a comparison of diesel and electric locomotive noise ... · proceedings of acoustics 2013 –...
TRANSCRIPT

Proceedings of Acoustics 2013 – Victor Harbor 17-20 November 2013, Victor Harbor, Australia
Australian Acoustical Society 1
A Comparison of Diesel and Electric Locomotive Noise Emissions from Coal Terminal Rail Loop and Spur line
Matthew Terlich
Savery & Associates Pty Ltd, Brisbane Queensland, Australia
ABSTRACT The noise emissions from rail loops and spur lines are of great interest to residents near coal terminals and the opera-tors of the terminals for proposed new or expanded port developments. The recent boom in coal and iron ore exports has increased the pressure on existing terminals to increase capacity and to expand terminal facilities. The assessment of noise impact of the locomotives moving the rolling-stock is critical, particularly for the assessment of the maxi-mum noise levels emitted by trains passing or unloading.
Noise measurements of coal train passbys were conducted at two different Queensland coal terminals which used ei-ther diesel or electric locomotives exclusively for coal train haulage and for unloading. Noise levels were measured near the spur-line and rail loop at each terminal facility. Sound power levels of each locomotive type were determined for slow train movement around an unloading rail loop and at higher speeds on the spur line.
The noise emissions associated with electric and diesel locomotives hauling coal trains on both rail loops and spur lines will be presented compared along with a discussion of the implications of this comparison for new port or port expansion developments.
INTRODUCTION
The noise emissions from rail loops and spur lines are of great interest to residents near coal terminals and the opera-tors of the terminals for proposed new or expanded port de-velopments. The recent boom in coal and iron ore exports has increased the pressure on existing terminals to increase ca-pacity and to expand terminal facilities. The assessment of noise impact of the locomotives moving the rolling-stock is critical, particularly for the assessment of the maximum noise levels emitted by the passing or unloading trains.
Sound power levels of diesel and electric locomotives on rail loops and and entire trains on spur lines were determined through noise measurements adjacent to rail loops and rail spur lines associated with two different Queensland coal terminals. One of the coal terminals had electric locomotives only on the spur line and rail loop, while the other had diesel locomotives only.
The sound power levels were determined from a number of measured coal train pass-bys over two days of measurement. Characteristics of each coal train point source (used for max-imum LAmax pass-by levels) were calculated by translating the sound pressure level at different distances to sound power levels based on simple hemispherical propagation. Average sound power levels were determined by considering the rail to be a line source exhibiting cylindrical propagation. Based on the calculated average sound power level of the coal trains using the rail and using the projected number of train pass-bys at any point along the rail track and the average time required for the train to pass any point, the LAeq, passby was determined for the locomotive on the rail loop travelling at slow speed and for the entire train along the spurline. From a projected number of rail movements per day, the cumulative sound power level of all trains on the rail track per day can be calculated to predict the LAeq, 24hr at the surrounding recep-tors.
METHODOLOGY
Description of Measurement Locations
Locations for unattended and attended noise measurements were selected based on safe and unobtrusive location re-quirements, with clear line of sight to the rail track and asso-ciated locomotives and rollingstock on the rail track. Loca-tions adjacent to the rail loops were selected to ensure that any unloading activity component levels were insignificant, while locations adjacent to the spur lines were selected to ensure that the maximum passby level at the higher travelling speed was recorded rather than slower speeds closer to the rail loop.
Monitoring locations were selected near to level stretches of ballasted track with the monitoring location as close as possi-ble to the rail tracks while still remaining outside of the rail corridor (for safety reasons). All rail tracks consisted of a narrow gauge, 1067mm (3’6”) track width. Each train con-sisted of a locomotive at the head of the train, with a second locomotive at approximately the centre of the following roll-ing-stock.
The duration of unattended monitoring at each monitoring location varied from approximately 12 hours at the diesel-only locomotive rail loop to 25 hours at the electric-only locomotive rail loop. The number of passbys at each of the measurement locations and the method of analysis are sum-marised below.
Unattended noise monitoring was conducted utilising CESVA SC310 Type 1 one-third octave logging sound ana-lysers, CESVA C250 microphones with PA14 preamplifiers and CESVA TK1000 outdoor microphone assemblies at 1.5 m microphone height.

Proceedings of Acoustics 2013 – Victor Harbor 17-20 November 2013, Victor Harbor, Australia
2 Australian Acoustical Society
Noise levels were measured continuously throughout the monitoring period. The logger recorded level samples with a “fast” time response in frequency bands from 20 Hz to 10 kHz. Instrumentation was field-calibrated prior to and follow-ing measurements.
The weather conditions during noise measurements were cool and dry, with no significant wind.
Analysis
The data from each of the noise loggers was post-processed to extract the spectral time history of each of the rail passbys. The data was inspected to ensure that passbys did not over-lap, though it is likely that some screening from intervening rolling stock on closer rail track occurred at times between locomotive passbys, particularly on the rail loops.
Spurline - Electric locomotives driving train – The noise monitoring location was adjacent to four rail tracks making up the spur line at different distances (12.5m, 22m, 26.5m and 36.5m) from the monitoring location. Sixteen measure-ments of train movements were included in the analysis. The monitoring results divided into four general groupings relat-ing to the distance from the corresponding rail track and en-ergy-averaged. The energy-averaged sound pressure level, Leq, of each group was extrapolated to the furthest measure-ment distance before all measurements were energy-averaged to determine the average pass-by noise level at that distance.
The energy-averaged sound power level of the train as a line source was then determined using the average length of the train, as provided by the rail operators (1800m) using cylin-drical propogation. From this calculated overall level, the average sound power level per metre of the train was deter-mined.
The average maximum sound power level was determined from the average maximum sound pressure level, with each of the maximum sound pressure levels extrapolated to the furthest measurement distance using hemispherical propoga-tion of a point source before they were energy averaged.
Spurline - Diesel locomotives driving train – The noise moni-toring location was adjacent to the single rail track of the spur line with a separation distance of 13.5m from the measure-ment position to the centre of the rail track. Measurements of 11 train movements were included in the analysis. The aver-age sound power level of the train as a line source was de-termined using the average length of the train, as provided by the rail operators (1800m) using cylindrical propogation. From this calculated overall level, the average sound power level per metre of the train was determined.
The average maximum sound power level was determined by energy averaging the maximum sound pressure levels and using the half hemisphere of the point source at the meas-urement distance.
Loop - Diesel locomotives – The noise monitoring location was adjacent to the two rail tracks making up the rail loop
with a distance of 16.5m from the measurement position to the centreline between the pair of rail tracks. Measurements of seven train movements were included in the analysis. The average sound power level of the locomotive as a line source was determined using the average passby time in combina-tion with the assumed speed provided by the rail operators (2km/hr) using cylindrical propogation. From the calculated overall level, the average sound power level per metre of the train was determined.
The average maximum sound power level was determined by energy averaging the maximum sound pressure levels and using the half hemisphere of the point source at the average measurement distance.
Loop - Electric locomotives – The noise monitoring location was adjacent to the three rail tracks making up the rail loop with a distance of between 13.5m and 29.5m from the meas-urement position to the outer pair of rail tracks (average dis-tance of 21.5m). Measurements of nine train movements were included in the analysis. Average sound power level of the locomotive as a line source was determined using the average passby time in combination with the assumed speed provided by the rail operators (2km/hr) using cylindrical propogation. From this calculated overall level, the average sound power level per metre of the train was determined.
The average maximum sound power level was determined by energy averaging the maximum sound pressure levels and using the half hemisphere of the point source at the average measurement distance.
A summary of the assumed, calculated and measured values are shown in Table 1.
Table 1. Summary of Locations and Parameters Loco Type
Rail area
Speed (km/hr)
Assumed Distance
(m)
Average Measured
Passby Time (s)
Electric Spur-line
31 1800 (whole train)
212
Loop 2 393 (loco only)
708
Diesel Spur-line
49 1800 (whole train)
132
Loop 2 206 (loco only)
372
RESULTS
Measured sound pressure level maximum passby spectrum of electric and diesel powered locomotives and coal trains are shown in Figures 1 to 4.

Proceedings of Acoustics 2013 – Victor Harbor 17-20 November 2013, Victor Harbor, Australia
Australian Acoustical Society 3
Figure 1. Measured Spectrum of LAmax SPL for Electric driven trains on Rail Spur @36.5m (25Hz to 10kHz)
Figure 2. Measured Spectrum of LAmax SPL for Diesel driven trains on Rail Spur @13.5m (25Hz to 10kHz)
Figure 3. Measured Spectrum of LAmax SPL for Electric Locomotives on Rail Loop @21.5m (25Hz to 10kHz)
Proceedings of Acoustics 2013 – Victor Harbor 17-20 November 2013, Victor Harbor, Australia
4 Australian Acoustical Society
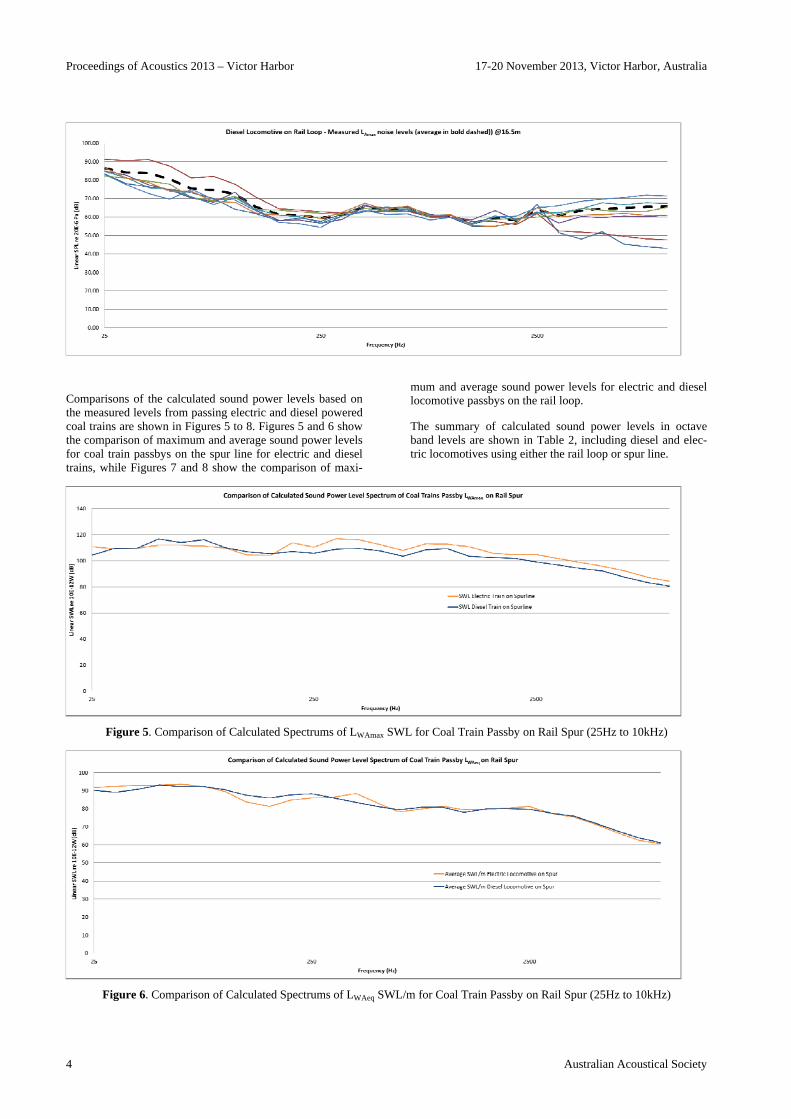
Figure 4. Measured Spectrum of LAmax SPL for Diesel Locomotives on Rail Loop @16.5m (25Hz to 10kHz)
Comparisons of the calculated sound power levels based on the measured levels from passing electric and diesel powered coal trains are shown in Figures 5 to 8. Figures 5 and 6 show the comparison of maximum and average sound power levels for coal train passbys on the spur line for electric and diesel trains, while Figures 7 and 8 show the comparison of maxi-
mum and average sound power levels for electric and diesel locomotive passbys on the rail loop.
The summary of calculated sound power levels in octave band levels are shown in Table 2, including diesel and elec-tric locomotives using either the rail loop or spur line.
Figure 5. Comparison of Calculated Spectrums of LWAmax SWL for Coal Train Passby on Rail Spur (25Hz to 10kHz)
Figure 6. Comparison of Calculated Spectrums of LWAeq SWL/m for Coal Train Passby on Rail Spur (25Hz to 10kHz)
Proceedings of Acoustics 2013 – Victor Harbor 17-20 November 2013, Victor Harbor, Australia
Australian Acoustical Society 5
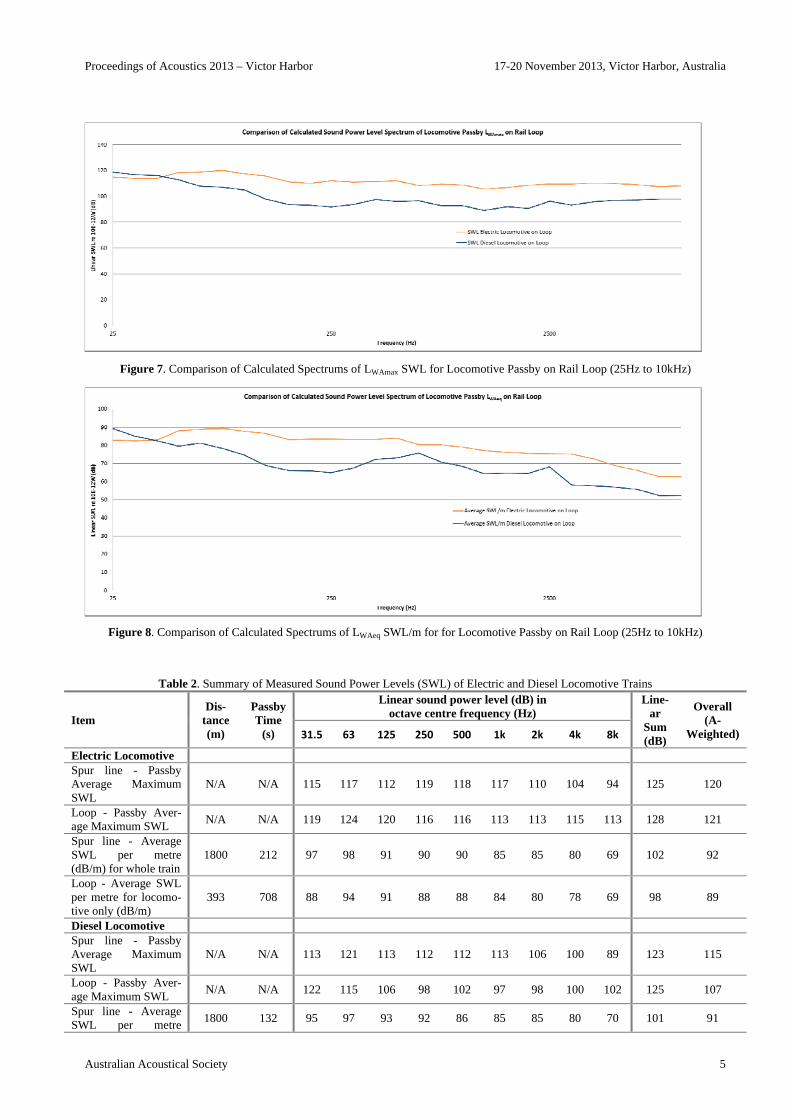
Figure 7. Comparison of Calculated Spectrums of LWAmax SWL for Locomotive Passby on Rail Loop (25Hz to 10kHz)
Figure 8. Comparison of Calculated Spectrums of LWAeq SWL/m for for Locomotive Passby on Rail Loop (25Hz to 10kHz)
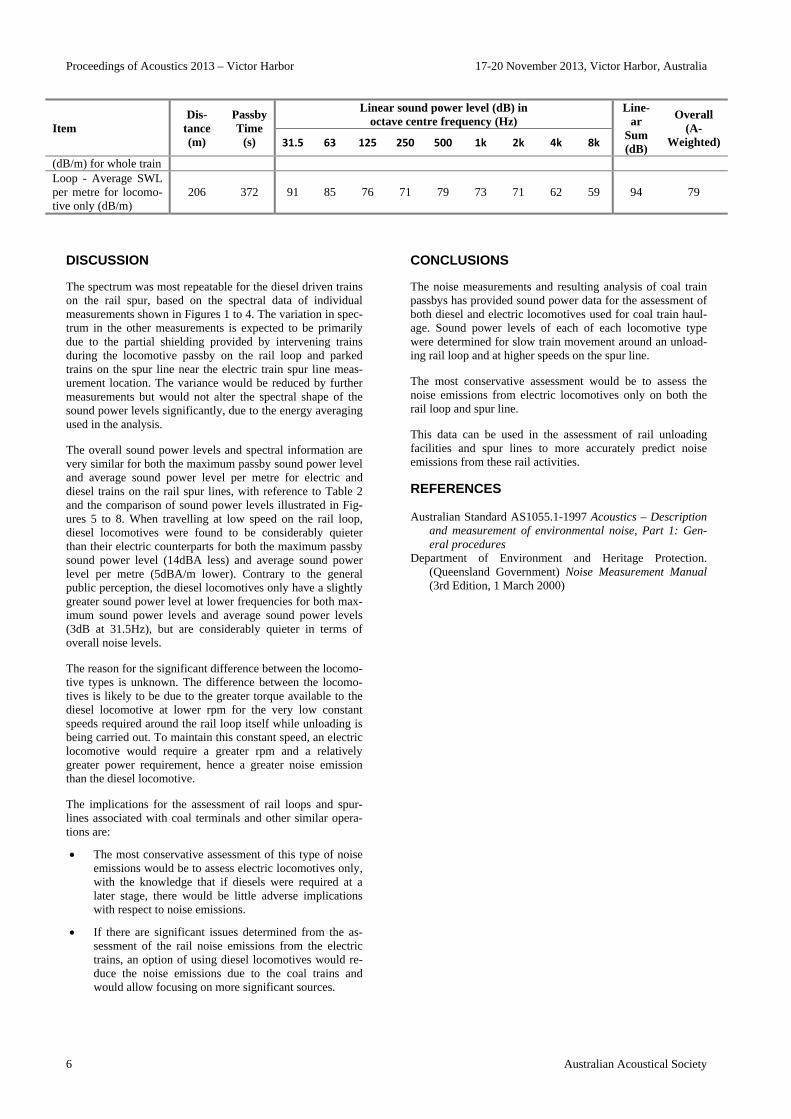
Table 2. Summary of Measured Sound Power Levels (SWL) of Electric and Diesel Locomotive Trains
Item Dis-
tance (m)
Passby Time
(s)
Linear sound power level (dB) in octave centre frequency (Hz)
Line-ar
Sum (dB)
Overall (A-
Weighted) 31.5 63 125 250 500 1k 2k 4k 8k
Electric Locomotive Spur line - Passby Average Maximum SWL
N/A N/A 115 117 112 119 118 117 110 104 94 125 120
Loop - Passby Aver-age Maximum SWL
N/A N/A 119 124 120 116 116 113 113 115 113 128 121
Spur line - Average SWL per metre (dB/m) for whole train
1800 212 97 98 91 90 90 85 85 80 69 102 92
Loop - Average SWL per metre for locomo-tive only (dB/m)
393 708 88 94 91 88 88 84 80 78 69 98 89
Diesel Locomotive Spur line - Passby Average Maximum SWL
N/A N/A 113 121 113 112 112 113 106 100 89 123 115
Loop - Passby Aver-age Maximum SWL
N/A N/A 122 115 106 98 102 97 98 100 102 125 107
Spur line - Average SWL per metre
1800 132 95 97 93 92 86 85 85 80 70 101 91
Proceedings of Acoustics 2013 – Victor Harbor 17-20 November 2013, Victor Harbor, Australia
6 Australian Acoustical Society
Item Dis-
tance (m)
Passby Time
(s)
Linear sound power level (dB) in octave centre frequency (Hz)
Line-ar
Sum (dB)
Overall (A-
Weighted) 31.5 63 125 250 500 1k 2k 4k 8k
(dB/m) for whole train Loop - Average SWL per metre for locomo-tive only (dB/m)
206 372 91 85 76 71 79 73 71 62 59 94 79
DISCUSSION
The spectrum was most repeatable for the diesel driven trains on the rail spur, based on the spectral data of individual measurements shown in Figures 1 to 4. The variation in spec-trum in the other measurements is expected to be primarily due to the partial shielding provided by intervening trains during the locomotive passby on the rail loop and parked trains on the spur line near the electric train spur line meas-urement location. The variance would be reduced by further measurements but would not alter the spectral shape of the sound power levels significantly, due to the energy averaging used in the analysis.
The overall sound power levels and spectral information are very similar for both the maximum passby sound power level and average sound power level per metre for electric and diesel trains on the rail spur lines, with reference to Table 2 and the comparison of sound power levels illustrated in Fig-ures 5 to 8. When travelling at low speed on the rail loop, diesel locomotives were found to be considerably quieter than their electric counterparts for both the maximum passby sound power level (14dBA less) and average sound power level per metre (5dBA/m lower). Contrary to the general public perception, the diesel locomotives only have a slightly greater sound power level at lower frequencies for both max-imum sound power levels and average sound power levels (3dB at 31.5Hz), but are considerably quieter in terms of overall noise levels.
The reason for the significant difference between the locomo-tive types is unknown. The difference between the locomo-tives is likely to be due to the greater torque available to the diesel locomotive at lower rpm for the very low constant speeds required around the rail loop itself while unloading is being carried out. To maintain this constant speed, an electric locomotive would require a greater rpm and a relatively greater power requirement, hence a greater noise emission than the diesel locomotive.
The implications for the assessment of rail loops and spur-lines associated with coal terminals and other similar opera-tions are:
The most conservative assessment of this type of noise emissions would be to assess electric locomotives only, with the knowledge that if diesels were required at a later stage, there would be little adverse implications with respect to noise emissions.
If there are significant issues determined from the as-sessment of the rail noise emissions from the electric trains, an option of using diesel locomotives would re-duce the noise emissions due to the coal trains and would allow focusing on more significant sources.
CONCLUSIONS
The noise measurements and resulting analysis of coal train passbys has provided sound power data for the assessment of both diesel and electric locomotives used for coal train haul-age. Sound power levels of each of each locomotive type were determined for slow train movement around an unload-ing rail loop and at higher speeds on the spur line.
The most conservative assessment would be to assess the noise emissions from electric locomotives only on both the rail loop and spur line.
This data can be used in the assessment of rail unloading facilities and spur lines to more accurately predict noise emissions from these rail activities.
REFERENCES Australian Standard AS1055.1-1997 Acoustics – Description
and measurement of environmental noise, Part 1: Gen-eral procedures
Department of Environment and Heritage Protection. (Queensland Government) Noise Measurement Manual (3rd Edition, 1 March 2000)