6 materials and methods - sundoc.bibliothek.uni-halle.de
TRANSCRIPT

Materials and Methods
104
6 Materials and Methods
6.1 Materials and Instrumentation
6.1.1 Proteins and Peptides
Angiotensin I Sigma Angiotensin II Sigma Bovine serum albumine (BSA) Sigma Peptide Calibration Standard Bruker Daltonik Calmodulin, high purity (Bos taurus, brain) Calbiochem Carbonic Anhydrase EC 4.2.1.1 Sigma Chymotrypsin (EC 3.4.21.1, Bos taurus), sequencing grade Roche Diagnostics Cytochrome c (Gallus gallus) Sigma Endoproteinase AspN (EC 3.4.21.33, Pseudomonas fragi mutant), Roche Diagnostics sequencing grade Endoproteinase LysC (EC 3.4.21.50, Lysobacter enzymogenes), Roche Diagnostics sequencing grade Endoproteinase GluC (EC 3.4.21.19, Staphylococcus aureus V8) Roche Diagnostics sequencing grade Immunoglobulin A Sigma Lactate dehydrogenase Sigma Luteinizing hormone releasing hormone (LHRH) Sigma Lysozyme, chicken egg white Sigma Melittin, synthetic Calbiochem Monoclonal Anti-Annexin II, Clone CPI-50-5-1 (Mus musculus) ICN Biomedicals Myoglobin (Equus caballus ,heart) Sigma Phosphorylase b Sigma Somatostatin Sigma Substance P Sigma Trypsin (EC 3.4.21.4, Bos taurus), sequencing grade Roche Diagnostics 6.1.2 Cross-Linking and Labeling Reagents
(+)-Biotinyl-iodoacetamidyl-3,6-dioxaoctanediamine (PEO-iodoacetyl biotin) Pierce Bis(sulfosuccinimidyl) glutarate (BS2G), d0 and d4
Pierce Bis(sulfosuccinimidyl) suberate (BS3), d0 and d4
Pierce Disuccinimidyl adipate (DSA), d0 and d8 K. Mechtler, IMP, Vienna Disulfosuccinimidyl tartrate (sDST) Pierce Ethylene glycol bis(succiimidly succinate) (EGS) Pierce 1-Ethyl-3-(3-dimethylaminopropyl)carbodiimide hydrochloride (EDC) Pierce N-Hydroxysulfosuccinimide (Sulfo-NHS) Pierce N-succinimidyl-6-[4’-azido-2’-nitrophenylamino]hexanoate (SANPAH) Pierce

Materials and Methods
105
6.1.3 Chemicals
Acetic acid, glacial Merck/VWR Acetone, Uvasol® for spectroscopy Merck/VWR Acetonitrile (ACN), Uvasol® for spectroscopy Merck/VWR Acrylamide/Bis solution 40% (37.5:1) Bio-Rad α-Cyano-4-hydroxy cinnamic acid Bruker Daltonik, Sigma Ammonium acetate Sigma Ammonium hydrogencarbonate (NH4HCO3) Sigma Ammonium persulfate (APS) Bio-Rad, Sigma 6-aza-2-thiothymine (ATT) Sigma Calcium chloride Sigma Complete, EDTA-free protease inhibitors Roche Diagnostics Coomassie-Brilliant-Blue R250 and G250 Sigma DEAE, pre-swollen microgranular DEAE cellulose (DE52) Whatman 2’,5’-Dihydroxyacetophenone Sigma 2,5-Dihydroxybenzoic acid (DHB) Sigma 3,5-Dimethoxy-4-hydroxy cinammic acid (sinapinic acid) Sigma Dimethyl sulfoxide (DMSO) Sigma Dithiothreitol (DTT) Sigma E-64 (N-[N-(L-3-carboxyoxirane-2-carbonyl)-L-leucyl]-agmatine) Roche Diagnostics Ethylene glycol tetraacetic acid (EGTA) Sigma Formic acid (FA) Sigma, Merck/VWR GelCode® Glycoprotein Staining Kit Pierce Glycine Sigma Hydrochloric acid (HCl) Sigma 4-Hydroxyazobenzene-2-carboxylic acid (HABA) Sigma Imidazole Sigma Iodoacetamide Sigma N-(2-Hydroxyethyl)piperazin-N´-(2-ethansulfonsäure) (HEPES) Sigma Isopropanol, Uvasol®, for spectroscopy Merck/VWR 2-Mercaptoethanol Bio-Rad Methanol, Uvasol®, for spectroscopy Merck/VWR 2-(N-Morpholino)ethane sulfonic acid (MES) Sigma Native Sample Buffer, Laemmli Bio-Rad PeppermintStick™ phosphoprotein molecular weight standard Invitrogen/Molecular Probes Ponceau S Potassium chloride Sigma ProQ ® Diamond phosphoprotein gel stain Invitrogen/Molecular Probes Precision Plus Protein™ Unstained Standards (10-250 kDa) Bio-Rad Sample Buffer, Laemmli Bio-Rad sodium dodecyl sulfate (SDS) solution, 10% Bio-Rad Sodium chloride Sigma, Roth N,N,N´,N´-Tetramethylethylendiamine (TEMED) Bio-Rad Triluoro acetic acid (TFA) Sigma Tris / Glycine Running buffer (10x) Roth Trishydroxymethylaminomethane (Tris-Base) Sigma Trishydroxymethylaminomethane hydrochloride (Tris-HCl) Sigma Triton X-100 (octylphenolepoly(ethyleneglycolether)X)
UltraLink Immobilized Monomeric Avidin Pierce

Materials and Methods
106
6.1.4 Instrumentation
MALDI-TOF Mass Spectrometers: Voyager-DE™ RP Biospectrometry™ Workstation (Applied Biosystems) Autoflex I (Bruker Daltonik) Ultraflex III (Bruker Daltonik)
ESI-FTICRMS:
Apex II (Bruker Daltonics), 7T magnet, Nano-ESI source (Agilent) LTQ-FT (ThermoScientific), 7T magnet, Nano-ESI source (Proxeon)
Nano-High-Performance Liquid Chromatography:
Ultimate™ Nano-HPLC System, (LC Packings / Dionex) equipped with: Ultimate™ Micropump
Ultimate™ UV-Detector Ultimate™ SWITCHOS II Famos™ Micro-Autosampler
Ultimate™ 3000 Nano-HPLC System, (LC Packings / Dionex)
Fast Protein Liquid Chromatography (FPLC):
ÄKTA Explorer (GE Healthcare)
6.1.5 Miscellaneous Equipment and Consumables
Analytical balances OHAUS Adventurer ARA520 OHAUS Adventurer ARA640
OHAUS
Bench-top shakers Duomax 1030 Titramax 101
Heidolph
Bench-top centrifuge MiniSpin Eppendorf
Centrifuge Avanti J-20 XP, rotor JLA 16.250 Optima LE-80K ultracentrifuge
Beckman Coulter
Desalting / Buffer Exchange
Microcon YM-3 and YM-10 centrifugal filter device (3 and 10 kDa cut-off) ZipTips, C4 and C18 Centriprep YM-30, centrifugal filter device (30 kDa cut-off) Dialysis membranes Spectra/Por®
Millipore
Millipore Millipore
Roth
Electrophoresis Mini-PROTEAN 3 cell, POWERPAC 300 power supply, glass plates with integrated spacer, short plates, side-by-side casting stand, casting frames, electrode, clamping frame, sample loading guide, square-bottom plastic combs
Bio-Rad
Heating and drying oven Heraeus T6 Function Line Thermo Fisher Imaging Gel Image Scanner
PharosFX Molecular Imager System Amersham Bio-Rad
Materials and Methods
107
pH-Meter inoLab pH Level 1 WTW
Protein purification Potter S homogenizer, homogenizer vessel, homogenizer cylinder, plunger Waring laboratory blender
Sartorius Waring
Vacuum concentrator Concentrator 5301 (SpeedVac) Eppendorf
Water DirectQ5TM water purification system Millipore
Western Blot equipment Trans-Blot Semi-Dry cell Bio-Rad
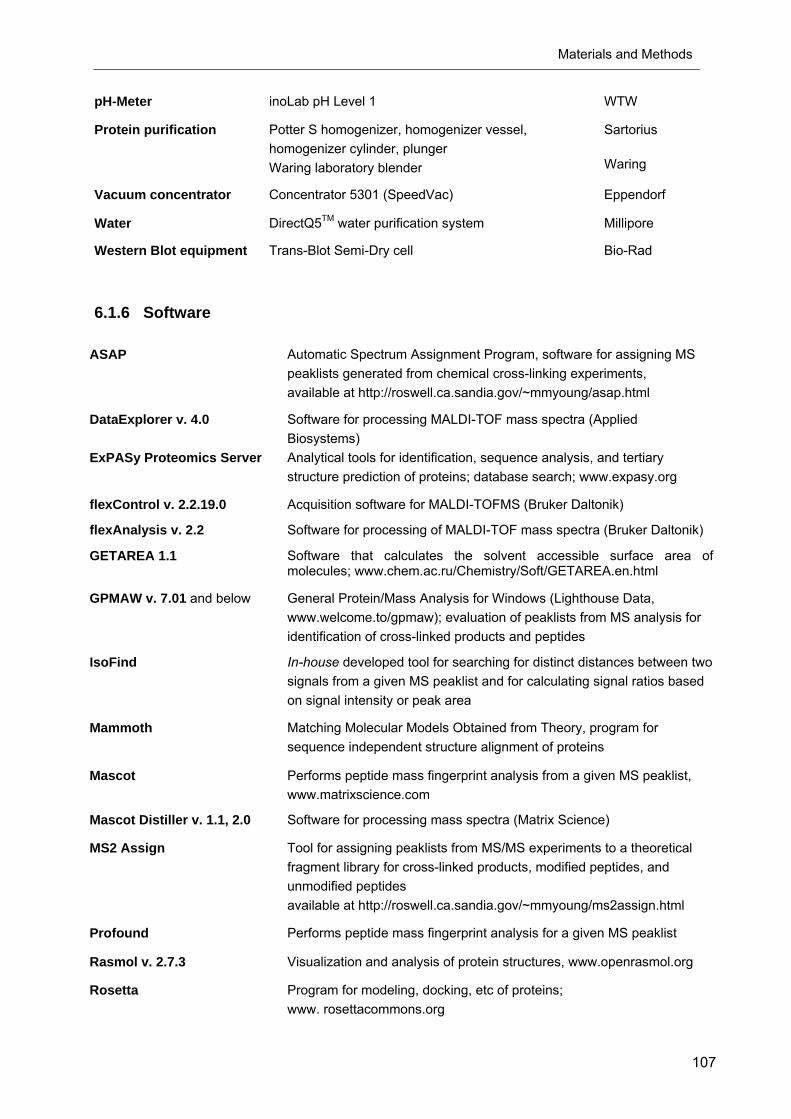
6.1.6 Software
ASAP Automatic Spectrum Assignment Program, software for assigning MS peaklists generated from chemical cross-linking experiments, available at http://roswell.ca.sandia.gov/~mmyoung/asap.html
DataExplorer v. 4.0 Software for processing MALDI-TOF mass spectra (Applied Biosystems)
ExPASy Proteomics Server Analytical tools for identification, sequence analysis, and tertiary structure prediction of proteins; database search; www.expasy.org
flexControl v. 2.2.19.0 Acquisition software for MALDI-TOFMS (Bruker Daltonik)
flexAnalysis v. 2.2 Software for processing of MALDI-TOF mass spectra (Bruker Daltonik)
GETAREA 1.1 Software that calculates the solvent accessible surface area of molecules; www.chem.ac.ru/Chemistry/Soft/GETAREA.en.html
GPMAW v. 7.01 and below General Protein/Mass Analysis for Windows (Lighthouse Data, www.welcome.to/gpmaw); evaluation of peaklists from MS analysis for identification of cross-linked products and peptides
IsoFind In-house developed tool for searching for distinct distances between two signals from a given MS peaklist and for calculating signal ratios based on signal intensity or peak area
Mammoth Matching Molecular Models Obtained from Theory, program for sequence independent structure alignment of proteins
Mascot Performs peptide mass fingerprint analysis from a given MS peaklist, www.matrixscience.com
Mascot Distiller v. 1.1, 2.0 Software for processing mass spectra (Matrix Science)
MS2 Assign Tool for assigning peaklists from MS/MS experiments to a theoretical fragment library for cross-linked products, modified peptides, and unmodified peptides available at http://roswell.ca.sandia.gov/~mmyoung/ms2assign.html
Profound Performs peptide mass fingerprint analysis for a given MS peaklist
Rasmol v. 2.7.3 Visualization and analysis of protein structures, www.openrasmol.org
Rosetta Program for modeling, docking, etc of proteins; www. rosettacommons.org

Materials and Methods
108
UMAX scanner software Operates UMAX scanner
Unicorn v. 4.10 Software for operating ÄKTA FPLC systems (Amersham Biosciences)
Voyager v. 5.1 Acquisition software for MALDI-TOFMS (Applied Biosystems)
VMD-Explorer v. 1.8.1 Visualization and analysis of protein structures (Theoretical and Computational Biophysics Group, NIH, www.ks.uiuc.edu)
XMASS vs, 5.0.10, 6.0 and 7.02
Software for acquisition and processing of ESI-FTICR mass spectra (Bruker Daltonics)
Xplor-NIH Structure determination program, http://nmr.cit.nih.gov/xplor-nih/
6.1.7 List of Manufacturers
Agilent Technologies Waldbronn Germany
ICN Biomedicals, GmbH Mühlgrabenstr. 12 53340 Meckenheim
Roche Diagnostics GmbH Sandhofer Str. 116 68305 Mannheim, Germany
Applied Biosystems 850 Lincoln Drive Foster City, CA 94404, USA
Invitrogen / Molecular Probes 3 Fountain Drive Inchinnan Buisness Park Paisley PA4 9RF, UK
Roth (Carl-Roth GmbH & Co. KG)Schoemperlenstr. 3-5 76185 Karlsruhe, Germany
Bio-Rad
1000 Alfred Nobel Drive Hercules, CA 94547, USA
LC Packings / Dionex Amsterdam The Netherlands
Sartorius AG Weender Landstr. 94-108 37075 Göttingen, Germany
Bruker Daltonics Billerica, MA USA
Lighthouse Data Odense Denmark
Sigma-Aldrich Chemie GmbH Eschenstr. 5 82024 Taufkirchen, Germany
Bruker Daltonik GmbH Bremen Germany
Merck / VWR Darmstadt Germany
Thermo Electron Bremen Germany
Calbiochem Schwalbach am Taunus Germany
Millipore Eschborn Germany
Waring Laboratory and Science waringproducts.com
Eppendorf GmbH Peter-Henlein-Str. 2 50389 Wesseling-Berzendorf Germany
New Objective Woburn, MA USA
Whatman Inc. 27 Great West Road Brentford, Middlesex TW8 9BW, United Kingdom
GE Healtcare München Germany
Pierce Inc. Rockford, IL USA
WTW GmbH Dr.-Karl-Slevogt-Strasse 1 D-82362 Weilheim
Heidolph Instruments GmbH & Co. KG Walpersdorfer Str. 12 91126 Schwabach, Germany
Proxeon Biosystems Odense Denmark

Materials and Methods
109
6.2 Experimental Procedures
6.2.1 Isolation and Purification of A2t
The ANXA2 / p11 heterotetramer (A2t) was purified from mucosa of pig (Sus scrofa) small
intestines following a slightly modified version of the protocol of Gerke and Weber (1984).
Six fresh small intestines were obtained from the slaughterhouse Altenburg and processed
immediately after evisceration. The small intestines were washed with 30 liters ice-cold
imidazole buffer (10mM imidazole, 150 mM NaCl, pH 7.4) to remove the gut contents and were
cut into pieces of about 50 cm length and were slit lengthwise. The thin mucosal layer was
scraped off and was immediately frozen in liquid nitrogen for storage. Henceforth, all steps of
the purification procedure were carried out at 4°C. Back in the laboratory, the frozen material
was thawed, 1.5 l HEPES/Tris buffer (30 mM HEPES, 600 mM NaCl, 0.5% Triton X-100, 1 mM
CaCl2, pH 7.4, Tris was used for adjusting pH) was added, and the mucosa was mechanically
disrupted using a Waring blender. In addition to protease inhibitors, the buffer contained 1 mM
Ca2+, which causes A2t binding to the membrane. The calcium concentration was raised to 2
mM and the homogenate was stirred for 15 minutes. After a centrifugation step (34,000 x g, 60
minutes, Avanti J-20 XP centrifuge, JLA 16.250 rotor, 4°C) the supernatant was discarded and
the pellet containing A2t was retained. In total, the sample was washed and centrifuged three
times with the above mentioned buffer containing the detergent Triton X-100, and was washed
another three times without detergent. In a next step, the pellet was resuspended in 300 ml
HEPES/Tris buffer (30 mM HEPES, 600 mM KCl) containing 10 mM ethylene glycol tetraacetic
acid (EGTA) and the cells were thoroughly disrupted in a Potter homogenizer (Sartorius).
Complexation of Ca2+ by EGTA released A2t from the membrane so that after
ultracentrifugation (45,000 rpm, 60 minutes, Optima LE-80K ultracentrifuge, 4°C) the A2t-
containing supernatant was retained. For preparation for DEAE (diethylaminoethyl cellulose,
Whatman) anionic exchange chromatography, the supernatant was dialyzed over-night against
two-times 15 l 20 mM imidazole / 10 mM NaCl / 0.5 mM EGTA buffer (pH 7.5). The dialyzed
protein solution was applied onto the equilibrated DEAE column (column volume approx. 70 ml)
and A2t was obtained in the flow-through. The obtained A2t was used without further
purification. Chromatographic separation steps were conducted with the ÄKTA Explorer fast
protein liquid chromatography (FPLC) system (GE Healthcare). The flow rate was manually
adjusted and a one-step gradient of 10 mM and 1M NaCl was applied. UV absorption at 280 nm
and conductivity were monitored.
Protease inhibitors Complete EDTA-free and E-64 as well as dithiothreitol (DTT, 1mM)
were applied during the whole course of the purification. After each purification step aliquots
were taken for monitoring the purification process and were stored at –20°C before SDS-PAGE
and MS analyses were performed.

Materials and Methods
110
The purified A2t was concentrated using Centripreps YM-30 (Millipore, 30 kDa cut-off) and
the buffer was at the same time exchanged against 20 mM HEPES / 150 mM NaCl / 0.5 mM
EGTA, 0.5 mM DTT (pH 7.4). The purified A2t was then lyophilized for storage at –20°C.
6.2.2 Characterization of A2t
Purification of A2t was confirmed by Western blot analysis and A2t was characterized with
respect to amino acid sequence and possibly existing posttranslational modifications.
6.2.2.1 Western Blot Analysis
Unstained gels from SDS-PAGE (chapter 6.2.6.2) were equilibrated in blot buffer (48 mM Tris,
39 mM glycine, 1.3 mM SDS, 20 % methanol (v/v), pH 9.2) for 20 minutes. Nitrocellulose
membranes were cut to gel size and placed for three minutes in blot buffer. Filter paper was as
well soaked in blot buffer. A sandwich composed of wet filter paper, nitrocellulose membrane,
equilibrated gel, and another wet filter paper was placed on the bottom platinum anode of the
TransBlot® Semi-Dry Transfer Cell (Bio-Rad) and the stainless steel cathode and safety cover
were placed on top. Transfer of the proteins from the gel onto the nitrocellulose membrane was
conducted at 10V (PowerPack300, Bio-Rad) for 30 minutes. Afterwards, the membrane was
incubated in fixing solution (40 % methanol (v/v), 10 % trichloro acetic acid (TCA) (v/v)) for 20
minutes. Ponceau S staining was employed for confirming the protein transfer to the membrane.
For blocking the membrane a 1% (w/v) bovine serum albumin solution in TTBS (Tween 20
(0.05% (v/v)) in TBS (20 mM Tris, 150 mM NaCl, pH 7.5)) was used, in which the membrane
was incubated for 90 minutes under gentle agitation. The BSA / TTBS solution was discarded.
Monoclonal anti-annexin II (clone CPI-50-5-1, 0.25 mg/ml, from Mus musculus, ICN
Biomedicals) was diluted 1:5000 in TTBS and used for incubating the membrane (60 minutes).
Unbound primary antibody was removed by three consecutive two-minute washing steps with
TTBS and replaced by the secondary antibody anti-mouse IgG (diluted 1:10000 in TTBS, from
goat (Capra hircus), Sigma product no. A3562)). This mouse-specific antibody is linked to the
reporter enzyme alkaline phosphatase (AP). Incubation time was 45 minutes after which excess
anti-body was again removed by two washing steps with TTBS and one washing step with 1x
Development Buffer (Bio-Rad, AP Color Development kit). For colorimetric detection, 300 µl
each of AP Color Reagents A (nitroblue tetrazolium, NBT) and B (5-bromo-4-cloro-3-indolyl
phosphate, BCIP) (Bio-Rad) were mixed with 30 ml 1x Development Buffer. The nitrocellulose
membrane was immersed in the color development solution for three minutes under gentle
agitation. The reaction of BCIP with alkaline phosphatase results in a blue precipitate that is
converted by NBT to result in purple color. Then the membrane was thoroughly rinsed with
water and the air-dried membrane was imaged for documentation.
Materials and Methods
111
6.2.2.2 Amino Acid Sequences
The amino acid sequence of porcine ANXA2 was determined by ESI-FTICRMS (chapter
6.2.8.2) and MALDI-TOFMS (Autoflex I, chapter 6.2.7.3) of enzymatic digests (chapter 6.2.6.1).
The obtained MS peaklists were compared to Swiss-Prot database (www.expasy.org) entries
available for Homo sapiens (P07355), Bos taurus (P04272), Canis familiaris (Q6TEQ7), Sus
scrofa (P19620, fragment of amino acids 1-91), and porcine amino acid sequences suggested
by V. Gerke (unpublished) and M. (Ph.D. thesis, 2005). ANXA2 amino acid sequence
assessment was performed using the Expasy Find Pept tool (chapter 6.2.11.3). Experimentally
obtained p11 peptide masses were compared to Swiss-Prot entry P04163.
6.2.2.3 Molecular Weight Determination of ANXA2 and P11
Linear MALDI-TOFMS analysis (Autoflex I) in the positive ionization mode of the purified A2t
complex was performed for determination of the molecular weights of ANXA2 and p11 (chapter
6.2.7.3). Several MALDI matrices (sinapinic acid, DHB, ATT, HABA, and acetophenone) were
tested for obtaining optimum mass spectra of ANXA2.
6.2.2.4 Posttranslational Modifications
Phosphorylation Analysis
ANXA2 and p11 were tested for phosphorylation using the Pro-Q® Diamond Phosphoprotein
Gel Stain Kit (Invitrogen/Molecular Probes), an in-gel fluorescent detection assay for
phosphorylation of Tyr, Ser, and Thr. PeppermintStick™ phosphoprotein molecular weight
(MW) standard contains a mixture of two phosphorylated (ovalbumin (45 kDa) and α-casein
(23.6 kDa)) and four non-phosphorylated proteins (β-galactosidase (116.25 kDa), BSA (66.6
kDa), avidin (18 kDa), and lysozyme (14.4 kDa)), thus functioning both as molecular weight
standard and as positive and negative controls. Following separation of A2t (20 µl of a 5.5 µM
solution) and the MW standard by gel electrophoresis, without subsequent Coomassie Brilliant
Blue-staining, the gel (5% stacking / 12% resolving) was incubated twice in fixing solution (50%
(v/v) methanol / 10% (v/v) acetic acid) for 30 minutes. The fixing solution was removed and the
gel was immersed in H2O for 10 minutes. Washing with H2O was repeated twice for thorough
removal of residual methanol and acetic acid. The gel was then incubated in ~ 60 ml of the
staining solution for 90 minutes in the dark. Afterwards, the gel was destained in 100 ml
destaining solution for 30 minutes, again protected from light. Destaining was repeated two
more times with fresh solution and afterwards the gel was thoroughly immersed in H2O.
Visualization of stained protein bands was achieved with the PharosFX Molecular Imager
System (Bio-Rad). The excitation and emission maxima of the Pro-Q® Diamond stain are ~555

Materials and Methods
112
nm and ~580 nm, respectively. Following documentation, the gel was stained with Coomassie
Brilliant Blue.
Glycosylation Analysis
ANXA2 and p11 were tested for glycosylation using the GelCode® Glycoprotein Staining Kit
(Pierce). Horseradish peroxidase and soybean trypsin inhibitor served as positive and negative
controls, respectively. Gels from electrophoretic separation of A2t, positive and negative
controls, and MW standard were fixed by 50% (v/v) methanol for 30 minutes. The solution was
replaced by 100 ml 3% (v/v) acetic acid and incubated for ten minutes. This washing step was
repeated once more, before the gel was transferred to 25 ml of Oxidizing Solution (periodic
acid) and was incubated for 15 minutes, oxidizing glycols to aldehydes. The gel was washed
three times for five minutes with 100 ml of 3% (v/v) acetic acid and was then immersed in 25 ml
of GelCode® Glycoprotein Stain for 15 minutes. Afterwards the gel was transferred into 25 ml
Reducing Solution and incubated for five minutes, after which the gel was extensively washed
with 3% (v/v) acetic acid and H2O. Glycoproteins appeared as magenta bands on the gel. The
GelCode® Glycoprotein Staining Kit reagents were prepared as specified by the manufacturer.
6.2.3 Chemical Cross-Linking
6.2.3.1 Cross-Linking Reactions of the Calmodulin / Melittin Complex
For chemical cross-linking of the calmodulin / melittin complex the zero-length cross-linking
reagent 1-ethyl-3(3-dimethylaminopropyl) carbodiimide hydrochloride (EDC) in combination with
sulfo-N-hydroxysuccinimide (sNHS) was employed, as well the homobifunctional amine-reactive
reagents sulfo-disuccinimidyl tartrate (sDST) and bis-sulfosuccinimidyl suberate (BS3).
EDC / Sulfo-NHS
An equimolar mixture of CaM and melittin (10µM each, final concentration) containing 1mM
CaCl2 (in 100mM MES buffer, pH 6.5) was incubated at room temperature for 20 min on a
shaker. The zero-length cross-linker EDC was dissolved in water shortly prior to addition and
added in 500-, 1000-, and 2000-fold molar excess over the protein/peptide mixture.
Simultaneously, sNHS, dissolved in water, was added in 500-fold molar excess to all three
EDC-containing reaction mixtures, thus resulting in EDC/sNHS ratios of 1:1, 2:1, and 4:1,
respectively. As a negative control, the protein mixture was incubated without cross-linking
reagent. The final volume was 1 ml. For quenching the reactions, 200µl-aliquots were taken
from the reaction mixtures after 5, 15, 30, 60, and 120 min, and DTT (40mM final concentration)
was added and the samples were stored at –20°C.

Materials and Methods
113
Table 6-1: Composition of the CaM / Mel Reaction Mixture with the Cross-Linker EDC / sNHS
I II III IV Final concentration
EDC/Sulfo-NHS ratio - 1:1 2:1 4:1
0.4M EDC* 0µl 12.5µl 25µl 50µl I: 0; II: 5mM; III: 10mM; IV: 20mM
0.4M sNHS* 0µl 12.5µl 12.5µl 12.5µl I: 0; II, III, IV: 5mM
1mg/ml Melittin** 28.5µl 28.5µl 28.5µl 28.5µl 10µM
1mg/ml Calmodulin** 167µl 167µl 167µl 167µl 10µM
0.1M MES (pH 6.5) 794.5µl 769.5µl 757µl 732µl ≈ 0.1M
100mM CaCl2** 10 µl 10 µl 10 µl 10 µl 1mM Ca2+
* in H2O, ** in MES buffer
sDST and BS3
For cross-linking experiments with the homobifunctional cross-linking reagents BS3 or sDST,
an equimolar mixture of CaM and melittin (10µM each, final concentration) containing 1mM
CaCl2 (20mM HEPES buffer, pH 7.4) was incubated at ambient temperature for 20 min. BS3 or
sDST was dissolved in dimethyl sulfoxide (DMSO) to avoid hydrolysis (stock solutions: 10mM,
50mM, and 100mM, respectively) and 10µl were added to result in a 10-, 50-, and 100-fold
molar excess over the proteins. The total volume of the reaction mixture was 1 ml. To quench
the reactions, 200µl-aliquots were taken from the reaction mixtures after 5, 15, 30, 60, and 120
min, and NH4HCO3 (20mM final concentration) was added and the sample was stored at -20°C.
Table 6-2: Composition of the CaM / Mel Reaction Mixtures with the Cross-Linkers sDST and BS3
0x 10x 50x 100x Final conc.
20mM HEPES (pH 7.4) 784.5µl 784.5µl 784.5µl 784.5µl 20mM
100mM CaCl2** 10µl 10µl 10µl 10µl 1mM Ca2+
1mg/ml Melittin** 28.5µl 28.5µl 28.5µl 28.5µl 10µM
1mg/ml Calmodulin** 167µl 167µl 167µl 167µl 10µM
sDST / BS3 stock
solution*
DMSO
10µL
10mM
10 µl
50mM
10 µl
100mM
10 µl 0, 100µM, 500µM, 1000µM
* in DMSO ** in HEPES buffer
6.2.3.2 Cross-Linking Reactions of the Annexin A2 / P11 Complex
The homobifunctional cross-linking reagents sDST, BS3, BS2G, and DSA were used for
chemical cross-linking of the ANXA2 / p11 complex. The latter three reagents were applied as
1:1 mixtures of non-deuterated and deuterated species (d0/d4 or d0/d8).
sDST
A 5-µM solution of A2t containing 1 mM CaCl2 (100 mM MES buffer; 150 mM NaCl, 1 mM DTT,
pH 7.5; final volume 120 µl) was incubated at room temperature for 10 min prior to addition of
the homobifunctional cross-linker sDST. sDST was dissolved in DMSO (2 and 5 mM stock

Materials and Methods
114
solutions, prepared shortly prior to addition) and 6 µl were added to give a 20- and 50-fold molar
excess over the protein concentration. For quenching the reaction, 40µl-aliquots were taken
from the reaction mixtures after 15, 30, and 60 min, and NH4HCO3 (20 mM final concentration)
was added.
Table 6-3: Composition of the ANXA2 / P11 Reaction Mixture with the Cross-Linker sDST
20x 50x Final conc.
A2t** 5.46 µM 110 µl 110 µl 5µM
30mM CaCl2** 4 µl 4 µl 1mM Ca2+
sDST* stock solution
added volume
2mM
6 µl
5mM
6 µl 100µM, 250µM
* in DMSO ** in MES buffer
BS3-d0/d4, BS2G-d0/d4, and DSA-d0/d8
The homobifunctional cross-linking reagents BS3, BS2G, and DSA were employed as 1:1
mixtures of their non-deuterated and deuterated form (BS3-d0/d4, BS2G-d0/d4, and DSA-d0/d8).
Stock solutions (75 and 150 mM) of cross-linking reagents were prepared shortly prior to
application. 6 µl were added to 594 µl of a 1.5 µM A2t solution in 20 mM HEPES, 150 mM NaCl,
1 mM DTT containing 1 mM CaCl2 (pH 7.4) to result in a 50- and 100-fold molar excess over the
protein concentration (600 µl final volume). To quench the reactions, 200-µl-aliquots were taken
from the reaction mixtures after 30, 60 and 120 min, and NH4HCO3 (20 mM final concentration)
was added.
Table 6-4: Composition of A2t Reaction Mixtures with Isotope-Labeled Cross-Linkers
50x 100x Final conc.
A2t 1.5µM in
20mM HEPES (pH 7.4),
1mM CaCl2
594 µl 594µl
1.5 µM
20mM
1mM Ca2+
X-linker* stock solution
added volume
7.5mM
6 µl
15mM
6 µl 75 µM, 100 µM
* in DMSO
6.2.4 Identification of A2t Interaction Partners by Chemical Cross-Linking
The protocol for identification of A2t binding partners involves several steps. The first step
comprises the biotinylation (and labeling with photoreactive cross-linker) of A2t. For testing
biotinylation efficiency, A2t (1.5 µM, in 20mM HEPES buffer, pH 7.5) was reacted with 1, 2, and
4 mM aqueous solutions of the sulfhydryl-reactive labeling reagent (+)-biotinyl-iodoacetamidyl-
3,6-dioxaoctane diamine (EZ-Link PEO-iodoacetyl biotin, Pierce) for 45 and 90 minutes at 37
°C. The reaction was quenched by the addition of five-fold excess dithiothreitol (DTT) over

Materials and Methods
115
labeling reagent concentration. The extent of biotinylation was evaluated by MALDI-TOFMS of
in-gel tryptic digests of modified ANXA2 and subsequent search with the ExPASy FindMod tool
and the GPMAW software, with PEO iodoacetyl biotin entered as variable modification (Δm =
414.194 u). For conducting the cross-linking experiments of A2t with its binding partners, a 4mM
solution PEO iodoacetyl biotin and a reaction time of 45 minutes was chosen.
Two cross-linking strategies were developed for the identification of A2t interaction
partners: In preparation A, A2t (6 ml, 1.5 µM, 20mM HEPES buffer, pH 7.5) was biotinylated
(4mM PEO iodoacetyl biotin) and simultaneously labeled with the heterobifunctional amine- and
photoreactive cross-linker N-succinimidyl-6-[4’-azido-2’-nitrophenylamino]hexanoate (SANPAH)
added at a 50-fold molar excess over A2t and reacted at its amine-reactive site (45 min
incubation time). In preparation B, A2t (6 ml, 1.5 µM) was only labeled with biotin (4mM solution
of PEO iodoacetyl biotin). Labeling of amines was quenched by addition of Tris, and DTT (5-fold
excess) was used for stopping the biotinylation reaction. In the second step, mucosal scrapings
were thoroughly homogenized and washed (two times with 1 l 30 mM HEPES / 0.6 M NaCl, pH
7.5 and two times with 1 l 30 mM HEPES / 0.15 M NaCl, pH 7.5) in the presence of 1 mM CaCl2
and 1 mM DTT (supernatants were discarded). Complete EDTA-free tablets were used for
protease inhibition. Then prelabeled A2t of preparation A and B (6 ml, 1.5 µM) was added to two
individual mucosal preparations (~50 ml each), respectively, and allowed to interact with
potential interaction partners at ambient temperature for 20 minutes. For covalent attachment of
A2t with its binding partners (third step), the mixture containing preparation A (A2t labeled with
amine-reacted SANPAH) was UV-irradiated for 60 minutes. Ethylene glycol bis(succinimidyl
succinate) (EGS) was added to sample preparation B containing A2t labeled with PEO
iodoacetyl biotin only. EGS reaction was stopped with excess Tris. For both preparations,
extraction of soluble (i.e. not membrane-associated) cross-linked proteins was accomplished by
thorough cell disruption, addition of EGTA (10mM) and ultracentrifugation (45,000 rpm, 45 min).
The supernatant containing cytosolic biotin-labeled A2t / binding partner complexes was
retained. Then SDS (0.5%) was added to the pellet for disintegrating the membrane, thus
releasing membrane-associated proteins. The supernatant of the subsequent centrifugation was
retained. For obtaining biotin-labeled A2t / membrane-associated protein complexes the
samples were purified by affinity purification on UltraLink Immobilized Monomeric Avidin
(Pierce) beads. Two-times (one each for preparation A and preparation B) 450 µl avidin beads
were washed with 1.5 ml 100 mM HEPES, pH 7.5 for 10 min and then centrifuged 3 min at 5500
rpm (Eppendorf MiniSpin centrifuge). The washing procedure was repeated once with 1.5 ml
100 mM glycine, pH 2.8 and three-times 1.5 ml 100 mM HEPES, pH 7.5. Avidin beads were
treated with biotin (1.5 ml 2mM biotin for 30 min). Biotin was removed by washing again one
time with glycine and then with 15% MeOH in 50 mM NH4HCO3, pH 7.5. The beads were
equilibrated with 1.5 ml HEPES (see above). Approximately 100 µl sample were added per 100

Materials and Methods
116
µl beads and twice the amount HEPES (30 mM, pH 7.5) was added and the mixture was
incubated for 3 hours on a shaker. Afterwards the beads were centrifuged and both supernatant
and beads were retained. Three consecutive washing steps with HEPES (see procedure above)
removed unbound sample. Elution of affinity-purified samples was achieved by two washing
steps with 50% ACN and 0.4% TFA with incubation times of 20 minutes and subsequent
centrifugation. The supernatants were dried in a vacuum concentrator. The obtained biotin-
labeled proteins were separated by SDS-PAGE and gel bands were excised and tryptically
digested (chapter 6.2.6.1) for subsequent analysis by MALDI-TOFMS and protein identification
by peptide mass fingerprinting. In addition to the Autoflex I instrument, the samples were
analyzed on an Ultraflex III MALDI-TOF/TOF instrument. Tandem mass spectrometric data was
obtained for most of the samples.
6.2.5 Polyacrylamide Gel Electrophoresis
One-dimensional polyacrylamide gel electrophoresis (PAGE) was carried out using the vertical
Mini-PROTEAN 3 electrophoresis system with POWERPAC 300 power supply (Bio-Rad,
München, Germany).
SDS gels, consisting of a stacking (5%, pH 6.8) and a resolving gel (10, 12, and 15%, pH
8.8), were prepared with the ingredients listed in Table 6-5 (gel size: 8.0 cm x 7.3 cm x 0.075
cm). First, the resolving gel was prepared by combining 40% acrylamide / bisacrylamide (37.5:1,
2.6% C) solution, 1.5 M Tris-HCl (pH 8.8), sodium dodecyl sulfate (SDS), and H2O. Addition of
ammonium persulfate (APS) and N,N,N’,N’-tetramethylethylenediamine (TEMED) initiated the
polymerization and the mixture was immediately poured between the glass plates and
overlayed with isopropanol. After 30 minutes, the gel was polymerized and the isopropanol layer
was removed (rinse with water to remove residual isopropanol). The stacking gel was prepared
and added on top of the resolving gel. A 10-well square-bottom comb was inserted into the
stacking gel for forming the gel pockets.
Table 6-5: Preparation of Polyacrylamide Gels.
Stacking Gel 5% Resolving Gel X%
40% Acrylamide / Bis 640 µl 0.25 · X% = x ml
0.5M Tris-HCl, pH 6.8 1.25 ml ---
1.5M Tris-HCl, pH 8.8 --- 2.5 ml
10% SDS (w/v) 50 µl 100 µl
H2O 3.025 ml 7.35 - x ml
TEMED 5 µl 5 µl
10% APS (w/v) 25 µl 50 µl
Total Volume 5 ml 10 ml

Materials and Methods
117
Native 8% (pH 8.8) gels were cast as continuous gels, i.e., without stacking gel, and SDS
was replaced by H2O.
For native PAGE and SDS-PAGE different sample preparation conditions, running buffers,
and electrophoresis conditions were employed as described below.
Following electrophoretic separation, gels were stained for 60 min with a staining solution
containing 0.1% (w/v) Coomassie Brilliant Blue R-250, 50% (v/v) methanol, and 10% (v/v)
glacial acetic acid. After 60 minutes the staining solution was replaced by the destaining
solution (25% (v/v) methanol, 10% (v/v) glacial acetic acid) and the gels were destained until
protein bands became visible and background stain was sufficiently removed. Gels were air-
dried between cellophane sheets for documentation.
6.2.5.1 Native Polyacrylamide Gel Electrophoresis
Native PAGE of the intact, non-cross-linked as well as cross-linked A2t was performed
under non-denaturing conditions in the absence of SDS and reducing agents employing 8%
continuous gels. Native sample buffer (containing 62.5 mM Tris-HCl, pH 6.8, 40% glycerol (Bio-
Rad)) without SDS and 2-mercaptoethanol was used for sample preparation in 1:1 ratio without
heating and the samples were filled into the sample wells. Detergent-free, 5x concentrated
running buffer (pH 8.3) containing 0.96 M glycine and 0.125 M Tris was diluted 1:5 (v/v).
Electrophoretic separation was conducted at 100V for ~4 hours at 4°C. Immunoglobulin A (300
kDa), lactate dehydrogenase (140 kDa), phosphorylase b (97 kDa), bovine serum albumine (67
kDa), carbonic anhydrase (29 kDa), and cytochrome c (12 kDa) were used as molecular weight
standards.
6.2.5.2 SDS - Polyacrylamide Gel Electrophoresis
One-dimensional SDS-PAGE was conducted as described by Laemmli [Laemmli, 1970].
Samples were mixed 1:1 (v/v) with Laemmli sample buffer containing 5% (v/v) 2-
mercaptoethanol and heated for 5 min at 95°C. For separation of the CaM / melittin cross-
linking reaction mixtures, 5% stacking / 15% resolving gels were prepared. For separation of the
ANXA2 / p11 cross-linking reaction mixtures, 5% stacking and 10, 12, or 15% resolving gels
were employed. Gels for monitoring the protein purification process and gels for subsequent
Western Blot analysis were 5% stacking / 12% resolving gels. Running buffer (prepared from
10x concentrated running buffer containing 0.25 M Tris, 1.92 M glycine, and 1% (v/v) SDS)
(Roth), was used for denaturing SDS-PAGE. Electrophoretic separation was conducted at room
temperature for about 90-120 min at 140V, depending on the porosity of the gels employed.
Gels intended for Western Blotting and post-translational modification analysis were not
stained with Coomassie Brilliant Blue, but were immediately processed for further use as

Materials and Methods
118
described in the respective chapters. Unless stated otherwise, Precision Plus Unstained
molecular weight standard from Bio-Rad was used.
6.2.6 Enzymatic Proteolysis
Following separation of protein mixtures by one-dimensional polyacrylamide gel
electrophoresis, the protein bands of interest were excised and in-gel digested. The gel bands
were cut into cubes of about 1 mm3 and the Coomassie stain was removed by three
consecutive washing steps employing 150 µl of a 50% (v/v) acetonitrile (ACN) / 50% (v/v) H2O
solution. The gel pieces were incubated in the washing solution for 10 minutes on a shaker and
the supernatants were discarded. In the next step, 80 µl ACN were added, the liquid was
removed after five minutes, and was replaced by 80 µl of a 100 mM NH4HCO3 solution. Again,
80 µl ACN were added without removing the NH4HCO3 solution and the gel cubes were
incubated for another ten minutes before the supernatant was discarded. In the following
vacuum centrifugation step, the gel pieces were dried within 30 minutes. For reduction of
disulfide bonds, 80 µl of a 10 mM dithiothreitol (DTT) / 100 mM NH4HCO3 solution were added
and incubated at 56°C for 45 minutes. For alkylation of the reduced cysteines, the DTT solution
was discarded and replaced by 80 µl of a 55mM iodoacetamide / 100 mM NH4HCO3 solution
and incubated at ambient temperature in the dark for 30 minutes. For removal of the reagents,
the gel pieces were washed by repeating the washing procedure described above and dried in
the vacuum concentrator. Diverse proteases were used for different applications. Trypsin
solution was prepared from 2µl-aliquots containing 1 µg trypsin in 1mM HCl. The aliquot was
diluted with 18 µl of a 50 mM NH4HCO3 solution, resulting in a 50 ng/µl trypsin solution.
Endoproteinase AspN solution was prepared by H2O to result in the desired concentrations (see
respective descriptions). LysC, GluC, and chymotrypsin were used at 50 ng/µl. For enzymatic
proteolysis, between 5 and 10 µl of enzyme solution were added to the dry gel pieces,
depending on the total volume of the gel pieces and the original Coomassie staining intensity of
the gel bands. After the protease solution was fully absorbed, the gel pieces were covered by a
50 mM NH4HCO3 solution. The gel pieces were incubated at 37°C for 16 hours unless stated
otherwise. Upon termination of the digestion by adding 50 µl ACN / H2O / formic acid (47.5%
(v/v) / 47.5 % (v/v) / 5% (v/v)) and retaining the supernatant, the peptides were extracted from
the gel pieces by incubation at room temperature for 10 minutes with fresh solution for two more
times. The individual supernatants were combined, concentrated in the vacuum concentrator to
a volume of about 10-15 µl, and stored at –20°C for subsequent mass spectrometric analysis.

Materials and Methods
119
6.2.6.1 Enzymatic Proteolysis of Proteins for Peptide Mass Fingerprint Analysis
For characterization of amino acid sequences of CaM and melittin in-gel digestions were
performed with trypsin (50 ng/µl, 37°C, over-night), trypsin / AspN mixture (50 ng/µl each, 37°C,
over-night), LysC / AspN mixture (50 ng/µl each, 37°C, over-night), and AspN (40 ng/µl, 37°C,
over-night), respectively.
ANXA2 and p11 amino acid sequence coverages were obtained by analysis of digests with
trypsin (50 ng/µl, 37°C, over-night) and AspN (30 or 60 ng/µl, 37°C, over-night). Chymotrypsin
(50 ng/µl, 37°C, 2hrs) was additionally employed for in-gel digestion of p11 for obtaining better
sequence coverage. In addition to trypsin, GluC (50 ng/µl, 37°C, 16 hrs) was used for
characterization of the N-terminally truncated annexin A2 species.
Co-purified proteins from A2t purification were digested with trypsin (50 ng/µl, 37°C, over-
night), as were all the proteins of A2t binding partners (chapter 6.2.4).
6.2.6.2 Enzymatic Proteolysis of Calmodulin / Melittin Cross-Linking Reaction Mixtures
Trypsin alone (50 ng/µL) was used for all cross-linking reaction mixtures, whereas
endoproteinase AspN (40 ng/µL), trypsin/AspN (both 100 ng/µl), and LysC/AspN (both 100
ng/µl) were used as additional digestion enzymes of the CaM / Mel complex cross-linked with
EDC/sNHS. When employing a combination of two proteases, only half the volume of each was
added to the gel bands to result in a two-fold dilution (i.e. 50 ng/µl) of the initial concentration.
6.2.6.3 Enzymatic Proteolysis of A2t Cross-Linking Reaction Mixtures
Trypsin (50 ng/µL) was used for all cross-linking reaction mixtures, whereas endoproteinase
AspN (50 ng/µL) was exclusively used for the sDST cross-linking reaction mixtures. The digests
were incubated at 37°C for 16 hrs.
6.2.7 MALDI-TOF Mass Spectrometry
MALDI-TOFMS was performed on a Voyager DE™ RP Biospectrometry™ Workstation (Applied
Biosystems) and on an Autoflex I instrument (Bruker Daltonik) both equipped with a nitrogen
laser (337 nm). Both instruments possess delayed-extraction technology and were operated in
positive ionization mode. Furthermore, both mass spectrometers possess a linear and a
reflector detector.
For analyses with the Voyager instrument 96-well stainless steel MALDI sample plates
were used. An MTP 384 massive target T was the target plate for the Autoflex I instrument.
Data acquisition and data processing were performed using the Voyager software version
5.1 and the Data Explorer software version 4.0 (Applied Biosystems), and the Flex Control
2.2.19.0 and Flex Analysis 2.2 software (Bruker Daltonik).

Materials and Methods
120
6.2.7.1 Sample Preparation for MALDI-TOFMS
Prior to MALDI-TOF mass spectrometric analysis the target plate onto which the samples are to
be deposited needs to be thoroughly cleaned. This is achieved by rinsing with different solvents
and gentle rubbing of the target surface.
The samples were desalted prior to analysis employing either C-18 or C-4 ZipTips (Millipore) for
low-volume peptide and protein samples, respectively. For larger volumes, microcon centrifugal
filter devices (Millipore) with appropriate cut-off were employed. The matrices were prepared by
preparing a saturated solution in 50-70 % (v/v) acetonitrile and 0.1 % (v/v) TFA or FA. The
supernatant was several-fold diluted until a thinly and evenly dispersed matrix layer was
observed upon deposition on the target. α-Cyano-4-hydroxy cinnamic acid (Bruker, (Sigma))
was employed for peptide analyses. Sinapinic acid (Sigma) was used for linear MALDITOFMS
of the intact CaM/Mel complex. For linear MALDI-TOFMS of intact ANXA2 the following
matrices were employed: 6-aza-2-thiothymine (ATT), 2’,5’-dihydroxyacetophenone , 2,5-
dihydroxybenzoic acid (DHB), 3,5-dimethoxy-4-hydroxy cinnamic acid (sinapinic acid), and 4-
hydroxyazobenzene-2-carboxylic acid (HABA).
Matrix and sample solutions were deposited on the MALDI sample plate using the dried-
droplet method.
6.2.7.2 Voyager DE RP
Linear mode MALDI-TOFMS of the non-digested CaM / Mel cross-linking reaction mixtures was
performed for monitoring the extent of chemical cross-linking. Measurements were conducted in
positive ionization mode using sinapinic acid as the matrix.
The matrix was prepared in 30% (v/v) acetonitrile / 70% (v/v) H2O / and 0.1% (v/v) trifluoro
acetic acid. Samples were desalted employing Microcon YM-10 filters (Millipore) and prepared
using the dried droplet method. 100 shots were added to one spectrum in the mass range m/z
2000 to 42000. The instrument was calibrated using cytochrome c ([M+H]+average at m/z 12361.6)
and myoglobin ([M+H]+average at m/z 16952.6).
For sequence coverages of CaM, melittin, and ANXA2, the instrument was run in positive
reflector mode with typically 200 shots summed to one spectrum. Calibration was performed
with angiotensin II ([M+H]+mono at m/z 1046.54), angiotensin I ([M+H]+mono at m/z 1296.68),
substance P ([M+H]+mono at m/z 1347.74), and somatostatin (red) ([M+H]+mono at m/z 1637.72).
6.2.7.3 Autoflex I
For protein analysis, measurements were performed in linear positive ionization mode using
sinapinic acid, 2,5-dihydroxybenzoic acid (DHB), 2’,5’-dihyroxyacetophenone, 4-
hydroxyazobenzene-2-carboxylic acid (HABA), and 6-aza-2-thiothymine (ATT) as matrices.

Materials and Methods
121
Positive ionization and reflectron mode were employed for MALDI-TOFMS measurements of
peptide mixtures using α-cyano-4-hydroxy-cinnamic acid as matrix. All matrices were prepared
in 50% (v/v) acetonitrile / 50% (v/v) H2O / and 0.1% (v/v) formic acid. Samples were desalted
using C4-ZipTips for proteins and C18-ZipTips for peptides (Millipore), respectively, and
prepared using the dried droplet method.
For peptide analysis, 200 laser shots were added to one spectrum typically in the m/z
ranges 800 to 4,000 or m/z 500 to 4,000. Peptide Calibration Standard (Bruker Daltonik)
(angiotensin II ([M+H]+mono at m/z 1046.54), angiotensin I ([M+H]+mono at m/z 1296.68),
substance P ([M+H]+mono at m/z 1347.74), bombesin ([M+H]+mono at m/z 1619.82), ACTH clip 1-
17 ([M+H]+mono at m/z 2093.09), ACTH clip 18-39 ([M+H]+mono at m/z 2465.20), and somatostatin
([M+H]+mono at m/z 3147.47)) was used for external calibration of the mass spectra in the
reflectron mode. Additionally, internal calibration of mass spectra was performed with autolytic
peptide signals of trypsin. When analyzing AspN-digested samples of ANXA2 and p11, signals
of ANXA2 and p11 peptides generated from AspN digestion that were frequently observed in
the spectra, were used for internal calibration. For external mass spectra calibration in the linear
mode, cytochrome c ([M+H]+average at m/z 12362), carbonic anhydrase ([M+H]+average at m/z
29025), and bovine serum albumin ([M+H]+average at m/z 66431) were used. 1000 laser shots
were accumulated to one spectrum in the m/z range between 8,000 and 110,000.
Ultraflex III: Experiments were conducted at Bruker Daltonik, Bremen.
6.2.8 Nano-High Performance Liquid Chromatography / Nano-Electrospray Ionization-Fourier Transform Ion Cyclotron Resonance Mass Spectrometry
6.2.8.1 Mass Spectrometric Analysis of the Calmodulin / Melittin Complex
The peptide mixtures from enzymatic digests were separated by nano-HPLC. Nano-HPLC was
carried out on an Ultimate™ Nano-LC system (LC Packings) equipped with a Switchos II
column switching module and a Famos™ Micro Autosampler with a 5-µl sample loop. Samples
were injected by the autosampler and concentrated on a trapping column (PepMap, C18, 300
µm * 1 mm, 5 µm, 100 Å, LC Packings) with water containing 0.1% formic acid (v/v) at flow rates
of 20 µl/min. After two minutes, the peptides were eluted onto the separation column (PepMap,
C18, 75 µm * 150 mm, 3 µm, 100 Å, LC Packings), which had been equilibrated with 95% A (A
being H2O + 0.1% (v/v) formic acid). Peptides were separated using the following gradient: 0-30
min: 5-50% B, 30-31 min: 50-95% B, 31-35 min: 95% B (B being acetonitrile + 0.1% (v/v) formic
acid) at flow rates of 200 nl/min and detected by their UV absorptions at 214 and 280 nm.

Materials and Methods
122
The nano-HPLC system was coupled on-line to an Apex II FTICR mass spectrometer
equipped with a 7 Tesla superconducting magnet (Bruker Daltonics) and a nano-electrospray
ionization source (Agilent Technologies). For nano-ESIMS, coated fused-silica PicoTips (tip IDs
8 µm and 15 µm, New Objective) were applied. The capillary voltage was set to -1400 V. Mass
spectral data were acquired over a range of m/z 400-2000, four scans were accumulated per
spectrum, and 400 spectra were recorded for each LC/MS run. MS data acquisition was
initialized with a trigger signal from the HPLC system 5 min after initiation of the LC gradient.
Data were acquired over 34.5 min. Calibration of the instrument was performed with CID
fragments (capillary exit voltage 200 V) of the LHRH peptide. Data acquisition and data
processing were performed using the XMASS software, versions 5.0.10 and 6.0 (Bruker
Daltonics). Processing of the raw data was performed using the ‘Projection’ tool in the XMASS
software [Bruker BioAPEX User’s Manual, 1996].
6.2.8.2 Mass Spectrometric Analysis of the ANXA2 / P11 Complex
The peptide mixtures from enzymatic digests were separated by the nano-HPLC system as
described above. The only differences were that after three minutes peptides were eluted onto
the separation column and that data acquisition and data processing were performed using
XMASS version 7.02. 2
6.2.8.3 Tandem Mass Spectrometric Analysis of the ANXA2 / P11 Complex
In-gel digests of cross-linking reaction mixtures from heterodimeric and heterotetrameric
complexes between ANXA2 and p11 were additionally analyzed by MS/MS experiments. The
peptide mixtures resulting from the in-gel digests were separated by C18-RP-chromatography
on a nano-HPLC system (Ultimate 3000, Dionex; pre-column: PepMap C18, 300µm * 5 mm, 3
µm, 100 Å, Dionex; separation column: PepMap, C18, 75 µm * 150 mm, 3 µm, 100 Å, Dionex;
solvents A: 5% (v/v) acetonitrile, 0.1% (v/v) formic acid in water, B: 80% (v/v) acetonitrile, 0.08%
(v/v) formic acid in water) using a gradient from 0 to 60 % B in 90 minutes followed by isocratic
elution with 90% B for 3 minutes. An LTQ-FT mass spectrometer (Thermo Electron) with a 7
Tesla magnet equipped with a nano-ESI source (Proxeon Biosystems; emitter: distal coated
PicoTips, tip i.d. 15 µm, New Objective) was on-line coupled to the nano-HPLC system. MS
data were acquired over 100 min in data-dependent MS2 mode: each high-resolution full scan
(m/z 300–2,000, resolution at m/z 400 was set to 100,000) in the ICR cell was followed by 10
product ion scans in the linear trap of the 10 most intense signals in the full-scan mass
2 Measurements on the ApexII instrument were conducted by Christian Ihling and Stefan Kalkhof.

Materials and Methods
123
spectrum (isolation window 3 u). Dynamic exclusion (exclusion duration 20 s, exclusion window
± 5 ppm) was enabled in order to allow detection of less abundant ions. 3
6.2.9 Processing of Mass Spectra
6.2.9.1 MALDI-TOFMS Data
Labeling of the mass spectra recorded on the Voyager (Applied Biosystems) instrument in the
reflector mode was performed by the Deisotoping tool in the Data Explorer software (v. 4.0,
Applied Biosystems). The obtained monoisotopic masses ([M+H]+) were manually evaluated by
setting peak detection thresholds for defined detection ranges based on signal intensities.
Linear MALDI-TOF mass spectra were labeled with the Peak Label tool in the Data Explorer
software.
Monoisotopic masses ([M+H]+) in the mass spectra recorded on the Autoflex I (Bruker
Daltonik) in the reflector mode were labeled manually. Linear MALDI-TOF mass spectra were
as well evaluated manually.
6.2.9.2 ESI-FTICRMS Data
ESI-FTICR (Apex II) mass spectra were processed with the XMass (v. 7.0.2 and 7.0.3, Bruker
Daltonics) software. The single spectra were projected into one final mass spectrum using the
Projection tool in the XMass software. The mass spectra were deconvoluted and monoisotopic
masses ([M+H]+) were manually labeled.
6.2.9.3 MS/MS Data
Data analysis was performed by dividing the chromatograms of the total ion current into five-
minutes-fractions and the obtained average mass spectra were deconvoluted using the Mascot
Distiller software v. 2.0 (Matrix Science). Product ion mass spectra of identified cross-linked
peptides were also processed with Mascot Distiller (v. 2.0, Matrix Science).
6.2.10 Peptide Mass Fingerprint Analysis
The Mascot (www.matrixscience.com) search tool Peptide Mass Fingerprinting was employed
for the identification of unknown proteins obtained during A2t purification. A set of
experimentally obtained peptide masses is compared to theoretical peptide masses calculated
from protein sequences deposited in protein databases like e.g. the NCBI (National Center for
Biotechnology Information, www.ncbi.nlm.nih.gov) database. Information on the taxonomy, the
3 Measurements on the LTQ-FT instrument were performed by Christoph Stingl.
Materials and Methods
124
employed protease, the number of missed cleavages, and on fixed (e.g. carbamidomethylation,
N-terminal acetylation) and variable (e.g. methionine oxidation) modifications are provided by
the user. Furthermore, the error window for experimental peptide masses needs to be defined.
Then the entered MS peaklist is searched for matches and proteins putatively matching the
entered masses are displayed. The probability-based MOWSE score given for an identified
protein is a criterion whether the result is significant or not.
6.2.11 Data Analysis
Cross-linked products were identified using IsoFind, the GPMAW (General Protein Mass
Analysis for Windows) software, versions 5.12beta3, 6.00, and 7.01 (Lighthouse Data)
(available at: http//welcome.to/gpmaw), the ExPASy Proteomics tools in the Swiss-Prot
Database (available at: www.expasy.org), ASAP (Automatic Spectrum Assignment Program) v.
1.09 and MS2Assign.
6.2.11.1 IsoFind
The in-house developed tool ‘IsoFind’ (developed by Tibor Kohajda and Stefan Kalkhof) was
employed for searching for distinct 4.025 or 8.05 amu spacing between two signals from a given
MS peaklist. The macro is run in Excel and applied to MS peaklists containing m/z values in one
column and either signal intensity or peak area values in the second column. From this, the
macro additionally calculates the signal ratios based on either signal intensity or peak area.
6.2.11.2 General Protein Mass Analysis for Windows (GPMAW)
This software calculates theoretical cross-linked products (inter- and intramolecular cross-linked
products, peptides modified by a partially hydrolyzed cross-linking reagent) and peptides for one
or two given protein sequences. Both the protease and cross-linking reagent employed are
defined by the user as well as the maximum number of missed cleavages. The experimentally
obtained masses from mass spectrometric analysis are compared to the theoretic values and
are assigned to cross-linked products or peptides. Maximum mass deviations for correct
assignment were 10 ppm for ESI-FTICRMS data and (at maximum) 100 ppm for MALDI-
TOFMS data
In case of doubt, cross-links assigned by the software were not considered as such when
discrimination between a peptide and a cross-linked product or between two different cross-
linked products, coincidently having the same mass, was ambiguous. In case of the CaM /
melittin complex, cleavages by proteases at modified amino acids, such as the trimethylated
K115 in CaM as well as amino acids modified by cross-linking reagents, were excluded. Both
the N-terminus of CaM and the C-terminus of melittin were excluded from possible cross-linking
Materials and Methods
125
by EDC since the former is acetylated and the latter amidated. In case of the ANXA2 / p11
complex, cleavages by proteases at amino acids modified by cross-linking reagents, were
allowed. The N-terminus of ANXA2 is acetylated and thus unavailable for cross-linking.
6.2.11.3 ExPASy Proteomics Tools
The FindPept and FindMod tools of the Swiss-Prot database (www.expasy.org) were used for
comparison of experimentally obtained m/z values from MS analysis of an enzymatically
digested protein with the theoretical peptide masses calculated for a specified amino acid
sequence. The FindPept tool was also used for searching for intrapeptide cross-links and
peptides with a hydrolyzed cross-linker by defining the cross-linking reagent as variable
modification. Data evaluation of the biotinylated protein was also performed using the FindPept
and FindMod tools. The program also accounts for protease autolysis and contaminant keratin
peptides.
6.2.11.4 Automated Spectrum Assignment Program (ASAP)
The ASAP tool (http://roswell.ca.sandia.gov/~mmyoung/asap.html) was used for assigning m/z
values obtained from MS analysis of enzymatically digested cross-linked proteins. ASAP
assigns cross-linked products and peptides based on comparison to theoretical cross-linked
products and peptides for a given protein. Information on cross-linker, protease, and amino acid
modifications has to be provided. Unfortunately, ASAP works only for single proteins.
Nevertheless, this program is useful as it, in contrast to GPMAW, considers variable
modifications.
6.2.11.5 MS2 Assign
MS2 Assign (http://roswell.ca.sandia.gov/~mmyoung/ms2assign.html) was used for assigning
m/z values obtained from MS fragmentation data of cross-linked peptides. MS2Assign
calculates a theoretical fragment library for a (cross-linked) peptide or a cross-linked pair of
peptides. Peptide sequences, crosslinker (if applicable), and amino acid modifications have to
be provided.
6.2.12 Computational Protein-Protein Docking
6.2.12.1 Protein-Peptide Docking of the CaM / Melittin Complex with Xplor-NIH
Structures of the CaM / melittin complex were calculated by conjoined rigid body/torsion angle
simulated annealing [Clore, 2000, Schwieters & Clore, 2001, Clore & Bewley, 2002] using the
molecular structure determination package Xplor-NIH [Schwieters et al., 2003] (available on-line

Materials and Methods
126
at: http://nmr.cit.nih.gov/xplor-nih) and structures were viewed using the VMD-XPLOR
visualization package [Schwieters & Clore, 2001] (available at: http://vmd-xplor.cit.nih.gov).
Distance restraints derived from cross-linking data were represented by empirical <r-6>-1/6
averages. This ensures that at least one of the distances in the restraint lies within the specified
target range, but no penalty ensues if the remaining distances within the restraint are much
longer than the target distance. The distances were classified into three ranges, ≤ 5 Å, ≤ 8.5 Å
and ≤ 13.4 Å, corresponding to cross-links obtained using EDC, sDST and BS3, respectively.
The starting coordinates employed for CaM and melittin were derived from the 2.2 Å resolution
crystal structure of the CaM / smMLCK peptide complex (PDB accession code 1CDL [Meador et
al., 1992) and the 2 Å resolution crystal structure of helical melittin (PDB accession code 2MLT
[Eisenberg et al., 1980]), respectively. The N- (residues 5-70) and C-terminal (residues 81-146)
halves of CaM, and the N- (residues 1-9) and C (residues 13-26) terminal halves of melittin
were treated as rigid bodies. Residues 71-80 of calmodulin, residues 10-12 of melittin (i.e., the
location of the kink between the two helical segments) and all interfacial side chains were given
full torsional degrees of freedom. The non-bonded term in the target function comprised a
quartic van-der-Waals repulsion term [Nilges et al., 1988] and a torsion angle database potential
of mean force derived from high-resolution crystal structures [Clore & Kuszewski, 2002]. The
latter ensures that the side chains torsion angles lie within energetically allowed rotamer ranges.
A qualitative interpretation of the cross-linking data indicated that melittin could bind CaM in two
opposing orientations. Consequently, both orientations were refined simultaneously by including
two complete sets of non-overlapping coordinates (i.e., no interactions were allowed between
the two sets). 4
6.2.12.2 Protein-Protein Docking of A2t with Rosetta
The X-ray structures of N-terminally truncated human ANXA2 (PDB entry 1W7B [Rosengarth et
al., 2004]) and the heterotetramer comprised of one p11 dimer (Homo sapiens) and two
synthetic ANXA2 N-terminal peptides (PDB entry 1BT6 [Réty et al., 1999]) were used as
starting structures for the docking procedure with Rosetta [Gray et al., 2003, Daily et al., 2005].
In a first low-resolution docking step 20,000 models were generated by randomizing both
docking partners. The models were filtered using the four distance restraints listed in Table 4-5.
The remaining 125 structures were clustered twice with cluster thresholds of 5 and 9 Å rmsd
(root mean square deviation), respectively. The structures representing the centers of clusters
with more than four models were used as starting structures for the following high-resolution
docking run, allowing a perturbation of 5 and 9 Å, respectively. The resulting structures were
filtered again (Table 4-5) and clustered with an rmsd threshold of 5 Å. The cluster center
4 Computational modeling of the calmodulin / melittin complex was performed by Dr. G. Marius Clore
Materials and Methods
127
structures of the top nine clusters with more than four models, together with two additional
structures, retrieved from filtering for NZ-NZ distances of lysine side chains, were used for
generating models of the symmetric A2t complex. A second ANXA2 monomer was added to the
(p11)2 / ANXA2 complex by superimposition, utilizing the inherent symmetry of the p11 dimer.
This superimposition, which was done with MAMMOTH [Olmea et al., 2002], led to steric
clashes for three out of eleven structures. For the remaining eight structures, the missing eight
amino acids between the N-terminal annexin peptide and N-terminally truncated ANXA2 as well
as the four C-terminal amino acids of p11 were modeled based on secondary structure
predictions using JUFO (www.meilerlab.org), PSIpred (http://bioinf.cs.ucl.ac.uk/psipred/), and
SAM (http://www.cse.ucsc.edu/research/compbio/sam.html). Amino acid substitutions between
porcine and human ANXA2 as well as between porcine ANXA2 and synthetic N-terminal
ANXA2 peptide were conducted before the A2t structures were subjected to repacking and
side-chain relaxation. With the objective of obtaining a model of the octameric ANXA2 / p11
complex, we created 2000 models of a p11 homotetramer by randomized docking. The starting
structure for the subsequent dock perturbation run was chosen restricting the N- and C-termini
of the two respective dimers to be in close proximity, thus ensuring that the opposite site that
was found to be the ANXA2 binding site remained unoccupied. From the 2000 model structures
after dock perturbation, one structure was picked, complying to the premise that the N- and C-
termini of the two respective dimers are equidistant and at the same time close to each other,
thus obtaining a compact and symmetric homotetramer. The models of the heterooctamer
structures between ANXA2 and p11 were obtained from the overlay of the A2t structure based
on the geometry of the p11 homotetramer. The dimensions of the created octamer structures
were determined using the Tabling function in the AMoRe software [Navaza, 1994]. 5
6.2.12.3 Determination of Solvent Accessibilities of Amino Acid Sidechains
Partially hydrolyzed cross-linkers, which are attached to lysine residues, provide valuable
information on the solvent accessibilities of the respective amino acid side chains in a protein.
The modified lysine residues were used for creating surface topology maps of ANXA2 and p11.
The findings were validated by the GETAREA 1.1 software (www.scsb.utmb.edu/getarea,
[Fraczkiewicz & Braun, 1998]) that calculates the solvent accessibilities of amino acid residues
and assigns amino acid residues that display more than 50% solvent accessibility to be
exposed on the surface of a protein.
5 The expert assistance of Stefan Kalkhof, who significantly contributed to computing the models of the complex between annexin
A2 and p11, is gratefully acknowledged.