the inheritance and molecular mapping of genes for...
TRANSCRIPT
Aus dem Institut für Pflanzenzüchtung und Pflanzenschutz
The Inheritance and Molecular Mapping of Genes for Post-anthesis Drought Tolerance
(PADT) in Wheat
Der Landwirtschaftlichen Fakultät der
Martin-Luther-Universität Halle-Wittenberg
als
Dissertation
zur Erlangung des akademischen Grades Doctor agriculturarum (Dr. agr.)
vorgelegt von M. Sc. in Agronomy geb. am 15. Juli 1971 Khaled Fathy Mahmoud Salem Farag in El-Menoufia, Ägypten. Gutachter: 1. Prof. Dr. W. E. Weber 2. Priv. Doz. Dr. A. Börner
3. Prof. Dr. Tamás Lelley
Öffentlich verteidigt am Oktober 25 th , 2004
Halle/Saale
2004
urn:nbn:de:gbv:3-000007346[http://nbn-resolving.de/urn/resolver.pl?urn=nbn%3Ade%3Agbv%3A3-000007346]
Contents
–––––––––––––––––––––––––– i –––––––––––––––––––––––––
CONTENTS
ABBREVIATIONS……...…………………………………………………………………...vi
LIST OF FIGURES……………….……………...…………………………...…………....viii
LIST OF TABLES…………………………….………………………………….……….…x
1. INTRODUCTION……………………………...……………………………………….….1
1.1. Wheat……………………………………………………………………………………...1
1.1.1. Economic importance and taxonomy of the wheat……………………………...1
1.1.2. Cultivation and use of the wheat crop…………………………………………...1
1.1.3. The wheat genome………………………………………………………………2
1.2. Drought tolerance………………………………………………………………………….3
1.2.1. Drought…………………………………………………………………………..3
1.2.2. Mechanism of drought tolerance………………………………………………...4
1.2.2.1. Drought escape………………………………………………………...4
1.2.2.2. Dehydration avoidance………………………………………………...4
1.2.2.3. Dehydration tolerance ………………………………………………...5
1.2.3. A conceptual model for drought tolerance…………………….………………...5
1.2.4. Stem reserve mobilization in wheat……………………………………………..8
1.2.4.1. Reserve accumulation………………………………………………….8
1.2.4.2. Reserve utilization……………………………………………………..8
1.2.4.3. Stem reserves mobilization under stress…………………….…………9
1.2.4.4. Methodology and selection for stem reserve under post-anthesis
drought stress………………………………………………………….10
1.2.5. How to estimate drought tolerance?…………...………..……………………...11
1.3. Molecular mapping in plants……………………………………………………………..11
1.3.1. Molecular marker technologies for genetic mapping…………………………..12
1.3.1.1. Hybridization based markers…………………………………………13
1.3.1.2. PCR-based molecular markers…………………………………….…15
1.3.1.3. Sequencing and DNA chip based markers…………………………...18
1.3.2. Comparison of different types of DNA markers……………………………….19
1.3.3. Mapping populations…………………………………………………………...21
1.3.3.1. F2 population………………...……………………………………….21
1.3.3.2. Back cross (BC) population…………………………………………..22
1.3.3.3. Doubled haploids (DHs) population………………………………….22
Contents
–––––––––––––––––––––––––– ii –––––––––––––––––––––––––
1.3.3.4. Recombinant inbred lines (RILs) or single seed descent (SSD)
population………………………………………………………..……23
1.3.4. Mapping quantitative trait loci (QTLs)………………………………………...23
1.3.4.1. Quantitative traits…………………………………………………….23
1.3.4.2. Methods of QTL mapping……………………………………………24
1.3.4.2.1. QTL analysis through a molecular marker approach………24
1.3.4.2.2. QTL analysis through a candidate gene approach………….25
1.3.4.3. Conclusions from QTL mapping experiments for abiotic stress……..25
1.3.5. Applications of molecular markers…………………………………………….26
1.3.5.1. Linkage maps…………………………………………………………26
1.3.5.2. Mapping qualitative traits for marker assisted selection (MAS)……..27
1.3.5.3. Fingerprinting and variety identification……………………………..29
1.3.5.4. Genetic diversity studies……………………………………………...29
1.3.5.5. Genetic fidelity and germplasm characterization………………….…30
1.4. Outline of the thesis……………………………………………………………………...30
2. MATERIALS AND METHODS………………………………………………………...31
2.1. Genetic materials…………………………………………………………………………31
2.1.1. Screening plant materials………………………………………………………31
2.1.2. Developing of F2:3 mapping population……...………………………………...31
2.1.3. Recombinant inbred lines (RILs)………………………………………………31
2.2. Drought experiments……...……………………………………………………………...31
2.2.1. Field experiments…………………………………………………...………….31
2.2.1.1. Screening plant materials………………………………………….…31
2.2.1.2. F2:3 mapping population……………………………….……………..32
2.2.1.3. Recombinant inbred lines (RILs)………………………………….…32
2.2.2. Drought test…………………………………………………………………….32
2.2.3. Drought scoring………………………………………………………………...33
2.2.4. Evaluation of phenotypic traits………………………………………………...33
2.2.4.1. Vegetative traits ………………………………….…………………..33
2.2.4.1.1. Flowering time (days)………………………………………33
2.2.4.1.2. Plant height (cm)………………………………………...…33
2.2.4.2. 1000-grain weight (g)………………………..……...………………..33
2.2.4.3. Grain characters………………………………………...…………….33
2.2.5. Gene symbols……………………………..……………………………………34
Contents
–––––––––––––––––––––––––– iii –––––––––––––––––––––––––
2.3. Molecular mapping………………………………………………………………………34
2.3.1. Enzymes, buffers and solutions………………………………………………...34
2.3.1.1. Enzymes…………………………………………………………...…34
2.3.1.2. Basic buffers and solutions……………………………………...……34
2.3.2. Solutions for DNA isolation……………………………………………………36
2.3.3. Genomic DNA isolation………………………………………………………..36
2.3.3.1. Plant growing and leave material preparation……………………..…36
2.3.3.2. Genomic DNA extraction for mapping………………………………37
2.3.3.3. Concentration measurement of DNA…………………………….…..37
2.3.4. Simple sequence repeats SSRs or microsatellite analysis……………………...37
2.3.4.1. Polymerase chain reaction analysis (PCR)……………………..…….37
2.3.4.2. Fragment analysis………………………………………………….…38
2.3.5. Marker nomenclature…………………………………………………………..39
2.4. Statistical methods……………………………………………………………………….39
2.4.1. Analysis of variance……………………………………………………………39
2.4.2. Phenotypic frequency distribution……………………………………………..39
2.4.3. Map construction……………………………………………………………….39
2.4.4. Quantitative trait loci analysis………………………………………………….40
3. RESULTS………………………………………...……………………………………….41
3.1. Screening wheat genotypes for post-anthesis drought tolerance ……...………………...41
3.2. Analysis of post-anthesis drought tolerance in F3 families………………………………42
3.2.1. Analysis of field experiments…………………………………………………..42
3.2.1.1. Phenotypic analysis and inheritance of stem reserve mobilization.….42
3.2.1.2. Phenotypic analysis and inheritance of vegetative traits………….….43
3.2.1.3. Phenotypic analysis and inheritance of grain characters……………..44
3.2.2. Genetic mapping……………………………………………………………….45
3.2.2.1. Polymorphism rate detected by microsatellite markers………………45
3.2.2.2. Linkage map construction……………………………………………46
3.2.3. Mapping QTLs for post-anthesis drought tolerance in F3 families ……………48
3.2.3.1. Mapping QTL for stem reserve mobilization (Srm)………………….49
3.2.3.2. Mapping QTL for vegetative traits ……………..……………………49
3.2.3.2.1. Plant height (Ht)………………………………...………….49
3.2.3.2.2. Flowering time (Flt)……………...………………………...57
3.2.3.3. Mapping QTL for grain characters…………….……………………..57
Contents
–––––––––––––––––––––––––– iv –––––––––––––––––––––––––
3.2.3.3.1. Grain area (Gae)……………………………………………57
3.2.3.3.2. Grain width (Gwd)………………………………………….57
3.2.3.3.3. Grain length (Glt)…………………………………………..57
3.2.3.3.4. Grain circumference (Gcc)…………………………………58
3.2.3.3.5. Grain roundness (Grs)……………………………………...58
3.2.3.3.6. Grain form-density factor (Gdf)………………….…………58
3.3. Analysis of post-anthesis drought tolerance in RILs mapping population………………58
3.3.1. Analysis of field experiments…………………………….…………………….58
3.3.1.1 Phenotypic analysis and inheritance of stem reserve mobilization.…..58
3.3.1.2. Phenotypic analysis and inheritance of vegetative traits……………..59
3.3.1.3. Phenotypic analysis and inheritance of grain characters……………..60
3.3.2. Mapping QTLs for post-anthesis drought tolerance in RILs…………………..61
3.3.2.1. Mapping QTL for stem reserve mobilization (Srm)………….………62
3.3.2.2. Mapping QTL for vegetative traits……………………………..…….62
3.3.2.2.1. Plant height (Ht)……………………………………………62
3.3.2.2.2. Flowering time (Flt)………………………………………..62
3.3.2.3. Mapping QTL for grain characters……………………………..…….63
3.3.2.3.1. Grain area (Gae)……………………………………………63
3.3.2.3.2. Grain width (Gwd)……………………………………….…63
3.3.2.3.3. Grain length (Glt)…………………………………………..63
3.3.2.3.4. Grain circumference (Gcc)…………………………………63
3.3.2.3.5. Grain roundness (Grs)……………………………………...64
3.3.2.3.6. Grain form-density factor (Gdf)……………….……………64
4. DISCUSSION…………………...…………………………………...…………………....72
4.1. Screening wheat genotypes for post-anthesis drought tolerance………………………...72
4.2. Genetic analysis of post-anthesis drought tolerance……………………………………..73
4.2.1. Phenotypic analysis and inheritance of stem reserve mobilization character….73
4.2.2. Phenotypic analysis and inheritance of vegetative traits……………………….74
4.2.3. Phenotypic analysis and inheritance of grain characters……………………….74
4.3. Genetic mapping of gene/s loci post-anthesis drought tolerance………………………...74
4.3.1. Polymorphism rate detected by microsatellite markers..………………………75
4.3.2. Linkage map construction……………………………………………………...76
4.4. Mapping QTLs for post-anthesis drought tolerance……..………………………………78
4.4.1. Mapping QTL for stem reserve mobilization (Srm)…………..…….………….78
Contents
–––––––––––––––––––––––––– v –––––––––––––––––––––––––
4.4.2. Mapping QTL for vegetative traits………………………………..……………83
4.4.2.1. Plant height (Ht)……………………………………………………...83
4.4.2.2. Flowering time (Flt)…………………………………………….……83
4.4.3. Mapping QTL for grain characters………………………………..……………85
4.5. Sources of alleles for post-anthesis drought tolerance…………………………………...87
4.6. Perspectives for marker-assisted selection……………………………………………….87
5. SUMMARY……………...………………………………………………………………..89
5.1. ENGLISH SUMMARY…………….……..……………………………………89
5.1.1. Screening wheat genotypes for post-anthesis drought tolerance…….…89
5.1.2. Construction of the molecular linkage map……………………….……89
5.1.3. Mapping QTLs for post-anthesis drought tolerance (PADT)..…………90
5.1.3.1. Mapping QTL for stem reserve mobilization (Srm)………….90
5.1.3.2. Mapping QTL for vegetative traits…………...………………91
5.1.3.3. Mapping QTL for grain characters……………….…………..91
5.2. ZUSAMMENFASSUNG ……........…………...………………….…….……...92
5.2.1. Screening von Weizengenotypen auf Trockentoleranz nach der Blüte...92
5.2.2. Konstruktion der molekularen Kopplungskarte......................................92
5.2.3. Kartierung von QTLs für Trockentoleranz nach der Blüte.....................93
5.2.3.1. Kartierung von QTLs für Halmreserve Mobilisierung.............93
5.2.3.2. Kartierung von QTLs für vegetative Merkmale.......................94
5.2.3.3. Kartierung von QTLs für Kornmerkmale.................................94
6. REFERENCES………………………………………………………………………..…..95
7. APPENDIX………………………………………………………………………………125
ACKNOWLEDGEMENTS........................................................................................................
ERKLÄRUNG.............................................................................................................................
PUBLIKATIONEN AUS DER ARBEIT..................................................................................
CURRICULUM VITAE……………………………………………………………………….
Abbreviations
–––––––––––––––––––––––––– vi –––––––––––––––––––––––––
ABBREVIATIONS
ABA accumulation of abscisic acid AFLPs amplified fragment length polymorphisms ALF automated laser fluorescence express DNA sequencer ANOVA analysis of variance APS ammonium persulphate ARC agriculture research center BC back cross population BP base pairs C estimated centromere position cM centiMorgans cm centimeter CTD canopy temperature depression DAF DNA amplification fingerprinting dATP deoxyadenosinetriphosphate dCTP deoxycytosinetriphosphate dGTP deoxyguanosinetriphosphate DH doubled haploid DNA deoxyribonucleic acid DIA digital image analysis dTTP deoxythymidinetriphosphate EDTA ethylenediamine tetraacetic acid EtBr ethidium bromide EtOH ethanol F1 first filial generation, produced by crossing two parental lines F2 second filial generation, produced by selfing the F1 F3 third filial generation, produced by selfing the F2 FAO food and agriculture organization of the united nations Flt flowering time G gram Gae grain area Gcc grain circumference Gdf grain form density factor GFS02 Gatersleben field season 2002 GFS03 Gatersleben field season 2003 Glt grain length Grs grain roundness Gwd grain width gwm Gatersleben wheat microsatellite H hour(s) HG homoeologous group Ht Plant height ITMI international triticeae mapping initiative IPK Institut für Pflanzengenetik und Kulturpflanzenforschung KI potassium iodide LOD logarithm of odds M molar MAS marker-assisted selection Min minute(s)
Abbreviations
–––––––––––––––––––––––––– vii –––––––––––––––––––––––––
MM millimeters µl microliter PADT post-anthesis drought tolerance PCR polymerase chain reaction PV phenotypic variance QTL quantitative trait loci RAPD random amplified polymorphic DNA RFLP restriction fragment length polymorphism RILs recombinant inbred lines RLWC relative leaf water content RNAse ribonuclease S second(s) SCARs sequence characterized amplified regions SDS sodium dodecyl sulfate SIM simple interval mapping SNPs single nucleotide polymorphisms Srm stem reserve mobilization SSD single seed descent SSRs simple sequence repeats or microsatellite STI stress tolerance index STMS sequence-tagged microsatellite sites STRs short tandem repeats STS sequence tagged site TBE Tris-Borate-EDTA buffer TE Trise-EDTA (TE) buffer TNS total non-structural carbohydrate Tris 2-amino-2-(hydroxymethyl)-propane-1,3-diol WSC water soluble carbohydrate WUE water use efficiency W/V weight/volume V/V volume/volume U unit % percent * significant at 5% level of probability ** significant at 1% level of probability
List of figures
–––––––––––––––––––––––––– viii –––––––––––––––––––––––––
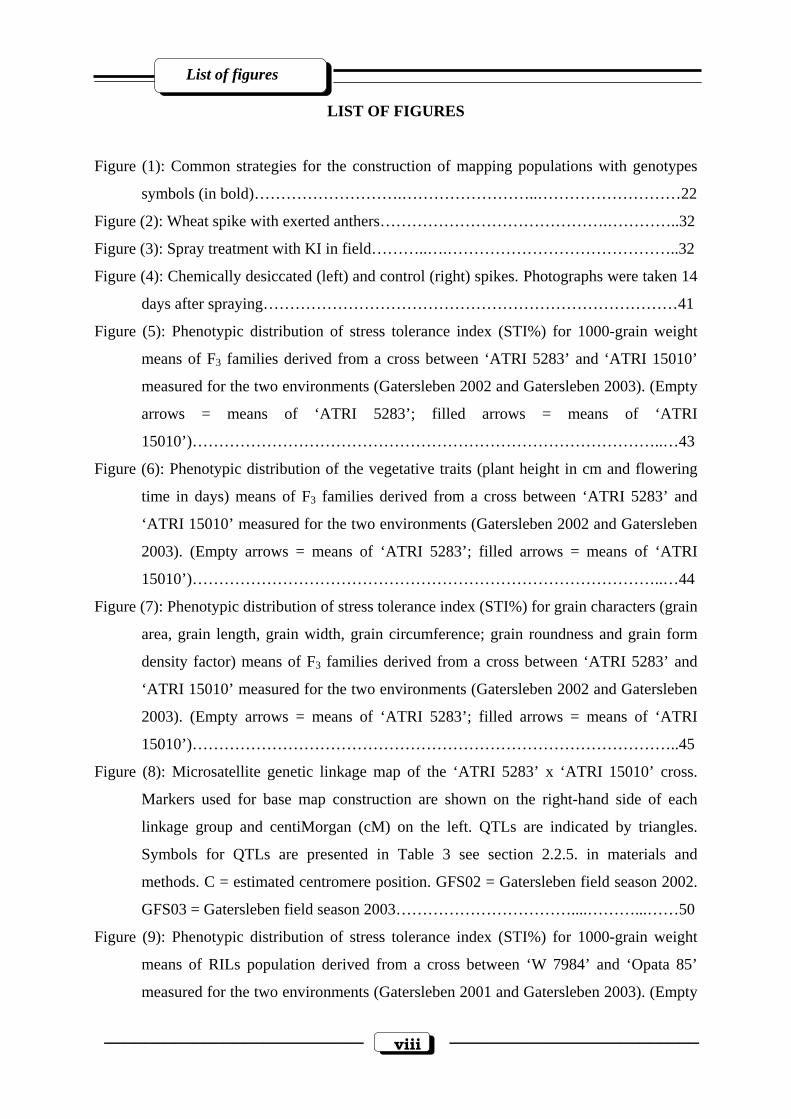
LIST OF FIGURES
Figure (1): Common strategies for the construction of mapping populations with genotypes
symbols (in bold)……………………….……………………..………………………22
Figure (2): Wheat spike with exerted anthers…………………………………….…………..32
Figure (3): Spray treatment with KI in field………..….……………………………………..32
Figure (4): Chemically desiccated (left) and control (right) spikes. Photographs were taken 14
days after spraying……………………………………………………………………41
Figure (5): Phenotypic distribution of stress tolerance index (STI%) for 1000-grain weight
means of F3 families derived from a cross between ‘ATRI 5283’ and ‘ATRI 15010’
measured for the two environments (Gatersleben 2002 and Gatersleben 2003). (Empty
arrows = means of ‘ATRI 5283’; filled arrows = means of ‘ATRI
15010’)……………………………………………………………………………..…43
Figure (6): Phenotypic distribution of the vegetative traits (plant height in cm and flowering
time in days) means of F3 families derived from a cross between ‘ATRI 5283’ and
‘ATRI 15010’ measured for the two environments (Gatersleben 2002 and Gatersleben
2003). (Empty arrows = means of ‘ATRI 5283’; filled arrows = means of ‘ATRI
15010’)……………………………………………………………………………..…44
Figure (7): Phenotypic distribution of stress tolerance index (STI%) for grain characters (grain
area, grain length, grain width, grain circumference; grain roundness and grain form
density factor) means of F3 families derived from a cross between ‘ATRI 5283’ and
‘ATRI 15010’ measured for the two environments (Gatersleben 2002 and Gatersleben
2003). (Empty arrows = means of ‘ATRI 5283’; filled arrows = means of ‘ATRI
15010’)………………………………………………………………………………..45
Figure (8): Microsatellite genetic linkage map of the ‘ATRI 5283’ x ‘ATRI 15010’ cross.
Markers used for base map construction are shown on the right-hand side of each
linkage group and centiMorgan (cM) on the left. QTLs are indicated by triangles.
Symbols for QTLs are presented in Table 3 see section 2.2.5. in materials and
methods. C = estimated centromere position. GFS02 = Gatersleben field season 2002.
GFS03 = Gatersleben field season 2003……………………………....………...……50
Figure (9): Phenotypic distribution of stress tolerance index (STI%) for 1000-grain weight
means of RILs population derived from a cross between ‘W 7984’ and ‘Opata 85’
measured for the two environments (Gatersleben 2001 and Gatersleben 2003). (Empty
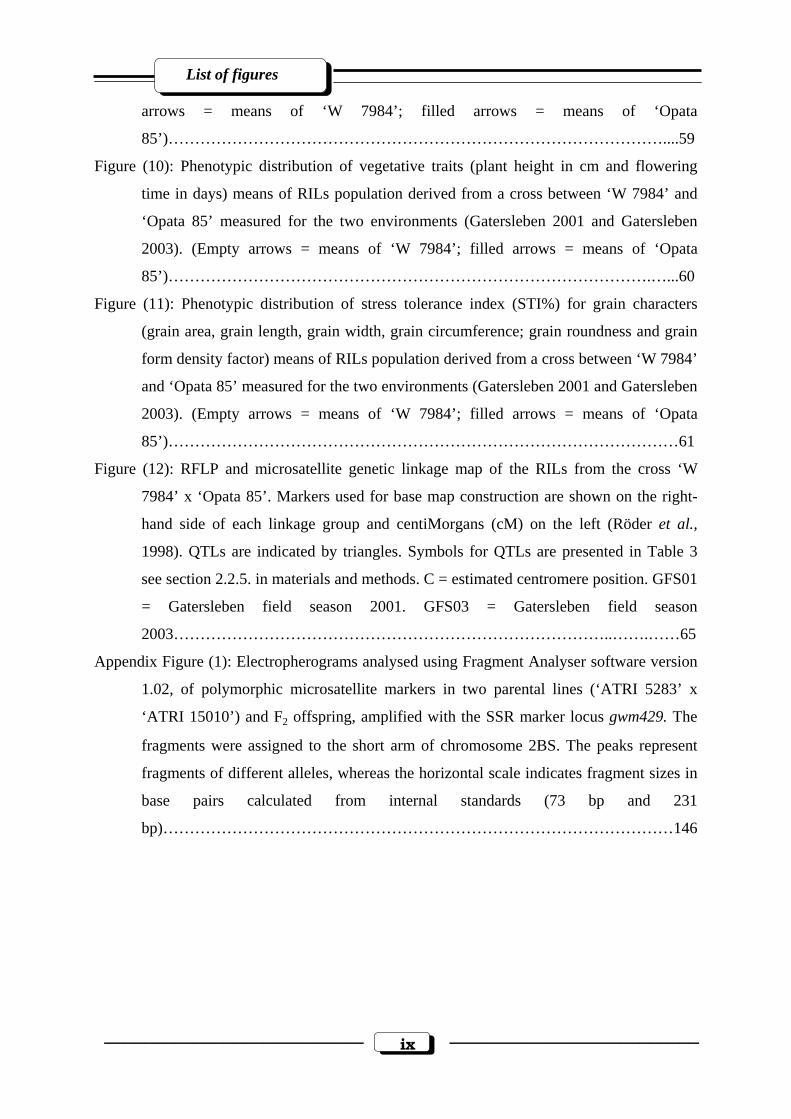
List of figures
–––––––––––––––––––––––––– ix –––––––––––––––––––––––––
arrows = means of ‘W 7984’; filled arrows = means of ‘Opata
85’)…………………………………………………………………………………....59
Figure (10): Phenotypic distribution of vegetative traits (plant height in cm and flowering
time in days) means of RILs population derived from a cross between ‘W 7984’ and
‘Opata 85’ measured for the two environments (Gatersleben 2001 and Gatersleben
2003). (Empty arrows = means of ‘W 7984’; filled arrows = means of ‘Opata
85’)……………………………………………………………………………….…...60
Figure (11): Phenotypic distribution of stress tolerance index (STI%) for grain characters
(grain area, grain length, grain width, grain circumference; grain roundness and grain
form density factor) means of RILs population derived from a cross between ‘W 7984’
and ‘Opata 85’ measured for the two environments (Gatersleben 2001 and Gatersleben
2003). (Empty arrows = means of ‘W 7984’; filled arrows = means of ‘Opata
85’)……………………………………………………………………………………61
Figure (12): RFLP and microsatellite genetic linkage map of the RILs from the cross ‘W
7984’ x ‘Opata 85’. Markers used for base map construction are shown on the right-
hand side of each linkage group and centiMorgans (cM) on the left (Röder et al.,
1998). QTLs are indicated by triangles. Symbols for QTLs are presented in Table 3
see section 2.2.5. in materials and methods. C = estimated centromere position. GFS01
= Gatersleben field season 2001. GFS03 = Gatersleben field season
2003………………………………………………………………………..…….……65
Appendix Figure (1): Electropherograms analysed using Fragment Analyser software version
1.02, of polymorphic microsatellite markers in two parental lines (‘ATRI 5283’ x
‘ATRI 15010’) and F2 offspring, amplified with the SSR marker locus gwm429. The
fragments were assigned to the short arm of chromosome 2BS. The peaks represent
fragments of different alleles, whereas the horizontal scale indicates fragment sizes in
base pairs calculated from internal standards (73 bp and 231
bp)……………………………………………………………………………………146
List of tables
–––––––––––––––––––––––––– x –––––––––––––––––––––––––
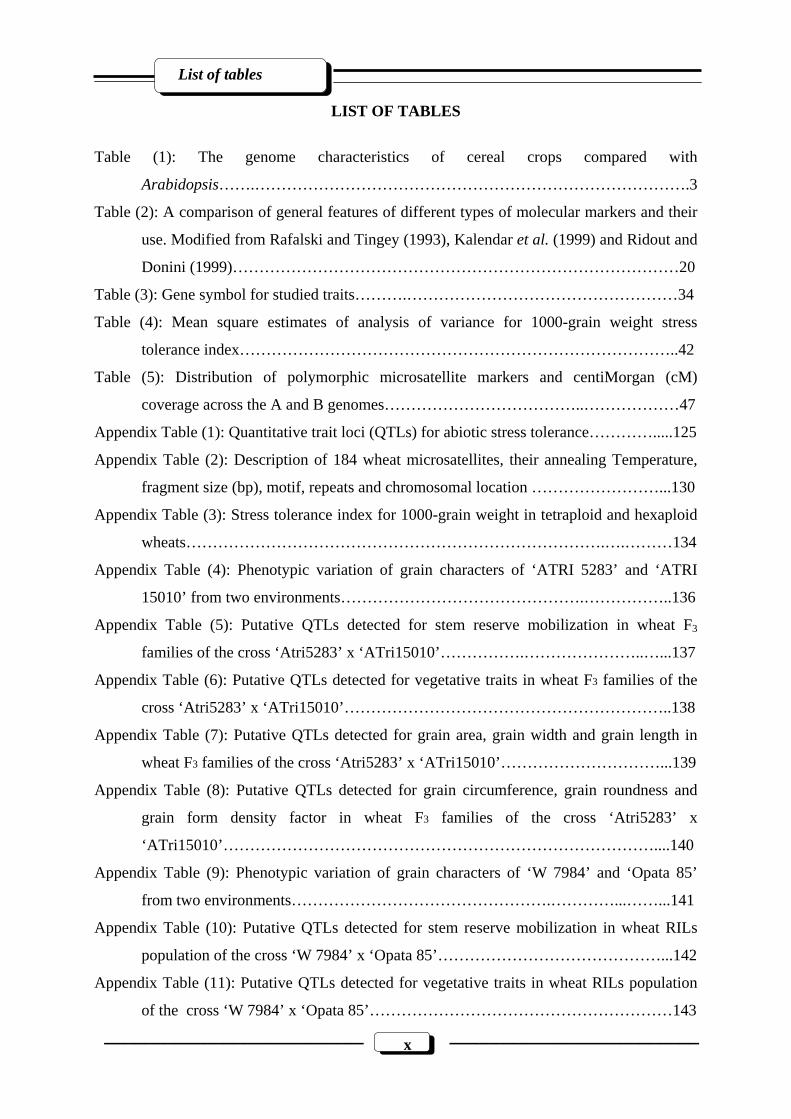
LIST OF TABLES
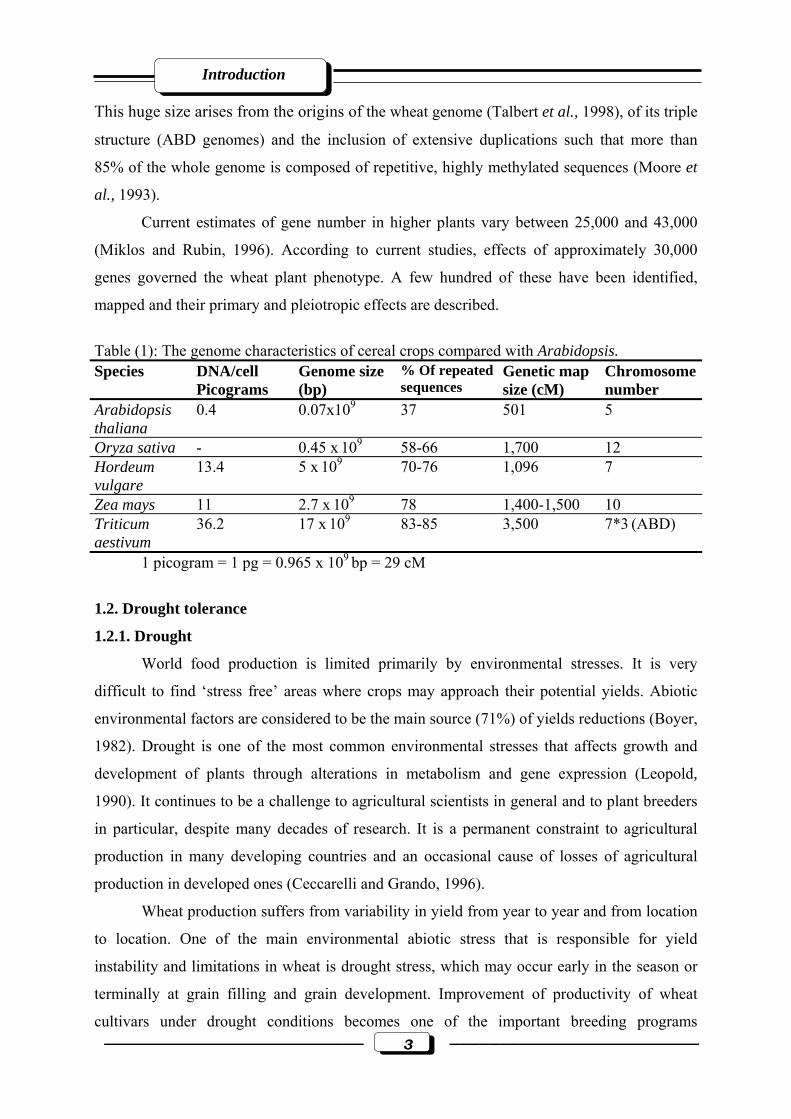
Table (1): The genome characteristics of cereal crops compared with
Arabidopsis…….……………………………………………………………………….3
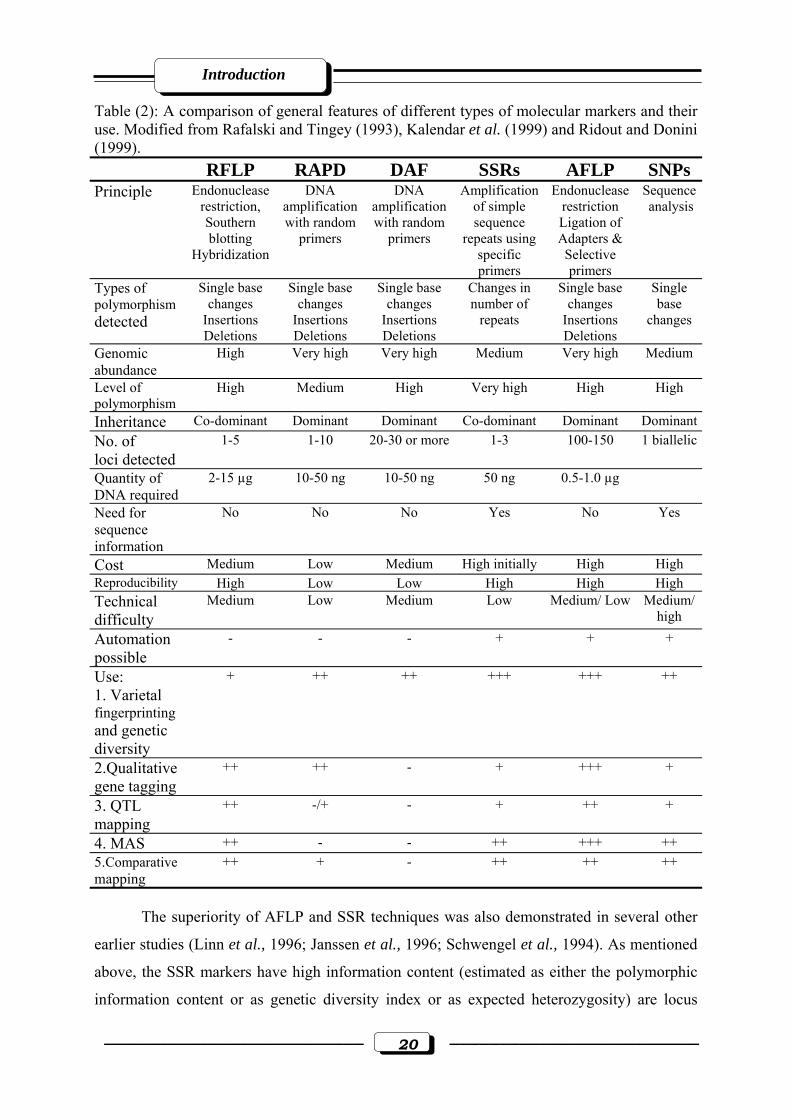
Table (2): A comparison of general features of different types of molecular markers and their
use. Modified from Rafalski and Tingey (1993), Kalendar et al. (1999) and Ridout and
Donini (1999)…………………………………………………………………………20
Table (3): Gene symbol for studied traits……….……………………………………………34
Table (4): Mean square estimates of analysis of variance for 1000-grain weight stress
tolerance index………………………………………………………………………..42
Table (5): Distribution of polymorphic microsatellite markers and centiMorgan (cM)
coverage across the A and B genomes………………………………..………………47
Appendix Table (1): Quantitative trait loci (QTLs) for abiotic stress tolerance………….....125
Appendix Table (2): Description of 184 wheat microsatellites, their annealing Temperature,
fragment size (bp), motif, repeats and chromosomal location ……………………...130
Appendix Table (3): Stress tolerance index for 1000-grain weight in tetraploid and hexaploid
wheats…………………………………………………………………….….………134
Appendix Table (4): Phenotypic variation of grain characters of ‘ATRI 5283’ and ‘ATRI
15010’ from two environments……………………………………….……………..136
Appendix Table (5): Putative QTLs detected for stem reserve mobilization in wheat F3
families of the cross ‘Atri5283’ x ‘ATri15010’…………….…………………..…...137
Appendix Table (6): Putative QTLs detected for vegetative traits in wheat F3 families of the
cross ‘Atri5283’ x ‘ATri15010’……………………………………………………..138
Appendix Table (7): Putative QTLs detected for grain area, grain width and grain length in
wheat F3 families of the cross ‘Atri5283’ x ‘ATri15010’…………………………...139
Appendix Table (8): Putative QTLs detected for grain circumference, grain roundness and
grain form density factor in wheat F3 families of the cross ‘Atri5283’ x
‘ATri15010’………………………………………………………………………....140
Appendix Table (9): Phenotypic variation of grain characters of ‘W 7984’ and ‘Opata 85’
from two environments………………………………………….…………...……...141
Appendix Table (10): Putative QTLs detected for stem reserve mobilization in wheat RILs
population of the cross ‘W 7984’ x ‘Opata 85’……………………………………...142
Appendix Table (11): Putative QTLs detected for vegetative traits in wheat RILs population
of the cross ‘W 7984’ x ‘Opata 85’…………………………………………………143
List of tables
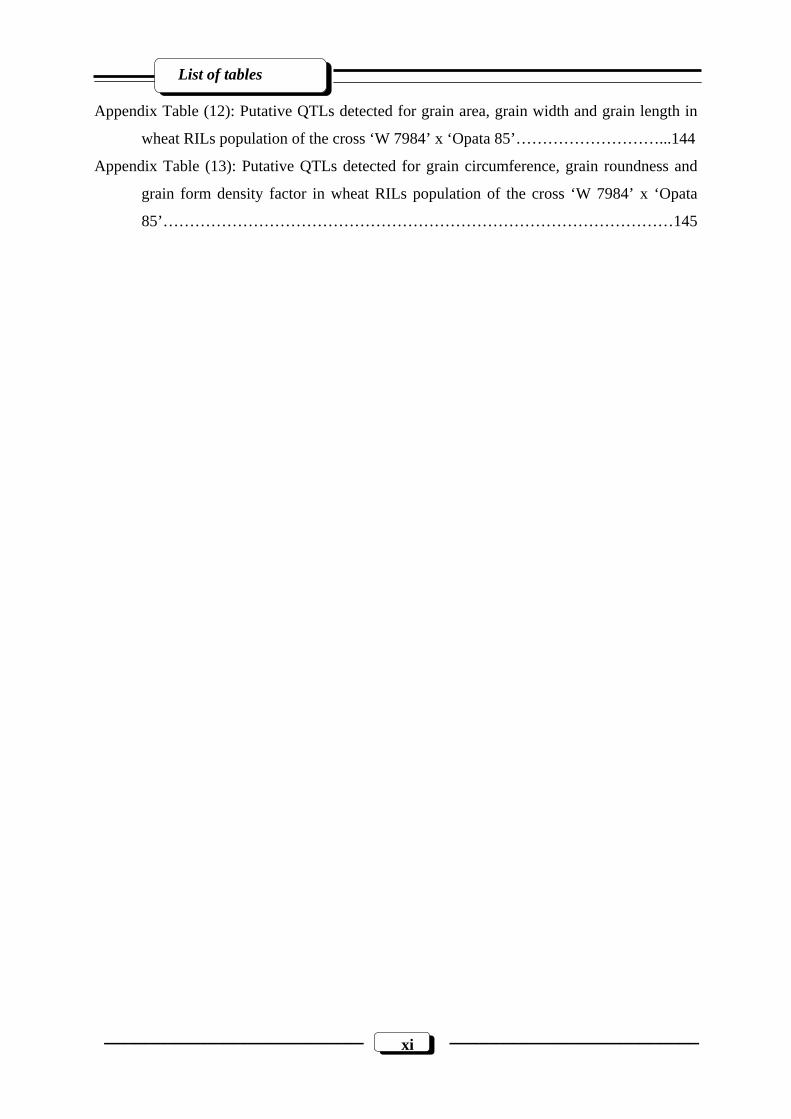
–––––––––––––––––––––––––– xi –––––––––––––––––––––––––
Appendix Table (12): Putative QTLs detected for grain area, grain width and grain length in
wheat RILs population of the cross ‘W 7984’ x ‘Opata 85’………………………...144
Appendix Table (13): Putative QTLs detected for grain circumference, grain roundness and
grain form density factor in wheat RILs population of the cross ‘W 7984’ x ‘Opata
85’……………………………………………………………………………………145
Introduction
–––––––––––––––––––––––––– 1 –––––––––––––––––––––––––
1. INTRODUCTION
1.1. Wheat
1.1.1. Economic importance and taxonomy of the wheat
Wheat (Triticum aestivum L. em Thell.) is the first important and strategic cereal crop
for the majority of world’s populations. It is the most important staple food of about two
billion people (36% of the world population). Worldwide, wheat provides nearly 55% of the
carbohydrates and 20% of the food calories consumed globally (Breiman and Graur, 1995). It
exceeds in acreage and production every other grain crop (including rice, maize, etc.) and is
therefore, the most important cereal grain crop of the world, which is cultivated over a wide
range of climatic conditions and the understanding of genetics and genome organization using
molecular markers is of great value for genetic and plant breeding purposes.
The grass family Poaceae (Gramineae) includes major crop plants such as wheat
(Triticum aestivum L.), barley (Hordeum vulgare L.), oat (Avena sativa L.), rye (Secale
cereale L.), maize (Zea mays L.) and rice (Oryza sativa L.). Triticeae is one of the tribes
containing more than 15 genera and 300 species including wheat and barley.
Wheat belongs to the tribe Triticeae (= Hordeae) in the grass family Poaceae
(Gramineae) (Briggle and Reitz, 1963) in which the one to several flowered spikelets are
sessile and alternate on opposite sides of the rachis forming a true spike. Wheats (Triticum)
and ryes (Secale) together with Aegilops, Agropyron, Eremopyron and Haynalidia form the
subtribe Triticineae (Simmonds, 1976).
Linnaeus in 1753 first classified wheat. In 1918, Sakamura reported the chromosome
number sets (genomes) for each commonly recognized type. This was a turning point in
Triticum classification. It separated wheat into three groups. Diploids had 14 (n=7),
tetraploids had 28 (n=14) and the hexaploids had 42 (n=21) chromosomes. Bread wheat is
Triticum aestivum. T. durum and T. compactum are the other major species. All three are
products of natural hybridization among ancestrals no longer grown commercially (Briggle,
1967).
1.1.2. Cultivation and use of the wheat crop
Wheat is an edible grain, one of the oldest and most important of the cereal crops.
Though grown under a wide range of climates and soils, wheat is best adapted to temperate
regions with rainfall between 30 and 90 cm. Winter and spring wheats are the two major types
of the crop, with the severity of the winter determining whether a winter or spring type is
cultivated. Winter wheat is always sown in the fall; spring wheat is generally sown in the
Introduction
–––––––––––––––––––––––––– 2 –––––––––––––––––––––––––
spring but can be sown in the fall where winters are mild. Therefore, today wheat is grown
all over the world, with different varieties sown according to the various climates. In
2002, the world’s main wheat producing regions were China, India, United States,
Russian Federation, France, Australia, Germany, Ukraine, Canada, Turkey, Pakistan,
Argentina, Kazakhstan and United Kingdom (FAO, 2003). Most of the currently
cultivated wheat varieties belong to hexaploid wheat (Triticum aestivum L.), which is
known as common bread wheat and valued for bread making. The greatest portion of the
wheat flour produced is used for bread making. Wheat grown in dry climates is generally
hard type, having protein content of 11-15 percent and strong gluten (elastic protein). The
sticky gluten of bread wheat entraps the carbon dioxide (CO2) formed during yeast
fermentation and enables leavened dough to rise. The hard type of wheat produces flour
best suited for bread making. The wheat of humid areas is softer, with protein content of
about 8-10 percent and weak gluten. The softer type produces flour suitable for cakes,
crackers, cookies, pastries and household flours. Durum wheat (Triticum turgidum L.),
which is the main tetraploid type, is also important, although its large, very hard grains
yield low gluten flour that is the main source of semolina suitable for pasta, couscous,
burghul and other Mediterranean local end-products (Nachit, 1992). Apparently, no
economically important diploid wheats are being cultivated as a crop anywhere in the
world. Although most wheat is grown for human food and about 10 percent is retained for
seed and industry (for production of starch, paste, malt, dextrose, gluten). Wheat grain
contains all essential nutrients; kernel contains about 12 percent water, including
carbohydrates (60-80% mainly as starch), proteins (8-15%) containing adequate amounts
of all essential amino acids (except lysine, tryptophan and methionine), fats (1.5-2%),
minerals (1.5-2%), vitamins (such as B complex, vitamin E) and 2.2% crude fibers.
1.1.3. The wheat genome
The haploid DNA content of hexaploid wheat (Triticum aestivum L. em Thell,
2n=42, AABBDD) is approximately 1.7 x 10¹⁰ bp, about 100 times larger than the
Arabidopsis genome, 40 times that of rice and about 6 times that of maize (Bennett and
Smith, 1976; Amuruganathan and Earle, 1991). The large genome of bread wheat has
resulted from polyploidy and extensive duplications, such that over 80% of the genome
consists of repetitive DNA sequences (Smith and Flavell, 1974). The average wheat
chromosome is around 810 MB, 25 times that of the average rice chromosome (Table 1).
Introduction
–––––––––––––––––––––––––– 3 –––––––––––––––––––––––––
This huge size arises from the origins of the wheat genome (Talbert et al., 1998), of its triple
structure (ABD genomes) and the inclusion of extensive duplications such that more than
85% of the whole genome is composed of repetitive, highly methylated sequences (Moore et
al., 1993).
Current estimates of gene number in higher plants vary between 25,000 and 43,000
(Miklos and Rubin, 1996). According to current studies, effects of approximately 30,000
genes governed the wheat plant phenotype. A few hundred of these have been identified,
mapped and their primary and pleiotropic effects are described.
Table (1): The genome characteristics of cereal crops compared with Arabidopsis. Species DNA/cell
Picograms Genome size (bp)
% Of repeated sequences
Genetic map size (cM)
Chromosome number
Arabidopsis thaliana
0.4 0.07x10⁹ 37 501 5
Oryza sativa - 0.45 x 10⁹ 58-66 1,700 12 Hordeum vulgare
13.4 5 x 10⁹ 70-76 1,096 7
Zea mays 11 2.7 x 10⁹ 78 1,400-1,500 10 Triticum aestivum
36.2 17 x 109 83-85 3,500 7*3 (ABD)
1 picogram = 1 pg = 0.965 x 10⁹ bp = 29 cM
1.2. Drought tolerance 1.2.1. Drought
World food production is limited primarily by environmental stresses. It is very
difficult to find ‘stress free’ areas where crops may approach their potential yields. Abiotic
environmental factors are considered to be the main source (71%) of yields reductions (Boyer,
1982). Drought is one of the most common environmental stresses that affects growth and
development of plants through alterations in metabolism and gene expression (Leopold,
1990). It continues to be a challenge to agricultural scientists in general and to plant breeders
in particular, despite many decades of research. It is a permanent constraint to agricultural
production in many developing countries and an occasional cause of losses of agricultural
production in developed ones (Ceccarelli and Grando, 1996).
Wheat production suffers from variability in yield from year to year and from location
to location. One of the main environmental abiotic stress that is responsible for yield
instability and limitations in wheat is drought stress, which may occur early in the season or
terminally at grain filling and grain development. Improvement of productivity of wheat
cultivars under drought conditions becomes one of the important breeding programs
Introduction
–––––––––––––––––––––––––– 4 –––––––––––––––––––––––––
objectives in wheat. Breeding for drought tolerant wheat cultivars is a major objective in arid
and semi-arid regions of the world due to inadequate precipitation, shortage of irrigation
water and high water demand for crop evapotranspiration in such climates.
1.2.2. Mechanism of drought tolerance
Drought tolerance in wild plant species is often defined as survival, but in crop species
it is defined in terms of productivity (Passioura, 1983). Rosielle and Hamblin (1981) defined
drought tolerance as the difference in yield between stress and non-stress environments, while
productivity is the average yield in stress and non-stress. A different definition regards
drought tolerance as minimization of reduction in yield caused by stress compared to yield
under non-stress environments (Fischer and Maurer, 1978; Langer et al., 1979; Blum, 1983a;
Blum, 1988). Also, it is defined as the relative yield of a genotype compared to other
genotypes subjected to the same drought stress (Hall, 1993). Drought tolerance comprises
drought escape, dehydration avoidance and dehydration tolerance mechanisms (Blum, 1988).
1.2.2.1. Drought escape
Drought escape through early flowering and/or short growth duration is advantageous
in environments with terminal drought stress and where physical or chemical barriers
inhibited root growth (Turner, 1986; Blum, 1988; Blum et al., 1989). On other hand, later
flowering can be beneficial in escaping early-season drought, if drought is followed by rains
(Ludlow and Muchow, 1990). Under non-stress conditions, late-flowering varieties tend to
yield higher than early-flowering ones (Turner, 1986; Lulow and Muchow, 1990). This is
because the early-flowering varieties are likely to leave the yield potential unutilized
(Muchow and Sinclair, 1986).
1.2.2.2. Dehydration avoidance
Dehydration avoidance can be defined as the plant’s ability to retain a relatively higher
level of ‘hydration’ under conditions of soil or atmospheric water stress (Blum, 1988). Levitt
(1980) recognized two plant types with respect to dehydration avoidance: plant that avoid
dehydration by reduced transpiration ‘water savers’ and plants that use means other than
reduced transpiration ‘water spenders’. Important features are root characteristics (increased
water uptake), leaf and stomata characteristics (reduced water loss) and osmotic adjustment to
lower the osmotic potential (Blum, 1988; Acevedo and Fereres, 1993).
Introduction
–––––––––––––––––––––––––– 5 –––––––––––––––––––––––––
1.2.2.3. Dehydration tolerance
Dehydration tolerance describes the ability of plants to continue metabolizing at low
leaf water potential and to maintain growth despite dehydration of the tissue or to recover
after release from stress conditions. According to Hsiao (1973) and Boyer (1976),
translocation is one of the more dehydration tolerant processes in plants. It would proceed at
levels of water deficit sufficient to inhibit photosynthesis. Ample information has been
accumulated in the cereals to show that grain growth is partially supported by translocated
plant reserves stored mainly in the stem during the pre-anthesis growth stages. When water
stress occurs and the current photosynthetic source is inhibited, the role of stem reserves as a
source for grain filling increases, both in relative and absolute terms. Stem reserves may
therefore be considered as a powerful resource for grain filling in stress-affected plants during
the grain filling stage.
1.2.3. A conceptual model for drought tolerance
The following model was described by Reynolds et al. (2000). Many anatomical,
physiological and biochemical traits are mentioned in the literature as being drought adaptive
(Blum, 1988; Loss and Siddique, 1994; Richards, 1996). This model will include those, which
are currently considered of most potential value to the environment described, bearing in
mind that not all traits are appropriate for all drought environments. The development of
molecular probes for marker assisted screening of these traits would be an important
objective, assuming their use is more efficient at identifying superior genotypes than
conventional screening approaches.
• Large seed size
Helps emergence, early ground cover and initial biomass.
• Long coleoptiles
Helps for emergence from deep sowing (Radford, 1987). This is practiced to help
seedlings reach the receding moisture profile and to avoid high soil surface temperatures
which inhibit germination.
• Early ground cover
Thinner, wider leaves (i.e. with a relatively low specific leaf weight) and a more prostrate
growth habit help to increase ground cover, thus conserving soil moisture and potentially
Introduction
–––––––––––––––––––––––––– 6 –––––––––––––––––––––––––
increasing radiation use efficiency (Richards, 1996). This trait would be more important in the
Mediterranean type of drought environment where rain may occur during the early part of the
cycle. It would be less useful in regions where the crop grows exclusively on stored soil
moisture where dust mulching is practiced or where residue retention is practiced to avoid
evaporation from the soil surface.
• High pre-anthesis biomass
Potential for vigorous growth prior to heading provides the opportunity to take advantage
of relatively good growing temperatures and moisture availability earlier in the cycle. Up to
40% of available water may be lost by evaporation directly from the soil in Mediterranean
types of environments (Loss and Siddique, 1994), so high early ground cover and biomass
production may permit a more efficient use of soil water. Although most drought studies
show that high water use efficiency (WUE) is not associated with better performance (Sayre
et al., 1995), ideally early biomass should be achieved with maximal water use efficiency to
improve water availability during grain filling.
• Good capacity for stem reserves and remobilization
Stored fructans can contribute substantially to grain filling especially when canopy
photosynthesis is inhibited by drought (Rawson and Evans, 1971). Traits that may contribute
include long and thick stem internodes, with extra storage tissue perhaps in the form of solid
stems. In studies where crosses where made between lines contrasting in the solid stem trait,
the solid-stem progeny contained more soluble carbohydrate per unit of stem length, though
total stem carbohydrate was unaffected due to narrower and shorter stems (Ford et al., 1979).
• High spike photosynthetic capacity
Spikes have higher WUE than leaves and have been shown to contribute up to 40% of
total carbon fixation under moisture stress (Evans et al., 1972). Awns contribute substantially
to spike photosynthesis and longer awns are a possible selection criterion. While gas
exchange measurement of spikes is time consuming and difficult to standardize, chlorophyll
fluorescence should be considered as a more rapid means of screening for spike
photosynthetic capacity under stress.
• High RLWC/CTD during grain filling to indicate ability to extract water
A root system that can extract whatever water is available in the soil profile is clearly
drought adaptive (Hurd, 1968), but difficult to measure. Traits affected by the water relations
Introduction
–––––––––––––––––––––––––– 7 –––––––––––––––––––––––––
of the plant, such as relative leaf water content (RLWC) measured pre-dawn or canopy
temperature depression (CTD) during the day and C13 discrimination or ash content of grain
or other tissues, can give indications of water extraction patterns.
• Osmotic adjustment
Adjustment will help maintain leaf metabolism and root growth at relatively low leaf
water potentials by maintaining turgor pressure in the cells (Morgan and Condon, 1986).
Some research suggests that the trait can be assayed relatively easily by measuring coleoptile
growth rate of seedlings in polyethylene glycol.
• Accumulation of abscisic acid (ABA)
The benefit of ABA accumulation under drought has been demonstrated (Innes et al.,
1984). It appears to pre-adapt plants to stress by reducing stomatal conductance, rates of cell
division, organ size and increasing development rate. However, high ABA can also result in
sterility problems since high ABA levels may abort developing florets.
• Leaf anatomy: waxiness, pubescence, rolling and thickness
These traits decrease radiation load to the leaf surface (Richards, 1996). Benefits
include a lower evapotranspiration rate and reduced risk of irreversible photo-inhibition.
However, they may also be associated with reduce radiation use efficiency, which would
reduce yield under more favorable conditions.
• High tiller survival
Comparison of old and new varieties have shown that under drought older varieties
over-produce tillers many of which fail to set grain while modern drought tolerant lines
produce fewer tillers most of which survive (Loss and Siddique, 1994).
• Heat tolerance
The contribution of heat tolerance to performance under moisture stress needs to be
quantified, but it is relatively easy to screen for (Reynolds et al., 1998).
• Stay green
The trait may indicate the presence of drought avoidance mechanisms, but probably
does not contribute to yield per se if there is no water left in the soil profile by the end of the
cycle to support leaf gas exchange. It may be detrimental if it indicates lack of ability to
Introduction
–––––––––––––––––––––––––– 8 –––––––––––––––––––––––––
remobilize stem reserves (Blum, 1998). However, research in sorghum has indicated that
stay-green is associated with higher leaf chlorophyll content at all stages of development and
both were associated with improved yield and transpiration efficiency under drought (Borrell
et al., 2000).
1.2.4. Stem reserve mobilization in wheat
1.2.4.1. Reserve accumulation
Reserve accumulation in the stem and the size of the storage strongly depend on the
growing conditions before anthesis. Total stem nonstructural carbohydrate (TNS) at anthesis
was shown to vary from 50 to 350 g kg-1 dry mass in different experiments (Kiniry, 1993).
Under optimal growing conditions with regard to temperature, water regime (Davidson and
Chevalier, 1992) and mineral nutrition (Papakosta and Gagianas, 1991), carbon assimilation
rates are high and a proportion of the assimilation during stem elongation is reduced by stress,
storage in stems is reduced. For example, remobilized water soluble carbohydrate (WSC)
were 641 mg and 1047 mg in water stressed and irrigated wheat, respectively, because the
former had less storage than the latter (Davidson and Chevalier, 1992). Under dry land field
conditions only half amount of water-soluble carbohydrates was available for remobilization
during grain filling, as compared with irrigated conditions. Stem length, as affected by height
genes, is important in affecting stem reserve storage. The Rht1 and Rht2 dwarfing genes of
wheat were found to reduce reserve storage by 35% and 39%, respectively as a consequence
of a 21% reduction in stem length (Borrell et al., 1993). However, under the favorable
conditions the advantage of the tall (rht) genotype in reserve storage was not expressed in
greater mobilization to ear. Under these favorable grain filling conditions only about 20% of
grain yield was contributed by stem reserves in all genotypes. The contribution of stem
reserves to grain yield was greater in a tall than a short barley cultivar, but absolute yield was
the same in both, indicating that the taller cultivar was lacking in current assimilation
compared with the shorter one (Daniels and Alcock, 1982).
1.2.4.2. Reserve utilization
Stem reserve mobilization is affected by sink size, by the environment and by cultivar.
The demand by grain yield sink is a primary factor in determining stem reserve mobilization.
Environmental conditions that decrease current assimilation during grain filling pose an
increased demand for stem reserves for grain filling. When wheat plants were shaded during
grain filling, up to 0.93g of grain was produced per gram of assimilates exported from the
Introduction
–––––––––––––––––––––––––– 9 –––––––––––––––––––––––––
stem (Kiniry, 1993). Stem reserve mobilization is affected by water deficit grain filling. Even
the rate of development of water deficit may affect mobilization (Palta et al., 1994). It is
therefore to be expected that estimates of relative contributions of stem reserves to total grain
mass per ear or to grain yield would vary among the different reports, according to the
experimental conditions and cultivar used. These contributions were estimated to be anywhere
between 6% and 100% (Austin et al., 1980, Papakosta and Gagianas, 1991; Pheloung and
Siddique, 1991; Davidson and Chevalier, 1992; Borrell et al., 1993; Blum et al., 1994; Gent,
1994; Palta et al., 1994; Khlestkina et al., 2001, Börner et al., 2002a, 2003, Salem and Börner
2003). It may be concluded that the reduction in current assimilation during grain filling,
under different stresses, will induce an increase in stem reserve mobilization and utilization
by grain. Drought conditions during grain filling often also involve heat stress, which reduces
the duration of grain filling. There is normally an increase in the rate of grain dry matter
accumulation under high temperatures, but it is not sufficient to compensate for the decrease
in duration.
1.2.4.3. Stem reserves mobilization under stress
In most wheat growing regions and especially in the Mediterranean grain filling is
subjected to several physical and biotic stresses. Grain filling often occurs when temperatures
are increasing and moisture supply is decreasing. Also foliar disease of wheat tends to spread
and intensify towards and after flowering. Leaf rust, stripe rust and Septoria leaf blotch can
result in total leaf destruction at grain filling. The common end result of all these stresses is
the reduction in kernel weight, kernel shriveling, reduced test weight and loss in yield. The
current source of carbon for grain filling is assimilation by light intercepting viable green
surfaces. This source is normally diminishing due to natural senescence and the effect of
various stresses, in addition to the demand posed by maintenance respiration of live plant
biomass.
While root storage is important in some legumes and other species, there is no
evidence that roots or leaves are as important as stems for reserve storage in the small grains.
In most studies of stem reserves in the small grains, stems also include the leaf sheaths, which
in themselves contain reserves. In small grains, stems store carbohydrates in the form of
glucose, fructose, sucrose and starch, but the main reserve is fructan (Lopatecki et al., 1962;
Dubois et al., 1990; Wardlaw and Willenbrink, 1994). Storage is commonly analyzed as total
non-structural carbohydrates (TNS) or water soluble carbohydrates (WSC). Fructan
accumulated in internodes while they were extending, although most of the fructan in an
Introduction
–––––––––––––––––––––––––– 10 –––––––––––––––––––––––––
internode accumulated after it was fully extended. When WSC was mobilized from the stem,
the mass of fructose first increased then decreased, indicating that fructan was hydrolyzed at a
faster rate than it is produced (Bonnett and Incoll, 1992).
1.2.4.4. Methodology and selection for stem reserve under post-anthesis drought stress
An important form of drought stress tolerance is the tolerance to post-anthesis stress.
In wheat, as in other cereals, grain filling depends partly on actual photosynthesis during this
period and partly on carbohydrates stored during pre-anthesis which are translocated from
vegetative plant parts. Under conditions of terminal drought (and heat) stress, net
photosynthesis decreases significantly in wheat (Acevedo, 1991) and the proportion of
translocation of stored soluble carbohydrates as a source for grain filling becomes larger
(Austin et al., 1977, 1980; Richards and Townley-Smith, 1987). Stem reserve mobilization is
affected by water deficit grain filling. Genetic variation exists within cereal crop species in the
ability to sustain kernel growth by remobilization of reserves (Austin et al., 1977; Acevedo
and Ceccarelli, 1989).
Blum et al. (1983a, 1983b) developed a technique for revealing translocation-based
grain filling in absence of photosynthesis under post-anthesis stress in wheat. With this
method, small plots are sprayed to complete wetting by a solution of magnesium or sodium
chlorate (4% active ingredient), at the initial part of the linear phase of kernel growth
(approximately 14 days after anthesis), when final cell number of the kernel has been
determined in each genotype. The chemical bleaches all plant surfaces upon contact without
killing the plant. The desiccant kills all photosynthetic tissue including leaves, leaf sheaths,
glumes and awns. The treatment does not simulate drought stress. However, it simulates the
effect of stress by inhibiting current assimilation. When the plants are devoid of their
chlorophyll, grain filling can proceed only with translocated plant reserves. At harvest, 1000
kernel weight was compared between treated and non-treated (control) plants, calculating the
rate of reduction in kernel weight caused by treatment. The technique is being applied
experimentally in Australia using potassium iodide as a desiccant (Turner and Nicholas, 1987;
Nicholas and Turner, 1993).
The correlation across diverse genetic materials between the rate of reduction in kernel
weight by chemical desiccation and the rate of reduction by drought stress was found to be
significant. It was r = 0.81 *** and r = 0.79 ** over two years in Blum et al. (1983b) and r =
0.48 *** and r = 0.81** over two years in Nicholas and Turner (1993).

Introduction
–––––––––––––––––––––––––– 11 –––––––––––––––––––––––––
Chemical desiccation can be incorporated into breeding program in two ways. Firstly,
it can be used to assess responses of individual advanced lines or families, always compared
with non-treated controls under non-stress conditions. Secondly, it can be used in mass
selection at the F2-F4 generation.
1.2.5. How to estimate drought tolerance?
Due to the complexity of drought tolerance in comparison to other traits, e.g., quality or
disease traits, which are more clearly defined, efforts to increase drought tolerance could be
achieved through selection for yield, which integrates all the unknown factors that will be
important for improving drought tolerance. However, consideration should be given to whether
the plants are grown in conditions which are representative of the target environments, genetic
variation is maximum and the genotype x environment interactions are not too large.
Accordingly, many yield-based parameters were suggested to evaluate drought tolerance.
Many of them were constructed in forms of indices, e.g., stress susceptibility index (SSI)
suggested by Fischer and Maurer (1978). The stress susceptibility index is the ratio of relative
reduction in yield of genotype due to drought compared to the mean relative reduction in yield of
all tested genotypes. This SSI is found to be equivalent to the ratio of yield under stress (Yd) to
yield under non-stress (Yw), (Yd/Yw) (Link et al., 1999).
1.3. Molecular mapping in plants
Traditional methods of plant breeding have made a significant contribution to crop
improvement, but they have been slow in targeting complex traits like grain yield, grain
quality and abiotic stress such as drought. In traditional plant breeding, the plant breeder
during selection of desirable plant from the segregation population faced the following
problems: (i) a large segregating population needs to be screened for a desirable trait e.g.,
yield and its component, quality, drought tolerance, disease resistance, etc.; (ii) wait for
advanced generations F6 to start selection for quantitative traits, for which selection in early
generation is not effective; (iii) it becomes very difficult to screen a segregating population
for a desired trait when the trait is influenced by environment; (iv) contrasting forms are often
not distinguishable at seedling stage, making it necessary to grow population up to the adult
stage; (v) it is difficult to undertake pyramiding of resistance genes, since selection of
additional genes in presence of an existing resistance gene would be difficult. To meet the
great increase in food production necessitated by population growth and the higher standards
of living expected by most of the developing countries, biotechnology brings new and
powerful tools to plant breeders. One method receiving growing attention is the mapping of

Introduction
–––––––––––––––––––––––––– 12 –––––––––––––––––––––––––
chromosomal regions affecting qualitative or quantitative traits. Polygenic characters, which
were very difficult to analyse using traditional plant breeding methods, can now be tagged
using DNA molecular markers. Molecular markers allow geneticists and plant breeders to
locate and follow the numerous interacting genes that determine a complex trait. Genetic
linkage maps can provide a more direct method for selecting desirable genes via their linkage
to easily detectable molecular markers (Tanksley et al., 1989). Combining marker-assisted
selection methods with conventional breeding schemes can increase the overall selection gain
and, therefore, the efficiency of breeding program. With the use of molecular techniques it is
possible to hasten the transfer of desirable genes between varieties and to introgress novel
genes from wild species into crop plants. The plant breeder would like to exercise indirect
marker aided selection (MAS) at the seedling stage in early generations, if possible.
Availability of tightly linked molecular markers for a trait will facilitate such an indirect
selection and help plant breeding by saving time and expense.
1.3.1. Molecular marker technologies for genetic mapping
The development of molecular marker technologies during the last ten years has
revolutionized the genetic analysis of crop plants. A significant progress has been made
towards the use of molecular approaches in plant breeding. From the time of Gregor Mendel
until the mid-eighties, morphological characters had been the major types of markers readily
available for genetic mapping. Molecular marker technology has changed dramatically during
the past two decades. The first molecular markers were isozyme markers, which based on the
different mobility of differently charged protein with the same enzymatic function on the gel.
Enzyme markers have limited genome coverage and numbers. The term molecular marker is
taken here to refer to markers identifying variation at the level of DNA, though biochemical
markers such as isozymes have made a valuable contribution to the development of genetic
maps in the late seventies and eighties for example, of tomato (Tanksley and Rick, 1980) and
maize (Edwards et al., 1987).
The molecular markers, so developed, may be used for improving the efficiency of
traditional plant breeding by facilitating indirect selection through molecular markers linked
to genes for the traits of interest, because, these markers are not influenced by the
environment and can be scored at all stages of plant growth. This saves time, resources and
energy that are needed not only for raising large segregating populations for several
generations, but also for estimating the parameters used for selection. In addition to these
applications, DNA markers can also be used for germplasm characterization, genetic
Introduction
–––––––––––––––––––––––––– 13 –––––––––––––––––––––––––
diagnostics, study of genetic diversity, study of genome organization, etc. (Rafalaski et al.,
1996). Molecular markers have already been used not only for the preparation of molecular
maps but also for tagging genes, controlling traits of interest, for use in marker assisted
selection (MAS). In plant, using markers, several genetic maps were initially prepared in
tomato (Bernatzky and Tanksley, 1986). Subsequently, maps were constructed in different
crops such as rice (McCouch et al., 1988, Kishimoto et al., 1989); maize (Burr et al., 1988;
Beavis and Grant, 1991; Burr and Burr, 1991), barley (Heun et al., 1991; Graner et al., 1991;
Hinze et al. 1991) or wheat (Chao et al., 1989; Liu and Tsunewaki, 1991; Liu et al., 1992;
Devos et al., 1992; Devos and Gale, 1993; Röder et al., 1998).
There are two main types of molecular markers, isozyme markers and DNA markers.
Markert and Moller (1959) were first to describe the differing forms of bands that they were
able to visualize with specific enzyme stains and they were the first to introduce the term
isozyme. Following this discovery further investigation showed that many of these enzymes
were tissue specific and generally unaffected by environmental or other factors. Lately, it was
found that this type of markers has many limitations and disadvantages (Tanksley, 1983). The
other type is DNA based markers. Recombinant DNA technology has provided new more
powerful tools for studying genetic variation with a greater resolution than all previous
experimental methods, including protein electrophoresis. Recombinant DNA technology can
be applied to a variety of in vitro techniques, which include DNA isolation and production of
new combination of heritable material by the splicing of the nucleic acids in vitro (Old and
Primrose, 1989). The main advantage of DNA based markers is that they give information of
about any kind of sequence in the genome, not only of isozymes or highly expressed non-
isozymatic proteins such as storage proteins but also unexpressed sequences.
On the basis of the principles and methods employed, molecular markers can be
broadly classified in the following four groups according to Mohan et al., 1997; Gupta et al.,
1999b; Gupta and Varshney, 2000, (i) hybridization based markers, (ii) PCR-based molecular
markers and (iii) sequencing and DNA chip based markers.
1.3.1.1. Hybridization based markers
Now it is possible to gain information about the whole genome and any of its
components, surpassing the limitations of protein electrophoresis, which only gives
information on translated sequences. DNA based markers have overcome main limitations of
protein electrophoresis since the detection of variation is not limited to coding regions and all
categories of mutational events can, in principle, be detected.

Introduction
–––––––––––––––––––––––––– 14 –––––––––––––––––––––––––
In 1980, it was suggested that large numbers of genetic markers might be found by
studying differences in the DNA molecule itself, revealed as restriction fragment length
polymorphisms (RFLP) (Botstein et al., 1980). This technique involves restriction of genomic
DNA followed by electrophoretic size separation of the fragments in a gel matrix. The
fragments are then transferred to a membrane by Southern blotting and hybridized with a
radioisotope labeled probe. Many sources of DNA can serve as probes, such as a small piece
of genomic DNA, cDNA sequence or specific PCR products. Sometimes, probes can be
adopted from other species as heterologous probes for comparative mapping, which allows
comparison of genome organization and evolution between the related species (Tanksley et
al., 1988; Bonierbale et al., 1988; Lagercrantz et al., 1996; Lagercrantz, 1998). The
polymorphisms detected by RFLP rely on the specific and characteristic nucleotide sequence,
which is recognized and cut by restriction enzymes. Insertions or deletions between restriction
sites or mutations occurring at restriction sites result in length polymorphisms of restriction
fragments. The range of fragment length and number of fragments depends on different
enzymes. RFLP markers are often co-dominant and, therefore, very informative. However,
generating RFLP data is labor intensive and time consuming and requires a relatively large
amount of DNA. RFLP maps have been developed for a number of species like maize
(Helentjaris et al., 1986, Helentjaris 1987), tomato (Bernatzky and Tanksley 1986, Helentjaris
et al., 1986, Zamir and Tanksley 1988), lettuce (Landry et al., 1987), rice (McCouch et al.,
1988), pepper (Tanksley et al., 1988), Arabidopsis (Chang et al., 1988), rye (Börner and
Korzun, 1998; Korzun et al., 2001), barley (Graner et al., 1991; Heun et al., 1991) and peanut
(Halward et al., 1992). In wheat, due to low frequency of RFLP, this approach has been
relatively less useful. This is sometimes attributed to polyploid nature, high proportion of
repetitive DNA and large genome size. Despite these difficulties, sufficient applications of
RFLP were practiced in wheat. These purposes included, genome mapping (Devos and Gale,
1993), variety identification (Gupta et al., 1998) and marker aided selection (Gale et al.,
1995). In wheat, RFLP’s have been used to map loci for seed storage protein (Dubcovsky et
al., 1997), flour colour (Parker et al., 1998), vernalization and frost resistance (Galiba et al.,
1995), dwarfing and vernalization (Korzun et al., 1997), resistance to pre-harvest sprouting
(Anderson et al., 1993), tissue culture response (Ben Amer et al., 1997), resistance against
cereal cyst nematode (Eastwood et al., 1994; Williams et al., 1996), milling yield (Parker et
al., 1999) and different important agronomic characters (Börner et al., 2002b).
Introduction
–––––––––––––––––––––––––– 15 –––––––––––––––––––––––––
1.3.1.2. PCR-based molecular markers
The development of new methods to perform analysis with molecular markers has
been the focus of many recent studies and most of these are based on PCR amplification of
genomic DNA (Kochert, 1994). Polymerase chain reactions (PCR) have been considered to
be the most revolutionary modern technique of molecular biology in 1980s. PCR is a
powerful extremely sensitive technique with applications in many fields such as molecular
biology diagnostics and population genetics. Recombinant DNA techniques have
revolutionized genetics by permitting the isolation and characterization of genes, allowing the
detailed study of their function and expression during development processes, or as a response
to environmental factors. More of the cloning methods involved can be accelerated and
sometimes even circumvented by using PCR, and novel applications of the technique now
permit studies that were not possible before. The idea of PCR is a simple process in which a
specific segment of DNA is synthesized repeatedly, resulting in the production of large
amounts of a single DNA sequence starting from a minute quantity of template (Saiki et al.,
1985). The process depends on primer sequences of DNA, which match flanking sequences at
both ends of targeted sequence. Through repeated denaturing, annealing and synthesized
steps, the intervening sequence is synthesized in a 2n amplification.
• Random amplified polymorphic DNA (RAPD)
Random Amplified Polymorphic DNA (RAPD) (William et al., 1990; Welsh and
McClelland, 1990) is a PCR-based technique for DNA fingerprinting. This assay, unlike the
PCR, does not require knowledge of the target DNA sequence, and a single arbitrary primer
will support DNA amplification from a genomic template if binding sites on opposite strands
of the template exist within a distance that can be traversed by the thermo stable equation
usually random oligonucleotides (or 10 bases) used as primer to amplify discrete fragments of
genomic DNA. The primers are generally of random sequence and contain at least 50% G and
C without internal inverted repeats. The products are easily separated by standard
electrophoretic technique and visualized under ultraviolet (UV) illumination of ethidium
bromide stained agarose gels. Polymorphism results from changes in either the sequence of
the primer-binding site (point mutation), which prevents stable association with the primer or
from changes, which alter the size or prevent amplification of target DNA (insertions,
deletions or inversions). RAPDs can rapidly be used to construct linkage maps. These
advantages have allowed mapping of a wide variety of plant genomes (Devos and Gale, 1992;
Waugh and Powell 1992; Tingey and Del Tufo, 1993). RAPD markers were also instrumental

Introduction
–––––––––––––––––––––––––– 16 –––––––––––––––––––––––––
for map-based cloning of disease-resistance genes (Jones et al., 1994; Mindrinos et al., 1994;
Whitham et al., 1994; Martin et al., 1991; Michelmore et al., 1991). However RAPD markers,
inherited usually in a dominant manner, are not transferable from one population to another
and are poorly reproducible between different laboratories (Penner et al., 1993; Jones, 1997).
Consequently, RAPD is largely being replaced by a more robust DNA fingerprinting
technique termed amplified fragment length polymorphism (AFLP).
• DNA amplification fingerprinting (DAF)
A modification of the RADP assay, named DNA amplification fingerprinting (DAF),
has been described by Caetano-Anoles et al. (1991). The difference from the other procedures
is that the PCR products are separated on polyacrylamide urea gels and visualized by silver
stain. In the DAF procedure primers as short as five nucleotides, produce complex band
patterns ideally suited for genome fingerprinting applications.
Denaturing polyacrylamide gradient gel-electrophoresis (DGGE) has been used to
resolve DNA sequence differences among fragments of similar or identical size (Fischer and
Lerman, 1983; Myers et al., 1987). Using the DGGE procedure, single base differences result
in altered migration of DNA fragments and thus produce polymorphic DNA fragments.
Because of this the DGGE procedure is considered to be highly suitable for self-pollinating
species.
• Sequence-tagged site (STS)
STS is a short, unique sequence that identified a specific locus and can be amplified by
PCR. A pair of PCR primers, which are designed by sequencing an RFLP probe representing
a mapped low-copy number sequence, characterizes each STS. Talbert et al. (1994) showed
that PCR could be used to detect polymorphism in wheat with primer sequences derived from
the α-amylase and γ-gladine genes. In another study in wheat, RFLP probe Xbcd1231, linked
with Pm4a locus was converted into an STS marker (Liu et al., 1998). Also, Roy et al. (1999)
found an STS marker, which showed a strong association with pre-harvest sprouting tolerance
in wheat. Conventionally, the term STS is used for the primers, which are designed on the
basis of mapped low-copy RFLP loci.
• Directed search (amplification of low copy DNA)
In general, cereals have a high level of repetitive DNA sequences (about 70% of the
DNA sequence in wheat are repetitive). Removal of repetitive DNA sequences before PCR

Introduction
–––––––––––––––––––––––––– 17 –––––––––––––––––––––––––
has been reported to produce polymorphic and reproducible DNA fragments (Eastwood et al.,
1994). Hydroxylapatite column chromatography is used to enrich low copy DNA sequences
(Clarke et al., 1992). Once the procedure is standardized, it could be useful to screen marker
linked to disease resistance and other traits.
• Sequence characterized amplified regions (SCARs)
Paran and Michelmore (1993) developed a dependable PCR - based technique called
sequence characterized amplified regions (SCARs). In this procedure, the polymorphic DNA
fragment is cloned and sequenced.
• Amplified fragment length polymorphisms (AFLPs)
AFLP is a PCR based DNA fingerprint technique (Vos et al., 1995; Zabeau and Vos,
1993). It involves restriction of genomic DNA followed by ligation of adaptors to restricted
fragments and preselective and selective PCR amplification of a subset of these fragments.
The amplified fragments are resolved on a sequencing gel and visualized either by
autoradiography or fluorescent sequencing equipment (Meksem et al., 1995; Zhang et al.,
1999; Schwarz et al., 1999; Huang et al., 2000b; Huang and Sun 1999; Hartl and Seefelder,
1998), depending on the method of labelling or silver staining (Cho et al., 1996). In contrast
to RAPD, AFLP is highly reproducible and also transferable between different populations
(Jones et al., 1997; Yin et al., 1999; Waugh et al., 1997; Li et al., 1998; Rouppe van der
Voort et al., 1997). One major limitation of AFLPs is the dominant nature and the difficulty
in identifying allelic variants at a specific locus although co-dominant AFLP markers have
been found, however, in frequencies of 4-15 % among all polymorphic AFLP markers
(Waugh et al., 1997; Lu et al., 1998; Boivin et al., 1999). AFLP is now the first option to
saturate a particular region of the genome when map-based cloning is applied to cloning
target genes. Above all, one major application of AFLP is for molecular genetic mapping. It
has been used to construct maps for barley (Becker et al., 1995; Waugh et al., 1997; Qi et al.,
1998), sugar beet (Schondelmaier et al., 1996), soybean (Keim et al., 1997), petunia (Gerats
et al., 1995), rice (Maheswaran et al., 1997), wheat (Lotti et al., 1998) and tomato (Haanstra
et al., 1999).
• Simple sequence repeats (SSRs) or microsatellite
DNA sequences with di-, tri-, tetra- or penta-nucleotide tandem repeats are described
either as microsatellites (Litt and Luty, 1989), as simple sequence repeats (SSRs; Hearne et
Introduction
–––––––––––––––––––––––––– 18 –––––––––––––––––––––––––
al., 1992) or as short tandem repeats (STRs; Edwards et al., 1991). The first report of
microsatellites in plants was made by Condit and Hubbell (1991). These markers appear to be
hypervariable, in addition to which their co-dominance and reproducibility make them ideal
for genome mapping, as well as for population genetic studies (Dayanandan et al., 1998).
Inter-SSRs are a variant of the RAPD technique, although the higher annealing temperatures
probably mean that they are more rigorous than RAPDs. They are present in the vast majority
of eukaryotic genomes. The total number of different dinucleotide blocks has been estimated
for several species (Ma et al., 1996; Wu and Tanksley, 1993; Morgante and Olivieri, 1993).
The number of sites ranged from 103 to 105 depending on the species and repeat motif.
Polymorphism produced by a variable number of tandem repeats has been demonstrated in a
large number of species. This feature has made microsatellites a very attractive molecular
marker for species with a narrow genetic base such as wheat and barley. This methodology is
based on the use of primers complementary to SSRs. Multilocus profiles have been generated
using different kinds of oligonucleotide containing simple sequence repeats as single primer
(Gupta et al., 1994; Nagaoka and Ogihara, 1997) or in combination with arbitrary sequence
oligonucleotides (Wu et al., 1994). These studies have shown the reproducibility of the
patterns generated the Mendelian inheritance of the polymorphic amplified bands and their
usefulness in the investigation of the genetic relationships. Mapping of this kind of markers
in barley (Becker and Heun, 1995) and rapeseed (Kresovich et al., 1995; Szewe-MeFadden et
al., 1996; Uzunova and Ecke, 1999; Plieske and Struss, 2001) have been conducted. In wheat,
Devos et al. (1995) searched sequence database and converted two microsatellite sequences
into PCR based markers. Röder et al. (1995), Ma et al. (1996) and Plaschke et al. (1995)
investigated the potential of microsatellite sequences as genetic markers in hexaploid wheat.
These markers were genome specific and displayed high levels of variation. More recently, a
detailed genetic map of 279 microsatellite loci (Röder et al., 1998), another map of 50 loci
(Stephenson et al., 1998), 65 loci for the D genome (Pestsova et al., 2000) and (Huang et al.,
2001) have been developed for bread wheat. The availability of extensive molecular maps of
wheat microsatellites will help in tagging genes of economic importance for marker assisted
selection. In wheat, microsatellite markers have been used to tag several genes or quantitative
trait loci (QTLs) (see section 1.3.5.2.).
1.3.1.3. Sequencing and DNA chip based markers
Single nucleotide polymorphisms (SNPs) are single base pair positions in genomic
DNA at which different sequence alternatives (alleles) exist in normal individuals in natural

Introduction
–––––––––––––––––––––––––– 19 –––––––––––––––––––––––––
populations (Brookes, 1999). Significant efforts towards large-scale characterization of SNPs
were first initiated in human genome research. SNPs have since been shown to be the most
common type of genetic variation in organisms. Of all the different types of sequence change
including single nucleotide substitutions, insertions/deletions and copy number variation in
nucleotide repeat motifs, SNP represents about 90 % of human DNA polymorphism (Collins
et al., 1998). SNPs have been found to occur with a frequency as high as 1 in every 202 bp in
the mouse genome and 1 in 1000 bp in the human genome (Lindblad-Toh et al., 2000; Wang
et al., 1998). There are various methods for SNP detection and scoring. More commonly used
are gel-based sequencing and high-density variation-detection DNA chips (Wang et al.,
1998). SNP has many advantages and great potential for many applications. Since SNPs exist
over the whole genome of organisms with a relatively high frequency, they could facilitate the
development of highly dense genetic function maps that would be highly valuable for genome
analysis. Moreover, as the sequence context of the SNPs is already known, it has the potential
for automation and can facilitate the genetic study of associating sequence variations with
heritable phenotypes on a large scale. Because of this, there has recently been considerable
interest in SNP discovery and detection for genome analysis of plant (Cho et al., 1999).
1.3.2. Comparison of different types of DNA markers
Several different types of DNA markers are currently available for genetic analysis
and new marker types are being developed continuously. Markers differ from each other in
many respects: the initial workload and costs for building up the marker system, running costs
and ease of use, level of polymorphisms, inheritance, number of loci analyzed per assay,
reproducibility and distribution on the chromosomes. Detection of polymorphism at the DNA
level is usually based either on restriction patterns or differential amplification of DNA. In
order to make a choice from a number of molecular markers that have now become available,
it is necessary to make a comparison between different types of molecular markers (RFLPs,
RAPDs, DAF, SSRs, AFLPs, etc.) described in this chapter. These markers have often been
compared for convenience, reproducibility, speed of assay, cost effectiveness and feasibility
of using automation and high throughput approaches (Table 2). The choice of the best marker
system depends on whether it will be used in evolutionary or population studies, genetic
mapping or fingerprinting. The ploidy level and reproductive system of the organism studied
are also important. However, using suitably designed experiments in several crops including
soybean, barley and wheat, these markers have also been compared for their relative
effectiveness and efficiency in detecting DNA polymorphism for a variety of purpose.
Introduction
–––––––––––––––––––––––––– 20 –––––––––––––––––––––––––
Table (2): A comparison of general features of different types of molecular markers and their use. Modified from Rafalski and Tingey (1993), Kalendar et al. (1999) and Ridout and Donini (1999). RFLP RAPD DAF SSRs AFLP SNPs Principle Endonuclease
restriction, Southern blotting
Hybridization
DNA amplification with random
primers
DNA amplification with random
primers
Amplification of simple sequence
repeats using specific primers
Endonuclease restriction Ligation of Adapters & Selective primers
Sequence analysis
Types of polymorphism detected
Single base changes
Insertions Deletions
Single base changes
Insertions Deletions
Single base changes
Insertions Deletions
Changes in number of
repeats
Single base changes
Insertions Deletions
Single base
changes
Genomic abundance
High Very high Very high Medium Very high Medium
Level of polymorphism
High
Medium High Very high High
High
Inheritance Co-dominant Dominant Dominant Co-dominant Dominant DominantNo. of loci detected
1-5 1-10 20-30 or more 1-3 100-150 1 biallelic
Quantity of DNA required
2-15 µg 10-50 ng 10-50 ng 50 ng 0.5-1.0 µg
Need for sequence information
No
No No Yes No Yes
Cost Medium Low Medium High initially High High Reproducibility High Low Low High High High Technical difficulty
Medium Low Medium Low Medium/ Low Medium/ high
Automation possible
- - - + + +
Use: 1. Varietal fingerprinting and genetic diversity
+ ++ ++ +++ +++ ++
2.Qualitative gene tagging
++ ++ - + +++ +
3. QTL mapping
++ -/+ - + ++ +
4. MAS ++ - - ++ +++ ++ 5.Comparative mapping
++ + - ++ ++ ++
The superiority of AFLP and SSR techniques was also demonstrated in several other
earlier studies (Linn et al., 1996; Janssen et al., 1996; Schwengel et al., 1994). As mentioned
above, the SSR markers have high information content (estimated as either the polymorphic
information content or as genetic diversity index or as expected heterozygosity) are locus

Introduction
–––––––––––––––––––––––––– 21 –––––––––––––––––––––––––
specific and co-dominant, thus making them the markers of choice for a variety of purposes
including practical plant breeding. However, if SSR markers are developed for the first time,
a very high cost of their development (due to cloning and sequencing) will restricted their use
in many laboratories. But if SSR primers have already been developed in a crop, the use of
SSR markers for this specific crop will be cost effective and can be used even in small
laboratories (e.g., in wheat, ~1000 primer pairs are available through the efforts of wheat
microsatellite and individual works). Polymorphic bands in RAPD and AFLP can also be
converted into locus specific SCARs, which will then prove to be as effective as SSR
markers.
1.3.3. Mapping populations
Mapping is putting markers (and genes or QTL) in order, indicating the relative
distances among them and assigning them to their linkage groups on the basis of their
recombination values from all pair wise combinations. Knowledge about the genetic concepts
of segregation and recombination is essential to the understanding of mapping. The
construction of a linkage map is a process that follows the segregation of molecular markers
in a segregating population and put them in linear order based on pair wise recombination
frequencies. Thus, a mapping population with high number of polymorphisms over the total
genome is highly desirable. Towards this end, various ways have been used to create mapping
populations, which are illustrated in Figure 1. Populations used for mapping are usually
derived from F1 hybrids between two lines (either homozygous or heterozygous), which show
allelic differences for selected probes. Genetic maps of plants are constructed based on
several different kinds of populations (Paterson, 2002), with each population structure having
unique strengths and weaknesses. Four types of population are commonly used for map
construction and mapping experiment, they are F2 population, back cross population (BC),
doubled haploid (DH) population, and recombinant inbred lines (RILs). Most genetic
mapping populations in plants have been derived from crosses between largely homozygous
parents.
1.3.3.1. F2 population
Such populations can be quickly developed and harbor all possible combinations of
parental alleles (Lander et al., 1987). However, each F2 individual has a different genotype
and no replication or experimental design can be employed to effectively control
environmental influence. To solve this problem, evaluation of F3 progenies derived from
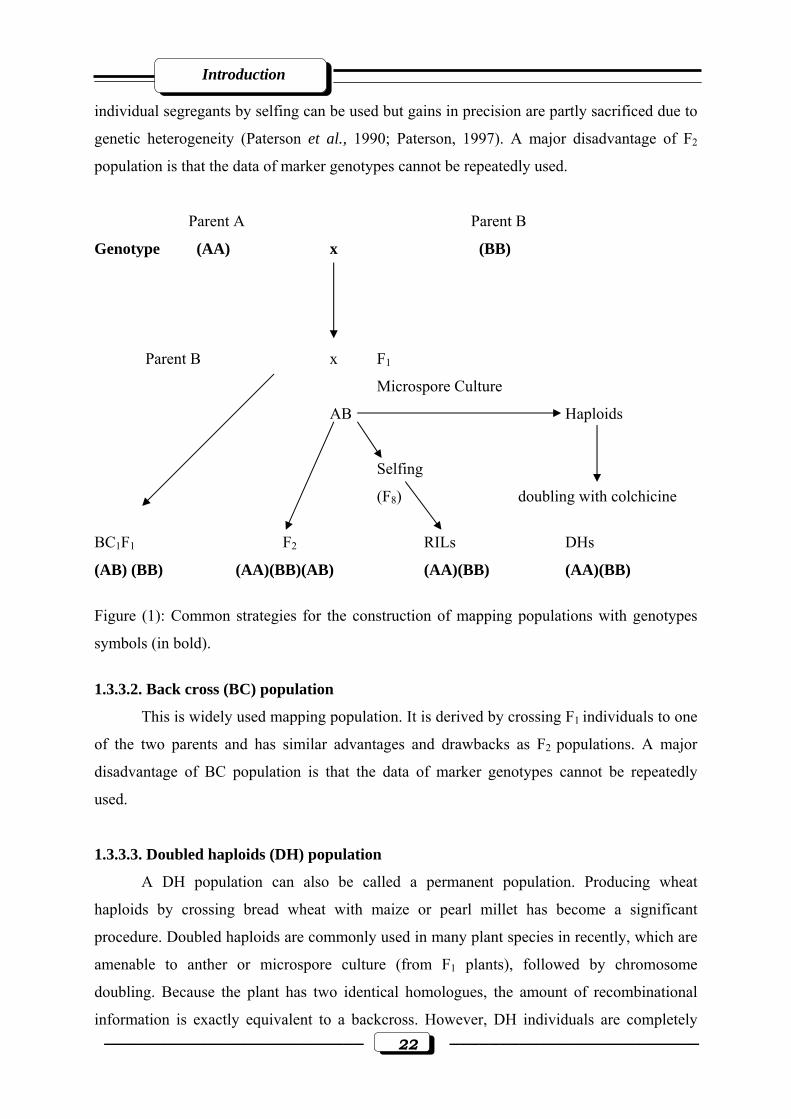
Introduction
–––––––––––––––––––––––––– 22 –––––––––––––––––––––––––
individual segregants by selfing can be used but gains in precision are partly sacrificed due to
genetic heterogeneity (Paterson et al., 1990; Paterson, 1997). A major disadvantage of F2
population is that the data of marker genotypes cannot be repeatedly used.
Parent A Parent B
Genotype (AA) x (BB)
Parent B x F1
Microspore Culture
AB Haploids
Selfing
(F8) doubling with colchicine
BC1F1 F2 RILs DHs
(AB) (BB) (AA)(BB)(AB) (AA)(BB) (AA)(BB)
Figure (1): Common strategies for the construction of mapping populations with genotypes
symbols (in bold).
1.3.3.2. Back cross (BC) population
This is widely used mapping population. It is derived by crossing F1 individuals to one
of the two parents and has similar advantages and drawbacks as F2 populations. A major
disadvantage of BC population is that the data of marker genotypes cannot be repeatedly
used.
1.3.3.3. Doubled haploids (DH) population
A DH population can also be called a permanent population. Producing wheat
haploids by crossing bread wheat with maize or pearl millet has become a significant
procedure. Doubled haploids are commonly used in many plant species in recently, which are
amenable to anther or microspore culture (from F1 plants), followed by chromosome
doubling. Because the plant has two identical homologues, the amount of recombinational
information is exactly equivalent to a backcross. However, DH individuals are completely
Introduction
–––––––––––––––––––––––––– 23 –––––––––––––––––––––––––
homozygous and can be self-pollinated to produce large numbers of progeny, which are all
genetically identical. This permits replicated testing of phenotypes and also facilitates
distribution of identical DH populations to many different researchers. A major disadvantage
of DH population is, it is not possible to estimate dominance effects and related types of
epistasis and the rates of pollens or microspores successfully turned into DH plants may vary
with genotypes, thus causing segregation distortion and false linkage between some marker
loci.
1.3.3.4. Recombinant inbred lines (RILs) or single seed descent (SSD) population
Homozygous or ‘permanent’ populations can also be made by traditional means i.e.,
by selfing or sib-mating individuals for many generations starting from F2 by the single seed
descent (SSD) approach until almost all of the segregating loci become homozygous. Each of
the loci having allelic difference in parents has two genotypes with equal frequencies.
However genetic distances based on RILs population are enlarged compared to those obtained
from F2, BC or DHs populations, because many generations of selfing or sib mating will
increase the chance of recombination. Also, the RILs populations have several advantages,
including reproduction, which favors the genetic analysis of quantitative traits because
experiments can be replicated over years and locations; and the use of dominant marker types
with the same efficiency as the co-dominant ones (Saliba-Colombi et al. 2000). A major
shortcoming of RILs populations is that development of RILs population takes long time and
it is not possible for all individuals to be homozygous at all segregating loci through limited
generations of selfing or sib mating, which decreases the efficiency for QTL mapping to some
extent. Also, replicated testing is possible like with DHs.
1.3.4. Mapping quantitative trait loci (QTLs)
1.3.4.1. Quantitative traits
Characters exhibiting continuous variation are termed quantitative traits. Quantitative
traits show continuous phenotypic variation in a population resulting from the combined
allelic effects of many genes and environmental conditions (Falconer and Mackay 1996). In
crop plants most traits of agricultural and economical significance exhibit quantitative
inheritance, such as yield, plant maturity, disease resistance and stress tolerance. The genetic
loci, which control quantitative traits, are referred to as QTL (quantitative trait loci). QTL
analysis has been a major area of genetically study for many decades. The earliest
documented experiments on linkage analysis between quantitative effects and marker
Introduction
–––––––––––––––––––––––––– 24 –––––––––––––––––––––––––
genotypes have been reported by Sax (1923) and Thoday (1961). However, for most of the
period up to 1980, the study of quantitative traits has largely involved biometrical approaches
based on means, variances, covariance of relatives and, consequently, very little was known
about the biological nature of quantitative or natural variation in terms of number and location
of the genes that underlie them (Fisher, 1918; Wright, 1934; Mather, 1949). It is only during
the past decade with the appearence of efficient molecular marker technologies and specific
statistical methods that it became possible to follow the segregation of quantitative traits via
linked markers (Tanksley, 1993) and to detect effects, numbers and map positions of QTL.
1.3.4.2. Methods of QTL mapping
The identification of QTL for economically important traits has been achieved
primarily by two approaches, either through linkage mapping to anonymous markers or
through association studies involving candidate genes.
1.3.4.2.1 QTL analysis through a molecular marker approach
The principle of QTL mapping is to associate the phenotypically evaluated trait(s)
with molecular markers using statistic tools. The map locations of QTL can then be estimated
by the means of highly associated markers. Typically, the detection and location of the loci
underlying quantitative trait variation involves three essential steps. First, a segregation
population is created and characterized with molecular markers. This usually leads to the
construction of a genome wide genetic map of the population. Second, the individuals of the
same population are phenotypically evaluated for the traits under investigation. Finally,
genotypic molecular markers are analyzed for association with the phenotypic trait data using
appropriate statistical methods. This type of QTL analysis can lead to the elucidation of QTL
parameters in terms of number, position, effects and interactions between them. Association
of morphological markers with quantitative traits in plants was observed early on (Sax, 1923;
Everson and Schaller, 1955) and the first steps towards mapping of QTLs or polygenes were
taken based on the scarce markers available (Thoday, 1961). Currently, complete genetical
maps exist for many crop species and algorithms have been developed for QTL mapping in a
wide range of pedigrees (Paterson, 1995). The simplest methods were based on single marker
analysis, where the differences between the phenotypic means of the marker classes are
compared using F-statistics, linear regression or nonparametric tests (Sax, 1923, Edwards et
al., 1987; Soller et al., 1976). The computer program Mapmaker (Lander et al., 1987) has
been used extensively for performing interval mapping in plant studies. Interval mapping,
Introduction
–––––––––––––––––––––––––– 25 –––––––––––––––––––––––––
now called simple interval mapping (SIM), searches for a single target QTL throughout a
mapped genome.
1.3.4.2.2. QTL analysis through a candidate gene approach
The candidate-gene approach is a powerful and robust method. Compared to the
genome wide mapping strategy, the chances of finding markers linked to putative QTL are
maximized, since the selection of candidate gene markers is based on known relationships
between biochemistry, physiology and the agronomic character under study. This approach
has been applied successfully in various QTL analyses, such as mapping QTL for defense
response to diseases in wheat (Faris et al., 1999; Pflieger et al., 1999), for resistance to corn
earworm in maize (Byrne et al. 1996, 1998) and early growth traits in maize (Causse et al.,
1995).
1.3.4.3. Conclusions from QTL mapping experiments for abiotic stress
In the traditional models of quantitative genetics simplifying assumptions were made
about equality and strict additivity of gene effects (Falconer and Mackay, 1996). From the
results of the QTL mapping experiments it has become clear that such assumptions are
incorrect. In many mapping experiments, a relatively small number of QTLs accounts for
very large portions of phenotypic variance, with increasing numbers of genes accounting for
progressively smaller portions of variance, until the significance threshold is reached
(Paterson, 1995). The number of QTLs located for particular traits in individual studies varies
from one to sixteen, usually being below five (Kearsey and Farquhar, 1998). The proportion
of phenotypic variation explained by each QTL and all QTLs together depends on heritability
of the trait as well as on the portion of revealed QTLs. QTLs are usually spread over all
chromosomes, but clusters of QTLs in certain chromosomal regions have been observed as
well. Differences occur in QTL incidence when quantitative traits are scored in many
environments or during many years. However, comparative studies between related species
have revealed conservation not only in marker order but also in locations of some QTLs (Lin
et al., 1995). Examples of QTL studies for different traits in various mapping crosses of
different plants for stress tolerance are shown in Appendix Table 1.
Introduction
–––––––––––––––––––––––––– 26 –––––––––––––––––––––––––
1.3.5. Applications of molecular markers
The invention of molecular marker technology such as RFLP, RAPD, AFLP, and SSR
as outlined in the previous sections has opened up a new era for genetic analysis of plant
genomes. Genetic mapping using molecular marker technology is of great significance to
plant breeding, plant genetics and evolutionary studies. The most common applications of
genetic linkage maps are concentrated on the following areas. First, genetic linkage maps can
be used for marker-assisted selection (MAS) in plant breeding. They could help to identify
DNA markers linked to single genes of major agronomic importance and the tightly linked
DNA markers can be used as diagnostic tools for MAS. This is particularly suitable and
powerful for screening for monogenic disease resistance. One of the successful examples is
MAS for soybean cyst nematode resistance (SCN) (Cregan et al., 1999). The SSR marker
Satt309, which is located 1-2 cM away from the gene rhg1 for resistance to SCN, has been
developed and used for tagging and tracking the gene through breeding programs, leading to
the development of resistant lines. The use of SSR markers has largely decreased the time and
effort involved as compared to phenotypic selection. Second, genetic linkage maps can be
used for the genetic analysis of quantitative traits. With the construction of molecular linkage
maps, characterization of quantitative traits has been greatly facilitated in identifying the
genomic regions responsible for the traits and estimating the possible number of genetic
factors controlling the traits of interest (Tanksley, 1993). Third, genetic linkage mapping can
be used to correlate the phenotypic traits with the genes controlling the trait, which includes
map-based cloning of a gene of known heritable phenotype and postulating candidate genes
for a trait with known biochemical basis. Finally, genetic linkage maps provide insights into
chromosomal organization and could be useful in map-based evolutionary studies by
comparative mapping.
1.3.5.1. Linkage maps
Construction of a genetic linkage map is based on observed recombination between
marker loci in the experimental cross. Segregating families, e.g. F2 population or BC
progenies, DHs population or RILs lines are commonly used. In barley the use of doubled
haploid progenies produced from the F1 generation simplifies genetic analysis. Doubled
haploid lines have undergone only one meiotic cycle and carry a completely homozygous
chromosome set. This means that the genetic information per plant is constant irrespective of
the marker system used (Graner et al., 1996). Genetic map distances are based on recombination
fractions between loci. The Haldane (1919) or Kosambi (1944) mapping functions are
Introduction
–––––––––––––––––––––––––– 27 –––––––––––––––––––––––––
commonly used for converting the recombination fractions to map units or centiMorgans
(cM). The Haldane mapping function takes into account the occurrence of multiple crossovers
but the Kosambi mapping function accounts also for interference, which is the phenomenon
of one crossing-over inhibiting the formation of another in its neighborhood (Ott, 1985).
Computer programs performing full multipoint linkage analysis include Mapmaker (Lander et
al., 1987) and JoinMap (Stam, 1993). Linkage map of human genome based on segregation
analysis of 814 (CA)n microsatellite loci was initially constructed (Weissenbach et al., 1992).
However in plants, mapping with STMS markers did not reach this level of resolution so far
(Weising et al., 1998), although the very first attempt to map sequence-tagged microsatellite
sites (STMS) loci in any species, was made as early as 1992, in rice using (GGC)n
microsatellites (Zhao and Kochert, 1992; 1993). Several barley maps based on SSRs (Liu et
al., 1996) and randomly amplified SSRs (Dávila et al., 1999) have been developed. Mapping
of the whole genome using microsatellite loci are also currently in progress in many crops i.e.
Brassica (Moule et al., 2000), soybean (Csanádi et al., 2001) and maize (Sharopova et al.,
2000). Microsatellite loci, other than STMS markers, have also been used for mapping in
different plant species. In bread wheat, two microsatellite maps, one with 279 loci (Röder et
al., 1998) and another with 50 loci (Stephenson et al., 1998) have been prepared. Also in
tetraploid wheat, 14 microsatellite loci were mapped on chromosomes 5A and 5B, which
carry genes for protein content, vernalization response and resistance to Hessian fly. Utilizing
International Triticeae Mapping Initiative (ITMI) population, an integrated map of wheat
genome (with 1200 RFLP earlier mapped; Leroy, 1997a, b) became available, to which 279
gwm microsatellite loci were added (Röder et al., 1998). Later, Gene and Genome Mapping
Group, Institut für Pflanzengenetik und Kulturpflanzenforschung (IPK), Gatersleben,
Germany has successfully assigned a set of another 70 microsatellite loci to specific
chromosomes using nulli-tetrasomic lines (Röder et al., 1999). Additional microsatellite loci
have been mapped by Leroy (2000). Comparative mapping within the Poaceae family has
also revealed high levels of conservation of gene order (Devos and Gale, 1997).
1.3.5.2. Mapping qualitative traits for marker assisted selection (MAS)
Qualitative genes are inherited in a Mendelian fashion and their allelic forms give
qualitatively distinct phenotypes. The phenotypes in a segregating progeny can be scored in a
similar fashion as molecular markers. A normal segregation analysis will reveal linkages to
any of the markers. Mapping a gene to a certain location on the chromosomes demands a
linkage map of the whole genome, but genes can also be tagged with molecular markers
Introduction
–––––––––––––––––––––––––– 28 –––––––––––––––––––––––––
without any previous information of the map location of markers used. Two approaches have
been proposed for this purpose, i.e., use of near-isogenic lines, NILs (Martin et al., 1991;
Muehlbauer et al., 1988) and pooled DNA samples (Michelmore et al., 1991). NILs differ
only by the presence or absence of the target gene and a small region of flanking DNA.
Hundreds of arbitrarily primed PCR-based markers can easily be screened to identify
differences between isogenic lines and these differences are likely to be linked to the target
gene. The NILs have been used in barley to tag a powdery mildew resistance gene (Hinze et
al., 1991) and a spot blotch resistance gene (Hakim, 1996). In bulked segregant analysis
(BSA), DNA pools of individuals of a crossing progeny are made based on their phenotype
and screened for differences in the molecular markers (Michelmore et al., 1991). BSA has
successfully been used in barley for tagging several disease resistance genes with RAPD
markers locating 1.6-12 cM from the target locus (Weyen et al., 1996; Borovkova et al.,
1997; Poulsen et al., 1995; Barua et al., 1993). Also, BSA has been proposed for tagging
quantitative loci with a major effect: theoretically QTL alleles with phenotypic effects of
0.75-1.0 standard deviations should be detectable in DH populations of 100-200 lines (Wang
and Paterson, 1994).
The first example of a gene linked to a microsatellite (AT) was a soybean mosaic virus
resistance gene (Rsv) (Yu et al., 1994; 1996). Several other resistance genes including those
for resistance to peanut mottle virus (Rpv), Phytophthora (Rps3) and Javanese root knot
nematode, were found to be clustered in the same region of soybean genome where this (AT)n
microsatellite was found to be associated with Rsv. Microsatellite markers, associated with
soybean cyst nematode (SCN) resistance locus, sclerotinia stem rot resistance and brown stem
rot resistance, were also reported by (Mudge et al., 1997; Moreiral et al., 1999). In wheat,
microsatellite markers have been applied widely for tagging genes or QTLs determining
dwarfing (Korzun et al., 1997, Korzun et al., 1998, Worland et al., 1998b), vernalization
response (Korzun et al., 1997; Tóth et al., 2003), disease resistance (Fahima et al., 1997;
1998; Peng et al., 1999; Börner et al., 2000b; Huang et al., 2000a; del Blanco et al., 2003;
Shen et al., 2003; Schnurbusch et al., 2003; 2004 ; Huang et al., 2003b), flour colour and
milling yield (Garry et al., 1997), grain protein content (Prasad et al., 1999; 2003), pre-
harvest sprouting tolerance (Roy et al., 1999), grain yield and its components (Varshney et
al., 2000; Huang et al., 2003a) and frost (Tóth et al., 2003). In durum wheat, some
microsatellites have been mapped in two regions of chromosome 5A each carrying a QTL, for
high grain protein content and for heading (Korzun et al., 1999).

Introduction
–––––––––––––––––––––––––– 29 –––––––––––––––––––––––––
1.3.5.3. Fingerprinting and variety identification
The ability to discriminate between and identify varieties of agricultural crops is
central to the operation of seed trade. Plant breeder’s rights offer protection for varieties, but
in turn require that new varieties are Distinct from others, Uniform and Stable in their
characteristics (the so called D, U and S criteria) (Cooke, 1995). Varietal identification and
purity are also important for consumers, and especially for industry, which uses the harvested
yield for large-scale processing. DNA markers have been introduced as a promising method
of fingerprinting different crop varieties. For example, DNA fingerprints of 65 registered six-
rowed barley varieties in Canada have been generated using RAPD markers. All varieties
could be identified from each other based on 18 polymorphic bands (Baum et al. 1998).
AFLP and RAPD markers have also been successfully used for barley malt fingerprinting
(Faccioli et al. 1999). Using a number of SSRs, oligonuclotide fingerprinting has been
successfully utilized in a variety of crops (Weising et al., 1995). In a study involving 105
hexaploid wheat varieties from Argentina, closely related wheat varieties having high
similarity co-efficients, could be discriminated using selected microsatellites, located on
different chromosomes (Manifesto et al., 1999).
1.3.5.4. Genetic diversity studies
DNA polymorphisms can also be used to explore issues of genetic diversity.
Knowledge of genetic diversity and the genetic relationship between genotypes is an
important consideration for efficient rationalization and utilization of germplasm resources.
Information on genetic diversity is also needed for the optimal design of plant breeding
programmes, influencing the choice of genotypes to cross for the development of new
populations. Molecular approaches have been used to group barley cultivars into
morphologically distinct groups and further into subgroups that have a similar genetic
background. RFLPs (Melchinger et al. 1994, Graner et al., 1994, Casas et al., 1998), RAPDs
(Dweikat et al., 1993; Tinker et al., 1993), AFLPs (Schut et al., 1997; Ellis et al., 1997) and
SSRs (Dávila et al., 1999; Russell et al., 1997) have been used for assessing variation in local
and global collections of barley germplasm. Microsatellites have been considered to be the
markers of choice for assessment of genetic diversity among cultivars and their wild relatives
(Karp et al., 1998; Doldi et al., 1997). Using set of 12 microsatellite markers, Prasad et al.
(2000) studied the genetic diversity of 55 elite genotypes. In bread wheat, 42 microsatellite
markers clearly distinguished varieties in three different agro-ecological areas namely
Hungary, Austria and Germany (Lelley and Stachel, 1998). The usefulness of these markers
Introduction
–––––––––––––––––––––––––– 30 –––––––––––––––––––––––––
for estimation of genetic relatedness has been demonstrated in many crops including maize
(Taramino and Tingey, 1996), barley (Russell et al., 1997), wheat (Plaschke et al., 1995;
Donini et al., 1998; Lelley et al., 2000; Stachel et al., 2000; Pestsova et al., 2000; Hammer et
al., 2000; Prasad et al., 2000; Stachel et al., 2000; Ben Amer et al., 2001; Fahima et al.; 2002;
Huang et al., 2002), rice (Wu and Tanksley, 1993; Ahn et al., 2000), sorghum (Brown et al.,
1996), sunflower (Paniego et al., 1999), Aegilops tauschii (Lelley et al., 2000) and potato
(Provan et al., 1996).
1.3.5.5. Genetic fidelity and germplasm characterization
Microsatellite markers have been utilized to find out wether or not the germplasm
accessions maintain their genetic fidelity during storage and conservation (i.e. detect
duplications, seed mixtures and inadvertent out crossing). One should realize that the failure
to detect polymorphism might not indicate genetic fidelity, although reproducibility of
polymorphism between the two taxa after storage may suggest some degree of genetic fidelity
(Gupta and Varshney, 1999; Börner et al., 2000a; Chebotar et al., 2003). The microsatellite
have been used to characterize and conserve the germplasm in many plant species i.e. soybean
(Rongwen et al., 1995), rapeseed (Poulsen et al., 1993) and Phaseolus (Hamann et al., 1995).
1.4. Outline of the thesis
Molecular markers are powerful tools that have been used for marker-assisted
selection and as landmarks for map-based cloning of genes. Molecular markers associated
with QTLs have been reported for many important traits. After a linkage between a QTL and
molecular marker has been determined, the QTL can be transferred into any genetic
background by marker-assisted selection. Therefore, the objectives of the present study are:
1. To define genotypes with high stem reserve mobilization ability.
2. To characterize the expression and inheritance of traits associated with post-anthesis
drought tolerance and grain development.
3. To determine of the number, chromosome position and effects of the QTLs conditioning
drought tolerance.
4. To identify SSR and RFLP markers associated with the QTLs for drought tolerance.
5. To explore the potential of marker-assisted selection in improving wheat drought tolerance.
Materials & Methods
–––––––––––––––––––––––––– 31 –––––––––––––––––––––––––
2. MATERIALS AND METHODS
2.1. Genetic materials
2.1.1. Screening plant materials 77 wheat genotypes from Genebank department, Institut für Pflanzengenetik und
Kulturpflanzenforschung (IPK), Gatersleben, Germany and Agriculture Research Center
(ARC), Giza, Egypt were used to establish the experimental materials for this investigation
(Appendix Table 3). The genotypes used in the study differ from each other in morphological
as well as phenological characters. They had been originated in different regions.
2.1.2. Developing of F2:3 mapping population
The post-anthesis drought tolerance (PADT) mapping population consisting of 81 F3
families was developed from an interspecific cross between the spring wheat accession ‘ATRI
5283’ as a male parent (Triticum durum L.) and ‘ATRI 15010’ as a female parent (Triticum
aestivum L.). These two genotypes were chosen according to their behavior to the post-
anthesis drought stress. The percentage and degrees of tolerance of these genotypes are listed
in Appendix Table 3. ‘ATRI 5283’ is a post-anthesis drought tolerant parent. On the other
hand, the ‘ATRI 15010’ was post-anthesis drought sensitive.
2.1.3. Recombinant inbred lines (RILs)
A set of 114 recombinant inbred lines (RILs) from the International Triticeae Mapping
Initiative (ITMI) population was also used for mapping of genes/QTLs for post-anthesis
drought tolerance. This population was derived by single seed descent F8 from the cross of ‘W
7984’ x ‘Opata 85’. The parent ‘W 7984’ was an amphihexaploid wheat synthesized from
Triticum tauschii (DD) and Triticum durum (AABB) variety ‘Alter 84’, while ‘Opata 85’ was
a Mexican wheat variety developed at CIMMYT (Centro Internacional de Mejoramiento de
Maizy Trigo). The development of these RILs was described by Börner et al. (2002b).
2.2. Drought experiments
2.2.1. Field experiments
2.2.1.1. Screening plant materials
This investigation was carried out at Gatersleben, during the wheat growing season
2001/2002. The experiments were arranged in a randomized complete block design with two
replicates. Each replicate consisted of one plot per genotype with four rows, 1 m long, with 20
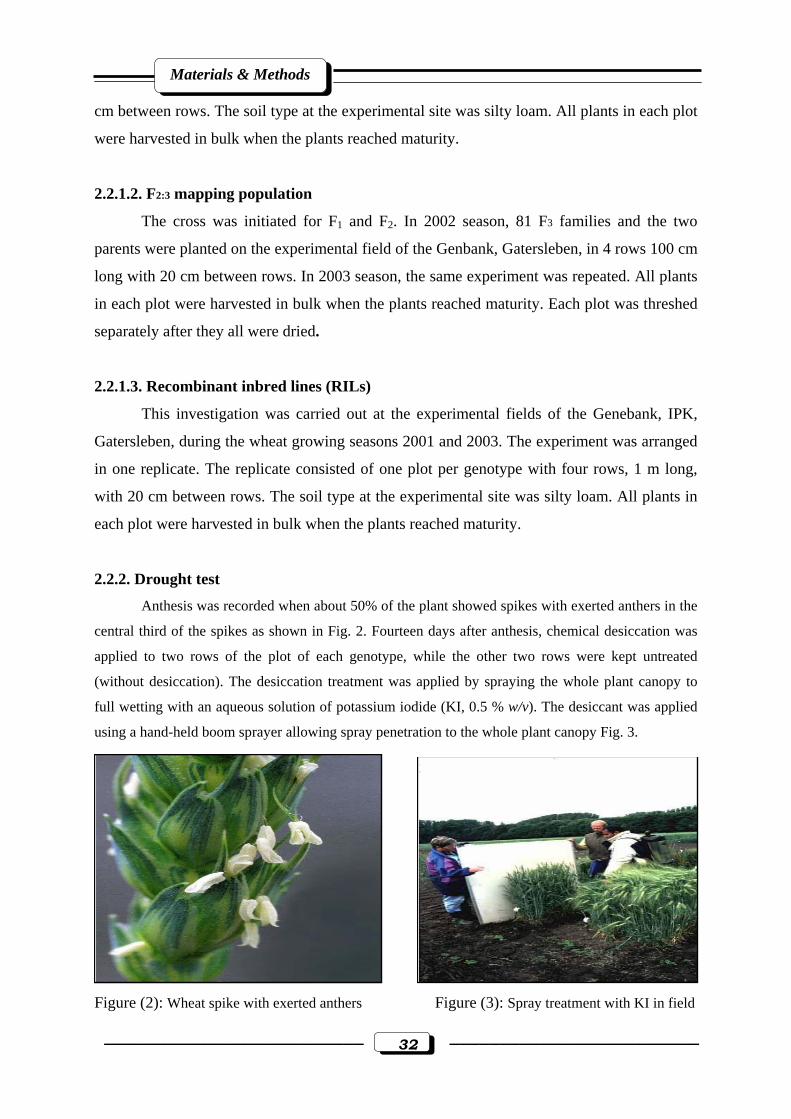
Materials & Methods
–––––––––––––––––––––––––– 32 –––––––––––––––––––––––––
cm between rows. The soil type at the experimental site was silty loam. All plants in each plot
were harvested in bulk when the plants reached maturity.
2.2.1.2. F2:3 mapping population
The cross was initiated for F1 and F2. In 2002 season, 81 F3 families and the two
parents were planted on the experimental field of the Genbank, Gatersleben, in 4 rows 100 cm
long with 20 cm between rows. In 2003 season, the same experiment was repeated. All plants
in each plot were harvested in bulk when the plants reached maturity. Each plot was threshed
separately after they all were dried.
2.2.1.3. Recombinant inbred lines (RILs)
This investigation was carried out at the experimental fields of the Genebank, IPK,
Gatersleben, during the wheat growing seasons 2001 and 2003. The experiment was arranged
in one replicate. The replicate consisted of one plot per genotype with four rows, 1 m long,
with 20 cm between rows. The soil type at the experimental site was silty loam. All plants in
each plot were harvested in bulk when the plants reached maturity.
2.2.2. Drought test
Anthesis was recorded when about 50% of the plant showed spikes with exerted anthers in the
central third of the spikes as shown in Fig. 2. Fourteen days after anthesis, chemical desiccation was
applied to two rows of the plot of each genotype, while the other two rows were kept untreated
(without desiccation). The desiccation treatment was applied by spraying the whole plant canopy to
full wetting with an aqueous solution of potassium iodide (KI, 0.5 % w/v). The desiccant was applied
using a hand-held boom sprayer allowing spray penetration to the whole plant canopy Fig. 3.
Figure (2): Wheat spike with exerted anthers Figure (3): Spray treatment with KI in field
Materials & Methods
–––––––––––––––––––––––––– 33 –––––––––––––––––––––––––
2.2.3. Drought scoring At maturity, the spikes were collected and threshed on a plot basis. After harvest,
1000-grain weight was estimated for treated and non-treated rows. In the final testing, the
post-anthesis drought tolerance index of a pre-specified seed bulk was estimated from the
performance of the stressed rows (S) relative to its respective non-stressed control rows (C)
within the same replicate and calculated as percent according to Blum et al. (1983a, b):
Calculation of stress tolerance index (STI) % = [(S/ C) x 100], where C = 1000-grain weight
under control and S = 1000-grain weight under potassium iodide (KI) treatment. 2.2.4. Evaluation of phenotypic traits
Plants were selected at random for subsequent measurements as follows
2.2.4.1. Vegetative traits
2.2.4.1.1. Flowering time (days)
It was determined as the number of days from date of sowing to the date of the first
anthers exertion of 50% of the ears of each genotype.
2.2.4.1.2. Plant height (cm)
Length of the main culm (in centimeters) was measured from the soil surface to the tip
of the main ear at maturity, excluding awns.
2.2.4.2. 1000-grain weight (g)
It was recorded as the weight of 1000 random wheat grain.
2.2.4.3. Grain characters
A separate preliminary experiment was conducted to determine the grain sample size.
Five Digital Image Analysis (DIA) parameters were measured and compared among samples
of kernels of genotypes grown under treated and non-treated rows. A method similar to that
described by Symons and Fulcher (1988) was used for DIA. The captured image was
displayed as a digitized grey level image on a computer monitor. Calibration was in mm. The
initial image was subjected to normalization. The discriminated grains were automatically
identified and measured for: Grain area (mm²), Grain width (mm), Grain length (mm), Grain
circumference (mm) and Grain Roundness. Also, Grain form density factor was estimated.
Grain form density factor, defined as grain weight/grain area (g/mm2), could be considered as
a grain quality character. Based on the measurements of grains originated from the treated and
non-treated samples, STI was calculated (see section 2.2.3.).
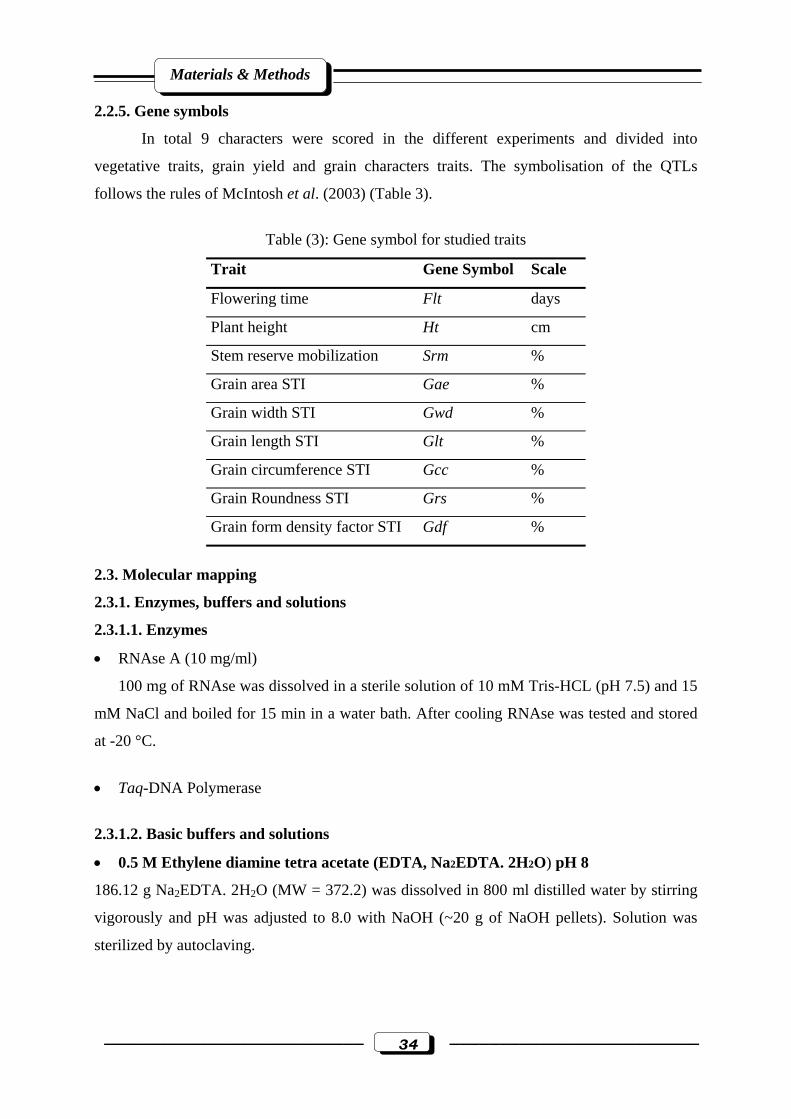
Materials & Methods
–––––––––––––––––––––––––– 34 –––––––––––––––––––––––––
2.2.5. Gene symbols
In total 9 characters were scored in the different experiments and divided into
vegetative traits, grain yield and grain characters traits. The symbolisation of the QTLs
follows the rules of McIntosh et al. (2003) (Table 3).
Table (3): Gene symbol for studied traits
Trait Gene Symbol Scale
Flowering time Flt days
Plant height Ht cm
Stem reserve mobilization Srm %
Grain area STI Gae %
Grain width STI Gwd %
Grain length STI Glt %
Grain circumference STI Gcc %
Grain Roundness STI Grs %
Grain form density factor STI Gdf %
2.3. Molecular mapping
2.3.1. Enzymes, buffers and solutions
2.3.1.1. Enzymes
• RNAse A (10 mg/ml)
100 mg of RNAse was dissolved in a sterile solution of 10 mM Tris-HCL (pH 7.5) and 15
mM NaCl and boiled for 15 min in a water bath. After cooling RNAse was tested and stored
at -20 °C.
• Taq-DNA Polymerase
2.3.1.2. Basic buffers and solutions
• 0.5 M Ethylene diamine tetra acetate (EDTA, Na2EDTA. 2H2O) pH 8 186.12 g Na2EDTA. 2H2O (MW = 372.2) was dissolved in 800 ml distilled water by stirring
vigorously and pH was adjusted to 8.0 with NaOH (~20 g of NaOH pellets). Solution was
sterilized by autoclaving.

Materials & Methods
–––––––––––––––––––––––––– 35 –––––––––––––––––––––––––
• (24:1, v/v) Chloroform: Iso-amyl alcohol (CHCl3: IAA)
40 ml iso-amyl alcohol was added to 960 ml chloroform. Store the mixture at 4°C in dark
glass bottles.
• Ethidium bromide (Et Br, 10 mg/ml) Stock
1g ethidium bromide was added to 100 ml of H2O and stirred vigorously on a magnetic
stirrer for several hours to ensure that the dye has dissolved. The container was wrapped in
aluminium foil and stored at 4°C.
• 3 M Sodium acetate (NaOAc) pH 5.2
408.1 g of sodium acetate was dissolved in 800 ml of distilled water; pH was adjusted to
5.2 with glacial acetic acid and sterilized by autoclaving.
• 5 M Sodium chloride (NaCl)
292.2 g of NaCl (MW = 58.44) was dissolved in 800 ml of distilled water (dH2O) and
volume adjusted to 1000 ml and solution was sterilized by autoclaving.
• (20 %, w/v) Sodium dodecyl sulphate (SDS)
20 g of lauryl dodecyl sulphate sodium salt (SDS) was dissolved in 100 ml of distilled
water by heating at 70 °C and pH was adjusted to 7.2 by adding a few drops of concentrated
HCl.
• 1 M Tris-HCl pH 8
121.1 g of Tris base was dissolved in 800 ml of distilled water and the pH to desired value
(pH 8) was adjusted by adding concentrated HCl. The volume was made up to 1L and
sterilized by autoclaving.
• Tris-EDTA (TE) buffer
(1,2114 g) of 1M Tris-HCl pH 8.0 and (0,37224 g) of 0.5M Na2 EDTA pH 8.0 was added
to 900 ml of distilled water (dH2O). The volume was made up to 1L and sterilized by
autoclaving.

Materials & Methods
–––––––––––––––––––––––––– 36 –––––––––––––––––––––––––
• (50 X) Tris-acetate-EDTA (TAE)
242 g Tris, 57.1 ml glacial acetic acid and 37.2 g Na2EDTA. 2H2O was added to 900 ml
of distilled water (dH2O), pH was adjusted to 8. The volume was made up to 1L.
• (10 X) Tris-Borate-EDTA (TBE) buffer
(108.0 g) of 0.89M Tris, (55.0 g) of 0.89M boric acid and (8.3 g) of 20mM EDTA was
added to 900 ml of distilled water (dH2O). The volume was made up to 1L.
• 10 mM dNTPs
Equal amounts of 10mM dATP, 10mM dCTP, 10mM dGTP and 10 mMdTTP was mixed.
Store in 10 µl aliquots at -20 °C.
• (10 X) PCR buffer
1 ml of 1M Tris-HCl pH 8.0, 5 ml of 1M KCl, 150 µl of 1M MgCl2 and 10 mg of gelatin
(Sigma G-2500) was added to 3.85 ml of distilled water (dH2O). The volume was made up to
10 ml and sterilized by autoclaving.
2.3.2. Solution for DNA isolation
Mix from 100 ml of 5M NaCl, 100 ml of 1M Tris-HCl pH 8.0, 100 ml of 0.5M EDTA pH
8.0 and 62.5 ml of 20% SDS was added to 500 ml of distilled water (dH2O). The volume was
made up to 1L and sterilized by autoclaving.
• 75% EtOH
Absolute EtOH was diluted to 75% with distilled water (dH2O).
2.3.3. Genomic DNA isolation
2.3.3.1. Plant growing and leave material preparation
Young leaves from eight-weeks-old F2 plants were cut as tissue samples for DNA
extraction from the greenhouse. An equal amount of tissue was taken from each single plant.
Only one replication was sampled for DNA extraction. The tissues were transported the same
day to the laboratory on liquid nitrogen and stored at –80 °C.
Materials & Methods
–––––––––––––––––––––––––– 37 –––––––––––––––––––––––––
2.3.3.2. Genomic DNA extraction for mapping
Total genomic DNA was isolated according to the protocol described previously by
Anderson et al. (1992). Briefly, 3-5 g of leaf tissue per sample (each sample was collected
from each F2 seedling 8 weeks after sowing, 81 plants in total) were ground in liquid nitrogen
and incubated at 60 °C for 45 min with 15 ml of extraction buffer, (100 mM Tris-HCl, 500 M
NaCl, 50 mM EDTA, 1.25 % SDS) in 50 ml polypropylene tubes. After cell disruption and
incubation with hot isolation buffer, proteins were removed by chloroform: iso-amyl alcohol
(24:1, v:v). Samples were incubated for 30 min by shaking and then centrifuged at 3000 rpm
for 30 min. The aqueous layer was transferred to a new tube and 20 µl RNAse A (10 mg/ml)
was added. Samples were incubated for 30 min at room temperature. One volume of cold
ethanol was added to precipitate DNA. After 30 min incubation at 4 °C, precipitated DNA
was hooked out and placed in a 2 ml reaction tube containing 1 ml of 75% ethanol. After
washing twice with 75% ethanol, the washing solution was removed and the DNA pellet was
dried thoroughly and dissolved in TE buffer. The DNA samples were diluted and stored at -20
°C. The DNA was diluted to a concentration of 50 ng/µl before used in SSR experiment.
2.3.3.3. Concentration measurement of DNA
This step is essential for checking that the isolated DNA is of high molecular weight.
For that, uncut DNA was run on 1% agarose gel. The quality and quantity of DNA were
measured by comparison of band-intensity on ethidium bromide stained agarose gels with a
DNA molecular weight standard.
2.3.4. Simple sequence repeats (SSRs) or microsatellite analysis
Wheat microsatellite (WMS) primer pairs were developed by Röder et al. (1995;
1998; unpublished results). One primer of each WMS pair was labelled by florescent agent.
The primer taglgap was described by Devos et al. (1995). All Gatersleben Wheat
Microsatellite (gwm) used were di-nucleotide repeats (Appendix Table 2), whereas taglgap
has a tri-nucleotide motif.
2.3.4.1. Polymerase chain reaction analysis (PCR)
SSR procedures were as described by Röder et al. (1995; 1998) and Devos et al.
(1995), respectively. Briefly, each polymerase chain reaction (PCR) was performed in a
volume of 25 µl in Perkin-Elmer (Norwalk, Ct.) thermocycles. The reaction mixture
contained the following:
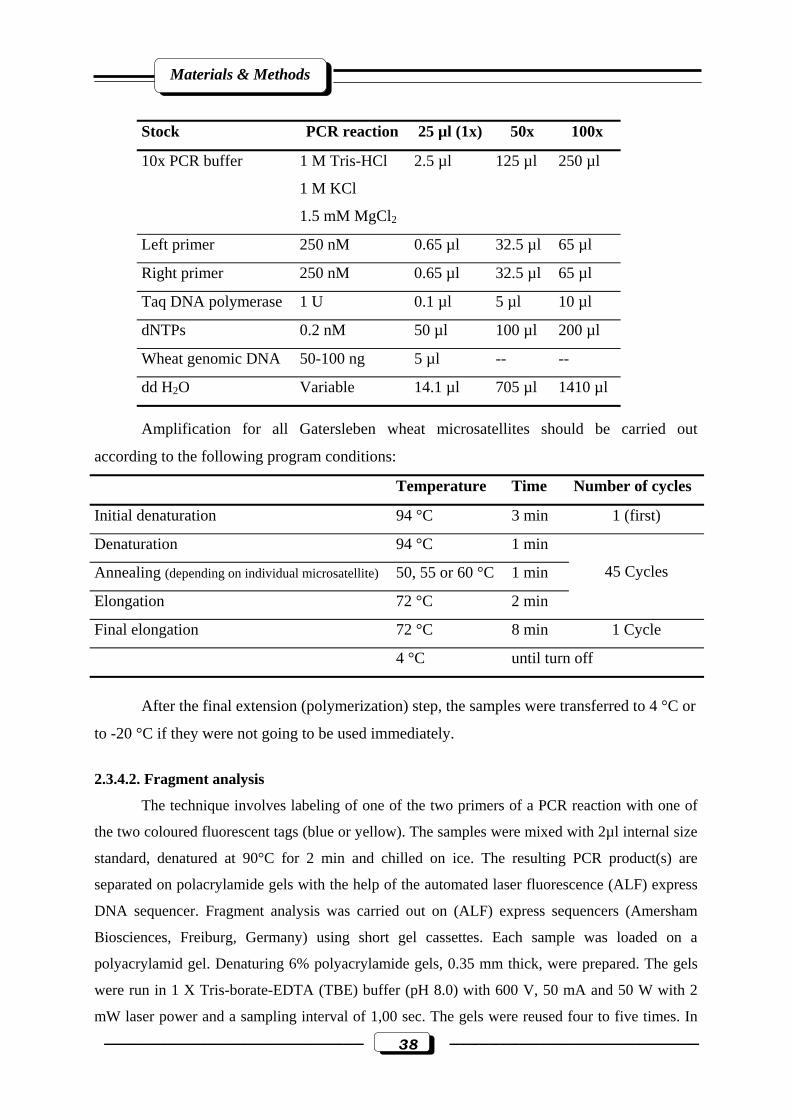
Materials & Methods
–––––––––––––––––––––––––– 38 –––––––––––––––––––––––––
Stock PCR reaction 25 µl (1x) 50x 100x
10x PCR buffer 1 M Tris-HCl
1 M KCl
1.5 mM MgCl2
2.5 µl 125 µl 250 µl
Left primer 250 nM 0.65 µl 32.5 µl 65 µl
Right primer 250 nM 0.65 µl 32.5 µl 65 µl
Taq DNA polymerase 1 U 0.1 µl 5 µl 10 µl
dNTPs 0.2 nM 50 µl 100 µl 200 µl
Wheat genomic DNA 50-100 ng 5 µl -- --
dd H2O Variable 14.1 µl 705 µl 1410 µl
Amplification for all Gatersleben wheat microsatellites should be carried out
according to the following program conditions:
Temperature Time Number of cycles
Initial denaturation 94 °C 3 min 1 (first)
Denaturation 94 °C 1 min
Annealing (depending on individual microsatellite) 50, 55 or 60 °C 1 min
Elongation 72 °C 2 min
45 Cycles
Final elongation 72 °C 8 min 1 Cycle
4 °C until turn off
After the final extension (polymerization) step, the samples were transferred to 4 °C or
to -20 °C if they were not going to be used immediately.
2.3.4.2. Fragment analysis
The technique involves labeling of one of the two primers of a PCR reaction with one of
the two coloured fluorescent tags (blue or yellow). The samples were mixed with 2µl internal size
standard, denatured at 90°C for 2 min and chilled on ice. The resulting PCR product(s) are
separated on polacrylamide gels with the help of the automated laser fluorescence (ALF) express
DNA sequencer. Fragment analysis was carried out on (ALF) express sequencers (Amersham
Biosciences, Freiburg, Germany) using short gel cassettes. Each sample was loaded on a
polyacrylamid gel. Denaturing 6% polyacrylamide gels, 0.35 mm thick, were prepared. The gels
were run in 1 X Tris-borate-EDTA (TBE) buffer (pH 8.0) with 600 V, 50 mA and 50 W with 2
mW laser power and a sampling interval of 1,00 sec. The gels were reused four to five times. In

Materials & Methods
–––––––––––––––––––––––––– 39 –––––––––––––––––––––––––
each laser, fragments with known size were included as standards. Microsatellite fragment sizes
were calculated using the computer program Fragment Analyser Version 1.02 ‘Amersham
Bioscience, Freiburg, Germany’, which was added to each lane in the loading buffer by
comparison with the internal size standards (Röder et al., 1998). (Appendix Fig. 1).
2.3.5. Marker nomenclature
Wheat microsatellite loci were designated ‘Xgwm’ for ‘Gatersleben Wheat
Microsatellite’ followed by a primer number, according to Röder et al. (1998). Detected loci
were marked with an ‘X’, the basic symbol for molecular marker loci of unknown function in
wheat. The information of mapped gwm primer pairs in this study can be found in Appendix
Table 2.
2.4. Statistical methods
2.4.1. Analysis of variance
Analysis of variance was performed using the program Minitab. The ANOVA was
estimated for 1000-grain weight stress tolerance index. The calculation tables were as follows:
ANOVA for 1000-grain weight stress tolerance index
S.O.V DF MS Expected MS
Block r-1
Genoypes (G) g-1 σ 2 e + r σ 2 g
Error (e) (r-1) (g-1) σ 2 e
Total (rg-1)
2.4.2. Phenotypic frequency distribution
Phenotypic frequency distribution was performed using the program Minitab.
2.4.3. Map construction
Linkage of all marker loci analysis was performed with the computer program
MAPMAKER (Lander et al., 1987). Kosambi function (Kosambi, 1944) was used to convert
the recombination frequency to genetic distances in centimorgans (cM). This analysis was
carried out by evaluating the mapping populations as an F2 using two-point analysis to
identify linkage group at a LOD score of 3.0. Data was put in as A, B and H to mark
genotypes of parent A; parent B, and heterozygotes, respectively, for co-dominant marker.
Other situations were coded by C = not A; i. e. H or B (for dominant markers), D = not B; i. e.
H or A (for dominant markers), ‘-’ = missing data for the individual at a locus.
Materials & Methods
–––––––––––––––––––––––––– 40 –––––––––––––––––––––––––
Any marker of one group has to any marker of the other group and LOD score < 3.0 or
recombination ratio > 0.40. The formed groups were afterwards ordered using the ‘First
Order’ command whenever possible. Usually, the first order was aided with LOD table
correlations between markers, to figure out the most-linked markers. The ‘Compare’
command calculated the maximum likelihood map for each specified order of markers and to
report the orders stored by likelihood of their maps. One sequence can specify more than one
order of loci. For example, the sequence ‘{1 2 3}’ specifies the three orders ‘1 2 3’, ‘1 3 2’
and ‘2 1 3’. Only the 20 most likely orders were reported by MAPMAKER. The best order
was indicated as having a relative log-likelihood of 0.0. The obtained order was then analyzed
further using a three-Point linkage analysis ‘Ripple’ command. Other markers were added
using the ‘Try’ command and fine-tuned using again the ‘Ripple’ command. The ‘Ripple’
command was conducted to assign exact positions to markers. Both chromosome assignment
and centromere localization were determined by comparing the map to the previously
published wheat maps, especially to the Röder et al. (1998) wheat SSR map. Marker loci and
linkage group that were more than 50 cM apart were considered to be not significantly linked.
2.4.4. Quantitative trait loci analysis
The QTL analysis was performed as a composite interval mapping analysis (CIM) to
identify genomic regions associated with the traits evaluated using QGENE (Nelson, 1997).
The association between phenotype and marker genotype was investigated using single-
marker regression. The program performs a multiple regression on evenly distributed
positions of the linkage map. It calculates the test statistics (LOD) based on the sum of
squares of the regression in a model with QTLs versus the sum of squares of the regression in
a model without QTLs. Also, the proportion of phenotypic variance explained by each QTL
marker was estimated using the coefficient of determination (PV), which is based on the
partial correlation of a putative QTL with the trait adjusted for cofactors in the multi locus
model. For each QTL, the regression coefficient from the multi-locus model was used to
estimate the additive effect of the ‘A’ or ‘B’ allele. Additive effect was positive if the allele of
‘A’ increase the post-anthesis drought tolerance score, plant height, heading date or grain
characters measurements and negative if the ‘B’ increased the post-anthesis drought tolerance
score, plant height, heading date or grain characters measurements. In the QGENE program,
the parameters for the QTL data were included in data files. These parameters were marker
data, linkage groups and the phenotypic observation values.
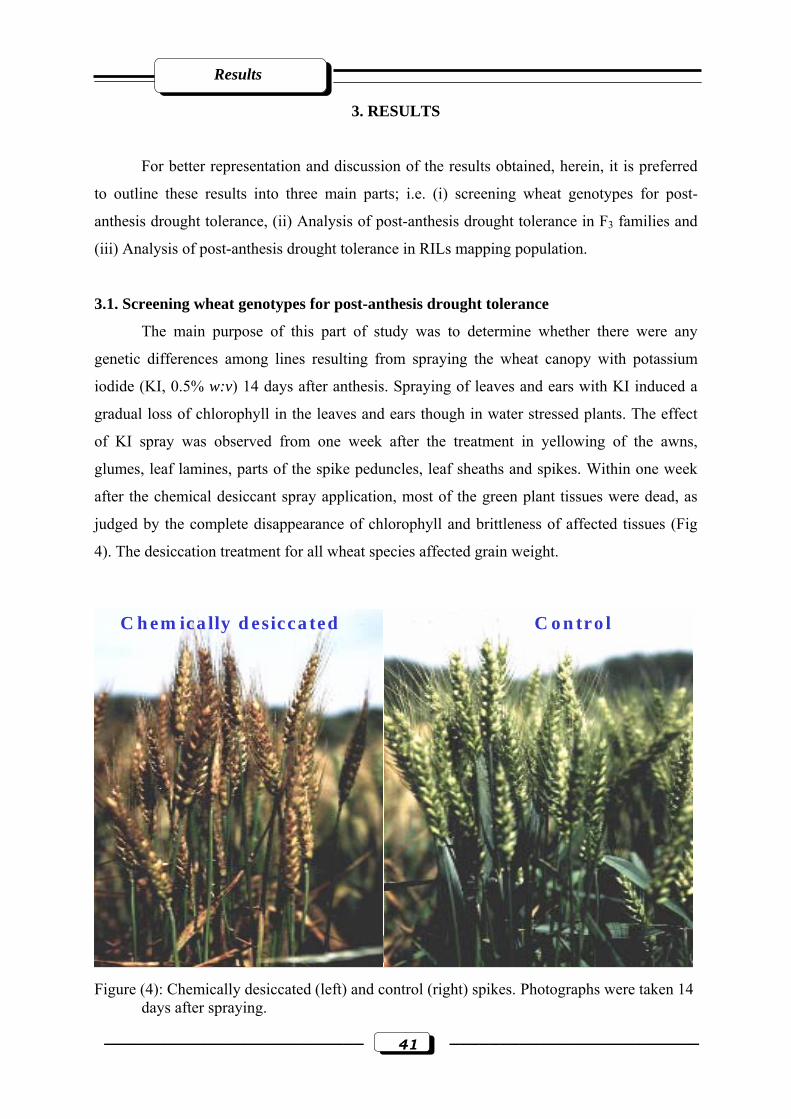
Results
–––––––––––––––––––––––––– 41 –––––––––––––––––––––––––
3. RESULTS
For better representation and discussion of the results obtained, herein, it is preferred
to outline these results into three main parts; i.e. (i) screening wheat genotypes for post-
anthesis drought tolerance, (ii) Analysis of post-anthesis drought tolerance in F3 families and
(iii) Analysis of post-anthesis drought tolerance in RILs mapping population.
3.1. Screening wheat genotypes for post-anthesis drought tolerance
The main purpose of this part of study was to determine whether there were any
genetic differences among lines resulting from spraying the wheat canopy with potassium
iodide (KI, 0.5% w:v) 14 days after anthesis. Spraying of leaves and ears with KI induced a
gradual loss of chlorophyll in the leaves and ears though in water stressed plants. The effect
of KI spray was observed from one week after the treatment in yellowing of the awns,
glumes, leaf lamines, parts of the spike peduncles, leaf sheaths and spikes. Within one week
after the chemical desiccant spray application, most of the green plant tissues were dead, as
judged by the complete disappearance of chlorophyll and brittleness of affected tissues (Fig
4). The desiccation treatment for all wheat species affected grain weight.
Figure (4): Chemically desiccated (left) and control (right) spikes. Photographs were taken 14
days after spraying.
S y m p tom s o n h ea d s
C h em ica lly d esicca ted C o n tro l
Results
–––––––––––––––––––––––––– 42 –––––––––––––––––––––––––
Table 4 shows the results of the analysis of variance based on stress tolerance index
indicated significant differences (P≤0.01) for 1000-grain weight stress tolerance index
between the wheat genotypes. Genotypes were found to be highly significant for stress
tolerance index, indicating that there was genetic diversity in post-anthesis drought tolerance
within the wheat germplasm.
Table (4): Mean square estimates of analysis of variance for
1000-grain weight stress tolerance index
Source of variance df Mean square F
Genotypes 76 471.6 5.41**
Blocks 1 581.4 6.67*
Error 76 87.2
Total 153 * and ** significant at 0.05 and 0.01 levels of probability, respectively.
The drought stress tolerance index based on grain yield i.e., 1000-grain weight under
KI spray treatment (S) and 1000-grain weight under control (C) for the genotypes analysed is
reported in Appendix Table 3. Among the seventy-seven wheat genotypes tested in the wheat
growing season 2001/2002, the stress tolerance index, ranged from 22.26% to 87.78%. The
wheat genotypes ATRI 1896, ATRI 5283, ATRI 17620, Synthetic/N, ATRI 9882, ATRI
5951, W7984 and ATRI 7099 exhibited the highest stress tolerance index values (87.78%,
82.41%, 80.23%, 78.46%, 77.71%, 74.33%, 70.80% and 70.06%, respectively). On the other
hand, the wheat genotypes ATRI 11457, ATRI 11445, ATRI 6931, ATRI 10213, Capelle-
Desprez, ATRI 10197, ATRI 1634 and Bezostaya exhibited the lowest stress tolerance index
values (22.26%, 25.72%, 26.60%, 26.88%, 30.29%, 30.37%, 30.55% and 31.13%,
respectively).
3.2. Analysis of post-anthesis drought tolerance in F3 families
3.2.1. Analysis of field experiments
3.2.1.1. Phenotypic analysis and inheritance of stem reserve mobilization
In two experiments in Gatersleben, a set of 81 F3 families plus the two parental
accession lines, ‘ATRI 5283’ and ‘ATRI 15010’ were grown in the field for the purpose of
phenotyping stem reserve mobilization. Plants were tested using potassium iodide (KI, 0.5 %
w/v) after 14 days and stress tolerance index (STI) for 1000-grain weight was measured. In

Results
–––––––––––––––––––––––––– 43 –––––––––––––––––––––––––
this study, mean responses of the parents were recorded as percent of 1000-grain weight
injury after treated by KI in Gatersleben location for the years 2002 and 2003. The two
parental lines differed in post-anthesis drought tolerance. The stress tolerance index for
‘ATRI 5283’ (80.42%-77.60%) was higher than that of ‘ATRI 15010’ (46.15%-57.72%).
These results confirmed that the ‘ATRI 5283’ have more stem reserve mobilized and a high
translocation ability for kernel weight compared with the ‘ATRI 15010’. Using the data of
1000-grain weight stress tolerance index of F3 families, a frequency distribution curve was
prepared (Fig. 5). A wide or continuous frequency distributions with transgressive segregants
was observed, as one would expect for a quantitative trait. The continuous distribution of stem
reserve indicated that stem reserve mobilization is polygenic in nature and quantitatively
inherited.
Figure (5): Phenotypic distribution of stress tolerance index (STI%) for 1000-grain weight
means of F3 families derived from a cross between ‘ATRI 5283’ and ‘ATRI 15010’ measured
for the two environments (Gatersleben 2002 and Gatersleben 2003). (Empty arrows = means
of ‘ATRI 5283’; filled arrows = means of ‘ATRI 15010’).
3.2.1.2. Phenotypic analysis and inheritance of vegetative traits
Plant height (Ht) was measured at Gatersleben in 2002 and 2003 as the distance from
the ground to the top of the spike (excluding awns) in centimeters. Also, flowering time (Flt)
was quantified as the number of days from planting to flowering of 50% of plants of each
genotype. Significant differences were noticed between the two parents means for the two
traits, where, the ‘ATRI 15010’ parent line was earlier in flowering time and shorter in plant
length than ‘ATRI 5283’. Using the data on plant height and flowering time of F3 families,
frequency distribution curves were obtained (Fig. 6). Wide or continuous frequency
distributions with transgressive segregants were observed, as one would expect for QTLs. The
Freq
uenc
y
1000-grain weight STI (2003)
30 40 50 60 70 80 90 100
0
5
10
Freq
uenc
y
1000-grain weight STI (2002)
30 40 50 60 70 80 90 1000
12345
678
Freq
uenc
y
1000-grain weight STI (2003)
30 40 50 60 70 80 90 100
0
5
10
Freq
uenc
y
1000-grain weight STI (2002)
30 40 50 60 70 80 90 1000
12345
678

Results
–––––––––––––––––––––––––– 44 –––––––––––––––––––––––––
continuous distributions of plant height and flowering time indicated that plant height and
flowering time are polygenic in nature and quantitatively inherited.
Figure (6): Phenotypic distribution of the vegetative traits (plant height in cm and flowering
time in days) means of F3 families derived from a cross between ‘ATRI 5283’ and ‘ATRI
15010’ measured for the two environments (Gatersleben 2002 and Gatersleben 2003). (Empty
arrows = means of ‘ATRI 5283’; filled arrows = means of ‘ATRI 15010’).
3.2.1.3. Phenotypic analysis and inheritance of grain characters
Stress tolerance index (STI%) for all grain characters was measured. The parental
means for the two environments Gatersleben field season 2002 and 2003 are given in
Appendix Table 4. Using the STI for the grain characters data of F3 families, frequency
distribution curves were prepared (Fig. 7). Wide or continuous frequency distributions with
transgressive segregants were observed, as one would expect for QTLs. The presence of
transgressive segregants for all the grain traits suggested that the parents selected for this
analysis had alleles associated with low and high values of these traits. The continuous
distributions indicated that the characters are polygenic in nature and quantitatively inherited.
Plant height (2002)55 65 75 85 95 105 115 125 135 145 155
0
5
10
15
Freq
uenc
y
Flowering time (2002) 90 95 100 105 110 115
0
10
20
Freq
uenc
y
Plant height (2003)55 65 75 85 95 105 115 125 135 145
0
5
10
Freq
uenc
yFr
eque
ncy
Flowering time (2003)82 84 86 88 90 92 94 96 98 100
0
5
10
15
Plant height (2002)55 65 75 85 95 105 115 125 135 145 155
0
5
10
15
Freq
uenc
y
Plant height (2002)55 65 75 85 95 105 115 125 135 145 155
0
5
10
15
Freq
uenc
y
Flowering time (2002) 90 95 100 105 110 115
0
10
20
Freq
uenc
y
Flowering time (2002) 90 95 100 105 110 115
0
10
20
Freq
uenc
y
Plant height (2003)55 65 75 85 95 105 115 125 135 145
0
5
10
Freq
uenc
y
Plant height (2003)55 65 75 85 95 105 115 125 135 145
0
5
10
Freq
uenc
yFr
eque
ncy
Flowering time (2003)82 84 86 88 90 92 94 96 98 100
0
5
10
15
Freq
uenc
y
Flowering time (2003)82 84 86 88 90 92 94 96 98 100
0
5
10
15

Results
–––––––––––––––––––––––––– 45 –––––––––––––––––––––––––
Figure (7): Phenotypic distribution of stress tolerance index (STI%) for grain characters (grain
area, grain length, grain width, grain circumference; grain roundness and grain form density
factor) means of F3 families derived from a cross between ‘ATRI 5283’ and ‘ATRI 15010’
measured for the two environments (Gatersleben 2002 and Gatersleben 2003). (Empty arrows
= means of ‘ATRI 5283’; filled arrows = means of ‘ATRI 15010’).
3.2.2. Genetic mapping
3.2.2.1. Polymorphism rate detected by microsatellite markers
In this part of the study the genetic variation on the DNA level between the two
parental lines ‘ATRI 5283’ and ‘ATRI 15010’ was estimated using DNA molecular markers.
The markers used were microsatellites, which offer great potential for generating large
numbers of markers evenly distributed throughout the genome and have efficiently been used
to give reliable and reproducible genetic markers. A total of 442 Gatersleben Wheat
Grain area STI (2002) Grain area STI (2003) Grain length STI (2002) Grain length STI (2003)
Grain width STI (2003)Grain width STI (2002) Grain circumference STI (2002) Grain circumference STI (2003)
Freq
uenc
y
Grain roundness STI (2002)85 90 95 100
0
10
20
Freq
uenc
y
Grain roundness STI (2002)85 90 95 100
0
10
20
85 90 95 1000
10
20
Grain roundness STI (2003)
Freq
uenc
y
85 90 95 1000
5
10
15
Grain roundness STI (2003)
Freq
uenc
y
85 90 95 1000
5
10
15
85 90 95 1000
5
10
15
10
Grain form density STI (2002)
Freq
uenc
y
30 40 50 60 70 80 90 1000
5
10
Grain form density STI (2002)
Freq
uenc
y
30 40 50 60 70 80 90 1000
5
Grain form density STI (2003)
Freq
uenc
y
30 40 50 60 70 80 90 1000123456789
Grain form density STI (2003)
Freq
uenc
y
30 40 50 60 70 80 90 1000123456789
30 40 50 60 70 80 90 1000123456789
Freq
uenc
y
10
80 90 1000
5
Freq
uenc
y
80 90 100
0
5
10
Freq
uenc
y
80 82 84 86 88 90 92 94 96 98 100
0
5
10
15
Freq
uenc
y
80 90 1000
2
4
6
8
10
12
14
Freq
uenc
y
10
80 90 1000
5
Freq
uenc
y
80 90 100
0
5
10
Freq
uenc
y
80 82 84 86 88 90 92 94 96 98 100
0
5
10
15
Freq
uenc
y
80 90 1000
2
4
6
8
10
12
14
70 80 90 1000
5
10
15
Freq
uenc
y
Freq
uenc
y
80 82 84 86 88 90 92 94 96 98 100
0
5
10
Freq
uenc
y
60 70 80 90 1000
5
10
Freq
uenc
y60 70 80 90 100
0123456789
70 80 90 1000
5
10
15
Freq
uenc
y
Freq
uenc
y
80 82 84 86 88 90 92 94 96 98 100
0
5
10
Freq
uenc
y
60 70 80 90 1000
5
10
Freq
uenc
y60 70 80 90 100
0123456789
Freq
uenc
y
Freq
uenc
y
80 82 84 86 88 90 92 94 96 98 100
0
5
10
Freq
uenc
y
60 70 80 90 1000
5
10
Freq
uenc
y60 70 80 90 100
0123456789
Freq
uenc
y
80 82 84 86 88 90 92 94 96 98 100
0
5
10
80 82 84 86 88 90 92 94 96 98 100
0
5
10
Freq
uenc
y
60 70 80 90 1000
5
10
Freq
uenc
y60 70 80 90 100
0123456789
Freq
uenc
y
60 70 80 90 1000
5
10
Freq
uenc
y
60 70 80 90 1000
5
10
60 70 80 90 1000
5
10
Freq
uenc
y60 70 80 90 100
0123456789
Results
–––––––––––––––––––––––––– 46 –––––––––––––––––––––––––
Microsatellites (GWM) with known map positions were analysed using the DNA of the two
parents in a polymerase chain reaction (PCR) for polymorphism. of the 442 GWM primer
pairs tested, a total of 184 GWM assigned to the A and B genomes showed polymorphisms
(41.63%) and were used for mapping in F2 generation.
3.2.2.2. Linkage map construction
The distribution of the mapped SSR markers for A and B genomes, the distribution per
each homoeologous group (H. G.), percent of covering per each chromosome, percent of
covering per each homoeologous group (H. G.), chromosome length (cM) and average
distance between markers in each chromosome (cM), are shown in Table 5. The map was
constructed using the data of 184 SSR markers on the 81 F2 plants applying the F2 model in
the Mapmaker program. The loci are fairly evenly distributed between the A and B genomes.
However, in all homoeologous groups with the exception of group 1, 2 and 7, the B genome
shows a slightly higher percentage of markers (Table 5). The basic map having a length of
2,603.34 cM is shown in (Figure 8). Consequently, 184 loci were mapped on A and B
genomes. The number of mapped loci was higher for B genome (103) compared to the A
genome (81). In both genomes the loci were distributed across all 7 chromosomes. As for the
mapping frequency of SSR markers in relation to chromosomes, the highest numbers of SSRs
were found on 6B (20 markers) and 4B (19 markers). The chromosomes with the fewest
markers are 5A (7 markers), 4A (8 markers), 3A (9 markers) and 1B (10 markers). The
homoeologous groups having the most markers are groups 2 and 6 (31 markers = 16.85% of
the total markers mapped) followed by group 7 (29 markers). Group 5 has the fewest number
of markers (18 markers = 9.78%). The 184 SSR markers cover a total length of 2,603.34 cM,
almost comparable with the linkage map reported by Röder et al. (1998; unpublished) for the
cross T. aestivum x T. aestivum considering the A and B genomes of that cross only. The
average distance between marker pairs is 15.17 cM, ranging from 8.43 cM for chromosome
4B to 22.49 cM for 5A (Table 5), however, there were some gaps wider than 50 cM on
chromosomes 1A, 2A, 3A, 4A, 5A, 5B and 7A (Fig. 8). Chromosomes 2A, 4B, 6B and 7A
showed marker clustering around the centromeric region. Marker clusters are usually
associated with reduced recombination in the proximal region of chromosome arms.
However, in this mapping population the marker distribution was relatively adequate and few
clusters of tightly linked loci were revealed, as all SSR marker locations were known and the
markers were selected to avoid closely linked multiple loci. Map locations of all markers were
comparable to that reported for the ITMI population (Röder et al., 1998).
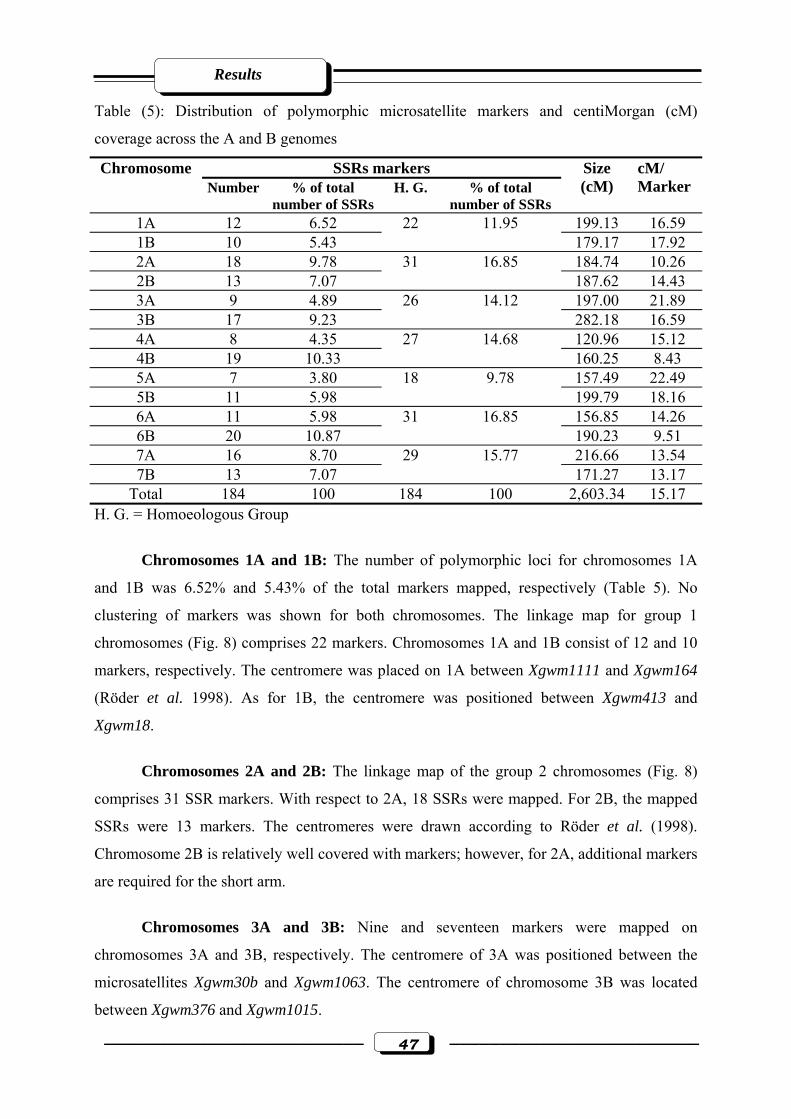
Results
–––––––––––––––––––––––––– 47 –––––––––––––––––––––––––
Table (5): Distribution of polymorphic microsatellite markers and centiMorgan (cM)
coverage across the A and B genomes
SSRs markers Chromosome Number % of total
number of SSRs H. G. % of total
number of SSRs
Size (cM)
cM/ Marker
1A 12 6.52 199.13 16.59 1B 10 5.43
22 11.95 179.17 17.92
2A 18 9.78 184.74 10.26 2B 13 7.07
31 16.85 187.62 14.43
3A 9 4.89 197.00 21.89 3B 17 9.23
26 14.12 282.18 16.59
4A 8 4.35 120.96 15.12 4B 19 10.33
27 14.68 160.25 8.43
5A 7 3.80 157.49 22.49 5B 11 5.98
18 9.78 199.79 18.16
6A 11 5.98 156.85 14.26 6B 20 10.87
31 16.85 190.23 9.51
7A 16 8.70 216.66 13.54 7B 13 7.07
29 15.77 171.27 13.17
Total 184 100 184 100 2,603.34 15.17 H. G. = Homoeologous Group
Chromosomes 1A and 1B: The number of polymorphic loci for chromosomes 1A
and 1B was 6.52% and 5.43% of the total markers mapped, respectively (Table 5). No
clustering of markers was shown for both chromosomes. The linkage map for group 1
chromosomes (Fig. 8) comprises 22 markers. Chromosomes 1A and 1B consist of 12 and 10
markers, respectively. The centromere was placed on 1A between Xgwm1111 and Xgwm164
(Röder et al. 1998). As for 1B, the centromere was positioned between Xgwm413 and
Xgwm18.
Chromosomes 2A and 2B: The linkage map of the group 2 chromosomes (Fig. 8)
comprises 31 SSR markers. With respect to 2A, 18 SSRs were mapped. For 2B, the mapped
SSRs were 13 markers. The centromeres were drawn according to Röder et al. (1998).
Chromosome 2B is relatively well covered with markers; however, for 2A, additional markers
are required for the short arm.
Chromosomes 3A and 3B: Nine and seventeen markers were mapped on
chromosomes 3A and 3B, respectively. The centromere of 3A was positioned between the
microsatellites Xgwm30b and Xgwm1063. The centromere of chromosome 3B was located
between Xgwm376 and Xgwm1015.

Results
–––––––––––––––––––––––––– 48 –––––––––––––––––––––––––
Chromosomes 4A and 4B: Homoeologous group 4 had a total 27 markers mapped. 8
and 19 markers for chromosomes 4A and 4B, respectively, were mapped. The suggested
centromere position of chromosome 4A is between Xgwm929 and Xgwm610, while for 4B it
is between Xgwm925 and Xgwm946.
Chromosomes 5A and 5B: On chromosome 5A, 7 markers were mapped, 5 of which
were located on the long arm. However on 5B, 11 gwm were mapped, 9 of which were
located on the long arm. The centromere of 5A was positioned between Xgwm415 and
Xgwm186 based on previously published maps (Röder et al., 1998). For chromosome 5B the
centromere was positioned between Xgwm810 and Xgwm1165.
Chromosomes 6A and 6B: The homoeologous group 6 consists of 31 markers (11 on
6A and 20 on 6B). The centromere for 6A was positioned between Xgwm1011a and
Xgwm786. The centromere of chromosome 6B was located between Xgwm1233 and
Xgwm644a.
Chromosomes 7A and 7B: Chromosome group 7 contains 29 markers, 16 and 13 on
chromosomes 7A and 7B, respectively. On chromosome 7A, the centromere was positioned
between Xgwm890 and Xgwm631. The centromere of chromosome 7B was located between
Xgwm1184 and Xgwm297.
3.2.3. Mapping QTLs for post-anthesis drought tolerance in F3 families
Mapping of quantitative trait loci (QTLs) was carried out in a set of 81 F3 families
derived from a cross between the two accessions ‘ATRI 5283’ and ‘ATRI 15010’.
Individual putative QTLs were detected for stem reserve mobilization character,
vegetative traits and grain characters. All traits were recorded in two years. The QTL analysis
was carried out for each year separately. Putative QTLs for each trait and their map positions
are shown in Fig. 8. According to Fulton et al. (1997, 2000) and Tanksley et al. (1996),
regions of the genomes were identified as putatively containing a QTL if the results met one
or more of the following criteria: a significant effect was observed for a single marker/trait
combination at a single environment with P<0.001; significant effects were observed in the
same direction (i.e. either all positive effects or all negative effects) for a single marker/trait
combination at one or two environments with P<0.01; significant effects were observed in the
same direction for a single marker/trait combination at one or two environments with P<0.1.
Results
–––––––––––––––––––––––––– 49 –––––––––––––––––––––––––
Based on this criteria, a total of 53 putative QTLs were identified, ranging from 3 to 9 QTLs
covering the 9 studied characters.
3.2.3.1 Mapping QTL for stem reserve mobilization (Srm)
The individual QTLs for stem reserve mobilization as identified by the single-marker
regression analysis using the QGENE program are presented in Figure 8 and Appendix Table
5. Six QTLs were detected on chromosomes 1A, 3A, 3B, 4B, 6A and 7B, explaining from
13.41% to 24.74% of the phenotypic variance (PV%) with a LOD score of 2.16 to 3.47.
Positive additive effect indicated that the score was higher for the parental allele of ‘ATRI
5283’ i.e. tolerance is inherited by the ‘ATRI 5283’ allele and sensitivity (smaller score) by
the ‘ATRI 15010’. For four QTLs, (designated QSrm.ipk-3B, QSrm.ipk-4B, QSrm.ipk-6A and
QSrm.ipk-7B) ‘ATRI 5283’ increased the stem reserve mobilization. For two QTLs,
(designated QSrm.ipk-1A and QSrm.ipk-3A) the ‘ATRI 15010’ alleles increased stem reserve
mobilization by 22.60% and 13.93%, respectively (Appendix Table 5). The loci QSrm.ipk-1A,
QSrm.ipk-3B and QSrm.ipk-6A, however, were detected in one environment only.
3.2.3.2. Mapping QTL for vegetative traits 3.2.3.2.1. Plant height (Ht)
Under non-stress conditions, eight putative QTLs significantly associated with plant
height were detected (Appendix Table 6). These eight QTLs were located on chromosomes
1A, 2A, 2B, 3A, 3B, 4A, 5A and 7A (Fig. 8), where individual QTLs explained between
12.08% and 22.96% of the phenotypic variance. For six QTLs (designated QHt.ipk-2A,
QHt.ipk-2B, QHt.ipk-3A, QHt.ipk-3B, QHt.ipk-5A and QHt.ipk-7A), the ‘ATRI 15010’ alleles
decreased the plant height. For two QTLs (designated QHt.ipk-1A and QHt.ipk-4A), the
‘ATRI 5283’ alleles had an effect that increased plant height (Appendix Table 6). The
QHt.ipk-1A, QHt.ipk-2B, QHt.ipk-3B and QHt.ipk-4A were only detected in one environment.
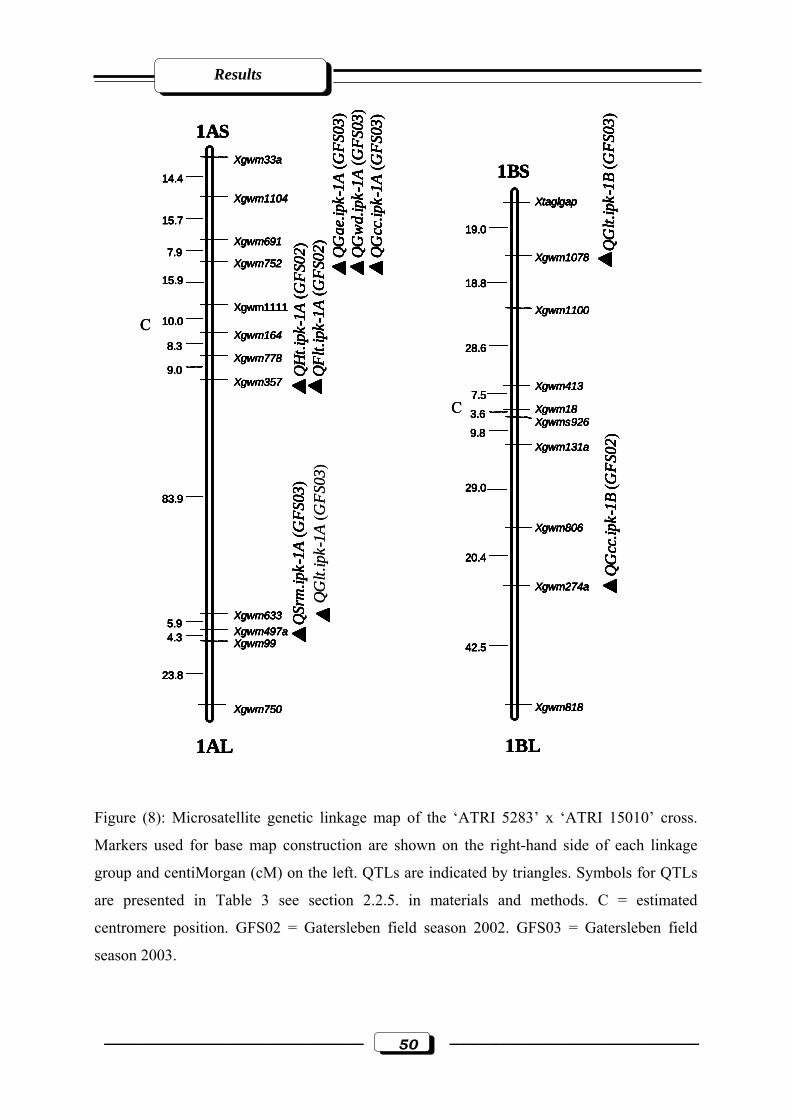
Results
–––––––––––––––––––––––––– 50 –––––––––––––––––––––––––
Figure (8): Microsatellite genetic linkage map of the ‘ATRI 5283’ x ‘ATRI 15010’ cross.
Markers used for base map construction are shown on the right-hand side of each linkage
group and centiMorgan (cM) on the left. QTLs are indicated by triangles. Symbols for QTLs
are presented in Table 3 see section 2.2.5. in materials and methods. C = estimated
centromere position. GFS02 = Gatersleben field season 2002. GFS03 = Gatersleben field
season 2003.
QG
cc.ip
k-1B
(GFS
02)
Xtaglgap
19.0
Xgwm1078
18.8
Xgwm1100
28.6
Xgwm4137.5
Xgwm183.6Xgwms926
9.8Xgwm131a
29.0
Xgwm806
20.4
Xgwm274a
42.5
Xgwm818
1BL
1BS
QG
lt.ip
k-1B
(GFS
03)
Xgwm33a
14.4
Xgwm1104
15.7
Xgwm6917.9
Xgwm75215.9
Xgwm111110.0
Xgwm1648.3
Xgwm7789.0
Xgwm357
83.9
Xgwm6335.9
Xgwm497a4.3 Xgwm99
23.8
Xgwm750
1AS
1AL
QG
ae.ip
k-1A
(GFS
03)
QG
wd.
ipk-
1A (G
FS03
)Q
Gcc
.ipk-
1A (G
FS03
)
QSr
m.ip
k-1A
(GFS
03)
QH
t.ipk
-1A
(GFS
02)
QFl
t.ipk
-1A
(GFS
02)
C
C
QG
lt.ip
k-1A
(GFS
03)
QG
cc.ip
k-1B
(GFS
02)
Xtaglgap
19.0
Xgwm1078
18.8
Xgwm1100
28.6
Xgwm4137.5
Xgwm183.6Xgwms926
9.8Xgwm131a
29.0
Xgwm806
20.4
Xgwm274a
42.5
Xgwm818
1BL
1BS
QG
lt.ip
k-1B
(GFS
03)
Xgwm33a
14.4
Xgwm1104
15.7
Xgwm6917.9
Xgwm75215.9
Xgwm111110.0
Xgwm1648.3
Xgwm7789.0
Xgwm357
83.9
Xgwm6335.9
Xgwm497a4.3 Xgwm99
23.8
Xgwm750
1AS
1AL
QG
ae.ip
k-1A
(GFS
03)
QG
wd.
ipk-
1A (G
FS03
)Q
Gcc
.ipk-
1A (G
FS03
)
QSr
m.ip
k-1A
(GFS
03)
QH
t.ipk
-1A
(GFS
02)
QFl
t.ipk
-1A
(GFS
02)
C
C
QG
cc.ip
k-1B
(GFS
02)
Xtaglgap
19.0
Xgwm1078
18.8
Xgwm1100
28.6
Xgwm4137.5
Xgwm183.6Xgwms926
9.8Xgwm131a
29.0
Xgwm806
20.4
Xgwm274a
42.5
Xgwm818
1BL
1BS
QG
lt.ip
k-1B
(GFS
03)
Xgwm33a
14.4
Xgwm1104
15.7
Xgwm6917.9
Xgwm75215.9
Xgwm111110.0
Xgwm1648.3
Xgwm7789.0
Xgwm357
83.9
Xgwm6335.9
Xgwm497a4.3 Xgwm99
23.8
Xgwm750
1AS
1AL
QG
ae.ip
k-1A
(GFS
03)
QG
wd.
ipk-
1A (G
FS03
)Q
Gcc
.ipk-
1A (G
FS03
)
QSr
m.ip
k-1A
(GFS
03)
QH
t.ipk
-1A
(GFS
02)
QFl
t.ipk
-1A
(GFS
02)
C
QG
cc.ip
k-1B
(GFS
02)
Xtaglgap
19.0
Xgwm1078
18.8
Xgwm1100
28.6
Xgwm4137.5
Xgwm183.6Xgwms926
9.8Xgwm131a
29.0
Xgwm806
20.4
Xgwm274a
42.5
Xgwm818
1BL
1BS
QG
lt.ip
k-1B
(GFS
03)
Xgwm33a
14.4
Xgwm1104
15.7
Xgwm6917.9
Xgwm75215.9
Xgwm111110.0
Xgwm1648.3
Xgwm7789.0
Xgwm357
83.9
Xgwm6335.9
Xgwm497a4.3 Xgwm99
23.8
Xgwm750
1AS
1AL
QG
ae.ip
k-1A
(GFS
03)
QG
wd.
ipk-
1A (G
FS03
)Q
Gcc
.ipk-
1A (G
FS03
)
QSr
m.ip
k-1A
(GFS
03)
QH
t.ipk
-1A
(GFS
02)
QFl
t.ipk
-1A
(GFS
02)
QG
cc.ip
k-1B
(GFS
02)
Xtaglgap
19.0
Xgwm1078
18.8
Xgwm1100
28.6
Xgwm4137.5
Xgwm183.6Xgwms926
9.8Xgwm131a
29.0
Xgwm806
20.4
Xgwm274a
42.5
Xgwm818
1BL
1BS
QG
lt.ip
k-1B
(GFS
03)
QG
cc.ip
k-1B
(GFS
02)
Xtaglgap
19.0
Xgwm1078
18.8
Xgwm1100
28.6
Xgwm4137.5
Xgwm183.6Xgwms926
9.8Xgwm131a
29.0
Xgwm806
20.4
Xgwm274a
42.5
Xgwm818
1BL
1BS
QG
lt.ip
k-1B
(GFS
03)
Xgwm33a
14.4
Xgwm1104
15.7
Xgwm6917.9
Xgwm75215.9
Xgwm111110.0
Xgwm1648.3
Xgwm7789.0
Xgwm357
83.9
Xgwm6335.9
Xgwm497a4.3 Xgwm99
23.8
Xgwm750
1AS
1AL
QG
ae.ip
k-1A
(GFS
03)
QG
wd.
ipk-
1A (G
FS03
)Q
Gcc
.ipk-
1A (G
FS03
)
QSr
m.ip
k-1A
(GFS
03)
QH
t.ipk
-1A
(GFS
02)
QFl
t.ipk
-1A
(GFS
02)
Xgwm33a
14.4
Xgwm1104
15.7
Xgwm6917.9
Xgwm75215.9
Xgwm111110.0
Xgwm1648.3
Xgwm7789.0
Xgwm357
83.9
Xgwm6335.9
Xgwm497a4.3 Xgwm99
23.8
Xgwm750
1AS
1AL
QG
ae.ip
k-1A
(GFS
03)
QG
wd.
ipk-
1A (G
FS03
)Q
Gcc
.ipk-
1A (G
FS03
)
QSr
m.ip
k-1A
(GFS
03)
QH
t.ipk
-1A
(GFS
02)
QFl
t.ipk
-1A
(GFS
02)
C
C
QG
lt.ip
k-1A
(GFS
03)

Results
–––––––––––––––––––––––––– 51 –––––––––––––––––––––––––
Figure (8): continued
QG
df.ip
k-2A
(GFS
02)
2AL
Xgwm6141.5Xgwm5125.1Xgwm636
15.6
Xgwm7268.2
Xgwm359
58.0
Xgwm954.1 Xgwm515a0.0 Xgwm2752.5 Xgwm3396.2 Xgwm10451.3 Xgwm71c0.1 Xgwm5581.2 Xgwm1011b19.2 Xgwm817
19.0
Xgwm2941.5Xgwm761
33.4
Xgwm382b7.9
Xgwm739b
2AS
QH
t.ipk
-2A
(GFS
02)
QH
t.ipk
-2A
(GFS
03)
QG
cc.ip
k-2A
(GFS
02)
QG
lt.ip
k-2A
(GFS
03)
QFl
t.ipk
-2A
(GFS
02)
QFl
t.ipk
-2A
(GFS
03)
Xgwm4298.1
Xgwm148
23.4
Xgwm3749.6
Xgwm972
16.4
Xgwm630
17.1
Xgwm38811.8
Xgwm191b
30.3
Xgwm10674.0 Xgwm877a
15.1
Xgwm1070a
35.0
Xgwm846d0.0Xgwm382d
16.8
Xgwm1027
2BL
2BS
QH
t.ipk
-2B(
GFS
02)
QG
ae.ip
k-2B
(GFS
02)
QG
wd.
ipk-
2B (G
FS02
)C
C
QG
df.ip
k-2A
(GFS
02)
QG
df.ip
k-2A
(GFS
02)
2AL
Xgwm6141.5Xgwm5125.1Xgwm636
15.6
Xgwm7268.2
Xgwm359
58.0
Xgwm954.1 Xgwm515a0.0 Xgwm2752.5 Xgwm3396.2 Xgwm10451.3 Xgwm71c0.1 Xgwm5581.2 Xgwm1011b19.2 Xgwm817
19.0
Xgwm2941.5Xgwm761
33.4
Xgwm382b7.9
Xgwm739b
2AS
QH
t.ipk
-2A
(GFS
02)
QH
t.ipk
-2A
(GFS
03)
QG
cc.ip
k-2A
(GFS
02)
QG
lt.ip
k-2A
(GFS
03)
QFl
t.ipk
-2A
(GFS
02)
QFl
t.ipk
-2A
(GFS
03)
Xgwm4298.1
Xgwm148
23.4
Xgwm3749.6
Xgwm972
16.4
Xgwm630
17.1
Xgwm38811.8
Xgwm191b
30.3
Xgwm10674.0 Xgwm877a
15.1
Xgwm1070a
35.0
Xgwm846d0.0Xgwm382d
16.8
Xgwm1027
2BL
2BS
QH
t.ipk
-2B(
GFS
02)
QG
ae.ip
k-2B
(GFS
02)
QG
wd.
ipk-
2B (G
FS02
)C
C
2AL
Xgwm6141.5Xgwm5125.1Xgwm636
15.6
Xgwm7268.2
Xgwm359
58.0
Xgwm954.1 Xgwm515a0.0 Xgwm2752.5 Xgwm3396.2 Xgwm10451.3 Xgwm71c0.1 Xgwm5581.2 Xgwm1011b19.2 Xgwm817
19.0
Xgwm2941.5Xgwm761
33.4
Xgwm382b7.9
Xgwm739b
2AS
QH
t.ipk
-2A
(GFS
02)
QH
t.ipk
-2A
(GFS
03)
QG
cc.ip
k-2A
(GFS
02)
QG
lt.ip
k-2A
(GFS
03)
QFl
t.ipk
-2A
(GFS
02)
QFl
t.ipk
-2A
(GFS
03)
Xgwm4298.1
Xgwm148
23.4
Xgwm3749.6
Xgwm972
16.4
Xgwm630
17.1
Xgwm38811.8
Xgwm191b
30.3
Xgwm10674.0 Xgwm877a
15.1
Xgwm1070a
35.0
Xgwm846d0.0Xgwm382d
16.8
Xgwm1027
2BL
2BS
QH
t.ipk
-2B(
GFS
02)
QG
ae.ip
k-2B
(GFS
02)
QG
wd.
ipk-
2B (G
FS02
)
2AL
Xgwm6141.5Xgwm5125.1Xgwm636
15.6
Xgwm7268.2
Xgwm359
58.0
Xgwm954.1 Xgwm515a0.0 Xgwm2752.5 Xgwm3396.2 Xgwm10451.3 Xgwm71c0.1 Xgwm5581.2 Xgwm1011b19.2 Xgwm817
19.0
Xgwm2941.5Xgwm761
33.4
Xgwm382b7.9
Xgwm739b
2AS
QH
t.ipk
-2A
(GFS
02)
QH
t.ipk
-2A
(GFS
03)
QG
cc.ip
k-2A
(GFS
02)
QG
lt.ip
k-2A
(GFS
03)
QFl
t.ipk
-2A
(GFS
02)
QFl
t.ipk
-2A
(GFS
03)
Xgwm4298.1
Xgwm148
23.4
Xgwm3749.6
Xgwm972
16.4
Xgwm630
17.1
Xgwm38811.8
Xgwm191b
30.3
Xgwm10674.0 Xgwm877a
15.1
Xgwm1070a
35.0
Xgwm846d0.0Xgwm382d
16.8
Xgwm1027
2BL
2BS
QH
t.ipk
-2B(
GFS
02)
QG
ae.ip
k-2B
(GFS
02)
QG
wd.
ipk-
2B (G
FS02
)
Xgwm4298.1
Xgwm148
23.4
Xgwm3749.6
Xgwm972
16.4
Xgwm630
17.1
Xgwm38811.8
Xgwm191b
30.3
Xgwm10674.0 Xgwm877a
15.1
Xgwm1070a
35.0
Xgwm846d0.0Xgwm382d
16.8
Xgwm1027
2BL
2BS
Xgwm4298.1
Xgwm148
23.4
Xgwm3749.6
Xgwm972
16.4
Xgwm630
17.1
Xgwm38811.8
Xgwm191b
30.3
Xgwm10674.0 Xgwm877a
15.1
Xgwm1070a
35.0
Xgwm846d0.0Xgwm382d
16.8
Xgwm1027
2BL
2BS
QH
t.ipk
-2B(
GFS
02)
QG
ae.ip
k-2B
(GFS
02)
QG
wd.
ipk-
2B (G
FS02
)C
C
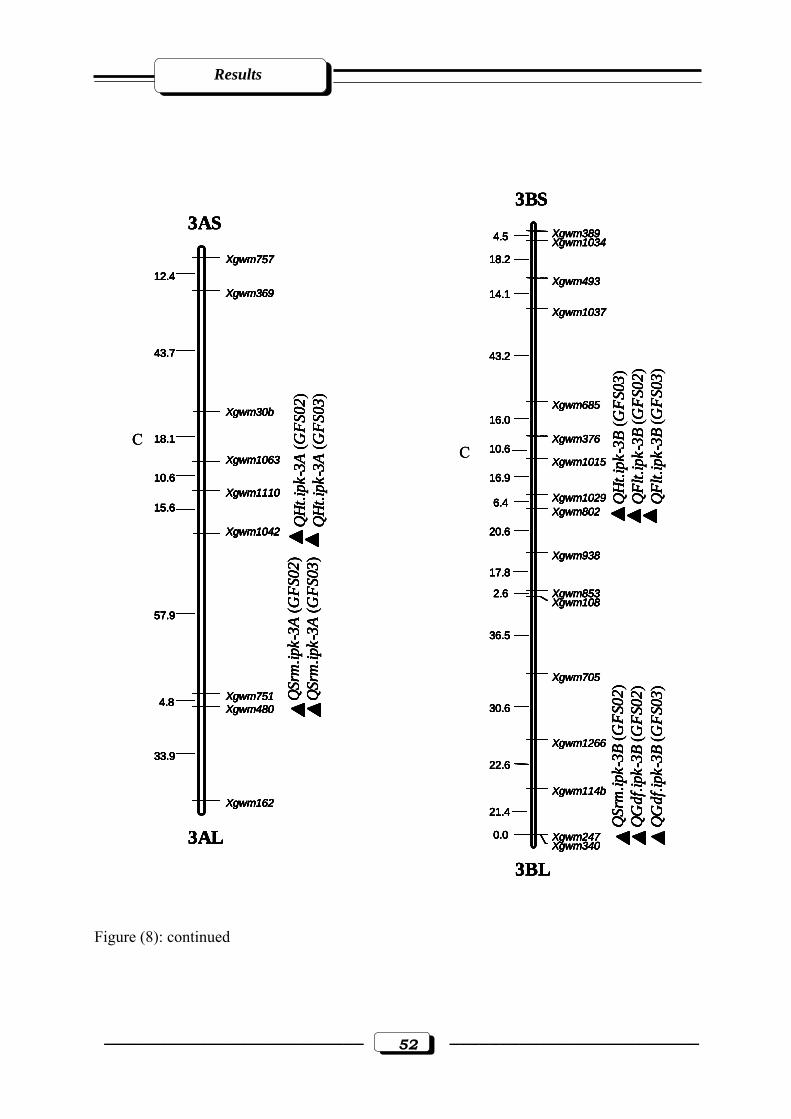
Results
–––––––––––––––––––––––––– 52 –––––––––––––––––––––––––
Figure (8): continued
Xgwm75712.4
Xgwm369
43.7
Xgwm30b
18.1
Xgwm106310.6
Xgwm111015.6
Xgwm1042
57.9
Xgwm7514.8 Xgwm480
33.9
Xgwm162
3AS
3AL
QSr
m.ip
k-3A
(GFS
02)
QSr
m.ip
k-3A
(GFS
03)
QH
t.ipk
-3A
(GFS
02)
QH
t.ipk
-3A
(GFS
03)
QH
t.ipk
-3B
(GFS
03)
QFl
t.ipk
-3B
(GFS
02)
QFl
t.ipk
-3B
(GFS
03)
Xgwm3894.5 Xgwm103418.2
Xgwm49314.1
Xgwm1037
43.2
Xgwm68516.0
Xgwm37610.6
Xgwm101516.9
Xgwm10296.4Xgwm802
20.6
Xgwm93817.8
Xgwm8532.6Xgwm108
36.5
Xgwm705
30.6
Xgwm1266
22.6
Xgwm114b
21.4
Xgwm2470.0Xgwm340
3BS
3BL
QSr
m.ip
k-3B
(GFS
02)
QG
df.ip
k-3B
(GFS
02)
QG
df.ip
k-3B
(GFS
03)
CC
Xgwm75712.4
Xgwm369
43.7
Xgwm30b
18.1
Xgwm106310.6
Xgwm111015.6
Xgwm1042
57.9
Xgwm7514.8 Xgwm480
33.9
Xgwm162
3AS
3AL
QSr
m.ip
k-3A
(GFS
02)
QSr
m.ip
k-3A
(GFS
03)
QH
t.ipk
-3A
(GFS
02)
QH
t.ipk
-3A
(GFS
03)
QH
t.ipk
-3B
(GFS
03)
QFl
t.ipk
-3B
(GFS
02)
QFl
t.ipk
-3B
(GFS
03)
Xgwm3894.5 Xgwm103418.2
Xgwm49314.1
Xgwm1037
43.2
Xgwm68516.0
Xgwm37610.6
Xgwm101516.9
Xgwm10296.4Xgwm802
20.6
Xgwm93817.8
Xgwm8532.6Xgwm108
36.5
Xgwm705
30.6
Xgwm1266
22.6
Xgwm114b
21.4
Xgwm2470.0Xgwm340
3BS
3BL
QSr
m.ip
k-3B
(GFS
02)
QG
df.ip
k-3B
(GFS
02)
QG
df.ip
k-3B
(GFS
03)
Xgwm75712.4
Xgwm369
43.7
Xgwm30b
18.1
Xgwm106310.6
Xgwm111015.6
Xgwm1042
57.9
Xgwm7514.8 Xgwm480
33.9
Xgwm162
3AS
3AL
QSr
m.ip
k-3A
(GFS
02)
QSr
m.ip
k-3A
(GFS
03)
QH
t.ipk
-3A
(GFS
02)
QH
t.ipk
-3A
(GFS
03)
Xgwm75712.4
Xgwm369
43.7
Xgwm30b
18.1
Xgwm106310.6
Xgwm111015.6
Xgwm1042
57.9
Xgwm7514.8 Xgwm480
33.9
Xgwm162
3AS
3AL
Xgwm75712.4
Xgwm369
43.7
Xgwm30b
18.1
Xgwm106310.6
Xgwm111015.6
Xgwm1042
57.9
Xgwm7514.8 Xgwm480
33.9
Xgwm162
Xgwm75712.4
Xgwm369
43.7
Xgwm30b
18.1
Xgwm106310.6
Xgwm111015.6
Xgwm1042
57.9
Xgwm7514.8 Xgwm480
33.9
Xgwm162
3AS
3AL
QSr
m.ip
k-3A
(GFS
02)
QSr
m.ip
k-3A
(GFS
03)
QH
t.ipk
-3A
(GFS
02)
QH
t.ipk
-3A
(GFS
03)
QH
t.ipk
-3B
(GFS
03)
QFl
t.ipk
-3B
(GFS
02)
QFl
t.ipk
-3B
(GFS
03)
Xgwm3894.5 Xgwm103418.2
Xgwm49314.1
Xgwm1037
43.2
Xgwm68516.0
Xgwm37610.6
Xgwm101516.9
Xgwm10296.4Xgwm802
20.6
Xgwm93817.8
Xgwm8532.6Xgwm108
36.5
Xgwm705
30.6
Xgwm1266
22.6
Xgwm114b
21.4
Xgwm2470.0Xgwm340
3BS
3BL
QSr
m.ip
k-3B
(GFS
02)
QG
df.ip
k-3B
(GFS
02)
QG
df.ip
k-3B
(GFS
03)
QH
t.ipk
-3B
(GFS
03)
QFl
t.ipk
-3B
(GFS
02)
QFl
t.ipk
-3B
(GFS
03)
Xgwm3894.5 Xgwm103418.2
Xgwm49314.1
Xgwm1037
43.2
Xgwm68516.0
Xgwm37610.6
Xgwm101516.9
Xgwm10296.4Xgwm802
20.6
Xgwm93817.8
Xgwm8532.6Xgwm108
36.5
Xgwm705
30.6
Xgwm1266
22.6
Xgwm114b
21.4
Xgwm2470.0Xgwm340
3BS
3BL
Xgwm3894.5 Xgwm103418.2
Xgwm49314.1
Xgwm1037
43.2
Xgwm68516.0
Xgwm37610.6
Xgwm101516.9
Xgwm10296.4Xgwm802
20.6
Xgwm93817.8
Xgwm8532.6Xgwm108
36.5
Xgwm705
30.6
Xgwm1266
22.6
Xgwm114b
21.4
Xgwm2470.0Xgwm340
3BS
3BL
QSr
m.ip
k-3B
(GFS
02)
QG
df.ip
k-3B
(GFS
02)
QG
df.ip
k-3B
(GFS
03)
CC
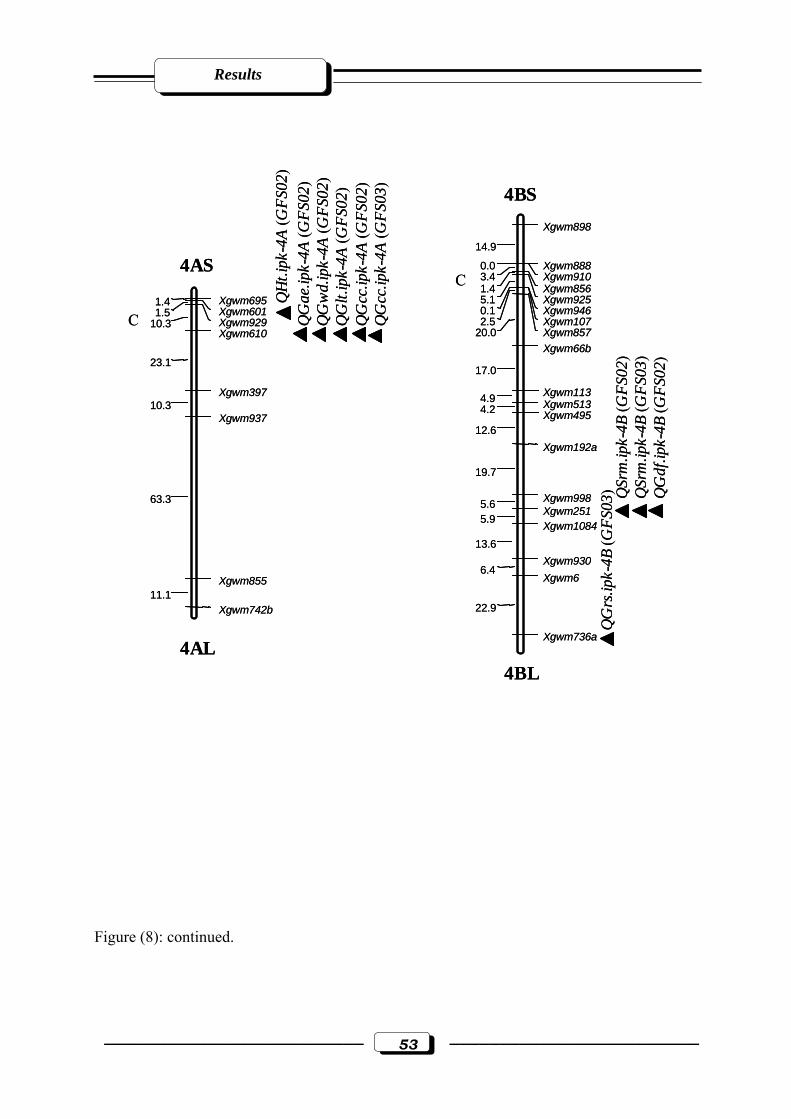
Results
–––––––––––––––––––––––––– 53 –––––––––––––––––––––––––
Figure (8): continued.
Xgwm6951.4Xgwm6011.5Xgwm92910.3Xgwm610
23.1
Xgwm39710.3
Xgwm937
63.3
Xgwm85511.1
Xgwm742b
4AS
4AL
QG
ae.ip
k-4A
(GFS
02)
QG
wd.
ipk-
4A (G
FS02
)Q
Glt.
ipk-
4A (G
FS02
)Q
Gcc
.ipk-
4A (G
FS02
)Q
Gcc
.ipk-
4A (G
FS03
)
QH
t.ipk
-4A
(GFS
02)
C
QG
rs.ip
k-4B
(GFS
03)
Xgwm898
14.9
Xgwm8880.0Xgwm9103.4Xgwm8561.4Xgwm9255.1Xgwm9460.1Xgwm1072.5Xgwm85720.0Xgwm66b
17.0
Xgwm1134.9 Xgwm5134.2 Xgwm49512.6
Xgwm192a
19.7
Xgwm9985.6 Xgwm2515.9 Xgwm1084
13.6Xgwm930
6.4Xgwm6
22.9
Xgwm736a
4BL
4BS
QSr
m.ip
k-4B
(GFS
02)
QSr
m.ip
k-4B
(GFS
03)
QG
df.ip
k-4B
(GFS
02)
CXgwm6951.4Xgwm6011.5Xgwm92910.3Xgwm610
23.1
Xgwm39710.3
Xgwm937
63.3
Xgwm85511.1
Xgwm742b
4AS
4AL
QG
ae.ip
k-4A
(GFS
02)
QG
wd.
ipk-
4A (G
FS02
)Q
Glt.
ipk-
4A (G
FS02
)Q
Gcc
.ipk-
4A (G
FS02
)Q
Gcc
.ipk-
4A (G
FS03
)
QH
t.ipk
-4A
(GFS
02)
C
QG
rs.ip
k-4B
(GFS
03)
Xgwm898
14.9
Xgwm8880.0Xgwm9103.4Xgwm8561.4Xgwm9255.1Xgwm9460.1Xgwm1072.5Xgwm85720.0Xgwm66b
17.0
Xgwm1134.9 Xgwm5134.2 Xgwm49512.6
Xgwm192a
19.7
Xgwm9985.6 Xgwm2515.9 Xgwm1084
13.6Xgwm930
6.4Xgwm6
22.9
Xgwm736a
4BL
4BS
QSr
m.ip
k-4B
(GFS
02)
QSr
m.ip
k-4B
(GFS
03)
QG
df.ip
k-4B
(GFS
02)
C
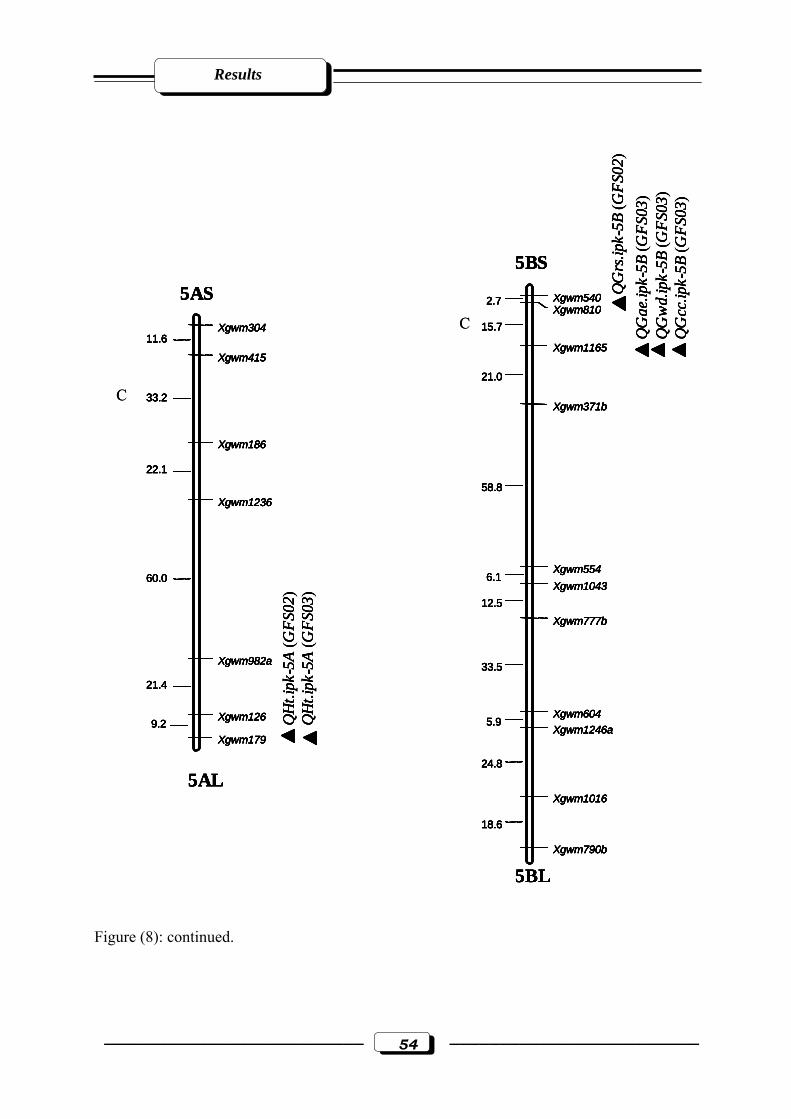
Results
–––––––––––––––––––––––––– 54 –––––––––––––––––––––––––
Figure (8): continued.
Xgwm30411.6
Xgwm415
33.2
Xgwm186
22.1
Xgwm1236
60.0
Xgwm982a
21.4
Xgwm1269.2Xgwm179
5AL
5ASQ
Ht.i
pk-5
A (G
FS02
)Q
Ht.i
pk-5
A (G
FS03
)Xgwm5402.7Xgwm810
15.7
Xgwm1165
21.0
Xgwm371b
58.8
Xgwm5546.1
Xgwm104312.5
Xgwm777b
33.5
Xgwm6045.9
Xgwm1246a
24.8
Xgwm1016
18.6
Xgwm790b
5BL
5BS
QG
ae.ip
k-5B
(GFS
03)
QG
wd.
ipk-
5B (G
FS03
)Q
Gcc
.ipk-
5B (G
FS03
)
QG
rs.ip
k-5B
(GFS
02)
C
CXgwm30411.6
Xgwm415
33.2
Xgwm186
22.1
Xgwm1236
60.0
Xgwm982a
21.4
Xgwm1269.2Xgwm179
5AL
5ASQ
Ht.i
pk-5
A (G
FS02
)Q
Ht.i
pk-5
A (G
FS03
)Xgwm5402.7Xgwm810
15.7
Xgwm1165
21.0
Xgwm371b
58.8
Xgwm5546.1
Xgwm104312.5
Xgwm777b
33.5
Xgwm6045.9
Xgwm1246a
24.8
Xgwm1016
18.6
Xgwm790b
5BL
5BS
QG
ae.ip
k-5B
(GFS
03)
QG
wd.
ipk-
5B (G
FS03
)Q
Gcc
.ipk-
5B (G
FS03
)
QG
rs.ip
k-5B
(GFS
02)
Xgwm30411.6
Xgwm415
33.2
Xgwm186
22.1
Xgwm1236
60.0
Xgwm982a
21.4
Xgwm1269.2Xgwm179
5AL
5ASQ
Ht.i
pk-5
A (G
FS02
)Q
Ht.i
pk-5
A (G
FS03
)Xgwm304
11.6
Xgwm415
33.2
Xgwm186
22.1
Xgwm1236
60.0
Xgwm982a
21.4
Xgwm1269.2Xgwm179
5AL
5AS
Xgwm30411.6
Xgwm415
33.2
Xgwm186
22.1
Xgwm1236
60.0
Xgwm982a
21.4
Xgwm1269.2Xgwm179
Xgwm30411.6
Xgwm415
33.2
Xgwm186
22.1
Xgwm1236
60.0
Xgwm982a
21.4
Xgwm1269.2Xgwm179
5AL
5ASQ
Ht.i
pk-5
A (G
FS02
)Q
Ht.i
pk-5
A (G
FS03
)Xgwm5402.7Xgwm810
15.7
Xgwm1165
21.0
Xgwm371b
58.8
Xgwm5546.1
Xgwm104312.5
Xgwm777b
33.5
Xgwm6045.9
Xgwm1246a
24.8
Xgwm1016
18.6
Xgwm790b
5BL
5BS
QG
ae.ip
k-5B
(GFS
03)
QG
wd.
ipk-
5B (G
FS03
)Q
Gcc
.ipk-
5B (G
FS03
)
QG
rs.ip
k-5B
(GFS
02)
Xgwm5402.7Xgwm810
15.7
Xgwm1165
21.0
Xgwm371b
58.8
Xgwm5546.1
Xgwm104312.5
Xgwm777b
33.5
Xgwm6045.9
Xgwm1246a
24.8
Xgwm1016
18.6
Xgwm790b
5BL
5BS
Xgwm5402.7Xgwm810
15.7
Xgwm1165
21.0
Xgwm371b
58.8
Xgwm5546.1
Xgwm104312.5
Xgwm777b
33.5
Xgwm6045.9
Xgwm1246a
24.8
Xgwm1016
18.6
Xgwm790b
Xgwm5402.7Xgwm810
15.7
Xgwm1165
21.0
Xgwm371b
58.8
Xgwm5546.1
Xgwm104312.5
Xgwm777b
33.5
Xgwm6045.9
Xgwm1246a
24.8
Xgwm1016
18.6
Xgwm790b
5BL
5BS
QG
ae.ip
k-5B
(GFS
03)
QG
wd.
ipk-
5B (G
FS03
)Q
Gcc
.ipk-
5B (G
FS03
)
QG
rs.ip
k-5B
(GFS
02)
C
C
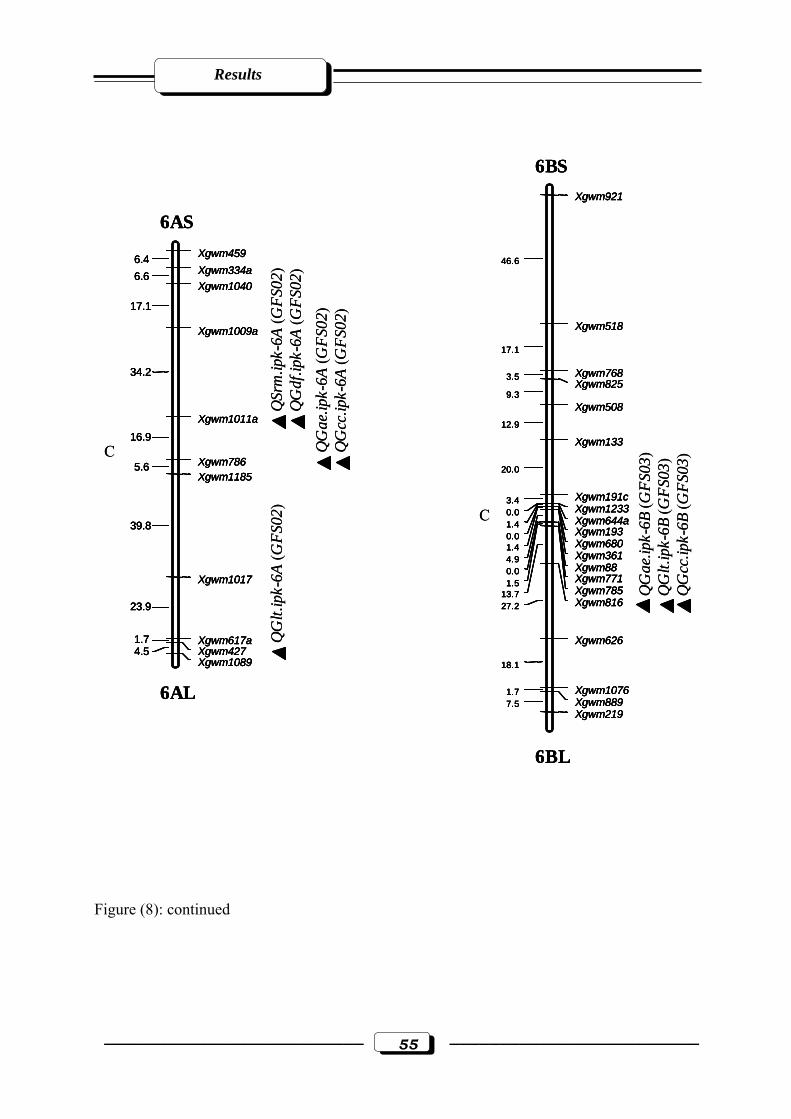
Results
–––––––––––––––––––––––––– 55 –––––––––––––––––––––––––
Figure (8): continued
Xgwm4596.4Xgwm334a6.6Xgwm1040
17.1
Xgwm1009a
34.2
Xgwm1011a16.9
Xgwm7865.6Xgwm1185
39.8
Xgwm1017
23.9
Xgwm617a1.7Xgwm4274.5Xgwm1089
6AL
6AS
QG
lt.ip
k-6A
(GFS
02)
QSr
m.ip
k-6A
(GFS
02)
QG
df.ip
k-6A
(GFS
02)
QG
ae.ip
k-6A
(GFS
02)
QG
cc.ip
k-6A
(GFS
02)
QG
ae.ip
k-6B
(GFS
03)
QG
lt.ip
k-6B
(GFS
03)
QG
cc.ip
k-6B
(GFS
03)
Xgwm921
46.6
Xgwm518
17.1
Xgwm7683.5Xgwm825
9.3Xgwm508
12.9
Xgwm133
20.0
Xgwm191c3.4Xgwm12330.0Xgwm644a1.4Xgwm1930.0Xgwm6801.4Xgwm3614.9Xgwm880.0Xgwm7711.5Xgwm78513.7Xgwm81627.2
Xgwm626
18.1
Xgwm10761.7Xgwm8897.5Xgwm219
6BS
6BL
C
C
Xgwm4596.4Xgwm334a6.6Xgwm1040
17.1
Xgwm1009a
34.2
Xgwm1011a16.9
Xgwm7865.6Xgwm1185
39.8
Xgwm1017
23.9
Xgwm617a1.7Xgwm4274.5Xgwm1089
6AL
6ASXgwm4596.4Xgwm334a6.6Xgwm1040
17.1
Xgwm1009a
34.2
Xgwm1011a16.9
Xgwm7865.6Xgwm1185
39.8
Xgwm1017
23.9
Xgwm617a1.7Xgwm4274.5Xgwm1089
Xgwm4596.4Xgwm334a6.6Xgwm1040
17.1
Xgwm1009a
34.2
Xgwm1011a16.9
Xgwm7865.6Xgwm1185
39.8
Xgwm1017
23.9
Xgwm617a1.7Xgwm4274.5Xgwm1089
6AL
6AS
QG
lt.ip
k-6A
(GFS
02)
QSr
m.ip
k-6A
(GFS
02)
QG
df.ip
k-6A
(GFS
02)
QG
ae.ip
k-6A
(GFS
02)
QG
cc.ip
k-6A
(GFS
02)
QG
ae.ip
k-6B
(GFS
03)
QG
lt.ip
k-6B
(GFS
03)
QG
cc.ip
k-6B
(GFS
03)
Xgwm921
46.6
Xgwm518
17.1
Xgwm7683.5Xgwm825
9.3Xgwm508
12.9
Xgwm133
20.0
Xgwm191c3.4Xgwm12330.0Xgwm644a1.4Xgwm1930.0Xgwm6801.4Xgwm3614.9Xgwm880.0Xgwm7711.5Xgwm78513.7Xgwm81627.2
Xgwm626
18.1
Xgwm10761.7Xgwm8897.5Xgwm219
6BS
6BL
Xgwm921
46.6
Xgwm518
17.1
Xgwm7683.5Xgwm825
9.3Xgwm508
12.9
Xgwm133
20.0
Xgwm191c3.4Xgwm12330.0Xgwm644a1.4Xgwm1930.0Xgwm6801.4Xgwm3614.9Xgwm880.0Xgwm7711.5Xgwm78513.7Xgwm81627.2
Xgwm626
18.1
Xgwm10761.7Xgwm8897.5Xgwm219
Xgwm921
46.6
Xgwm518
17.1
Xgwm7683.5Xgwm825
9.3Xgwm508
12.9
Xgwm133
20.0
Xgwm191c3.4Xgwm12330.0Xgwm644a1.4Xgwm1930.0Xgwm6801.4Xgwm3614.9Xgwm880.0Xgwm7711.5Xgwm78513.7Xgwm81627.2
Xgwm626
18.1
Xgwm10761.7Xgwm8897.5Xgwm219
6BS
6BL
C
C
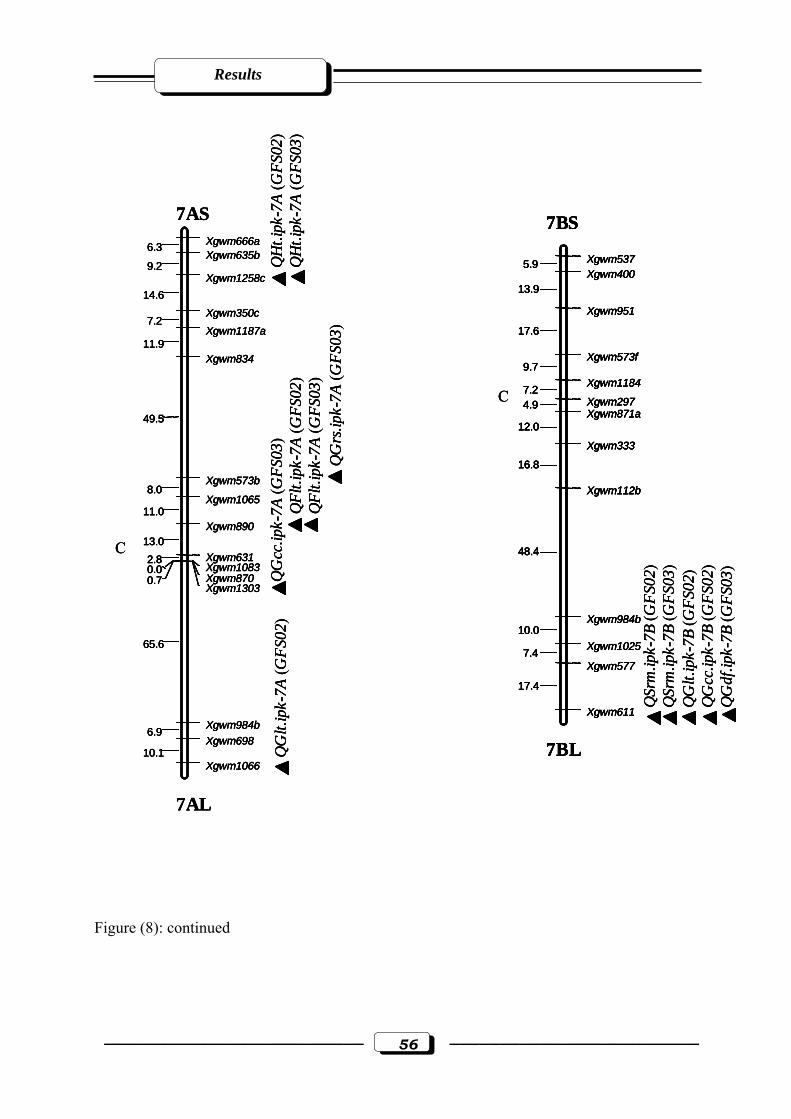
Results
–––––––––––––––––––––––––– 56 –––––––––––––––––––––––––
Figure (8): continued
Xgwm666a6.3Xgwm635b
9.2Xgwm1258c
14.6Xgwm350c
7.2Xgwm1187a
11.9Xgwm834
49.5
Xgwm573b8.0
Xgwm106511.0
Xgwm89013.0
Xgwm6312.8Xgwm10830.0Xgwm8700.7Xgwm1303
65.6
Xgwm984b6.9Xgwm698
10.1Xgwm1066
7AL
7AS
QH
t.ipk
-7A
(GFS
02)
QH
t.ipk
-7A
(GFS
03)
QG
rs.ip
k-7A
(GFS
03)
QG
cc.ip
k-7A
(GFS
03)
QFl
t.ipk
-7A
(GFS
02)
QFl
t.ipk
-7A
(GFS
03)
QG
lt.ip
k-7A
(GFS
02)
QSr
m.ip
k-7B
(GFS
02)
QSr
m.ip
k-7B
(GFS
03)
QG
lt.ip
k-7B
(GFS
02)
QG
cc.ip
k-7B
(GFS
02)
QG
df.ip
k-7B
(GFS
03)
Xgwm5375.9Xgwm400
13.9
Xgwm951
17.6
Xgwm573f9.7
Xgwm11847.2Xgwm2974.9Xgwm871a
12.0
Xgwm333
16.8
Xgwm112b
48.4
Xgwm984b10.0
Xgwm10257.4Xgwm577
17.4
Xgwm611
7BS
7BL
C
C
Xgwm666a6.3Xgwm635b
9.2Xgwm1258c
14.6Xgwm350c
7.2Xgwm1187a
11.9Xgwm834
49.5
Xgwm573b8.0
Xgwm106511.0
Xgwm89013.0
Xgwm6312.8Xgwm10830.0Xgwm8700.7Xgwm1303
65.6
Xgwm984b6.9Xgwm698
10.1Xgwm1066
7AL
7ASXgwm666a6.3Xgwm635b
9.2Xgwm1258c
14.6Xgwm350c
7.2Xgwm1187a
11.9Xgwm834
49.5
Xgwm573b8.0
Xgwm106511.0
Xgwm89013.0
Xgwm6312.8Xgwm10830.0Xgwm8700.7Xgwm1303
65.6
Xgwm984b6.9Xgwm698
10.1Xgwm1066
Xgwm666a6.3Xgwm635b
9.2Xgwm1258c
14.6Xgwm350c
7.2Xgwm1187a
11.9Xgwm834
49.5
Xgwm573b8.0
Xgwm106511.0
Xgwm89013.0
Xgwm6312.8Xgwm10830.0Xgwm8700.7Xgwm1303
65.6
Xgwm984b6.9Xgwm698
10.1Xgwm1066
7AL
7AS
QH
t.ipk
-7A
(GFS
02)
QH
t.ipk
-7A
(GFS
03)
QG
rs.ip
k-7A
(GFS
03)
QG
cc.ip
k-7A
(GFS
03)
QFl
t.ipk
-7A
(GFS
02)
QFl
t.ipk
-7A
(GFS
03)
QG
lt.ip
k-7A
(GFS
02)
QSr
m.ip
k-7B
(GFS
02)
QSr
m.ip
k-7B
(GFS
03)
QG
lt.ip
k-7B
(GFS
02)
QG
cc.ip
k-7B
(GFS
02)
QG
df.ip
k-7B
(GFS
03)
Xgwm5375.9Xgwm400
13.9
Xgwm951
17.6
Xgwm573f9.7
Xgwm11847.2Xgwm2974.9Xgwm871a
12.0
Xgwm333
16.8
Xgwm112b
48.4
Xgwm984b10.0
Xgwm10257.4Xgwm577
17.4
Xgwm611
7BS
7BL
C
C
QH
t.ipk
-7A
(GFS
02)
QH
t.ipk
-7A
(GFS
03)
QG
rs.ip
k-7A
(GFS
03)
QG
cc.ip
k-7A
(GFS
03)
QFl
t.ipk
-7A
(GFS
02)
QFl
t.ipk
-7A
(GFS
03)
QG
lt.ip
k-7A
(GFS
02)
QSr
m.ip
k-7B
(GFS
02)
QSr
m.ip
k-7B
(GFS
03)
QG
lt.ip
k-7B
(GFS
02)
QG
cc.ip
k-7B
(GFS
02)
QG
df.ip
k-7B
(GFS
03)
Xgwm5375.9Xgwm400
13.9
Xgwm951
17.6
Xgwm573f9.7
Xgwm11847.2Xgwm2974.9Xgwm871a
12.0
Xgwm333
16.8
Xgwm112b
48.4
Xgwm984b10.0
Xgwm10257.4Xgwm577
17.4
Xgwm611
7BS
7BL
Xgwm5375.9Xgwm400
13.9
Xgwm951
17.6
Xgwm573f9.7
Xgwm11847.2Xgwm2974.9Xgwm871a
12.0
Xgwm333
16.8
Xgwm112b
48.4
Xgwm984b10.0
Xgwm10257.4Xgwm577
17.4
Xgwm611
Xgwm5375.9Xgwm400
13.9
Xgwm951
17.6
Xgwm573f9.7
Xgwm11847.2Xgwm2974.9Xgwm871a
12.0
Xgwm333
16.8
Xgwm112b
48.4
Xgwm984b10.0
Xgwm10257.4Xgwm577
17.4
Xgwm611
7BS
7BL
C
C
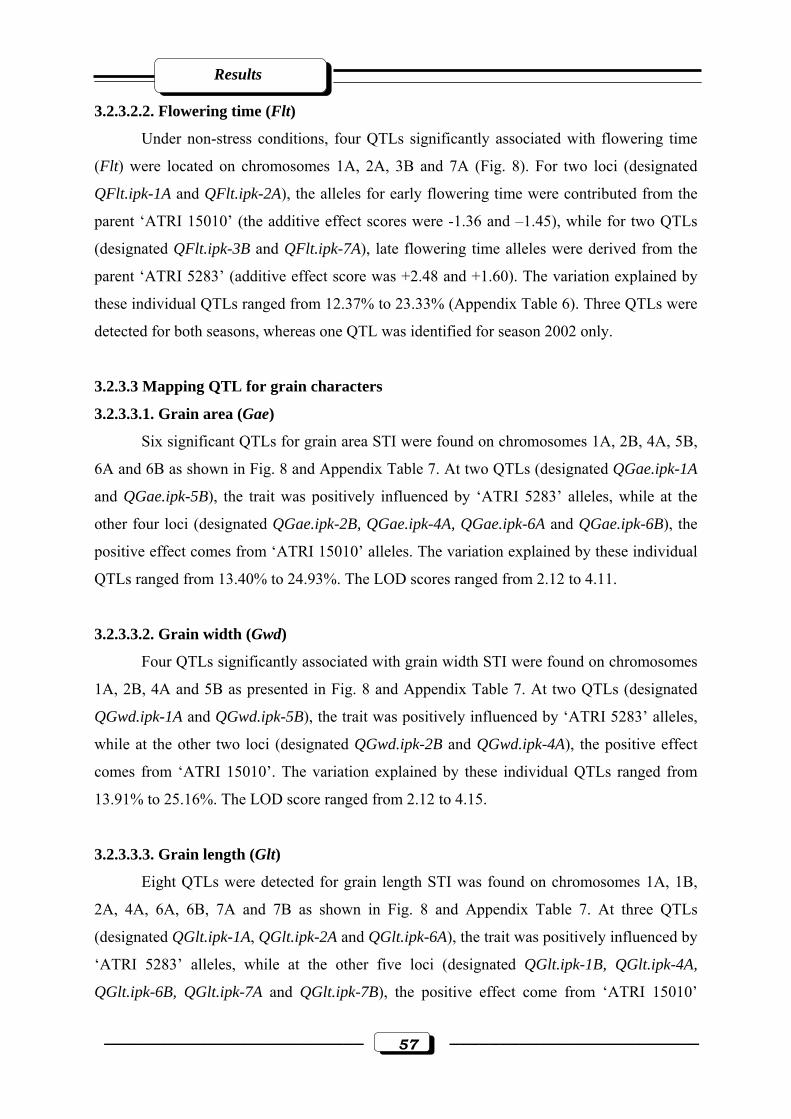
Results
–––––––––––––––––––––––––– 57 –––––––––––––––––––––––––
3.2.3.2.2. Flowering time (Flt)
Under non-stress conditions, four QTLs significantly associated with flowering time
(Flt) were located on chromosomes 1A, 2A, 3B and 7A (Fig. 8). For two loci (designated
QFlt.ipk-1A and QFlt.ipk-2A), the alleles for early flowering time were contributed from the
parent ‘ATRI 15010’ (the additive effect scores were -1.36 and –1.45), while for two QTLs
(designated QFlt.ipk-3B and QFlt.ipk-7A), late flowering time alleles were derived from the
parent ‘ATRI 5283’ (additive effect score was +2.48 and +1.60). The variation explained by
these individual QTLs ranged from 12.37% to 23.33% (Appendix Table 6). Three QTLs were
detected for both seasons, whereas one QTL was identified for season 2002 only.
3.2.3.3 Mapping QTL for grain characters
3.2.3.3.1. Grain area (Gae)
Six significant QTLs for grain area STI were found on chromosomes 1A, 2B, 4A, 5B,
6A and 6B as shown in Fig. 8 and Appendix Table 7. At two QTLs (designated QGae.ipk-1A
and QGae.ipk-5B), the trait was positively influenced by ‘ATRI 5283’ alleles, while at the
other four loci (designated QGae.ipk-2B, QGae.ipk-4A, QGae.ipk-6A and QGae.ipk-6B), the
positive effect comes from ‘ATRI 15010’ alleles. The variation explained by these individual
QTLs ranged from 13.40% to 24.93%. The LOD scores ranged from 2.12 to 4.11.
3.2.3.3.2. Grain width (Gwd)
Four QTLs significantly associated with grain width STI were found on chromosomes
1A, 2B, 4A and 5B as presented in Fig. 8 and Appendix Table 7. At two QTLs (designated
QGwd.ipk-1A and QGwd.ipk-5B), the trait was positively influenced by ‘ATRI 5283’ alleles,
while at the other two loci (designated QGwd.ipk-2B and QGwd.ipk-4A), the positive effect
comes from ‘ATRI 15010’. The variation explained by these individual QTLs ranged from
13.91% to 25.16%. The LOD score ranged from 2.12 to 4.15.
3.2.3.3.3. Grain length (Glt)
Eight QTLs were detected for grain length STI was found on chromosomes 1A, 1B,
2A, 4A, 6A, 6B, 7A and 7B as shown in Fig. 8 and Appendix Table 7. At three QTLs
(designated QGlt.ipk-1A, QGlt.ipk-2A and QGlt.ipk-6A), the trait was positively influenced by
‘ATRI 5283’ alleles, while at the other five loci (designated QGlt.ipk-1B, QGlt.ipk-4A,
QGlt.ipk-6B, QGlt.ipk-7A and QGlt.ipk-7B), the positive effect come from ‘ATRI 15010’

Results
–––––––––––––––––––––––––– 58 –––––––––––––––––––––––––
alleles. The phenotypic variance explained by these individual QTLs ranged from 15.12% to
25.39%. The LOD score ranged from 2.20 to 4.20.
3.2.3.3.4. Grain circumference (Gcc)
Nine QTLs detected for grain circumference STI were found on chromosomes 1A, 1B,
2A, 4A, 5B, 6A, 6B, 7A and 7B (Fig. 8, Appendix Table 8). At two QTLs, (designated
QGcc.ipk-1A and QGcc.ipk-5B), the trait was positively influenced by ‘ATRI 5283’ alleles,
while at the other seven loci (designated as, QGcc.ipk-1B, QGcc.ipk-2A, QGcc.ipk-4A,
QGcc.ipk-6A, QGcc.ipk-6B, QGcc.ipk-7A and QGcc.ipk-7B), the positive effect comes from
‘ATRI 15010’. The phenotypic variance explained by these individual QTLs ranged from
13.04% to 29.92%. The LOD score ranged from 2.03 to 5.10.
3.2.3.3.5. Grain roundness (Grs)
Three QTLs detected for grain roundness STI were found on chromosomes 4B, 5B
and 7A as presented in Fig. 8 and Appendix Table 8. At two QTLs (designated QGrs.ipk-4B
and QGrs.ipk-7A), the trait was positively influenced by ‘ATRI 5283’ alleles, while at one
QTL (designated QGrs.ipk-5B), the positive effect come from ‘ATRI 15010’ alleles. The
phenotypic variance explained by these individual QTLs ranged from 13.72% to 18.14%. The
LOD score ranged from 2.08 to 2.87.
3.2.3.3.6. Grain form-density factor (Gdf)
Five QTLs were detected for grain form-density factor STI located on chromosomes
2A, 3B, 4B, 6A and 7B (Fig. 8, Appendix Table 8). At all QTLs (designated QGdf.ipk-2A,
QGdf.ipk-3B, QGdf.ipk-4B, QGdf.ipk-6A and QGdf.ipk-7B) the trait was positively influenced
by ‘ATRI 5283’ alleles. The phenotypic variance explained by these individual QTLs ranged
from 15.01% to 23.02%. The LOD score ranged from 2.40 to 3.77.
3.3. Analysis of post-anthesis drought tolerance in RILs mapping population
3.3.1 Analysis of field experiments
3.3.1.1 Phenotypic analysis and inheritance of stem reserve mobilization
A set of 114 RILs plus the two parental lines ‘W 7984’ and ‘Opata 85’ were grown in
the field for the purpose of phenotyping stem reserve mobilization in two experiments in
Gatersleben. Plants were treated with potassium iodide (KI, 0.5 % w/v) after 14 days and
stress tolerance index (STI) for 1000-grain weight was measured. The two parental lines
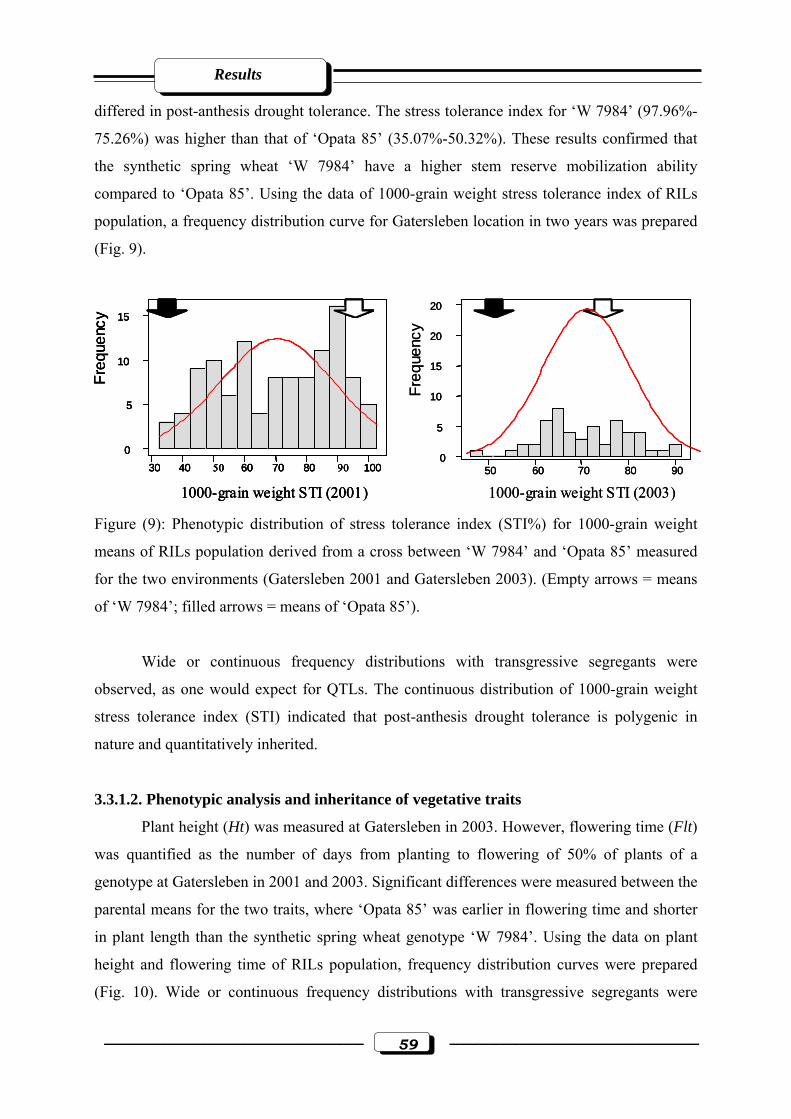
Results
–––––––––––––––––––––––––– 59 –––––––––––––––––––––––––
differed in post-anthesis drought tolerance. The stress tolerance index for ‘W 7984’ (97.96%-
75.26%) was higher than that of ‘Opata 85’ (35.07%-50.32%). These results confirmed that
the synthetic spring wheat ‘W 7984’ have a higher stem reserve mobilization ability
compared to ‘Opata 85’. Using the data of 1000-grain weight stress tolerance index of RILs
population, a frequency distribution curve for Gatersleben location in two years was prepared
(Fig. 9).
Figure (9): Phenotypic distribution of stress tolerance index (STI%) for 1000-grain weight
means of RILs population derived from a cross between ‘W 7984’ and ‘Opata 85’ measured
for the two environments (Gatersleben 2001 and Gatersleben 2003). (Empty arrows = means
of ‘W 7984’; filled arrows = means of ‘Opata 85’).
Wide or continuous frequency distributions with transgressive segregants were
observed, as one would expect for QTLs. The continuous distribution of 1000-grain weight
stress tolerance index (STI) indicated that post-anthesis drought tolerance is polygenic in
nature and quantitatively inherited.
3.3.1.2. Phenotypic analysis and inheritance of vegetative traits
Plant height (Ht) was measured at Gatersleben in 2003. However, flowering time (Flt)
was quantified as the number of days from planting to flowering of 50% of plants of a
genotype at Gatersleben in 2001 and 2003. Significant differences were measured between the
parental means for the two traits, where ‘Opata 85’ was earlier in flowering time and shorter
in plant length than the synthetic spring wheat genotype ‘W 7984’. Using the data on plant
height and flowering time of RILs population, frequency distribution curves were prepared
(Fig. 10). Wide or continuous frequency distributions with transgressive segregants were
Freq
uenc
y
30 40 50 60 70 80 90 1000
5
10
15
1000-grain weight STI (2001)
Freq
uenc
y
50 60 70 80 900
5
10
15
20
20
1000-grain weight STI (2003)
Freq
uenc
y
30 40 50 60 70 80 90 1000
5
10
15
1000-grain weight STI (2001)
Freq
uenc
y
30 40 50 60 70 80 90 1000
5
10
15
30 40 50 60 70 80 90 1000
5
10
15
1000-grain weight STI (2001)
Freq
uenc
y
50 60 70 80 900
5
10
15
20
20
50 60 70 80 900
5
10
15
20
20
1000-grain weight STI (2003)
Results
–––––––––––––––––––––––––– 60 –––––––––––––––––––––––––
observed. The continuous distribution of plant height and flowering time indicated that plant
height and flowering time are polygenic in nature and quantitatively inherited.
Figure (10): Phenotypic distribution of vegetative traits (plant height in cm and flowering
time in days) means of RILs population derived from a cross between ‘W 7984’ and ‘Opata
85’ measured for the two environments (Gatersleben 2001 and Gatersleben 2003). (Empty
arrows = means of ‘W 7984’; filled arrows = means of ‘Opata 85’).
3.3.1.3. Phenotypic analysis and inheritance of grain characters
Stress tolerance index (STI) for all grain characters was measured. The parental data
for grain characters for the two environments Gatersleben field season 2001 and 2003 are
given in Appendix Table 9. Using the data on RILs, a frequency distribution curve was
prepared (Fig. 11). The continuous distribution of STIs for grain traits indicated that these
traits are polygenic in nature and quantitatively inherited. Transgressive segregation occurred
in both directions for all traits. The presence of transgressive segregants for all the grain traits
suggested that the parents selected for this analysis had alleles associated with both low and
high values.
Freq
uenc
y
50 60 70 80 90 100 110 1200
10
20
Plant height (2003)
70 80 900
5
10
15
Flowering time (2001)
Freq
uenc
y
65 66 67 68 69 70 71 72 730
5
10
Freq
uenc
y
Flowering time (2003)
Freq
uenc
y
50 60 70 80 90 100 110 1200
10
20
Plant height (2003)
70 80 900
5
10
15
Flowering time (2001)
Freq
uenc
y
65 66 67 68 69 70 71 72 730
5
10
Freq
uenc
y
Flowering time (2003)

Results
–––––––––––––––––––––––––– 61 –––––––––––––––––––––––––
Figure (11): Phenotypic distribution of stress tolerance index (STI%) for grain characters
(grain area, grain length, grain width, grain circumference; grain roundness and grain form
density factor) means of RILs population derived from a cross between ‘W 7984’ and ‘Opata
85’ measured for the two environments (Gatersleben 2001 and Gatersleben 2003). (Empty
arrows = means of ‘W 7984’; filled arrows = means of ‘Opata 85’).
3.3.2. Mapping QTLs for post-anthesis drought tolerance in RILs
Based on the RILs, a genetic linkage map was constructed consisting of 654 RFLP and
SSRs markers (Röder et al., 1998, unpublished). The map covered a distance of 4,329.64 cM
of the wheat genome comprising 21 chromosomes. All traits were recorded in two years
except plant height for one year. Individual putative QTLs were detected for the stem reserve
mobilization character, vegetative traits and grain characters. Putative QTLs for each trait and
their map positions are shown in Fig. 12. As described before in section 3.2.3., criteria for
definition of a QTL were set in accordance to Fulton et al. (1997, 2000) and Tanksley et al.
Grain area STI (01) Grain area STI (03)
Freq
uenc
y
70 80 90 1000
5
10
15
75 85 950
5
10
15
20
25
Freq
uenc
y
Freq
uenc
y
80 90 1000
5
10
15
Freq
uenc
y
60 65 70 75 80 85 90 950
10
20
Freq
uenc
y
50 60 70 80 90 1000
10
20
30
40
Freq
uenc
y
90 95 1000
10
20
80 90 100Fr
eque
ncy
0
5
10
15
90 95 100
Freq
uenc
y
0
5
10
15
Grain form density STI (01) Grain form density STI (03)
Freq
uenc
y
40 50 60 70 80 90 1000
10
20
Freq
uenc
y60 70 80 90 100
0
5
10
15
20
25
Freq
uenc
y
90 95 1000
5
10
15
Freq
uenc
y
88 90 92 94 96 980
5
10
15
20
25
Grain width STI (01) Grain width STI (03)
Grain length STI (01) Grain length STI (03) Grain roundness STI (01) Grain roundness STI (03)
Grain circumference STI (03)Grain circumference STI (01)
Grain area STI (01) Grain area STI (03)
Freq
uenc
y
70 80 90 1000
5
10
15
Freq
uenc
y
70 80 90 1000
5
10
15
75 85 950
5
10
15
20
25
Freq
uenc
y
0
5
10
15
20
25
Freq
uenc
y
Freq
uenc
y
80 90 1000
5
10
15
Freq
uenc
y
80 90 1000
5
10
15
Freq
uenc
y
60 65 70 75 80 85 90 950
10
20
Freq
uenc
y
60 65 70 75 80 85 90 950
10
20
Freq
uenc
y
50 60 70 80 90 1000
10
20
30
40
Freq
uenc
y
50 60 70 80 90 1000
10
20
30
40
Freq
uenc
y
90 95 1000
10
20
Freq
uenc
y
90 95 1000
10
20
80 90 100Fr
eque
ncy
0
5
10
15
Freq
uenc
y
0
5
10
15
90 95 100
Freq
uenc
y
0
5
10
15
Freq
uenc
y
0
5
10
15
Grain form density STI (01) Grain form density STI (03)
Freq
uenc
y
40 50 60 70 80 90 1000
10
20
Freq
uenc
y
40 50 60 70 80 90 1000
10
20
Freq
uenc
y60 70 80 90 100
0
5
10
15
20
25
Freq
uenc
y60 70 80 90 100
0
5
10
15
20
25
Freq
uenc
y
90 95 1000
5
10
15
Freq
uenc
y
90 95 1000
5
10
15
Freq
uenc
y
88 90 92 94 96 980
5
10
15
20
25
Freq
uenc
y
88 90 92 94 96 980
5
10
15
20
25
Grain width STI (01) Grain width STI (03)
Grain length STI (01) Grain length STI (03) Grain roundness STI (01) Grain roundness STI (03)
Grain circumference STI (03)Grain circumference STI (01)
Results
–––––––––––––––––––––––––– 62 –––––––––––––––––––––––––
(1996). Based on this criteria, a total of 57 putative QTLs were identified, ranging from 4 to 8
QTLs covering the 9 studied characters.
3.3.2.1. Mapping QTLs for stem reserve mobilization (Srm)
Putative QTLs for stem reserve trait are listed in Appendix Table 10 and their map
positions are shown in Fig. 12. Eight QTLs were detected on chromosomes 1A, 1B, 2D, 5B,
5D, 6A, 7B and 7D for stem reserve mobilization, explaining from 10.17% to 42.22% of the
phenotypic variance (PV%) with a LOD score of 1.52 to 3.15. For four QTLs (designated
QSrm.ipk-2D, QSrm.ipk-5B, QSrm.ipk-5D and QSrm.ipk-7D), the ‘W 7984’ alleles increased
the post-anthesis drought tolerance. For the other four QTLs (QSrm.ipk-1A, QSrm.ipk-1B,
QSrm.ipk-6A and QSrm.ipk-7B), the ‘Opata 85’ alleles had an effect that increased stem
reserve mobilization by 10.17% and 24.75%, respectively (Appendix Table 10).
3.3.2.2. Mapping QTLs for vegetative traits
3.3.2.2.1. Plant height (Ht)
Under non-stress conditions, four putative QTLs were significantly associated with
plant height (Appendix Table 11). These four QTLs were located on chromosomes 3B, 4D,
5A and 6D (Fig. 12), where individual QTLs explained between 14.62% and 30.01% of the
phenotypic variance. For two QTLs (QHt.ipk-4D and QHt.ipk-6D), the ‘Opata 85’ alleles
decreased the plant height. For the other two QTLs (QHt.ipk-3B and QHt.ipk-5A) the
synthetic wheat alleles had an effect that increased plant height (Appendix Table 11).
3.3.2.2.2. Flowering time (Flt)
Under non-stress conditions, seven QTLs significantly associated with flowering time
were identified on chromosomes 1A, 2B, 3D, 5B, 5D, 7B and 7D (Fig. 12, Appendix Table
11). For four loci (QFlt.ipk-2B, QFlt.ipk-3D, QFlt.ipk-5B and QFlt.ipk-7D), the alleles for
early flowering time were contributed by the parent ‘Opata 85’ (the additive effect scores
were –0.63 and –1.47), while for the other three QTLs (QFlt.ipk-1A, QFlt.ipk-5D and
QFlt.ipk-7B) the alleles was derived from the synthetic wheat parent ‘W 7984’ (additive
effect score was +0.79 and +1.87). The variation explained by these individual QTLs ranged
from 12.91% to 22.61%.

Results
–––––––––––––––––––––––––– 63 –––––––––––––––––––––––––
3.3.2.3. Mapping QTLs for grain characters
3.3.2.3.1. Grain area (Gae)
Six significant QTLs determining for grain area STI were found on chromosomes 1A,
1B, 2D, 4D, 6B and 7D (Fig. 12, Appendix Table 12). At three QTLs (designated QGae.ipk-
2D, QGae.ipk-4D and QGae.ipk-7D), the trait was positively influenced by the tolerance
parent ‘W 7984’ alleles, while at the other three loci (designated QGae.ipk-1A, QGae.ipk-1B
and QGae.ipk-6B), the positive effect came from ‘Opata 85’. The variation explained by these
individual QTLs ranged from 7.57% to 19.04%. The LOD scores ranged from 1.54 to 1.94.
3.3.2.3.2. Grain width (Gwd)
Eight QTLs significantly associated with grain width STI were found on chromosomes
1B, 1D, 3D, 5A, 5B, 5D, 6D and 7D (Fig. 12, Appendix Table 12). At five QTLs (designated
QGwd.ipk-3D, QGwd.ipk-5B, QGwd.ipk-5D, QGwd.ipk-6D and QGwd.ipk-7D), the trait was
positively influenced by ‘W 7984’ alleles, while at the other three loci (designated QGwd.ipk-
1B, QGwd.ipk-1D and QGwd.ipk-5A), the positive effect came from ‘Opata 85’. The variation
explained by these individual QTLs ranged from 6.15% to 17.48%. The LOD score ranged
from 1.52 to 2.40.
3.3.2.3.3. Grain length (Glt)
Six QTLs detected for grain length STI were found on chromosomes 2D, 3D, 4D, 5A,
7A, and 7D (Fig. 12, Appendix Table 12). At four QTLs (designated QGlt.ipk-2D, QGlt.ipk-
4D, QGlt.ipk-7A and QGlt.ipk-7D), the trait was positively influenced by ‘W 7984’ alleles,
while at the other two loci (designated QGlt.ipk-3D and QGlt.ipk-5A) the positive effect came
from ‘Opata 85’. The phenotypic variance explained by these individual QTLs ranged from
6.35% to 17.37%. The LOD score ranged from 1.50 to 2.78.
3.3.2.3.4. Grain circumference (Gcc)
Seven QTLs detected for grain circumference STI were found on chromosomes 1A,
2B, 2D, 5B, 5D, 6B and 7D (Fig. 12, Appendix Table 13). At two QTLs (designated
QGcc.ipk-2D and QGcc.ipk-7D), the trait was positively influenced by ‘W 7984’ alleles,
while at the other five loci (designated QGcc.ipk-1A, QGcc.ipk-2B, QGcc.ipk-5B, QGcc.ipk-
5D and QGcc.ipk-6B), the positive effect came from ‘Opata 85’. The phenotypic variance
explained by these individual QTLs ranged from 10.10% to 19.24%. The LOD score ranged
from 1.68 to 2.57.
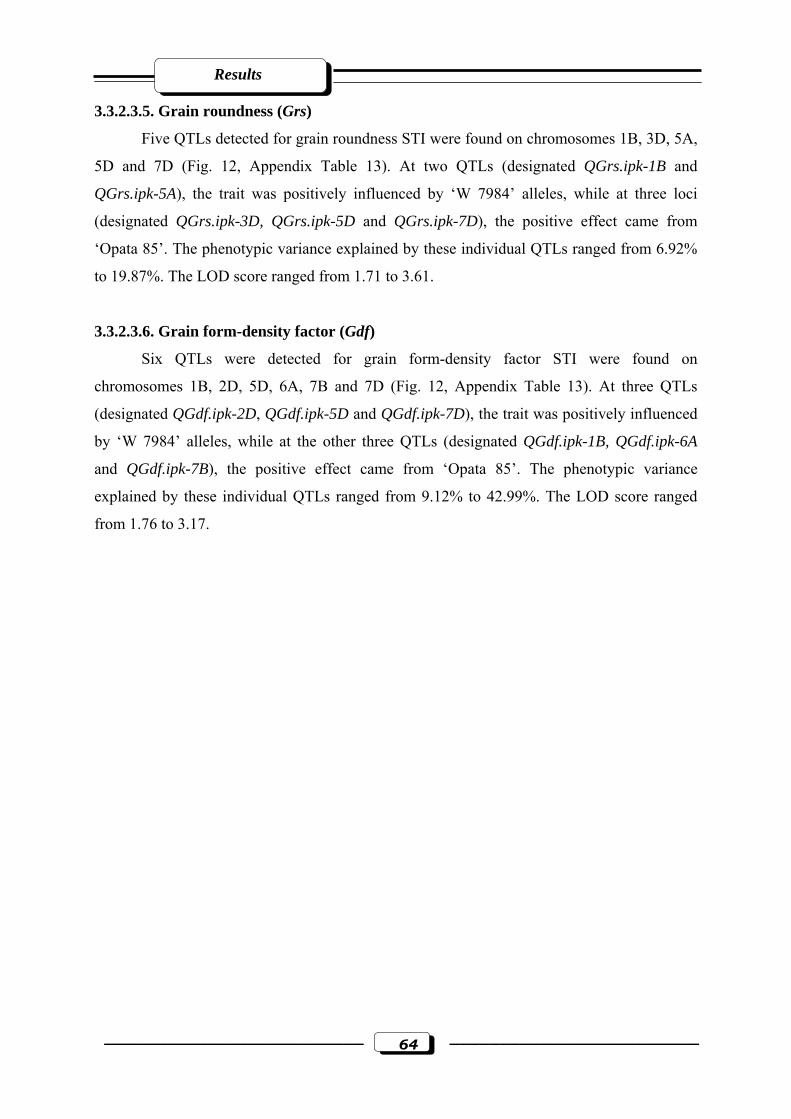
Results
–––––––––––––––––––––––––– 64 –––––––––––––––––––––––––
3.3.2.3.5. Grain roundness (Grs)
Five QTLs detected for grain roundness STI were found on chromosomes 1B, 3D, 5A,
5D and 7D (Fig. 12, Appendix Table 13). At two QTLs (designated QGrs.ipk-1B and
QGrs.ipk-5A), the trait was positively influenced by ‘W 7984’ alleles, while at three loci
(designated QGrs.ipk-3D, QGrs.ipk-5D and QGrs.ipk-7D), the positive effect came from
‘Opata 85’. The phenotypic variance explained by these individual QTLs ranged from 6.92%
to 19.87%. The LOD score ranged from 1.71 to 3.61.
3.3.2.3.6. Grain form-density factor (Gdf)
Six QTLs were detected for grain form-density factor STI were found on
chromosomes 1B, 2D, 5D, 6A, 7B and 7D (Fig. 12, Appendix Table 13). At three QTLs
(designated QGdf.ipk-2D, QGdf.ipk-5D and QGdf.ipk-7D), the trait was positively influenced
by ‘W 7984’ alleles, while at the other three QTLs (designated QGdf.ipk-1B, QGdf.ipk-6A
and QGdf.ipk-7B), the positive effect came from ‘Opata 85’. The phenotypic variance
explained by these individual QTLs ranged from 9.12% to 42.99%. The LOD score ranged
from 1.76 to 3.17.

Results
–––––––––––––––––––––––––– 65 –––––––––––––––––––––––––
Figure (12): RFLP and microsatellite genetic linkage map of the RILs from the cross ‘W
7984’ x ‘Opata 85’. Markers used for base map construction are shown on the right-hand side
of each linkage group and centiMorgans (cM) on the left (Röder et al., 1998, unpublished).
QTLs are indicated by triangles. Symbols for QTLs are presented in Table 3 see section 2.2.5.
in materials and methods. C = estimated centromere position. GFS01 = Gatersleben field
season 2001. GFS03 = Gatersleben field season 2003.
QSr
m.ip
k-1B
(GFS
01)
QG
ae.ip
k-1B
(GFS
01)
QG
wd.
ipk-
1B (G
FS01
)Q
Gdf
.ipk-
1B (G
FS01
)
QG
rs.ip
k-1B
(GFS
01)
QG
rs.ip
k-1B
(GFS
03)
Xksud14e5.7Xgwm1363.1Xksud14b8.1Xgwm33a2.8Xcdo4267.9Xabc156c5.3Xksue18D6.1Xgwm6914.2Xcdo5803.1Xgwm1646.0Xgwm3575.8Xgwm1358.5Xbcd1072
10.5Xcdo312b4.3Xmwg555.5Glu1A
13.4Xbcd265a
10.3Xksuh9d9.2Xgwm497a
17.7
Xgwm666c
29.4
Xcdo11604.8Xmwg6322.6Xgwm99
14.5Xmwg912b3.8Xcdo3932.9Xwg241a2.6Xksue11b
QSr
m.ip
k-1A
(GFS
01)
QG
ae.ip
k-1A
(GFS
01)
QG
cc.ip
k-1A
(GFS
01)1AS
1AL
QFl
t.ipk
-1A
(GFS
03)
Xksud14a6.9Xgwm5506.9Xmwg938b4.9 Xgwm33b1.6 Xgwm264a3.9 Xabc156a3.9 Xksue18Hb4.5 Xpsr6885.3 Xbcd11245.0 Xgwm582b4.0 Xgwm181.5 Xgwm110.0 Xgwm2730.0 Xgwm4131.5 Xcdo11733.0 Xbcd122.7 Xgwm4984.2 Xgwm131a6.6 Xcdo63710.3 Xbcd1150a14.1 Xgwm403
14.8
Xbcd4428.5
Xbcd3042.4Xksug340.9Xgwm1532.7Xgwm274a5.6Xgwm2680.0Xgwm12416.2Xbcd15627.1Xcdo1189
11.7Xcdo346b6.0Xgwm2596.9Xgwm1404.5 Xksui27a
1BS
1BL
QG
wd.
ipk-
1D (G
FS03
)
Xksud14d2.0Xbcd14344.6Xmwg938a5.0Xgwm33c6.1Xmwg837a4.7Xabc156b1.9Xgwm106
13.1Xmwg77
13.3
Xgwm6030.0Xgwm33712.3Xgwm458
22.6
Xcdo89a
24.5
Xcdo312a7.1Xksug551.4Xgwm6422.3Xksug29.4Xbcd1930a
12.6Xcmwg6955.2XAdh
8.1XATPasea
20.7
Xgwm2322.9Xbcd1261a10.8Xksue11e5.1Xksui27b4.2Xwg241b
1DS
1DL
C
C
C
QSr
m.ip
k-1B
(GFS
01)
QG
ae.ip
k-1B
(GFS
01)
QG
wd.
ipk-
1B (G
FS01
)Q
Gdf
.ipk-
1B (G
FS01
)
QG
rs.ip
k-1B
(GFS
01)
QG
rs.ip
k-1B
(GFS
03)
Xksud14e5.7Xgwm1363.1Xksud14b8.1Xgwm33a2.8Xcdo4267.9Xabc156c5.3Xksue18D6.1Xgwm6914.2Xcdo5803.1Xgwm1646.0Xgwm3575.8Xgwm1358.5Xbcd1072
10.5Xcdo312b4.3Xmwg555.5Glu1A
13.4Xbcd265a
10.3Xksuh9d9.2Xgwm497a
17.7
Xgwm666c
29.4
Xcdo11604.8Xmwg6322.6Xgwm99
14.5Xmwg912b3.8Xcdo3932.9Xwg241a2.6Xksue11b
QSr
m.ip
k-1A
(GFS
01)
QG
ae.ip
k-1A
(GFS
01)
QG
cc.ip
k-1A
(GFS
01)1AS
1AL
QFl
t.ipk
-1A
(GFS
03)
Xksud14a6.9Xgwm5506.9Xmwg938b4.9 Xgwm33b1.6 Xgwm264a3.9 Xabc156a3.9 Xksue18Hb4.5 Xpsr6885.3 Xbcd11245.0 Xgwm582b4.0 Xgwm181.5 Xgwm110.0 Xgwm2730.0 Xgwm4131.5 Xcdo11733.0 Xbcd122.7 Xgwm4984.2 Xgwm131a6.6 Xcdo63710.3 Xbcd1150a14.1 Xgwm403
14.8
Xbcd4428.5
Xbcd3042.4Xksug340.9Xgwm1532.7Xgwm274a5.6Xgwm2680.0Xgwm12416.2Xbcd15627.1Xcdo1189
11.7Xcdo346b6.0Xgwm2596.9Xgwm1404.5 Xksui27a
1BS
1BL
QG
wd.
ipk-
1D (G
FS03
)
Xksud14d2.0Xbcd14344.6Xmwg938a5.0Xgwm33c6.1Xmwg837a4.7Xabc156b1.9Xgwm106
13.1Xmwg77
13.3
Xgwm6030.0Xgwm33712.3Xgwm458
22.6
Xcdo89a
24.5
Xcdo312a7.1Xksug551.4Xgwm6422.3Xksug29.4Xbcd1930a
12.6Xcmwg6955.2XAdh
8.1XATPasea
20.7
Xgwm2322.9Xbcd1261a10.8Xksue11e5.1Xksui27b4.2Xwg241b
1DS
1DL
C
C
C
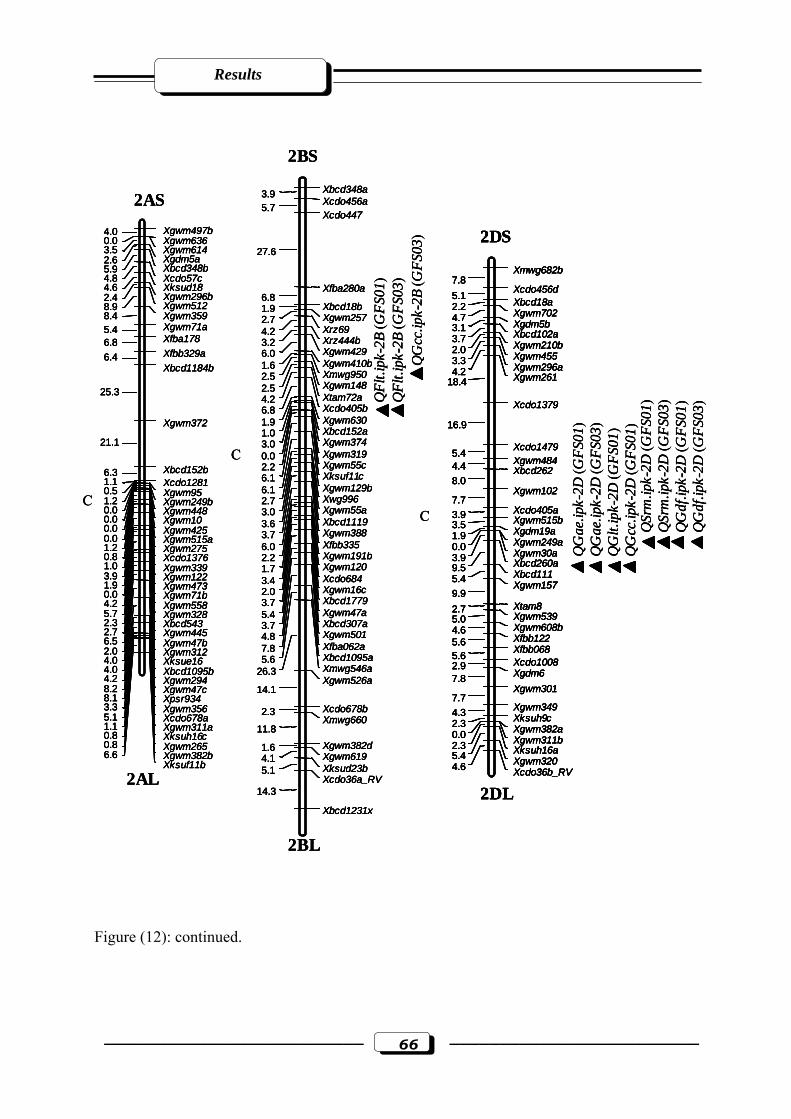
Results
–––––––––––––––––––––––––– 66 –––––––––––––––––––––––––
Figure (12): continued.
Xbcd348a3.9Xcdo456a5.7Xcdo447
27.6
Xfba280a6.8
Xbcd18b1.9Xgwm2572.7Xrz694.2Xrz444b3.2Xgwm4296.0Xgwm410b1.6Xmwg9502.5Xgwm1482.5Xtam72a4.2Xcdo405b6.8Xgwm6301.9Xbcd152a1.0Xgwm3743.0Xgwm3190.0Xgwm55c2.2Xksuf11c6.1Xgwm129b6.1Xwg9962.7Xgwm55a3.0Xbcd11193.6Xgwm3883.7Xfbb3356.0Xgwm191b2.2Xgwm1201.7Xcdo6843.4Xgwm16c2.0Xbcd17793.7Xgwm47a5.4Xbcd307a3.7Xgwm5014.8Xfba062a7.8Xbcd1095a5.6Xmwg546a26.3Xgwm526a
14.1
Xcdo678b2.3Xmwg660
11.8Xgwm382d1.6Xgwm6194.1Xksud23b5.1Xcdo36a_RV
14.3
Xbcd1231x
2BS
2BL
Xgwm497b4.0Xgwm6360.0Xgwm6143.5Xgdm5a2.6Xbcd348b5.9Xcdo57c4.8Xksud184.6Xgwm296b2.4Xgwm5128.9Xgwm3598.4Xgwm71a5.4Xfba1786.8Xfbb329a6.4Xbcd1184b
25.3
Xgwm372
21.1
Xbcd152b6.3Xcdo12811.1Xgwm950.5Xgwm249b1.2Xgwm4480.0Xgwm100.0Xgwm4250.0Xgwm515a0.0Xgwm2751.2Xcdo13760.8Xgwm3391.0Xgwm1223.9Xgwm4731.9Xgwm71b0.0Xgwm5584.2Xgwm3285.7Xbcd5432.3Xgwm4452.7Xgwm47b6.5Xgwm3122.0Xksue164.0Xbcd1095b4.0Xgwm2944.2Xgwm47c8.2Xpsr9348.1Xgwm3563.3Xcdo678a5.1Xgwm311a1.1Xksuh16c0.8Xgwm2650.8Xgwm382b6.6Xksuf11b
2AS
2AL
QFl
t.ipk
-2B
(GFS
01)
QFl
t.ipk
-2B
(GFS
03)
QG
cc.ip
k-2B
(GFS
03)
Xmwg682b7.8
Xcdo456d5.1 Xbcd18a2.2 Xgwm7024.7 Xgdm5b3.1 Xbcd102a3.7 Xgwm210b2.0 Xgwm4553.3 Xgwm296a4.2 Xgwm26118.4
Xcdo1379
16.9
Xcdo14795.4Xgwm4844.4 Xbcd262
8.0Xgwm102
7.7Xcdo405a3.9 Xgwm515b3.5 Xgdm19a1.9 Xgwm249a0.0 Xgwm30a3.9 Xbcd260a9.5 Xbcd1115.4 Xgwm157
9.9Xtam82.7Xgwm5395.0Xgwm608b4.6Xfbb1225.6Xfbb0685.6 Xcdo10082.9Xgdm67.8Xgwm301
7.7Xgwm3494.3 Xksuh9c2.3 Xgwm382a0.0 Xgwm311b2.3 Xksuh16a5.4 Xgwm3204.6 Xcdo36b_RV
2DL
2DS
QG
ae.ip
k-2D
(GFS
01)
QG
ae.ip
k-2D
(GFS
03)
QG
lt.ip
k-2D
(GFS
01)
QG
cc.ip
k-2D
(GFS
01)
QSr
m.ip
k-2D
(GFS
01)
QSr
m.ip
k-2D
(GFS
03)
QG
df.ip
k-2D
(GFS
01)
QG
df.ip
k-2D
(GFS
03)
C
C
C
Xbcd348a3.9Xcdo456a5.7Xcdo447
27.6
Xfba280a6.8
Xbcd18b1.9Xgwm2572.7Xrz694.2Xrz444b3.2Xgwm4296.0Xgwm410b1.6Xmwg9502.5Xgwm1482.5Xtam72a4.2Xcdo405b6.8Xgwm6301.9Xbcd152a1.0Xgwm3743.0Xgwm3190.0Xgwm55c2.2Xksuf11c6.1Xgwm129b6.1Xwg9962.7Xgwm55a3.0Xbcd11193.6Xgwm3883.7Xfbb3356.0Xgwm191b2.2Xgwm1201.7Xcdo6843.4Xgwm16c2.0Xbcd17793.7Xgwm47a5.4Xbcd307a3.7Xgwm5014.8Xfba062a7.8Xbcd1095a5.6Xmwg546a26.3Xgwm526a
14.1
Xcdo678b2.3Xmwg660
11.8Xgwm382d1.6Xgwm6194.1Xksud23b5.1Xcdo36a_RV
14.3
Xbcd1231x
2BS
2BL
Xbcd348a3.9Xcdo456a5.7Xcdo447
27.6
Xfba280a6.8
Xbcd18b1.9Xgwm2572.7Xrz694.2Xrz444b3.2Xgwm4296.0Xgwm410b1.6Xmwg9502.5Xgwm1482.5Xtam72a4.2Xcdo405b6.8Xgwm6301.9Xbcd152a1.0Xgwm3743.0Xgwm3190.0Xgwm55c2.2Xksuf11c6.1Xgwm129b6.1Xwg9962.7Xgwm55a3.0Xbcd11193.6Xgwm3883.7Xfbb3356.0Xgwm191b2.2Xgwm1201.7Xcdo6843.4Xgwm16c2.0Xbcd17793.7Xgwm47a5.4Xbcd307a3.7Xgwm5014.8Xfba062a7.8Xbcd1095a5.6Xmwg546a26.3Xgwm526a
14.1
Xcdo678b2.3Xmwg660
11.8Xgwm382d1.6Xgwm6194.1Xksud23b5.1Xcdo36a_RV
14.3
Xbcd1231x
2BS
2BL
Xgwm497b4.0Xgwm6360.0Xgwm6143.5Xgdm5a2.6Xbcd348b5.9Xcdo57c4.8Xksud184.6Xgwm296b2.4Xgwm5128.9Xgwm3598.4Xgwm71a5.4Xfba1786.8Xfbb329a6.4Xbcd1184b
25.3
Xgwm372
21.1
Xbcd152b6.3Xcdo12811.1Xgwm950.5Xgwm249b1.2Xgwm4480.0Xgwm100.0Xgwm4250.0Xgwm515a0.0Xgwm2751.2Xcdo13760.8Xgwm3391.0Xgwm1223.9Xgwm4731.9Xgwm71b0.0Xgwm5584.2Xgwm3285.7Xbcd5432.3Xgwm4452.7Xgwm47b6.5Xgwm3122.0Xksue164.0Xbcd1095b4.0Xgwm2944.2Xgwm47c8.2Xpsr9348.1Xgwm3563.3Xcdo678a5.1Xgwm311a1.1Xksuh16c0.8Xgwm2650.8Xgwm382b6.6Xksuf11b
2AS
2AL
QFl
t.ipk
-2B
(GFS
01)
QFl
t.ipk
-2B
(GFS
03)
QG
cc.ip
k-2B
(GFS
03)
Xmwg682b7.8
Xcdo456d5.1 Xbcd18a2.2 Xgwm7024.7 Xgdm5b3.1 Xbcd102a3.7 Xgwm210b2.0 Xgwm4553.3 Xgwm296a4.2 Xgwm26118.4
Xcdo1379
16.9
Xcdo14795.4Xgwm4844.4 Xbcd262
8.0Xgwm102
7.7Xcdo405a3.9 Xgwm515b3.5 Xgdm19a1.9 Xgwm249a0.0 Xgwm30a3.9 Xbcd260a9.5 Xbcd1115.4 Xgwm157
9.9Xtam82.7Xgwm5395.0Xgwm608b4.6Xfbb1225.6Xfbb0685.6 Xcdo10082.9Xgdm67.8Xgwm301
7.7Xgwm3494.3 Xksuh9c2.3 Xgwm382a0.0 Xgwm311b2.3 Xksuh16a5.4 Xgwm3204.6 Xcdo36b_RV
2DL
2DS
QG
ae.ip
k-2D
(GFS
01)
QG
ae.ip
k-2D
(GFS
03)
QG
lt.ip
k-2D
(GFS
01)
QG
cc.ip
k-2D
(GFS
01)
QSr
m.ip
k-2D
(GFS
01)
QSr
m.ip
k-2D
(GFS
03)
QG
df.ip
k-2D
(GFS
01)
QG
df.ip
k-2D
(GFS
03)
C
C
C
Xgwm497b4.0Xgwm6360.0Xgwm6143.5Xgdm5a2.6Xbcd348b5.9Xcdo57c4.8Xksud184.6Xgwm296b2.4Xgwm5128.9Xgwm3598.4Xgwm71a5.4Xfba1786.8Xfbb329a6.4Xbcd1184b
25.3
Xgwm372
21.1
Xbcd152b6.3Xcdo12811.1Xgwm950.5Xgwm249b1.2Xgwm4480.0Xgwm100.0Xgwm4250.0Xgwm515a0.0Xgwm2751.2Xcdo13760.8Xgwm3391.0Xgwm1223.9Xgwm4731.9Xgwm71b0.0Xgwm5584.2Xgwm3285.7Xbcd5432.3Xgwm4452.7Xgwm47b6.5Xgwm3122.0Xksue164.0Xbcd1095b4.0Xgwm2944.2Xgwm47c8.2Xpsr9348.1Xgwm3563.3Xcdo678a5.1Xgwm311a1.1Xksuh16c0.8Xgwm2650.8Xgwm382b6.6Xksuf11b
2AS
2AL
QFl
t.ipk
-2B
(GFS
01)
QFl
t.ipk
-2B
(GFS
03)
QG
cc.ip
k-2B
(GFS
03)
Xmwg682b7.8
Xcdo456d5.1 Xbcd18a2.2 Xgwm7024.7 Xgdm5b3.1 Xbcd102a3.7 Xgwm210b2.0 Xgwm4553.3 Xgwm296a4.2 Xgwm26118.4
Xcdo1379
16.9
Xcdo14795.4Xgwm4844.4 Xbcd262
8.0Xgwm102
7.7Xcdo405a3.9 Xgwm515b3.5 Xgdm19a1.9 Xgwm249a0.0 Xgwm30a3.9 Xbcd260a9.5 Xbcd1115.4 Xgwm157
9.9Xtam82.7Xgwm5395.0Xgwm608b4.6Xfbb1225.6Xfbb0685.6 Xcdo10082.9Xgdm67.8Xgwm301
7.7Xgwm3494.3 Xksuh9c2.3 Xgwm382a0.0 Xgwm311b2.3 Xksuh16a5.4 Xgwm3204.6 Xcdo36b_RV
2DL
2DS
Xmwg682b7.8
Xcdo456d5.1 Xbcd18a2.2 Xgwm7024.7 Xgdm5b3.1 Xbcd102a3.7 Xgwm210b2.0 Xgwm4553.3 Xgwm296a4.2 Xgwm26118.4
Xcdo1379
16.9
Xcdo14795.4Xgwm4844.4 Xbcd262
8.0Xgwm102
7.7Xcdo405a3.9 Xgwm515b3.5 Xgdm19a1.9 Xgwm249a0.0 Xgwm30a3.9 Xbcd260a9.5 Xbcd1115.4 Xgwm157
9.9Xtam82.7Xgwm5395.0Xgwm608b4.6Xfbb1225.6Xfbb0685.6 Xcdo10082.9Xgdm67.8Xgwm301
7.7Xgwm3494.3 Xksuh9c2.3 Xgwm382a0.0 Xgwm311b2.3 Xksuh16a5.4 Xgwm3204.6 Xcdo36b_RV
2DL
2DS
QG
ae.ip
k-2D
(GFS
01)
QG
ae.ip
k-2D
(GFS
03)
QG
lt.ip
k-2D
(GFS
01)
QG
cc.ip
k-2D
(GFS
01)
QSr
m.ip
k-2D
(GFS
01)
QSr
m.ip
k-2D
(GFS
03)
QG
df.ip
k-2D
(GFS
01)
QG
df.ip
k-2D
(GFS
03)
C
C
C
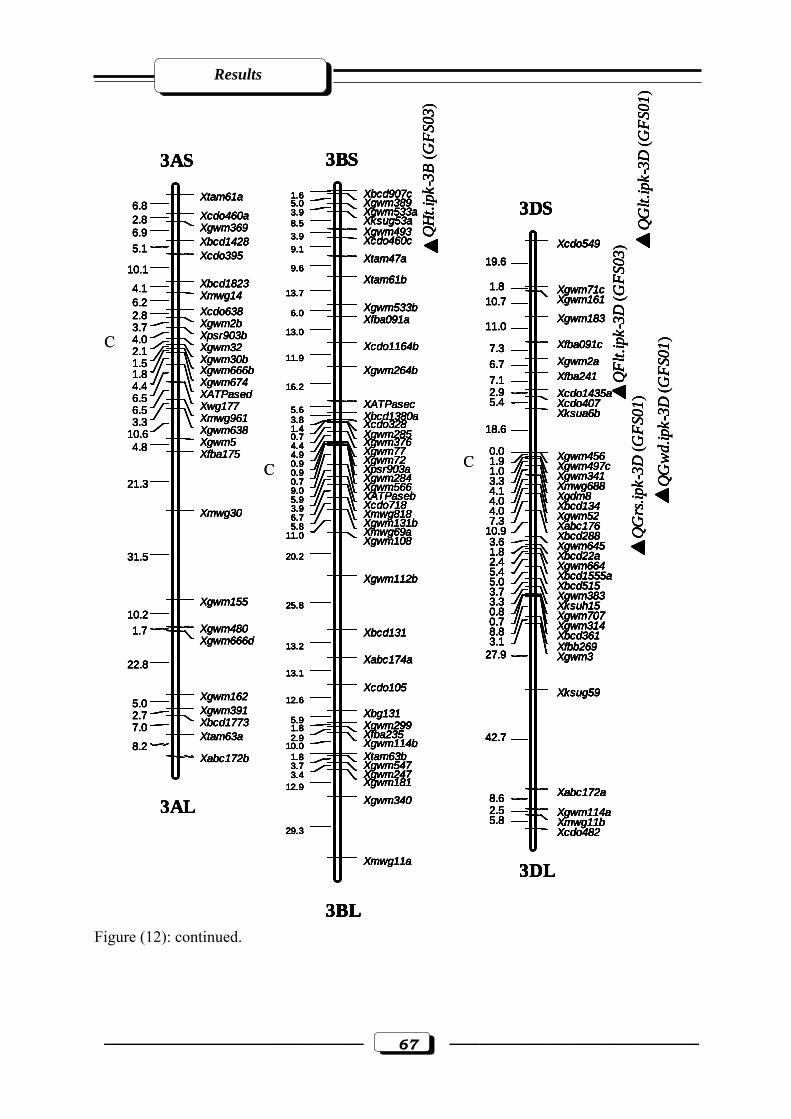
Results
–––––––––––––––––––––––––– 67 –––––––––––––––––––––––––
Figure (12): continued.
Xtam61a6.8
Xcdo460a2.8Xgwm3696.9Xbcd14285.1 Xcdo395
10.1Xbcd18234.1 Xmwg146.2Xcdo6382.8Xgwm2b3.7Xpsr903b4.0Xgwm322.1Xgwm30b1.5 Xgwm666b1.8Xgwm6744.4XATPased6.5Xwg1776.5Xmwg9613.3Xgwm63810.6Xgwm54.8 Xfba175
21.3
Xmwg30
31.5
Xgwm15510.2
Xgwm4801.7Xgwm666d
22.8
Xgwm1625.0 Xgwm3912.7 Xbcd17737.0Xtam63a
8.2Xabc172b
3AS
3AL
Xbcd907c1.6Xgwm3895.0Xgwm533a3.9Xksug53a8.5Xgwm4933.9 Xcdo460c
9.1Xtam47a
9.6Xtam61b
13.7
Xgwm533b6.0 Xfba091a13.0
Xcdo1164b11.9
Xgwm264b16.2
XATPasec5.6 Xbcd1380a3.8 Xcdo3281.4 Xgwm2850.7 Xgwm3764.4 Xgwm774.9 Xgwm720.9 Xpsr903a0.9 Xgwm2840.7 Xgwm5669.0 XATPaseb5.9 Xcdo7183.9 Xmwg8186.7 Xgwm131b5.8 Xmwg69a11.0 Xgwm10820.2
Xgwm112b
25.8
Xbcd13113.2
Xabc174a13.1
Xcdo10512.6
Xbg1315.9 Xgwm2991.8 Xfba2352.9 Xgwm114b10.0
Xtam63b1.8Xgwm5473.7Xgwm2473.4Xgwm18112.9Xgwm340
29.3
Xmwg11a
3BL
3BS
QH
t.ipk
-3B
(GFS
03)
QG
rs.ip
k-3D
(GFS
01)
Xcdo54919.6
Xgwm71c1.8Xgwm16110.7Xgwm183
11.0Xfba091c7.3Xgwm2a6.7Xfba2417.1Xcdo1435a2.9Xcdo4075.4Xksua6b
18.6
Xgwm4560.0Xgwm497c1.9Xgwm3411.0Xmwg6883.3Xgdm84.1Xbcd1344.0Xgwm524.0Xabc1767.3Xbcd28810.9Xgwm6453.6Xbcd22a1.8Xgwm6642.4Xbcd1555a5.4Xbcd5155.0Xgwm3833.7Xksuh153.3Xgwm7070.8Xgwm3140.7Xbcd3618.8Xfbb2693.1Xgwm327.9
Xksug59
42.7
Xabc172a8.6Xgwm114a2.5Xmwg11b5.8Xcdo482
3DS
3DL
QG
wd.
ipk-
3D (G
FS01
)
QFl
t.ipk
-3D
(GFS
03)
QG
lt.ip
k-3D
(GFS
01)
C
C C
Xtam61a6.8
Xcdo460a2.8Xgwm3696.9Xbcd14285.1 Xcdo395
10.1Xbcd18234.1 Xmwg146.2Xcdo6382.8Xgwm2b3.7Xpsr903b4.0Xgwm322.1Xgwm30b1.5 Xgwm666b1.8Xgwm6744.4XATPased6.5Xwg1776.5Xmwg9613.3Xgwm63810.6Xgwm54.8 Xfba175
21.3
Xmwg30
31.5
Xgwm15510.2
Xgwm4801.7Xgwm666d
22.8
Xgwm1625.0 Xgwm3912.7 Xbcd17737.0Xtam63a
8.2Xabc172b
3AS
3AL
Xbcd907c1.6Xgwm3895.0Xgwm533a3.9Xksug53a8.5Xgwm4933.9 Xcdo460c
9.1Xtam47a
9.6Xtam61b
13.7
Xgwm533b6.0 Xfba091a13.0
Xcdo1164b11.9
Xgwm264b16.2
XATPasec5.6 Xbcd1380a3.8 Xcdo3281.4 Xgwm2850.7 Xgwm3764.4 Xgwm774.9 Xgwm720.9 Xpsr903a0.9 Xgwm2840.7 Xgwm5669.0 XATPaseb5.9 Xcdo7183.9 Xmwg8186.7 Xgwm131b5.8 Xmwg69a11.0 Xgwm10820.2
Xgwm112b
25.8
Xbcd13113.2
Xabc174a13.1
Xcdo10512.6
Xbg1315.9 Xgwm2991.8 Xfba2352.9 Xgwm114b10.0
Xtam63b1.8Xgwm5473.7Xgwm2473.4Xgwm18112.9Xgwm340
29.3
Xmwg11a
3BL
3BS
QH
t.ipk
-3B
(GFS
03)
QG
rs.ip
k-3D
(GFS
01)
Xcdo54919.6
Xgwm71c1.8Xgwm16110.7Xgwm183
11.0Xfba091c7.3Xgwm2a6.7Xfba2417.1Xcdo1435a2.9Xcdo4075.4Xksua6b
18.6
Xgwm4560.0Xgwm497c1.9Xgwm3411.0Xmwg6883.3Xgdm84.1Xbcd1344.0Xgwm524.0Xabc1767.3Xbcd28810.9Xgwm6453.6Xbcd22a1.8Xgwm6642.4Xbcd1555a5.4Xbcd5155.0Xgwm3833.7Xksuh153.3Xgwm7070.8Xgwm3140.7Xbcd3618.8Xfbb2693.1Xgwm327.9
Xksug59
42.7
Xabc172a8.6Xgwm114a2.5Xmwg11b5.8Xcdo482
3DS
3DL
QG
wd.
ipk-
3D (G
FS01
)
QFl
t.ipk
-3D
(GFS
03)
QG
lt.ip
k-3D
(GFS
01)
Xtam61a6.8
Xcdo460a2.8Xgwm3696.9Xbcd14285.1 Xcdo395
10.1Xbcd18234.1 Xmwg146.2Xcdo6382.8Xgwm2b3.7Xpsr903b4.0Xgwm322.1Xgwm30b1.5 Xgwm666b1.8Xgwm6744.4XATPased6.5Xwg1776.5Xmwg9613.3Xgwm63810.6Xgwm54.8 Xfba175
21.3
Xmwg30
31.5
Xgwm15510.2
Xgwm4801.7Xgwm666d
22.8
Xgwm1625.0 Xgwm3912.7 Xbcd17737.0Xtam63a
8.2Xabc172b
3AS
3AL
Xtam61a6.8
Xcdo460a2.8Xgwm3696.9Xbcd14285.1 Xcdo395
10.1Xbcd18234.1 Xmwg146.2Xcdo6382.8Xgwm2b3.7Xpsr903b4.0Xgwm322.1Xgwm30b1.5 Xgwm666b1.8Xgwm6744.4XATPased6.5Xwg1776.5Xmwg9613.3Xgwm63810.6Xgwm54.8 Xfba175
21.3
Xmwg30
31.5
Xgwm15510.2
Xgwm4801.7Xgwm666d
22.8
Xgwm1625.0 Xgwm3912.7 Xbcd17737.0Xtam63a
8.2Xabc172b
3AS
3AL
Xbcd907c1.6Xgwm3895.0Xgwm533a3.9Xksug53a8.5Xgwm4933.9 Xcdo460c
9.1Xtam47a
9.6Xtam61b
13.7
Xgwm533b6.0 Xfba091a13.0
Xcdo1164b11.9
Xgwm264b16.2
XATPasec5.6 Xbcd1380a3.8 Xcdo3281.4 Xgwm2850.7 Xgwm3764.4 Xgwm774.9 Xgwm720.9 Xpsr903a0.9 Xgwm2840.7 Xgwm5669.0 XATPaseb5.9 Xcdo7183.9 Xmwg8186.7 Xgwm131b5.8 Xmwg69a11.0 Xgwm10820.2
Xgwm112b
25.8
Xbcd13113.2
Xabc174a13.1
Xcdo10512.6
Xbg1315.9 Xgwm2991.8 Xfba2352.9 Xgwm114b10.0
Xtam63b1.8Xgwm5473.7Xgwm2473.4Xgwm18112.9Xgwm340
29.3
Xmwg11a
3BL
3BS
QH
t.ipk
-3B
(GFS
03)
Xbcd907c1.6Xgwm3895.0Xgwm533a3.9Xksug53a8.5Xgwm4933.9 Xcdo460c
9.1Xtam47a
9.6Xtam61b
13.7
Xgwm533b6.0 Xfba091a13.0
Xcdo1164b11.9
Xgwm264b16.2
XATPasec5.6 Xbcd1380a3.8 Xcdo3281.4 Xgwm2850.7 Xgwm3764.4 Xgwm774.9 Xgwm720.9 Xpsr903a0.9 Xgwm2840.7 Xgwm5669.0 XATPaseb5.9 Xcdo7183.9 Xmwg8186.7 Xgwm131b5.8 Xmwg69a11.0 Xgwm10820.2
Xgwm112b
25.8
Xbcd13113.2
Xabc174a13.1
Xcdo10512.6
Xbg1315.9 Xgwm2991.8 Xfba2352.9 Xgwm114b10.0
Xtam63b1.8Xgwm5473.7Xgwm2473.4Xgwm18112.9Xgwm340
29.3
Xmwg11a
3BL
3BS
Xbcd907c1.6Xgwm3895.0Xgwm533a3.9Xksug53a8.5Xgwm4933.9 Xcdo460c
9.1Xtam47a
9.6Xtam61b
13.7
Xgwm533b6.0 Xfba091a13.0
Xcdo1164b11.9
Xgwm264b16.2
XATPasec5.6 Xbcd1380a3.8 Xcdo3281.4 Xgwm2850.7 Xgwm3764.4 Xgwm774.9 Xgwm720.9 Xpsr903a0.9 Xgwm2840.7 Xgwm5669.0 XATPaseb5.9 Xcdo7183.9 Xmwg8186.7 Xgwm131b5.8 Xmwg69a11.0 Xgwm10820.2
Xgwm112b
25.8
Xbcd13113.2
Xabc174a13.1
Xcdo10512.6
Xbg1315.9 Xgwm2991.8 Xfba2352.9 Xgwm114b10.0
Xtam63b1.8Xgwm5473.7Xgwm2473.4Xgwm18112.9Xgwm340
29.3
Xmwg11a
3BL
3BS
QH
t.ipk
-3B
(GFS
03)
QG
rs.ip
k-3D
(GFS
01)
Xcdo54919.6
Xgwm71c1.8Xgwm16110.7Xgwm183
11.0Xfba091c7.3Xgwm2a6.7Xfba2417.1Xcdo1435a2.9Xcdo4075.4Xksua6b
18.6
Xgwm4560.0Xgwm497c1.9Xgwm3411.0Xmwg6883.3Xgdm84.1Xbcd1344.0Xgwm524.0Xabc1767.3Xbcd28810.9Xgwm6453.6Xbcd22a1.8Xgwm6642.4Xbcd1555a5.4Xbcd5155.0Xgwm3833.7Xksuh153.3Xgwm7070.8Xgwm3140.7Xbcd3618.8Xfbb2693.1Xgwm327.9
Xksug59
42.7
Xabc172a8.6Xgwm114a2.5Xmwg11b5.8Xcdo482
3DS
3DL
QG
wd.
ipk-
3D (G
FS01
)
QFl
t.ipk
-3D
(GFS
03)
QG
lt.ip
k-3D
(GFS
01)
QG
rs.ip
k-3D
(GFS
01)
Xcdo54919.6
Xgwm71c1.8Xgwm16110.7Xgwm183
11.0Xfba091c7.3Xgwm2a6.7Xfba2417.1Xcdo1435a2.9Xcdo4075.4Xksua6b
18.6
Xgwm4560.0Xgwm497c1.9Xgwm3411.0Xmwg6883.3Xgdm84.1Xbcd1344.0Xgwm524.0Xabc1767.3Xbcd28810.9Xgwm6453.6Xbcd22a1.8Xgwm6642.4Xbcd1555a5.4Xbcd5155.0Xgwm3833.7Xksuh153.3Xgwm7070.8Xgwm3140.7Xbcd3618.8Xfbb2693.1Xgwm327.9
Xksug59
42.7
Xabc172a8.6Xgwm114a2.5Xmwg11b5.8Xcdo482
3DS
3DL
Xcdo54919.6
Xgwm71c1.8Xgwm16110.7Xgwm183
11.0Xfba091c7.3Xgwm2a6.7Xfba2417.1Xcdo1435a2.9Xcdo4075.4Xksua6b
18.6
Xgwm4560.0Xgwm497c1.9Xgwm3411.0Xmwg6883.3Xgdm84.1Xbcd1344.0Xgwm524.0Xabc1767.3Xbcd28810.9Xgwm6453.6Xbcd22a1.8Xgwm6642.4Xbcd1555a5.4Xbcd5155.0Xgwm3833.7Xksuh153.3Xgwm7070.8Xgwm3140.7Xbcd3618.8Xfbb2693.1Xgwm327.9
Xksug59
42.7
Xabc172a8.6Xgwm114a2.5Xmwg11b5.8Xcdo482
3DS
3DL
QG
wd.
ipk-
3D (G
FS01
)
QFl
t.ipk
-3D
(GFS
03)
QG
lt.ip
k-3D
(GFS
01)
C
C C

Results
–––––––––––––––––––––––––– 68 –––––––––––––––––––––––––
Figure (12): continued.
Xfba078b6.0Xfba3202.8Xgwm43.4Xgwm6013.5Xgwm165a3.4Xcdo13872.8Xksuf8a3.4Xgwm6956.2Xbcd402b2.7Xgwm6106.7Xksug12b3.0Xwg6225.7Xgwm397
18.1
Xgwm63715.7
Xmwg549b3.0 Xbcd1670a5.5 Xmwg710c3.7 Xcdo475a4.6 Xksud93.5 Xbcd1302.9 Xfba2318.0Xcdo545a4.9 Xgwm160
4AS
4AL
Xfba078a8.8
Xfba008a5.0
Xgwm3682.3Xgwm7103.9Xcdo7957.7Xbcd12623.6Xgwm1071.1Xgwm1130.9Xgwm66b2.8Xgwm5131.3Xbcd12651.5Xgwm4952.9Xgwm165c3.7Xgwm1491.0Xcdo14013.4Xcdo1312a4.1Xfbb178a2.2Xgwm25112.5Xfbb067d8.4Xfba177a6.7Xbcd402a14.1Xgwm538
21.2
Xgwm6
4BL
4BS
QG
lt.ip
k-4D
(GFS
01)
Xmwg634a
32.0
Xbcd265b8.6Xbcd3273.0Xgdm612.7Xksuf8b0.8Xgwm608a5.3Xgwm165b9.1Xbcd15b5.3Xfbb178b8.2Xcdo1312b
11.0Xbcd1431e
15.5
Xfbb226e7.5Xgwm1943.5Xfba177b
10.7Xgwm6241.2Xcdo9494.4XßAmy2.4Xgwm609
4DS
4DL
QH
t.ipk
-4D
(GFS
03)
QG
ae.ip
k-4D
(GFS
03)
C
C
C
Xfba078b6.0Xfba3202.8Xgwm43.4Xgwm6013.5Xgwm165a3.4Xcdo13872.8Xksuf8a3.4Xgwm6956.2Xbcd402b2.7Xgwm6106.7Xksug12b3.0Xwg6225.7Xgwm397
18.1
Xgwm63715.7
Xmwg549b3.0 Xbcd1670a5.5 Xmwg710c3.7 Xcdo475a4.6 Xksud93.5 Xbcd1302.9 Xfba2318.0Xcdo545a4.9 Xgwm160
4AS
4AL
Xfba078a8.8
Xfba008a5.0
Xgwm3682.3Xgwm7103.9Xcdo7957.7Xbcd12623.6Xgwm1071.1Xgwm1130.9Xgwm66b2.8Xgwm5131.3Xbcd12651.5Xgwm4952.9Xgwm165c3.7Xgwm1491.0Xcdo14013.4Xcdo1312a4.1Xfbb178a2.2Xgwm25112.5Xfbb067d8.4Xfba177a6.7Xbcd402a14.1Xgwm538
21.2
Xgwm6
4BL
4BS
QG
lt.ip
k-4D
(GFS
01)
Xmwg634a
32.0
Xbcd265b8.6Xbcd3273.0Xgdm612.7Xksuf8b0.8Xgwm608a5.3Xgwm165b9.1Xbcd15b5.3Xfbb178b8.2Xcdo1312b
11.0Xbcd1431e
15.5
Xfbb226e7.5Xgwm1943.5Xfba177b
10.7Xgwm6241.2Xcdo9494.4XßAmy2.4Xgwm609
4DS
4DL
QH
t.ipk
-4D
(GFS
03)
QG
ae.ip
k-4D
(GFS
03)
Xfba078b6.0Xfba3202.8Xgwm43.4Xgwm6013.5Xgwm165a3.4Xcdo13872.8Xksuf8a3.4Xgwm6956.2Xbcd402b2.7Xgwm6106.7Xksug12b3.0Xwg6225.7Xgwm397
18.1
Xgwm63715.7
Xmwg549b3.0 Xbcd1670a5.5 Xmwg710c3.7 Xcdo475a4.6 Xksud93.5 Xbcd1302.9 Xfba2318.0Xcdo545a4.9 Xgwm160
4AS
4AL
Xfba078b6.0Xfba3202.8Xgwm43.4Xgwm6013.5Xgwm165a3.4Xcdo13872.8Xksuf8a3.4Xgwm6956.2Xbcd402b2.7Xgwm6106.7Xksug12b3.0Xwg6225.7Xgwm397
18.1
Xgwm63715.7
Xmwg549b3.0 Xbcd1670a5.5 Xmwg710c3.7 Xcdo475a4.6 Xksud93.5 Xbcd1302.9 Xfba2318.0Xcdo545a4.9 Xgwm160
Xfba078b6.0Xfba3202.8Xgwm43.4Xgwm6013.5Xgwm165a3.4Xcdo13872.8Xksuf8a3.4Xgwm6956.2Xbcd402b2.7Xgwm6106.7Xksug12b3.0Xwg6225.7Xgwm397
18.1
Xgwm63715.7
Xmwg549b3.0 Xbcd1670a5.5 Xmwg710c3.7 Xcdo475a4.6 Xksud93.5 Xbcd1302.9 Xfba2318.0Xcdo545a4.9 Xgwm160
4AS
4AL
Xfba078a8.8
Xfba008a5.0
Xgwm3682.3Xgwm7103.9Xcdo7957.7Xbcd12623.6Xgwm1071.1Xgwm1130.9Xgwm66b2.8Xgwm5131.3Xbcd12651.5Xgwm4952.9Xgwm165c3.7Xgwm1491.0Xcdo14013.4Xcdo1312a4.1Xfbb178a2.2Xgwm25112.5Xfbb067d8.4Xfba177a6.7Xbcd402a14.1Xgwm538
21.2
Xgwm6
4BL
4BS
Xfba078a8.8
Xfba008a5.0
Xgwm3682.3Xgwm7103.9Xcdo7957.7Xbcd12623.6Xgwm1071.1Xgwm1130.9Xgwm66b2.8Xgwm5131.3Xbcd12651.5Xgwm4952.9Xgwm165c3.7Xgwm1491.0Xcdo14013.4Xcdo1312a4.1Xfbb178a2.2Xgwm25112.5Xfbb067d8.4Xfba177a6.7Xbcd402a14.1Xgwm538
21.2
Xgwm6
Xfba078a8.8
Xfba008a5.0
Xgwm3682.3Xgwm7103.9Xcdo7957.7Xbcd12623.6Xgwm1071.1Xgwm1130.9Xgwm66b2.8Xgwm5131.3Xbcd12651.5Xgwm4952.9Xgwm165c3.7Xgwm1491.0Xcdo14013.4Xcdo1312a4.1Xfbb178a2.2Xgwm25112.5Xfbb067d8.4Xfba177a6.7Xbcd402a14.1Xgwm538
21.2
Xgwm6
4BL
4BS
QG
lt.ip
k-4D
(GFS
01)
Xmwg634a
32.0
Xbcd265b8.6Xbcd3273.0Xgdm612.7Xksuf8b0.8Xgwm608a5.3Xgwm165b9.1Xbcd15b5.3Xfbb178b8.2Xcdo1312b
11.0Xbcd1431e
15.5
Xfbb226e7.5Xgwm1943.5Xfba177b
10.7Xgwm6241.2Xcdo9494.4XßAmy2.4Xgwm609
4DS
4DL
QH
t.ipk
-4D
(GFS
03)
QG
ae.ip
k-4D
(GFS
03)
QG
lt.ip
k-4D
(GFS
01)
Xmwg634a
32.0
Xbcd265b8.6Xbcd3273.0Xgdm612.7Xksuf8b0.8Xgwm608a5.3Xgwm165b9.1Xbcd15b5.3Xfbb178b8.2Xcdo1312b
11.0Xbcd1431e
15.5
Xfbb226e7.5Xgwm1943.5Xfba177b
10.7Xgwm6241.2Xcdo9494.4XßAmy2.4Xgwm609
4DS
4DL
Xmwg634a
32.0
Xbcd265b8.6Xbcd3273.0Xgdm612.7Xksuf8b0.8Xgwm608a5.3Xgwm165b9.1Xbcd15b5.3Xfbb178b8.2Xcdo1312b
11.0Xbcd1431e
15.5
Xfbb226e7.5Xgwm1943.5Xfba177b
10.7Xgwm6241.2Xcdo9494.4XßAmy2.4Xgwm609
Xmwg634a
32.0
Xbcd265b8.6Xbcd3273.0Xgdm612.7Xksuf8b0.8Xgwm608a5.3Xgwm165b9.1Xbcd15b5.3Xfbb178b8.2Xcdo1312b
11.0Xbcd1431e
15.5
Xfbb226e7.5Xgwm1943.5Xfba177b
10.7Xgwm6241.2Xcdo9494.4XßAmy2.4Xgwm609
4DS
4DL
QH
t.ipk
-4D
(GFS
03)
QG
ae.ip
k-4D
(GFS
03)
C
C
C
C
C
C
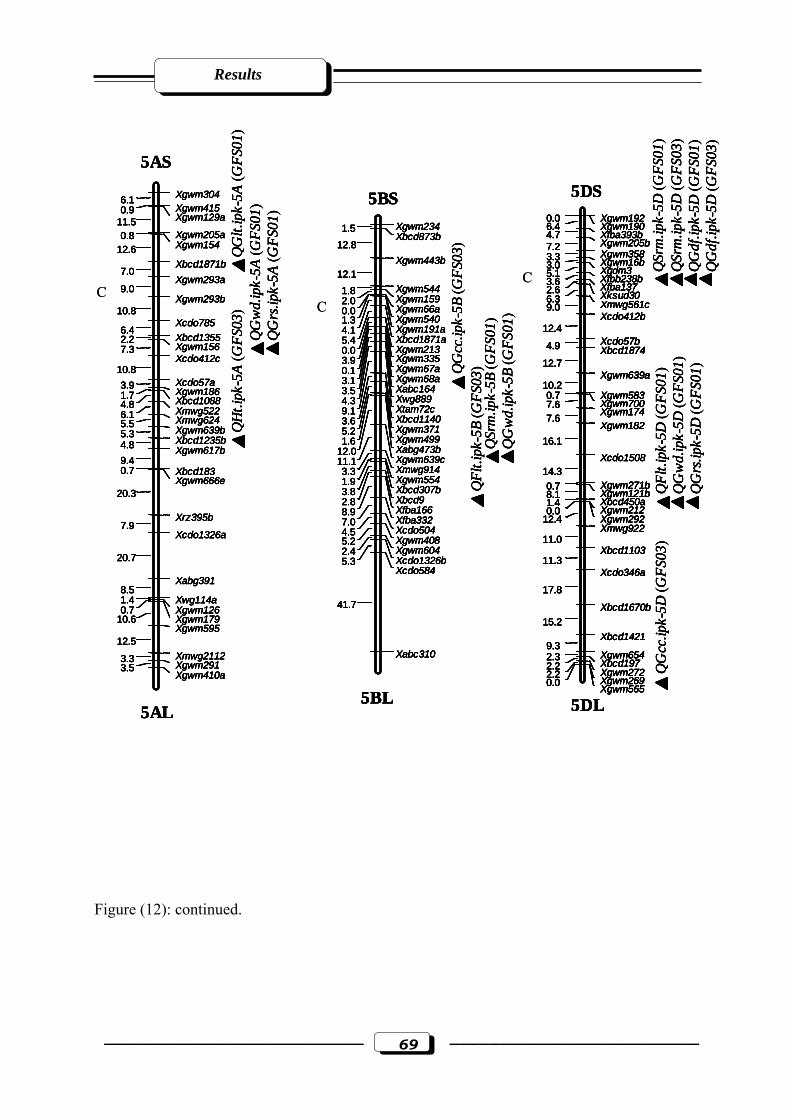
Results
–––––––––––––––––––––––––– 69 –––––––––––––––––––––––––
Figure (12): continued.
Xgwm3046.1Xgwm4150.9Xgwm129a11.5Xgwm205a0.8Xgwm15412.6Xbcd1871b
7.0Xgwm293a
9.0Xgwm293b
10.8Xcdo785
6.4Xbcd13552.2Xgwm1567.3Xcdo412c
10.8Xcdo57a3.9 Xgwm1861.7 Xbcd10884.8 Xmwg5226.1 Xmwg6245.5 Xgwm639b5.3 Xbcd1235b4.8 Xgwm617b
9.4Xbcd1830.7Xgwm666e
20.3
Xrz395b7.9
Xcdo1326a
20.7
Xabg3918.5
Xwg114a1.4Xgwm1260.7Xgwm17910.6Xgwm595
12.5Xmwg21123.3 Xgwm2913.5Xgwm410a
5AS
5AL
QG
wd.
ipk-
5A (G
FS01
)Q
Grs
.ipk-
5A (G
FS01
)
QH
t.ipk
-5A
(GFS
03)
QG
lt.ip
k-5A
(GFS
01)
QSr
m.ip
k-5B
(GFS
01)
QG
wd.
ipk-
5B (G
FS01
)
QFl
t.ipk
-5B
(GFS
03)QG
cc.ip
k-5B
(GFS
03)
Xgwm2341.5Xbcd873b
12.8Xgwm443b
12.1Xgwm5441.8Xgwm1592.0Xgwm66a0.0Xgwm5401.3Xgwm191a4.1Xbcd1871a5.4Xgwm2130.0Xgwm3353.9Xgwm67a0.1Xgwm68a3.1Xabc1643.5Xwg8894.3Xtam72c9.1Xbcd11403.6Xgwm3715.2Xgwm4991.6Xabg473b12.0Xgwm639c11.1Xmwg9143.3Xgwm5541.9Xbcd307b3.8Xbcd92.8Xfba1668.9Xfba3327.0Xcdo5044.5Xgwm4085.2Xgwm6042.4Xcdo1326b5.3Xcdo584
41.7
Xabc310
5BL
5BSXgwm1920.0Xgwm1906.4Xfba393b4.7Xgwm205b7.2Xgwm3583.3 Xgwm16b3.0 Xgdm35.1 Xfbb238b3.6 Xfba1372.6 Xksud306.3 Xmwg561c9.0Xcdo412b
12.4Xcdo57b4.9 Xbcd1874
12.7Xgwm639a
10.2Xgwm5830.7Xgwm7007.6Xgwm1747.6Xgwm182
16.1Xcdo1508
14.3Xgwm271b0.7Xgwm121b8.1Xbcd450a1.4Xgwm2120.0Xgwm29212.4Xmwg922
11.0Xbcd1103
11.3Xcdo346a
17.8
Xbcd1670b15.2
Xbcd14219.3
Xgwm6542.3 Xbcd1972.2 Xgwm2722.2 Xgwm2690.0 Xgwm565
5DS
5DL
QSr
m.ip
k-5D
(GFS
01)
QSr
m.ip
k-5D
(GFS
03)
QG
df.ip
k-5D
(GFS
01)
QG
df.ip
k-5D
(GFS
03)
QFl
t.ipk
-5D
(GFS
01)
QG
wd.
ipk-
5D (G
FS01
)Q
Grs
.ipk-
5D (G
FS01
)
QG
cc.ip
k-5D
(GFS
03)
CC
C
Xgwm3046.1Xgwm4150.9Xgwm129a11.5Xgwm205a0.8Xgwm15412.6Xbcd1871b
7.0Xgwm293a
9.0Xgwm293b
10.8Xcdo785
6.4Xbcd13552.2Xgwm1567.3Xcdo412c
10.8Xcdo57a3.9 Xgwm1861.7 Xbcd10884.8 Xmwg5226.1 Xmwg6245.5 Xgwm639b5.3 Xbcd1235b4.8 Xgwm617b
9.4Xbcd1830.7Xgwm666e
20.3
Xrz395b7.9
Xcdo1326a
20.7
Xabg3918.5
Xwg114a1.4Xgwm1260.7Xgwm17910.6Xgwm595
12.5Xmwg21123.3 Xgwm2913.5Xgwm410a
5AS
5AL
QG
wd.
ipk-
5A (G
FS01
)Q
Grs
.ipk-
5A (G
FS01
)
QH
t.ipk
-5A
(GFS
03)
QG
lt.ip
k-5A
(GFS
01)
QSr
m.ip
k-5B
(GFS
01)
QG
wd.
ipk-
5B (G
FS01
)
QFl
t.ipk
-5B
(GFS
03)QG
cc.ip
k-5B
(GFS
03)
Xgwm2341.5Xbcd873b
12.8Xgwm443b
12.1Xgwm5441.8Xgwm1592.0Xgwm66a0.0Xgwm5401.3Xgwm191a4.1Xbcd1871a5.4Xgwm2130.0Xgwm3353.9Xgwm67a0.1Xgwm68a3.1Xabc1643.5Xwg8894.3Xtam72c9.1Xbcd11403.6Xgwm3715.2Xgwm4991.6Xabg473b12.0Xgwm639c11.1Xmwg9143.3Xgwm5541.9Xbcd307b3.8Xbcd92.8Xfba1668.9Xfba3327.0Xcdo5044.5Xgwm4085.2Xgwm6042.4Xcdo1326b5.3Xcdo584
41.7
Xabc310
5BL
5BSXgwm1920.0Xgwm1906.4Xfba393b4.7Xgwm205b7.2Xgwm3583.3 Xgwm16b3.0 Xgdm35.1 Xfbb238b3.6 Xfba1372.6 Xksud306.3 Xmwg561c9.0Xcdo412b
12.4Xcdo57b4.9 Xbcd1874
12.7Xgwm639a
10.2Xgwm5830.7Xgwm7007.6Xgwm1747.6Xgwm182
16.1Xcdo1508
14.3Xgwm271b0.7Xgwm121b8.1Xbcd450a1.4Xgwm2120.0Xgwm29212.4Xmwg922
11.0Xbcd1103
11.3Xcdo346a
17.8
Xbcd1670b15.2
Xbcd14219.3
Xgwm6542.3 Xbcd1972.2 Xgwm2722.2 Xgwm2690.0 Xgwm565
5DS
5DL
QSr
m.ip
k-5D
(GFS
01)
QSr
m.ip
k-5D
(GFS
03)
QG
df.ip
k-5D
(GFS
01)
QG
df.ip
k-5D
(GFS
03)
QFl
t.ipk
-5D
(GFS
01)
QG
wd.
ipk-
5D (G
FS01
)Q
Grs
.ipk-
5D (G
FS01
)
QG
cc.ip
k-5D
(GFS
03)
Xgwm3046.1Xgwm4150.9Xgwm129a11.5Xgwm205a0.8Xgwm15412.6Xbcd1871b
7.0Xgwm293a
9.0Xgwm293b
10.8Xcdo785
6.4Xbcd13552.2Xgwm1567.3Xcdo412c
10.8Xcdo57a3.9 Xgwm1861.7 Xbcd10884.8 Xmwg5226.1 Xmwg6245.5 Xgwm639b5.3 Xbcd1235b4.8 Xgwm617b
9.4Xbcd1830.7Xgwm666e
20.3
Xrz395b7.9
Xcdo1326a
20.7
Xabg3918.5
Xwg114a1.4Xgwm1260.7Xgwm17910.6Xgwm595
12.5Xmwg21123.3 Xgwm2913.5Xgwm410a
5AS
5AL
QG
wd.
ipk-
5A (G
FS01
)Q
Grs
.ipk-
5A (G
FS01
)
QH
t.ipk
-5A
(GFS
03)
QG
lt.ip
k-5A
(GFS
01)
Xgwm3046.1Xgwm4150.9Xgwm129a11.5Xgwm205a0.8Xgwm15412.6Xbcd1871b
7.0Xgwm293a
9.0Xgwm293b
10.8Xcdo785
6.4Xbcd13552.2Xgwm1567.3Xcdo412c
10.8Xcdo57a3.9 Xgwm1861.7 Xbcd10884.8 Xmwg5226.1 Xmwg6245.5 Xgwm639b5.3 Xbcd1235b4.8 Xgwm617b
9.4Xbcd1830.7Xgwm666e
20.3
Xrz395b7.9
Xcdo1326a
20.7
Xabg3918.5
Xwg114a1.4Xgwm1260.7Xgwm17910.6Xgwm595
12.5Xmwg21123.3 Xgwm2913.5Xgwm410a
5AS
5AL
QG
wd.
ipk-
5A (G
FS01
)Q
Grs
.ipk-
5A (G
FS01
)
QH
t.ipk
-5A
(GFS
03)
QG
lt.ip
k-5A
(GFS
01)
QSr
m.ip
k-5B
(GFS
01)
QG
wd.
ipk-
5B (G
FS01
)
QFl
t.ipk
-5B
(GFS
03)QG
cc.ip
k-5B
(GFS
03)
Xgwm2341.5Xbcd873b
12.8Xgwm443b
12.1Xgwm5441.8Xgwm1592.0Xgwm66a0.0Xgwm5401.3Xgwm191a4.1Xbcd1871a5.4Xgwm2130.0Xgwm3353.9Xgwm67a0.1Xgwm68a3.1Xabc1643.5Xwg8894.3Xtam72c9.1Xbcd11403.6Xgwm3715.2Xgwm4991.6Xabg473b12.0Xgwm639c11.1Xmwg9143.3Xgwm5541.9Xbcd307b3.8Xbcd92.8Xfba1668.9Xfba3327.0Xcdo5044.5Xgwm4085.2Xgwm6042.4Xcdo1326b5.3Xcdo584
41.7
Xabc310
5BL
5BS
QSr
m.ip
k-5B
(GFS
01)
QG
wd.
ipk-
5B (G
FS01
)
QFl
t.ipk
-5B
(GFS
03)QG
cc.ip
k-5B
(GFS
03)
Xgwm2341.5Xbcd873b
12.8Xgwm443b
12.1Xgwm5441.8Xgwm1592.0Xgwm66a0.0Xgwm5401.3Xgwm191a4.1Xbcd1871a5.4Xgwm2130.0Xgwm3353.9Xgwm67a0.1Xgwm68a3.1Xabc1643.5Xwg8894.3Xtam72c9.1Xbcd11403.6Xgwm3715.2Xgwm4991.6Xabg473b12.0Xgwm639c11.1Xmwg9143.3Xgwm5541.9Xbcd307b3.8Xbcd92.8Xfba1668.9Xfba3327.0Xcdo5044.5Xgwm4085.2Xgwm6042.4Xcdo1326b5.3Xcdo584
41.7
Xabc310
5BL
5BSXgwm2341.5Xbcd873b
12.8Xgwm443b
12.1Xgwm5441.8Xgwm1592.0Xgwm66a0.0Xgwm5401.3Xgwm191a4.1Xbcd1871a5.4Xgwm2130.0Xgwm3353.9Xgwm67a0.1Xgwm68a3.1Xabc1643.5Xwg8894.3Xtam72c9.1Xbcd11403.6Xgwm3715.2Xgwm4991.6Xabg473b12.0Xgwm639c11.1Xmwg9143.3Xgwm5541.9Xbcd307b3.8Xbcd92.8Xfba1668.9Xfba3327.0Xcdo5044.5Xgwm4085.2Xgwm6042.4Xcdo1326b5.3Xcdo584
41.7
Xabc310
5BL
5BSXgwm1920.0Xgwm1906.4Xfba393b4.7Xgwm205b7.2Xgwm3583.3 Xgwm16b3.0 Xgdm35.1 Xfbb238b3.6 Xfba1372.6 Xksud306.3 Xmwg561c9.0Xcdo412b
12.4Xcdo57b4.9 Xbcd1874
12.7Xgwm639a
10.2Xgwm5830.7Xgwm7007.6Xgwm1747.6Xgwm182
16.1Xcdo1508
14.3Xgwm271b0.7Xgwm121b8.1Xbcd450a1.4Xgwm2120.0Xgwm29212.4Xmwg922
11.0Xbcd1103
11.3Xcdo346a
17.8
Xbcd1670b15.2
Xbcd14219.3
Xgwm6542.3 Xbcd1972.2 Xgwm2722.2 Xgwm2690.0 Xgwm565
5DS
5DL
QSr
m.ip
k-5D
(GFS
01)
QSr
m.ip
k-5D
(GFS
03)
QG
df.ip
k-5D
(GFS
01)
QG
df.ip
k-5D
(GFS
03)
QFl
t.ipk
-5D
(GFS
01)
QG
wd.
ipk-
5D (G
FS01
)Q
Grs
.ipk-
5D (G
FS01
)
QG
cc.ip
k-5D
(GFS
03)
Xgwm1920.0Xgwm1906.4Xfba393b4.7Xgwm205b7.2Xgwm3583.3 Xgwm16b3.0 Xgdm35.1 Xfbb238b3.6 Xfba1372.6 Xksud306.3 Xmwg561c9.0Xcdo412b
12.4Xcdo57b4.9 Xbcd1874
12.7Xgwm639a
10.2Xgwm5830.7Xgwm7007.6Xgwm1747.6Xgwm182
16.1Xcdo1508
14.3Xgwm271b0.7Xgwm121b8.1Xbcd450a1.4Xgwm2120.0Xgwm29212.4Xmwg922
11.0Xbcd1103
11.3Xcdo346a
17.8
Xbcd1670b15.2
Xbcd14219.3
Xgwm6542.3 Xbcd1972.2 Xgwm2722.2 Xgwm2690.0 Xgwm565
5DS
5DL
Xgwm1920.0Xgwm1906.4Xfba393b4.7Xgwm205b7.2Xgwm3583.3 Xgwm16b3.0 Xgdm35.1 Xfbb238b3.6 Xfba1372.6 Xksud306.3 Xmwg561c9.0Xcdo412b
12.4Xcdo57b4.9 Xbcd1874
12.7Xgwm639a
10.2Xgwm5830.7Xgwm7007.6Xgwm1747.6Xgwm182
16.1Xcdo1508
14.3Xgwm271b0.7Xgwm121b8.1Xbcd450a1.4Xgwm2120.0Xgwm29212.4Xmwg922
11.0Xbcd1103
11.3Xcdo346a
17.8
Xbcd1670b15.2
Xbcd14219.3
Xgwm6542.3 Xbcd1972.2 Xgwm2722.2 Xgwm2690.0 Xgwm565
5DS
5DL
QSr
m.ip
k-5D
(GFS
01)
QSr
m.ip
k-5D
(GFS
03)
QG
df.ip
k-5D
(GFS
01)
QG
df.ip
k-5D
(GFS
03)
QFl
t.ipk
-5D
(GFS
01)
QG
wd.
ipk-
5D (G
FS01
)Q
Grs
.ipk-
5D (G
FS01
)
QG
cc.ip
k-5D
(GFS
03)
CC
C
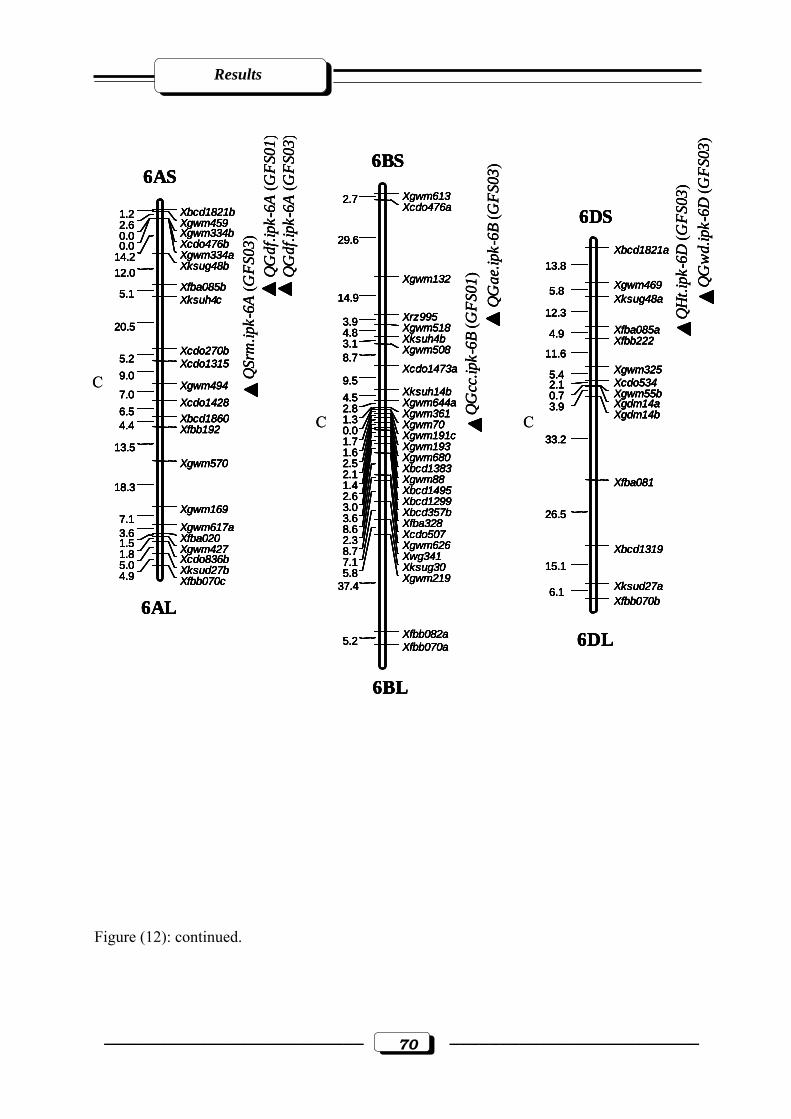
Results
–––––––––––––––––––––––––– 70 –––––––––––––––––––––––––
Figure (12): continued.
Xbcd1821b1.2Xgwm4592.6Xgwm334b0.0Xcdo476b0.0Xgwm334a14.2Xksug48b12.0Xfba085b5.1 Xksuh4c
20.5
Xcdo270b5.2 Xcdo13159.0
Xgwm4947.0
Xcdo14286.5 Xbcd18604.4 Xfbb192
13.5Xgwm570
18.3
Xgwm1697.1
Xgwm617a3.6 Xfba0201.5 Xgwm4271.8 Xcdo836b5.0 Xksud27b4.9 Xfbb070c
6AS
6AL
QSr
m.ip
k-6A
(GFS
03)
QG
df.ip
k-6A
(GFS
01)
QG
df.ip
k-6A
(GFS
03)
Xgwm6132.7Xcdo476a
29.6
Xgwm132
14.9
Xrz9953.9 Xgwm5184.8 Xksuh4b3.1 Xgwm5088.7
Xcdo1473a9.5
Xksuh14b4.5 Xgwm644a2.8 Xgwm3611.3 Xgwm700.0 Xgwm191c1.7 Xgwm1931.6 Xgwm6802.5 Xbcd13832.1 Xgwm881.4 Xbcd14952.6 Xbcd12993.0 Xbcd357b3.6 Xfba3288.6 Xcdo5072.3 Xgwm6268.7 Xwg3417.1 Xksug305.8 Xgwm21937.4
Xfbb082a5.2 Xfbb070a
6BL
6BS
QG
cc.ip
k-6B
(GFS
01)
QG
ae.ip
k-6B
(GFS
03)
Xbcd1821a13.8
Xgwm4695.8Xksug48a
12.3Xfba085a4.9 Xfbb222
11.6Xgwm3255.4Xcdo5342.1Xgwm55b0.7Xgdm14a3.9Xgdm14b
33.2
Xfba081
26.5
Xbcd131915.1
Xksud27a6.1Xfbb070b
6DL
6DS
QH
t.ipk
-6D
(GFS
03)
QG
wd.
ipk-
6D (G
FS03
)
C
C C
Xbcd1821b1.2Xgwm4592.6Xgwm334b0.0Xcdo476b0.0Xgwm334a14.2Xksug48b12.0Xfba085b5.1 Xksuh4c
20.5
Xcdo270b5.2 Xcdo13159.0
Xgwm4947.0
Xcdo14286.5 Xbcd18604.4 Xfbb192
13.5Xgwm570
18.3
Xgwm1697.1
Xgwm617a3.6 Xfba0201.5 Xgwm4271.8 Xcdo836b5.0 Xksud27b4.9 Xfbb070c
6AS
6AL
QSr
m.ip
k-6A
(GFS
03)
QG
df.ip
k-6A
(GFS
01)
QG
df.ip
k-6A
(GFS
03)
Xbcd1821b1.2Xgwm4592.6Xgwm334b0.0Xcdo476b0.0Xgwm334a14.2Xksug48b12.0Xfba085b5.1 Xksuh4c
20.5
Xcdo270b5.2 Xcdo13159.0
Xgwm4947.0
Xcdo14286.5 Xbcd18604.4 Xfbb192
13.5Xgwm570
18.3
Xgwm1697.1
Xgwm617a3.6 Xfba0201.5 Xgwm4271.8 Xcdo836b5.0 Xksud27b4.9 Xfbb070c
6AS
6AL
Xbcd1821b1.2Xgwm4592.6Xgwm334b0.0Xcdo476b0.0Xgwm334a14.2Xksug48b12.0Xfba085b5.1 Xksuh4c
20.5
Xcdo270b5.2 Xcdo13159.0
Xgwm4947.0
Xcdo14286.5 Xbcd18604.4 Xfbb192
13.5Xgwm570
18.3
Xgwm1697.1
Xgwm617a3.6 Xfba0201.5 Xgwm4271.8 Xcdo836b5.0 Xksud27b4.9 Xfbb070c
Xbcd1821b1.2Xgwm4592.6Xgwm334b0.0Xcdo476b0.0Xgwm334a14.2Xksug48b12.0Xfba085b5.1 Xksuh4c
20.5
Xcdo270b5.2 Xcdo13159.0
Xgwm4947.0
Xcdo14286.5 Xbcd18604.4 Xfbb192
13.5Xgwm570
18.3
Xgwm1697.1
Xgwm617a3.6 Xfba0201.5 Xgwm4271.8 Xcdo836b5.0 Xksud27b4.9 Xfbb070c
6AS
6AL
QSr
m.ip
k-6A
(GFS
03)
QG
df.ip
k-6A
(GFS
01)
QG
df.ip
k-6A
(GFS
03)
Xgwm6132.7Xcdo476a
29.6
Xgwm132
14.9
Xrz9953.9 Xgwm5184.8 Xksuh4b3.1 Xgwm5088.7
Xcdo1473a9.5
Xksuh14b4.5 Xgwm644a2.8 Xgwm3611.3 Xgwm700.0 Xgwm191c1.7 Xgwm1931.6 Xgwm6802.5 Xbcd13832.1 Xgwm881.4 Xbcd14952.6 Xbcd12993.0 Xbcd357b3.6 Xfba3288.6 Xcdo5072.3 Xgwm6268.7 Xwg3417.1 Xksug305.8 Xgwm21937.4
Xfbb082a5.2 Xfbb070a
6BL
6BS
QG
cc.ip
k-6B
(GFS
01)
QG
ae.ip
k-6B
(GFS
03)
Xgwm6132.7Xcdo476a
29.6
Xgwm132
14.9
Xrz9953.9 Xgwm5184.8 Xksuh4b3.1 Xgwm5088.7
Xcdo1473a9.5
Xksuh14b4.5 Xgwm644a2.8 Xgwm3611.3 Xgwm700.0 Xgwm191c1.7 Xgwm1931.6 Xgwm6802.5 Xbcd13832.1 Xgwm881.4 Xbcd14952.6 Xbcd12993.0 Xbcd357b3.6 Xfba3288.6 Xcdo5072.3 Xgwm6268.7 Xwg3417.1 Xksug305.8 Xgwm21937.4
Xfbb082a5.2 Xfbb070a
6BL
6BS
Xgwm6132.7Xcdo476a
29.6
Xgwm132
14.9
Xrz9953.9 Xgwm5184.8 Xksuh4b3.1 Xgwm5088.7
Xcdo1473a9.5
Xksuh14b4.5 Xgwm644a2.8 Xgwm3611.3 Xgwm700.0 Xgwm191c1.7 Xgwm1931.6 Xgwm6802.5 Xbcd13832.1 Xgwm881.4 Xbcd14952.6 Xbcd12993.0 Xbcd357b3.6 Xfba3288.6 Xcdo5072.3 Xgwm6268.7 Xwg3417.1 Xksug305.8 Xgwm21937.4
Xfbb082a5.2 Xfbb070a
6BL
6BS
QG
cc.ip
k-6B
(GFS
01)
QG
ae.ip
k-6B
(GFS
03)
Xbcd1821a13.8
Xgwm4695.8Xksug48a
12.3Xfba085a4.9 Xfbb222
11.6Xgwm3255.4Xcdo5342.1Xgwm55b0.7Xgdm14a3.9Xgdm14b
33.2
Xfba081
26.5
Xbcd131915.1
Xksud27a6.1Xfbb070b
6DL
6DS
QH
t.ipk
-6D
(GFS
03)
QG
wd.
ipk-
6D (G
FS03
)
Xbcd1821a13.8
Xgwm4695.8Xksug48a
12.3Xfba085a4.9 Xfbb222
11.6Xgwm3255.4Xcdo5342.1Xgwm55b0.7Xgdm14a3.9Xgdm14b
33.2
Xfba081
26.5
Xbcd131915.1
Xksud27a6.1Xfbb070b
6DL
6DSXbcd1821a
13.8
Xgwm4695.8Xksug48a
12.3Xfba085a4.9 Xfbb222
11.6Xgwm3255.4Xcdo5342.1Xgwm55b0.7Xgdm14a3.9Xgdm14b
33.2
Xfba081
26.5
Xbcd131915.1
Xksud27a6.1Xfbb070b
Xbcd1821a13.8
Xgwm4695.8Xksug48a
12.3Xfba085a4.9 Xfbb222
11.6Xgwm3255.4Xcdo5342.1Xgwm55b0.7Xgdm14a3.9Xgdm14b
33.2
Xfba081
26.5
Xbcd131915.1
Xksud27a6.1Xfbb070b
6DL
6DS
QH
t.ipk
-6D
(GFS
03)
QG
wd.
ipk-
6D (G
FS03
)
C
C C
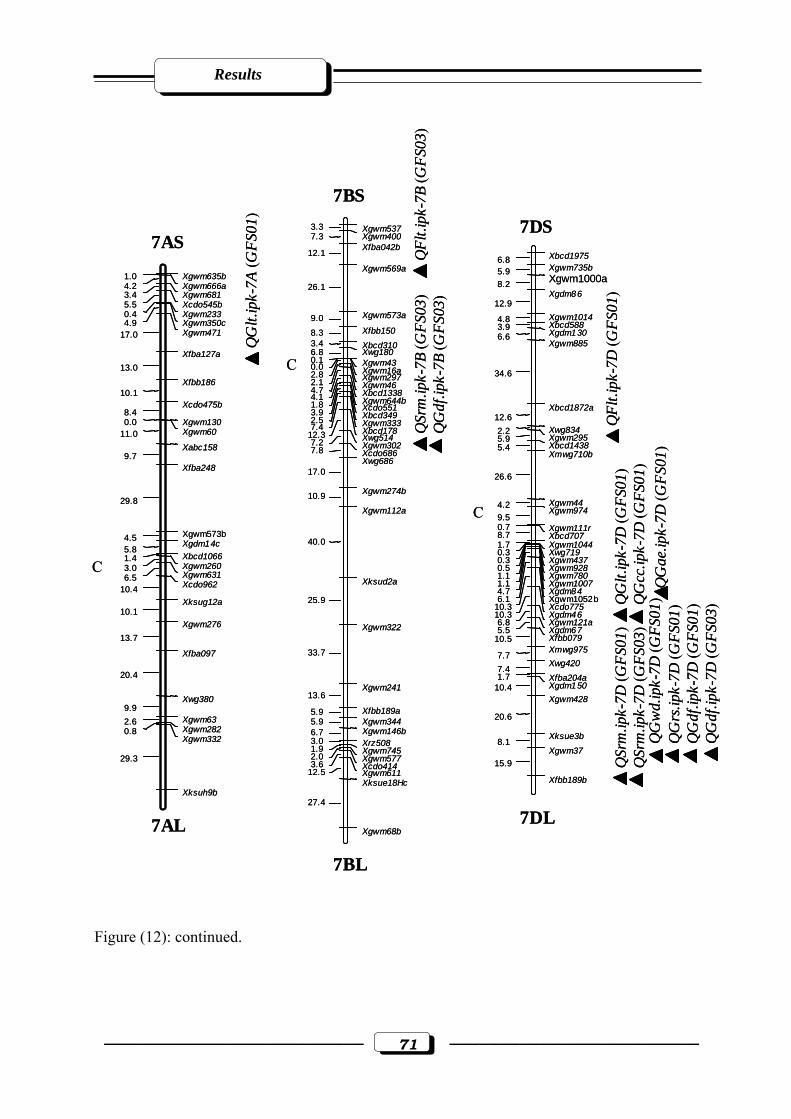
Results
–––––––––––––––––––––––––– 71 –––––––––––––––––––––––––
Figure (12): continued.
QG
lt.ip
k-7A
(GFS
01)
Xgwm635b1.0Xgwm666a4.2Xgwm6813.4Xcdo545b5.5Xgwm2330.4Xgwm350c4.9Xgwm47117.0
Xfba127a13.0
Xfbb18610.1
Xcdo475b8.4
Xgwm1300.0Xgwm6011.0Xabc158
9.7Xfba248
29.8
Xgwm573b4.5Xgdm14c
5.8Xbcd10661.4Xgwm2603.0Xgwm6316.5Xcdo96210.4Xksug12a
10.1Xgwm276
13.7
Xfba097
20.4
Xwg3809.9
Xgwm632.6Xgwm2820.8Xgwm332
29.3
Xksuh9b
7AL
7ASXgwm5373.3Xgwm4007.3Xfba042b
12.1
Xgwm569a
26.1
Xgwm573a9.0Xfbb1508.3Xbcd3103.4Xwg1806.8Xgwm430.1Xgwm16a0.0Xgwm2972.8Xgwm462.1Xbcd13384.7Xgwm644b4.1Xcdo5511.8Xbcd3493.9Xgwm3332.5Xbcd1787.4Xwg51412.3Xgwm3027.2Xcdo6867.8Xwg686
17.0
Xgwm274b10.9
Xgwm112a
40.0
Xksud2a
25.9
Xgwm322
33.7
Xgwm24113.6
Xfbb189a5.9Xgwm3445.9Xgwm146b6.7Xrz5083.0Xgwm7451.9Xgwm5772.0Xcdo4143.6Xgwm61112.5Xksue18Hc
27.4
Xgwm68b
7BS
7BL
QFl
t.ipk
-7B
(GFS
03)
QSr
m.ip
k-7B
(GFS
03)
QG
df.ip
k-7B
(GFS
03)
QG
ae.ip
k-7D
(GFS
01)
QG
wd.
ipk-
7D (G
FS01
)Q
Grs
.ipk-
7D (G
FS01
)Q
Gdf
.ipk-
7D (G
FS01
)Q
Gdf
.ipk-
7D (G
FS03
)
Xbcd19756.8Xgwm735b5.9Xgwm1000a8.2Xgdm86
12.9Xgwm10144.8Xbcd5883.9Xgdm1306.6Xgwm885
34.6
Xbcd1872a12.6
Xwg8342.2Xgwm2955.9Xbcd14385.4Xmwg710b
26.6
Xgwm444.2Xgwm974
9.5Xgwm111r0.7Xbcd7078.7Xgwm10441.7Xwg7190.3Xgwm4370.3Xgwm9280.5Xgwm7801.1Xgwm10071.1Xgdm844.7Xgwm1052b6.1Xcdo77510.3Xgdm4610.3Xgwm121a6.8Xgdm675.5Xfbb07910.5Xmwg975
7.7Xwg420
7.4Xfba204a1.7Xgdm15010.4Xgwm428
20.6
Xksue3b8.1
Xgwm3715.9
Xfbb189b
7DL
7DS
QFl
t.ipk
-7D
(GFS
01)
QG
lt.ip
k-7D
(GFS
01)
QG
cc.ip
k-7D
(GFS
01)
QSr
m.ip
k-7D
(GFS
01)
QSr
m.ip
k-7D
(GFS
03)
C
C
C
QG
lt.ip
k-7A
(GFS
01)
Xgwm635b1.0Xgwm666a4.2Xgwm6813.4Xcdo545b5.5Xgwm2330.4Xgwm350c4.9Xgwm47117.0
Xfba127a13.0
Xfbb18610.1
Xcdo475b8.4
Xgwm1300.0Xgwm6011.0Xabc158
9.7Xfba248
29.8
Xgwm573b4.5Xgdm14c
5.8Xbcd10661.4Xgwm2603.0Xgwm6316.5Xcdo96210.4Xksug12a
10.1Xgwm276
13.7
Xfba097
20.4
Xwg3809.9
Xgwm632.6Xgwm2820.8Xgwm332
29.3
Xksuh9b
7AL
7ASXgwm5373.3Xgwm4007.3Xfba042b
12.1
Xgwm569a
26.1
Xgwm573a9.0Xfbb1508.3Xbcd3103.4Xwg1806.8Xgwm430.1Xgwm16a0.0Xgwm2972.8Xgwm462.1Xbcd13384.7Xgwm644b4.1Xcdo5511.8Xbcd3493.9Xgwm3332.5Xbcd1787.4Xwg51412.3Xgwm3027.2Xcdo6867.8Xwg686
17.0
Xgwm274b10.9
Xgwm112a
40.0
Xksud2a
25.9
Xgwm322
33.7
Xgwm24113.6
Xfbb189a5.9Xgwm3445.9Xgwm146b6.7Xrz5083.0Xgwm7451.9Xgwm5772.0Xcdo4143.6Xgwm61112.5Xksue18Hc
27.4
Xgwm68b
7BS
7BL
QFl
t.ipk
-7B
(GFS
03)
QSr
m.ip
k-7B
(GFS
03)
QG
df.ip
k-7B
(GFS
03)
QG
ae.ip
k-7D
(GFS
01)
QG
wd.
ipk-
7D (G
FS01
)Q
Grs
.ipk-
7D (G
FS01
)Q
Gdf
.ipk-
7D (G
FS01
)Q
Gdf
.ipk-
7D (G
FS03
)
Xbcd19756.8Xgwm735b5.9Xgwm1000a8.2Xgdm86
12.9Xgwm10144.8Xbcd5883.9Xgdm1306.6Xgwm885
34.6
Xbcd1872a12.6
Xwg8342.2Xgwm2955.9Xbcd14385.4Xmwg710b
26.6
Xgwm444.2Xgwm974
9.5Xgwm111r0.7Xbcd7078.7Xgwm10441.7Xwg7190.3Xgwm4370.3Xgwm9280.5Xgwm7801.1Xgwm10071.1Xgdm844.7Xgwm1052b6.1Xcdo77510.3Xgdm4610.3Xgwm121a6.8Xgdm675.5Xfbb07910.5Xmwg975
7.7Xwg420
7.4Xfba204a1.7Xgdm15010.4Xgwm428
20.6
Xksue3b8.1
Xgwm3715.9
Xfbb189b
7DL
7DS
QFl
t.ipk
-7D
(GFS
01)
QG
lt.ip
k-7D
(GFS
01)
QG
cc.ip
k-7D
(GFS
01)
QSr
m.ip
k-7D
(GFS
01)
QSr
m.ip
k-7D
(GFS
03)
C
C
C

Discussion
–––––––––––––––––––––––––– 72 –––––––––––––––––––––––––
4. DISCUSSION
4.1. Screening wheat genotypes for post-anthesis drought tolerance
The improvement of drought tolerance is suggested as a desirable breeding objective
in crops such as wheat (Keim and Kronstad, 1979; Blum, 1983b). When sever drought stress
occurs during grain filling, leaves desiccate and transient photosynthesis is sharply reduced.
Under such conditions, grain filling and consequently yield are highly dependent on
mobilized stem reserves (Bidinger et al., 1977; Davidson and Birch, 1978; Hunt, 1979; Blum,
1988). Chemical desiccation of plant canopies at the onset of grain filling was developed as a
tool for revealing genotypic differences in grain filling from stem reserves in the absence of
current photosynthesis (Blum et al., 1983a, 1983b, 1990). Potassium iodide (KI), a chemical
contact-desiccant, has been endorsed as useful for assessing genotypic diversity in grain
filling under drought stress (Blum et al., 1983a, 1983b, 1990; Hossain et al., 1990; Nicholas
and Turner, 1993; Tyagi et al., 2000). One of the advantage of this technique is that water
stress situation can artificially be created in field grown crops under irrigated conditions. As
has been documented for water stress (Farquhar and Sharkey, 1982), potassium iodide
induced desiccation at the post-anthesis stage, lowered chlorophyll content, stomatal
conductance and rates of photosynthesis and transpiration of flag leaves of the treated plants.
The observed effects of potassium iodide treatment are qualitatively identical to those
documented in plants under water stress see also section 1.2.4.4.
The purpose of the present study was to determine whether there were any genetic
differences among different wheat germplasm resulting from spraying the wheat canopy with
potassium iodide (KI, 0.5% w:v), 14 days after anthesis. In the present investigation, means
for 1000-grain weight stress tolerance index (STI) after desiccation ranged from 22.26% to
87.78%. The observed magnitude of effect of potassium iodide treatment on 1000-grain
weight in drought sensitive genotypes (i.e., ATRI 11457, ATRI 11445, ATRI 6931, ATRI
10213, Cappelle-Desprez, ATRI 10197, ATRI 1634 and Bezostaya) was higher than in
tolerant genotypes (i.e., ATRI 1896, ATRI 5283, ATRI 17620, Synthetic/N, ATRI 9882,
ATRI 5951, W 7984 and ATRI 7099). This indicated that the tolerant wheat genotypes had
more stem reserves mobilized and high translocation ability for grain weight while the
sensitive wheat genotypes showed low stem reserve mobilization and poor translocation
ability. Wheat varieties were found to differ in their contributions of stem reserves to support
grain filling from mobilized stem reserves. The relative contribution of stem reserve was
estimated by Blum et al. (1983a, 1983b). These contributions were estimated to be anywhere
Discussion
–––––––––––––––––––––––––– 73 –––––––––––––––––––––––––
between 6% and 100% (Austin et al., 1980; Papakosta and Gagiannas, 1991; Pheloung and
Siddique, 1991; Davidson and Chevalier, 1992; Borrell et al., 1993; Blum et al., 1994; Gent,
1994; Palta et al., 1994; Khlestkina et al., 2001; Börner et al., 2002a, 2003; Salem and
Börner, 2003).
Translocation capacity of the plant in the absence of transient photosynthesis is
generally estimated as variation in grain weight because, when the treatment is applied
(generally 14 days after anthesis), all yield components except grain weight have already been
determined (Blum et al., 1983a; b; 1991). The analysis of variance (ANOVA) based on stress
tolerance index indicated that significant differences (P ≤ 0.01) for 1000-grain weight stress
tolerance were noticed between the wheat genotypes. These observations demonstrated that
reduction in 1000-grain weight caused by KI treatment differs from genotype to genotype.
This result was to be expected because of the genetic diversity in post-anthesis drought
tolerance within the wheat germplasm. There is, therefore, potential for improving post-
anthesis drought tolerance in wheat through breeding programs. From the present study, stem
reserve offers a powerful resource for grain filling under post-anthesis drought stress, which
inhibits current assimilation. It thus appears that KI treatment can be employed to create
water-limiting conditions in irrigated environment for screening of wheat genotypes for post-
anthesis drought tolerance.
4.2. Genetic analysis of post-anthesis drought tolerance
4.2.1. Phenotypic analysis and inheritance of stem reserve mobilization character
One of the objectives of this research was to elucidate the genetic basis of the stem
reserve mobilization under post-anthesis drought stress using F2:3 and RILs mapping
populations. The phenotypic frequency distributions of 1000-grain weight STI for different
environments and different populations among the F2:3 families and RILs suggested polygenic
inheritance of this trait. The genetic control is complex. The parents differed at several QTLs
controlling stem reserve mobilization. Therefore, it would be difficult to improve this trait by
traditional breeding methods. However, the transgressive segregation for 1000-grain weight
STI observed in our study indicated that it would be possible to select lines with high stem
reserve mobilization ability within these two populations. The recovery of progenies having a
1000-grain weight STI as high or low as the parents supported that the two populations were
useful for the molecular tagging. In the present study loci were detected, comparable to earlier
studies investigating 1000-grain weight under non-stressed conditions (Halloran, 1976;
Bannier, 1979; Chojecki et al., 1983; Petrovic and Worland, 1988; Giura and Saulescu, 1996;
Discussion
–––––––––––––––––––––––––– 74 –––––––––––––––––––––––––
Campbell et al., 1999; Varshney et al., 2000; Ammiraju et al., 2001; Börner et al., 2002b;
Huang et al., 2003a; Dholakia et al., 2003; Elouafi and Nachit, 2004).
4.2.2. Phenotypic analysis and inheritance of vegetative traits
Although the prime purpose of this study was to discover new genes for drought
tolerance, the opportunity was also taken to evaluate the genetics of the vegetative traits, plant
height and flowering time, using F2:3 and RILs mapping populations. Plant height and
flowering time for the different environments and the two different populations showed
continuous distributions suggesting that these traits were not simply inherited. Transgressive
segregants occurred towards a low or a high plant height and early or late flowering time. Our
results are in conformity with the results of several earlier studies, where many loci located on
several chromosomes were reported to control both traits (Cadalen et al., 1998; Keller et al.,
1999a; Ahmed, et al., 2000; Börner et al., 2002b; Huang et al., 2003a).
4.2.3. Phenotypic analysis and inheritance of grain characters
One of the objectives of this study was to investigate the genetic basis of the grain
morphology characters under post-anthesis drought stress i.e., grain area STI (Gae), grain
length STI (Glt), grain width STI (Gwd), grain circumference STI (Gcc), grain roundness STI
(Grs) and grain form density factor STI (Gdf) using F2:3 and RILs mapping populations.
Phenotypic frequency distributions of grain characters for different environments and
different populations indicated that the inheritance of these traits is complex. The parents
differed at several QTLs controlling grain characters. Transgressive segregants occurred
towards low and high parental values for all characters. The present ressults are in conformity
with several published studies performed under non-stressed conditions, which show linkage
of seed size and shape traits to a number of different loci in wheat (Snape et al., 1985; Giura
and Saulescu, 1996; Campbell et al., 1999; Ammiraju et al. 2001; Dholakia et al., 2003).
4.3. Genetic mapping of gene/s loci for post-anthesis drought tolerance
Microsatellites belong to an important class of molecular markers, since they are
abundant in all animal and plant genomes and are hypervariable in nature (Gupta et al., 1996;
Gupta and Varshney, 2000). In bread wheat also, where molecular markers like RFLPs and
RAPDs failed to detect adequate polymorphism (Röder et al., 1998; Gupta and Varshney,
2000), microsatellites have been found to be useful. They have been used in bread wheat for
genome mapping (Röder et al., 1998, Stephenson et al., 1998), gene tagging and genetic
Discussion
–––––––––––––––––––––––––– 75 –––––––––––––––––––––––––
diversity studies (Gupta and Varshney, 2000); see also section 1.3.5. Keeping in view the
importance of microsatellites, in the present study, they were utilized as PCR-based
approaches for gene/s tagging.
4.3.1. Polymorphism rate detected by microsatellite markers
The use of tolerant cultivars is the best way to decrease the reduction in grain yield
due to post-anthesis drought stress. Also, because post-anthesis drought stress is
quantitatively inherited and screening for post-anthesis drought stress is complicated and
requires special equipment, breeding for post-anthesis drought stress with traditional methods
requires substantial time and effort. Therefore, molecular identification of QTL has become
the method of choice for post-anthesis drought tolerance. After a linkage between a QTL and
molecular markers has been determined, the QTL can be transferred selectively into different
genetic backgrounds by marker-assisted selection because these markers are not influenced by
the environment and can be scored at all stages of plant growth. Therefore, it is important to
start mapping with a group of markers, which showed a high level of polymorphism in the
organism under study. In the present study, the large genetic distance between the two
parental lines ‘ATRI 5283’ and ‘ATRI 15010’ provided a high degree of polymorphism and a
sufficient number of offspring differing in their post-anthesis drought tolerance. Wheat is a
segmental allopolyploid containing three distinct but genetically related homoeologous
genomes, A, B and D. The haploid content of bread wheat genome is approximately 1.7 X 10⁷
bp (Arumuganathan and Earle, 1991) with an average of 810 Mb per chromosome. Such a
large genome of hexaploid wheat has resulted from polyploidy and extensive duplications,
such that over 80% of the genome consists of repetitive DNA sequences (Gupta et al.,
1999b). For these reasons, there have been problems in the preparation of molecular maps and
in the development of markers for marker-assisted selection in wheat. The main problem has
been the failure of a variety of molecular markers to detect adequate and useful
polymorphism. However, despite these problems, success has been achieved in recent years
and molecular maps have become available for chromosomes of all homoeologous groups in
wheat by using different types of molecular markers. In the present study, one type of DNA
molecular markers, microsatellites (PCR-based DNA markers), was used to construct a
linkage map and to locate QTLs responsible for post-anthesis drought tolerance in wheat. The
gwm-SSRs used have known chromosomal assignments and were previously mapped in
several mapping populations, including the bread wheat populations ‘T. aestivum; W 7984’ x
‘T. aestivum; Opata85’ = ITMI population (Röder et al., 1995, 1998), ‘T. aestivum; W 7984’
Discussion
–––––––––––––––––––––––––– 76 –––––––––––––––––––––––––
x ‘T. aestivum; Prinz’ (Huang et al., 2003a) and tetraploid populations, ‘T. durum; Messapia’
x ‘T. dicoccoides; MG4343’ (Korzun et al., 1999) or ‘T. durum; Jennah Khetifa’ x ‘T. durum;
Cham1’ (Nachit et al., 2001). Although, the SSRs indicated less polymorphism than AFLP,
they were very informative, since they are co-dominant, locus specific and evenly distributed
along chromosomes (Röder et al., 1998). In addition, Plaschke et al. (1995), Röder et al.
(1995), Ma et al. (1996) and Bryan et al. (1997) agreed that SSRs showed a much higher
polymorphism and informativeness in hexaploid wheat than any other marker systems.
However, due to the large genome size, the development of microsatellite markers in wheat is
extremely time-consuming and expensive (Röder et al., 1998). The percentage of
polymorphic SSRs used in this study was 41.63% of the total number of tested SSRs. This
high rate of polymorphism found in the present population confirms the transferability of
SSRs between bread and durum wheat as has been shown in T. durum x T. dicoccoides
(Korzun et al., 1999) and T. durum x T. durum (Nachit et al., 2001) mapping populations. The
percentage of polymorphism of the F2:3 mapping population used in the present study was
higher than the numbers showed by Röder et al. (1995) or Ma et al. (1996) who found that the
percentage of polymorphic microsatellites was about 22% and 36% in common wheat,
respectively. This was expected because an interspecific ‘T. durum; ATRI 5283’ x ‘T.
aestivum; ATRI 15010’ cross was used. Using the synthetic wheat ‘W 7984’ for creating the
ITMI mapping population Röder et al., (1998), showed that 80% of 294 SSRs primer pairs
detected polymorphism between the two parents. These results, along with others (Prasad et
al., 1999, 2000; Roy et al., 1999) suggested that the microsatellite markers can be
successfully utilized for various types of investigation e.g., genome mapping, gene tagging,
evolutionary studies and germplasm characterization (see also section 1.3.5).
4.3.2. Linkage map construction
The population consisting of 81 F2:3 families from an interspecific hybridization of the
Chinese durum wheat landrace ‘ATRI 5283’ and the Ethiopian spring bread wheat landrace
‘ATRI 15010’ proved to be suitable for constructing a linkage map and for detecting QTL for
post-anthesis drought tolerance. Because of the difficulties in finding polymorphisms between
much more closely related varieties, an interspecific cross have been made. Many linkage
maps involve interspecific crosses because of low polymorphism among cultivated varieties
of wheat (Anderson et al., 1993; Devos et al., 1995). Since the numbers of loci controlling
quantitative traits are large, the use of large mapping populations will give a higher chance in
detecting these QTLs (Kicherer et al., 2000). Large population sizes have been used by others
Discussion
–––––––––––––––––––––––––– 77 –––––––––––––––––––––––––
like Keller et al. (1999b); Messmer et al. (2000) and Sourdille et al. (2000) who used
progenies of 226, 204 and 217 individuals, respectively, for constructing genetic maps.
However, other researchers used mapping populations with smaller numbers such as Bai et al.
(1999); de la Pena et al. (1999), Mingeot and Jacquemin (1999), Waldron et al. (1999),
Toojinda et al. (2000) and Huang et al. (2003a). These differences in the size of the mapping
populations may depend on the genome size of the organism, the generation of mapping
population and the nature of the inheritance of the trait under study (Beavis, 1998). In the
present study, 184 different polymorphic SSRs markers were used to construct the linkage
map of F2:3 families. A population of 81 F2 plants is certainly at the lower end of the plant
numbers that have been analysed in comparable studies. However, a larger population is a
much higher burden for population generation (due to sterility in the material) and population
analysis.
The 184 polymorphic marker loci covered the whole genome (A genome: 81; B
genome: 103). According to extended linkage mapping data from integrated genetic maps of
wheat (McGuire and Qualset, 1997) the average chromosome length varied between 150 and
200 cM, which would result in a total genome length of 3,200 to 4,200 cM. The map of this
study spans 2,603.34 cM, covering the wheat A and B genomes. The distribution of the
marker loci across the 14 chromosomes indicated that there are more markers identified on B
genome than on A genome. This result is in harmony with genetic maps obtained by Röder et
al. (1995, 1998, unpublished data) in bread wheat ‘W 7984’ x ‘Opata 85’ ITMI population;
in ‘W 7984’ x ‘Prinz’ population (Huang et al., 2003a) and in durum wheat populations,
Messapia x MG4343 (Korzun et al., 1999) and ‘Jennah Khetifa’ x ‘Cham1’ (Nachit et al.,
2001). The percentage of markers assigned to the respective genomes in this research is in
good agreement with the numbers obtained from other researchers. Comparable results were
obtained by Röder et al. (1998) who found that out of 279 microsatellite markers, 93 mapped
to the A genome, 115 to B genome and 71 to D genome. Thus it can be concluded, that the
number of markers assigned to each genome is in part a reflection of the relative amount of
genetic variation present among the different genomes of wheat. Therefore, in order to
increase the number of A and D genome markers, they could be isolated from T. monococcum
or T. tauschii, respectively. This idea of the potential of Aegilops tauschii the diploid
progenitor of the D genome of wheat as a source of microsatellite markers for hexaploid bread
wheat was investigated by Pestsova et al. (2000). Their data obtained, confirmed this idea. All
primer pairs that were functional in Aegilops tauschii amplified well in hexaploid wheat and
extended the existing wheat microsatellite map. Also, the use of new developed systems of
Discussion
–––––––––––––––––––––––––– 78 –––––––––––––––––––––––––
molecular markers like single nucleotide polymorphisms (SNPs, Gupta et al., 1999b) may
help in increasing the number of markers in different genomes including the A and D
genomes. The use of SNPs system, which led to rapid advancement in developing human
genetic map, would offer rapid and high-automated genotyping of wheat genome (Gupta et
al., 1999b).
4.4. Mapping QTLs for post-anthesis drought tolerance
The prime purpose of this study was to discover new genes for post-anthesis drought
tolerance. Several new QTLs were discovered in the ‘ATRI 5283’ x ‘ATRI 15010’ and ‘W
7984’ x ‘Opata 85’ mapping populations and, overall, this indicates that there is quite a lot of
genetic variation for the stem reserve mobilization trait.
4.4.1. Mapping QTL for stem reserve mobilization (Srm)
Abiotic stress such as drought, salinity and others generally reduce crop productivity.
It has been estimated that crops attain only about 25% of their potential yield because of the
detrimental effects of environmental stress (Boyer, 1982). Plant responses to water stress are
clearly influenced by the timing and intensity of stress (Ludlow and Muchow, 1990),
indicating a genotype x environment interaction, which makes the genetic analysis of such
traits very complicated. Stem reserve mobilization was defined as the ratio of 1000-grain
weight under chemical desiccation treatment to 1000-grain weight under control (Blum et al.,
1983a, 1983b). In wheat, the stem reserve plays an important role in supplying carbohydrate
to grains under post-anthesis drought stress (Blum et al., 1983a, 1983b; Reynolds, et al.,
2000; see also section 1.2.4.).
For the mapping of QTL for tolerance to drought, consistent drought condition is
critical for accurate assessment of the tolerance of plant genotypes and for determination of
the magnitude of the genetic factors that contribute to drought tolerance. This is especially
important for drought, since environment is one of the major determining factors for initiation
and development of drought. The identification of markers associated with stem reserve QTLs
would help breeders to construct beneficial allelic combinations and accelerate breeding
programs for the development of drought tolerant cultivars. The markers linked to low seed
size QTLs can also be used as indirect selection tools to eliminate the transfer of these alleles
into elite breeding lines. Characterization of QTLs for drought tolerance in this study provides
insight into an understanding of the mode of drought tolerance in wheat. The most-practical
application of the identified QTLs for drought tolerance components is to perform marker-
Discussion
–––––––––––––––––––––––––– 79 –––––––––––––––––––––––––
assisted selection aimed at efficient pyramiding of favourable QTL alleles to improve drought
tolerance in wheat. Further analysis of this population under different agroclimatic conditions
to find out stable QTLs as well as to identify additional genes/QTLs for post-anthesis drought
tolerance traits is our present effort. It is also possible to establish an ensemble of different
QTLs linked to stem reserve mobilization for improved seed size in standard varieties in
wheat.
Numerous QTL mapping studies examining drought tolerance and related traits in
maize, rice, barley and wheat have demonstrated that this trait is affected by several loci, each
of which have relatively small effects (Agrama and Moussa, 1996; McCouch and Doerge,
1995; Quarrie, 1996; Morgan and Tan, 1996). Polygenes controlling important metric traits
such as seed size are usually distributed among several QTLs, which may not linked to one
another (Law and Worland, 1973; Fatokun et al., 1992). The low level of contribution to
phenotypic variation explained by individual markers in our data confirms the quantitative
nature of seed-weight inheritance and implies that transfer of the grain size trait can not be
approached by any easy way through conventional breeding programs. To our knowledge, no
study has included the mapping of post-anthesis drought tolerance genes/QTLs in wheat.
In the present study, two wheat mapping populations, derived from the cross ‘ATRI
5283’ x ‘ATRI 15010’ and ‘W 7984’ x ‘Opata 85’ grown in two different environments
(Gatersleben field season 2001 or 2002 and 2003), were used to detect QTLs for post-anthesis
drought tolerance. In order to better understand the mechanisms of post-anthesis drought
tolerance via stem reserve mobilization in wheat, a molecular dissection of QTLs for stem
reserve in two different genetic backgrounds was studied. The parents were well studied at
vegetative and grain yield levels and performed differently. The two populations segregated
for 1000-grain weight stress tolerance index (STI). The contrasting features in the parents and
the mapping populations made this germplasm ideal for studying drought tolerance in wheat.
The consistent QTLs identified in this study could be useful in marker-assisted selection for
high grain size in wheat drought tolerance breeding programs. Stem reserve is the only
putative post-anthesis drought tolerance trait that has been associated with sustained grain
yield in wheat plants under drought stress (Blum et al., 1983a, 1983b). For the first time,
using two mapping population of F2:3 families and RILs, QTLs were mapped for stem reserve
mobilization in wheat.
The 81 F2:3 families of the ‘ATRI 5283’ x ‘ATRI 15010’ cross were grown in two
different environments. At the same time, 184 SSR markers were used to construct the genetic
linkage map. It may be recalled that only 41.63% of gwm primers detected polymorphism
Discussion
–––––––––––––––––––––––––– 80 –––––––––––––––––––––––––
between the parental genotypes that differed for stem reserve mobilization. Six microsatellite
markers (Xgwm497a, Xgwm480, Xgwm247, Xgwm251, Xgwm1011a and Xgwm611) showed
an association with QTLs (designated QSrm.ipk-1A, QSrm.ipk-3A, QSrm.ipk-3B, QSrm.ipk-
4B, QSrm.ipk-6A and QSrm.ipk-7B) for stem reserve mobilization, located on chromosomes
1A, 3A, 3B, 4B, 6A and 7B. Alleles derived from the tolerance parent ‘ATRI 5283’ were
associated with a positive effect on stem reserve mobilization for four of the six QTLs
detected for this trait in F2:3 mapping population. The four QTLs for stem reserve
mobilization increase were mapped on chromosomes 3B, 4B, 6A and 7B. The number and
location of significant QTLs detected for stem reserve mobilization varied between the two
environments. Since single environments differed in the plant development during vegetative
stage and consequently in reproduction stage, different genes might be relevant for tolerance
in different environments. Also, since the post-anthesis drought tolerance is controlled by
group of QTLs, which affected by environment, gene expression of these QTLs would differ
in different environments. This can be explained from the QTLs, which were identified in
some environments at low LOD values. Two of these QTLs, which were identified on
chromosomes 3A and 7B in both environments. Also, another QTL which was appointed in
two different environments at Gatersleben 2002 and 2003 on chromosome 4B. Low values of
LOD scores in one environment explained the low contribution of the QTL to the phenotypic
variance in this environment. In other words, these QTLs are present at the specific loci and
the different factors of environment pressure were not strong enough to let these QTLs to be
expressed at the maximum level. In the proper environments, the same QTLs showed high
level of gene expression (LOD more than 3.0).
Keeping in view the fact, that the F3 families showed a distribution, it may be
concluded that there may be other QTLs controlling the difference in post-anthesis drought
tolerance between the parents. The presence of many QTLs for grain weight under non-
stressed conditions was also suggested in recent studies (Campbell et al., 1999, Halloran,
1976; Bannier, 1979; Chojecki et al. 1983; Zheng et al. 1993, Börner et al., 2002b and Huang
et al. 2003a).
Although the progress in preparation of wheat genetic maps has been steady, the use
of RFLP markers in preparation of molecular maps has rather been slow because of the very
limited level of RFLP polymorphism detected in wheat. Therefore, the preparation of
molecular maps necessitated the use of populations derived from wide crosses. Consequently,
at international level a mapping population was derived by single seed descent (SSD) F8 from
the cross of ‘W 7984’, an amphihexaploid wheat synthesized from Aegilops tauschii (DD)
Discussion
–––––––––––––––––––––––––– 81 –––––––––––––––––––––––––
and Triticum durum (AABB) variety ‘Altar 84’ with the Mexican variety ‘Opata 85’ from
CIMMYT. The population has commonly been described as ITMI (International Triticeae
Mapping Initiative) and map prepared on the basis of ITMI has been described as ITMI map.
Using ITMI population for microsatellite markers, a detailed genetic map using 279
microsatellite loci has already been published (Röder et al., 1998). Keeping in view the
importance of ITMI population, this population was also used for mapping the RFLP and the
microsatellite markers that were linked with post-anthesis drought tolerance traits identified
during the present study. Eight RFLP and microsatellite markers namely (Xgwm357,
Xmwg938b, Xgwm249a, Xgwm639c, Xfbb238b, Xgwm494, Xgwm302 and Xfbb189b) showed
an association with QTLs (designated QSrm.ipk-1A, QSrm.ipk-1B, QSrm.ipk-2D, QSrm.ipk-
5B, QSrm.ipk-5D, QSrm.ipk-6A, QSrm.ipk-7B and QSrm.ipk-7D) for stem reserve
mobilization. They mapped to chromosomes 1A, 1B, 2D, 5B, 5D, 6A, 7B and 7D,
respectively. For stem reserve mobilization, three QTLs were detected in the two
environments. Those ‘stable’ QTLs were located on chromosomes 2D, 5D and 7D.
During the last two decades, several attempts have been made to understand the
genetic basis of seed size in wheat. Halloran (1976) has reported that chromosome 4B is
associated with seed size. Petrovic and Worland (1988) have identified that 1000-grain
weight is associated with chromosome 5D. Giura and Saulescu (1996) have reported that
chromosomes 6D and 4A are associated with a high 1000-grain weight while 5B and 5D are
associated with a low 1000-grain weight. A QTL for 1000-grain weight on chromosome 3A
was detected by Shah et al. (1999). Campbell et al. (1999) have shown that chromosomes 1A,
1B, 3B and 7A have loci which control 1000-grain weight, while Gupta et al. (1999a) have
found chromosome 1AS to be associated with 1000-grain weight in the same cross. Ammiraju
et al. (2001) identified QTLs for high and low seed size on chromosomes 6B, 2D and 1D.
Börner et al. (2002b) mapped the QTLs for 1000-grain weight on chromosomes 1B, 2D, 3A,
3B, 5A, 6A, 6B, 7B and 7D. Groos et al. (2003) detected nine QTLs for 1000-grain weight on
chromosomes 1D, 2B, 2D, 3A, 5B, 6A, 6D, 7A and 7D. Recently, Huang et al. (2003a)
identified the chromosomal location for 1000-grain weight on chromosomes 2A, 2D, 4D, 5B,
7A, 7B and 7D. The QTLs detected in the present study on chromosomes 1B, 2D, 3A, 3B,
5B, 6A, 7B and 7D may be comparable to that found by Börner et al. (2002b) and Huang et
al. (2003a). The chromosomes 1A, 4B and 7A identified during the present study, are three of
the eight chromosomes (1A, 1D, 2B, 4B, 5B, 6B, 7A and 7D) that were earlier identified to
carry the loci for high grain weight, using monosomic analysis (Varshney et al., 2000).
Discussion
–––––––––––––––––––––––––– 82 –––––––––––––––––––––––––
Concurrently, Jing et al. (2000) found that a drought tolerance gene in an ancient
Chinese wheat landrace ‘Pingyao Bai Mai’ and its derived vareities was putatively linked to
microsatellite loci Xgwm11, Xgwm157, Xgwm5, Xgwm44 and Xgwm111 on chromosomes 1B,
2D, 3A and 7D. This result fits well with the result of the present study.
Morgan (1991) suggested a genomic location for osmoregulation on chromosome 7A
in wheat by studying chromosome substitution lines. Morgan and Tan (1996) have located a
putative gene for osmoregulation on chromosome 7AS of wheat using RFLP analysis. The
QTL on chromosome 7A found by Morgan (1991) and Morgan and Tan (1996) were not
identified here.
Alleles derived from the synthetic wheat ‘W 7984’ were associated with a positive
effect on stem reserve mobilization for four of the 8 QTLs detected for this trait in ITMI
mapping population. The four QTLs for stem reserve mobilization increase were mapped on
chromosomes 2D, 5B, 5D and 7D. The stem reserve mobilization increasing QTL, QSrm.ipk-
2D, may be a pleiotropic effect of the gene Ppd1 for day length insensitivity that is important
for the adaptation to short days and increasing the yield in southern Europe (Börner et al.,
1993; Worland et al., 1998a). Two loci, QSrm.ipk.7B and QSrm.ipk.7D, were located in the
homoeologous positions of homoeologous group 7. Both are in comparable regions like the
1000-grain weight QTLs reported by Börner et al. (2002b) detected in the same population.
The results of the present study agree with other reports for the location of QTLs for
1000-grain weight except, the QTL on chromosomes 1D, 2A, 2B, 4A, 4D, 5A, 6B, 6D and 7A
were not identified in the present study. Our results indicate that QTLs for stem reserve
mobilization are spread over the genome. Also, genomes A and B play a great role in
controlling this trait and genome D has little effects.
Finally, the few studies on the location of QTLs involved in drought tolerance showed
the difficulty in finding general key regions for adaptation. The dissection of each adaptive
trait enables major chromosomal regions to be located. The validity of the regions was
strengthened when related to other studies or to results obtained for different adaptive traits.
The co-location of the QTLs detected for the different traits allowed us to identify important
genomic regions for stem reserve mobilization.
In conclusion, the key points revealed by our results are the stability of some QTLs for
stem reserve mobilization and the existence of genetic factors specific for drought tolerance.
This information can be useful in a breeding program aimed at improving yield stability.
Discussion
–––––––––––––––––––––––––– 83 –––––––––––––––––––––––––
4.4.2. Mapping QTL for vegetative traits
Although the prime purpose of this study was to discover new genes for post-anthesis
drought tolerance, the opportunity was also taken to evaluate the genetics of vegetative traits
under non-stress condition. Several new QTLs were discovered in the ‘ATRI 5283’ x ‘ATRI
15010’ and ‘W 7984’ x ‘Opata 85’ mapping population.
4.4.2.1. Plant height (Ht)
A reduction in plant height can improve lodging resistance and indirectly increase
yield. The genetic control of plant height is known to be complex involving many genes
(Börner et al., 1996). In the present study, eight and four QTLs were detected for plant height
on chromosomes 2A, 2B, 3A, 3B, 5A and 7A in F3 families and on chromosomes 3B, 4D, 5A
and 6D in RILs population.
Law et al. (1976) mapped gene/s for plant height on chromosome 2B. Roberts (1990)
found another locus on 5A. Hyne et al. (1994) located QTLs for plant height on chromosomes
6B and 7B. Cadalen et al. (1998) using RFLP markers found QTLs for plant height on 4A,
4D, 7A and 7B. Kato et al. (1999) identified 3 QTLs on 5AL chromosome. Keller et al.,
(1999a) found 11 QTLs for plant height on chromosomes 1A, 2A, 4A, 5A, 6A, 1B, 4B, 5B
and 7B. In addition, Shah et al. (1999) appointed a QTL on chromosome 3AL. Börner et al.
(2002b) mapped 12 QTLs for plant height on chromosomes 1A, 1B, 2D, 3A, 3B, 3D, 4A, 4B,
4D, 5D, 6A and 6B using RILs. Finally, Huang et al. (2003a) identified 5 chromosome
regions for plant height on chromosomes 2B, 4B, 4D, 6A and 7B using advance backcross
mapping population.
The results of the present study agree with other reports for the location of QTLs for
plant height except, the QTL on chromosome 6D, which was not identified by others. The
QTLs controlling plant height identified by others on chromosomes 1A, 1B, 2D, 3D, 4A, 4B,
5B, 5D, 6A, 6B and 7B were not detected in the present study. Our results and those of other
researchers indicate that QTLs for plant height are wide spread over the genome. Genomes A
and B play an important role in controlling this trait compared to the D genome.
4.4.2.2. Flowering time (Flt)
Drought escape through early flowering and/or short growth duration is advantageous
in environments with terminal drought stress and where root growth is inhibited by physical
or chemical barriers (Turner, 1986; Blum, 1988; Blum et al., 1989). On other hand, later
flowering can be beneficial in escaping early-season drought, if drought is followed by rains
Discussion
–––––––––––––––––––––––––– 84 –––––––––––––––––––––––––
(Ludlow and Muchow, 1990). Under non-stress conditions, late-flowering varieties tend to
yield higher than early-flowering ones (Turner, 1986; Ludlow and Muchow, 1990). This is
because the early-flowering varieties are likely to leave the yield potential unutilized
(Muchow and Sinclair, 1986).
Heading date is critical determinant of crop adaptation. Many genes are involved in
fitting crop cultivars to prevailing environmental conditions; for example photoperiod and
vernalization response genes that cause plants to change from vegetative growth to
reproductive growth. Also, heading date is influenced by genes independent of environmental
conditions (earliness per se) (Kato and Wada, 1999). Wheat cultivars are usually classified
into two growth habits, namely, spring and winter types. The major physiological determinant
of the difference between the two types is the requirement of winter wheats for certain period
of growth at low temperature, called vernalization, before flora initiation. In hexaploid wheat,
there are five genetic loci involved in response to vernalization requirement and the
chromosomal locations of four have been identified; namely Vrn-A1 on 5A (Vrn1), Vrn-D1 on
5D (Vrn3), Vrn-B1 on 5B (Vrn2) and Vrn-B4 on 7B (Vrn5) (Law et al., 1976; Snape et al.,
1985; Galiba et al., 1995; Kato et al., 1998; Snape et al 1998). Genes responding to
photoperiod also affect heading date. They are designated Ppd-D1 (formerly Ppd1), Ppd-B1
(formerly Ppd2) and Ppd-A1 (formerly Ppd3) on the short arms of chromosomes 2D, 2B and
2A, respectively, (Pirasteh and Welsh, 1975; Scarth and Law, 1983).
Stelmakh et al. (1998) compared different effect values of Vrn-A1, Vrn-B1, Vrn-D1
genes in relation to heading date, plant height and yield components. He found that varieties
possessed Vrn-D1 could adapt to stress conditions such as high temperature and drought at
grain filling stage and achieved high grain yield. Research of wec (wheat embryo cold)
treatment genes associated with heading factors was also carried out by Shindo and Sasakuma
(2002) using near isogenic lines of Vrn-A1. The only studies for Vrn-D1 gene were just
genetic mapping done by Snape et al. (2001) and Shindo et al. (2003).
Furthermore, Law and Wolfe (1966) located a genetic factor for ear emergence time
on chromosome 7BS. Law et al. (1976) mapped the heading date on 5A. Hoogendoorn (1985)
detected genes involved in earliness on chromosomes 3A, 4A, 4D, 6B and 7B. Miura and
Worland (1994) found a QTL on chromosome 3A for heading date. Also, Hyne et al. (1994)
identified two QTLs on 7A and 7D chromosomes for heading date. Kato et al. (1998)
indicated two QTLs for heading date on chromosome 5A. Miura et al. (1999) identified two
genes affecting earliness on chromosome 3A. In addition, Shah et al. (1999) appointed a QTL
on 3A for heading date. Keller et al. (1999) detected 10 QTLs for heading date on

Discussion
–––––––––––––––––––––––––– 85 –––––––––––––––––––––––––
chromosomes 2A, 2B, 3A, 3B, 4A, 4B, 5A, 5B, 7A and 7B. There was a mapping report by
Sourdille et al. (2000) who found three QTLs on 2BS, 5AL and 7BS chromosomes for
heading date. Finally, Börner et al. (2002b) mapped QTLs for flowering time on
chromosomes 2B, 2D, 3A and 5D.
In the present study, four and seven QTLs were identified for flowering time on
chromosomes 1A, 2A, 3B and 7A in F3 families and on chromosomes 1A, 2B, 3D, 5B, 5D,
7B and 7D in ITMI population. The QTLs on chromosome 2B and 5D, QFlt.ipk-2B and
QFlt.ipk-5D, might be the same as that found in the ITMI population recently (Börner et al.,
2002b). New QTLs on chromosomes 1A, 3D, 5B, 7B and 7D were detected here for the first
time.
In this study two QTLs for flowering time and for plant height were found in the same
intervals on chromosomes 1A and 3B in F2:3 families. This observation may indicate that
these traits are linked to each other. Our results and those of other researchers (Keller et al.
1999a) indicate that QTLs for these two traits are spread over the genome. As for flowering
time and plant height, these QTLs most probably are at the same loci displaying, these QTLs
are either tightly linked or have pleiotropic effects.
Early heading and short plants are desirable traits in wheat therefore, their association
with drought tolerance is very useful in wheat improvement. One mechanism of drought
tolerance is reducing the plant life cycle. Development of early maturing variety can help to
escape from drought stress.
4.4.3. Mapping QTL for grain characters
The shape and size of wheat grains is a primary determinant in the value of the grain
(Campbell et al., 1999). It has an effect on many factors of the agronomy on end use of the crop
and therefore is an important trait for genetic study. Millers obtain higher flour yields from larger
grains (Wiersma et al., 2001; Giura and Saulescu, 1996) and therefore place pressure on breeders
to ensure new varieties exhibit large grains. This has an effect on the specific weight of the grain
sample, with large, full grains producing higher specific weights than small, shrivelled grains. As
grain value is partly determined by specific weight values, again seed size and shape may be very
important in increasing the premium on grain samples. It has been suggested in a number of
studies that increasing grain size is an important factor in increasing yield from a crop. However,
this may have some negative implications on the end use of the crop, with larger kernelled lines
often showing a decrease in protein content due to the extra grain size being composed mainly of
starch rather than protein. It has also been shown that large seeds may give a better start for plants
Discussion
–––––––––––––––––––––––––– 86 –––––––––––––––––––––––––
grown in the field, with greater seedling size and speed of growth coming from larger seeds
(Bredemeier et al., 2001).
The economic value of the wheat crop is determined by class, which depends in part on
grain morphology and texture and by test weight. Colour, shape and length of the grain and shape
of the germ are used to determine wheat grain classes (GIPSA, 1997).
Although the prime purpose of this study was to discover new genes for post-anthesis
drought tolerance, the opportunity was also taken to evaluate the genetics of grain characters
under post-anthesis drought stress condition. In fact this study has provided the first complete
analysis of grain characters under post-anthesis drought stress in wheat. Using image analysis
techniques, it was easy to measure a large number of grains and to process the results on a
computer, avoiding laborious hand measurements. It was thus possible to measure variation in
grain dimensions for the large number of samples needed for QTL mapping studies of such traits.
All grain traits were measured by digital image analysis (DIA) (Symons and Fulcher, 1988),
except grain form density factor. Grain form density factor was derived from DIA parameter and
agronomic trait. Density factor, defined as grain weight/grain area, could be considered as a grain
quality character. Grain density is traditionally measured using displacement assays with aqueous
solutions (Peterson et al., 1986).
This study has shown that grain character STIs are under the genetic control of many
genes. Interestingly, there are different ‘types’ of QTL. First, there are those that influence the
components of grain area STI, width STI, length STI, circumference STI, Grain roundness STI,
Grain form-density factor STI, independently. For example in F3 mapping population, there are
QTLs on chromosomes 6A and 6B that influences grain area STI, on chromosomes 7A and 7B
that influences grain length STI and on chromosome 5B that influences grain width STI. The
importance of such QTL is in the fact that they indicate that it should be possible to breed for
different grain shapes, such as long thin grain, short thin grain etc., through utilizing such
variation. Secondly, there are QTL, which influence more than one trait, for example, the grain
area and grain width STIs on chromosome 1A. These imply that there are ‘general’ grain size
factors, which influence all dimensions. Such variation means that it should be possible to
increase grain size through simultaneously increasing all dimensions. By judicious selection of
both types of QTL it should be possible to breed for larger grains and hence increase yield, with
different grain shapes, as desired. Several QTL control grain area and these seemed to reflect the
probable pleiotropic effect of QTL for grain width, grain length and grain circumference. Thus,
the variation in grain area is due to grain shape and size differences. This indicates, not
surprisingly, that to maximize grain area means breeding for many small grains. Thus, selection

Discussion
–––––––––––––––––––––––––– 87 –––––––––––––––––––––––––
has to be a compromise between ‘good’ grain shape and size. This could be achieved by directed
plant breeding for the types of QTLs identified here.
It seems, from the differences in numbers and positions of the QTLs found in these
studies, that different combinations of these genes may be responsible for producing the different
phenotype of size and shape in different wheat varieties, although, of course, environment and
genotype x environment interactions play a part.
Using monosomic analysis, Giura and Saulescu (1996) studied grain characters in an
Italian local wheat population and indicated that kernel length was increased by chromosomes 1B,
2B, 3A, 4A and 4B; kernel width by chromosomes 1A and 1B and density by 6A and 6D.
Campbell et al. (1999) detected QTLs for kernel traits on chromosomes 1A, 2A, 2B, 2D, 3B, 4A,
5A, 7A and 7B. Several researchers have mapped QTLs for seed size and shape in cereal grains.
In wheat, Dholakia et al. (2003) discovered QTLs for kernel size and shape on wheat
chromosomes 2B, 2D, 5B, 6B and 7B.
In our study, the main QTLs for grain morphology were located on chromosomes 1A, 1B,
1D, 2A, 2B, 2D, 3B, 3D, 4A, 4B, 4D, 5A, 5B, 5D, 6A, 6B, 6D, 7A, 7B and 7D. The
homoeologous group 1, 2, 3, chromosomes were mentioned in several of the studies listed above.
An interesting observation in this analysis was the identification of new loci associated with grain
traits under post-anthesis drought stress which have not reported earlier on 1D, 3D, 5D and 7D,
however no QTLs were detected on chromosome 3A in the present study. Like in other species
QTLs are population specific (Melchinger et al., 1998).
4.5. Sources of alleles for post-anthesis drought tolerance
Post-anthesis drought tolerance genes are located throughout the genome and are genotype
dependent. In this study, it was found that for stem reserve mobilization four putative QTLs were
derived from ‘ATRI 5283’ in F3 families and other four were derived from the synthetic wheat ‘W
7984’ in RILs population. However, some of the QTLs were also derived from sensitive parents
of the two populations. Similar results for other traits of interest were found by Börner et al.
(2002b) or Huang et al. (2003a). These findings further confirm that post-anthesis drought
tolerance is a quantitative trait and that apparently sensitive parents may contain alleles for
tolerance, which may not be found in the tolerant parents. It can be concluded that the sensitive
parents ‘ATRI 15010’ and ‘Opata 85’ may contain some tolerance alleles that when combined
with alleles from tolerant parents can result in increased level of tolerance.
4.6. Perspectives for marker-assisted selection
Early generation selection for drought in the field is difficult and unpredictable, and
genotype screening requires replications and is resource intensive. Consequently, marker-assisted

Discussion
–––––––––––––––––––––––––– 88 –––––––––––––––––––––––––
selection could be used to facilitate the transfer of these genes for drought tolerance into well
adapted genotypes. However, there are certain considerations need to be taken when deciding
which QTL should be emphasized in MAS strategy. First of all it is necessary to decide which
region(s) has enough evidence for the presence of a major QTL. This can be achieved by setting
appropriate thresholds (LOD more than 3) for the identification of the QTLs and by detecting
QTLs in the same region in different environments. In this study, three QTLs for stem reserve
mobilization on chromosomes 3A, 4B and 7B in F3 families and three QTLs on chromosomes 2D,
5D and 7D in ITMI population fulfilled these criteria. They showed high values of LOD scores
and they were detected in two environments. Beside MAS for drought, selection can be done by
plant height, flowering time and grain morphology. Finally, the selected QTL for MAS should
indicate high levels of contribution to the phenotypic variance, which measured by PV. However,
this consideration should be taken with caution because these values can be significantly
influenced by population sizes and the number of markers used in the multi-locus model (Beavis,
1998). In simulation studies, QTL analyses using population sizes of 100 identified only a subset
of the total number of simulated QTLs and often over-estimated their effects (de la Pena et al.,
1999). It can be concluded that the three QTLs on chromosomes 3A, 4B and 7B in F3 families and
three QTLs on chromosomes 2D, 5D and 7D in ITMI population, which were constant under
different environmental conditions, are promising candidates for MAS.
Molecular markers closely linked to genes of agronomic importance have been
demonstrated to be useful tools for indirect selection in a barley breeding programmes (Jefferies et
al. 1997). Marker-assisted selection is time-efficient, non-destructive and depending on linkage
relationships, characterised by low selection error. Marker assisted selection should be done on a
case by case basis. Further investigation for drought tolerance will be required to establish the
importance of the identified genomic regions in other backgrounds. Also, field evaluation is
required to establish the effectiveness of the drought screening system in modelling water
responses and in evaluating the stability of QTLs across environments. Our results indicate the
existence of genes or gene clusters with major effects, which are involved in the control of
significant proportions of the phenotypic variation in quantitatively inherited traits related to
drought tolerance.
The QTLs and molecular markers for post-anthesis drought tolerance provide further
evidence for the inheritance of the stem reserve mobilization. Compared with conventional
methods, QTLs and molecular markers provide breeders new alternatives for selection. Marker-
assisted selection can accelerate breeding by reducing the time to develop new cultivars (Tanksley
and Hewitt, 1988; Paterson et al., 1991). Further research is needed on molecular markers and
QTL mapping to screen potential parents for drought tolerance in wheat.

English Summary
–––––––––––––––––––––––––– 89 –––––––––––––––––––––––––
5. SUMMARY 5.1. English summary
This work was carried out at the Institut für Pflanzengenetik und Kulturpflanzenforschung
(IPK), Gatersleben, Germany, during the wheat growing seasons, 2001, 2002 and 2003. Seventy-
seven wheat accessions and two wheat mapping populations were used. The objectives of the
present study were:
1. To define genotypes with high stem reserve mobilization ability.
2. To characterize the expression and inheritance of traits associated with post-anthesis drought
tolerance and grain development.
3. To determine of the number, chromosome position and effects of the QTLs associated with
drought tolerance.
4. To identify SSR and RFLP markers associated with the QTLs for drought tolerance.
The obtained results could be summarized as follows
5.1.1. Screening wheat genotypes for post-anthesis drought tolerance
1) Among the seventy-seven wheat genotypes tested in the wheat growing season
2001/2002, the 1000-grain weight stress tolerance index (mean damage values after
desiccation) ranged from 22.26% to 87.78%.
2) The wheat genotypes ATRI 1896, ATRI 5283, ATRI 17620, Synthetic/N, ATRI 9882,
ATRI 5951, W 7984 and ATRI 7099 exhibited the highest stress tolerance index values
(87.78%, 82.41%, 80.23%, 78.46%, 77.71%, 74.33%, 70.80% and 70.06%, respectively).
3) The wheat genotypes ATRI 11457, ATRI 11445, ATRI 6931, ATRI 10213, Capelle-
Desprez, ATRI 10197, ATRI 1634 and Bezostaya exhibited the lowest stress tolerance
index values (22.26%, 25.72%, 26.60%, 26.88%, 30.29%, 30.37%, 30.55% and 31.13%,
respectively).
4) There was genetic diversity in post-anthesis drought tolerance within the wheat
germplasm.
5.1.2. Construction of the molecular linkage map
1) Of 442 Gatersleben Wheat Microsatellite (GWM) primer pairs tested, a total of 184 GWM
(41.63%) assigned to the A and B genomes showed polymorphism between the parents
‘ATRI 5283’ (tolerant) and ‘ATRI 15010’ (sensitive) and were used for mapping in F2
generation.
2) The map was constructed using the data of 184 gwm-SSR molecular markers on 81 F2
plants using the F2 model in the Mapmaker program. The base map spans 2,603.34 cM.
English Summary
–––––––––––––––––––––––––– 90 –––––––––––––––––––––––––
103 and 81 gwm markers were mapped on B and A genomes, respectively. The five
chromosomes 6B, 4B, 2A, 3B and 7A included the highest number of loci mapped.
3) The average distance between marker pairs was 15.17 cM.
4) Chromosomes 2A, 4B, 6B and 7A showed marker clustering around the centromeric
region.
5.1.3. Mapping QTLs for post-anthesis drought tolerance (PADT)
The PADT mapping population consisted of 81 F3 families developed from the cross
between ‘ATRI 5283’ and ‘ATRI 15010’. Also, post-anthesis drought tolerance was recorded
on the synthetic spring wheat genotype ‘W 7984’, the Mexican spring wheat variety ‘Opata
85’ and a set of 114 recombinant inbred lines (RILs) from the International Triticeae Mapping
Initiative (ITMI) population.
5.1.3.1. Mapping QTLs for stem reserve mobilization (Srm)
1) Wide or continuous frequency distributions with transgressive segregants were observed
in both populations as one would expect for QTLs. The continuous distributions of stem
reserve mobilization indicated that the trait is polygenic in nature and quantitatively
inherited. The transgressive segregation for high stem reserve indicated the potential for
increasing the grain size under post-anthesis drought stress.
2) The individual QTLs for PADT were identified by the single marker analysis using the
QGENE program. Six microsatellite markers (Xgwm497a, Xgwm480, Xgwm247,
Xgwm251, Xgwm1011a and Xgwm611) showing an association with QTLs (designated as
QSrm.ipk-1A, QSrm.ipk-3A, QSrm.ipk-3B, QSrm.ipk-4B, QSrm.ipk-6A and QSrm.ipk-7B)
were located on chromosomes 1A, 3A, 3B, 4B, 6A and 7B, respectively, analysing the
‘ATRI 5283’ x ‘ATRI 15010’ cross. The percentage of the phenotypic variance (%PV)
explained by a single QTL ranged from 13.41% to 24.74% in F3 families. In the ITMI-
population eight RFLP and microsatellite markers (Xgwm357, Xmwg938b, Xgwm249a,
Xgwm639c, Xfbb238b, Xgwm494, Xgwm302 and Xfbb189b) showed an association with
QTLs (designated as QSrm.ipk-1A, QSrm.ipk-1B, QSrm.ipk-2D, QSrm.ipk-5B, QSrm.ipk-
5D, QSrm.ipk-6A, QSrm.ipk-7B and QSrm.ipk-7D) for stem reserve mobilization that
mapped to chromosomes 1A, 1B, 2D, 5B, 5D, 6A, 7B and 7D, respectively. The
percentage of the phenotypic variance (%PV) explained by a single QTL ranged from
10.17% to 42.22%.
3) In the ‘ATRI 5283’ x ‘ATRI 15010’ cross, the ‘stable’ QTLs were located on
chromosomes 3A, 4B and 7B. Other three ‘stable’ QTLs were located on chromosomes
2D, 5D and 7D in the ITMI population.

English Summary
–––––––––––––––––––––––––– 91 –––––––––––––––––––––––––
5.1.3.2. Mapping QTLs for vegetative traits
1) Wide or continuous frequency distributions with transgressive segregants were observed
as one would expect for QTLs. The continuous distributions of plant height (Ht) and
flowering time (Flt) indicated that plant height and flowering time are polygenic in nature
and quantitatively inherited.
2) In F3 families of the ‘ATRI 5283’ x ‘ATRI 15010’ cross, eight QTLs were detected for
plant height on chromosomes 1A, 2A, 2B, 3A, 3B, 4A, 5A and 7A. For flowering time,
four QTLs were identified on chromosomes 1A, 2A, 3B and 7A. The phenotypic variance
(%PV) ranged from 12.08% to 22.96% and from 12.37% to 23.33% for plant height and
flowering time, respectively. Analysing the ITMI population for plant height, four QTLs
were detected on chromosomes 3B, 4D, 5A and 6D. Whereas for flowering time, seven
QTLs were identified on chromosomes 1A, 2B, 3D, 5B, 5D, 7B and 7D. The phenotypic
variance (%PV) ranged from 15.91% to 30.01% and from 12.91% to 22.61% for plant
height and flowering time, respectively.
3) In the ‘ATRI 5283’ x ‘ATRI 15010’ cross, four ‘stable’ QTLs were located on
chromosomes 2A, 3A, 5A and 7A for plant height. For flowering time, three stable QTLs
were identified on chromosomes 2A, 3B and 7A analysing the ‘ATRI 5283’ x ‘ATRI
15010’ cross, whereas one ‘stable’ QTL for flowering time was located on chromosome
2B in the ITMI population.
5.1.3.3. Mapping QTLs for grain character
1) Wide or continuous frequency distributions with transgressive segregants were observed
in F3 families and RILs. The presence of transgressive segregants for all the grain trait
STIs suggested that the parents selected for this analysis had alleles associated with low
and high values of these traits. The continuous distributions indicated that the characters
are polygenic in nature and quantitatively inherited.
2) In the present, the main QTLs for grain morphology STIs were located on chromosomes
1A, 1B, 1D, 2A, 2B, 2D, 3B, 3D, 4A, 4B, 4D, 5A, 5B, 5D, 6A, 6B, 6D, 7A, 7B and 7D.
Zusammenfassung
–––––––––––––––––––––––––– 92 –––––––––––––––––––––––––
5.2. Zusammenfassung
Die Arbeit wurde in den Jahren 2001, 2002 und 2003 am Institut für Pflanzengenetik und
Kulturpflanzenforschung (IPK), Gatersleben, durchgeführt. Siebenundsiebzig Weizen-
akzessionen und zwei Kartierungspopulationen wurden analysiert. Die Ziele der Arbeit waren:
1. Das Auffinden von Genotypen mit der Fähigkeit in hohem Maße Halmreserven zu
mobilisieren.
2. Die Charakterisierung der Expression und Vererbung von Merkmalen, welche für die
Trockentoleranz nach der Blüte und die Kornentwicklung verantwortlich sind.
3. Das Feststellen der Anzahl, der Position auf dem Chromosom und der Effekte von QTL,
welche die Trockentoleranz steuern.
4. Die Identifizierung von SSR und RFLP Markern, die zu QTLs für Trockentoleranz gekoppelt
sind.
Die erzielten Ergebnisse können wie folgt zusammengefasst werden
5.2.1. Screening von Weizengenotypen auf Trockentoleranz nach der Blüte
1) Innerhalb der 77 analysierten Weizengenotypen schwankte der 1000-Korngewicht-
Stresstoleranz Index (mittlere Schädigung nach Dessikation) zwischen 22,26% und
87,78%.
2) Die Weizengenotypen ATRI 1896, ATRI 5283, ATRI 17620, Synthetic/N, ATRI 9882,
ATRI 5951, W 7984 und ATRI 7099 hatten die höchsten Stresstoleranz Indices. Diese
betrugen 87,78%, 82,41%, 80,23%, 78,46%, 77,71%, 74,33%, 70,80% bzw. 70,06%.
3) Die Weizengenotypen ATRI 11457, ATRI 11445, ATRI 6931, ATRI 10213, Capelle-
Desprez, ATRI 10197, ATRI 1634 und Bezostaya hatten die geringsten Stresstoleranz
Indices. Diese betrugen 22,26%, 25,72%, 26,60%, 26,88%, 30,29%, 30,37%, 30,55%
bzw. 31,13%.
4) Innerhalb der Weizenkollektion war eine Variabilität für Trockentoleranz nach der Blüte
nachweisbar.
5.2.2. Konstruktion der molekularen Kopplungskarte
1) Von den getesteten 442 Gatersleben Weizen Mikrosatelliten (GWM) Primerpaaren
zeigten 184 (41,63%) der auf dem A oder B Genom lokalisierten GWM einen
Polymorphismus zwischen den Eltern ‘ATRI 5283’ (tolerant) und ‘ATRI 15010’
(sensitive). Diese wurden für die Kartierung der F2 Population genutzt.
2) Unter Verwendung der 184 gwm-SSR Maker und 81 F2 Pflanzen wurde eine Karte mittels
Mapmaker Programm (F2 Modell) konstruiert. Die Karte überspannt 2603,34 cM. Auf

Zusammenfassung
–––––––––––––––––––––––––– 93 –––––––––––––––––––––––––
dem A bzw. B Genom wurden 103 bzw. 81 gwm Marker kartiert. Auf den Chromosomen
6B, 4B, 2A, 3B und 7A konnten die meisten Marker Loci kartiert werden.
3) Der mittlere Abstand zwischen den Markern beträgt 15,17 cM.
4) Auf den Chromosomen 2A, 4B, 6B und 7A waren die Marker in Zentromerbereich
geklustert.
5.2.3. Kartierung von QTLs für Trockentoleranz nach der Blüte
Die Kartierungspopulation bestand aus 81 F3 Familien, hervorgegangen aus der Kreuzung
zwischen ‘ATRI 5283’ und ‘ATRI 15010’. Außerdem wurde die Trockentoleranz nach der
Blüte bei dem sythetischen Sommerweizen ‘W 7984’, der mexikanischen Sommerweizensorte
‘Opata 85’ und insgesamt 114 rekombinanten Inzuchtlinien (RILs) einer Population der
Internationalen Triticeae Mapping Initiative (ITMI) bestimmt.
5.2.3.1. Kartierung von QTLs für Halmreserve Mobilisierung
1) In beiden Kartierungspopulationen wurden kontinuierliche Verteilungen mit
Transgressionen gefunden, wie man es für QTLs erwarten kann. Die kontinuierliche
Verteilung des Merkmals Halmreserve Mobilisierung bestätigt den polygenen Charakter
und die quantitative Vererbung. Die aufgefundenen Transgressionen weisen darauf hin,
dass Genotypen mit erhöhter Halmreserve Mobilisierung und demzufolge erhöhtem
Korngewicht unter Trockenstress nach der Blüte selektiert werden können.
2) Die QTLs für Trockenstress nach der Blüte wurden unter Verwendung des Programms
QGENE identifiziert. In der ‘ATRI 5283’ x ‘ATRI 15010’ Population waren insgesamt
sechs Mikrosatelliten Marker (Xgwm497a, Xgwm480, Xgwm247, Xgwm251, Xgwm1011a
und Xgwm611) zu QTLs (bezeichnet mit QSrm.ipk-1A, QSrm.ipk-3A, QSrm.ipk-3B,
QSrm.ipk-4B, QSrm.ipk-6A und QSrm.ipk-7B) gekoppelt. Diese waren auf den
Chromosomen 1A, 3A, 3B, 4B, 6A bzw. 7B lokalisiert. Die phänotypische Varianz
(%PV), errechnet für die einzelnen QTLs, betrug zwischen 13,41% und 24,74%. In der
ITMI-Population waren acht RFLP und Mikrosatelliten Marker (Xgwm357, Xmwg938b,
Xgwm249a, Xgwm639c, Xfbb238b, Xgwm494, Xgwm302 und Xfbb189b) zu QTLs
(bezeichnet mit QSrm.ipk-1A, QSrm.ipk-1B, QSrm.ipk-2D, QSrm.ipk-5B, QSrm.ipk-5D,
QSrm.ipk-6A, QSrm.ipk-7B und QSrm.ipk-7D) gekoppelt. Die QTLs waren auf den
Chromosomen 1A, 1B, 2D, 5B, 5D, 6A, 7B und 7D lokalisiert. Die phänotypische
Varianz (%PV), errechnet für die einzelnen QTLs, betrug zwischen 10,17% und 42,22%.
Zusammenfassung
–––––––––––––––––––––––––– 94 –––––––––––––––––––––––––
3) In der ‘ATRI 5283’ x ‘ATRI 15010’ Population wurden ‘stabile’ QTLs auf den
Chromosomen 3A, 4B und 7B lokalisiert. Drei weitere ‘stabile’ QTLs befanden sich auf
den Chromosomen 2D, 5D und 7D in der ITMI-Population.
5.2.3.2. Kartierung von QTLs für vegetative Merkmale
1) Kontinuierliche Verteilungen mit Transgressionen wurden in beiden
Kartierungspopulationen gefunden. Die kontinuierlichen Verteilungen der Merkmale
Pflanzenlänge und Tage bis zur Blüte bestätigen den polygenen Charakter und die
quantitative Vererbung beider Merkmale.
2) In den F3 Familien der ‘ATRI 5283’ x ‘ATRI 15010’ Population wurden acht QTLs für
Pflanzenlänge auf den Chromosomen 1A, 2A, 2B, 3A, 3B, 4A, 5A und 7A detektiert. Für
das Merkmal Tage bis zur Blüte wurden vier QTLs auf den Chromosomen 1A, 2A, 3B
und 7A identifiziert. Die phänotypische Varianz (%PV), errechnet für die einzelnen
QTLs, betrug zwischen 12,08% und 22,96% für das Merkmal Pflanzenlänge und
zwischen 12,37% und 23,33% für das Merkmal Tage bis zur Blüte. Die Analyse der ITMI
Population führte zur Identifizierung von vier QTLs für Pflanzenlänge auf den
Chromosomen 3B, 4D, 5A und 6D, während für das Merkmal Tage bis zur Blüte sieben
QTLs auf den Chromosomen 1A, 2B, 3D, 5B, 5D, 7B und 7D gefunden wurden. Die
phänotypische Varianz (%PV), errechnet für die einzelnen QTLs, betrug zwischen
15,91% und 30,01% für die Pflanzenlänge und zwischen 12,91% und 22,61% für die Tage
bis zur Blüte.
3) Stabile QTLs konnten auf den Chromosomen 2A, 3A, 5A und 7A (Pflanzenlänge) und
2A, 3B und 7A (Tage bis zur Blüte) in der ‘ATRI 5283’ x ‘ATRI 15010’ Population
gefunden werden. In der ITMI Population gab es nur einen stabilen QTL für Tage bis zur
Blüte auf dem Chromosom 2B.
5.2.3.3. Kartierung von QTLs für Kornmerkmale
1) In beiden Kartierungspopulationen wurden kontinuierliche Verteilungen mit
Transgressionen gefunden. Die kontinuierlichen Verteilungen der Kornmerkmale
bestätigen den polygenen Charakter und die quantitative Vererbung.
2) Haupt-QTLs für Kornmerkmale wurden auf den Chromosomen 1A, 1B, 1D, 2A, 2B, 2D,
3B, 3D, 4A, 4B, 4D, 5A, 5B, 5D, 6A, 6B, 6D, 7A, 7B und 7D gefunden.

References
–––––––––––––––––––––––––– 95 –––––––––––––––––––––––––
6. REFERENCES
Acevedo, E. (1991). Morphophysiological traits of adaptation of cereals to Mediterranean environments. In: Improvement and management of winter cereals under temperature, drought and salinity stresses, pp. 85-96. E. Acevedo; E. Fereres; C. Giménez and J. P. Srivastava. (Eds.). Proceedings of the ICARDA-INIA Symposium. Córdoba, Spain.
Acevedo, E. and S. Ceccarelli. (1989). Role of psysiologist-breeder in a breeding program for drought
resistance conditions. In: Drought Resistance in Crereals. pp. 117-139. Baker, F. (Ed.). CAB International, Wallingford.
Acevedo, E. and E. Fereres. (1993). Resistance to abiotic stresses. In: Plant Breeding: Principles and
Prospects. pp. 406-421. M. D. Hayward, N. O. Bosenmark and I. Romagosa (Eds.). London, Chapman & Hall.
Agrama, H. A. S. and M. E. Moussa. (1996). Mapping QTLs in breeding for drought tolerance in
maize (Zea mays L.). Euphytica 91: 89-97. Ahmed, T. A.; H. Tsujimoto and T. Sasakuma. (2000). Identification of RFLP markers linked with
heading date and its heterosis in hexaploid wheat. Euphytica 116: 111-119. Ahn, S. N.; S. J. Kwon; C. I. Yang; H. C. Hong; Y. K. Kim; J. P. Suh; H. G. Huang; H. C. Choi and H.
P. Moon. (2000). Diversity analysis of Korea bread rice cultivars. In: International plant and animal genome VIII Conference, Abstract P 499, January 9th-12th, 2000, San Diego, CA.
Ali, M. L.; M. S. Pathan; J. Zhang; G. Bai; S. Sarkarung and H. T. Nguyen. (2000). Mapping QTLs
for root traits in a recombinant inbred population from two indica ecotypes in rice. Theor. Appl. Genet. 101: 756-766.
Ammiraju, J. S. S.; B. B. Dholakia; D. K. Santra; H. Singh; M. D. Lagu; S. A. Tamhankar; H. S.
Dhaliwal; V. S. Rao; V. S. Gupta and P. K. Ranjekar. (2001). Identification of inter simple sequence repeat (ISSR) markers associated with seed size in wheat. Theor. Appl. Genet. 102: 726-732.
Amuruganathan, E. and E. D. Earle. (1991). Nuclear DNA content of some important plants species.
Plant Mol. Biol. Rep. 9: 208-218. Andaya, V. C. and D. J. Mackill. (2003). QTLs conferring cold tolerance at the booting stage of rice
using recombinant inbred lines from a japonica x indica cross. Theor. Appl. Genet. 106: 1084-1090.
Anderson, J. A.; M. E. Sorrells and S. D. Tanksley. (1993). RFLP analysis of genomic regions
associated with resistance to preharvest sprouting in wheat. Crop Sci. 33: 453-459. Anderson, J. A.; Y. Ogihara; M. E. Sorrells and S. D. Tanksley. (1992). Development of a
chromosomal arm map for wheat based on RFPL markers. Theor Appl Genet 83: 1035-1043. Austin, R. B.; J. A. Edrich; M. A. Ford and R. D. Blackwell. (1977). The fate of dry matter,
carbohydrates and 14C lost from leaves and stems of wheat during grain filling. Ann. Bot. 41: 1309-1321.
Austin, R. B.; C. L. Morgan; M. A. Ford and R. D. Blackwell. (1980). Contributions to grain yield
from pre-anthesis assimilation in tall and dwarf barley genotypes in two contrasting seasons. Ann. Bot. 45: 309-319.

References
–––––––––––––––––––––––––– 96 –––––––––––––––––––––––––
Bai, G. H.; F. L. Kolb; G. E. Shaner and L. L. Domier. (1999). Amplified fragment length polymorphism markers linked to a major quantitative trait locus controlling scab resistance in wheat. Phytopathology 89: 343-348.
Bannier, E. (1979). Monosomic analysis of the inheritance of 1000 grain weight in the winter wheat
varieties, Karkaz and Orlando. Arch Zuchtungsforsch 9: 209-214. Barua, U. M.; K. J. Chalmers; C. A. Hackett; W. T. B. Thomas; W. Powell and R. Waugh. (1993).
Identification of RAPD markers linked to a Rhyncosporium secalis resistance locus in barley using near-isogenic lines and bulked segregant analysis. Heredity 71: 177-184.
Baum, B. R.; S. Mechanda; G. A. Penner and A. B. Ednie. (1998). Establishment of a scheme for the
identification of Canadian barley (Hordeum vulgare L.) six row cultivars using RAPD diagnostic bands. Seed Sci & Technol. 26: 449-462.
Beavis, W. D. (1998). QTL analysis: power, precision and accuracy. In: Molecular Dissection of
Complex Trait. pp. 145-162. Paterson A. H. (Ed). CRC Press, Boca Raton, Florida, USA. Beavis, W. D. and D. Grant. (1991). A linkage map based on information from four F2 populations of
maize (Zea mays L.). Theor. Appl. Genet. 82: 636-644. Becker, J. and M. Heun. (1995). Barley microsatellites: allele variation and mapping. Plant Mol. Biol.
27: 835-845. Becker, J.; P. Vos; M. Kuiper; F. Salamini and M. Heun. (1995). Combined mapping of AFLP and
RFLP markers in barley. Mol. Gen. Genet. 249: 65-73. Ben Amer, I. M; A. Börner and M. S. Röder. (2001). Detection of genetic diversity in Libyan wheat
genotypes using using wheat microsatellite markers. Genetic Resources and Crop Evolution. 48: 579-585.
Ben Amer, I. M.; A. J. Worland; V. Korzun and A. Börner. (1997). Genetic mapping of QTL
controlling tissue-culture response on chromosome 2B of wheat (Triticum aestivum L.) in relation to major genes and RFLP markers. Theor. Appl. Genet. 94: 1047-1052.
Bennett, M. D. and J. B. Smith. (1976). Nuclear DNA amounts in angiosperms. Phil. Trans. Roy. Soc.
Lond. B. 274: 227-274. Bernatzky, R. and S. D. Tanksley. (1986). Toward a saturated linkage map in tomato based on
isozyme and random cDNA sequences. Genetics 112: 887-898. Bianchi-Hall, C. M.; T. E. Carter; Jr.; M. A. Bailey; M. A. R. Mian; T.W. Rufty; D. A. Ashley; H. R.
Boerma; C. Arellano; R. S. Hussey and W. A. Parrott. (2000). Aluminum tolerance associated with quantitative trait loci derived from soybean PI 416937 in hydroponics. Crop Sci. 40: 538-545.
Bidinger, F.; R. B. Musgrave and R. A. Fischer. (1977). Contribution of stored preanthesis assimilate
to grain yield in wheat and barley. Nature 270: 431-433. Blum, A. (1983a). Genetic and physiological relationships in plant breeding for drought resistance.
Water Manage. 7: 195-205. Blum, A. (1983b). Breeding programs for improving crop resistance to water stress. In: Crop
Reactions to Water and Temperature Stresses in Humid, Temperate Climates. pp. 263-275. Jr. C. D. Raper and P. J. Kramer (Eds.). Westview Press; Boulder; Colorado, USA.
Blum, A. (1988). Plant Breeding for Stress Environments. CRC Press Inc., Boca Raton, Florida, USA.
References
–––––––––––––––––––––––––– 97 –––––––––––––––––––––––––
Blum, A. (1998). Improving wheat grain filling under stress by stem reserve mobilisation. Euphytica 100: 77-83.
Blum, A.; S. Mayer and G. Galon. (1989). Agronomic and physiological assessments of genotypic
variation for drought resistance in sorghum. Aust. J. Agric. 40: 49-61. Blum, A.; J. Mayer and G. Golan. (1983a). Chemical desiccation of wheat plants as a simulator of
post-anthesis stress II. Relations to drought stress. Field Crop Research. 6: 149-155. Blum, A.; H. Poiarkova; G. Golan and J. Mayer. (1983b). Chemical desiccation of wheat plants as a
simulator of post-anthesis stress I. Effects on translocation and kernel growth. Field Crop Research. 6: 51-58.
Blum, A.; S. Ramaiah; E. T. Kanemasu and G. M. Paulsen. (1990). Recovery of wheat from drought
stress at the tillering developmental stage. Field Crops Res. 24: 67-85. Blum, A.; L. Shpiler; G. Golan; J. Mayer and B. Sinmena. (1991). Mass selection of wheat for grain
filling without transient photosynthesis. Euphytica 54: 111-116. Blum, A.; B. Sinmena; J. Mayer; G. Golan and L. Shpiler. (1994). Stem reserve mobilisation supports
wheat grain filling under heat stress. Aust. J. Plant Physiol. 21: 771-781. Boivin, K.; M. Deu; J. F. Rami; G. Trouche and P. Hamon. (1999). Towards a saturated sorghum map
using RFLP and AFLP markers. Theor. Appl. Genet. 98: 320-328. Bonierbale, M. W.; R. L. Plaisted and S. D. Tanksley. (1988). RFLP maps based on a common set of
clones reveal modes of chromosomal evolution in potato and tomato. Genetics 120: 1095-1103.
Bonilla, P.; J. Dvorak; D. Mackill; K. Deal and G. Gregorio. (2002). RFLP and SSLP mapping of
salinity tolerance genes in chromosome 1 of rice (Oryza sativa L.) using recombinant inbred lines. Philipp. Agric. Sci.85: 68-76.
Bonnett, G. D. and L. D. Incoll. (1992). Effects on the stem of winter barley of manipulating the
source and sink during grain-filling 2. Changes in the composition of water-soluble carbohydrates of internodes J. Exp. Bot. 44: 83-91.
Borovkova, I. G.; Y. Jin; B. J. Steffenson; A. Kilian; T. K. Blake and A. Kleinhofs. (1997).
Identification and mapping of a leaf rust resistance gene in barley line Q21861. Genome 40: 236-241.
Borrell, A. K.; G. L. Hammer and R. G. Henzell. (2000). Does maintaining green leaf area in sorghum
improve yield under drought? II. Dry matter production and yield. Crop Sci. 40: 1037-1048. Borrell, A. K.; L. D. Incoll and M. J. Dalling. (1993). The influence of the rht1 and rht2 alleles on the
deposition and use of stem reserves in wheat. Ann. Bot.71: 317-326. Botstein, D.; R. L. White; M. Skolnick and R. W. Davies. (1980). Construction of a genetic map in
man using restriction fragment length polymorphisms. Am. J. Hum. Genet. 32: 314-331. Börner, A.; A. Balint; K. F. M. Salem; E. Pestsova; M. S. Röder and E. K. Khlestkina. (2003). Copper
tolerance/Stem reserve mobilization/ Genetic diversity of Siberian wheat varieties/ Development of wheat-Aegilops tauschii introgression lines. Ann. Wheat Newsletter 49: 28-30.
Börner, A.; S. Chebotar and V. Korzun. (2000a). Molecular characterization of the genetic integrity of
wheat (Triticum aestivum L.) germplasm after long term maintenance. Theor. Appl. Genet. 100: 494–497.

References
–––––––––––––––––––––––––– 98 –––––––––––––––––––––––––
Börner, A.; U. Freytag; U. Sperling; K. F. M. Salem and E. K. Khlestkina. (2002a). Sixty years disease resistance screening/ Stem reserve mobilization/ Geographical distribution of red coleoptile color genes. Ann. Wheat Newsletter 48: 58-65.
Börner, A. and V. Korzun. (1998). A consensus linkage map of rye (Secale cereale L.) including 374
RFLPs, 24 isozymes and 15 gene loci. Theor. Theor. Appl. Genet. 97: 1279-1288. Börner, A.; J. Plaschke; V. Korzun and A. J. Worland. (1996). The relationships between dwarfing
genes of wheat and rye. Euphytica 89: 69-75. Börner, A.; M. S. Röder; O. Unger and A. Meinel. (2000b). The detection and molecular mapping of a
major gene for non specific adult plant disease resistance against stripe rust (Puccinia striiformis) in wheat. Theor. Appl. Genet. 100: 1095-1099.
Börner, A.; E. Schumann; A. Fürste; H. Cöster; B. Leithold; M. S. Röder and W. E. Weber. (2002b).
Mapping of quantitative trait loci determining agronomic important characters in hexaploid wheat (Triticum aestivum L.) Theor. Appl. Genet. 105: 921-936.
Börner, A.; A. J. Worland; J. Plaschke; E. Schumann and C. N. Law. (1993). Pleiotropic effects of
genes for reduced height (Rht) and day length insensitivity (Ppd) on yield and its components for wheat grown in middle Europe. Plant Breed 111: 204-216.
Boyer, J. S. (1976). Photosynthesis at low water potentials. Philosophical Transactions of the Royal
Society B 273: 501-512. Boyer, J. S. (1982). Plant productivity and environment. Science 218: 443-448. Bredemeier, C.; C. M. Mundstock and D. Buttenbender. (2001). Effect of seed size on initial plant
growth and grain yield of wheat. Pesquisa Agropecuaria Brasileira 36: 1061-1068. Breiman, A. and D. Graur. (1995). Wheat Evolution. Israel Jour. Pl. Sci. 43: 85-98. Briggle, L. W. (1967). Morphology of the Wheat Plant. In Wheat and Wheat Improvement. Am. Soc.
of Agronomy Monograph. Briggle, L.W. and L. P. Reitz. (1963). Classification of Triticum species and of wheat varieties grown
in the United States. Technical Bulletin 1278. United States Department of Agriculture. Brookes, A. J. (1999). The essence of SNPs. Gene 234: 177-186. Brouwer, D. J.; S. H. Duke and T. C. Osborn. (2000). Mapping genetic factors associated with winter
hardiness, fail growth and freezing injury in autotetraploid alfalfa. Crop Sci. 40: 1387-1396. Brown, S. M.; M. S. Hopkins; S. E. Mitchel; T. Y. Wang; S. Kresovich; R. R. Duncan; M. L. Senior
and F. G. Candelas. (1996). Multiple methods for the identification of polymorphic simple sequence repeats (SSRs) in sorghum [Sorghum bicolor (L.) Moench]. Theor. Appl. Genet. 93: 190-198.
Bruford, M. W. and R. K. Wayne. (1993). Microsatellites and their application to population genetic
studies. Current Opinion in Genetics and Development 3: 939-943. Bryan, G. J.; A. J. Collins; P. Stephenson; A. Orry; J. B. Smith and M. D. Gale. (1997). Isolation and
characterization of microsatellites from hexaploid bread wheat. Theor. Appl. Genet. 94: 557-563.
Burr, B. and F. A. Burr. (1991). Recombinant inbreds for molecular mapping in maize: theoretical and
practical considerations. Trends Genet. 7: 55-60. Burr, B.; F. A. Burr; K. H. Thompson; M. C. Albertsen and C. W. Stuber. (1988). Gene mapping with
recombinant inbreds in maize. Genetics 118: 519-526.

References
–––––––––––––––––––––––––– 99 –––––––––––––––––––––––––
Byrne, P. F.; M. D. McMullen; M. E. Snook; T. A. Musket; J. M. Theuri; N. W. Widstrom; B. R. Wiseman and E. H. Coe. (1996). Quantitative trait loci and metabolic pathways: Genetic control of the concentration of maysin, a corn earworm resistance factor, in maize silks. Proceedings of the National Academy of Sciences USA 93: 8820-8825.
Byrne, P. F.; M. D. McMullen; B. R. Wiseman; M. E. Snook; T. A. Musket; J. M. Theuri; N. W.
Widstrom and E. H. Coe. (1998). Maize silk maysin concentration and corn earworm antibiosis: QTL and genetic mechanisms. Crop Sci. 38: 461-471.
Cadalen, T.; P. Sourdille; G. Charmet; M. H. Tixier; G. Gay; C. Boeuf; S. Bernard; P. Leeroy and M.
Bernard. (1998). Molecular markers linked to genes affecting plant height in wheat using a doubled-haploid population. Theor. Appl. Genet. 96: 933-940.
Caetano-Anolles, G.; B. J. Basam and P. M. Gresshoff. (1991). DNA amplification fingerprinting
using very short arbitrary oligonucleotide primers. Bio/Technology 9: 553-557. Campbell, K. G.; C. J. Bergman; D. G. Gualberto; J. A. Anderson; M. J. Giroux; G. Hareland; R. G.
Fulcher; M. E. Sorrells and P. L. Finney. (1999). Quantitative trait loci associated with kernel traits in soft x hard wheat cross. Crop Sci 39: 1184-1195.
Casas, A. M.; E. Igartua; M. P. Vallés and J. L. Molina-Cano. (1998). Genetic diversity of barley
cultivars grown in Spain, estimated by RFLP, similarity and coancestry coefficients. Plant Breed 117: 429-435.
Causse, M.; J. P. Rocher; A. M. Henry; A. Charcosset; J. L. Prioul and D. deVienne. (1995). Genetic
dissection of the relationship between carbon metabolism and early growth in maize, with emphasis on the key-enzyme loci. Mol Breed 1: 259-272.
Ceccarelli, S. and S. Grando. (1996). Drought as a challenge for the breeder. Plant Growth Regulation
20: 149-155. Cha, K.W.; Y. J. Lee; H. J. Koh; B. M. Lee; Y. W. Nam and N. C. Paek. (2002). Isolation,
characterization and mapping of the stay green mutant in rice. Theor. Appl. Genet. 104: 526-532.
Chandra, B. R.; Bay D. Nguyen; V. Chamarerk; P. Shanmugasundaram; P. Chezhian; P. Jeyaprakash;
S. K. Ganesh; A. Palchamy; S. Sadasivam; S. Sarkarung; L. J. Wade and H. T. Nguyen. (2003). Genetic analysis of drought resistance in rice by molecular markers association between secondary traits and field performance. Crop Sci. 43: 1457-1469.
Champoux, M. C.; G. Wang; S. Sarkarung; D. J. Mackill; J. C. O’Toole; N. Huang and S. R.
Mccouch. (1995). Locating genes associated with root morphology and drought avoidance in rice via linkage to molecular markers. Theor. Appl. Genet. 90: 969-981.
Chang, C.; J. L. Bowman; A. W. DeJohn; E. S. Lander and E. M. Meyerowitz. (1988). Restriction
fragment length polymorphism linkage map for Arabidopsis thaliana. Pro. Natl. Acad. Sci. USA 85: 6856-6860.
Chao, S.; P. J. Sharp; A. J. Worland; E. J. Warham; R. M. D. Koebner and M. D. Gale. (1989). RFLP
based genetic maps of wheat homoeologous group 7 chromosomes. Theor. Appl. Genet. 78: 495-504.
Chebotar, S.; M. S. Röder; V. Korzun; B. Saal; W. E. Weber and A. Börner. (2003). Molecular studies
on genetic integrity of open pollinating species rye (Secale cereale L.) after long term genebank maintenance. Theor. Appl. Genet. 107: 1469-1476.
References
–––––––––––––––––––––––––– 100 –––––––––––––––––––––––––
Cho, Y. G.; M. W. Blair; O. Panaud and S. R. Mccouch. (1996). Cloning and mapping of variety specific rice genomic DNA sequences: amplified fragment length polymorphisms (AFLP) from silver-stained polyacrylamide gels. Genome 39: 373-378.
Cho, R. J.; M. Mindrinos; D. R. Richards; R. J. Sapolsky; M. Anderson; E. Drenkard; J. Dewdney; T.
L. Reuber; M. Stammers; N. Federspiel; A. Theologis; W. H. Yang; E. Hubbell; M. Au; E. Y. Chung; D. Lashkari; B. Lemieux; C. Dean; R. J. Lipshutz; F. M. Ausubell; R. W. Davis and P. J. Oefner. (1999). Genome-wide mapping with biallelic markers in Arabidopsis thaliana. Nature Genet. 23: 203-207.
Chojecki, A. J. S.; M. D. Gale and M. W. Bayliss. (1983). Reciprocal mono-somicanalysis of grain
size in wheat. In: Proc 6th Int Wheat Genet Symp. Sakamoto, S. (Ed). pp. 1061-1071. Maruzen, Kyoto, Japan.
Ciaferelli, R. A.; M. Gallitelli and F. Cellini. (1995). Random amplified hybridisation microsatellites
(RAHM): isolation of a new class of microsatellite-containing DNA clones. Nucl. Acid Research 23: 3802-3803.
Ciofi, C.; S. M. Funk; T. Coote; D. J. Cheesman; R. L. Hammond; I. J. Saccheri and M. W. Bruford.
(1998). Genotyping with microsatellite markers. In: Molecular Tools for Screening Biodiversity. pp. 195-201. Karp, A; P. G. Isaac and D. S. Ingram. (Eds.). Chapman & Hall, London.
Clarke, B.; P. Stancombe; T. Money; T. Foote and G. Moore. (1992). Targeting deletion
(homeologous chromosome pairing locus) or addition line single copy sequences from cereal genomes. Nucl. Acids Res. 20: 1289-1292.
Collins, F. S.; L. D. Brooks and A. Chakravarti. (1998). A DNA polymorphism discovery resource for
research on human genetic variation. Genome Res. 8: 1229-1231. Condit, R. and S. P. Hubbell. (1991). Abundance and DNA sequence of two-base repeat regions in
tropical tree genomics. Genome 34: 66-71. Connell, J. P.; S. Pammi; M. J. Iqbal; T. Huizinga and A. S. Reddy. (1998). A high throughput
procedure for capturing microsatellites from complex plant genomes. Plant Mol. Biol. 16: 341-349.
Cooke, R. J. (1995). Introduction: the reasons for variety identification. In: Identification of Food
Grain Varieties. pp. 1-17. Wrigley, C. W. (Ed.). American Association of Cereal Chemists, St. Paul, MN, USA.
Courtois, B.; G. McLaren; P. K. Sinha; K. Prasad; R. Yadav and L. Shen. (2000). Mapping QTLs
associated with drought avoidance in upland rice. Mol. Breed. 6: 55-66. Crasta, O. R.; W. Xu; D. T. Rosenow; J. E. Mullet and H. T. Nguyen. (1999). Mapping of post-
flowering drought resistance traits in grain sorghum: Association between QTLs influencing premature senescence and maturity. Mol. Gen. Genetics 262: 579-588.
Cregan, P. B.; J. Mudge; E. W. Fickus; D. Danesh; R. Denny and N. D. Young. (1999). Two simple
sequence repeat markers to select for soybean cyst nematode resistance conditioned by the rhg1 locus. Theor. Appl. Genet. 99: 811-818.
Csanádi, G.; J. Vollmann; G. Stift and T. Lelley. (2001). Seed quality QTLs identified in a molecular
map of early maturing soybean. Theor. Appl. Genet. 103: 912–919. Daniels, R.W. and M. B. Alcock. (1982). A reappraisal of stem reserve contribution to grain yield in
spring barley (Hordeum vulgare L.) J. Agric. Sci. 98: 347-355.

References
–––––––––––––––––––––––––– 101 –––––––––––––––––––––––––
Davidson, J. L. and J. W. Birch. (1978). Responses of a standard Australian and Mexican wheat to temperature and water stress. Aust. J. Agric. Res. 29: 1091-1106.
Davidson, D. J. and P. M. Chevalier. (1992). Storage and remobilization of water-soluble
carbohydrates in stems of spring wheat. Crop Sci. 32: 186-190. Dayanandan, S.; O. P. Rajora and K. S. Bawa. (1998). Isolation and characterisation of microsatellites
in trembling aspen (Populus tremuloides). Theor. Appl. Genet. 96: 950-956. Dávila, J. A.; Y. Loarce and E. Ferrer. (1999). Molecular characterization and genetic mapping of
random amplified microsatellite polymorphism in barley. Theor. Appl. Genet. 98: 265-273. Del Blanco, I. A.; R. C. Frohberg ; R. W. Stack; W. A. Berzonsky and S. F. Kianian. (2003). Detection
of QTL linked to Fusarium head blight resistance in Sumai 3-derived North Dakota bread wheat lines. Theor. Appl. Genet. 106: 1027-1031.
De la Pena, R. C.; K. P. Smith; F. Capettini; G. J. Muehibauer; M. Gallo-Meagher; R. DillMacky; D.
A. Somers and D. C. Rasmusson. (1999). Quantitative trait loci associated with resistance to Fusarium head blight and kernel discoloration in barley. Theor. Appl. Genet. 99: 561-569.
Devos, K. M.; M. D. Atkinson; C. N. Chinoy; C. J. Liu and M. D. Gale. (1992). RFLP-based genetic
map of the homoelogous group 3 chromosomes of wheat and rye. Theor. Appl. Genet. 83: 931-939.
Devos, K. M.; G. J. Bryan; A. J. Collins; P. Stephenson and M. D. Gale. (1995). Application of two
microsatellite sequences in wheat storage proteins as molecular markers. Theor. Appl. Genet. 90: 247-252.
Devos, K. M. and M. D. Gale. (1992). The use of random amplified polymorphic DNA markers in
wheat. Theor. Appl. Genet. 84: 567-572. Devos, K. M. and M. D. Gale. (1993). Extended genetic maps of the homoeologous group 3
chromosomes of wheat, rye and barley. Theor. Appl. Genet. 85: 469-652. Devos, K. M. and M. D. Gale. (1997). Comparative genetics in the grasses. Plant Mol. Biol. 35: 3-15. Dholakia, B. B.; J. S. S. Ammiraju; H. Singh; M. D. Lagu; M. S. Röder; V. S. Rao; H. S. Dhaliwal; P.
K. Ranjekar and V. S. Gupta. (2003). Molecular marker analysis of kernel size and shape in bread wheat. Plant Breed 122: 392-395.
Doldi, M. L.; J. Vollmann and T. Lelley. (1997). Genetic diversity in soybean as determined by
RAPD and microsatellite analysis. Plant Breed 116: 331-335. Donini, P.; P. Stephenson; G. J. Bryan and R. M. D. Koebner. (1998). The potential of microsatellites
for high throughput genetic diversity assessment in wheat and barley. Genet. Resour. Crop Evol. 45: 415-421.
Dubcovsky, J.; M. Echaide; S. Giancola; M. Rousset; M. C. Luo; L. R. Joppa and J. Dvorak. (1997).
Seed storage protein loci in RFLP maps of diploid, tetraploid and hexaploid wheat Theor. Appl. Genet. 95: 1169-1180.
Dubois, D.; M. Winzeler and J. Nosberger. (1990). Fructan accumulation and sucrose: sucrose
fructosyltransferase activity in stems of spring wheat genotypes. Crop Sci. 30: 315-319. Dweikat, I.; S. Mackenzie; M. Levy and H. Ohm. (1993). Pedigree assessment using RAPD-DGGE in
cereal crop species. Theor. Appl. Genet. 85: 497-505. Eastwood, R. F.; E. S. Lagudah and R. Appels. (1994). A directed search for DNA sequences tightly
linked to cereal cyst nematode resistance genes in Triticum tauschii. Genome 37: 311-319.
References
–––––––––––––––––––––––––– 102 –––––––––––––––––––––––––
Edwards, A.; H. Civitello; H. A. Hammond and C. T. Caskey. (1991). DNA typing and genetic mapping with trimeric and tetrameric tandem repeats. Am. J. Hum. Genet. 49: 746-756.
Edwards, M. D.; C. W. Stuber and J. F. Wendel. (1987). Molecular-marker-facilitated investigations
of quantitative-traits loci in maize. I. Numbers, genomic distribution and types of gene action. Genetics 116: 113-125.
Ellis, R. P.; J. W. McNicol; E. Baird; A. Booth; P. Lawrence; W. T. B. Thomas and W. Powell.
(1997). The use of AFLPs to examine genetic relatedness in barley. Mol. Breed. 3: 359-369. Elouafi, I. and M. M. Nachit. (2004). A genetic linkage map of the Durum x Triticum dicoccoides
backcross population based on SSRs and AFLP markers and QTL analysis for milling traits. Theor. Appl. Genet. 108: 401-413.
Evans, L.T.; J. Bingham; P. Johnson and J. Sutherlands. (1972). Effect of awns and drought on the
supply of photosynthate and its distribution within wheat ears. Ann. Appl. Biol. 70: 67. Everson, E. and C. W. Schaller. (1955). The genetics of yield differences associated with awn barbing
in the barley hybrid (‘Lion’ x ‘Atlas 10’) x ‘Atlas’. Agron. J. 47: 276-280. Faccioli, P.; N. Pecchioni; A. M. Stanca and V. Terzi (1999). Amplified fragment length
polymorphism (AFLP) markers for barley malt fingerprinting. J. Cer. Sci. 29: 257-260. Fahima, T.; V. Chague; G. Sun; A. Korol; Y. Ronin; M. Röder; A. Grama and E. Nevo. (1997).
Identification and potential use of PCR markers flanking the Triticum dicoccoides derived stripe rust resistance gene Yr15 in wheat. In: 5th international congress of plant molecular biology: 21st-27th Sept. 1997, Singapore.
Fahima, T.; M. Röder; A. Grama and E. Nevo. (1998). Microsatellite DNA polymorphism divergence
in Triticum dicoccoides accessions highly resistant to yellow rust. Theor. Appl. Genet. 96: 187–195.
Fahima, T.; M. S. Röder; K. Wendehake; V. M. Kirzhner and E. Nevo. (2002). Microsatellite
polymorphism in natural populations of wild emmer wheat, Triticum dicoccoides, in Israel. Theor. Appl. Genet. 104: 17-29.
Falconer, D. S. (1989). Introduction to Quantitative Genetics. Third edition Longman, Essex, England. Falconer, D. S. and T. F. C. Mackay. (1996). Introduction to quantitative genetics. pp. 464. Longman
Group Ltd. Essex, England. FAO. (2003). Production Year Book, FAO, Rome, http://apps.fao.org/default.jsp. Faris, J. D.; W. L. Li; D. J. Liu; P. D. Chen and B. S. Gill. (1999). Candidate gene analysis of
quantitative disease resistance in wheat. Theor. Appl. Genet. 98: 219-225. Farquhar, G. D. and T. D. Sharkey. (1982). Stomatal conductance and photosynthesis. Ann. Rev. Plant
Physiol. 3: 317-345. Fatokun, C. A.; D. T. Menancio-Hautea; D. Danesh and N. D. Young. (1992). Evidence of
orthologous seed weight genes in cowpea and mung bean based on RFLP mapping. Genetics 132: 1205-1209.
Fisher, R. A. (1918). The correlations between relatives on the supposition of Mendelian inheritance.
Trans. R. Soc. Ediub. 52: 399-433. Fischer, R. A. and R. Maurer. (1978). Drought resistance in spring wheat cultivars. 1. Grain yield
responses. Aust. J. Agric. Res. 29: 897-912.
References
–––––––––––––––––––––––––– 103 –––––––––––––––––––––––––
Fischer, S. G. and L. S. Lerman. (1983). DNA fragments differing by single basepair substitutions are separated in denaturing gradient gels: Correspondence with melting theory. Proc. Nat. Acad Sci. USA 80: 1579-1583.
Flowers, T. J.; M. L. Koyama; S. A. Flowers; C. Sudhakar; K. P. Singh and A. R. Yeo. (2000). QTL:
their place in engineering tolerance of rice to salinity. J. Exp. Bot. 51: 99-106. Ford, M. A.; R. D. Blackwell; M. L. Parker and R. B. Austin. (1979). Associations between stem
solidity, soluble carbohydrate accumulation, and other characters in Wheat. Ann. Bot. 44: 731-738.
Fracheboud, Y.; J. M. Ribaut; M. Vargas; R. Messmer and P. Stamp. (2002). Identification of
quantitative trait loci for cold-tolerance of photosynthesis in maize (Zea mays L.). J. Exp. Bot. 53: 1967-1977.
Fulton, T. M.; T. Beck-Bunn; D. Emmatty; Y. Eshed; J. Lopez; V. Petiard; J. Uhlig; D. Zamir and S.
D. Tanksley. (1997). QTL analysis of an advanced backcross of Lycopersicon peruvianum to the cultivated tomato and comparisons with QTLs found in other wild species. Theor. Appl. Genet. 95: 881-894.
Fulton, T. M.; S. Grandillo; T. Beck-Bunn; E. Fridman; A. Frampton; J. Lopez; V. Petiard; J. Uhlig;
D. Zamir and S. D. Tanksley. (2000). Advanced backcross QTL analysis of a Lycopersicon esculentum x Lycopersicon parviflorum cross. Theor. Appl. Genet. 100: 1025-1042.
Gale, M. D.; M. D. Atkinson; C. N. Chinoy; R. L. Harcourt; J. Jai; Q. Y. Li and K. M. Devos. (1995).
Genetic maps of hexaploid wheat. In: Chen, S. (Eds). Proc. 8th International Wheat Genetics Symposium. pp. 29-40. China Agricultural Scientech Press, Beijing, China.
Galiba, G.; S. A. Quarrie; J. Sutka; A. Morgounov and J. W. Snape. (1995). RFLP mapping of
vernalization (Vrn1) and frost resistance (Fr1) genes on chromosome 5A of wheat. Theor. Appl. Genet. 90: 1174-1179.
Garry, P.; C. Ken; R. Anthony and L. Peter. (1997). Identification of molecular markers linked to flour
colour and milling yield in wheat. In: 5th international congress of plant molecular biology: 21st-27th Sept. 1997, Singapore.
Gent, M. P. N. (1994). Photosynthate reserves during grain filling in winter wheat. Agron. J. 86: 159-
167. Gerats, T.; P. De Keukeleire; R. Deblaere; M. Van Montagu and J. Zethof. (1995). Amplified
fragment length polymorphism (AFLP) mapping in Petunia; a fast and reliable method for obtaining a genetic map. Act. Hort. 420: 58-61.
GIPSA. (1997). Subpart M—United States Standards for Wheat. USDA, Washington, DC.
(http://www.usda.gov /agency/gipsa/strulreg/standard/wheat.htm; verified 3 March 1999). Giura, A. and N. N. Saulescu. (1996). Chromosomal location of genes contolling grain size in a large
grained selection of wheat (Triticum aestivum L.). Euphytica 89: 77-80. Graner, A.; A. Jahoor; J. Schondelmaier; H. Siedler; K. Pillen; G. Fischbeck; G. Wenzel and R. G.
Herrmann. (1991). Construction of an RFLP map of barley. Theor. Appl. Genet. 83: 250-256. Graner, A.; B. Foroughi-Wehr and A. Tekauz. (1996). RFLP mapping of a gene in barley conferring
resistance to net blotch (Pyrenophora teres ). Euphytica 91: 229-234.
References
–––––––––––––––––––––––––– 104 –––––––––––––––––––––––––
Graner, A.; W. F. Ludwig and A. E. Melchinger. (1994). Relationships among European barley germplasm: II. Comparison of RFLP and pedigree data. Crop Sci. 34: 1199-1205.
Groos, C.; N. Robert; E. Bervas and G. Charmet. (2003). Genetic analysis of grain protein-content,
grain yield and thousand-kernel weight in bread wheat Theor. Appl. Genet. 106: 1032-1040. Gupta, P. K.; H. S. Balyan; M. Prasad; R. K. Varshney; J. K. Roy; H. Singh and H. S. Dhaliwal.
(1999a). Molecular markers for some quality traits in wheat. In: Proceedings of National Symposium on Frontiers of Research in Plant Sciences. pp. 14, Dec 2-4, 1999, Calcutta, India.
Gupta, P. K.; H. S. Balyan; P. C. Sharma and B. Ramesh. (1996). Microsatellites in plants: A new
class of molecular markers. Curr. Sci. 70: 45-54. Gupta, M.; H. S. Balyan; P. C. Sharma and B. Ramesh. (1998). Genetics and molecular biology of
seed storage proteins in wheat. In: Genetics and Biotechnology in Crop Improvement. pp. 126-157. Gupta, P. K. (Ed.) Rastogi Publications, Meerut.
Gupta, M; Y. S. Chyi; J. Romero-Severson and J. L. Owen. (1994). Amplification of DNA markers
from evolutionarily diverse genomes using single primers of simple sequence repeats. Theor. Appl. Genet. 89: 998-1006.
Gupta, P. K. and R. K. Varshney. (1999). Molecular markers for genetic fidelity during
micropropogation and germplasm conservation. Curr. Sci. 76: 1308-1310. Gupta, P. K. and R. K. Varshney. (2000). The development and use of microsatellite markers for
genetic analysis and plant breeding with emphasis on bread wheat. Euphytica 113: 163-185. Gupta, P. K.; R. K. Varshney; P. C. Sharma and B. Ramesh. (1999b). Molecular markers and their
application in wheat breeding. Plant Breed. 118: 369-390. Haanstra, J. P. W.; C. Wye; H. Verbakel; F. Meijer-Dekens; P. Van den Berg; P. Odinot; A. W.
Heusden; S. Tanksley; P. Lindhout and J. Peleman. (1999). An integrated high-density RFLP-AFLP map of tomato based on two Lycopersicon esculentum x L. pennellii F2 populations. Theor. Appl. Genet. 99: 254-271.
Hakim, L. (1996). Exploitation of near-isogenic lines to identify RAPD markers linked to
Rhyncosporium resistance gene in barley (Hordeum vulgare). Ind. J. Exp. Biol. 34: 1166-1168.
Haldane, J. B. S. (1919). The recombination of linkage values and calculation of distance between the
loci of linkage factors. J. Genet. 8: 299-309. Hall, A. E. (1993). Is dehydration tolerance relevant to genotypic differences in leaf senescence and
crop adaptation to dry environments?. In: Close, T. J. and E. A. Bray (Eds.). Plant Responses to Cellular Dehydration during Environmental Stress. Rockville, Md. American Soc. Plant Phys.
Halloran, G. M. (1976). Genetic analysis of hexaploid wheat, Triticum aestivum using intervarietal
chromosome substitutionlines- protein content and grain weight. Euphytica 25: 65-71. Halward, T.; T. Stalker; E. LaRue and G. Kochert. (1992). Use of single-primer DNA amplifications
in genetic studies of peanut (Arachis hypogaea L.). Plant Mol. Biol. 18: 315-325. Hamann, A.; D. Zink and W. Nagl. (1995). Microsatellite fingerprint in the genus Phaseolus. Genome
38: 507-515. Hammer, K.; A. A. Filatenko and V. Korzun. (2000). Microsatellite markers: a new tool for
distinguishing diploid wheat species. Genet. Res. Crop Evol. 47: 497-505.
References
–––––––––––––––––––––––––– 105 –––––––––––––––––––––––––
Hartl, L. and S. Seefelder. (1998). Diversity of selected hop cultivars detected by fluorescent AFLPs. Theor. Appl. Genet. 96: 112-116.
Haussmann, B. I. G.; V. Mahalakshmi; B. V. S. Reddy; N. Seetharama; C. T. Hash and H. H. Geiger.
(2002). QTL mapping of stay-green in two sorghum recombinant inbred populations. Theor. Appl. Genet. 106: 133-142.
Hearne, C. M.; S. Ghosh and J. A. Todd. (1992). Microsatellites for linkage analysis of genetic traits.
Trends Genet. 8: 288-294. Helentjaris, T. (1987). A genetic linkage map for maize based on RFLPs. Trends Genet. 3: 217-221. Helentjaris, T.; M. Slocum; S. Wright; A. Schaefer and J. Nienhuis. (1986). Construction of genetic
linkage maps in maize and tomato using restriction fragment length polymorphisms. Theor. Appl. Genet. 72: 761-769.
Hemamalini, G. S.; H. E. Shashidhar and S. Hittalmani. (2000). Molecular marker assisted tagging of
morphological and physiological traits under two contrasting moisture regimes at peak vegetative stage in rice (Oryza sativa L.). Euphytica 112: 69-78.
Hervé, D; F. Fabre; E. F. Berrios; N. Leroux; G. A. Chaarani; C. Planchon; A. Sarrafi and L.
Gentzbittel. (2001). QTL analysis of photosynthesis and water status traits in sunflower (Helianthus annuus L.) under greenhouse conditions. J. Exp. Bot. 52: 1857-1864.
Heun, M.; A. E. Kennedy; J. A. Anderson; N. L. V. Lapitan; M. E. Sorrells and S. D. Tanksley.
(1991). Construction of a restriction fragment length polymorphism map for barley (Hordeum vulgare). Genome 34: 437-447.
Hinze, K.; R. D. Thompson; E. Ritter; F. Salamini and P. Schulze-Lefert. (1991). Restriction fragment
length polymorphism-mediated targeting of the ml-o resistance locus in barley (Hordeum vulgare). Proc. Nat. Acad. Sci. 88: 3691-3695.
Hoogendoorn, J. (1985). A reciprocal F1 monosomic analysis of the genetic control of time ear
emergence, number of leaves and number of spikelets in wheat (Triticum aestivum L.). Euphytica 34: 545-558.
Hossain, A. B. S.; R. G. Sears; T. S. Cox and G. M. Paulsen. (1990). Desiccation tolerance and its
relationship to assimilate partitioning in winter wheat. Crop Sci. 30: 622-627. Hsiao, T. C. (1973). Plant responses to water stress. Ann. Rev. Plant Physiol. 24: 519-570. Hu, B.; P. Wu; C.Y. Liao; W. P. Zhang and J. J. Ni. (2001). QTLs and epistasis underlying activity of
acid phosphatase under phosphorus sufficient and deficient condition in rice (Oryza sativa L.). Plant and Soil 230: 99-105.
Huang, J. and M. Sun. (1999). A modified AFLP with fluorescence-labelled primers and automated
DNA sequencer detection for efficient fingerprinting analysis in plants. Biotechnology Techniques 13: 277-278.
Huang, X. Q.; A. Börner; M. S. Röder and M. W. Ganal. (2002). Assessing genetic diversity of wheat
(Triticum aestivum L.) germplasm using microsatellite markers. Theor. Appl. Genet. 105: 699-707.
Huang, X. Q.; H. Cöster; M. W. Ganal and M. S. Röder. (2003a). Advanced backcross QTL analysis
for the identification of quantitative trait loci alleles from wild relatives of wheat (Triticum aestivum L.). Theor. Appl. Genet. 106: 1379-1389.
References
–––––––––––––––––––––––––– 106 –––––––––––––––––––––––––
Huang, X. Q.; S. L. K. Hsam; F. J. Zeller; G. Wenzel and V. Mohler. (2000a). Molecular mapping of the wheat powdery mildew resistance gene Pm24 and marker validation for molecular breeding. Theor. Appl. Genet. 101: 407-414.
Huang, X. Q.; M. S. Röder; E. Pestsova; A. Börner and M. W. Ganal. (2001). Development and use of
wheat microsatellite markers for the characterization of germplasm of hexaploid wheat (Triticum aestivum L.). In: Plant and Animal Genome IXth Conference, Abstract P260, January 13-17, 2001, San Diego, California, USA.
Huang, X. Q.; L. X. Wang; M. X. Xu and M. S. Röder. (2003b). Microsatellite mapping of the
powdery mildew resistance gene Pm5e in common wheat (Triticum aestivum L.). Theor. Appl. Genet. 106: 858-865.
Huang, X. Q.; F. J. Zeller; S. L. K. Hsam; G. Wenzel and V. Mohler. (2000b). Chromosomal location
of AFLP markers in common wheat utilizing nulli-tetrasomic stocks. Genome 43: 298-305. Hunt, L. A. (1979). Stem weight changes during grain filling in wheat from diverse sources. In: Proc.
5th Int. Wheat Genetics Symp. pp. 923-929, IARI, New Delhi, India. Hurd, E. A. (1968). Growth of roots of seven varieties of spring wheat at high and low moisture levels.
Agron. J. 60: 201-205. Hyne, V.; M. J. Kearsey; O. Martinez; W. Gang and J. W. Snape. (1994). A partial genome assy for
quantitative trait loci in wheat (Triticum aestivum) using different analytical techniques. Theor. Appl. Genet. 89: 735-741.
Innes, P.; R. D. Blackwell and S. A. Quarrie. (1984). Some effects of genetic variation in drought-
induced abscisic acid accumulation on the yield and water-use of spring wheat. J. Agric. Sci. Camb. 102: 341-351.
Janssen, P.; R. Coopman; G. Huys; J. Swing; M. Bleeker; P. Vos; M. Zabeau and K. Kersters. (1996).
Evaluation of the DNA fingerprinting method AFLP as a new tool in bacterial taxonomy. Microbiology 142: 1881-1893.
Jarne, P. and P. J. L. Lagoda. (1996). Microsatellites, from molecules to populations and back. Trends
in Ecology and Evolution 11: 424-429. Jefferies, S. P.; A. R. Barr; A. Karakousis; J. M. Kretschmer; S. Manning; K. J. Chalmers; J. C.
Nelson; A. K. M. R. Islam and P. Langridge. (1999). Mapping of chromosome regions conferring boron toxicity tolerance in barley (Hordeum vulgare L.). Theor. Appl. Genet. 98: 1293-1303.
Jefferies, S. P.; A. R. Barr; P. Langridge; K. J. Chalmers; J. M. Kretschmer; P. Gianquitto and A.
Karakousis. (1997). Practical application of molecular markers in barley breeding. pp. 136-144. In: Johnston, R. P. and D. Poulsen. (Eds.). Proc. 8th Aust. Barley Tech. Symp.
Jefferies, S. P.; M. A. Pallotta; J. G. Paull; A. Karakousis; J. M. Kretschmer; S. Manning; A. K. M. R.
Islam; P. Langridge and K. J. Chalmers. (2000). Mapping and validation of chromosome regions conferring boron toxicity tolerance in wheat (Triticum aestivum). Theor. Appl. Genet. 101: 767-777.
Jing, R.; X. Chang; R. Hu; M. Broggio and J. Jia. (2000). A SSR analysis of wheat pedigrees with
drought tolerance. In: International Plant and Animal Genome VIII Conference: Abstract P-104, 9th-12th January 2000, San Diego, USA.
Johnson, W. C.; L. E. Jackson; O. Ochoa; R. van Wijk; J. Peleman; D. A. St. Clair and R. W.
Michelmore. (2000). Lettuce, a shallow-rooted crop, and Lactuca serriola, its wild progenitor,

References
–––––––––––––––––––––––––– 107 –––––––––––––––––––––––––
differ at QTL determining root architecture and deep soil water exploitation. Theor. Appl. Genet. 101: 1066-1073.
Jones, C. J.; K. J. Edwards; S. Castaglione; M. O. Winfield; F. Sala; C. vandeWiel; G. Bredemeijer; B.
Vosman; M. Matthes; A. Daly; R. Brettschneider; P. Bettini; M. Buiatti; E. Maestri; A. Malcevschi; N. Marmiroli; R. Aert; G. Volckaert; J. Rueda; R. Linacero; A. Vazquez and A. Karp. (1997). Reproducibility testing of RAPD, AFLP and SSR markers in plants by a network of European laboratories. Mol. Breed. 3: 381-390.
Jones, D. A.; C. M. Thomas; K. E. Hammond-Kosack; P. J. Balint-Kurtti and J. D. G. Jones. (1994).
Isolation of the tomato Cf-9 gene for resistance to Cladosporum fulvum by transposon tagging. Science 266: 789-793.
Kalendar, R.; T. Grob; M. Regina; A. Suoniemi and A. H. Schulman. (1999). IRAP and REMAP: Two
new retrotransposon-based DNA fingerprinting techniques. Theor. Appl. Genet. 98: 704-711. Kamoshita, A.; J. X. Zhang; J. Siopongco; S. Sarkarung; H. T. Nguyen and L. J. Wade. (2002). Effects
of phenotyping environment on identification of quantitative trait loci for rice root morphology under anaerobic conditions. Crop Sci. 42: 255-265.
Karp, A.; P. I. Isaac and D. S. Ingram. (1998). Molecular Tools for Screening Biodiversity: plants and
animals. Chapman and Hall, London. Kato, K.; H. Miura; M. Akiyama; M. Kuroshima and S. Sawada. (1998). RFLP mapping of the three
major genes, Vrn1, Q and B1, on the long arm of chromosome 5A of wheat. Euphytica 101: 91-95.
Kato, K.; H. Miura and S. Sawada. (1999). QTL mapping of genes controlling ear emergence time and
plant height on chromosome 5A of wheat. Theor. Appl. Genet. 98: 472-477. Kato, K. and T. Wada. (1999). Genetic analysis and selection experiment for narrow-sense earliness in
wheat by using segregating hybrid progenies Breed. Sci. 49: 233-238. Kearsey, M. J. and A. G. L. Farquhar. (1998). QTL analysis in plants; where are we now? Heredity 80:
137-142. Kebede, H.; P. K. Subudhi; D. T. Rosenow and H. T. Nguyen. (2001). Quantitative trait loci
influencing drought tolerance in grain sorghum (Sorghum bicolor L. Moench). Theor. Appl. Genet. 103: 266-276.
Keim, D. L. and W. E. Kronstad. (1979). Drought resistance and dryland adaptation in winter wheat.
Crop Sci. 19: 574-576. Keim, P.; J. M. Schupp; S. E. Travis; K. Clayton; T. Zhou; L. Shi; A. Ferreira and D. M. Webb.
(1997). A high-density soybean genetic map based on AFLP markers. Crop Sci. 37: 537-543. Keller, M.; C. Karutz; J. E. Schmid; P. Stamp; M. Winzeler; B. Keller and M. M. Messmer. (1999a).
Quantitative trait loci for lodging resistance in a segregating wheat x spelt population. Theor. Appl. Genet. 98: 1171-1182.
Keller, M.; B. Keller; G. Schachermayr; M. Winzeler; J. E. Schmid; P. Stamp and M. M. Messmer.
(1999b). Quantitative trait loci for resistance against powdery mildew in a segregating wheat x spelt population. Theor. Appl. Genet. 98: 903-912.
Khabaz-Saberi, H.; R. D. Graham; M. A. Pallotta; A. J. Rathjen and K. J. Williams. (2002). Genetic
markers for manganese efficiency in durum wheat. Plant Breed. 121: 224-227. Khlestkina, E. K; A. Strich; M. S. Röder and A. Börner. (2001). Stem reserve mobilization/
Geographical distribution of red coleoptile color genes. Ann. Wheat Newsletter 47: 50-56.

References
–––––––––––––––––––––––––– 108 –––––––––––––––––––––––––
Keim, P.; J. M. Schupp; S. E. Travis; K. Clayton; T. Zhu; L. A. Shi; A. Ferreira and D. M. Webb. (1997). A high density soybean genetic map based upon AFLP markers. Crop Sci 37: 537-543.
Kicherer, S.; G. Backes; U. Walther and A. Jahoor. (2000). Localising QTLs for leaf rust resistance
and agronomic traits in barley (Hordeum vulgare L). Theor. Appl. Genet. 100: 881-888. Kiniry, J. R. (1993). Nonstructural carbohydrate utilization by wheat shaded during grain growth.
Agronomy Journal 85: 844-849. Kishimoto, N.; M. Yamo; T. Tanaka; K. Saito; T. Nagamine; S. Kuhara; M. Kawase; M. Katsuta; S.
Yoshimura; A. Yoshimura; M. Nakagahra and N. Iwata. (1989). Linkage mapping of RFLP markers of rice nuclear DNA, morphological markers and isozyme loci in rice (Oryza sativa L.). Proc 6th Intern Cong of SABRAO: 489-498.
Kobayashi, Y. and H. Koyama. (2002). QTL analysis of al tolerance in recombinant inbred lines of
Arabidopsis thaliana. Plant Cell Physiol. 43: 1526-1533. Kochert, G. (1994). RFLP technology. In: DNA-Based Markers in Plants. pp. 8-38. Phillipp R. L. and
Vasil I. K. (Eds.), Kluwer Academic Puplishers, The Netherlands. Korzun, V.; S. Malyshev; A. Voylokov and A. Börner. (2001). A genetic map of rye (Secale cereale
L.) combining RFLP, isozyme, protein, microsatellite and gene loci. Theor. Appl. Genet. 102: 709-717.
Korzun, V.; M. S. Röder; M. W. Ganal; A. J. Worland and C. N. Law. (1998). Genetic analysis of the
dwarfing gene Rht8 in wheat. Part I. Molecular mapping of Rht8 on the short arm of chromosome 2D of bread wheat (Triticum aestivum L.). Theor. Appl. Genet. 96: 1104-1109.
Korzun, V.; M. S. Röder; K. Wendehoke; A. Pasqualone; C. Lotti; M. W. Ganal and A. Blanco.
(1999). Integration of dinucleotide microsatellites from hexaploid bread wheat into a genetic linkage map of durum wheat. Theor. Appl. Genet. 98: 1202-1207.
Korzun, V.; M. S. Röder; A. J. Worland and A. Börner. (1997). Intrachromosomal mapping of genes
for dwarfing (Rht12) and vernalization response (Vrn1) in wheat by using RFLP and microsatellite markers. Plant Breed. 116: 227-232.
Kosambi, D. D. (1944). The estimation of map distances from recombination values. Ann. Eugen. 12:
172-175. Koyama, M. L.; A. Levesley; R. M. D. Koebner; T. J. Flowers and A. R. Yeo. (2001). Quantitative
Trait Loci for Component Physiological Traits Determining Salt Tolerance in Rice. Plant Physiol. 125: 406-422.
Kresovich, S.; A. K. Szewe-McFadden; S. M. Bliek and J. R. McFerson. (1995). Abundance and
characterization of simple sequence repeats (SSRs) isolated from a size fractionated genomic library of Brassica napus L. (rapeseed). Theor. Appl. Genet. 91: 206-211.
Lagercrantz, U. (1998). Comparative mapping between Arabidopsis thaliana and Brassica nigra
indicates that Brassica genomes have evolved through extensive genome replication accompanied by chromosome fusions and frequent rearrangements. Genetics 150: 1217-1228.
Lagercrantz, U.; H. Ellegren and L. Andersson. (1993). The abundance of various polymorphic
microsattelite motifs differs between plants and vertebrates. Nucl. Acids Res. 21: 1111-1115. Lagercrantz, U.; J. Putterill; G. Coupland and D. Lydiate. (1996). comparative mapping in Arabidopsis
and Brassica, fine scale genome collinearity and congruence of genes controlling flowering time. Plant J. 9: 13-20.
References
–––––––––––––––––––––––––– 109 –––––––––––––––––––––––––
Lander, E.; P. Green; J. Abrahamson; A. Barlow; M. J. Daly; S. E. Lincoln and L. Newburg. (1987). MAPMAKER: An interactive computer package for constucting primary genetic linkage maps of experimental and natural population. Genomics 1: 174-181.
Landry, B. S.; R. V. Kesseli; B. Farrara and R. W. Michelmore. (1987b). A genetic map of lettuce
(lactuca sativa L.) with restriction fragment length polymorphism, isozyme, disease resistance and morphological markers. Genetics 116: 331-337.
Langer, I.; K. J. Frey and T. Bailey. (1979). Associations among productivity, production response and
stability indexes in oat varieties. Euphytica 28: 17-24. Law, C. N. (1966). The location of genetic factors affecting a quantitative character in wheat. Genetics
53: 487-498. Law, C. N. and M. S. Wolfe. (1966). Location of genetic factors for mildew resistance and ear
emergence time on chromosome 7B of wheat. Can. J. Genet. Cytol. 8: 462-470. Law, C. N. and A. J. Worland. (1973). Aneuploidy in wheat and its chromosome manipulation. Phil.
Trans. R Soc. Lond. Ser B 292: 509-518. Law, C. N.; A. J. Worland and B. Giorgi. (1976). The genetic control of ear-emergence time by
chromosome 5A and 5D wheat. Heredity 36: 49-58. Lelley, T. and M. Stachel. (1998). Microsatellites can differenziate wheat varieties from different
agroecological areas and of different quality. In: A. E. Slinkard (Ed.). Proceedings of the 9th
international wheat genetics symposium (Vol. 3): 2-7 August 1998, pp123-125, University Extension press, University of Saskatchewan, Canda.
Lelley, T.; M. Stachel; H. Grausgruber and J. Vollmann. (2000). Analysis of relationships between
Aegilops tauschii and the D genome of wheat utilizing microsatellites. Genome 43(4): 661-668.
Lench, N. J.; A. Norris; A. Bailey; A. Booth and A. F. Markham. (1996). Vectorette PCR isolation of
microsatellite repeat sequences using anchored dinucleotide repeat primers. Nucl. Acid Research 24: 2190-2191.
Leopold, A. C. (1990). Coping with desiccation. In: Stress response in plants: adaptation and
acclimation mechanisms. pp. 37–56. Alscher, R. G. and J. R. Cumming (Eds). New York: Wiley-Liss.
Leroy, P. (1997a). IWMMN Report # 2, dated April 9, 1997. Leroy, P. (1997b). IWMMN Repart # 5, dated December 18, 1997. Leroy, P. (2000). IWMMN Exchange Data File, Exchange# 8, dated April 26, 2000. Levitt, J. (1980). Response of Plants to Environmental Stresses. Chilling, Freezing and High
Temperature Stresses. pp. 497. I, Academic press, New York. Li, X.; H. J. Van Eck; J. N. A. M. Rouppe van der Voort; D. J. Huigen; P. Stam and E. Jacobsen.
(1998). Autotetraploid and genetic mapping using common AFLP markers: the R2 allele conferring resistance to Phytophthora infestans mapped on potato chromosome 4. Thoer. Appl. Genet. 96: 1121-1128.
Lilley, J. M.; M. M. Ludlow; S. R. Mccouch and J. C. O'Toole. (1996). Locating QTL for osmotic
adjustment and dehydration tolerance in rice. J. Exp. Bot. 47: 1427-1436.
References
–––––––––––––––––––––––––– 110 –––––––––––––––––––––––––
Lin, S. F.; J. Baumer; D. Ivers; S. Cianzio and R. Shoemaker. (2000). Nutrient solution screening of Fe chlorosis resistance in soybean evaluated by molecular characterization. J. Plant Nutr. 23: 1915-1928.
Lin, S. F.; D. Grant; S. Cianzio and R. Shoemaker. (2000). Molecular characterization of iron
deficiency chlorosis in soybean. J. Plant Nutr. 23: 1929-1939. Lin, Y. R.; K. F. Schertz and A. H. Paterson. (1995). Comparative analysis of QTLs affecting plant
height and maturity across the Poaceae, in reference to an interspecific sorghum population. Genetics 141: 391-411.
Lindblad-Toh, K.; E. Winchester; M. J. Daly; D. G. Wang; J. N. Hirschhorn; J. P. Laviolette; K.
Ardlie; D. E. Reich; E. Robinson; P. Sklar; N. Shah; D. Tomas; J. B. Fan; T. Gingeras; J. Warrington; N. Patil; T. J. Hudson and E. S. Lander. (2000). Large-scale discovery and genotyping of single-nucleotide polymorphisms in the mouse. Nat. Genet. 24: 381-386.
Link, W.; A. A. Abdelmula; E. von Kittlitz; S. Bruns; H. Riemer and D. Stelling. (1999). Genotypic
variation for drought tolerance in Vicia faba. Plant Breed 118: 477-483. Linn, J. J.; J. Kuo; J. Ma; J. A. Saunders; H. S. Beard; M. H. MacDonald; W. Kenworthy; G. N. Ude
and B. L. Matthews. (1996). Identification of molecular markers in soybean: comparing RFLP, RAPD and AFLP DNA mapping techniques. Plant Mol. Biol. Rep. 14: 156-169.
Litt, M. and J. A. Luty. (1989). A hypervariable microsatellite revealed by in vitro amplification of a
dinucleotide repeat within the cardiac muscle action gene. Am. J. Hum. Genet. 44: 397-401. Liu, C. J.; M. D. Atkinson; C. N. Chinoy; K. M. Devos and M. D. Gale. (1992). Nonhomoeologous
translocations between group 4, 5 and 7 chromosomes within wheat and rye. Theor. Appl. Genet. 83: 305-312.
Liu, Z. W.; R. M. Biyashev and M. A. Saghai-Maroof. (1996). Development of simple sequence
repeat DNA markers and their integration into a barley linkage map. Theor. Appl. Genet. 93: 869-876.
Liu, D. J.; J. Y. Liu; W. J. Tao and P. D. Chen. (1998). Molecular markers and breeding wheat for
powdery mildew resistance. In: Slinkard, A. E. (Eds.). Proc. 9th International Wheat Genetics Symposium, 3: 128-131, 2–7 Aug., 1998, Univ. Extension Press, Saskatoon, SK, Canada.
Liu, Y. G. and K. Tsunewaki. (1991). Restriction fragment length polymorphism (RFLP) analysis in
wheat. II. Linkage maps of the RFLP sites in common wheat. Jpn. J. Genet. 66: 617-633. Lopatecki, L. E.; E. I. Longair and R. Kasting. (1962). Quantitative changes of soluble carbohydrates
in stems of solid- and hollow- stemmed wheats during growth. Can. J. Bot. 40: 1223-1228. Loss, S. P. and K. H. M. Siddique. (1994). Morphological and physiological traits associated with
wheat yield increases in Mediterranean environment. Adv. Agron. 52: 229-276. Lotti, C.; S. Salvi; A. Pasqualone; R. Tuberosa and A. Blanco. (1998). Polymorphism and mapping of
AFLP markers in durum wheat. In: International plant and animal genome VII conference: Abstract P164, 18th-22st Jan. 1998, San Diego, CA.
Lu, Z. X.; B. Sosinski; G. L. Reighard; W. V. Baird and A. G. Abbott. (1998). Construction of a
genetic linkage map and identification of AFLP markers for resistance to root-knot nematodes in peach rootstocks. Genome 41: 199-207.
Ludlow, M. M. and R. C. Muchow. (1990). A critical evaluation of traits for improving crop yields in
water-limited environments. Adv. Agron. 43: 107-152.
References
–––––––––––––––––––––––––– 111 –––––––––––––––––––––––––
Ma, Z. Q.; M. S. Röder and M. E. Sorrells. (1996). Frequencies and sequence characteristics of di-, tri- and tetra- nucleotide microsatellites in wheat. Genome 39: 123-130.
Maheswaran, M.; P. K. Subudhi; S. Nandi; J. C. Xu; A. Parco; D. C. Yang and N. Huang. (1997).
Polymorphism, distribution, and segregation of AFLP markers in a doubled-haploid rice population. Theor. Appl. Genet. 94: 39-45.
Manifesto, M. M.; A. R. Schlatter; H. E. Hopp; E. Y. Suarez and J. Dubcovsky. (1999). Bread wheat
(Triticum aestivum) fingerprinting using microsatellite. In: International plant and animal genome VII conference: Abstract P371, 17th-21st Jan. 1999, San Diego, CA.
Markert C. L. and F. Moller. (1959). Chemical and biochemical techniques for varietal identification.
Seed Sci. Technol. 1: 181-199. Martin, G.; J. G. K. Williams and S. D. Tanksley. (1991). Rapid identification of markers linked to a
Pseudomonas resistance gene in tomato by using random primers and nearly isogenic lines. Proc. Natl. Acad. Sci. USA 88: 2336-2340.
Mather, K. (1949). Biometrical Genetics. 1st Edn, Methuen, London. McCouch, S. R. and R. W. Doerge. (1995). QTL mapping in rice. Trends in Genetics. 11: 482-487. McCouch, S. R.; G. Kochert; Z. H. Yu; G. S. Khush; W. R. Coffman and S. D. Tanksley. (1988).
Molecular mapping of rice chromosomes. Theor. Appl. Genet. 76: 815-829. McGuire, P. E. and C. O. Qualset. (1997). Progress in genome mapping of wheat and related species.
Joint Proc 5th and 6th Public Workshops Int Triticeae Mapping Initiative, 1-3 Sept 1995, Norwich UK, and 30-31 Aug 1996, Sydney, Australia. Report No. 18. Univ. of California Genetic Resources Conservation Program, Davis, USA.
McIntosh, R. A.; Y. Yamazaki; K. M. Devos; J. Dubkovsky, W. J. Rogers. and R. Appels. (2003).
MacGene 2003-Catalogue of gene symbols for wheat. CD, In: Proc 10th Int Wheat Genet Symp, Paestum, Italy.
Meksem, K.; D. Leister; J. Peleman; M. Zabeau; F. Salamini and C. Gebhardt. (1995). A high-
resolution map of the vicinity of the R1 locus on chromosome V of potato based on RFLP and AFLP markers. Mol. Gen. Genet. 249: 74-81.
Melchinger, A. E.; A. Graner; M. Singh and M. Messmer. (1994). Relationships among European
barley germplasm: I. Genetic diversity among winter and spring cultivars revealed by RFLPs. Crop Sci. 34: 1191-1199.
Melchinger, A. E.; H. F. Utz and C. C. Schön. (1998). Quantitative trait locus (QTL) mapping using
different testers and independent population samples in maize reveals low power of QTL detection and large bias in estimates of QTL effects. Genetics 149: 383-403.
Messmer, M. M.; R. Seyfarth; M. Keller; G. Schachermayr; M. Winzeler; S. Zanetti; C. Feuillet and
B. Keller. (2000). Genetic analysis of durable leaf rust resistance in winter wheat. Theor. Appl. Genet. 100: 419-431.
Michelmore, R. W.; I. Paran and R. V. Kesseli. (1991). Identification of markers linked to disease-
resistance genes by bulked segregant analysis: a rapid method to detect markers in specific genomic regions by using segregating populations. Proc Nat Acad Sci 88: 9828-9832.
Miftahudin; G. J. Scoles and J. P. Gustafson. (2002). AFLP markers tightly linked to the aluminium-
tolerance gene Alt3 in rye (Secale cereale L.). Theor. Appl. Genet. 104: 626-631. Miklos, G. L. G. and G. M. Rubin. (1996). The role of the genome project in determining gene
function: Insights from model organisms. Cell 86: 521-529.
References
–––––––––––––––––––––––––– 112 –––––––––––––––––––––––––
Mindrinos, M.; F. Katagari; G. L. Yu and F. M. Ausubel. (1994). The A. thaliana disease resistance gene RPS2 encodes a protein containing a nucleotide-binding site and leucine-rich repeats. Cell 78: 1089-1099.
Mingeot, D. and J. M. Jacquemin. (1999). Mapping of RFLP probes characterized for their
polymorphism on wheat. Theor. Appl. Genet. 98: 1132-1137. Miura, H.; N. Nakagawa and A. J. Worland. (1999). Control of ear emergence time by chromosome
3A of wheat. Plant Breed. 118: 85-87. Miura, H. and A. J. Worland. (1994). Genetic control of vernalization, day-lenght response and
earliness per se by homologous group-3 chromosomes in wheat. Plant Breed. 113: 160-169. Mohan, M.; S. Nair; A. Bhagwat; T. G. Krishna; M. Yano; C. R. Bhatia and T. Sasaki. (1997).
Genome mapping, molecular markers and marker-assisted selection in crop plants. Molecular breed. 3: 87-103.
Moreiral, M. A.; E. G. Barros; I. Schuster; J. F. Silva; R. A. S. Kiihl; R. V. Abdelinoor; S. S. R.
Marim and V. P. Carvalho. (1999). SSR markers linked to soybean cyst nematode resistance genes. In: International plant and animal genome VII conference: Abstract P249, 17th-21st Jan. 1999, San Diego, CA.
Moore, G.; S. Abbo; W. Cheung; T. Foote; M. Gale; R. Koebner; A. Leitch; I. Leitch; T. Money; P.
Stancombe; M. Yano and R. Flavell. (1993). Key features of cereal genome organization as revealed by the use of cytosine methylation-sensitive restriction endonucleases. Genomics 15: 472-482.
Morgan, J. M. (1991). A gene controlling differences in osmoregulation in wheat. Aust. J. Plant
Physiol. 18: 248-257. Morgan, J. M. and A. G. Condon. (1986). Water use, grain yield and osmoregulation in wheat. Aust. J.
Plant Physiol. 13: 523-532. Morgan, J. M. and M. K. Tan. (1996). Chromosomal location of a wheat osmoregulation gene using
RFLP analysis. Aust. J. Plant Physiol.23: 803-806. Morgante, M. and A. M. Olivieri. (1993). PCR-amplified microsatellites as markers in plant genetics.
Plant J. 3: 175-182. Moule, C.; K. J. Edwrads and M. Trick. (2000). Development of Brassica microsatellite markers In:
International plant and animal genome VIII conference: Abstract P496, 9th-12st Jan. 2000, San Diego, CA.
Moxon, E. R. and C. Wills. (1999). DNA microsatellites: agents of evolution? Scientific American,
January: 72-77. Muchow, R. C. and T. R. Sinclair. (1986). Water and nitrogen limitations in soybean grain production.
II. Field and model analysis. Field Crops Res. 15: 143-156. Mudge, J.; P. B. Cregan; J. P. Kenworthy; W. J. Kenworthy; J. H. Orf and N. D. Young. (1997). Two
microsatellite markers that flank the major soybean cyst nematode resistance locus. Crop Sci. 37: 1611-1615.
Muehlbauer, G. J.; J. E. Specht; M. A. Thomas-Compton; P. E. Staswick and R. L. Bernard. (1988).
Near-isogenic lines- a potential resource in the integration of conventional and molecular marker linkage maps. Crop Sci. 28: 729-735.
Myers, R. M.; T. Maniatis and L. S. Lerman. (1987). Detection and localization of single base changes
by denaturing gradient gel electrophoresis. Methods Enzmol 155: 501-527.
References
–––––––––––––––––––––––––– 113 –––––––––––––––––––––––––
Nachit, M. M. (1992). Durum wheat breeding for Mediterranean dryland of North Africa and West Asia. In: Durum Wheats: “Challenges and Opportunities”. pp 14 –27. Rajram, S.; E. E. Saari and G. P. Hetel. (Eds). CIMMYT, Ciudad Obregon, Mexico.
Nachit, M. M.; I. Elouafi; A. Pagnotta; A. El Saleh; E. Iacono; M. Labhilili; A. Asbati; M. Azrak; H.
Hazzam; D. Benscher; M. Khairallah; J. M. Ribaut; O. A. Tanzarella; E. Porceddu and M. E. Sorrells. (2001). Molecular linkage map for an intraspecific recombinant inbred population of durum wheat (Triticum turgidum L. var. durum ). Theor. Appl. Genet. 102: 177-186.
Nagaoka, T. and Y. Ogihara. (1997). Applicability of inter-simple sequence repeat polymorphisms in
wheat for use as DNA markers in comparison to RFLP and RAPD markers. Theor. Appl. Genet. 94: 597-602.
Nandi, S; P. K. Subudhi; D. Senadhira; N. L. Manigbas; S. Sen-Mandi and N. Huang. (1997).
Mapping QTLs for submergence tolerance in rice by AFLP analysis and selective genotyping. Mol. Gen. Genet. 255: 1-8.
Nelson, J. C. (1997). QGENE: software for marker-based genomic analysis and breeding. Mol. Breed.
3: 239-245. Nguyen, B. D.; D. S. Brar; B. C. Bui; T. V. Nguyen; L. N. Pham and H. T. Nguyen. (2003).
Identification and mapping of the QTL for aluminum tolerance introgressed from the new source, Oryza rufipogon Griff., into indica rice (Oryza sativa L.). Theor. Appl. Genet. 106: 583-593.
Nicholas, M. E. and N. C. Turner. (1993). Use of chemical desiccants and senescing agent to select
wheat lines maintaining stable grain size during post-anthesis drought. Field Crop Res. 31: 155-171.
Old, R. W. and S. B. Primrose. (1989). Principles of gene manipulation. An introduction to genetic
engineering 4th ed., Blackwell Scientific Publication, Oxford. Ott, J. (1985). Analysis of Human Genetic Linkage. The John Hopkins Press Ltd, London, 197 p. Pallotta, M. A.; R. D. Graham; P. Langridge; D. H. B. Sparrow and S. J. Barker. (2000). RFLP
mapping of manganese efficiency in barley. Theor. Appl. Genet. 101: 1100-1108. Palta, J. A.; T. Kobata; N. C. Turner and I. R. Fillery. (1994). Remobilization of carbon and nitrogen
in wheat as influenced by post-anthesis water deficits. Crop Sci. 34: 118-124. Paniego, N. B.; M. Munoz; M. Echaide; L. Fernadez; P. Faccio; R. Zandomeni; E. Suarez and E.
Hopp. (1999). Microsatellite development for sunflower. In: International plant and animal genome VII conference: Abstract P464, 17th-21st Jan. 1999, San Diego, CA.
Papakosta, D. K. and A. A. Gagianas. (1991). Nitrogen and dry matter accumulation, remobilization
and losses for Mediterranean wheat during grain filling. Agron. J. 83: 864-870. Paran, I. and R. W. Michelmore. (1993). Development of reliable PCR-based markers linked to
downey midew resistance in lettuce. Theor. Appl. Genet. 85: 985-993. Parker, G. D.; K. J. Chalmers; A. J. Rathjen and P. Langridge. (1998). Mapping loci associated with
flour in wheat (Triticum aestivum L.). Theor Appl Genet 97: 238-245. Parker, G. D.; K. J. Chalmers; A. J. Rathjen and P. Langridge. (1999). Mapping loci associated with
milling yield in wheat (Triticum aestivum L.). Molecular Breed 5: 561-568. Passioura, J. B. (1983). Roots and drought resistance. Agric. Water Manage. 7: 265-280.
References
–––––––––––––––––––––––––– 114 –––––––––––––––––––––––––
Paterson, A. H. (1995). Molecular dissection of quantitative traits: Progress and prospects. Genome Res. 5: 321-333.
Paterson, A. H. (1997). Comparative mapping of plant phenotypes. Plant Breed Rev. 14: 13-37. Paterson, A. H. (2002). What has QTL mapping taught us about plant domestication?. New
Phytologist 154: 591–608. Paterson, A. H.; S. Damon; J. D. Hewitt; D. Zamir; H. D. Rabinowitch; S. E. Lincoln; E. S. Lander
and S. Tanksley. (1991). Mendelian factors underlying quantitative traits in tomato: Comparision across species, generations, and environments. Genetics 127: 181-197.
Paterson, A. H.; J. W. Deverna; B. Lanini and S. D. Tanksley. (1990). Fine mapping of quantitative
trait loci using selected overlapping recombinant chromosomes, in an interspecies cross of tomato. Genetics 124: 735-742.
Pelleschi, S.; S. Guy; J. Y. Kim; C. Pointe; A. Mahé; L. Barthes; A. Leonardi and J. L. Prioul. (1999).
Ivr2, a candidate gene for a QTL of vacuolar invertase activity in maize leaves. Gene-specific expression under water stress. Plant Mol. Biol. 39: 373-380.
Peng, J. H.; T. Fahima; M. S. Röder; Y. C. Li; A. Dahan; A. Grama; Y. I. Ronin; A. B. Korol and E.
Nevo. (1999). Microsatellite tagging of stripe-rust resistance gene YrH52 derived from wild emmer wheat, Triticum dicoccoides, and suggestive negative crossover interference on chromosome 1B. Theor. Appl. Genet. 98: 862-872.
Penner, G. A.; A. Bush; R. Wise; W. Kim; L. Domier; K. Kasha; A. Laroche; G. Scoles; S. J. Molnar
and G. Fedak. (1993). Reproducibility of random amplified polymorphic DNA (RAPD) analysis among laboratories. PCR Methods Appl. 2: 341-345.
Pestsova, E.; M. W. Ganal and M. S. Röder. (2000). Isolation and mapping of microsatellite markers
specific for the D genome of bread wheat. Genome 43: 689-697. Peterson, C. J.; G. T. Liu; P. J. Mattern; V. A. Johnson and S. L. Kuhr. (1986). Mass selection for
increased seed protein concentration of wheat based on seed density. Crop Sci. 26: 523-527. Petrovic, S. and A. J. Worland. (1988). The use of reciprocal monosomic analysis to detect variation
between certain chromosomes of the wheat varieties ‘Bersee’ and ‘Sava’. pp 629-633. In: Miller, T. E. and R. M. D. Koebner. (Eds). Proc 7th Int. Wheat Genet. Symp. Cambridge, England, 13-19 July 1988. Inst. Plant Sci. Res., Cambridge Lab, Cambridge.
Pflieger, S.; V. Lefebvre; C. Caranta; A. Blattes; B. Goffinet and A. Palloix. (1999). Disease resistance
gene analogs as candidates for QTLs involved in pepper-pathogen interactions. Genome 42: 1100-1110.
Pheloung, P. C. and K. H. M. Siddique. (1991). Contribution of stem dry matter to grain yield in wheat
cultivars. Aust. J. Plant Physiol. 18: 53-64. Pirasteh, B. and J. R. Welsh. (1975). Monosomic analysis of photoperiod response in wheat. Crop Sci.
15: 503-505. Plaschke, J.; M. W. Ganal and M. S. Röder. (1995). Detection of genetic diversity in closely related
bread wheat using microsatellite markers. Theor. Appl. Genet. 91: 1001-1007. Plieske, J. and D. Struss. (2001). STS markers linked to Phoma resistance genes of the Brassica B-
genome revealed sequence homology between Brassica nigra and Brassica napus. Theor. Appl. Genet. 102: 483-488.
References
–––––––––––––––––––––––––– 115 –––––––––––––––––––––––––
Poulsen, D. M. E.; R. J. Henry; R. J. Johnston; J. A. G. Irwin and R. G. Rees. (1995). The use of bulk segregant analysis to identify a RAPD marker linked to a leaf rust resistance in barley. Theor. Appl. Genet. 91: 270-273.
Poulsen, G. B.; G. Kahl and K. Weissing. (1993). Abundance and polymorphism of simple repetitive
DNA sequences in Brassica napus L. Theor. Appl. Genet. 85: 994-1000. Powell, W.; M. Morgante; R. McDevitt; G. Vendramin and A. Rafalski. (1995). Polymorphic simple
sequence repeat regions in chloroplast genomes: Applications to the population genetics of pines. Proc. Natl. Acad. Sci., USA, 92: 7759-7763.
Prasad, M.; N. Kumar; P. L. Kulwal; M. S. Röder; H. S. Balyan; H. S. Dhaliwal and P. K. Gupta.
(2003). QTL analysis for grain protein content using SSR markers and validation studies using NILs in bread wheat. Theor. Appl. Genet. 106: 659-667.
Prasad, M.; R. K. Varshney; A. Kumar; H. S. Balyan; P. C. Sharma; K. J. Edwards; H. Singh; H. S.
Dhaliwal; J. K. Roy and P. K. Gupta. (1999). A microsatellite marker associated with a QTL for grain protein content on chromosome arm 2DL of bread wheat. Theor. Appl. Genet. 99: 341-345.
Prassad, M.; R. K. Varshney; J. K. Roy; H. S. Balyan and P. K. Gupta. (2000). The use of
microsatellites for detecting DNA polymorphism, genotype identification and genetic diversity in wheat. Theor. Appl. Genet. 100: 584-592.
Price, A. H.; K. A. Steele, B. J. Moore and R. G. W. Jones. (2002a). Upland rice grown in soil-filled
chambers and exposed to contrasting water-deficit regimes. II. Mapping quantitative trait loci for root morphology and distribution. Field Crops Res.76: 25-43.
Price, A. H.; J. Townend; M. P. Jones; A. Audebert and B. Courtois. (2002b). Mapping QTLs
associated with drought avoidance in upland rice grown in the Philippines and West Africa. Plant Mol. Biol. 48: 683-695.
Proven, J.; J. R. Russell; A. Booth and W. Powell. (1999). Polymorphic chloroplast simple sequence
repeat primers for systematic and population studies in the genus Hordeum. Molecular Ecology 8: 505-511.
Provan, J.; W. T. B. Thomas; B. P. Forster and W. Powell. (1999). Copia-SSR: A simple marker
technique which can be used on total genomic DNA. Genome 42: 363-366. Provan, J.; R. Waugh and W. Powell. (1996). Microsatellite analysis of relationships within cultivated
potato (Solanum tuberosum). Theor. Appl. Genet. 92: 1076-1084. Qi, X., P. Stam and P. Linndhout. (1998). Use of locus-specific AFLP markers to construct a high-
density molecular map in barley. Theor. Appl. Genet. 96: 376-384. Quarrie, S. A. (1996). New molecular tools to improve the efficiency of breeding for increased
drought resistance. Plant Growth Regulation 20: 167-178. Quarrie, S. A.; M. Gulli; C. Calestani; A. Steed and N. Marmaroli. (1994). Location of a gene
regulating drought-induced abscisic acid production on the long arm of chromosome 5A of wheat. Theor. Appl. Genet. 89: 794-800.
Quarrie, S. A.; D. A. Laurie; J. H. Zhu; C. Lebreton; A. Seikhodskii; A. Steed; H. Witsenboer and C.
Calestani. (1997). QTL analysis to study the association between leaf size and abscisic acid accumulation in droughted rice leaves and comparisons across cereals. Plant Molecular Biology 35: 155-165.
Quesada, V.; S. Garcia-Martinez; P. Piqueras; M. R. Ponce and J. L. Micol. (2002). Genetic
Architecture of NaCl Tolerance in Arabidopsis. Plant Physiol. 130: 951-963.
References
–––––––––––––––––––––––––– 116 –––––––––––––––––––––––––
Radford, B. J. (1987). Effect of constant and fluctuating temperature regimes and seed source on the coleoptile length of tall and semi-dwarf wheats. Austral. J. Exp. Agric. 27:113-117.
Rafalski, J. A. and S. V. Tingey. (1993). Genetic diagnostics in plant breeding: RAPDs, microsatellites
and machines. Trends Genet 9: 275-280. Rafalski, J. A.; J. M. Vogel; M. Morgante; W. Powell; C. Andre and S. V. Tingey. (1996). Generating
and using DNA markers in plants. In: Nonmammalian Genome Analysis. A Practical Guide. pp. 75-134. Birren, B. and E. Lai. (Eds.). Academic Press, San Diego.
Rajasekaran, L. R.; P. E. Kriedemann; D. Aspinall and L. G. Paleg. (1997). Physiological significance
of proline and glycinebetaine: Maintaining photosynthesis during NaCl stress in wheat. Photosynthetica 34: 357-366.
Raman, H.; J. S. Moroni; K. Sato; B. J. Read and B. J. Scott. (2002). Identification of AFLP and
microsatellite markers linked with an aluminium tolerance gene in barley (Hordeum vulgare L.). Theor. Appl. Genet. 105: 458-464.
Ray, J. D.; L. Yu.; S. R. McCouch; C. C. Champoux; G. Wang and H. T. Nguyen. (1996). Mapping
quantitative trait loci associated with root penetration ability in rice (Oryza sativa L.). Theor. Appl. Genet. 92: 627-636.
Rawson, H. M. and L. T. Evans. (1971). The contribution of stem reserves to grain development in a
range of wheat cultivars of different height. Austral. J. Agric. Res. 22: 851-863. Reynolds, M. P.; R. P. Singh; A. Ibrahim; O. A. A. Ageeb; A. Larque-Saavedra and J. S. Quick.
(1998). Evaluating physiological traits to compliment empirical selection for wheat in warm environments. Euphytica 100: 85-94.
Reynolds, M. P.; B. Skovmand; R. M. Trethowan and W. H. Pfeiffer. (2000). Evaluating a conceptual
model for drought tolerance. In: Molecular Approaches for the Genetic Improvement of Cereals for Stable Production in Water-Limited Environments. A Strategic Planning Workshop; El Batan, Texcoco (Mexico); 21-25 Jun 1999. Ribaut, J. M. and D. Poland. (Eds.). Mexico, DF (Mexico): CIMMYT. p. 49-53.
Ribaut, J. M.; D. A. Hoisington; J. A. Deutsch; C. Jiang and D. GonzalezdeLeon. (1996).
Identification of quantitative trait loci under drought conditions in tropical maize. I. flowering parameters and the anthesis-silking interval. Theor. Appl. Genet. 92: 905-914.
Richards, R. A. (1996). Defining selection criteria to improve yield under drought. Plant Growth
Regulation 20: 157-166. Richards, R. A. and T. F. Townley-Smith. (1987). Variation in leaf area development and its effects
and water use, yield and harvest index of droughted wheat. Aust. J. Agric. Res. 38: 983-992. Ridout, C. J. and P. Donini. (1999). Use of AFLP in cereals research. Trends Plant Sci. 4: 76-79. Riede, C. R. and J. A. Anderson. (1996). Linkage of RFLP markers to an aluminum tolerance gene in
wheat. Crop Sci. 36: 905-909. Roberts, D. W. A. (1990). Identification of loci on chromosome 5A involved in control of cold
hardiness, vernalization, leaf length, growth habit and height of hardened plants. Genome 33: 247-259.
Rongwen, J.; M. S. Akkaya; A. A. Bhagwat; U. Lavi and P. B. Cregan. (1995). The use of
microsatellite DNA markers for soybean genotype identification. Theor. Appl. Genet. 90: 43-48.
References
–––––––––––––––––––––––––– 117 –––––––––––––––––––––––––
Rosielle, A. A. and J. Hamblin. (1981). Theoretical aspects of selection for yield in stress and non-stress environments. Crop Sci. 21: 943-946.
Rouppe van der Voort, J. N.; P. van Zandvoort; H. J. van Eck; R. T. Folkertsma; R. C. Hutten; J.
Draaistra; F. J. Gommers; E. Jacobsen; J. Helder and J. Bakker. (1997). Use of allele specificity of comigrating AFLP markers to align genetic maps from different potato genotypes. Mol. Gen. Genet. 255: 438-447.
Roy, J. K.; M. Prasad; R. K. Varshney; H. S. Balyan; T. K.Blake; H. S. Dhaliwal; H. Singh; K. J.
Edwards and P. K. Gupta. (1999). Identification of a microsatellite on chromosome 6B and a STS on 7D of bread wheat showing association with preharvest sprouting tolerance. Theor. Appl. Genet. 99: 336-340.
Röder, M. S.; V. Korzun and M. W. Ganal. (1999). Microsatellite in wheat development and
applications. In: International plant and animal VII conference: Abstract P453, 17th-21st Jan. 1999, San Diego, CA.
Röder, M. S.; V. Korzun; K. Wendehake; J. Plaschke; M. H. Tixer; P. Leroy and M. W. Ganal. (1998).
A microsatellite map of wheat. Genetics 149: 2007-2023. Röder, M. S.; J. Plaschke; S. U. König; A. Börner; M. E. Sorrells; S. D. Tanksley and M. W. Ganal.
(1995). Abundance, variability and chromosomal location of microsatellites in wheat. Mol. Gen. Genet. 246: 327-333.
Russell, J. R.; J. D. Fuller; M. Macaulay; B. G. Hatz; A. Jahoor; W. Powell and R. Waugh. (1997).
Direct comparison of levels of genetic variation among barley accessions detected by RFLPs, AFLPs, SSRs and RAPDs. Theor. Appl. Genet. 95: 714-722.
Sakamura, T. (1918). Kurze Mitteilung uber die Chromosomenzahlen und die
Verwandtschaftsverhaltnisse der Triticum-Arten. Bot. Mag. 32: 151-154. Saiki, R. K.; S. Scharf; F. Faloona; K. B. Mullis; G. T. Horn; H. A. Erlich and N. Arnheim. (1985).
Enzymatic amplification of β-globin genomic sequences and restriction site analysis for diagnosis of sickle cell anemia. Science 230: 1350-1354.
Saito, K.; K. Miura; K. Nagano; Y. Hayano-Saito; H. Araki and A. Kato. (2001). Identification of two
closely linked quantitative trait loci for cold tolerance on chromosome 4 of rice and their association with anther length. Theor. Appl. Genet. 103: 862-868.
Salem, K. F. M. and A. Börner. (2003). Evaluation of wheat accessions from Gatersleben genebank
for post-anthesis drought tolerance in field. In: ‘Abiotischer Streß – Herausforderung für die Pflanzenzüchtung’: Poster, 11-12 Juni, 2003, Groß Lüsewitz, Germany.
Saliba-Colombi, V.; M. Causse; L. Gervais and J. Philouze. (2000). Efficiency of RFLP, RAPD and
AFLP markers for the construction of an intraspecific map of the tomato genome. Genome 43: 29-40.
Sanchez, A. C.; P. K. Subudhi; D. T. Rosenow and H. T. Nguyen. (2002). Mapping QTLs associated
with drought resistance in sorghum (Sorghum bicolor L. Moench). Plant Mol. Biol. 48: 713-726.
Sax, K. (1923). The association of size differences with seed coat pattern and pigmentation in
Phaseolus vulgaris. Genetics 8: 552-560. Sayre, K. D.; E. Acevedo and R. B Austin. (1995). Carbon isotope discrimination and grain yield for
three bread wheat germplasm groups grown at different levels of water stress. Field Crops Research 41: 45-54.
References
–––––––––––––––––––––––––– 118 –––––––––––––––––––––––––
Scarth, R. and C. N. Law. (1983). The location of photoperiod gene Ppd2 and an additional genetic factor for ear emergence time on chromosome 2B of wheat. Heredity 51: 607-619.
Schnurbusch, T.; S. Paillard; D. Fossati; M. Messmer; G. Schachermayr; M. Winzeler and B. Keller.
(2003). Detection of QTLs for Stagonospora glume blotch resistance in Swiss winter wheat. Theor. Appl. Genet. 107: 1226-1234.
Schnurbusch, T.; S. Paillard; A. Schori; M. Messmer; G. Schachermayr; M. Winzeler and B. Keller.
(2004). Dissection of quantitative and durable leaf rust resistance in Swiss winter wheat reveals a major resistance QTL in the Lr34 chromosomal region. Theor. Appl. Genet. 108: 477-484.
Schondelmaier, J.; G. Steinruecken and C. Jung. (1996). Integration of AFLP markers into a linkage
map of sugar beet (Beta vulgaris L.). Plant Breed. 115: 231-237. Schut, J. W.; X. Qi and P. Stam. (1997). Association between relationship measures based on AFLP
markers, pedigree data and morphological traits in barley. Theor. Appl. Genet. 95: 1161-1168. Schwarz, G.; W. Michalek; V. Mohler; G. Wenzel and A. Jahoor. (1999). Chromosome landing at the
Mla locus in barley (Hordeum vulgare L.) by means of high-resolution mapping with AFLP markers. Theor. Appl. Genet. 98: 521-530.
Schwengel, D. A.; A. E. Jedlicka; E. J. Nanthakumar; J. L. Weber and R. C. Levitt. (1994).
Comparison of fluorescence-based semi-automated genotyping of multiple microsatellite loci with autoradiographic techniques. Genomics 22: 46-54.
Shah, M. M.; K. S. Gill; P. S. Baenzger; Y. Yen; S. M. Kaeppler and H. M. Ariyarathe. (1999).
Molecular mapping of loci for agronomic traits on chromosome 3A of bread wheat. Crop Sci. 39: 1728-1732.
Sharopova, N.; M. D. McMullen; L. M. Schultz; S. G. Schroeder; K. E. Houchins; E. Chin; K.
Edwards; D. E. Bergstrom; K. C. Cone; W. Woodman; M. J. Long; M. Lee; J. Vogel; R. Wineland; C. R. Brouwer and T. A. Arbuckle. (2000). Microsatellites in maize-development and mapping. In: International plant and animal genome VIII conference: Abstract P493, 9th-12st Jan. 2000, San Diego, CA.
Shen, X.; M. Zhou; W. Lu and H. Ohm. (2003). Detection of Fusarium head blight resistance QTL in
a wheat population using bulked segregant analysis. Theor. Appl. Genet. 106: 1041-1047. Shindo, C. and T. Sasakuma. (2002). Genes responding to vernalization in hexaploid wheat. Theor.
Appl. Genet. 104: 1003-1010. Shindo, C.; H. Tsujimoto and T. Sasakuma. (2003). Segregation analysis of heading traits in hexaploid
wheat utilizing recombinant inbred lines. Heredity 90: 56-63. Siangliw, M.; T. Toojinda; S. Tragoonrung and A. Vanavichit. (2003). Thai Jasmine Rice Carrying
QTLch9 (SubQTL) is Submergence Tolerant. Ann. Bot. 91: 255-261. Sibov, S. T.; M. Gaspar; M. J. Silva; L. M. M. Ottoboni; P. Arruda and A. P. Souza. (2000). Two
genes control aluminum tolerance in maize: Genetic and molecular mapping analyses. Genome 42: 475-482.
Simmonds, N. W. (1976). Evolution of Crop Plants. Longman, London. Sledge, M. K.; J. H. Boutonb; M. Dall'Agnoll; W. A. Parrottb and G. Kochertc. (2002). Identification
and Confirmation of Aluminum Tolerance QTL in Diploid Medicago sativa subsp. Coerulea. Crop Sci. 42: 1121-1128.
References
–––––––––––––––––––––––––– 119 –––––––––––––––––––––––––
Smith, D. B. and R. B. Flavell. (1974). The relatedness and evolution of repeated nucleotide sequences in the genomes of some Gramineae species. Biochem. Genet. 12: 243-256.
Snape, J. W.; C. N. Law; B. B. Parker and A. J. Worland. (1985). Genetical analysis of chromosome
5A of wheat and its influence on important agronomic characters. Theor. Appl. Genet. 71: 518-526.
Snape, J. W.; R. Sarma; S. A. Quarrie; L. Fish; G. Galiba and J. Sutka. (2001). Mapping genes for
flowering times and frost tolerance in cereals using precise genetic stocks. Euphytica 120: 309-315.
Snape, J. W.; A. Semikhodskii; R. N. Sarma; V. Korzun; L. Fish; S. A. Quarrie; B. S. Gill; T. Sasaki;
G. Galiba and J. Sutka. (1998). Mapping vernalization loci in wheat and comparative mapping with other cereals. In: A. E. Sliknard. (Ed.). Proc 9th Intl Wheat Genet Symp Vol. 3, pp. 156-158. University Extension Press, University of Saskatchewan, Canada.
Soller, M.; T. Brody and A. Genizi. (1976). On the power of experimental designs for the detection of
linkage between marker loci and quantitative loci in crosses between inbred lines. Theor. Appl. Genet. 47: 35-39.
Sourdille, P.; J. W. Snape; T. Cadalen; G. Charmet; N. Nakata; S. Bernard and M. Bernard. (2000).
Detection of QTLs for heading time and photoperiod response in wheat using a doubled-haploid population. Genome 43: 487-494.
Specht, J. E.; K. Chase; M. Macrander; G. L. Graef; J. Chung; J. P. Markwell; M. Germann; J. H. Orf
and K. G. Lark. (2001). Soybean response to water: A QTL analysis of drought tolerance. Crop Sci. 41: 493-509.
Sripongpangkul, K.; G. B. T. Posa; D. W. Senadhira; D. Brar; N. Huang; G. S. Khush and Z. K. Li.
(2000). Genes/QTLs affecting flood tolerance in rice. Theor. Appl. Genet. 101: 1074-1081. Stachel, M.; T. Lelly; H. Grausgruber and Vollmann. (2000). Application of microsatellites in wheat
(Triticum aestivum L.) for studying genetic differentiation caused by selection for adaptation and use. Theor. Appl. Genet. 100: 242-248.
Stam, P. (1993). Construction of integrated genetic linkage maps by means of a new computer
package: JoinMap. Plant J. 3: 739–744. St. Burgos, M.; M. M. Messmer; P. Stamp and J. E. Schmid. (2001). Flooding tolerance of spelt
(Triticum spelta L.) compared to wheat (Triticum aestivum L.)- A physiological and genetic approach. Euphytica 122: 287-295.
Stelmakh, A. F. (1998). Genetics systems regulating flowering response in wheat. Euphytica 100: 359-
369. Stephenson, P.; G. Bryan; J. Kirby; A. Collins; K. M. Devos; C. Busso and M. D. Gale. (1998). Fifty
new microsatellite loci for the wheat genetic map. Theor. Appl. Genet. 97: 946-949. Strand, M.; T. A. Prolla; R. M. Liskay and T. D. Petes. (1993). Destabilisation of tracts of simple
repetitive DNA in yeast by mutations affecting DNA mismatch repair. Nature 365: 274-276. Symons, S. J. and R. G. Fulcher. (1988). Determination of variation in oat kernel morphology by
digital image analysis. J. Cereal Sci. 7: 219-228. Szewe-McFadden, A. K.; S. Kresovich; S. M. Bliek; S. E. Mitchell and J. R. McFerson. (1996).
Identification of polymorphic, conserved simple sequence repeats (SSRs) in cultivated Brassica species. Theor. Appl. Genet. 93: 534-538.
References
–––––––––––––––––––––––––– 120 –––––––––––––––––––––––––
Takeuchi, Y.; H. Hayasaka; B. Chiba; I. Tanaka; T. Shimano; M. Yamagishi; K. Nagano; T. Sasaki and M. Yano. (2001). Mapping quantitative trait loci controlling cool-temperature tolerance at booting stage in temperate japonica rice. Breed. Sci. 51: 191-197.
Talbert, L. E.; N. K. Blake; P. W. Chee; T. K. Blake and G. M. Magyar. (1994). Evaluation of
sequence tagged site PCR products as molecular markers in wheat. Theor. Appl. Genet. 87: 789-794.
Talbert, L. E.; L. Y. Smith and N. K. Blake. (1998). More than one origin of hexaploid wheat is
indicated by sequence comparison of low-copy DNA. Genome 41: 402-407. Tanksley, S. D. (1983). Molecular markers in plant breeding. Plant Mol. Biol. Rep. 1: 3-8. Tanksley, S. D. (1993). Mapping Polygenes. Annual Rev. Genetic 27: 205-233. Tanksley, S. D.; R. Bernatzky; N. L. Lapitan and J. P. Prince. (1988). Conservation of gene repertoire
but not gene order in pepper and tomato. Proc. Natl. Acad. Sci. USA 85: 6419-6423. Tanksley, S. D.; S. Grandillo; T. M. Fulton; D. Zamir; T. Eshed; V. Petiard; J. Lopez and T. Beck-
Bunn (1996). Advanced backcross QTL analysis in a cross between an elite processing line of tomato and its wild relative L. pimpinellifolium . Theor. Appl. Genet. 92: 213-224.
Tanksley, S. D. and J. D. Hewitt. (1988). Use of molecular markers in breeding for soluble solids in
tomato a reexamination. Theor. Appl. Genet. 75: 811-823. Tanksley, S. D. and C. M. Rick. (1980). Isozymic gene linkage map of the tomato: Applications in
genetics and breeding. Theor. Appl. Genet. 57: 161-170. Tanksley, S. D.; N. D. Young; A. H. Paterson and M. W. Bonierbale. (1989). RFLP mapping in plant
breeding: New tools for an old science. Bio/Technology 7: 257-264. Tao, Y. Z.; R. G. Henzell; D. R. Jordan; D. G. Butler; A. M. Kelly and C. L. McIntyre. (2000).
Identification of genomic regions associated with stay green in sorghum by testing RILs in multiple environments. Theor. Appl. Genet. 100: 1225-1232.
Taramino, G. and S. Tingey. (1996). Simple sequence repeats for germplasm analysis and mapping in
maize. Genome 39: 277-287. Tautz, D. (1989). Hypervariability of simple sequences as a general source of polymorphic DNA
markers. Nucl. Acids Res. 17: 6463-6471. Teulat, B.; D. This; M. Khairallah; C. Borries; C. Ragot; P. Sourdille; P. Leroy; P. Monneveux and A.
Charrier. (1998). Several QTLs involved in osmotic-adjustment trait variation in barley (Hordeum vulgare L.). Theor. Appl. Genet. 96: 688-698.
Thoday, J. M. (1961). Location of polygenes. Nature 191: 368-370. Thumma, B. R.; B. P. Naidu; A. Chandra; D. F. Cameron; L. M. Bahnisch and C. J. Liu. (2001).
Identification of causal relationships among traits related to drought resistance in Stylosanthes scabra using QTL analysis. J. Exp. Bot. 52: 203-214.
Tingey, S. and J. P. Del Tufo. (1993). Genetic analysis with random amplified polymorphic DNA
markers. Plant Physiol. 101: 349-352. Tinker, N. A.; M. G. Fortin and D. E. Mather. (1993). Random amplified polymorphic DNA and
pedigree relationships in spring barley. Theor. Appl. Genet. 85: 976-984. Toojinda, T.; L. H. Broers; X. M. Chen; P. M. Hayes; A. Kleinhofs; J. Korte; D. Kudrna; H. Leung; R.
F. Line; W. Powell; L. Ramsay; H. Vivar and R. Waugh. (2000). Mapping quantitative and
References
–––––––––––––––––––––––––– 121 –––––––––––––––––––––––––
qualitative disease resistance genes in a doubled haploid population of barley (Hordeum vulgare). Theor. Appl. Genet. 101: 580-589.
Toojinda, T.; M. Siangliw; S. Tragoonrung and A. Vanavichit. (2003). Molecular genetics of
submergence tolerance in rice: QTL analysis of key. traits. Ann. Bot.91: 243-253. Tóth, B.; G. Galiba; E. Fehér; J. Sutka and·J. W. Snape. (2003). Mapping genes affecting flowering
time and frost resistance on chromosome 5B of wheat Theor. Appl. Genet. 107: 509-514. Tripathy, J. N.; J. Zhang; S. Robin; T. T. Nguyen and H. T. Nguyen. (2000). QTLs for cell-membrane
stability mapped in rice (Oryza sativa L.) under drought stress. Theor. Appl. Genet. 100: 1197-1202.
Truco, M. J.; L. B. Randall; A. J. Bloom and D. A. St. Clair. (2000). Detection of QTLs associated
with shoot wilting and root ammonium uptake under chilling temperatures in an interspecific backcross population from Lycopersicon esculentum x L. hirsutum. Theor. Appl. Genet. 101: 1082-1092.
Tuberosa, R.; M. C. Sanguineti; P. Landi; M. M. Giuliani; S. Salvi and S. Conti. (2002). Identification
of QTLs for root characteristics in maize grown in hydroponics and analysis of their overlap with QTLs for grain yield in the field at two water regimes. Plant Mol. Biol.48: 697-712.
Tuberosa, R.; M. C. Sanguineti; P. Landi; S. Salvi; E. Casarini and S. Conti. (1998). RFLP mapping of
quantitative trait loci controlling abscisic acid concentration in leaves of drought-stressed maize (Zea mays L.). Theor. Appl. Genet. 97: 744-755.
Turner, N. C. (1986). Crop water deficits: a decade of progress. Adv. Agron. 39: 1-51. Turner, N. C. and M. E. Nicholas. (1987). Drought resistance of wheat for light-textured soils in
Mediterranean climate. In: Drought tolerance in winter cereals. p. 203-216. Srivastava, J. P.; E. Porceddu; E. Acevedo and S. Varma. (Eds.). John Wiley, Chichester, England.
Tyagi, P. K.; D. P. Singh and R. K. Pannu. (2000). Effect of post-anthesis desiccation on plant–water
relation, canopy temperature, photosynthesis and grain yield in wheat genotypes. Ann. Biol. 16: 111-119.
Uzunova, M. I. and W. Ecke. (1999). Abundance, polymorphism and genetic mapping of
microsatellites in oilseed rape (Brassica napus L.). Plant Breed. 118: 323-326. Vaccino, P.; M. Accerbi and M. Corbelli. (1993). Cultivar identification in T. aestivum using highly
polymorphic RFLP probes. Theor. Appl. Genet. 86: 833-836. Varshney, R. K.; M. Prasad; J. K. Roy; N. Kumar; Harjit-Singh; H. S. Dhaliwal; H. S. Balyan and P.
K. Gupta. (2000). Identification of eight chromosomes and a microsatellite marker on 1AS associated with QTL for grain weight in bread wheat. Theor. Appl. Genet. 100: 1290-1294.
Venuprasad, R.; H. E. Shashidhar; S. Hittalmani and G. S. Hemamalini. (2002). Tagging quantitative
trait loci associated with grain yield and root morphological traits in rice (Oryza sativa L.) under contrasting moisture regimes. Euphytica 128: 293-300.
Vos, P.; R. Hogers; M. Bleeker; T. Reijans; T. Van de Lee; M. Hornes; A. Frijters; J. Pot; J. Peleman;
M. Kuiper and M. Zabeau. (1995). AFLP: A new technique for DNA fingerprinting. Nucl. Acids Res. 23: 4407-4414.
Waldron, B. L.; B. Moreno-Sevilla; J. A. Anderson; R. W. Stack and R. C. Frohberg. (1999). RFLP
Mapping Of QTL for Fuarium head blight resistance in wheat. Crop Sci. 39: 805-811. Wan, J. L.; H. Q. Zhai; J. M.Wan and H. Ikehashi. (2003). Detection and analysis of QTLs for ferrous
iron toxicity tolerance in rice, Oryza sativa L. Euphytica 131: 201-206.
References
–––––––––––––––––––––––––– 122 –––––––––––––––––––––––––
Wang, D. G.; J. B. Fan; C. J. Siao; A. Berno; P. Young; R. Sapolsky; G. Ghandour; N. Perkins; E. Winchester; J. Spencer; L. Kruglyak; L. Stein; L. Hsie; T. Topaloglou; E. Hubbell; E. Robinson; M. Mittmann; M. S. Morris; N. P. Shen; D. Kilburn; J. Rioux; C. Nusbaum; S. Rozen; T. J. Hudson; R. Lipshutz; M. Chee and E. S. Lander. (1998). Large-scale identification, mapping, and genotyping of single-nucleotide polymorphisms in the human genome. Science 280: 1077-1082.
Wang, G.; R. Mahalingam and H. T. Knap. (1998). (C-A) and (G-A) anchored simple sequence
repeats (ASSRs) generated polymorphism in soybean, Glycine max (L.) Merr. Theor. Appl. Genet. 96: 1086-1096.
Wang, G. L. and A. H. Paterson. (1994). Assessment of DNA pooling strategies for mapping of QTLs.
Theor. Appl. Genet. 88: 355-361. Wang, Y. X.; P. Wu; Y. R. Wu and X. L. Yan. (2002). Molecular marker analysis of manganese
toxicity tolerance in rice under greenhouse conditions. Plant and Soil 238: 227-233. Wardlaw, I. F. and J. Willenbrink. (1994). Carbohydrate storage and mobilization by the culm of
wheat between heading and grain maturity: the relation to sucrose synthase and sucrose-phosphate synthase. Aust. J. Plant. Physiol. 21: 255-271.
Waugh, P. and W. Powell. (1992). Using RAPD markers for crop improvement. Trends Biotch. 10:
186-191. Waugh, R.; N. Bonar; E. Baird; B. Thomas; A. Graner; P. Hayes and W. Powell. (1997). Homology of
AFLP products in three mapping populations of barley. Mol. Gen. Genet. 255: 311-321. Weber, C. A.; G. A. Moore; Z. Deng and F. G. Gmitter. (2003). Mapping freeze tolerance quantitative
trait loci in a Citrus grandis x Poncirus trifoliata F1 pseudo-testcross using molecular markers. Journal of the American Society of Horticultural Science. 128: 508-514.
Weising, K.; H. Nybom; K. Wolff and W. Meyer. (1995). DNA Fingerprinting in Plants and Fungi.
CRC Press, Boca Raton, Florida. Weising, K.; P. Winter; B. Huttel and G. Kahl. (1998). Microsatellite markers for molecular breeding.
J. Crop Production 1: 113-143. Weissenbach, J.; G. Gyapay; C. Dib; A. Vignal; J. Morissette; P. Millasseau; G. Vasseix and M.
Lathrop. (1992). A second-generation linkage map of the human genome. Nature 359: 794-801.
Welsh, J. and M. McClelland. (1990). Fingerprinting genomes using PCR with arbitrary primers.
Nucleic Acids Res. 18: 7213-7218. Weyen, J.; E. Bauer; A. Graner; W. Friedt and F. Ordon. (1996). RAPD-mapping of the distal portion
of chromosome 3 of barley, including the BaMMV/BaYMV resistance gene ym4. Plant Breed. 115: 285-287.
White, G. and W. Powell. (1997b). Isolation and characterisation of microsatellite loci in Swietenia
humulis (Meliaceae): an endangered tropical hardwood species. Molecular Ecology 6: 851-860.
Whitham, S.; S. P. Dinesh-Kumar; D. Choi; R. Hehl; C. Corr and B. Baker. (1994). The product of the
tobacco mosaic virus resistance gene N: similarity to Toll and interleukine-1 receptor. Cell 78: 1101-1115.
Wiersma, J. J.; R. H. Busch; G. G. Fulcher and G. A. Hareland. (2001). Recurrent selection for kernel
weight in spring wheat. Crop Sci. 41: 999-1005.
References
–––––––––––––––––––––––––– 123 –––––––––––––––––––––––––
Williams, J. G. K.; A. R. Kubelik; K. J. Livak; J. A. Rafalski and S. V. Tingey. (1990). DNA polymorphisms amplified by arbitrary primers are useful as genetic markers. Nucl. Acids Res. 18: 6531-6535.
Williams, K. J.; J. M. Fisher and P. Langridge. (1996). Development of a PCR-based allele-specific
assay from an RFLP probe linked to resistance to cereal cyst-nematode resistance in wheat. Genome 39: 798-801.
Wissuwa, M.; J. Wegner; N. Ae and M. Yano. (2002). Substitution mapping of Pup1: a major QTL
increasing phosphorus uptake of rice from a phosphorus-deficient soil. Theor. Appl. Genet. 105: 890-897.
Worland, A. J.; A. Börner; V. Korzun; W. M. Li; S. Petrovic and E. J. Sayers. (1998a). The influence
of photoperiod genes on the adaptability of European winter wheats. Euphytica 100: 385-394. Worland, A. J.; V. Korzun; M. S. Röder; M. W. Ganal and C. N. Law. (1998b). Genetic analysis of the
dwarfing gene Rht8 in wheat. Part 1I. The distribution and adaptive significance of allelic variants at the Rht8 locus of wheat as revealed by microsatellite screening. Theor. Appl. Genet. 96: 1110-1120.
Wright, S. (1934). An analysis of variability in number of difits in an inbred strain of guinea pigs.
Genetics 19: 506-536. Wu, K. S.; R. Jones; L. Danneberger and P. A. Scolnik. (1994). Detection of microsatellite
polymorphism without cloning. Nucl. Acids Res. 22: 3257-3258. Wu, P.; C. Y. Liao; B. Hu; K. K. Yi; W. Z. Jin; J. J. Ni and C. He. (2000). QTLs and epistasis for
aluminum tolerance in rice (Oryza sativa L.) at different seedling stages Theor. Appl. Genet. 100: 1295-1303.
Wu, Z. S. and S. D. Tanksley. (1993). Abundance, polymorphism and genetic mapping of
microsatellites in rice. Mol. Gen. Genet. 241: 225-235. Xu, F. S.; Y. H. Wang and J. Meng. (2001). Mapping boron efficiency gene(s) in Brassica napus
using RFLP and AFLP markers. Plant Breed 120: 319-324. Xu, K.; X. Xu; P. C. Ronald and D. J. Mackill. (2000). A high-resolution linkage map of the vicinity
of the rice submergence tolerance locus Sub1. Mol. Gen. Genet. 263: 681-689. Xu, W. W.; P. K. Subudhi; O. R. Crasta; D. T. Rosenow; J. E. Mullet and H. T. Nguyen. (2000).
Molecular mapping of QTLs conferring stay-green in grain sorghum (Sorghum bicolor L. Moench). Genome 43: 461-469.
Yadav, R.; B. Courtois; N. Huang and G. Mclaren. (1997). Mapping genes controlling root
morphology and root distribution in a doubled-haploid population of rice. Theor. Appl. Genet. 94: 619-632.
Yadav, R. S.; C. T. Hash; F. R. Bidinger; G. P. Cavan and C. J. Howarth. (2002). Quantitative trait
loci associated with traits determining grain and stover yield in pearl millet under terminal drought-stress conditions. Theor. Appl. Genet. 104: 67-83.
Yang, J.; R. G. Sears; B. S. Gill and G. M. Paulsen. (2002). Quantitative and molecular
characterization of heat tolerance in hexaploid wheat. Euphytica 126: 275-282. Yin, X.; P. Stam; C. J. Dourleijn and M. J. Kropff. (1999). AFLP mapping of quantitative trait loci for
yield determining physiological characters in spring barley. Theor. Appl. Genet. 99: 244-253.
References
–––––––––––––––––––––––––– 124 –––––––––––––––––––––––––
Yu, Y. G.; M. A. Saghai-Maroof and G. R. Buss. (1996). Divergence and allelomorphic relationship of soybean virus resistance gene based on tightly linked DNA microsatellite and RFLP markers. Theor. Appl. Genet. 92: 64-69.
Yu, Y. G.; M. A. Saghai-Maroof; G. R. Buss; P. J. Maughan and S. A. Tolin. (1994). RFLP and
microsatellite mapping of a gene for soybean mosaic virus resistance. Phytopathology 84: 60-64.
Zabeau, M. and P. Vos. (1993). Keygene, Wageningen. In European Patent Application, Publication
NR 0 534 858 A1. Zamir, D. and S. D. Tanksley. (1988). Tomato genome is comprised largely of fast-evolving, low
copy-number sequences. Mol. Gen. Genet. 213: 254-261. Zhang, J.; H. G. Zheng; A. Aarti; G. Pantuwan; T. T. Nguyen; J. N. Tripathy; A. K. Sarial; S. Robin;
R. C. Babu; B. D. Nguyen; S. Sarkarung; A. Blum and H. T. Nguyen. (2001). Locating genomic regions associated with components of drought resistance in rice: comparative mapping within and across species. Theor. Appl. Genet. 103: 19-29.
Zhang, L. H.; P. Ozias-Akins; G. Kochert; S. Kresovich; R. Dean and W. Hanna. (1999).
Differentiation of bermudagrass (Cynodon spp.) genotypes by AFLP analyses. Theor. Appl. Genet. 98: 895-902.
Zhao, X. and G. Kochert. (1992). Characterization and genetic mapping of a short, highly repeated,
interspersed DNA sequence from rice (Oryza sativa L.). Mol. Gen. Genet. 231: 353-359. Zhao, X. and G. Kochert. (1993). Phylogenetic distribution and genetic mapping of a (GGC)n
microsatellite from rice (Oryza sativa L.). Plant Mol. Biol. 21: 607-614. Zheng, H. G.; R. C. Babu; M. S. Pathan; L. Ali; N. Huang; B. Courtois and H. T. Nguyen. (2000).
Quantitative trait loci for root-penetration ability and root thickness in rice: Comparison of genetic backgrounds. Genome 43: 53-61.
Zheng, Y. L.; J. Yan and J. L. Yang. (1993). Localization of genes for grain weight in common wheat.
Acta. Agron. Sin. 19: 304-308.
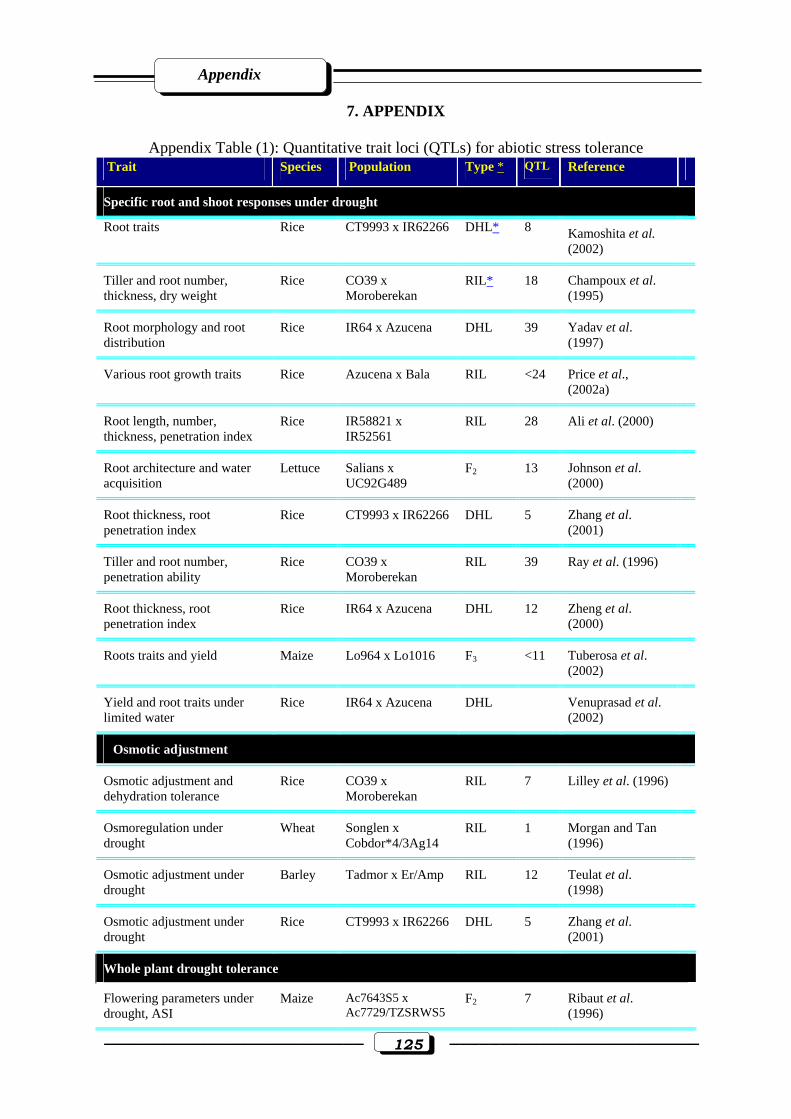
Appendix
–––––––––––––––––––––––––– 125 –––––––––––––––––––––––––
7. APPENDIX
Appendix Table (1): Quantitative trait loci (QTLs) for abiotic stress tolerance Trait Species Population Type * QTL Reference
Specific root and shoot responses under drought
Root traits Rice CT9993 x IR62266 DHL* 8 Kamoshita et al. (2002)
Tiller and root number, thickness, dry weight
Rice CO39 x Moroberekan
RIL* 18 Champoux et al. (1995)
Root morphology and root distribution
Rice IR64 x Azucena DHL 39 Yadav et al. (1997)
Various root growth traits Rice Azucena x Bala RIL <24 Price et al., (2002a)
Root length, number, thickness, penetration index
Rice IR58821 x IR52561
RIL 28 Ali et al. (2000)
Root architecture and water acquisition
Lettuce Salians x UC92G489
F2 13 Johnson et al. (2000)
Root thickness, root penetration index
Rice CT9993 x IR62266 DHL 5 Zhang et al. (2001)
Tiller and root number, penetration ability
Rice CO39 x Moroberekan
RIL 39 Ray et al. (1996)
Root thickness, root penetration index
Rice IR64 x Azucena DHL 12 Zheng et al. (2000)
Roots traits and yield Maize Lo964 x Lo1016 F3 <11 Tuberosa et al. (2002)
Yield and root traits under limited water
Rice IR64 x Azucena DHL Venuprasad et al. (2002)
Osmotic adjustment
Osmotic adjustment and dehydration tolerance
Rice CO39 x Moroberekan
RIL 7 Lilley et al. (1996)
Osmoregulation under drought
Wheat Songlen x Cobdor*4/3Ag14
RIL 1 Morgan and Tan (1996)
Osmotic adjustment under drought
Barley Tadmor x Er/Amp RIL 12 Teulat et al. (1998)
Osmotic adjustment under drought
Rice CT9993 x IR62266 DHL 5 Zhang et al. (2001)
Whole plant drought tolerance
Flowering parameters under drought, ASI
Maize Ac7643S5 x Ac7729/TZSRWS5
F2 7 Ribaut et al. (1996)
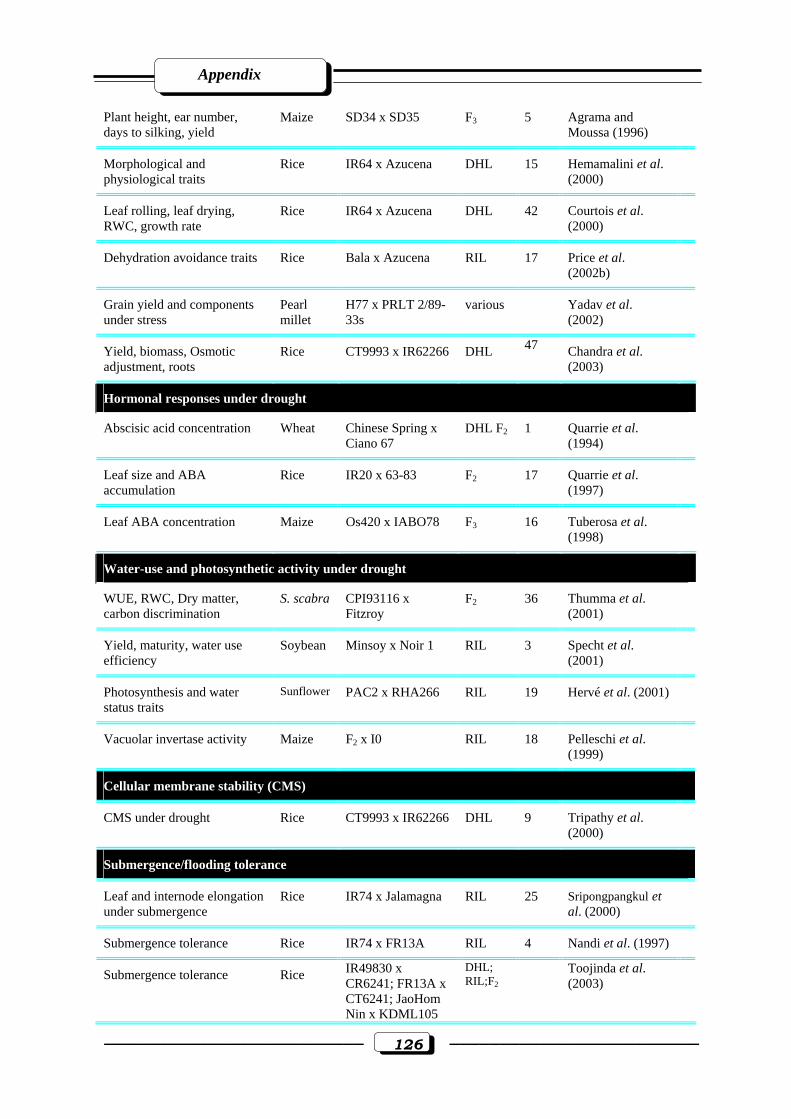
Appendix
–––––––––––––––––––––––––– 126 –––––––––––––––––––––––––
Plant height, ear number, days to silking, yield
Maize SD34 x SD35 F3 5 Agrama and Moussa (1996)
Morphological and physiological traits
Rice IR64 x Azucena DHL 15 Hemamalini et al. (2000)
Leaf rolling, leaf drying, RWC, growth rate
Rice IR64 x Azucena DHL 42 Courtois et al. (2000)
Dehydration avoidance traits Rice Bala x Azucena RIL 17 Price et al. (2002b)
Grain yield and components under stress
Pearl millet
H77 x PRLT 2/89-33s
various Yadav et al. (2002)
Yield, biomass, Osmotic adjustment, roots
Rice CT9993 x IR62266 DHL 47 Chandra et al. (2003)
Hormonal responses under drought
Abscisic acid concentration Wheat Chinese Spring x Ciano 67
DHL F2 1 Quarrie et al. (1994)
Leaf size and ABA accumulation
Rice IR20 x 63-83 F2 17 Quarrie et al. (1997)
Leaf ABA concentration Maize Os420 x IABO78 F3 16 Tuberosa et al. (1998)
Water-use and photosynthetic activity under drought
WUE, RWC, Dry matter, carbon discrimination
S. scabra CPI93116 x Fitzroy
F2 36 Thumma et al. (2001)
Yield, maturity, water use efficiency
Soybean Minsoy x Noir 1 RIL 3 Specht et al. (2001)
Photosynthesis and water status traits
Sunflower PAC2 x RHA266 RIL 19 Hervé et al. (2001)
Vacuolar invertase activity Maize F2 x I0 RIL 18 Pelleschi et al. (1999)
Cellular membrane stability (CMS)
CMS under drought Rice CT9993 x IR62266 DHL 9 Tripathy et al. (2000)
Submergence/flooding tolerance
Leaf and internode elongation under submergence
Rice IR74 x Jalamagna RIL 25 Sripongpangkul et al. (2000)
Submergence tolerance Rice IR74 x FR13A RIL 4 Nandi et al. (1997)
Submergence tolerance Rice IR49830 x CR6241; FR13A x CT6241; JaoHom Nin x KDML105
DHL; RIL;F2
Toojinda et al. (2003)
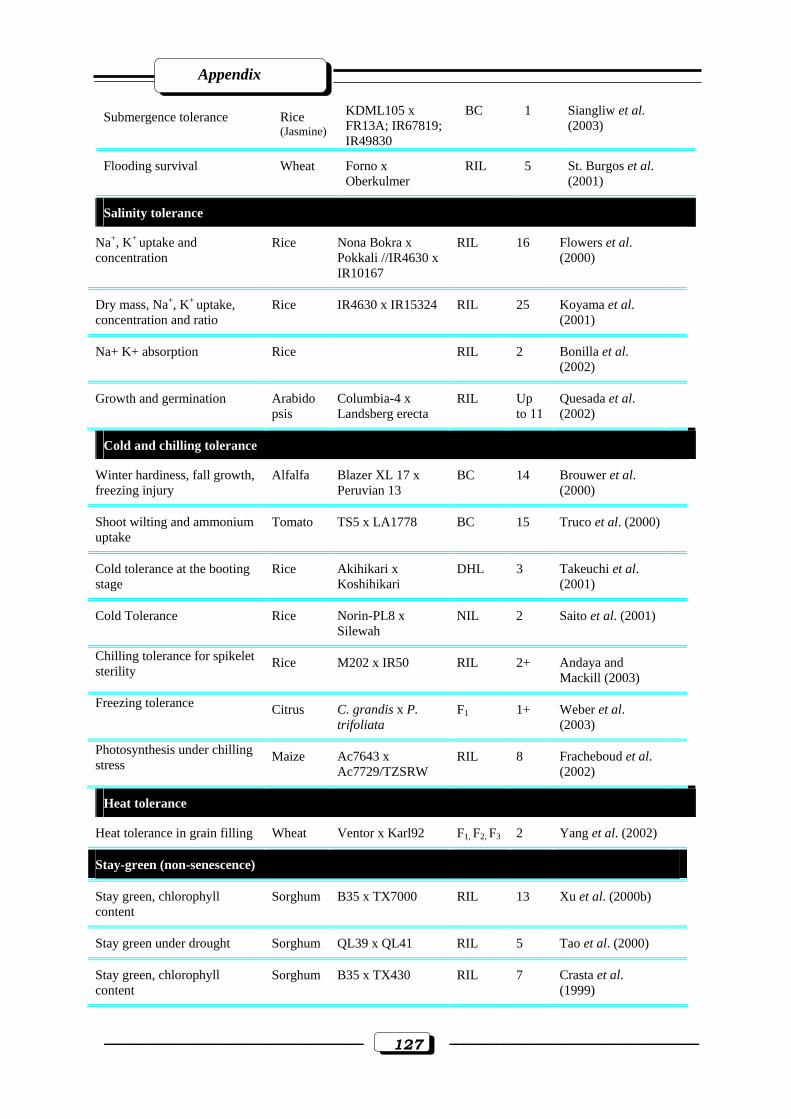
Appendix
–––––––––––––––––––––––––– 127 –––––––––––––––––––––––––
Submergence tolerance Rice (Jasmine)
KDML105 x FR13A; IR67819; IR49830
BC 1 Siangliw et al. (2003)
Flooding survival Wheat Forno x Oberkulmer
RIL 5 St. Burgos et al. (2001)
Salinity tolerance
Na+, K+ uptake and concentration
Rice Nona Bokra x Pokkali //IR4630 x IR10167
RIL 16 Flowers et al. (2000)
Dry mass, Na+, K+ uptake, concentration and ratio
Rice IR4630 x IR15324 RIL 25 Koyama et al. (2001)
Na+ K+ absorption Rice RIL 2 Bonilla et al. (2002)
Growth and germination Arabidopsis
Columbia-4 x Landsberg erecta
RIL Up to 11
Quesada et al. (2002)
Cold and chilling tolerance
Winter hardiness, fall growth, freezing injury
Alfalfa Blazer XL 17 x Peruvian 13
BC 14 Brouwer et al. (2000)
Shoot wilting and ammonium uptake
Tomato TS5 x LA1778 BC 15 Truco et al. (2000)
Cold tolerance at the booting stage
Rice Akihikari x Koshihikari
DHL 3 Takeuchi et al. (2001)
Cold Tolerance Rice Norin-PL8 x Silewah
NIL 2 Saito et al. (2001)
Chilling tolerance for spikelet sterility Rice M202 x IR50 RIL 2+ Andaya and
Mackill (2003)
Freezing tolerance Citrus C. grandis x P. trifoliata
F1 1+ Weber et al. (2003)
Photosynthesis under chilling stress Maize Ac7643 x
Ac7729/TZSRW RIL 8 Fracheboud et al.
(2002)
Heat tolerance
Heat tolerance in grain filling Wheat Ventor x Karl92 F1, F2, F3 2 Yang et al. (2002)
Stay-green (non-senescence)
Stay green, chlorophyll content
Sorghum B35 x TX7000 RIL 13 Xu et al. (2000b)
Stay green under drought Sorghum QL39 x QL41 RIL 5 Tao et al. (2000)
Stay green, chlorophyll content
Sorghum B35 x TX430 RIL 7 Crasta et al. (1999)
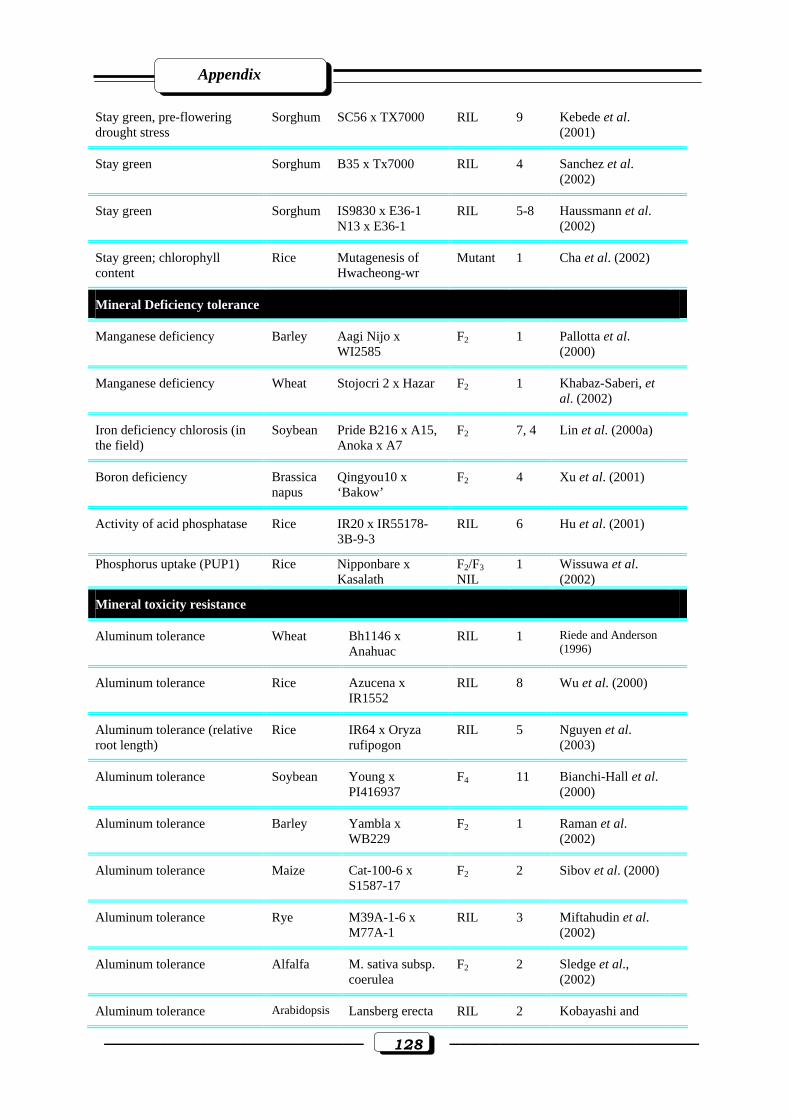
Appendix
–––––––––––––––––––––––––– 128 –––––––––––––––––––––––––
Stay green, pre-flowering drought stress
Sorghum SC56 x TX7000 RIL 9 Kebede et al. (2001)
Stay green Sorghum B35 x Tx7000 RIL 4 Sanchez et al. (2002)
Stay green Sorghum IS9830 x E36-1 N13 x E36-1
RIL 5-8 Haussmann et al. (2002)
Stay green; chlorophyll content
Rice Mutagenesis of Hwacheong-wr
Mutant 1 Cha et al. (2002)
Mineral Deficiency tolerance
Manganese deficiency Barley Aagi Nijo x WI2585
F2 1 Pallotta et al. (2000)
Manganese deficiency Wheat Stojocri 2 x Hazar F2 1 Khabaz-Saberi, et al. (2002)
Iron deficiency chlorosis (in the field)
Soybean Pride B216 x A15, Anoka x A7
F2 7, 4 Lin et al. (2000a)
Boron deficiency Brassica napus
Qingyou10 x ‘Bakow’
F2 4 Xu et al. (2001)
Activity of acid phosphatase Rice IR20 x IR55178-3B-9-3
RIL 6 Hu et al. (2001)
Phosphorus uptake (PUP1) Rice Nipponbare x Kasalath
F2/F3 NIL
1 Wissuwa et al. (2002)
Mineral toxicity resistance
Aluminum tolerance Wheat Bh1146 x Anahuac
RIL 1 Riede and Anderson (1996)
Aluminum tolerance Rice Azucena x IR1552
RIL 8 Wu et al. (2000)
Aluminum tolerance (relative root length)
Rice IR64 x Oryza rufipogon
RIL 5 Nguyen et al. (2003)
Aluminum tolerance Soybean Young x PI416937
F4 11 Bianchi-Hall et al. (2000)
Aluminum tolerance Barley Yambla x WB229
F2 1 Raman et al. (2002)
Aluminum tolerance Maize Cat-100-6 x S1587-17
F2 2 Sibov et al. (2000)
Aluminum tolerance Rye M39A-1-6 x M77A-1
RIL 3 Miftahudin et al. (2002)
Aluminum tolerance Alfalfa M. sativa subsp. coerulea
F2 2 Sledge et al., (2002)
Aluminum tolerance Arabidopsis Lansberg erecta RIL 2 Kobayashi and

Appendix
–––––––––––––––––––––––––– 129 –––––––––––––––––––––––––
x Columbia Koyama (2002)
Boron tolerance (uptake, root length, shoot dry weight)
Barley Sahara3771 x Clipper
DHL 4 Jefferies et al. (1999)
Iron Toxicity tolerance Rice Nipponbare x Kasalath
BC lines
4 Wan et al. (2003)
Manganese tolerance Rice Azucena x IR1552
RIL 8 Wang et al. (2002)
(*) DHL = doubled haploids; RILs = Recombinant inbred lines; BC = Back cross; BIL = Backcross recombinant inbred lines; NIL = Near-isogenic line
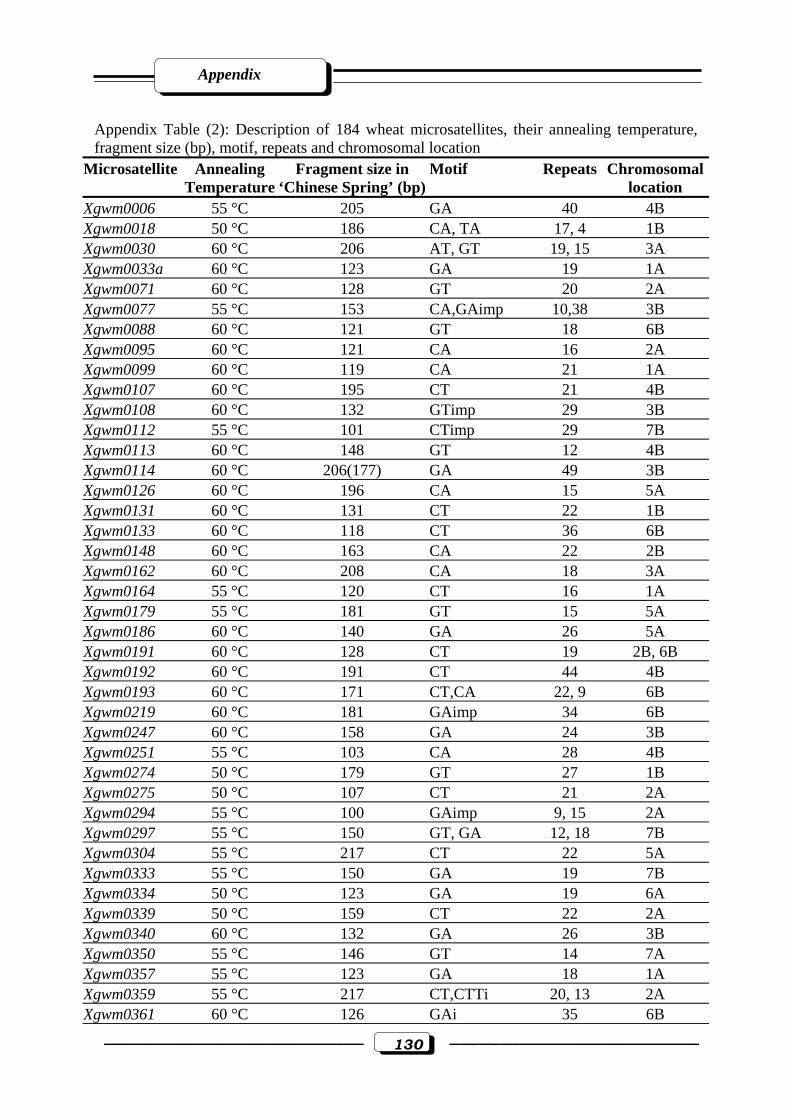
Appendix
–––––––––––––––––––––––––– 130 –––––––––––––––––––––––––
Appendix Table (2): Description of 184 wheat microsatellites, their annealing temperature, fragment size (bp), motif, repeats and chromosomal location
Microsatellite
Annealing Temperature
Fragment size in ‘Chinese Spring’ (bp)
Motif
Repeats
Chromosomal location
Xgwm0006 55 °C 205 GA 40 4B Xgwm0018 50 °C 186 CA, TA 17, 4 1B Xgwm0030 60 °C 206 AT, GT 19, 15 3A Xgwm0033a 60 °C 123 GA 19 1A Xgwm0071 60 °C 128 GT 20 2A Xgwm0077 55 °C 153 CA,GAimp 10,38 3B Xgwm0088 60 °C 121 GT 18 6B Xgwm0095 60 °C 121 CA 16 2A Xgwm0099 60 °C 119 CA 21 1A Xgwm0107 60 °C 195 CT 21 4B Xgwm0108 60 °C 132 GTimp 29 3B Xgwm0112 55 °C 101 CTimp 29 7B Xgwm0113 60 °C 148 GT 12 4B Xgwm0114 60 °C 206(177) GA 49 3B Xgwm0126 60 °C 196 CA 15 5A Xgwm0131 60 °C 131 CT 22 1B Xgwm0133 60 °C 118 CT 36 6B Xgwm0148 60 °C 163 CA 22 2B Xgwm0162 60 °C 208 CA 18 3A Xgwm0164 55 °C 120 CT 16 1A Xgwm0179 55 °C 181 GT 15 5A Xgwm0186 60 °C 140 GA 26 5A Xgwm0191 60 °C 128 CT 19 2B, 6B Xgwm0192 60 °C 191 CT 44 4B Xgwm0193 60 °C 171 CT,CA 22, 9 6B Xgwm0219 60 °C 181 GAimp 34 6B Xgwm0247 60 °C 158 GA 24 3B Xgwm0251 55 °C 103 CA 28 4B Xgwm0274 50 °C 179 GT 27 1B Xgwm0275 50 °C 107 CT 21 2A Xgwm0294 55 °C 100 GAimp 9, 15 2A Xgwm0297 55 °C 150 GT, GA 12, 18 7B Xgwm0304 55 °C 217 CT 22 5A Xgwm0333 55 °C 150 GA 19 7B Xgwm0334 50 °C 123 GA 19 6A Xgwm0339 50 °C 159 CT 22 2A Xgwm0340 60 °C 132 GA 26 3B Xgwm0350 55 °C 146 GT 14 7A Xgwm0357 55 °C 123 GA 18 1A Xgwm0359 55 °C 217 CT,CTTi 20, 13 2A Xgwm0361 60 °C 126 GAi 35 6B
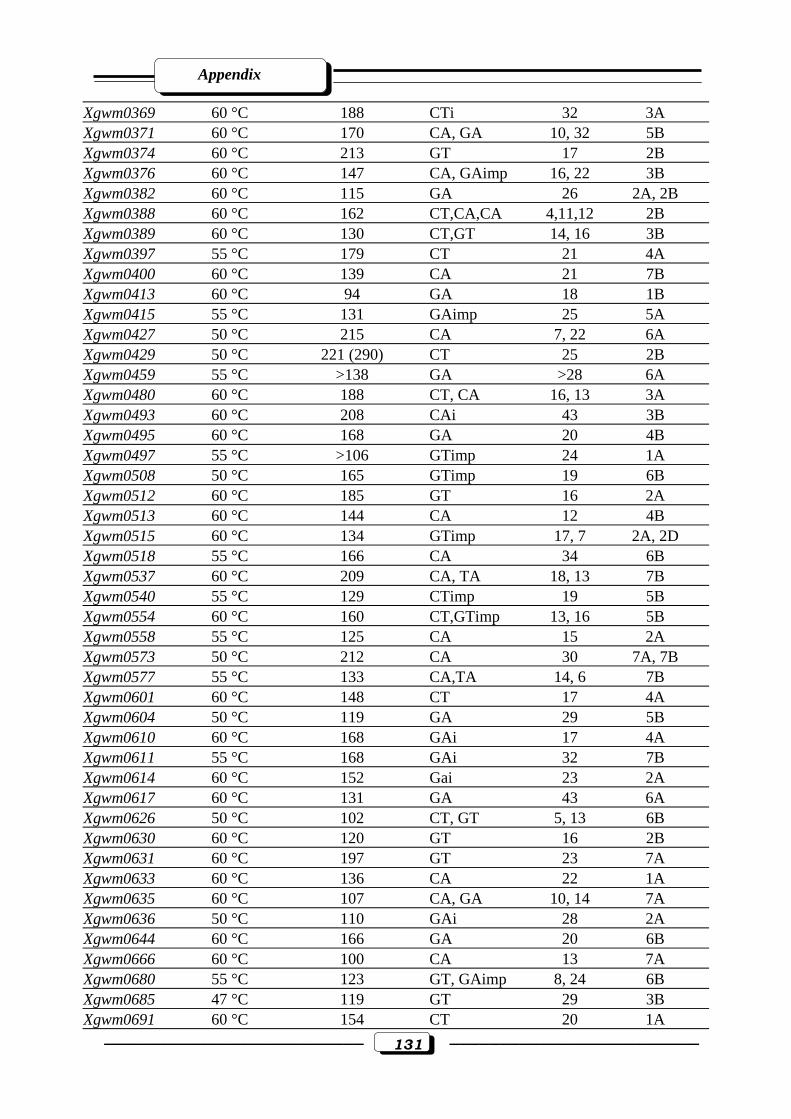
Appendix
–––––––––––––––––––––––––– 131 –––––––––––––––––––––––––
Xgwm0369 60 °C 188 CTi 32 3A Xgwm0371 60 °C 170 CA, GA 10, 32 5B Xgwm0374 60 °C 213 GT 17 2B Xgwm0376 60 °C 147 CA, GAimp 16, 22 3B Xgwm0382 60 °C 115 GA 26 2A, 2B Xgwm0388 60 °C 162 CT,CA,CA 4,11,12 2B Xgwm0389 60 °C 130 CT,GT 14, 16 3B Xgwm0397 55 °C 179 CT 21 4A Xgwm0400 60 °C 139 CA 21 7B Xgwm0413 60 °C 94 GA 18 1B Xgwm0415 55 °C 131 GAimp 25 5A Xgwm0427 50 °C 215 CA 7, 22 6A Xgwm0429 50 °C 221 (290) CT 25 2B Xgwm0459 55 °C >138 GA >28 6A Xgwm0480 60 °C 188 CT, CA 16, 13 3A Xgwm0493 60 °C 208 CAi 43 3B Xgwm0495 60 °C 168 GA 20 4B Xgwm0497 55 °C >106 GTimp 24 1A Xgwm0508 50 °C 165 GTimp 19 6B Xgwm0512 60 °C 185 GT 16 2A Xgwm0513 60 °C 144 CA 12 4B Xgwm0515 60 °C 134 GTimp 17, 7 2A, 2D Xgwm0518 55 °C 166 CA 34 6B Xgwm0537 60 °C 209 CA, TA 18, 13 7B Xgwm0540 55 °C 129 CTimp 19 5B Xgwm0554 60 °C 160 CT,GTimp 13, 16 5B Xgwm0558 55 °C 125 CA 15 2A Xgwm0573 50 °C 212 CA 30 7A, 7B Xgwm0577 55 °C 133 CA,TA 14, 6 7B Xgwm0601 60 °C 148 CT 17 4A Xgwm0604 50 °C 119 GA 29 5B Xgwm0610 60 °C 168 GAi 17 4A Xgwm0611 55 °C 168 GAi 32 7B Xgwm0614 60 °C 152 Gai 23 2A Xgwm0617 60 °C 131 GA 43 6A Xgwm0626 50 °C 102 CT, GT 5, 13 6B Xgwm0630 60 °C 120 GT 16 2B Xgwm0631 60 °C 197 GT 23 7A Xgwm0633 60 °C 136 CA 22 1A Xgwm0635 60 °C 107 CA, GA 10, 14 7A Xgwm0636 50 °C 110 GAi 28 2A Xgwm0644 60 °C 166 GA 20 6B Xgwm0666 60 °C 100 CA 13 7A Xgwm0680 55 °C 123 GT, GAimp 8, 24 6B Xgwm0685 47 °C 119 GT 29 3B Xgwm0691 60 °C 154 CT 20 1A
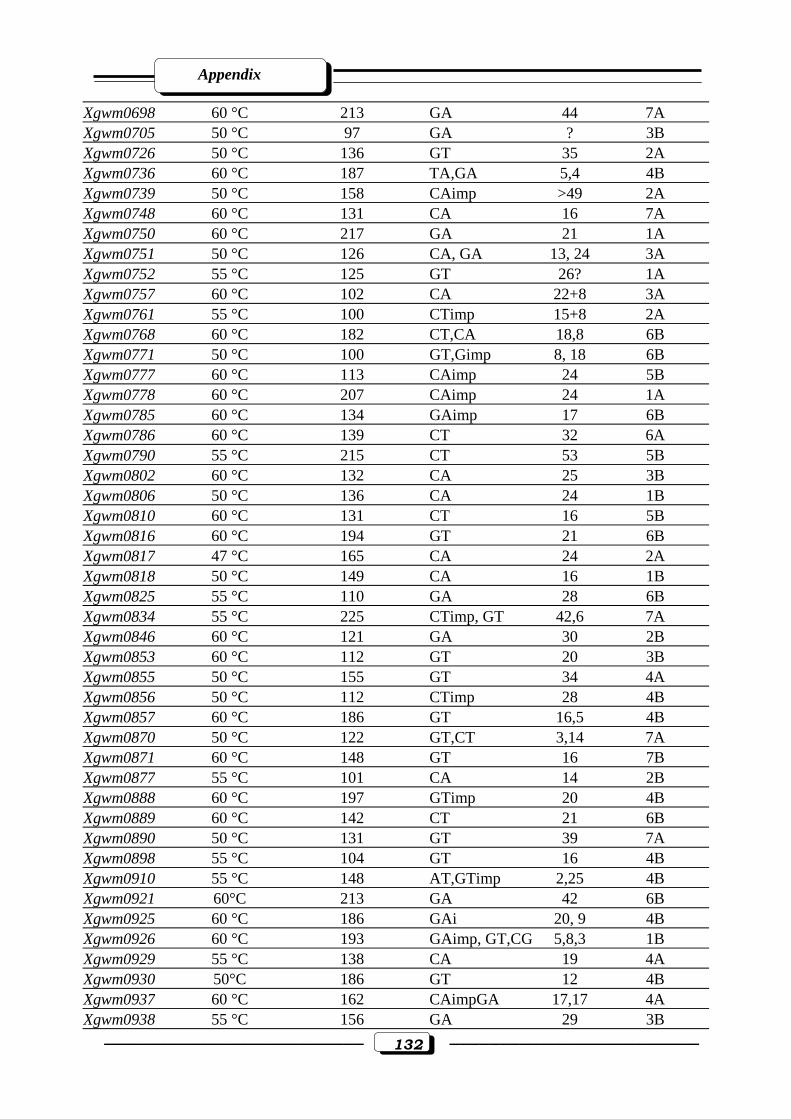
Appendix
–––––––––––––––––––––––––– 132 –––––––––––––––––––––––––
Xgwm0698 60 °C 213 GA 44 7A Xgwm0705 50 °C 97 GA ? 3B Xgwm0726 50 °C 136 GT 35 2A Xgwm0736 60 °C 187 TA,GA 5,4 4B Xgwm0739 50 °C 158 CAimp >49 2A Xgwm0748 60 °C 131 CA 16 7A Xgwm0750 60 °C 217 GA 21 1A Xgwm0751 50 °C 126 CA, GA 13, 24 3A Xgwm0752 55 °C 125 GT 26? 1A Xgwm0757 60 °C 102 CA 22+8 3A Xgwm0761 55 °C 100 CTimp 15+8 2A Xgwm0768 60 °C 182 CT,CA 18,8 6B Xgwm0771 50 °C 100 GT,Gimp 8, 18 6B Xgwm0777 60 °C 113 CAimp 24 5B Xgwm0778 60 °C 207 CAimp 24 1A Xgwm0785 60 °C 134 GAimp 17 6B Xgwm0786 60 °C 139 CT 32 6A Xgwm0790 55 °C 215 CT 53 5B Xgwm0802 60 °C 132 CA 25 3B Xgwm0806 50 °C 136 CA 24 1B Xgwm0810 60 °C 131 CT 16 5B Xgwm0816 60 °C 194 GT 21 6B Xgwm0817 47 °C 165 CA 24 2A Xgwm0818 50 °C 149 CA 16 1B Xgwm0825 55 °C 110 GA 28 6B Xgwm0834 55 °C 225 CTimp, GT 42,6 7A Xgwm0846 60 °C 121 GA 30 2B Xgwm0853 60 °C 112 GT 20 3B Xgwm0855 50 °C 155 GT 34 4A Xgwm0856 50 °C 112 CTimp 28 4B Xgwm0857 60 °C 186 GT 16,5 4B Xgwm0870 50 °C 122 GT,CT 3,14 7A Xgwm0871 60 °C 148 GT 16 7B Xgwm0877 55 °C 101 CA 14 2B Xgwm0888 60 °C 197 GTimp 20 4B Xgwm0889 60 °C 142 CT 21 6B Xgwm0890 50 °C 131 GT 39 7A Xgwm0898 55 °C 104 GT 16 4B Xgwm0910 55 °C 148 AT,GTimp 2,25 4B Xgwm0921 60°C 213 GA 42 6B Xgwm0925 60 °C 186 GAi 20, 9 4B Xgwm0926 60 °C 193 GAimp, GT,CG 5,8,3 1B Xgwm0929 55 °C 138 CA 19 4A Xgwm0930 50°C 186 GT 12 4B Xgwm0937 60 °C 162 CAimpGA 17,17 4A Xgwm0938 55 °C 156 GA 29 3B
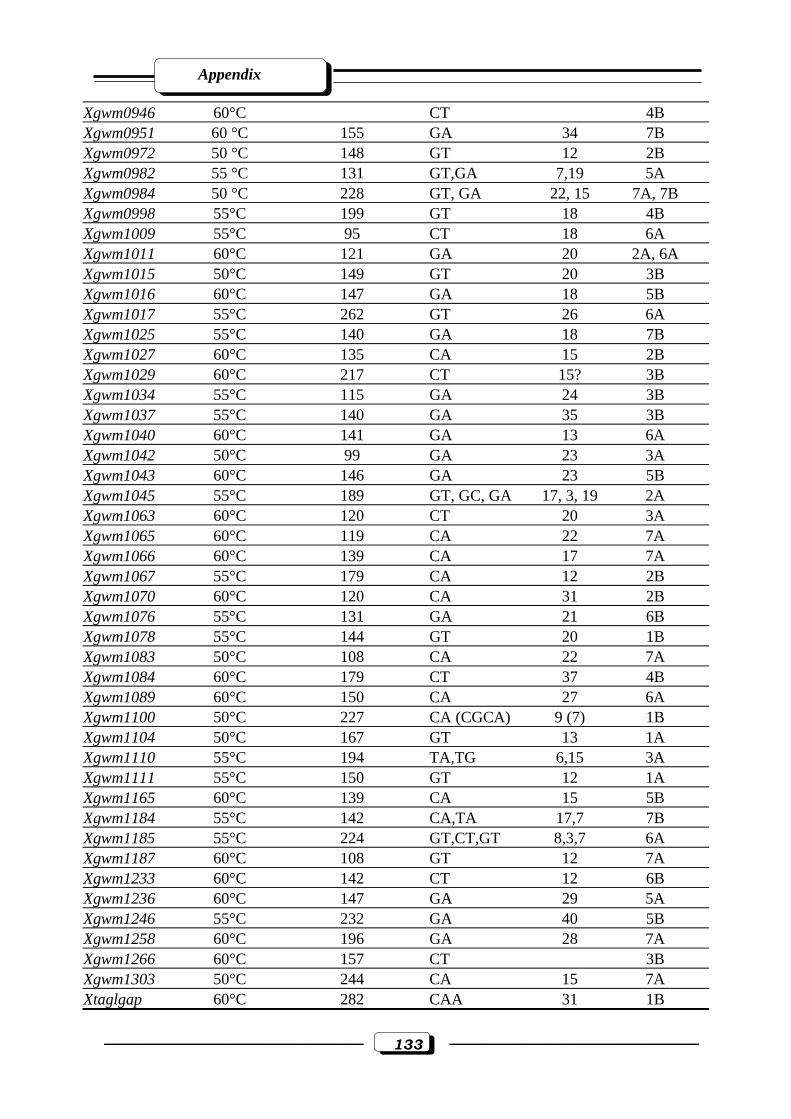
Appendix
–––––––––––––––––––––––––– 133 –––––––––––––––––––––––––
Xgwm0946 60°C CT 4B Xgwm0951 60 °C 155 GA 34 7B Xgwm0972 50 °C 148 GT 12 2B Xgwm0982 55 °C 131 GT,GA 7,19 5A Xgwm0984 50 °C 228 GT, GA 22, 15 7A, 7B Xgwm0998 55°C 199 GT 18 4B Xgwm1009 55°C 95 CT 18 6A Xgwm1011 60°C 121 GA 20 2A, 6A Xgwm1015 50°C 149 GT 20 3B Xgwm1016 60°C 147 GA 18 5B Xgwm1017 55°C 262 GT 26 6A Xgwm1025 55°C 140 GA 18 7B Xgwm1027 60°C 135 CA 15 2B Xgwm1029 60°C 217 CT 15? 3B Xgwm1034 55°C 115 GA 24 3B Xgwm1037 55°C 140 GA 35 3B Xgwm1040 60°C 141 GA 13 6A Xgwm1042 50°C 99 GA 23 3A Xgwm1043 60°C 146 GA 23 5B Xgwm1045 55°C 189 GT, GC, GA 17, 3, 19 2A Xgwm1063 60°C 120 CT 20 3A Xgwm1065 60°C 119 CA 22 7A Xgwm1066 60°C 139 CA 17 7A Xgwm1067 55°C 179 CA 12 2B Xgwm1070 60°C 120 CA 31 2B Xgwm1076 55°C 131 GA 21 6B Xgwm1078 55°C 144 GT 20 1B Xgwm1083 50°C 108 CA 22 7A Xgwm1084 60°C 179 CT 37 4B Xgwm1089 60°C 150 CA 27 6A Xgwm1100 50°C 227 CA (CGCA) 9 (7) 1B Xgwm1104 50°C 167 GT 13 1A Xgwm1110 55°C 194 TA,TG 6,15 3A Xgwm1111 55°C 150 GT 12 1A Xgwm1165 60°C 139 CA 15 5B Xgwm1184 55°C 142 CA,TA 17,7 7B Xgwm1185 55°C 224 GT,CT,GT 8,3,7 6A Xgwm1187 60°C 108 GT 12 7A Xgwm1233 60°C 142 CT 12 6B Xgwm1236 60°C 147 GA 29 5A Xgwm1246 55°C 232 GA 40 5B Xgwm1258 60°C 196 GA 28 7A Xgwm1266 60°C 157 CT 3B Xgwm1303 50°C 244 CA 15 7A Xtaglgap 60°C 282 CAA 31 1B
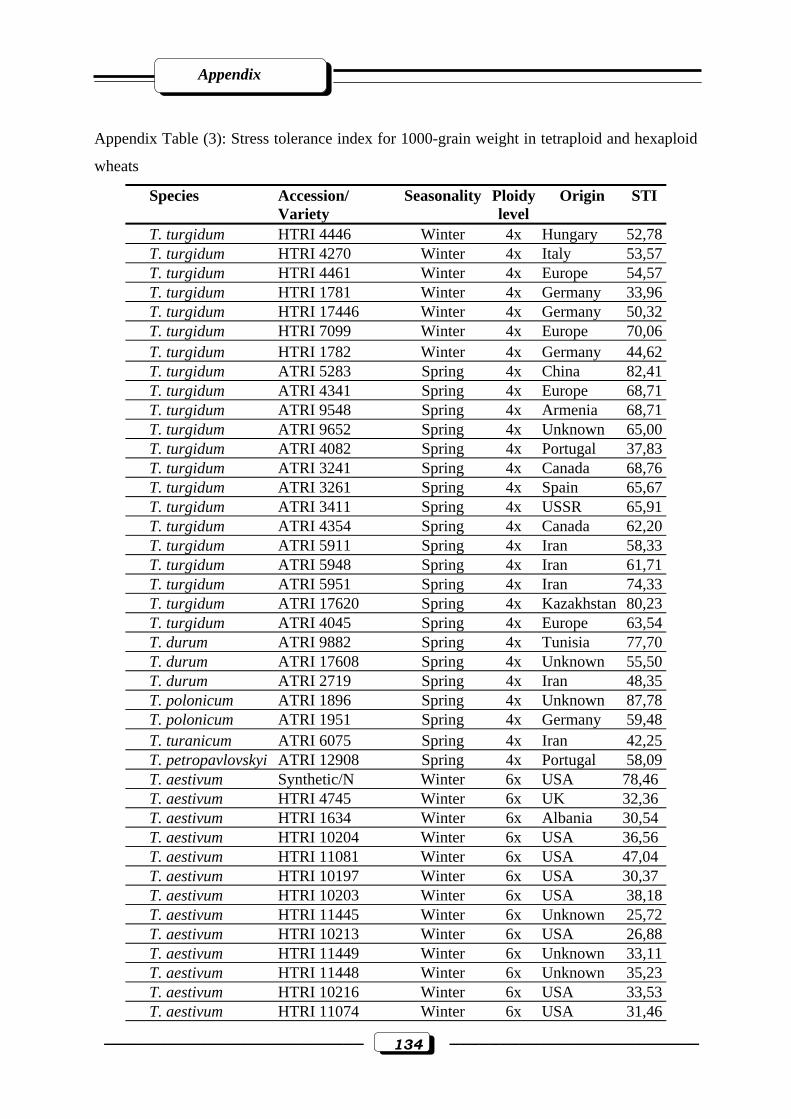
Appendix
–––––––––––––––––––––––––– 134 –––––––––––––––––––––––––
Appendix Table (3): Stress tolerance index for 1000-grain weight in tetraploid and hexaploid
wheats
Species
Accession/ Variety
Seasonality
Ploidy level
Origin
STI
T. turgidum HTRI 4446 Winter 4x Hungary 52,78T. turgidum HTRI 4270 Winter 4x Italy 53,57T. turgidum HTRI 4461 Winter 4x Europe 54,57T. turgidum HTRI 1781 Winter 4x Germany 33,96T. turgidum HTRI 17446 Winter 4x Germany 50,32T. turgidum HTRI 7099 Winter 4x Europe 70,06T. turgidum HTRI 1782 Winter 4x Germany 44,62T. turgidum ATRI 5283 Spring 4x China 82,41T. turgidum ATRI 4341 Spring 4x Europe 68,71T. turgidum ATRI 9548 Spring 4x Armenia 68,71T. turgidum ATRI 9652 Spring 4x Unknown 65,00T. turgidum ATRI 4082 Spring 4x Portugal 37,83T. turgidum ATRI 3241 Spring 4x Canada 68,76T. turgidum ATRI 3261 Spring 4x Spain 65,67T. turgidum ATRI 3411 Spring 4x USSR 65,91T. turgidum ATRI 4354 Spring 4x Canada 62,20T. turgidum ATRI 5911 Spring 4x Iran 58,33T. turgidum ATRI 5948 Spring 4x Iran 61,71T. turgidum ATRI 5951 Spring 4x Iran 74,33T. turgidum ATRI 17620 Spring 4x Kazakhstan 80,23T. turgidum ATRI 4045 Spring 4x Europe 63,54T. durum ATRI 9882 Spring 4x Tunisia 77,70T. durum ATRI 17608 Spring 4x Unknown 55,50T. durum ATRI 2719 Spring 4x Iran 48,35T. polonicum ATRI 1896 Spring 4x Unknown 87,78T. polonicum ATRI 1951 Spring 4x Germany 59,48T. turanicum ATRI 6075 Spring 4x Iran 42,25T. petropavlovskyi ATRI 12908 Spring 4x Portugal 58,09T. aestivum Synthetic/N Winter 6x USA 78,46 T. aestivum HTRI 4745 Winter 6x UK 32,36 T. aestivum HTRI 1634 Winter 6x Albania 30,54 T. aestivum HTRI 10204 Winter 6x USA 36,56 T. aestivum HTRI 11081 Winter 6x USA 47,04 T. aestivum HTRI 10197 Winter 6x USA 30,37 T. aestivum HTRI 10203 Winter 6x USA 38,18T. aestivum HTRI 11445 Winter 6x Unknown 25,72T. aestivum HTRI 10213 Winter 6x USA 26,88T. aestivum HTRI 11449 Winter 6x Unknown 33,11T. aestivum HTRI 11448 Winter 6x Unknown 35,23T. aestivum HTRI 10216 Winter 6x USA 33,53T. aestivum HTRI 11074 Winter 6x USA 31,46
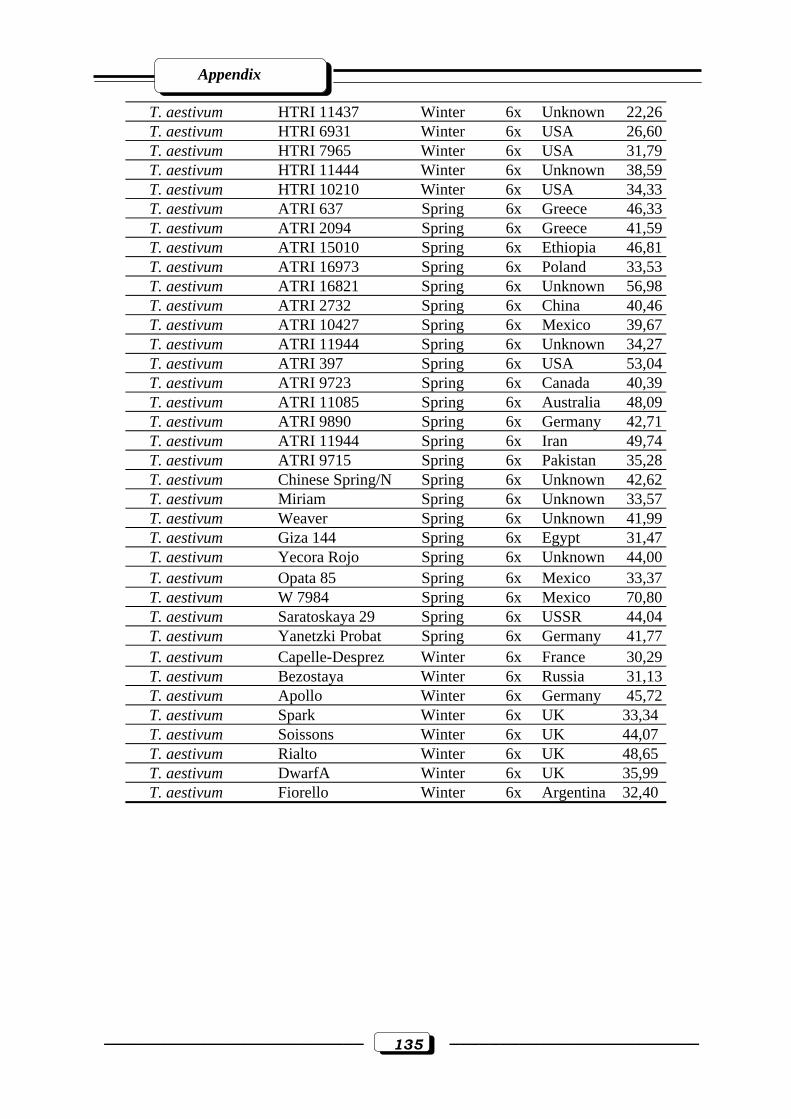
Appendix
–––––––––––––––––––––––––– 135 –––––––––––––––––––––––––
T. aestivum HTRI 11437 Winter 6x Unknown 22,26T. aestivum HTRI 6931 Winter 6x USA 26,60T. aestivum HTRI 7965 Winter 6x USA 31,79T. aestivum HTRI 11444 Winter 6x Unknown 38,59T. aestivum HTRI 10210 Winter 6x USA 34,33T. aestivum ATRI 637 Spring 6x Greece 46,33T. aestivum ATRI 2094 Spring 6x Greece 41,59T. aestivum ATRI 15010 Spring 6x Ethiopia 46,81T. aestivum ATRI 16973 Spring 6x Poland 33,53T. aestivum ATRI 16821 Spring 6x Unknown 56,98T. aestivum ATRI 2732 Spring 6x China 40,46T. aestivum ATRI 10427 Spring 6x Mexico 39,67T. aestivum ATRI 11944 Spring 6x Unknown 34,27T. aestivum ATRI 397 Spring 6x USA 53,04T. aestivum ATRI 9723 Spring 6x Canada 40,39T. aestivum ATRI 11085 Spring 6x Australia 48,09T. aestivum ATRI 9890 Spring 6x Germany 42,71T. aestivum ATRI 11944 Spring 6x Iran 49,74T. aestivum ATRI 9715 Spring 6x Pakistan 35,28T. aestivum Chinese Spring/N Spring 6x Unknown 42,62T. aestivum Miriam Spring 6x Unknown 33,57T. aestivum Weaver Spring 6x Unknown 41,99T. aestivum Giza 144 Spring 6x Egypt 31,47T. aestivum Yecora Rojo Spring 6x Unknown 44,00T. aestivum Opata 85 Spring 6x Mexico 33,37T. aestivum W 7984 Spring 6x Mexico 70,80T. aestivum Saratoskaya 29 Spring 6x USSR 44,04T. aestivum Yanetzki Probat Spring 6x Germany 41,77T. aestivum Capelle-Desprez Winter 6x France 30,29T. aestivum Bezostaya Winter 6x Russia 31,13T. aestivum Apollo Winter 6x Germany 45,72T. aestivum Spark Winter 6x UK 33,34 T. aestivum Soissons Winter 6x UK 44,07 T. aestivum Rialto Winter 6x UK 48,65 T. aestivum DwarfA Winter 6x UK 35,99 T. aestivum Fiorello Winter 6x Argentina 32,40
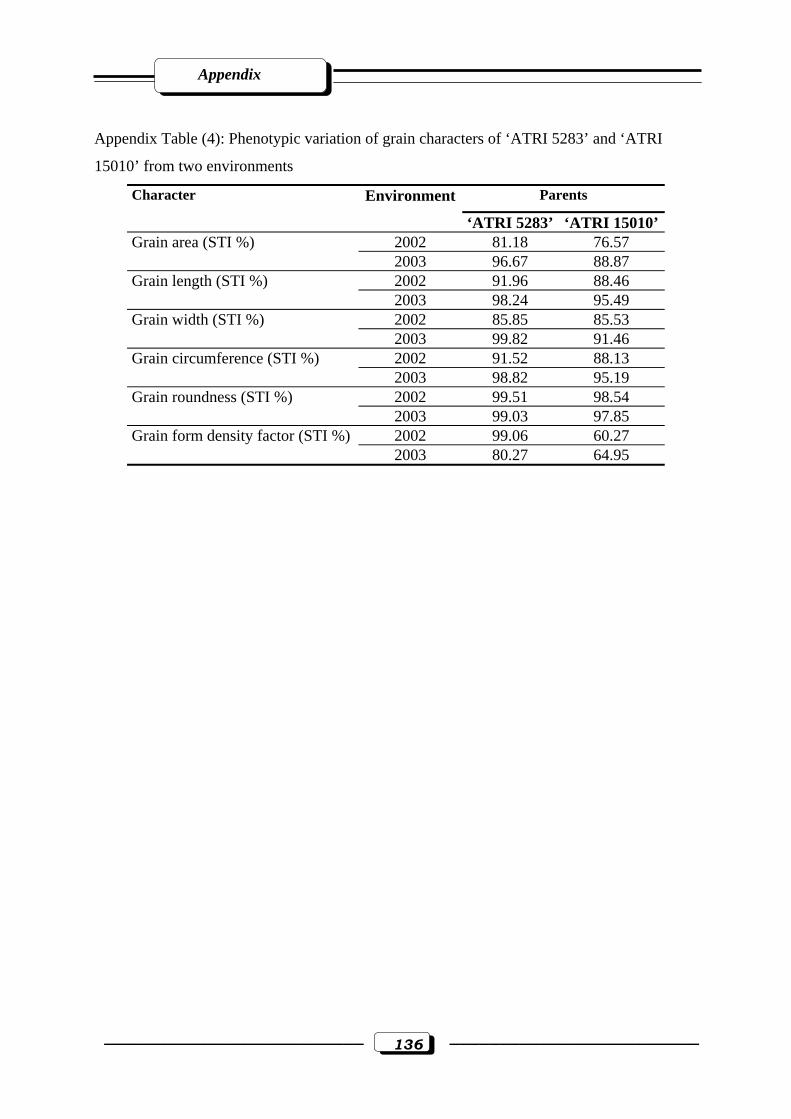
Appendix
–––––––––––––––––––––––––– 136 –––––––––––––––––––––––––
Appendix Table (4): Phenotypic variation of grain characters of ‘ATRI 5283’ and ‘ATRI
15010’ from two environments
Parents Character Environment
‘ATRI 5283’ ‘ATRI 15010’2002 81.18 76.57 Grain area (STI %) 2003 96.67 88.87 2002 91.96 88.46 Grain length (STI %) 2003 98.24 95.49 2002 85.85 85.53 Grain width (STI %) 2003 99.82 91.46 2002 91.52 88.13 Grain circumference (STI %) 2003 98.82 95.19 2002 99.51 98.54 Grain roundness (STI %) 2003 99.03 97.85 2002 99.06 60.27 Grain form density factor (STI %) 2003 80.27 64.95
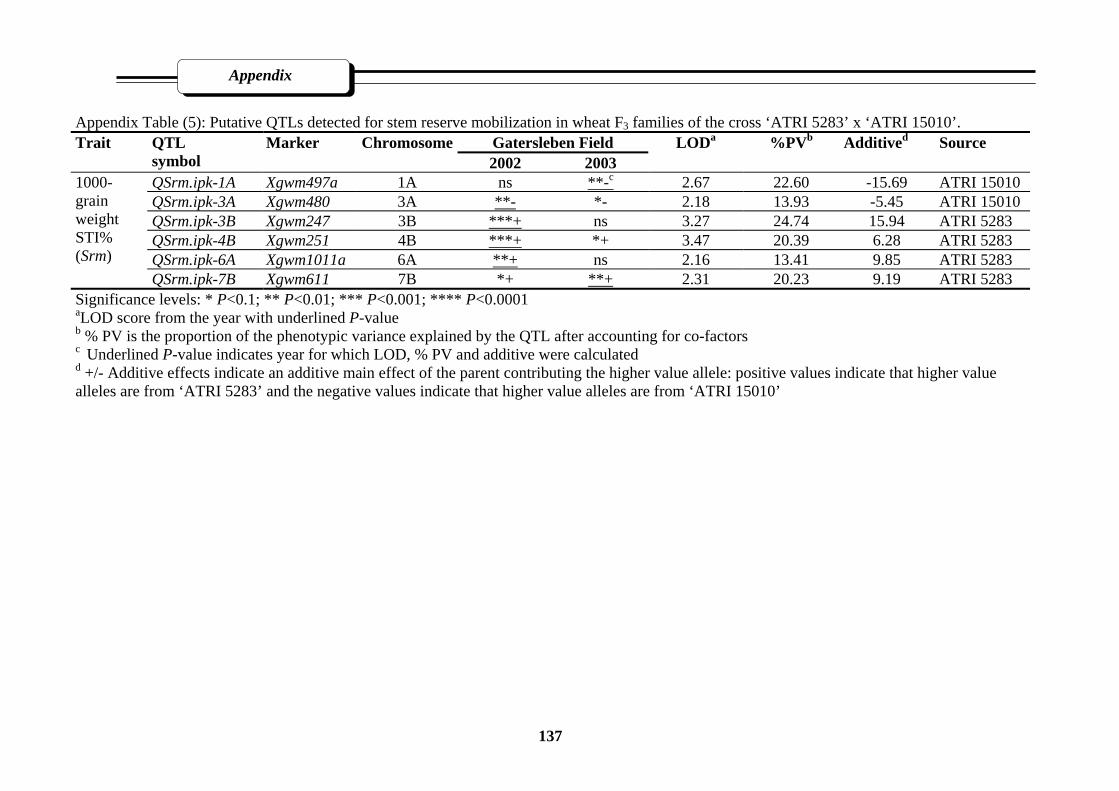
Appendix
137
Appendix Table (5): Putative QTLs detected for stem reserve mobilization in wheat F3 families of the cross ‘ATRI 5283’ x ‘ATRI 15010’.
Gatersleben Field Trait QTL symbol
Marker Chromosome2002 2003
LODa %PVb
Additived Source
QSrm.ipk-1A Xgwm497a 1A ns **-c 2.67 22.60 -15.69 ATRI 15010 QSrm.ipk-3A Xgwm480 3A **- *- 2.18 13.93 -5.45 ATRI 15010 QSrm.ipk-3B Xgwm247 3B ***+ ns 3.27 24.74 15.94 ATRI 5283 QSrm.ipk-4B Xgwm251 4B ***+ *+ 3.47 20.39 6.28 ATRI 5283 QSrm.ipk-6A Xgwm1011a 6A **+ ns 2.16 13.41 9.85 ATRI 5283
1000-grain weight STI% (Srm)
QSrm.ipk-7B Xgwm611 7B *+ **+ 2.31 20.23 9.19 ATRI 5283 Significance levels: * P<0.1; ** P<0.01; *** P<0.001; **** P<0.0001 aLOD score from the year with underlined P-value b % PV is the proportion of the phenotypic variance explained by the QTL after accounting for co-factors c Underlined P-value indicates year for which LOD, % PV and additive were calculated d +/- Additive effects indicate an additive main effect of the parent contributing the higher value allele: positive values indicate that higher value alleles are from ‘ATRI 5283’ and the negative values indicate that higher value alleles are from ‘ATRI 15010’
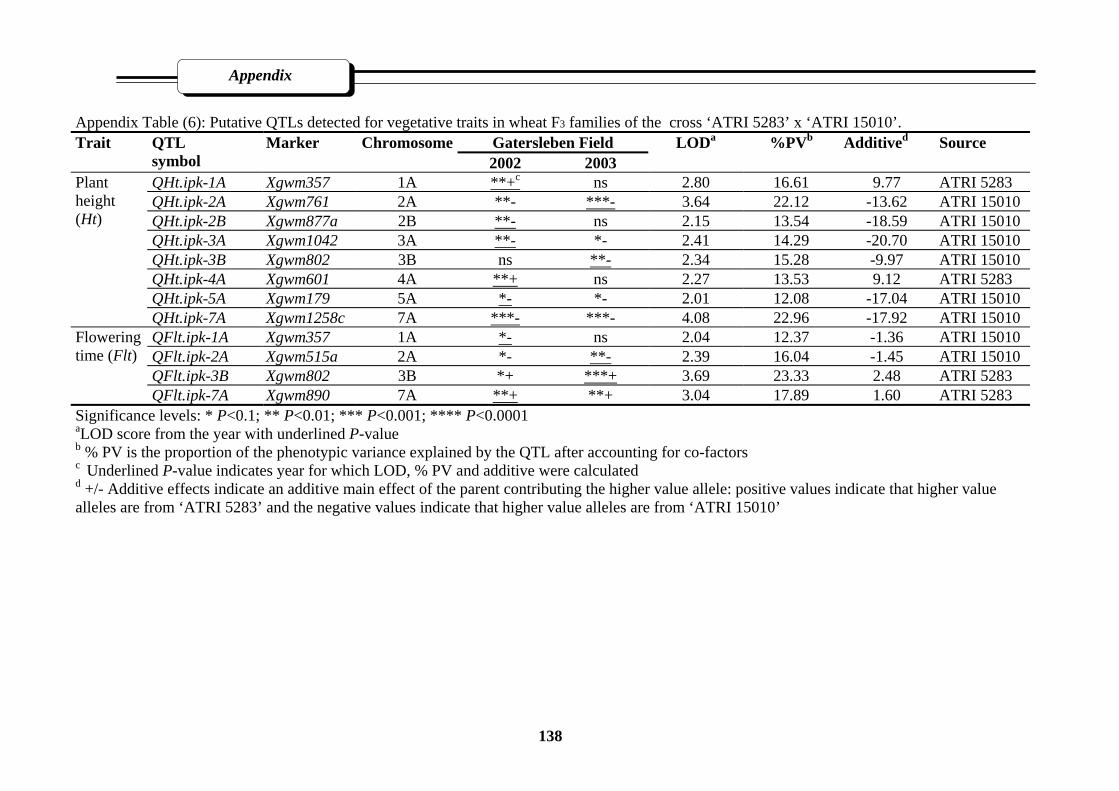
Appendix
138
Appendix Table (6): Putative QTLs detected for vegetative traits in wheat F3 families of the cross ‘ATRI 5283’ x ‘ATRI 15010’.
Gatersleben Field Trait QTL symbol
Marker Chromosome2002 2003
LODa %PVb
Additived Source
QHt.ipk-1A Xgwm357 1A **+c ns 2.80 16.61 9.77 ATRI 5283 QHt.ipk-2A Xgwm761 2A **- ***- 3.64 22.12 -13.62 ATRI 15010 QHt.ipk-2B Xgwm877a 2B **- ns 2.15 13.54 -18.59 ATRI 15010 QHt.ipk-3A Xgwm1042 3A **- *- 2.41 14.29 -20.70 ATRI 15010 QHt.ipk-3B Xgwm802 3B ns **- 2.34 15.28 -9.97 ATRI 15010 QHt.ipk-4A Xgwm601 4A **+ ns 2.27 13.53 9.12 ATRI 5283 QHt.ipk-5A Xgwm179 5A *- *- 2.01 12.08 -17.04 ATRI 15010
Plant height (Ht)
QHt.ipk-7A Xgwm1258c 7A ***- ***- 4.08 22.96 -17.92 ATRI 15010 QFlt.ipk-1A Xgwm357 1A *- ns 2.04 12.37 -1.36 ATRI 15010 QFlt.ipk-2A Xgwm515a 2A *- **- 2.39 16.04 -1.45 ATRI 15010 QFlt.ipk-3B Xgwm802 3B *+ ***+ 3.69 23.33 2.48 ATRI 5283
Flowering time (Flt)
QFlt.ipk-7A Xgwm890 7A **+ **+ 3.04 17.89 1.60 ATRI 5283 Significance levels: * P<0.1; ** P<0.01; *** P<0.001; **** P<0.0001 aLOD score from the year with underlined P-value b % PV is the proportion of the phenotypic variance explained by the QTL after accounting for co-factors c Underlined P-value indicates year for which LOD, % PV and additive were calculated d +/- Additive effects indicate an additive main effect of the parent contributing the higher value allele: positive values indicate that higher value alleles are from ‘ATRI 5283’ and the negative values indicate that higher value alleles are from ‘ATRI 15010’

Appendix
139
Appendix Table (7): Putative QTLs detected for grain area, grain width and grain length in wheat F3 families of the cross ‘ATRI 5283’ x ‘ATRI 15010’.
Gatersleben Field Trait QTL symbol
Marker Chromosome2002 2003
LODa %PVb
Additived Source
QGae.ipk-1A Xgwm752 1A ns ***+ c 3.80 23.92 4.61 ATRI 5283 QGae.ipk-2B Xgwm191b 2B **- ns 2.91 20.01 -6.22 ATRI 15010 QGae.ipk-4A Xgwm610 4A **- ns 3.07 18.77 -6.16 ATRI 15010 QGae.ipk-5B Xgwm1165 5B ns ***+ 4.11 24.93 3.77 ATRI 5283 QGae.ipk-6A Xgwm786 6A **- ns 2.12 13.40 -3.50 ATRI 15010
Grain area STI% (Gae)
QGae.ipk-6B Xgwm816 6B ns ***- 3.67 22.60 -4.29 ATRI 15010 QGwd.ipk-1A Xgwm752 1A ns **+ 2.31 15.32 2.67 ATRI 5283 QGwd.ipk-2B Xgwm846d 2B **- ns 2.68 16.80 -3.87 ATRI 15010 QGwd.ipk-4A Xgwm610 4A **- ns 2.12 13.91 -3.52 ATRI 15010
Grain width STI% (Gwd) QGwd.ipk-5B Xgwm1165 5B ns ***+ 4.15 25.16 2.83 ATRI 5283
QGlt.ipk-1A Xgwm633 1A ns **+ 2.35 15.12 2.09 ATRI 5283 QGlt.ipk-1B Xgwm1078 1B ns **- 2.20 15.28 -3.69 ATRI 15010 QGlt.ipk-2A Xgwm512 2A ns **+ 2.60 17.57 4.33 ATRI 5283 QGlt.ipk-4A Xgwm610 4A **- ns 2.74 16.92 -3.64 ATRI 15010 QGlt.ipk-6A Xgwm427 6A **+ ns 2.81 17.80 2.22 ATRI 5283 QGlt.ipk-6B Xgwm816 6B ns ***- 4.20 25.39 -2.89 ATRI 15010 QGlt.ipk-7A Xgwm1066 7A **- ns 2.47 15.39 -1.79 ATRI 15010
Grain length STI% (Glt)
QGlt.ipk-7B Xgwm611 7B **- ns 2.36 15.16 -2.16 ATRI 15010 Significance levels: * P<0.1; ** P<0.01; *** P<0.001; **** P<0.0001 aLOD score from the year with underlined P-value b % PV is the proportion of the phenotypic variance explained by the QTL after accounting for co-factors c Underlined P-value indicates year for which LOD, % PV and additive were calculated d +/- Additive effects indicate an additive main effect of the parent contributing the higher value allele: positive values indicate that higher value alleles are from ‘ATRI 5283’ and the negative values indicate that higher value alleles are from ‘ATRI 15010’
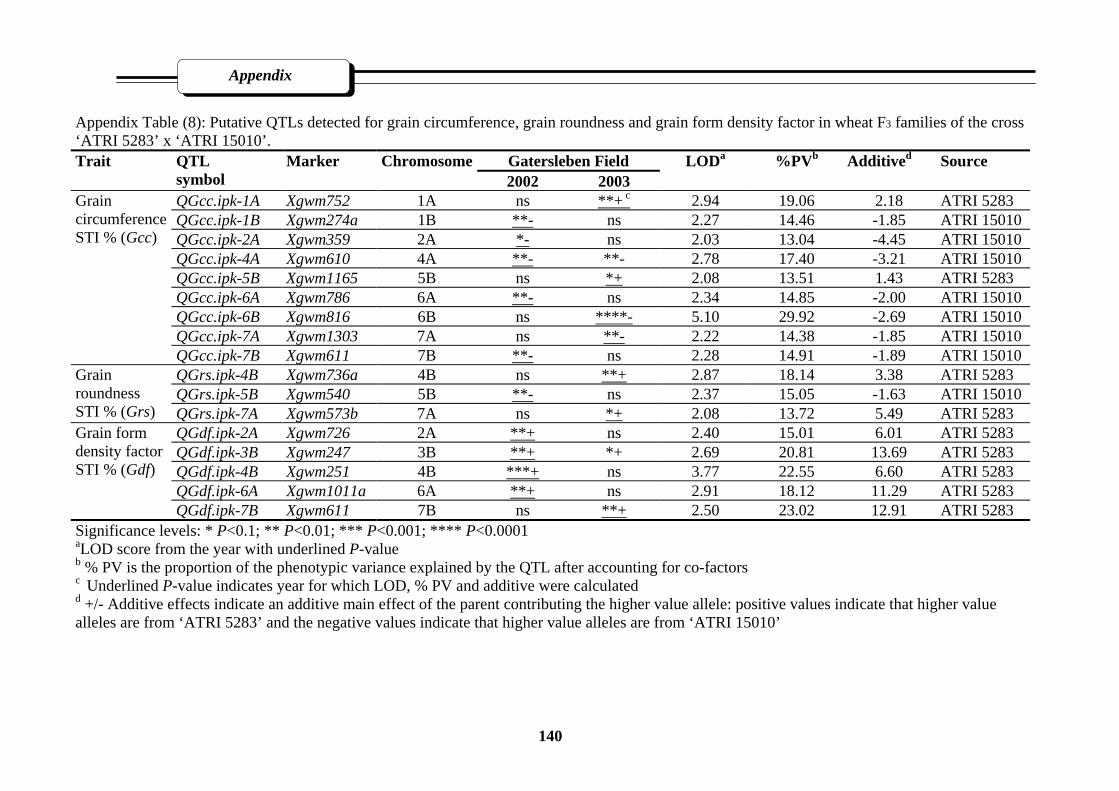
Appendix
140
Appendix Table (8): Putative QTLs detected for grain circumference, grain roundness and grain form density factor in wheat F3 families of the cross ‘ATRI 5283’ x ‘ATRI 15010’.
Gatersleben Field Trait QTL symbol
Marker Chromosome2002 2003
LODa %PVb
Additived Source
QGcc.ipk-1A Xgwm752 1A ns **+ c 2.94 19.06 2.18 ATRI 5283 QGcc.ipk-1B Xgwm274a 1B **- ns 2.27 14.46 -1.85 ATRI 15010 QGcc.ipk-2A Xgwm359 2A *- ns 2.03 13.04 -4.45 ATRI 15010 QGcc.ipk-4A Xgwm610 4A **- **- 2.78 17.40 -3.21 ATRI 15010 QGcc.ipk-5B Xgwm1165 5B ns *+ 2.08 13.51 1.43 ATRI 5283 QGcc.ipk-6A Xgwm786 6A **- ns 2.34 14.85 -2.00 ATRI 15010 QGcc.ipk-6B Xgwm816 6B ns ****- 5.10 29.92 -2.69 ATRI 15010 QGcc.ipk-7A Xgwm1303 7A ns **- 2.22 14.38 -1.85 ATRI 15010
Grain circumference STI % (Gcc)
QGcc.ipk-7B Xgwm611 7B **- ns 2.28 14.91 -1.89 ATRI 15010 QGrs.ipk-4B Xgwm736a 4B ns **+ 2.87 18.14 3.38 ATRI 5283 QGrs.ipk-5B Xgwm540 5B **- ns 2.37 15.05 -1.63 ATRI 15010
Grain roundness STI % (Grs) QGrs.ipk-7A Xgwm573b 7A ns *+ 2.08 13.72 5.49 ATRI 5283
QGdf.ipk-2A Xgwm726 2A **+ ns 2.40 15.01 6.01 ATRI 5283 QGdf.ipk-3B Xgwm247 3B **+ *+ 2.69 20.81 13.69 ATRI 5283 QGdf.ipk-4B Xgwm251 4B ***+ ns 3.77 22.55 6.60 ATRI 5283 QGdf.ipk-6A Xgwm1011a 6A **+ ns 2.91 18.12 11.29 ATRI 5283
Grain form density factor STI % (Gdf)
QGdf.ipk-7B Xgwm611 7B ns **+ 2.50 23.02 12.91 ATRI 5283 Significance levels: * P<0.1; ** P<0.01; *** P<0.001; **** P<0.0001 aLOD score from the year with underlined P-value b % PV is the proportion of the phenotypic variance explained by the QTL after accounting for co-factors c Underlined P-value indicates year for which LOD, % PV and additive were calculated d +/- Additive effects indicate an additive main effect of the parent contributing the higher value allele: positive values indicate that higher value alleles are from ‘ATRI 5283’ and the negative values indicate that higher value alleles are from ‘ATRI 15010’
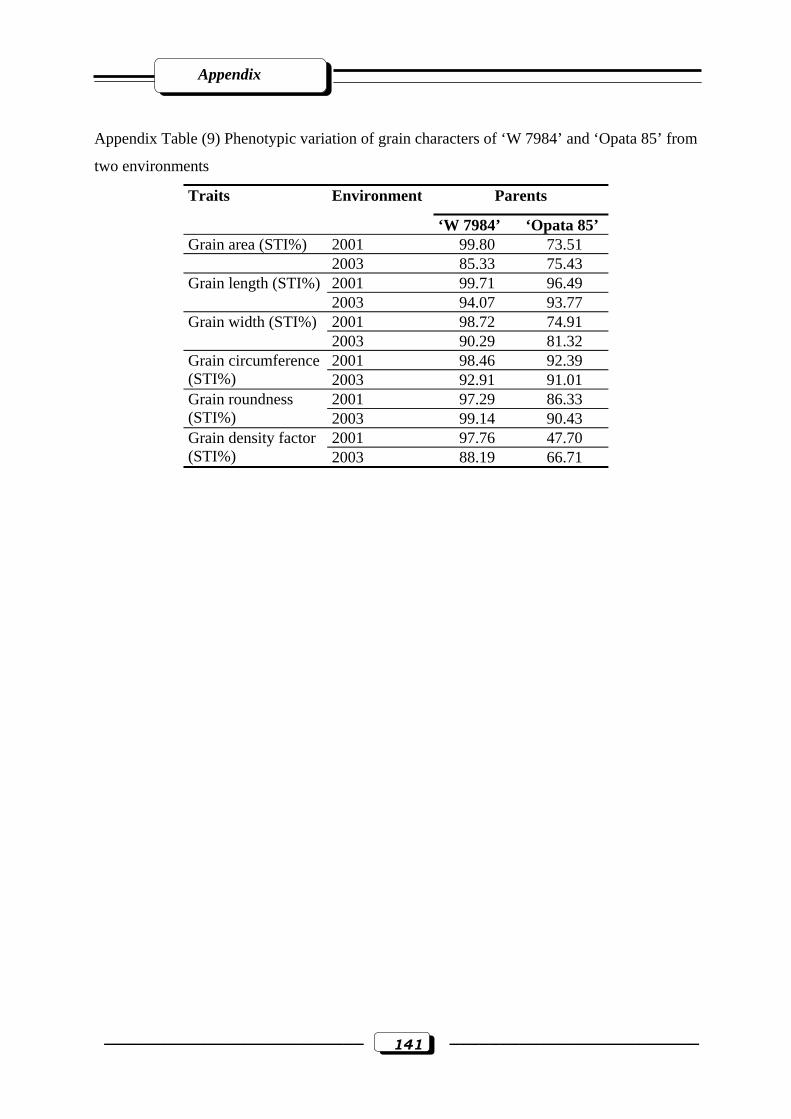
Appendix
–––––––––––––––––––––––––– 141 –––––––––––––––––––––––––
Appendix Table (9) Phenotypic variation of grain characters of ‘W 7984’ and ‘Opata 85’ from
two environments
Parents Traits Environment
‘W 7984’ ‘Opata 85’ Grain area (STI%) 2001 99.80 73.51 2003 85.33 75.43
2001 99.71 96.49 Grain length (STI%) 2003 94.07 93.77 2001 98.72 74.91 Grain width (STI%) 2003 90.29 81.32 2001 98.46 92.39 Grain circumference
(STI%) 2003 92.91 91.01 2001 97.29 86.33 Grain roundness
(STI%) 2003 99.14 90.43 2001 97.76 47.70 Grain density factor
(STI%) 2003 88.19 66.71

Appendix
142
Appendix Table (10): Putative QTLs detected for stem reserve mobilization in wheat RILs population of the cross ‘W 7984’ x ‘Opata 85’
Gatersleben Field Trait QTL symbol
Marker Chromosome2001 2003
LODa %PVb
Additived Source
QSrm.ipk-1A Xgwm357 1A **- c ns 1.52 11.21 -6.24 Opata 85 QSrm.ipk-1B Xmwg938b 1B **- ns 2.19 10.17 -5.89 Opata 85 QSrm.ipk-2D Xgwm249a 2D *+ ***+ 3.10 42.22 6.94 W 7984 QSrm.ipk-5B Xgwm639c 5B **+ ns 1.61 11.13 6.36 W 7984 QSrm.ipk-5D Xfbb238b 5D *+ **+ 2.45 37.54 6.17 W 7984 QSrm.ipk-6A Xgwm494 6A ns **- 1.79 15.51 -3.87 Opata 85 QSrm.ipk-7B Xgwm302 7B ns ***- 3.15 24.75 -4.62 Opata 85
1000-grain weight STI% (Srm)
QSrm.ipk-7D Xfbb189b 7D ***+ *+ 2.77 21.01 8.18 W 7984 Significance levels: * P<0.1; ** P<0.01; *** P<0.001; **** P<0.0001 aLOD score from the year with underlined P-value b % PV is the proportion of the phenotypic variance explained by the QTL after accounting for co-factors c Underlined P-value indicates year for which LOD, % PV and additive were calculated d +/- Additive effects indicate an additive main effect of the parent contributing the higher value allele: positive values indicate that higher value alleles are from ‘W 7984’ and the negative values indicate that higher value alleles are from ‘Opata 85’
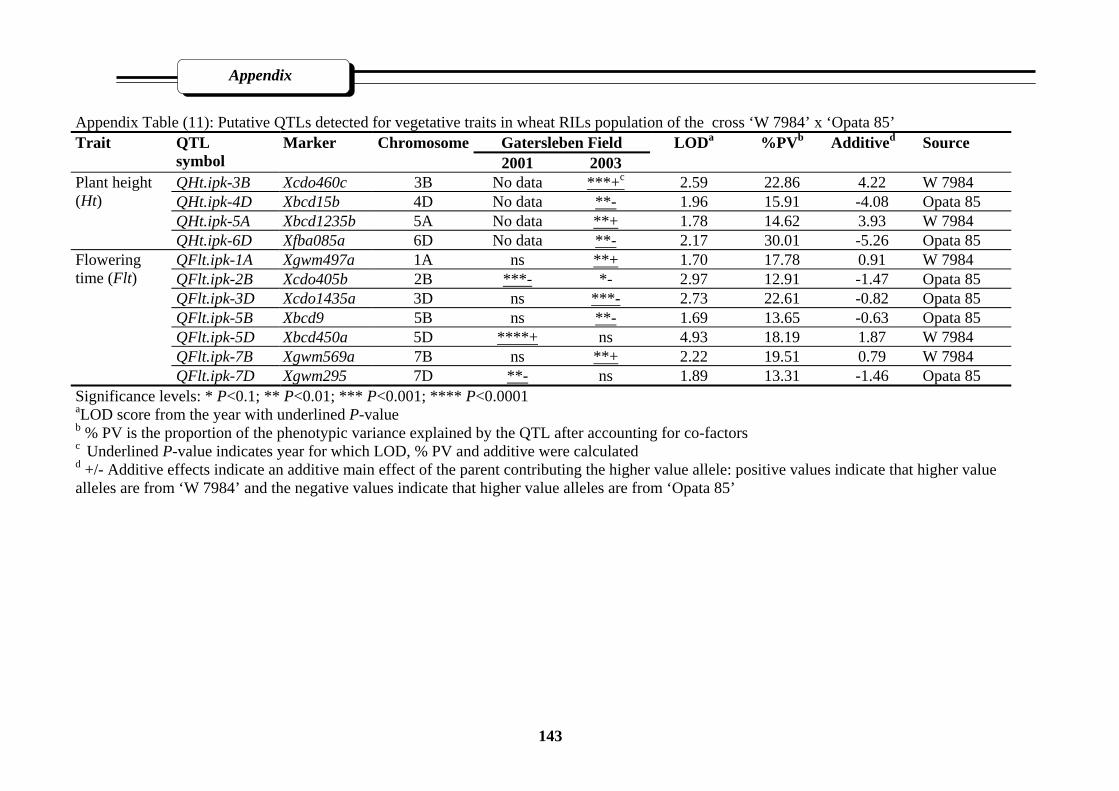
Appendix
143
Appendix Table (11): Putative QTLs detected for vegetative traits in wheat RILs population of the cross ‘W 7984’ x ‘Opata 85’
Gatersleben Field Trait QTL symbol
Marker Chromosome2001 2003
LODa %PVb
Additived Source
QHt.ipk-3B Xcdo460c 3B No data ***+c 2.59 22.86 4.22 W 7984 QHt.ipk-4D Xbcd15b 4D No data **- 1.96 15.91 -4.08 Opata 85 QHt.ipk-5A Xbcd1235b 5A No data **+ 1.78 14.62 3.93 W 7984
Plant height (Ht)
QHt.ipk-6D Xfba085a 6D No data **- 2.17 30.01 -5.26 Opata 85 QFlt.ipk-1A Xgwm497a 1A ns **+ 1.70 17.78 0.91 W 7984 QFlt.ipk-2B Xcdo405b 2B ***- *- 2.97 12.91 -1.47 Opata 85 QFlt.ipk-3D Xcdo1435a 3D ns ***- 2.73 22.61 -0.82 Opata 85 QFlt.ipk-5B Xbcd9 5B ns **- 1.69 13.65 -0.63 Opata 85 QFlt.ipk-5D Xbcd450a 5D ****+ ns 4.93 18.19 1.87 W 7984 QFlt.ipk-7B Xgwm569a 7B ns **+ 2.22 19.51 0.79 W 7984
Flowering time (Flt)
QFlt.ipk-7D Xgwm295 7D **- ns 1.89 13.31 -1.46 Opata 85 Significance levels: * P<0.1; ** P<0.01; *** P<0.001; **** P<0.0001 aLOD score from the year with underlined P-value b % PV is the proportion of the phenotypic variance explained by the QTL after accounting for co-factors c Underlined P-value indicates year for which LOD, % PV and additive were calculated d +/- Additive effects indicate an additive main effect of the parent contributing the higher value allele: positive values indicate that higher value alleles are from ‘W 7984’ and the negative values indicate that higher value alleles are from ‘Opata 85’

Appendix
144
Appendix Table (12): Putative QTLs detected for grain area, grain width and grain length in wheat RILs population of the cross ‘W 7984’ x ‘Opata 85’.
Gatersleben Field Trait QTL symbol
Marker Chromosome2001 2003
LODa %PVb
Additived Source
QGae.ipk-1A Xgwm357 1A **-c ns 1.80 13.29 -3.13 Opata 85 QGae.ipk-1B Xmwg938b 1B **- ns 1.94 9.06 -2.59 Opata 85 QGae.ipk-2D Xbcd260a 2D **+ *+ 1.90 7.57 2.31 W 7984 QGae.ipk-4D Xbcd15b 4D ns **+ 1.54 13.00 1.34 W 7984 QGae.ipk-6B Xrz995 6B ns **- 1.93 19.04 -1.62 Opata 85
Grain area STI% (Gae)
QGae.ipk-7D Xgwm1052b 7D **+ ns 1.72 11.00 3.06 W 7984 QGwd.ipk-1B Xmwg938b 1B **- ns 2.07 9.64 -2.22 Opata 85 QGwd.ipk-1D Xcdo89a 1D ns **- 2.17 17.48 -2.19 Opata 85 QGwd.ipk-3D Xgdm8 3D **+ ns 1.68 11.75 2.57 W 7984 QGwd.ipk-5A Xgwm156 5A **- ns 1.59 11.66 -2.86 Opata 85 QGwd.ipk-5B Xgwm639c 5B **+ ns 1.73 12.08 2.63 W 7984 QGwd.ipk-5D Xbcd450a 5D **+ ns 1.52 6.15 1.83 W 7984 QGwd.ipk-6D Xksug48a 6D ns **+ 1.85 15.39 1.94 W 7984
Grain width STI% (Gwd)
QGwd.ipk-7D Xgwm37 7D **+ ns 2.40 13.70 2.65 W 7984 QGlt.ipk-2D Xbcd260a 2D ***+ ns 2.61 10.27 1.04 W 7984 QGlt.ipk-3D Xcdo549 3D **- ns 1.60 6.46 -0.82 Opata 85 QGlt.ipk-4D Xmwg634a 4D **+ ns 1.50 6.35 0.83 W 7984 QGlt.ipk-5A Xbcd1871b 5A **- ns 1.97 7.85 -0.91 Opata 85 QGlt.ipk-7A Xfba127a 7A **+ ns 1.82 14.16 1.23 W 7984
Grain length STI% (Glt)
QGlt.ipk-7D Xgdm46 7D ***+ ns 2.78 17.37 1.42 W 7984 Significance levels: * P<0.1; ** P<0.01; *** P<0.001; **** P<0.0001 aLOD score from the year with underlined P-value b % PV is the proportion of the phenotypic variance explained by the QTL after accounting for co-factors c Underlined P-value indicates year for which LOD, % PV and additive were calculated d +/- Additive effects indicate an additive main effect of the parent contributing the higher value allele: positive values indicate that higher value alleles are from ‘W 7984’ and the negative values indicate that higher value alleles are from ‘Opata 85’
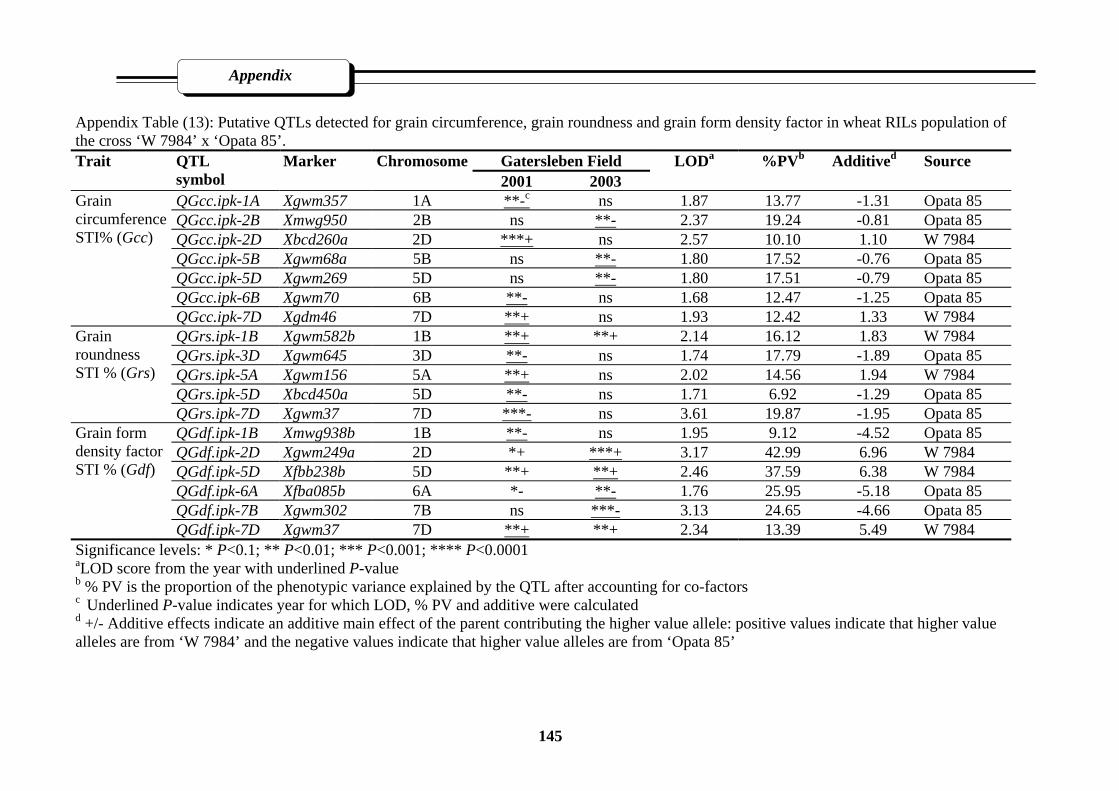
Appendix
145
Appendix Table (13): Putative QTLs detected for grain circumference, grain roundness and grain form density factor in wheat RILs population of the cross ‘W 7984’ x ‘Opata 85’.
Gatersleben Field Trait QTL symbol
Marker Chromosome2001 2003
LODa %PVb
Additived Source
QGcc.ipk-1A Xgwm357 1A **-c ns 1.87 13.77 -1.31 Opata 85 QGcc.ipk-2B Xmwg950 2B ns **- 2.37 19.24 -0.81 Opata 85 QGcc.ipk-2D Xbcd260a 2D ***+ ns 2.57 10.10 1.10 W 7984 QGcc.ipk-5B Xgwm68a 5B ns **- 1.80 17.52 -0.76 Opata 85 QGcc.ipk-5D Xgwm269 5D ns **- 1.80 17.51 -0.79 Opata 85 QGcc.ipk-6B Xgwm70 6B **- ns 1.68 12.47 -1.25 Opata 85
Grain circumference STI% (Gcc)
QGcc.ipk-7D Xgdm46 7D **+ ns 1.93 12.42 1.33 W 7984 QGrs.ipk-1B Xgwm582b 1B **+ **+ 2.14 16.12 1.83 W 7984 QGrs.ipk-3D Xgwm645 3D **- ns 1.74 17.79 -1.89 Opata 85 QGrs.ipk-5A Xgwm156 5A **+ ns 2.02 14.56 1.94 W 7984 QGrs.ipk-5D Xbcd450a 5D **- ns 1.71 6.92 -1.29 Opata 85
Grain roundness STI % (Grs)
QGrs.ipk-7D Xgwm37 7D ***- ns 3.61 19.87 -1.95 Opata 85 QGdf.ipk-1B Xmwg938b 1B **- ns 1.95 9.12 -4.52 Opata 85 QGdf.ipk-2D Xgwm249a 2D *+ ***+ 3.17 42.99 6.96 W 7984 QGdf.ipk-5D Xfbb238b 5D **+ **+ 2.46 37.59 6.38 W 7984 QGdf.ipk-6A Xfba085b 6A *- **- 1.76 25.95 -5.18 Opata 85 QGdf.ipk-7B Xgwm302 7B ns ***- 3.13 24.65 -4.66 Opata 85
Grain form density factor STI % (Gdf)
QGdf.ipk-7D Xgwm37 7D **+ **+ 2.34 13.39 5.49 W 7984 Significance levels: * P<0.1; ** P<0.01; *** P<0.001; **** P<0.0001 aLOD score from the year with underlined P-value b % PV is the proportion of the phenotypic variance explained by the QTL after accounting for co-factors c Underlined P-value indicates year for which LOD, % PV and additive were calculated d +/- Additive effects indicate an additive main effect of the parent contributing the higher value allele: positive values indicate that higher value alleles are from ‘W 7984’ and the negative values indicate that higher value alleles are from ‘Opata 85’

Appendix
–––––––––––––––––––––––––– 146 –––––––––––––––––––––––––
Appendix Figure (1): Electropherograms analysed using Fragment Analyser software version
1.02, of polymorphic microsatellite markers in two parental lines (‘ATRI 5283’ x ‘ATRI 15010’)
and F2 offspring, amplified with the SSR marker locus gwm429. The fragments were assigned to
the short arm of chromosome 2BS. The peaks represent fragments of different alleles, whereas
the horizontal scale indicates fragment sizes in base pairs calculated from internal standards (73
bp and 231 bp)
Bases80 90 100 110 120 130 140 150 160 170 180 190 200 210 220 230 240 250 260 270 280 290 300 310
73122
196 2311
External standard
73
201
231 2862
73
197
231
282
3
73
197
231
282
4
73
197201
231282286
5
73
197201
231
282286
6
73
197
231
282
7
73
197201
231
282286
8
73
197201
231 282286 9
73
197
231 282 10
Scoring Data
F2 offspring: B allele
ATRI 15010: B allele
ATRI 5283: A allele Internal standard
F2 offspring: heterozygote or (H) allele
F2 offspring: heterozygote or (H) allele
F2 offspring: B allele
F2 offspring: heterozygote or (H) allele
F2 offspring: heterozygote or (H) allele
F2 offspring: B allele

ACKNOLWEDGEMENTS
ACKNOLWEDGEMENTS
I am grateful for the support and help I received during my Ph. D. work at Institut für
Pflanzengenetik und Kulturpflanzenforschung (IPK), Gatersleben, Germany.
I wish to express my deep grateful, sincere gratitude and sincere appreciation to my
supervisor Priv. Doz. Dr. habil. Andreas Börner, Head of Resources Genetics and Reproduction
Group (RGR), Genebank, IPK, Gatersleben, for his support, scientific advice and sincere co-
operation during this work as well as I thank him for excellent suggestions, correction, criticism
during write-up, critical review of the manuscript and fruitful discussion, especially for his great
support during my stay in Germany. Also, I would be grateful to Dr. A. Börner for his
introduction in this fascinating area of molecular plant breeding research.
I would like to express my sincere gratitude to Prof. Dr. rer. hort. habil. W. E. Weber,
Head of Institute of Plant Protection and Plant Breeding, Faculty of Agriculture, Martin-Luther-
Universität Halle-Wittenberg for accepting to be my supervisor and referee.
I am very grateful to Mrs. Dr. Marion Röder, Head of Gene and Genome Mapping Group,
IPK, Gatersleben, Germany for allowing me to carry out PCR experiments in her laboratory,
primers supply, check my map data, valuable support and sincere co-operation during this work.
Many thanks to Dr. S. Chebotar, Dr. E. Khlestkina and Dr. X. Huang, for their advice and
valuable tips in PCR techniques, scoring data and showing me how to start for map construction
and QTL mapping analysis.
My thanks go to Mrs. Renate Voss, Mrs. Gudrun Schütze, Mrs. Anette Heber, Mrs. Heike
Ballhausen, Mr. Michael Grau, Mrs. Marina Schäfer, Mrs. Steffi Winter, Mrs. Irma Friese, Mrs.
Annette Marlow, Mr. Peter Schreiber and Mr. Rolf Zetsche for their excellent technical
assistance.
I deeply express thanks to my father Prof. Dr. Fathy Mahmoud Salem, Prof. of
Nematology and former Head of Plant Protection Department, Faculty of Agriculture, Menoufia
University, Egypt for his encouragement, scientific advice, support during my post-graduate study
and for all efforts that he had made for my carrier.
I express my deep thanks and affection to my wife Fatma Ebid and the children (Jasmine,
Ahmed and Mahmoud) for their great support in many ways during the stay in Germany.
Finally, I thank the Egyptian Government and the Genetic Engineering and Biotechnology
Research Institute (GEBRI), Menoufia University, Egypt for my financial support during the
language course and the years of my study in Germany.
Erklärung
ERKLÄRUNG
Hiermit erkläre ich, dass mit dieser wissenschaftlichen Arbeit noch keine vergeblichen
Promotionsversuche unternommen wurden.
Die eingereichte Dissertation mit dem Thema: ‘The Inheritance and Molecular Mapping of
Genes for Post-anthesis Drought Tolerance (PADT) in Wheat’ habe ich selbständig und nur
unter Verwendung der angegeben Literatur und Hilfsmittel angefertigt.
Des weiteren erkläre ich, dass keine Strafverfahren gegen mich anhängig sind.
Datum: Unterschrift:
Halle/Saale, den 23. 06. 2004
Khaled F. M. S. Farag
Publikationen
PUBLIKATIONEN AUS DER ARBEIT
Teile dieser Arbeit sind in folgenden Veröffentlichungen enthalten
1. Börner, A.; U. Freytag; U. Sperling; K. F. M. Salem and E. K. Khlestkina. (2002). Sixty years disease resistance screening/ Stem reserve mobilization/ Geographical distribution of red coleoptile color genes. Ann. Wheat Newsletter 48: 58-65.
2. Börner, A.; A. Balint; K. F. M. Salem; E. Pestsova; M. S. Röder and E. K. Khlestkina.
(2003). Copper tolerance/ Stem reserve mobilization/ Genetic diversity of Siberian wheat varieties/ Development of wheat-Aegilops tauschii introgression lines. Ann. Wheat Newsletter 49: 28-30.
3. Salem K. F. M. and A. Börner. (2003). Evaluation of wheat accessions from Gatersleben
Genebank for post-anthesis drought tolerance in field. In: Gesellschaft für Pflanzenzüchtung, GPZ-Tagung, Vortragsveranstaltung zum Thema: “Abiotischer Streß – Herausforderung für die Pflanzenzüchtung’’, 11-12 Juni 2003, Groß Lüsewitz, Germany.
4. Salem K. F. M.; Marion Röder and A. Börner. (2003). Mapping of quantitative trait loci
(QTLs) for post-anthesis drought tolerance in bread wheat (Triticum aestivum L.). (2003). In: Gesellschaft für Pflanzenzüchtung, GPZ-Tagung, 11. Vortragsveranstaltung “Harnessing Genetic Diversity: Genomics and Allele Mining’’., 16-17.09.2003, Institut für Pflanzengenetik und Kulturpflanzenforschung (IPK), Gatersleben, Germany.
5. Börner, A.; A. Balint; K. F. M. Salem; U. Lohwasser; A. Weidner; M. S. Röder and E. K.
Khlestkina. (2004). Salt Tolerance/ Post-Anthesis Drought Tolerance/ Copper Tolerance/ Pre-Harvest Sprouting Dormancy/ Genetic diversity/ Mapping Wheat Microsatellite Markers In Rye. Ann. Wheat Newsletter (in press).
6. Salem K. F. M.; Marion Röder and A. Börner. (2004). Molecular mapping of quantitative
trait loci (QTLs) determining post-anthesis drought tolerance in hexaploid wheat (Triticum aestivum L.). In: 7 Gesellschaft für Pflanzenzüchtung, GPZ-Tagung, Vortragsveranstaltung zum Thema: “ Klimatische und edaphische Sortenanpassung und Züchtung für Nachwachsende Rohstoffe’’. 3-5 March 2004, Halle/Saale, Germany. Vort Pflanzenzüchtung 64: 21-24.
7. Salem K. F. M. and A. Börner. (2004). Post-anthesis drought tolerance in genus Triticum.
In: Botanikertagung, 5-10 September 2004, Braunschweig, Germany.
Curriculum Vitae
CURRICULUM VITAE
Personal Data Name: Khaled Fathy Mahmoud Salem Farag.
Date of birth: 15/07/1971.
Place of birth: Shebin El-Kom, El-Menoufia, Egypt.
Parent Father: Prof. Dr. Fathy Mahmoud Salem Farag.
Family status: Married and have 1 girl, Jasmine and 2 boys, Ahmed and Mahmoud.
Education
1978-1983: Primary school, Shebin El-Kom, El-Menoufia, Egypt.
1984-1986: Preparatory school, Shebin El-Kom, El-Menoufia, Egypt.
1987-1989: El-Massay secondary school, Shebin El-Kom, El-Menoufia, Egypt.
Higher Education
1990-1993: Student at the Faculty of Agriculture, Shebin El-Kom, Menoufia
University, Egypt.
1993: B. Sc. Agronomy, with final general grade ‘excellent with a grade of
honour’, Agronomy Department, Faculty of Agriculture, Shebin El-Kom,
Menoufia University, Egypt.
1994-1998: M. Sc. in Agronomy, Agronomy Department, Faculty of Agriculture,
Shebin El-Kom, Menoufia University, Egypt.
M. Sc. Thesis title: Breeding Studies On Rice (Oryza sativa L.).
1999: Biotechnology And Genetic Engineering In Industrial Fungi And Higher
Plants, 8-18 May 1999, Training course, Alexandria University, Egypt.
January-Juni 2000: Goethe -Institute, Cairo, Egypt.
January-May 2001: Goethe -Institute, Göttingen, Germany.
2001-2004: Ph. D. student, Genebank Department, Institute of Plant Genetics and Crop
Plant Research (IPK), Gatersleben, Germany.
Employment experiences
1994-1998: Research assistance, Rice Research and Training Center (RRTC), Field
Crops Institute, Agricultural Research Center (ARC), Giza, Egypt.
1998: Demonstrator, Genetic Engineering and Biotechnology Research Institute,
Menoufia University, Egypt.
1999-present: Assistant lecturer, Genetic Engineering and Biotechnology Research
Institute (GEBRI), Menoufia University, Egypt.