2 materials and methods - uni-halle.de · 2 materials and methods 12 2 materials and methods 2.1...
TRANSCRIPT
2 Materials and Methods 12
2 Materials and Methods
2.1 Materials
Acetonitrile (ultra gradient, HPLC grade) J. T. Baker, Deventer, Netherlands
Ammonium carbonate (analytical-reagent grade) Fluka, Neu-Ulm, Germany
Ammonium hydroxide (25% (v/v), picograde) VWR, Darmstadt, Germany
Dichloromethane (analytical-reagent grade) VWR, Darmstadt, Germany
N, N-Dimethyloctylamine (purum ≥ 96%) Fluka, Neu-Ulm, Germany
Disodium hydrogenphosphate dehydrate (picograde) VWR, Darmstadt, Germany
Acetic acid (glacial) VWR, Darmstadt, Germany
Glucuronidase reagent from E.coli, 140 units/mg Roche, Mannheim, Germany
Hexane (picograde) Promochem, Wesel, Germany
Hydrochloric acid (26% (v/v), analytical-reagent grade) VWR, Darmstadt, Germany
Methanol (analytical-reagent grade) VWR, Darmstadt, Germany
5-(p-Methylphenyl)-5-phenylhydantoin (MPPH) VWR, Darmstadt, Germany
Neostigmine bromide Promochem, Wesel, Germany
Phosphoric acid (85% (v/v), analytical-reagent grade) VWR, Darmstadt, Germany
Potassium dihydrogenphosphate (picograde) VWR, Darmstadt, Germany
Potassium hydroxide (picograde) VWR, Darmstadt, Germany
Potassium tetraborate tetrahydrate (analytical-reagent grade) Fluka, Neu-Ulm, Germany
Reference standards and solutions Promochem, Wesel, Germany
Tetramethylammonium chloride (picograde) Fluka, Neu-Ulm, Germany
Tris-(hydroxymethylene)-amino-methane (tris-buffer) VWR, Darmstadt, Germany
Water (osmosis purification) MembraPure, Bodenheim,
Germany
2.1.1 Buffer and Solutions
Borate buffer pH 8
Borate solution A:
Potassium tetraborate tetrahydrate 19.1 g
Water ad 1000.0 mL
Borate solution A 55.9 mL
0.1 N HCl 44.1 mL

2 Materials and Methods 13
0.05 M Phosphate buffer pH 2.3
Potassium dihydrogenphosphate 5 6.7 g
Water ad 1000.0 mL
(pH adjustment with phosphoric acid to pH 2.3)
0.1 M Phosphate buffer pH 6
Potassium dihydrogenphosphate 13.6 g
Water ad 1000.0 mL
(pH adjustment with 1.0 M potassium hydroxide to pH 6)
0.01 M Phosphate buffer pH 6 (loading buffer)
0.1 M Phosphate buffer pH 6 100.0 mL
Water ad 1000.0 mL
Phosphate buffer pH 7
Potassium dihydrogenphosphate 6.8 g
Disodium hydrogenphosphate 11.2 g
Water ad 1000.0 mL
(pH adjustment with 1.0 M potassium hydroxide to pH 7)
0.2 M Tris-buffer pH 9.1
Tris-(hydroxymethylene)-aminomethane 12.1 g
Water ad 0500.0 mL
(pH adjustment with 0.1 M hydrochloric acid to pH 9.1)
Ammonium carbonate buffer pH 10
Ammonium carbonate 5 4.8 g
Water ad 1000.0 mL
(pH adjustment with 25% ammonium hydroxide to pH 10)
Mobile phase 1 (screening method for basic compounds)
0.05 M Phosphate buffer pH 2.3 ad 0685.0 mL
Acetonitrile/water (90/10, v/v) ad 0315.0 mL
Mobile phase 2 (screening method for plasma)
0.05 M Phosphate buffer pH 2.3 ad 0640.0 mL
Acetonitrile/water (90/10, v/v) ad 0360.0 mL

2 Materials and Methods 14
Mobile phase 1 with amine modifiers
N,N-Dimethyloctylamine 30.2 mg
Tetramethylammonium chloride 30.5 mg
Mobile phase 1 ad 100.0 mL
1.0 M Acetic acid
Acetic acid (glacial) 5 5.8 mL
Water ad 100.0 mL
0.01 M Acetic acid
Acetic acid (glacial) 58.0 µL
Water ad 100.0 mL
0.1 M Hydrochloric acid
Hydrochloric acid (26% (v/v)) 12.5 mL
Water ad 1000.0 mL
1.0 M Potassium hydroxide
Potassium hydroxide 5.6 g
Water ad 100.0 mL
Following preparation, all buffers and solutions were filtrated (membrane filter, cellulose acetate,
pore diameter 0.22 µm).
Stock solutions
Stock solutions were prepared by diluting commercial methanol reference standard solutions of the
compounds to 1 µg/mL and 0.1 µg/mL with mobile phase 1 (direct injection) or 0.01 M phosphate
buffer pH 6 (on-line extraction).
Performance control sample screening method for basic compounds in urine
A performance control sample (PCS) stock solution was prepared by diluting commercial methanol
reference standard solutions of codeine, the methadone metabolite 2-ethyliden-1,5-dimethyl-3,3-
diphenylpyrrolidene (EDDP), 3,4-methylene-dioxy-amphetamine (MDA), morphine, scopolamine
(each 1 mg/mL) to 1 µg/mL and the I.S. neostigmine bromide to 5 µg/mL with 0.01 M phosphate
buffer pH 6 (PCS 1) and with a mixture of urine and 0.01 M phosphate buffer pH 6 (2/1, v/v) (PCS
2), respectively. The PCS 1 and 2 were stored frozen (-18 ± 3 °C) in aliquots of 1.5 mL.
2 Materials and Methods 15
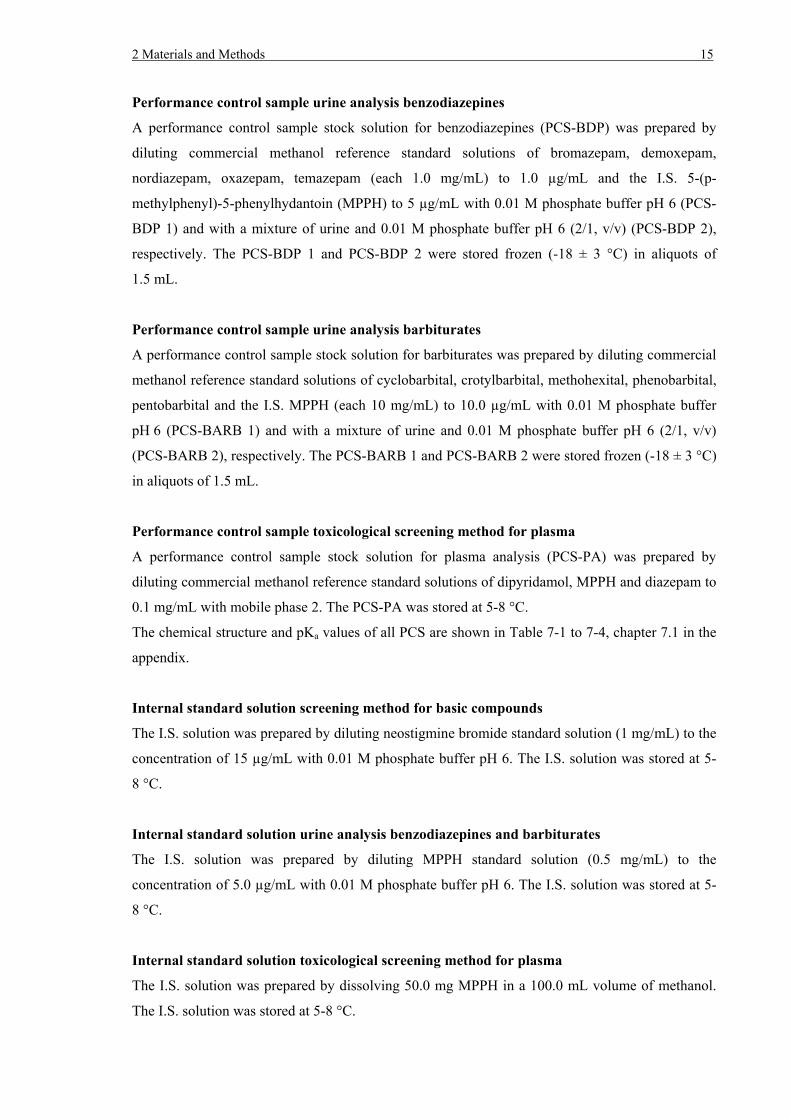
Performance control sample urine analysis benzodiazepines
A performance control sample stock solution for benzodiazepines (PCS-BDP) was prepared by
diluting commercial methanol reference standard solutions of bromazepam, demoxepam,
nordiazepam, oxazepam, temazepam (each 1.0 mg/mL) to 1.0 µg/mL and the I.S. 5-(p-
methylphenyl)-5-phenylhydantoin (MPPH) to 5 µg/mL with 0.01 M phosphate buffer pH 6 (PCS-
BDP 1) and with a mixture of urine and 0.01 M phosphate buffer pH 6 (2/1, v/v) (PCS-BDP 2),
respectively. The PCS-BDP 1 and PCS-BDP 2 were stored frozen (-18 ± 3 °C) in aliquots of
1.5 mL.
Performance control sample urine analysis barbiturates
A performance control sample stock solution for barbiturates was prepared by diluting commercial
methanol reference standard solutions of cyclobarbital, crotylbarbital, methohexital, phenobarbital,
pentobarbital and the I.S. MPPH (each 10 mg/mL) to 10.0 µg/mL with 0.01 M phosphate buffer
pH 6 (PCS-BARB 1) and with a mixture of urine and 0.01 M phosphate buffer pH 6 (2/1, v/v)
(PCS-BARB 2), respectively. The PCS-BARB 1 and PCS-BARB 2 were stored frozen (-18 ± 3 °C)
in aliquots of 1.5 mL.
Performance control sample toxicological screening method for plasma
A performance control sample stock solution for plasma analysis (PCS-PA) was prepared by
diluting commercial methanol reference standard solutions of dipyridamol, MPPH and diazepam to
0.1 mg/mL with mobile phase 2. The PCS-PA was stored at 5-8 °C.
The chemical structure and pKa values of all PCS are shown in Table 7-1 to 7-4, chapter 7.1 in the
appendix.
Internal standard solution screening method for basic compounds
The I.S. solution was prepared by diluting neostigmine bromide standard solution (1 mg/mL) to the
concentration of 15 µg/mL with 0.01 M phosphate buffer pH 6. The I.S. solution was stored at 5-
8 °C.
Internal standard solution urine analysis benzodiazepines and barbiturates
The I.S. solution was prepared by diluting MPPH standard solution (0.5 mg/mL) to the
concentration of 5.0 µg/mL with 0.01 M phosphate buffer pH 6. The I.S. solution was stored at 5-
8 °C.
Internal standard solution toxicological screening method for plasma
The I.S. solution was prepared by dissolving 50.0 mg MPPH in a 100.0 mL volume of methanol.
The I.S. solution was stored at 5-8 °C.

2 Materials and Methods 16
Extraction solution plasma analysis
The extraction solution for LLE of plasma samples was prepared by diluting
0.5 mL MPPH I.S. solution (plasma analysis) to the concentration of 2.5 µg/mL with
dichloromethane. The I.S. solution was stored at 5-8 °C.
2.1.2 Consumables
Eppendorf cups, 1.5 mL and 2.0 mL Eppendorf, Hamburg, Germany
Membrane filter (0.22 µm, cellulose acetate) Millipore, Eschborn, Germany
Monovettes Sarstedt, Nümbrecht, Germany
Peek capillary 1/16`` AD x 0.13 mm Chromatographie Service, Langerwehe,
Germany
Peek capillary 1/16`` AD x 0.25 mm Chromatographie Service, Langerwehe,
Germany
Pipette tips Eppendorf, Hamburg, Germany
Screw-Top vial, 2 mL XL Laubscher LABS, Rixheim, France
Screw cap, XL Laubscher LABS, Rixheim, France
Vial inlays Kunz & Müller, Berlin, Germany
Urine sampling cups Lamprecht, Berlin, Germany
2.1.3 Equipment
Centrifuge 5415D Eppendorf, Hamburg, Germany
IKA® Vortex Genius 3 IKA, Staufen, Germany
Turbo Vap® LV Evaporator Zymark, Idstein, Germany
Syva Micro Trak® EIA Dry-bath Dade Behring, Schwalbach, Germany
Eppendorf MixMate Eppendorf, Hamburg, Germany
Pipettes Eppendorf, Hamburg, Germany
Dispenser piccolo, 500 µL Vitlab, Grossostheim, Germany
HPLC-DAD System Shimadzu, Duisburg, Germany
Ternary pump system (LC-10 ADVP)
Gradient unit (FCV-10 ALVP)
Solvent degasser (DGU-14 A)
Auto sampler (SIL-10 AF)
Sample loop (2 mL)
Option box VP

2 Materials and Methods 17
High pressure valves (FCV-12 AH)
Oven (CTO-10 ACVP)
Column switching valves (FCV-14 AH)
DAD system (SPD-M10 AVP)
System controller (SCL-10 AVP)
Shimadzu LC SolutionTM software 1.21
UV spectra of toxic compounds [22]
Rheodyne two-position valve, 6-port Techlab GmbH, Erkerode, Germany
Computer and monitor Acer, Ahrensberg, Germany
RemediTM-HS including reagents and columns Bio-Rad, Munich, Germany
Olympus AU 640 Olympus Deutschland GmbH, Hamburg,
Germany
CEDIA DAU® reagents and immunoassays Microgenics, Passau, Germany, part of
Fisher Scientific, Schwerte, Germany
Analytical columns (length x diameter, particle size)
Ionosphere™ (250 x 4.6 mm, 5 µm) Varian, Darmstadt, Germany
Luna C8™ (30 x 3.0 mm, 5 µm) Phenomenex, Aschaffenburg, Germany
Luna C18™ (30 x 3.0 mm, 5 µm) Phenomenex, Aschaffenburg, Germany
Luna Polar™ (30 x 3.0 mm, 5 µm) Phenomenex, Aschaffenburg, Germany
LunaSCXTM (150 x 4.6 mm, 5 µm) Phenomenex, Aschaffenburg, Germany
LunaSCXTM (250 x 4.6 mm, 5 µm) Phenomenex, Aschaffenburg, Germany
Metasil™ (250 x 4.6 mm, 5 µm) Varian, Darmstadt, Germany
NucleosilTM 100 C8 (200 x 4.0 mm, 5 µm) VDS Optilab, Berlin, Germany
NucleosilTM 100 C8 (50 x 4.0 mm, 5 µm) VDS Optilab, Berlin, Germany
Synergy 4 µ Hydro RPTM (250 x 4.6 mm, 4 µm) Phenomenex, Aschaffenburg, Germany
Synergy 4 µ Polar- RP™ (250 x 4.6 mm, 4 µm) Phenomenex, Aschaffenburg, Germany
Extraction columns (length x diameter, particle size)
Bond Elut CBATM (20 x 2.1 mm, 40/120 µm) Varian, Darmstadt, Germany
NexusTM (20 x 2.1 mm, 70 µm) Varian, Darmstadt, Germany
Oasis HLBTM (15 x 2.0 mm, 25 µm) Waters, Eschborn, Germany
Oasis MCXTM (15 x 2.0 mm, 30 µm) Waters, Eschborn, Germany
StrataXTM (20 x 2.0 mm, 35 µm) Phenomenex, Aschaffenburg, Germany
StrataX-CTM (20 x 2.0 mm, 35 µm) Phenomenex, Aschaffenburg, Germany
StrataX-CWTM (20 x 2.0 mm, 35 µm) Phenomenex, Aschaffenburg, Germany

2 Materials and Methods 18
Pre-(guard)cartridges (length x diameter, particle size)
Security guard cartridge C8 (4.0 x 2.0 mm, 5 µm) Phenomenex, Aschaffenburg, Germany
Security guard cartridge C18 (4.0 x 2.0 mm, 5 µm) Phenomenex, Aschaffenburg, Germany
Security guard cartridge C18 wide pore (4.0 x 2.0 mm, Phenomenex, Aschaffenburg, Germany
5 µm, pore size 300Å)
Security guard cartridge NH2 (4.0 x 2.0 mm, 5 µm) Phenomenex, Aschaffenburg, Germany
Security guard cartridge SCX (4.0 x 3.0 mm, 5 µm) Phenomenex, Aschaffenburg, Germany
2.1.4 Samples and Sample Preparation
Biological samples
Biological samples sent to the Institute of Toxicology–Clinical Toxicology and Poison Control
Centre Berlin from hospital emergency rooms, psychiatric units and substance abuse clinics, were
used.
Urine samples
The urine samples were centrifuged for 5 min at 15 000 x g in monovettes and 1.0 mL of the
supernatant was transferred to a 2.0-mL polypropylene cup, diluted with 500 µL I.S. solution,
vortexed and centrifuged again for 5 min at 15 000 x g. The samples were placed into the auto
sampler. The injection volume was 1.0 mL.
Performance control sample urine analysis
A total of 1.5 mL of the PCS 1 or PCS 2 was transferred into a 2.0-mL polypropylene cup,
centrifuged at 15 000 x g for 5 min and placed into the auto sampler. The injection volume was
1.0 mL.
Glucuronide hydrolysis
A 1.0-mL volume of urine was adjusted to pH 6 with phosphate buffer, when necessary, before
0.1 mL of glucuronidase reagent was added. Hydrolysis was carried out at 45° C for 1.5 h
following the method of Grieshaber et al. [85]. The hydrolysed sample was centrifuged for 5 min at
15 000 x g and 1.0 mL was transferred to a new 2.0-mL polypropylene cup, diluted with 500 µL
I.S. solution, vortexed and centrifuged again for 5 min at 15 000 x g.
Plasma samples
A total of 0.5 mL plasma/serum, 0.1 mL tris-buffer (pH 9.1) and 0.4 mL extraction solution were
mixed in a 1.5-mL polypropylene cup for 2 min. The sample was centrifuged for 2 min at
15 000 x g and 0.2 mL of the organic phase was transferred to a second 1.5-mL polypropylene cup

2 Materials and Methods 19
and evaporated to dryness under a stream of nitrogen at 40 ± 3 °C. The residue was redissolved in
100.0 µL mobile phase 2 and vortexed for 15 s. The sample was placed into the auto sampler. The
injection volume was 50 µL.
Performance control sample plasma analysis
A total of 0.1 mL of the PCS-PA was transferred into a vial inlay and the vial was placed into the
auto sampler. The injection volume was 50 µL.
2.2 Screening Method for Basic Compounds in Urine
2.2.1 Circuit Diagram
Prior to the method development, the HPLC-DAD equipment was set-up and a circuit diagram was
designed in order to direct various liquids through the extraction and analytical columns. The
system set-up followed the aim to keep the dead time as low as possible; the circuit diagram had to
fulfil six major demands:
1. Option to forward and back flush the extraction column
2. Option to elute undesired fractions or interferences to waste
3. Elution of the target analytes from the extraction column into the analytical column
4. Elution from the extraction column in the forward or back flush mode
5. Multiple analytical column set-up
6. Direct injection on the analytical columns (without on-line extraction)
To meet the above demands, two types of valves were used: two two-position switching valves
(Fig. 2-1 (a)) and two column switching valves (Fig. 2-1 (b)). The two-position switching valves
could be programmed in position 0 and 1, the column switching valves allowed the parallel set-up
of up to six different analytical columns.
(a) (b)
Fig. 2-1 Switching valves: two-position switching valve (a), column switching valve (b)

2 Materials and Methods 20
Three HPLC pumps (A, B, C) were connected to the two-position valves by capillary tubes. Pump
A was also connected to a gradient unit, capable to mix four different solvents; pump B and pump
C were connected by a T-piece. Pump A should be used to load, wash (forward flush) and
subsequently flush and equilibrate the extraction column. Pump C should deliver mobile phase for
the elution of the target analytes and the analytical separation, pump B should be employed for the
back flush wash of the extraction column. In Fig. 2-2 the schematic drawing of the four basic
positions: a) loading and wash (forward), b) back flush mode, c) elution, d) direct injection on the
analytical columns without on-line extraction is shown. The circuit diagram will be explained in
more detail in the results section 3.2.3 in context with the final optimised method.
.AC Tox
..AC Tox
.
.. V1 V2
V3 V4
PumpB
Auto-sampler
PumpC
PumpA
Detector
... ... .
.
.
..
....
. .. .
AC Urine
EC
... .
.V1 V2
V3 V4
PumpB
Auto-sampler
PumpC
PumpA
Detector
. . .. .
..
.... ...
.
AC Urine
AC Tox
EC
.
.
.
..
. ...
a) Loading and wash forward (blue) b) Back flush mode (blue)
.V1 V2
V3 V4
PumpB
Auto-sampler
PumpC
PumpA
Detector
. ..... .
..
.....
.
AC Tox
EC
. ...
. AC Urine ..
..
.
.
.V1 V2
V3 V4
PumpB
Auto-sampler
PumpC
PumpA
Detector
. . ..
.. .... . .
..
EC
.. .
..
.
..
..
AC Urine
AC Tox
.
c) Elution (yellow) d) Direct injection on the analytical column
(red)
EC Extraction column Waste AC Urine Analytical columns urine analysis AC Tox Analytical columns plasma analysis V1+V2 Two-position valves V3+V4 Column switching valves Fig. 2-2 Basic positions of the circuit diagram: a) Loading and wash forward, b) back flush
mode, c) elution, d) direct injection on the analytical column without on-line extraction
2.2.2 Analytical Procedure
2.2.2.1 HPLC Separation and Detection
The principles of HPLC separation and DAD are thoroughly explained in the literature [77, 86-88].
HPLC separation was performed on two coupled strong cation-exchange (SCX) columns

2 Materials and Methods 21
(2 x LunaSCXTM 150 x 4.6 mm, 5 µm, including a SCX 4.0 x 3.0 mm pre-(guard)cartridge) at a
flow rate of 1.2 mL/min under isocratic conditions. The mobile phase consisted of a mixture of
0.05 M dihydrogenphosphate buffer pH 2.3 (68.5%) and acetonitrile/water (90/10, v/v) (31.5%).
The oven temperature was 40 °C and the wavelengths were set at 205/235 nm. The injection
volume was 1.0 mL. To allow secure compound identification by spectra and RRT comparison the
spectra of all investigated analytes were stored in a spectra library using the library editor. A
commercially available library of approximately 2600 spectra [22] was used as backup spectra
library. Criteria for positive identification was a 99.9% agreement between the obtained and the
library spectrum expressed in a similarity index (SI) > 0.999 and a maximum deviation of the RRT
of ± 5%. All data were processed using the Shimadzu LC SolutionTM software 1.21.
2.2.2.2 Method Development and Optimisation
The mobile phase for the used spectra library consisted of 0.05 M dihydrogenphosphate buffer
pH 2.3 and acetonitrile/water (90/10, v/v). If a commercial spectra library is used, it will be very
important to use the same mobile phase solvents that were used for the library set-up, as UV
spectra show pH dependency [53]. Therefore, only the column material and the buffer/organic
solvent ratio could be varied and not the mobile phase solvents. Within the scope of the analytical
separation development, various column materials (reversed phase, embedded polar phase, cation-
exchange material), different column lengths and the coupling of analytical columns were
investigated. The analytical method development and optimisation followed the aim to separate
analytes from a wide range of chemical structures and polarities and to allow the separation of
polar analytes from the injection peak. In Table 2-1 a survey of all investigated analytical columns
is given. The percentage of 0.05 M dihydrogenphosphate buffer and acetonitrile/water (90/10, v/v)
as well as the flow rates for each column were optimised. A mixture of seven reference standards
(6-acetylmorphine (6-AM), codeine, EDDP, morphine, psilocin, scopolamine and tilidine) diluted
to 0.1 µg/mL in 0.05 M dihydrogenphosphate buffer pH 2.3 was used for the evaluation of the
analytical separation. The capacity (κ) and separation (α) factors for each column and flow rate
(0.7, 0.8, 0.9, 1.0, 1.1, 1.2 mL/min) were calculated using the equations Eq. 1 and Eq. 2. Optimum
κ values range from 1-5, α should be ≥ 1.1 to achieve sufficient resolution [87]. The mixture was
injected directly onto the analytical columns; the injection peak was used as a dead time marker for
the κ value determinations.
κ = (RT-t0/t0) Eq. 1 κ Capacity factor RT Retention time t0 Dead time (time of an unretained peak)

2 Materials and Methods 22
α = (κn+1/κn) Eq. 2 α Separation factor κ Capacity factor
Separation of target analytes for this method was evaluated under optimised conditions, injecting
buffer solution spiked with reference standards e. g. atropine/scopolamine, MDA/3,4-methylene-
dioxy-methamphetamine (MDMA), amphetamine/methamphetamine, 6-AM/morphine/methadone.
Table 2-1 Investigated HPLC columns
Column type Material Particle size
[µm]
Pore size [Å]
Surface
[m2/g]
Length x diameter
[mm]
PH range
Cation-exchange
IonospherTM * 5 125 165 250 x 4.6 2.0-05.0
Luna SCXTM * 5 100 400 150 x 4.6 2.0-07.0
Luna SCXTM * 5 100 400 250 x 4.6 2.0-07.0
MetasilTM * 5 080 200 250 x 4.6 2.0-08.0
Embedded polar phase
Synergi Hydro-RPTM ** 4 080 475 250 x 4.6 1.5-07.0
Synergi Polar-RPTM *** 4 080 475 250 x 4.6 1.5-07.0
Reversed phase
Luna C8TM C8 5 100 400 030 x 3.0 1.5-10.0
Luna C18TM C18 5 100 400 030 x 3.0 1.5-10.0
NucleosilTM 100 C8 C8 5 100 350 200 x 4.0 1.5-10.0
NucleosilTM 100 C8 C8 5 100 350 50 x 4.0 1.5-10.0 * Strong acid ion-exchange material (functional cation-exchange group: sulfonic acid) ** C18 reversed phase material with polar endcapping *** Ether-linked phenyl phase with polar endcapping
In order to pursue better separation results, the influence of the amine modifiers N,N-
dimethyloctylamine (N(CH3)2C8H11) and tetramethylammonium chloride (N(CH3)4Cl) on the
separation, peak shape or symmetry was studied.
2.2.3 On-line Extraction Procedure
2.2.3.1 Extraction Method
The system set-up described in section 2.2.1 was used for the on-line extraction. The samples were
applied to the extraction column (StrataX-CWTM, 20 x 2.1 mm, 35 µm) with 0.01 M phosphate
buffer pH 6.0 followed by a wash step with acetonitrile/water (90/10, v/v). Solvents were
transported by pump A, each step took 2.5 min and the flow rate was set to 2 mL/min. During the

2 Materials and Methods 23
loading and wash step, the analytical columns were conditioned with mobile phase (pump C, flow-
rate = 1.2 mL/min). The extraction column was then washed with water transported by pump B in
the back flush mode (1 min; flow rate = 3 mL/min). The following elution into the analytical
columns with mobile phase 1 was again in the back flush mode using pump C.
The time required for the on-line extraction was 6 min. The final extraction method together with
the according circuit diagram is described in more detail in the results section (3.2.3).
2.2.3.2 Extraction Method Development and Optimisation
The on-line column to be employed should allow the extraction of a wide range of analytes and
effectively work in combination with the separation column and the mobile phase optimised.
Polymer (electroneutral), weak cation-exchange (carboxylic acid functions, WCX) and strong
cation-exchange (benzenesulphonic acid functions, SCX) sorbents were investigated for on-line
extraction. In Table 2-2 the studied extraction materials are summarised.
Table 2-2 Investigated extraction materials
Material Particle size
(µm)
Pore size (Å)
Surface
(m2/g)
Length x diameter
(mm)
Extraction capacity (meq/g)
1. Polymer material Polystyrene-divinylbenzene 35 85 800 20 x 2.0 - Styrenedivinylbenzene/ methacrylate copolymer
70 100/400 575 20 x 2.1 -
N-vinylpyrrolidone/divinyl- benzene copolymer
25 80 810 15 x 2.0 -
2. Weak cation-exchange material Polymer based carboxylic acid functions
35 85 800 20 x 2.0 Approx. 1.00
Silica based carboxylic acid function
40/120 60 Not given
20 x 2.1 Approx. 0.35
3. Strong cation-exchange material Polymer based benzenesulphonic acid functions
35 85 800 20 x 2.0 Not given
Polymer based benzenesulphonic acid functions
30 78 792 15 x 2.0 Approx. 0.81
Depending on the nature of the extraction sorbent, the target analytes had to be uncharged when the
sorbent was apolar (electroneutral) and charged when a polar sorbent (WCX, SCX) was used to
guarantee retention. Therefore, borate buffer pH 8, tris-buffer pH 9.1 and ammonium carbonate
buffer pH 10 were used to load the analytes onto polymer (electroneutral) material, and phosphate
buffer pH 6.0 for the loading onto the cation-exchangers, respectively.

2 Materials and Methods 24
The loading, wash, back flush and elution steps were optimised by the determination of the optimal
solvents and solvent composition, volumes and flow rates for each working step. Water, acetic
acid, phosphate buffer pH 2.3, pH 6 and pH 7, borate buffer pH 8, tris-buffer pH 9.1 and
ammonium carbonate buffer pH 10 were investigated as loading and wash buffers. The molarity of
the buffer solutions (0.01 M, 0.05 M, 0.1 M, 0.2 M) and the percentage of acetonitrile/water
(90/10, v/v) were varied and flow rates ranging from 0.5-5.0 mL/min examined. The time required
to equilibrate and adjust the extraction column to a certain pH, switching from an acidic to a basic
solvent, was determined by pH measurement behind the extraction column (Fig. 2-3).
The compound break-through in the loading and wash steps was investigated by collecting
fractions behind the extraction column (Fig. 2-3). The organic fractions were evaporated to dryness
under a stream of nitrogen at 40 ± 3 °C. The residue was redissolved in 1.0 mL of mobile phase 1,
vortexed for 15 s and reanalysed by direct injection on the analytical columns. The aqueous
fractions were directly injected into the analytical columns.
.
AC Tox
..AC Tox
.
.. V1 V2
V3 V4
PumpB
Auto-sampler
PumpC
PumpA
Detector
... ... .
.
.
..
....
. .. .
AC Urine
EC
... .
EC Extraction column AC Urine Analytical columns urine analysis AC Tox Analytical columns plasma analysis V1-V4 Valves Fig. 2-3 Circuit diagram, loading and wash position (forward)
The elution with the mobile phase was determined by directly connecting the extraction column to
the analytical column and direct injection of PCS 1 (n = 6) on the three coupled columns (Fig. 2-4).
The peak areas of the PCS 1 analytes were compared to those obtained from the direct analysis of
the PCS 1 (n = 6) without the coupled extraction column.
Autosampler DAD system
Fig. 2-4 Direct connection of the extraction column (EC) with the analytical column
pH measurement for the determination of the equilibration time
Fraction withdrawal
Analytical columnEC
2 Materials and Methods 25
The extraction of buffer spiked with reference standards, blank and spiked blank urine samples was
carried out, evaluating the extraction efficiency and the absence of interferences for each
investigated column.
In order to increase the life-time of the extraction columns, the filter effect of a C8, C18, C18 wide
pore, NH2 and SCX pre-(guard)cartridge was studied by connecting the respective pre-
(guard)cartridge to the extraction column prior to analysis. The influence on the life-time of the
extraction column by measuring the pressure was determined. The pore size of the investigated pre-
(guard)cartridges was 100 Å and 300 Å for the wide pore cartridge, respectively.
2.2.4 Validation
With the following investigations the suitability of the developed method for its intended use
should be demonstrated and documented (method validation).
Despite their frequent use, only few strategies for the validation of qualitative analytical methods
are described in the literature [89]. Selectivity and the lower limit of detection are the most
important validation parameters for the validation of qualitative methods according to different
organizations [90-94]. The comparison with described methods of the same field of application [16,
19, 21, 34, 55, 95] led to the addition of the validation parameters recovery, precision, linearity and
the performance of carry-over experiments. Main emphasis was put on the ruggedness of the
method; especially the batch-to-batch reproducibility of the extraction and analytical columns
should be given, to allow the simple column exchange by the operator. The PCS 1 (buffer matrix)
and PCS 2 (urine matrix) consisting of six different analytes were used for the assay validation
which represented the following groups of interest: alkaloids (scopolamine), amphetamine-
derivatives (MDA) opiates (codeine, morphine), opioids (EDDP) and neostigmine bromide (I.S.).
The determination of the above mentioned parameters followed the Food and Drug Administration
(FDA) guidelines for biomedical method validation [96] which was originally developed for the
validation of quantitative methods.
2.2.4.1 Selectivity/Specificity
To demonstrate the selectivity of the analytical procedure, six blank urine samples obtained from
six healthy volunteers were analysed (each n = 3). The absence of interfering peaks (signal-to-noise
ratio (S/N) > 3) at the RT of the analytes of the PCS 1 and PCS 2 in the chromatogram was
verified. In addition, the secure identification of multiple drug cases was ensured by the analysis of
spiked urine samples with possible opiates, alkaloids, amphetamine-derivatives, tilidine and tilidine
metabolites.

2 Materials and Methods 26
2.2.4.2 Stability
The stability of the PCS 1 and PCS 2 was assessed by dividing the freshly prepared performance
control sample in three aliquots; the first was frozen immediately, the second was stored in the
fridge at 5-8 °C and the third was kept in the dark at room temperature. Three samples of the
freshly prepared performance control sample were analysed immediately as reference samples,
samples of each aliquot were analysed after 3, 7, 14, 21, 28 days (n = 3).
Long-term stability evaluations over 67 days (n = 3) were carried out using the PCS 1, but
scopolamine was replaced by tilidine. The samples were portioned in 1.5-mL cups and stored
frozen. Prior to analysis, the samples were thawed and immediately analysed.
Psilocin stability
Psilocin is the dephosphorylated pharmacologically-active fraction of psilocybin, which represents
the main psychoactive compound of Psilocybe mushrooms. Psilocin is usually present in smaller
amounts in the so called “magic mushrooms”, but it is formed as an in vivo metabolite and
therefore is available for analysis in biological fluids [97]. Psilocin is partially excreted in urine in
the glucuronide conjugated form [98], thus glucuronide hydrolysis prior to psilocin analysis is
recommended [85, 99-101].
As the weak stability of psilocin is described in the literature [97], the UV and temperature
influence on the psilocin stability should be examined with the following investigations. A number
of 16 blank urine samples was prepared and spiked with 5 µg/mL psilocin reference standard. To
8 samples 0.1 mL glucuronidase reagent was added. Four sample aliquots each were wrapped in
aluminium foil to protect them from UV radiation. The samples containing glucuronidase reagent
were hydrolysed at 45 °C. After 0, 4, 8 and 24 h, a UV-protected sample with and without
hydrolysis and a non-protected sample with and without hydrolysis were extracted and analysed.
In a second experiment, blank urine samples spiked with 5 µg/mL psilocin reference standard were
stored at 5-8 °C (fridge) and < -15 °C (freezer). Samples of each aliquot were analysed after 0, 1, 7,
28 and 42 days (n = 3). The recoveries (R, %) for both stability experiments were calculated with
the following equation: R, % = Peak area (n h or m days) / Peak area (0 h or 0 days) x 100 Eq. 3
n 0, 4, 8, 24 h m 0, 1, 7, 28, 42 days
2.2.4.3 Extraction Recovery
The extraction recovery was calculated from the average peak areas (arithmetic mean) of the
extracted PCS 1 (buffer matrix, n = 6) and PCS 2 (urine matrix, n = 6) in relation to the average
peak areas (arithmetic mean) of the direct injection of PCS 1 into the analytical columns (n = 6) at

2 Materials and Methods 27
three concentrations (1.0 (level 1), 5.0 (level 2), 15.0 (level 3) µg/mL). The following equation
(Eq. 4) was used for the calculation:
Recovery, % = Peak area (PCS 1 or 2, on-line extraction) / Peak area (PCS 1, direct injection) x 100 Eq. 4
The influence of any matrix components on the recovery was determined by comparison of the
recoveries of PCS 1 and PCS 2 at level 1-3.
2.2.4.4 Precision
Within-day precision of the system was assessed by the direct injection of the PCS 1 (buffer
matrix, n = 6) and calculation of the standard deviation (SD) and the relative standard deviation
(RSD) of the six replicates, respectively. Within-day precision of the method was determined by
the extraction and analysis of the PCS 2 (urine matrix, n = 6) and calculation of the SD and the
RSD of the six replicates. For each parameter three concentrations (1.0, 5.0, 15.0 µg/mL, level 1-3)
were investigated. Between-day precision was determined by the analysis of PCS 2 on six different
days (n = 3).
2.2.4.5 Carry-Over Experiments
For the determination of the concentration that led to a carry-over, blank urine samples were
injected after each sample of the following concentrations 0.25, 0.50, 1.00, 2.00, 5.00, 10.00, 15.00,
and 20.00 µg/mL. In each instance, the chromatograms obtained from the blank samples were
tested for appearing peaks.
2.2.4.6 Linearity
Linearity was evaluated extracting and analysing matrix samples spiked with the PCS 2 analytes at
the following concentrations: 0.10, 0.20, 0.25, 0.50, 1.00, 2.00, 5.00, 10.00, 15.00, and
20.00 µg/mL (n = 6).
2.2.4.7 Limit of Detection
The lower limit of detection (LLOD) of the system was assessed by comparing the chromatograms
of empty matrix with those obtained from spiked blank urine samples (PCS 2) near the expected
LLOD (c = 0.25, 0.20, 0.10 µg/mL (n = 6)). The LLOD was regarded as the lowest concentration
of the performance control sample analytes yielding a signal-to-noise (S/N) ratio of at least 3.0.

2 Materials and Methods 28
2.2.4.8 Batch-to-Batch Reproducibility
For the evaluation of the batch-to-batch reproducibility of the extraction column and the analytical
columns, the PCS 2 was analysed using three different batches of extraction columns (each n = 3)
and three different batches of analytical columns (each n = 6). The SD and RSD of the replicates
were calculated for within- and between-reproducibility (peak area and RRT).
2.2.4.9 Calibration for Semi-Quantitative Determination
For a selection of analytes a 7-point calibration (0.1, 0.2, 0.5, 1.0, 5.0, 10.0, 15.0 µg/mL, n = 6) for
semi-quantitative analysis was carried out. Within-day precision (n = 6), between-day precision (on
6 different days) and linearity by correlation coefficient, intercept and slope were calculated using
Microsoft Office ExcelTM 2003. A Grubbs-test was performed to determine any outliers.
Semi quantitative concentration calculation was carried out using equation Eq. 5, accuracy by
relative error (RE, %) was calculated using Eq. 6. For the determination of both latter parameters
the PCS was exemplarily used.
c = (Peak area analyte / Peak area I.S.-intercept) / slope Eq. 5
RE, % = 100 x (c (calculated) – c (nominal)) / c (nominal) Eq. 6
2.2.5 Method Modifications for Critical Compounds
The developed method was modified for the analysis of compounds which had a low recovery due
to early elution in the acetonitrile/water wash step (benzoylecgonine (BEC)) or could not be
analysed on the strong cation-exchange columns within an acceptable time range due to strong
interactions with the HPLC material (late eluting compounds (LEC): aripiprazol, cetirizine,
clozapine, olanzapine, opipramol, pipamperone, quetiapine, risperidone, ziprasidone).
2.2.5.1 Benzoylecgonine Method
The BEC method was established in order to increase the BEC detection signal. The second wash
step with acetonitrile/water (90/10, v/v) was reduced (0.5 min) and the loading and wash step with
0.01 M phosphate buffer was extended to 4.5 min in comparison to the earlier described extraction
method. After 4 min of elution with mobile phase, the extraction cartridge was separated and
washed with acetonitrile/water (90/10, v/v) while parallel analytical separation was carried out on
the analytical columns. The total run time was 41 min.
2 Materials and Methods 29
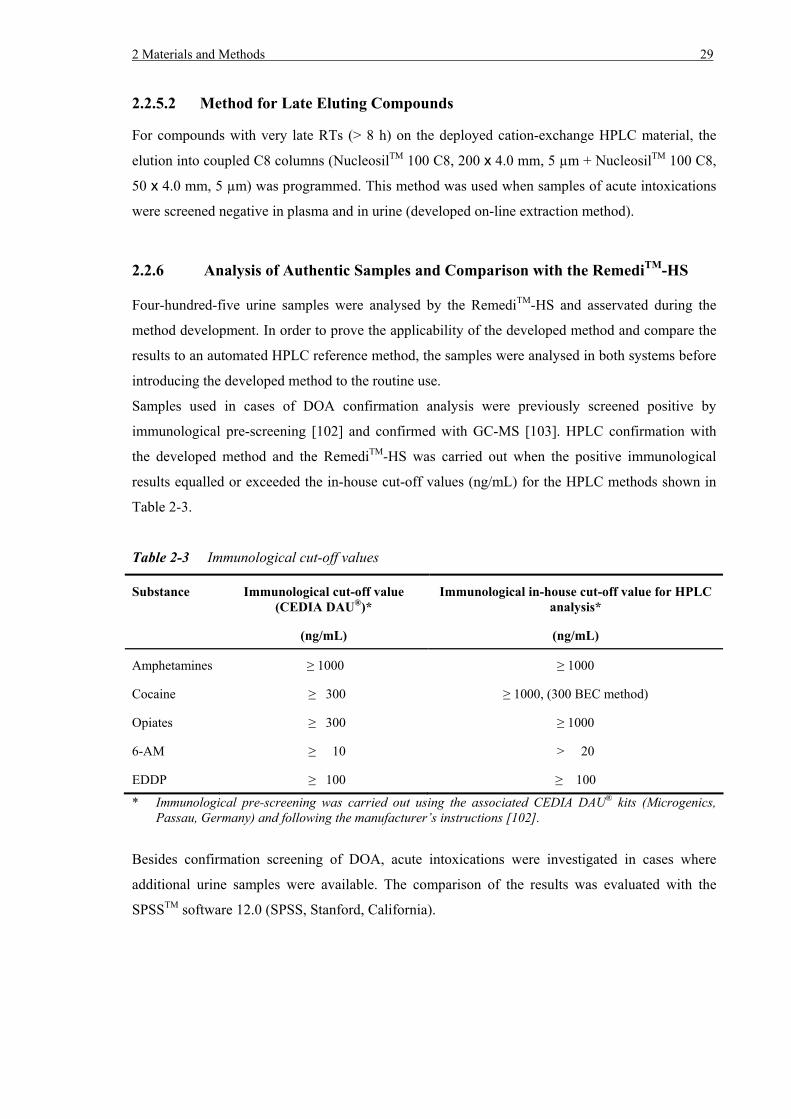
2.2.5.2 Method for Late Eluting Compounds
For compounds with very late RTs (> 8 h) on the deployed cation-exchange HPLC material, the
elution into coupled C8 columns (NucleosilTM 100 C8, 200 x 4.0 mm, 5 µm + NucleosilTM 100 C8,
50 x 4.0 mm, 5 µm) was programmed. This method was used when samples of acute intoxications
were screened negative in plasma and in urine (developed on-line extraction method).
2.2.6 Analysis of Authentic Samples and Comparison with the RemediTM-HS
Four-hundred-five urine samples were analysed by the RemediTM-HS and asservated during the
method development. In order to prove the applicability of the developed method and compare the
results to an automated HPLC reference method, the samples were analysed in both systems before
introducing the developed method to the routine use.
Samples used in cases of DOA confirmation analysis were previously screened positive by
immunological pre-screening [102] and confirmed with GC-MS [103]. HPLC confirmation with
the developed method and the RemediTM-HS was carried out when the positive immunological
results equalled or exceeded the in-house cut-off values (ng/mL) for the HPLC methods shown in
Table 2-3.
Table 2-3 Immunological cut-off values
Substance Immunological cut-off value (CEDIA DAU®)*
Immunological in-house cut-off value for HPLC analysis*
(ng/mL) (ng/mL)
Amphetamines ≥ 1000 ≥ 1000
Cocaine 0≥ 0300 ≥ 1000, (300 BEC method)
Opiates 0≥ 0300 ≥ 1000
6-AM 0≥ 0010 > 20
EDDP 0≥ 0100 ≥ 100
* Immunological pre-screening was carried out using the associated CEDIA DAU® kits (Microgenics, Passau, Germany) and following the manufacturer’s instructions [102].
Besides confirmation screening of DOA, acute intoxications were investigated in cases where
additional urine samples were available. The comparison of the results was evaluated with the
SPSSTM software 12.0 (SPSS, Stanford, California).

2 Materials and Methods 30
2.2.6.1 Sample Pre-Treatment RemediTM-HS
The sample preparation followed the instructions of the manufacturer for the RemediTM-HS
analysis. The urine samples were centrifuged for 5 min at 15 000 x g and 1.0 mL was transferred to
a 1.5-mL polypropylene cup, diluted with 200 µL I.S. solution (BioRad), vortexed and centrifuged
again for 5 min at 15 000 x g. The samples were placed into the auto sampler. The injection volume
was 1.0 mL.
2.2.6.2 Extraction and Analytical Procedure RemediTM-HS
Following sample preparation, the sample was applied to the first column (purification column)
with application buffer. On this column on-line extraction was carried out retaining basic, neutral
and weakly acidic compounds. Hydrophilic endogenous compounds, salts and glucuronides were
not retained and passed through that column. On the 2nd column (extraction column) endogenous
organic acids were retained. The target analytes were eluted into a 3rd and 4th column (separation 1
cartridge and separation 2 cartridge) for separation by an exchange and transfer buffer. The
separation 1 cartridge was a reversed-phase cartridge that separated weakly basic compounds; the
separation 2 cartridge (silica material) separated basic compounds by cation-exchange. Separation
was carried out under isocratic conditions. A 5th cartridge (mobile phase saturator cartridge) was
used to saturate the mobile phase with silica, protecting the separation cartridges from dissolution.
Identification of the compounds was performed by spectra comparison and chromatographic data.
For the RT calculation two internal standards (N-ethyl-nordiazepam and chlorpheniramine) were
used. Time required for analysis including extraction was approximately 20 min. A detailed
description of the system is given by Binder et al. [55]. In 7.2 in the appendix a picture of the
RemediTM-HS (Fig. 7-1) and of its circuit diagram (Fig. 7-2) are shown.
2.3 Screening Method for Plasma
The toxicological screening method for substances in plasma or serum followed a laboratory
internal method and has been described in the literature [104]. The method has been part of the
routinely performed STA at the laboratory of the Institute of Toxicology-Clinical Toxicology and
Poison Control Centre Berlin since 1988 and was established and examined with the analysis of an
accuracy control test in the described analytical system in order to allow screening of plasma.
2.3.1 Analytical Procedure
Following LLE (2.1.4), the samples were brought onto the coupled NucleosilTM 100 C8 columns,
where isocratic analytical separation was carried out at a flow rate of 0.7 mL/min. The mobile

2 Materials and Methods 31
phase consisted of 64% 0.05 M phosphate buffer pH 2.3 and 36% acetonitrile/water (90/10, v/v).
The oven temperature was 40 °C and the detection wavelength was set at 210 nm.
Prior to analysis, the column switching valves were switched in-line with the required analytical
column and an equilibration gradient was run (0.05 M phosphate buffer pH 2.3: increase from 20%
to 64% linear in 10 min, plus 10 min isocratic under the mobile phase conditions). The time
required for analysis was 50 min. The schematic set-up for the analytical system using column
switching is shown in Fig. 2-5.
.
.V1 V2
V3 V4
PumpB
Auto-sampler
PumpC
PumpA
Detector
. . ..
..
.... . .
..
AC Urine
AC Tox
EC
..
.
PC
..
.
..
..
Fig. 2-5 Circuit diagram of the toxicological screening method in plasma (red)
2.3.2 Validation
The set-up of the method in the analytical system was checked by a suggested performance test for
accuracy control [22] consisting of histamine (0.1 mg/mL) for the determination of the time of an
unretained peak, caffeine (0.1 mg/mL) for accuracy measurement of the auto sampler, MPPH
(0.1 mg/mL) for reproducibility and precision evaluation of the RRTs and benzene (1.0 mg/mL)
was used to control the resolution, precision and reproducibility of the UV spectra measurement
(vibration bands between 240 and 270 nm). The latter parameters were determined by analysis of
six consecutive samples (n = 6). The injection volume was 10 µL.
Between-day precision was assessed with the analysis of the PCS on six different days. The
accuracy of the method was assessed by calculation of the mean percentage deviation (RE, %) of
measured concentrations of the PCS-PA from their nominal concentration (2.2.4.9, Eq. 6).
The precision from HPLC-system-to-HPLC-system was investigated by analysis of the PCS-PA in
the developed system and in an HPLC-UV reference system from Shimadzu used for routine
plasma analysis at the Institute of Toxicology-Clinical Toxicology and Poison Control Centre
Berlin (7.3, appendix), each n = 6. Accuracy from HPLC-system-to-HPLC-system was determined
by calculation of the RE using Eq. 7. The injection volume was 50 µL for evaluation of the latter
described validation parameters.
RE, % = 100 x (c (developed system) – c (reference system in routine use)) / c (reference system in routine use) Eq. 7
PC Pre-(guard)cartridge
EC Extraction column
AC Urine Analytical columns urine analysis
AC Tox Analytical columns plasma analysis
V1+V2 Two-position valves
V3+V4 Column switching valves

2 Materials and Methods 32
In addition, the analysis of real toxicological specimens in both systems was evaluated and
compared.
2.4 Screening Method for Neutral, Weakly Acidic and Weakly Basic
Compounds in Urine
2.4.1 Analytical Procedure
Since neutral, weakly acidic and weakly basic compounds cannot be extracted via the weak cation-
exchange material, an on-line extraction method for neutral, weakly acidic and weakly basic
compounds was developed. The samples were loaded on apolar extraction material (StrataXTM
20 x 2.0, 35 µm) with loading buffer consisting of 90% 0.01 M phosphate buffer pH 6.0 and 10%
acetonitrile/water (90/10, v/v). A subsequent wash step in the forward (80% 0.01 M phosphate
buffer pH 6.0/20% acetonitrile/water (90/10, v/v)) and back flush mode (water) was performed.
Flow rates, loading/wash time and the use of the three pumps were adapted from the on-line
extraction method for basic compounds described in section 2.2.3.1. Analytical separation was
carried out on coupled NucleosilTM 100 C8 columns at a flow rate of 0.7 mL/min under isocratic
conditions. The detection wavelength was set to 205 nm and time for analysis including on-line
extraction was 50 min.
For integration of this method in the analytical system, a fifth valve was established in order to
allow automatic switching between two on-line extraction columns (see Fig. 2-6).
.. V1 V2
V3 V4
PumpB
Auto-sampler
PumpC
PumpA
Detector
1... ... .
.
.
..
....
. .. .
AC Urine
EC1
PC
...AC Tox
..AC Tox
..
.
EC2
.... ..V5
.. V1 V2
V3 V4
PumpB
Auto-sampler
PumpC
PumpA
Detector
1... ... .
.
.
..
....
. .. .
AC Urine
EC1
PC
...AC Tox
..AC Tox
..
.
EC2
... ... V5
Fig. 2-6 Circuit diagram including a 5th valve, EC 1: 1st extraction column, EC 2: 2nd extraction s column, PC: pre-(guard)cartridge, AC: analytical columns, V1, V2, V5: two-position s valves, V3, V4: column switching valves
2.4.2 Method Development and Optimisation
For the development of the method the consistence of the loading and wash solvents was optimised
and the sample break-through examined (2.2.3.2, Fig. 2-3). Different polymer (electroneutral)

2 Materials and Methods 33
extraction materials were investigated (2.2.3.2, Table 2-2), the analytical columns for the on-line
extraction method (2 x LunaSCX 150 x 4.6 mm) and the screening method in plasma (NucleosilTM
100 C8, 200 x 4.0 mm + NucleosilTM 100 C8, 50 x 4.0 mm) were studied in order to pursue
optimum separation of benzodiazepines and barbiturates in particular.
In order to increase the extractable amount of benzodiazepines in the urine sample, glucuronide
hydrolysis was carried out as described in section 2.1.4. Optimisation of the required hydrolysis
time was performed by hydrolysing the same benzodiazepine-positive samples for 30, 60, 120, 150
and 180 min. The glucuronide cleavage was evaluated by the peak area of the benzodiazepine
peaks in the corresponding chromatogram (n = 3). Furthermore glucuronide hydrolysis with HCl at
80 °C for 30 min was investigated and the results compared.
2.4.3 Validation
The validation of the method was carried out with the exemplary use of PCS-BDP 1 and 2 and
PCS-BARB 1 and 2. The following parameters were determined as described in section 2.2.4:
selectivity, stability, recovery, precision, LOD, carry-over experiments, linearity and
reproducibility were carried out. Linearity was investigated over the range of the following
concentrations: 0.05, 0.10, 0.50, 1.00, 5.00, 10.00, 20.00 µg/mL (n = 6). The dependency of the pH
on the extraction behaviour of MPPH (I.S.) was studied by calculating the recovery of spiked
MPPH samples (c = 5 µg/mL) adjusted to pH 4.5, 6.0, 7.0 and 9.0 (each n = 3) compared to the
direct injection (n = 3).
2.4.4 Analysis of Authentic Benzodiazepine Positive Samples
The applicability of the method was investigated with real toxicological samples. For this purpose
urine samples that were previously positively pre-screened by immunological analysis (CEDIA
DAU®, cut-off for benzodiazepines 200 ng/mL) were used.
2.5 Strategies for Systematic Toxicological Analysis with the New Analytical
Screening System
2.5.1 Samples Spiked with Reference Standards
Frequently prescribed and/or toxicologically relevant compounds (c = 1 µg/mL) were analysed
with the three described methods in order to establish a systematic structure of the developed
analytical system and determine the method choice in dependence on the sample type. The
analytical data for each compound (RT, RRT, UV spectrum) were stored in a separate library for

2 Materials and Methods 34
each method, which was programmed using the Library editor of the LC SolutionTM software. The
set-up of the separate spectra libraries for each method, in addition to the commercial library, was
used to allow compound identification by comparison of retention and RRTs.
2.5.2 Authentic Toxicological Samples
Within the scope of the analysis of acute intoxications at the Institute of Toxicology-Clinical
Toxicology and Poison Control Centre Berlin, authentic toxicological samples were analysed
following the analysis strategy presented in Fig. 1-1, 1.1. Over a time period of six weeks all
samples where plasma and urine were sent for analysis were asservated and subsequently
reanalysed with the developed system. Urine samples were investigated with the two on-line
extraction methods, plasma samples were analysed following LLE with the toxicological screening
method in plasma, respectively. The switching between the different methods using different
analytical columns was handled by programming an equilibration sequence prior to sample
analysis. The injection volume, method parameters and method depending report formats were
stored in a template for batch-analysis in order to simplify the routine use and to avoid mistakes by
switching from one method to the other. Following sample analysis, a wash sequence was run
before the corresponding method was set to the standby mode.
In Fig. 2-7 a schematic drawing of all used methods in accordance to the investigated sample
matrix and the spectra libraries used for compound identification is shown.
Urine Urine
Screening methodfor neutral, weakly acidic and
weakly basic compounds
Screening methodfor basic compounds in urine
Method-specific UV libraryincluding metabolites and RTs
Commercial UV library of toxic compounds
(approx. 2600 spectra)
Method-specific UV libraryincluding metabolites and RTs
Commercial UV library of toxic compounds
(approx. 2600 spectra)
Screening methodfor benzoylecgonine
Plasma
Screening method for plasma
Method-specific UV libraryincluding metabolites and RTs
(laboratory internal)
Commercial UV library of toxic compounds
(approx. 2600 spectra)
Fig. 2-7 Schematic drawing of the methods used for STA