expression and function of neutral endopeptidase/cd10 on...
TRANSCRIPT

Expression and function of Neutral Endopeptidase/CD10
on pancreatic adenocarcinoma
Dissertation
zur Erlangung des akademischen Grades
doktor rerum naturalium (Dr. rer. nat.)
vorgelegt der
Naturwissenschaftlichen Fakultät I
(Institut für Biologie)
der Martin-Luther-Universität Halle-Wittenberg
von
Herrn Diplom Biologe
Mabruk Erhuma H. Erhuma
geboren am 19 August, 1965 Libyen
Gutachter:
1. Prof. Dr. Hans-Jörg Ferenz
2. PD Dr. Hoang-Vu Cuong
3. Prof. Dr. Walter Halangk
Halle (Saale), den 17.03.2008
urn:nbn:de:gbv:3-000013393[http://nbn-resolving.de/urn/resolver.pl?urn=nbn%3Ade%3Agbv%3A3-000013393]

Thank God for all his blessings
My family for
continuous and unconditional support

- III -
Contents 1 INTRODUCTION 1
1.1 Pancreas anatomy, histology and function 1
1.2 Pancreas diseases 2
1.2.1 Pancreatitis 2 1.2.2 Pancreatic cancer 3 1.2.3 Risk factors 4 1.2.4 Cellular cancer classification of pancreatic adenocarcinoma 5
1.3 Ectoenzymes 6
1.3.1 Neutral endopeptidase 8
1.4 NEP/CD10 expression in pancreatitis and carcinoma tissues 14
1.5 Aim of the present investigation 15
2 MATERIALS AND METHODS 16
2.1 Pancreatic adenocarcinoma cell lines and culture conditions 16
2.2 Plasmids 16
2.3 RNA isolation and cDNA synthesis 18
2.4 NEP/CD10 standard preparation 18
2.5 Quantitative RT-PCR 19
2.6 Flow cytometry 20
2.7 Genomic DNA extraction 21
2.7.1 Bisulfite modification of DNA 21 2.7.2 NEP/CD10 MSP primer design 22 2.7.3 Methylation specific PCR assay 22
2.8 Cell culture stimulation 23
2.9 Transformation 23
2.10 Killing curve 24
2.11 Transfection and clone selection 25
2.12 Freezing, thawing and adapting of transformed cells 26
2.12.1 Freezing cells 26 2.12.2 Thawing cells 27
2.13 Microarray gene expression analysis 27
2.14 Cell proliferation assay 28
2.15 NEP/CD10 indirect immunofluorescence 29
2.16 Cell cycle analysis 30

- IV -
2.17 NEP/CD10 activity assay 31
2.18 Cell migration assays 32
2.19 Transfilter invasion assay 32
2.20 Extraction of total protein from cells 33
2.21 Western Blot 33
2.21.1 Protein detection and results evaluation 35 2.21.2 Membrane stripping 35
2.22 Statistical analysis 36
3 RESULTS 37
3.1 Heterogeneous NEP/CD10 expression in different cell lines 37
3.1.1 NEP/CD10 mRNA expression 37 3.1.2 NEP/CD10 protein expression 38 3.1.3 NEP/CD10 enzyme activity 39
3.2 NEP/CD10 promoters and methylation status 39
3.3 NEP/CD10 regulation on pancreatic carcinoma cell lines 41
3.3.1 Regulation of NEP/CD10 mRNA expression 41 3.3.2 Regulation of NEP/CD10 protein expression 41
3.4 Transfection and NEP/CD10 expression on PANC-1 clones 42
3.4.1 NEP/CD10 mRNA over expression upon gene transfection 42 3.4.2 NEP/CD10 protein over expression upon gene transfection 43
3.5 Immunofluorescence and localization of NEP/CD10 44
3.6 NEP/CD10 enzyme activity assay 46
3.7 NEP/CD10 and cell lines proliferation assay 47
3.8 Cell cycle analysis by flow cytometry 47
3.9 NEP/CD10 expression and cell migration 51
3.10 NEP/CD10 expression and cell invasion 52
3.11 Microarray gene expression analysis 53
3.11.1 Differential gene transcriptions 54 3.11.2 Validation of microarray data result 56
4 DISCUSSION 59
5 CONCLUSION 69
6 PROSPECTIVE PLANE 72
7 REFERENCES 73

- V -
Abbreviations aa Amino acid
A Ampere
Abeta Amyloid-beta peptide
AD Alzheimer`s disease
AIDS Acquired immune deficiency syndrome
Ala Alanine
ANF Atrial natriuretic factor
ANP Atrial natriuretic peptide
Arg Arginine
Asp Aspartate
ATRA All-trans retinoic acid
BA Butyric acid
BK Bradykinin
BLP Bombesin like peptides
BRCA2 Breast cancer 2
bp Base pair
BSA Bovine serum albumine
CALLA Common acute lymphocytic leukemia antigen
CD Cluster of Differentiation
CDKN2A Cyclin-dependent kinase inhibitor 2A
cDNA Complementary deoxriboynucleic acid
Cdc42 Cell division cycle 42
CDS Coding sequence
CGRP Calcitonin gene-related peptide
COBRA Combined of bisulfite and resection enzyme assay
CT Threshold cycle
DEPC Diethylpyrocarbonat
DMEM Dulbecco’s minimum essential medium
DMSO Dimethylsulphoxide
DNA Deoxyribonucleic acid
dNTP Deoxyribonucleotide triphosphate
DTT Dithiothreitol
EC Extra cellular
EDTA Ethylene diamine tetra acetic acid
EGF Epidermal growth factor
EGTA Ethylene glycol-bis-(b-amino-ethyl ether) N,N,N´,N´-tetra-acetic acid

- VI -
ET-1 Endothelin-1
FACS Fluorescence activated cell sorter
FCS Fetal calf serum
fMLP Formyl-metheonyl-leucyl-phenylalanine
GAPDH Glyceraldehyde-3-phosphate dehydrogenase
Glu Glutamate
GRP Gene-related peptide
HBSS Hank’s Balanced Salt Solution
hCG Human chorionic gonadotropin
HDAC Histone deacetylase
HEPES N-[2-Hydroxyethyl]piperazine-N'-ethanesulfonic acid
His Histidine
HIV 1 Human immunodeficiency virus 1
HNPCs Human neuronal progenitor cells
IFN-β Interferon-beta
IGF Insulin like growth factor
IL-1β Interleukin-1 beta
IL-6 Interleukin- 6
Ile Isoleucine
kb Kilo base
kDa Kilo dalton
K-ras Kirsten retrovirus-associated DNA sequences
Leu Leucine
Lys Lysine
mAb Monoclonal antibody
Met Methionine
mRNA Messenger ribonucleic acid
MTT 3-(4,5-Dimethyl-thiazol-2-yl)-2,5-diphenyl tetrazolium bromide
MSP Methylation specific PCR
NAD Nicotinamide adenine dinucleotide
NADP Nicotinamide adenine dinucleotide phosphate
NEP Neutral endopeptidase
NKA Neurokinin A
nm Nanometer
NPY Neuropeptide Y
NTC No template control
OD Optical density

- VII -
PAK1 p21/Cdc42/Rac1-activated kinase 1
PAMP Proadrenomedullin N-terminal 20 peptide
PBS Phosphate buffered saline
PBST Phosphate buffered saline with tween
PC Pancreatic cancer
PCR Polymerase chain reaction
PE Phycoerythrin
Phe Phenylalanine
PETs Pancreatic endocrine adenocarcinomas
PI3K Phosphoinositide-3-kinase
PI Propidium iodide
PIN Pancreatic intraepithelial neoplasia
PMN cells Poly morpho nuclear cells
Pro Proline
PVDF Polyvinylidene difluoride
q Long arm side of chromosome
Rac Ras-related C3 botulinum toxin substrate
RhoA Ras homolog gene family, member A
RNA Ribonucleic acid
rNTP Ribose nucleotide triphosphate
ROCK Rho-associated, coiled-coil containing protein kinase
RhoGDIs Rho Guanine nucleotide dissociation inhibitors
rpm Rotations per minute
SDS-PAGE Sodium dodecyl sulfate polyacrylamide gel electrophoresis
SMA Smooth muscle actin
SP Substance P
TBST Tris buffered saline with tween
Thr Threonine
Tm Melting temperature
Trp Tryptophan
Tsp-1 Thrombospondin-1
Tyr Tyrosine
UICC Union international contre le cancer
Val Valine
VIP Vasoactive intestinal peptide
VPA Valproic acid

- 1 - Introduction
1 Introduction
1.1 Pancreas anatomy, histology and function
The pancreas a part of the digestive system is a long, flat gland (Figure 1), that is located
deep in the abdomen sandwiched between the stomach and the spine.1 It lies partially
behind the stomach. The other part is nestled in the curve of the small intestine called the
duodenum. Pancreas is described as having a head, body and tail.
Fig. 1: Morphological structure and location of pancreas in the body
Histologically, the pancreatic parenchyma is divided into two components: (i) the exocrine
portion, which is composed of ducts and acini and (ii) the endocrine component, (Figure 2)
which is composed of hormone-secreting cells arranged in islets (islets of Langerhans).
The pancreatic exocrine cells, the larger part (98-99 %), is composed of tubulo-acinar
glands that drain, via a highly branched duct system, into the main pancreatic duct. This
duct runs the whole length of the gland and opens into the duodenum through the ampulla
of Vater. The acinar cells produce digestive enzymes and some duct lining cells yield a
fluid rich in sodium and bicarbonate.2 The enzymes are responsible for the breakdown of
proteins mainly (trypsin, chymotrypsin, elastase and others), fats (lipase) and

- 2 - Introduction
carbohydrates (amylase). The endocrine cells are small clusters of cells (1-2 % of the
adult pancreatic mass)3 named the islets of Langerhans and some spread cells that occur
single or in small groups.4 The islets are scattered throughout the exocrine pancreas,
although the islets are more numerous in the tail.2 Endocrine cells are also found within
the ductal system.4 Human islet cells have been classified into four types based on their
hormone production: A cells (glucagon); B cells (insulin); D cells (somatostatin); and PP
cells (pancreatic polypeptide).5,6 In the special islets of the pancreatic head the ratio of PP
cells is increased even as the endocrine cells found outside the islets include both PP and
D cells.3,4 Two other cell types occur more rarely: D1 cells that secrete vasoactive
intestinal peptide (VIP) and enterochromaffin cells that secrete serotonin.6
Fig. 2: Histological structure of pancreas (our slide)
1.2 Pancreas diseases
1.2.1 Pancreatitis
Pancreatitis is a rare disease in which the pancreas becomes inflamed. The mechanism
that causes pancreatitis is not well known. It is thought that enzymes normally secreted by
the pancreas in an inactive form become activated inside the pancreas and start to digest
the pancreatic tissue. This process called auto digestion could lead to swelling,
hemorrhage in the gland, serious tissue damage, infection and formation of cysts.
Enzymes and bacterial toxins may then enter the bloodstream and seriously injure organs,
duct
Endocrine gland
Exocrine gland
Centroacinar cell
Intercalated duct
Endocrine gland
Exocrine gland
Centroacinar cell

- 3 - Introduction
such as the heart, lungs and kidney. Most commonly caused by alcohol abuse or
gallstones, the disease affects men more often than women. There are two forms of
pancreatitis: acute and chronic. The acute form occurs suddenly and may result in life-
threatening complications; nevertheless the majority of patients (80 %) recover
completely. Chronic pancreatitis is a long-term inflammation of the pancreas, that is
primarily marked by severe pain and loss of pancreatic function.7
1.2.2 Pancreatic cancer
Like all organs, the pancreas is made up of individual living cells. These cells are joined to
form the tissues of the pancreas. There are several different types of cells in the pancreas
to accomplish its functions as mentioned above. The cells divide rapidly while the
pancreas is growing in the womb, childhood and through puberty. In adults, they only
divide rarely to replace old, dying cells or injured ones. Cell division is normally under very
tight control by the genetic material (genes) such as cyclines, p21, p53 etc, that control all
mechanisms like proliferation, differentiation and other functions inside each cell.
Pancreatic cancer begins in a single cell. A change occurs in the genes of this cell, which
loses its controls to prevent haphazard division (Figure 3).
UCSF Comprehensive Cancer CenterUCSF Comprehensive Cancer Center
Fig. 3: Pancreatic cancer progression. Stages of pancreatic cancer progression from a normal polarized epithelial monolayer through hyperplasia (PanIN-1A), dysplasia (PanIN-IB/2), and ductal carcinoma in situ (PanIN-3).

- 4 - Introduction
The abnormal cell starts dividing rapidly, makes millions and billions of copies of it. Soon a
clump of abnormal cells is produced, called adenocarcinoma. Adenocarcinoma simply
means a swelling and is not necessarily malignant or cancerous. When the cells in the
adenocarcinoma just grow in their local area and do not spread elsewhere, then the
adenocarcinoma is benign. However, when the adenocarcinoma's cells, which are dividing
out of control, gain the capacity to spread to distant body areas, this is a malignancy
called cancer. Malignant adenocarcinomas can spread to any area of the body; the
process of distant spread is called metastasis (Table 1). The cancer at first grows in its
local area and interferes with the pancreas functions. When cancer metastasizes, it can
grow in vital organs, cause symptoms there and eventually kill the patient.
1.2.3 Risk factors
Pancreatic cancer is the fourth most common cause of cancer death in Western society
and is a leading cause of cancer death worldwide. Its incidence and mortality rates are
almost identical. The 5-year survival rate is approximately 1-2 % and the median survival
time after diagnosis is 4-6 months.
Pancreatic cancer is more common among males than females, with peak incidence
occurring at age sixty.8 The etiology of the disease remains unclear, but cigarette
smoking, obesity and alcohol abuse have been related with an increased incidence of
pancreatic cancer. Pancreatic cancer is more common among individuals with histories of
the following conditions: cirrhosis (a chronic liver disease), chronic pancreatitis, diabetes
and a history of surgery to the upper digestive tract.8 Long term exposure to certain
chemical carcinogens, such as dry cleaning chemicals, gasoline or metallurgic fumes,
also appears to increase the risk of this cancer.8 Inherited DNA changes that may
increase a person's risk of developing cancer of the pancreas can also cause an
increased risk for certain other cancers. Mutation in oncogene (K-ras in codon 12), tumor
suppressor genes (CDKN2A/INK4A, TP53 and DPC4/SMAD4/MADH4) and caretaker
genes (BRCA2) also have a higher rate of pancreatic cancer. Current studies on

- 5 - Introduction
pancreatic adenocarcinoma tissues and cell lines have shown that multiple subsets of
genes undergo activation or inactivation during development and progression of disease.9
Cancer of the endocrine pancreas includes a highly treatable and often curable collection
of tumors. They are uncommon cancers with 200 to 1.000 new cases per year and occur
in only 1.5 % of detailed autopsy series. About 95% of pancreatic cancers begin in the
exocrine pancreas. Here in this study only exocrine pancreas cell lines will being
investigated.
1.2.4 Cellular cancer classification of pancreatic adenocarcinoma
Cancer of the pancreas can be classified according to the UICC and TNM . Once cancer
of the pancreas is found, more tests will be done to find out whether the cancer has
spread from the pancreas to the tissues around it or to other parts of the body. This is
called staging (Table 1).
Table 1: The UICC TNM classification for staging of cancers
Involvement of lymph nodes N
Primary adenocarcinoma T N0 regional node N1 distant nodes M
T1 With in the pancreas 2 cm or smaller Stage 1a Stage 2b Stage 4
T2 With in the pancreas larger than 2 cm Stage 1b Stage 2b Stage 4
T3 Beyond the pancreas Stage 2a Stage 2b Stage 4
T4 Invasion to the celiac artery or SMA* Stage 3 Stage 3 Stage 4
Liver metastasis, lung metastasis, peritoneal dissemination12 Stage 4:
*Smooth muscle actins (SMA) are commonly used to elucidate mammary myoepithelial (ME) cells, whose presence or absence is a reliable criterion for differentiating in situ and invasive adenocarcinomas.
Cancers of the exocrine pancreas can be grouped according to where in the pancreas the
cancer is or according to the type of cell the cancer has originated from.
duct cell adenocarcinoma (90 % of all cases)
acinar cell adenocarcinoma
papillary adenocarcinoma
adenosquamous adenocarcinoma

- 6 - Introduction
undifferentiated adenocarcinoma
mucinous adenocarcinoma
giant cell adenocarcinoma
mixed type
small cell adenocarcinoma
cyst adenocarcinoma
unclassified
pancreatoblastoma
papillary-cystic neoplasm (this adenocarcinoma has lower malignant potential and may be cured with surgery alone)10,11
1.3 Ectoenzymes
Ectoenzymes are integral membrane proteins anchored by hydrophobic interactions with
the lipids of the plasma membrane, that have their enzymatically active site outside the
plasma membrane in the extracellular environment. Many ectoenzymes are type II integral
membrane proteins with a short amino terminus in the cytosol or are glycosylphosphatidyl-
inositol-linked molecules. But all other possible kinds of anchoring in cell membranes have
been found. One of the first ectoenzymes to be identified was cholinesterase, which
hydrolyses acetylcholine at neuronal synapses.13 Ectoenzymes can be classified
according to their enzymatic activities. Many of them are peptidases and proteinases, see
below table 3. Other enzyme species include hydrolases and nucleotidases which
hydrolyse extracellular nucleotides, NAD and NADP, or oxidases which oxidize various
substrates (Table 2).14

- 7 - Introduction
Table 2: Ectoenzymes and substrates
Name EC number Catalytic activity Substrates Products
Nucleotidases and related enzymes
CD39 EC 3.6.1.5 ATP diphosphohydrolase ATP ATP ADP
AMP ADP AMP
CD73 EC 3.1.3.5 5.-Nucleotidase AMP Adenosine
ADP-ribosyl cyclases and ADP-ribosyltransferases ADP-ribosyl cyclase NAD(P) cADPR(P) and nicotinamide
NAD(P) hydrolase NAD(P) ADPR(P) and nicotinamide
cADPR hydrolase cADPR ADPR CD38 EC 3.2.2.5
Base-exchange catalyst NAD(P) NAAD(P)
ADP-ribosyl cyclase NAD(P) cADPR(P) and nicotinamide
NAD(P) hydrolase NAD(P) ADPR(P) and nicotinamide
cADPR hydrolase cADPR ADPR CD157 EC 3.2.2.5
Base-exchange catalyst NAD(P) NAAD(P)
ART2 EC 2.4.2.31 ADP-ribosyltransferase NAD(P) ADP-ribosylated proteins
Peptidases and proteases CD10 EC 3.4.24.11 Neutral endopeptidase Peptides derivatives Cleaved peptides
CD13 EC 3.4.11.2 Aminopeptidase N Peptides derivatives Cleaved peptide
CD26 EC 3.4.14.5 Dipeptidyl peptidase X-Pro/Ala Cleaved peptide
MT1-MMP EC 3.4.24.80 Matrix metalloproteinase Protein Proteolytic fragments
CD156b EC 3.4.24.86 Metalloproteinase Protein Proteolytic fragments
Oxidases VAP1 EC 1.4.3.6 Amine oxidase Amine Aldehyde, H2O2 and NH3 NADPH oxidase EC 1.6.3.1 Oxidase NADPH Superoxide and H2O2
ADPR, ADP-ribose; ADPR(P), ADPR or ADPR phosphate; ART2, ADP-ribosyltransferase 2; cADPR, cyclic ADP-ribose; cADR(P), cADPR or cADPR phosphate; cAMP, cyclic AMP; H2O2, hydrogen peroxide; LPA, lyso-phosphatidic acid; MT1-MMP, membrane-type-1 matrix metalloproteinase; NAAD, nicotinic-acid-adenine dinucleotide; NAAD(P), NAAD or NAAD phosphate; NAD(P), NAD or NADP; NH3, ammonia; S1P, sphingosine 1-phosphate; VAP1, vascular adhesion protein 1; X, any amino acid.
Ectopeptidases may cleave regulatory peptides and peptide hormones at the
adenocarcinoma cell surface, thereby modulating the biological effect of these peptides on
adenocarcinoma cell proliferation, differentiation and also facilitating immune escape
mechanisms.15-17 Several ectopeptidases are also capable of transducing signals
independently of their proteolytic activity, making them multifunctional membrane proteins.
Ectopeptidases are present in a wide variety of tissues and cell types. They are classified
according to the location of the cleavage site in the putative substrate (Table 3).
Endopeptidases recognize specific amino acid in the middle of the peptide, whereas
exopeptidases distinguish one or two terminal amino acids. Exopeptidases that attack
peptides from the N-terminus (removing either single amino acids or a dipeptide) are

- 8 - Introduction
termed (dipeptidyl) aminopeptidases, whereas peptidases attacking the C-terminus are
termed carboxypeptidases.18
Table 3: Ectopeptidases and substrates
Peptidase Specificity* Posssible natural substrates
Aminopeptidases APN ○ ÷ ● ─ = Ala, Leu fMLP, opioid peptides, enkephalins
APA ○ ÷ ● ─ = Glu, Asp Angiotensins
APP ● ÷ ○ ─ = Pro BK, SP
DPP IV ● ÷ ○ ─ = Pro, Ala SP, BK, NPY, chemokines (CXCL9, 10)
Carboxy peptidases CPN ─ ● ÷ ○ = Arg, Lys Anaphylatoxins
Endopeptidases
NEP ─● ÷ ○ ─ ● ─ = Phe, Leu, Ile, Val, Thr, Trp, Ala BK, SP, NKA, NPY, VIP, ANF, enkephalins ET-1, BLP, angiotensins
ACE ● ─ ● ÷ ○─ ○ ─ = Relatively non-specific Angiotensins, enkephalins, SP
ECE ─ ○─ ○ ─ ÷ ● ─ = Ile-Ile-Trp Big ET-1
The peptidase cleaves peptides in which the open circle represents (one of) the mentioned amino acids. The closed circle can be any amino acid. The cleaved bond is represented by ‘÷’. Peptidases: APN, aminopeptidase N; APA, aminopeptidase A; APP, aminopeptidase P; DPP IV, dipeptidyl(amino)peptidase IV; CPN, carboxypeptidase N; NEP, neprilysin; ACE, angiotensin-converting enzyme; ECE, endothelin-converting enzyme. Substrates:fMLP, formyl-metheonyl-leucyl-phenylalanine; BK, bradykinin; SP, substance P; NKA, neurokinin A ; NPY, neuropeptide Y ; VIP, vasoactive intestinal peptide ; ANF, atrial natriuretic factor ; ET-1, endothelin-1 ; BLP, bombesin-like peptides.
1.3.1 Neutral endopeptidase
Membrane metalloendopeptidase EC 3.4.24.11 (Enkephalinase, neprilysin, neutral
endopeptidase, NEP) is a mammalian type II integral membrane zinc-containing
endopeptidase ectoenzyme. Immunophenotypically it is identified as the leukocyte cluster
of differentiation CD10 or CALLA (common acute lymphoblastic leukemia antigen), which
has specificity for cleaving oligopeptides (≤ 40 amino acids in length) at the amino side of
hydrophobic amino acids (Val, Ile, Phe, Leu, Ala).19
1.3.1.1 Biochemical and molecular characteristics
Neutral endopeptidase was first characterized and isolated from rabbit kidney tubule
brush borders. Cloning of the NEP/CD10 gene and subsequent cloning of the common
acute lymphoblastic leukemia antigen (CALLA, CD10) showed that both sequences are
identical.20-22 NEP/CD10 is a glycoprotein with 750 amino acids.20 It has a single 24 amino
- 9 - Introduction
acid hydrophobic segment that functions both as a transmembrane region and a signal
peptide. The C-terminal 700 amino acids compose the extracellular domain which
contains the pentapeptide consensus sequence (His-Glu-[Ile, Leu, Met]-X-His) of zinc-
binding metalloproteases, whereas the 25 N-terminal amino acids form the cytoplasmic
tail.
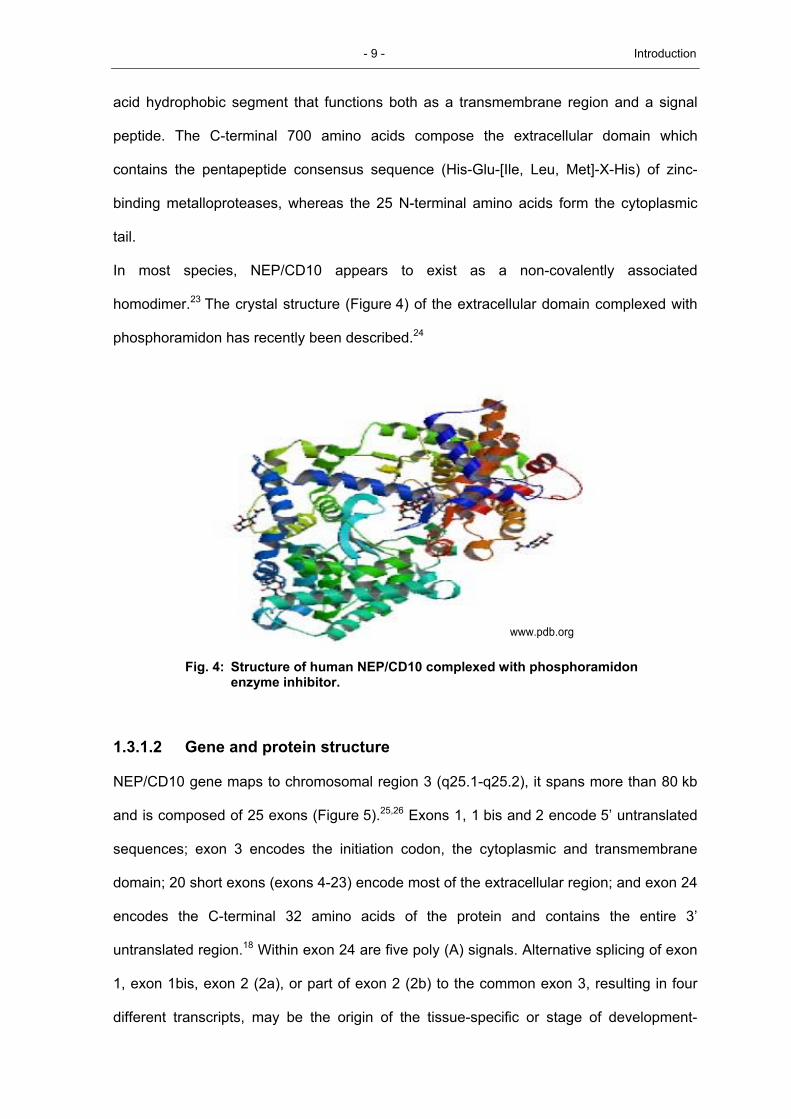
In most species, NEP/CD10 appears to exist as a non-covalently associated
homodimer.23 The crystal structure (Figure 4) of the extracellular domain complexed with
phosphoramidon has recently been described.24
www.pdb.orgwww.pdb.org
Fig. 4: Structure of human NEP/CD10 complexed with phosphoramidon enzyme inhibitor.
1.3.1.2 Gene and protein structure
NEP/CD10 gene maps to chromosomal region 3 (q25.1-q25.2), it spans more than 80 kb
and is composed of 25 exons (Figure 5).25,26 Exons 1, 1 bis and 2 encode 5’ untranslated
sequences; exon 3 encodes the initiation codon, the cytoplasmic and transmembrane
domain; 20 short exons (exons 4-23) encode most of the extracellular region; and exon 24
encodes the C-terminal 32 amino acids of the protein and contains the entire 3’
untranslated region.18 Within exon 24 are five poly (A) signals. Alternative splicing of exon
1, exon 1bis, exon 2 (2a), or part of exon 2 (2b) to the common exon 3, resulting in four
different transcripts, may be the origin of the tissue-specific or stage of development-

- 10 - Introduction
specific expression of NEP/CD10.27 Indeed, two separate regulatory elements have been
found in the NEP/CD10 promoter region and these elements may be regulated by the
transcription factor CBF/ NF-Y in a tissue specific manner. A cDNA clone lacking the
complete exon 16 has been isolated from human lung tissue.28
Fig. 5: Variant gene transcripts structure of NEP/CD10 confer four transcripts
that present only one protein. Copied from gene data bank.
1.3.1.3 Enzymatic activity and biological function
NEP/CD10 is able to hydrolyse peptide bonds on the N-terminal site of hydrophobic amino
acids, including Phe, Leu, Ile, Val, Tyr, Ala and Trp. However, sub-site interactions and
conformational factors greatly influence the efficiency of hydrolysis. It hydrolyses a variety
of physiologically active peptides including opioid peptides (Met- and Leu-enkephalin),
substance P, atrial natriuretic factor (ANF), endothelin, neurotensin, oxytocin, bradykinin,
angiotensin 1, 2, chemotactic peptide formyl-Met-Leu-Phe (f - MLP) , and bombesine like
peptides.19 Thus, one of the main roles of NEP/CD10 seems to be reducing the local
concentration of biologically active peptides available for receptor binding and signal
transduction. The ubiquitous occurrence of NEP/CD10 in mammalian organs renders
possible a broad field of physiological functions as illustrated by more or less organ-

- 11 - Introduction
specific peptides proven to be cleft by the enzymes. In kidneys possible physiological
substrates of NEP/CD10 are ANP, adrenomedullin and PAMP (see the list of
abbreviations); in the brain, the substrates probably are enkephalins and oxytocin.
Similarly, possible substrates in the lung are bombesin, BLP, GRP, neuromedin C,
substance P and neurokinin A; in the cardiovascular system, angiotenisin II, bradykinin
and CGRP; in the gut, VIP; on the neutrophil membrane, fMLP etc. Some substrates are
not strictly tissue-specific, e.g. substance P. Preclinical and clinical trials explored
possibilities of therapeutic application of the inhibitors of NEP/CD10, such as thiorphan in
the management of pain, diarrhea, depression, arterial hypertension and asthma.29-37 It
has been reported that NEP/CD10 may also be able to hydrolyse certain larger
substrates, including cytokines such as IL-1β and IL-6.18 A role for NEP/CD10 in lymphoid
development has been suggested by studies showing that inhibition of NEP/CD10 results
in increased proliferation and maturation of B cells, both in vitro and in vivo.38
1.3.1.4 Distribution in tissues
The common acute lymphoblastic leukemia antigen (CALLA; CD10) was originally found
on lymphoblasts from patients with pre-B type acute lymphoblastic leukemia.39 Later it has
been found to be widely associated with precursor B-cell acute lymphoblastic leukemia, T-
cell acute lymphoblastic leukemia, as well as various types of lymphomas including
follicular lymphomas and Burkitt lymphomas.40-45
Subsequently, immunohistochemical studies demonstrated the expression of this antigen
on a variety of non hematopoietic normal and adenocarcinoma tissues, such as kidney,
breast, fetal small intestine, fibroblasts, gliomas, melanomas, retinoblastomas, various
mesenchymal adenocarcinomas, breast, colon adenocarcinoma cells, genitourinary tract,
such as renal cell, transitional cell and prostate adenocarcinomas.46-59 In the female
genital tract, NEP/CD10 is a marker of trophoblastic adenocarcinomas and endometrial
stromal neoplasms.60 It is also expressed by serous ovarian adenocarcinomas.60-62 In the
gastrointestinal system, NEP/CD10 is expressed in hepatocellular adenocarcinomas.63 It
also has been detected in pancreatic ductal adenocarcinomas and is frequently observed

- 12 - Introduction
in solid pseudopapillary adenocarcinomas.64-66 It has been reported to be positive in some
pancreatic endocrine adenocarcinomas (PETs) in a small series.64,67 This wide tissue
distribution, suggests a crucial role in vivo of this antigen.
1.3.1.5 NEP/CD10 function in normal and carcinoma tissues
The various functions certainly depend on cell type or tissue origin. In muscles,
NEP/CD10 may play an important role during muscle cell differentiation, possibly through
the regulation, either directly or indirectly, of the insulin-like growth factor I driven
myogenic program.68 Furthermore, other results showed that elevated cardiac NEP/CD10
activity may increase the local degradation of bradykinin and natriuretic peptides promote
to pressure loaded and failing human hearts.69 Neutral endopeptidase may terminate the
proinflammatory and mitogenic actions of neuropeptides in normal skin and wounds.70 In
addition it plays a specific role in promoting early T-cell development.71 In human bronchi,
it may regulate peptide-induced inflammation.72 In human thymocytes, expression of
functional NEP/CD10 suggests a role for this enzyme in the maturation of human
thymocytes by hydrolysing thymopentin, a thymic peptide known to induce the maturation
of prothymocytes into thymocytes.73 NEP/CD10 of epithelial cells within human digestive
tract (in the stomach, duodenum, small intestine, ascending, descending sigmoid colon
and rectum) confirms the hypothesis of its participation in protein hydrolysis processes.74
In the human respiratory mucosa, in addition to the modulating functions of NEP/CD10 on
neuropeptide-mediated activities on vessels and glands, it is possible that in secreted
form it plays a role in regulating mucosal responses to luminal neuropeptides or other as
yet uncharacterized NEP/CD10 substrates.75 In spleen, results suggest that NEP/CD10
inhibition promotes the reconstitution and maturation of splenic B-cells. Therefore, it may
function to regulate B-cell ontogeny in vivo by hydrolyzing a peptide substrate that
stimulates B-cell proliferation and or differentiation.76
In tumors, NEP/CD10 function seems to be also variable from one tissue to others. In
stromal cells, it seems to promote invasion and metastasis of differentiated gastric
carcinoma.77 In malignant melanoma the expression is also associated with tumor

- 13 - Introduction
progression.78 In epithelial ovarian carcinomas, it may play a role in the regulation of
neoplastic transformation and tumor differentiation,79 however other evidence suggests
that NEP/CD10 functionally suppresses the progression of ovarian carcinoma.80 In an
integral part of colorectal carcinogenesis it seems to contribute to the invasion and thus
probably facilitates metastasis.81 In placenta, induction of choriocarcinoma cell
differentiation is associated with an increase of NEP/CD10 expression at the cell surface,
suggesting a role of this enzyme in regulating differentiated trophoblast functions such as
human chronic gonadotrophin (hCG) secretion.82 In brain, a partial reduction of
extracellular amyloid-beta peptide (Abeta) levels by NEP/CD10 may facilitate
development of human neuronal progenitor cells (HNPCs) in treatment of
neurodegenerative diseases like Alzheimer's disease (AD).83,84 Downregulation of
NEP/CD10 in the progression of urothelial bladder carcinomas, probably facilitates
invasion, especially into muscle.85 In nasopharyngeal carcinoma it was revealed that
NEP/CD10 expression by stromal cells in this malignancy plays an important role in tumor
progression, particularly in older patients.86 In cervical carcinoma cells results indicated
that NEP/CD10 functions as a tumor-suppressor gene and its expression may have
prognostic significance,87 and in oral squamous cell carcinoma may have an important
role in tumor invasion, probably facilitating the occurrence of metastases.88

- 14 - Introduction
1.4 NEP/CD10 expression in pancreatitis and carcinoma tissues
We investigated NEP/CD10 expression in pancreatitis and pancreatic tumor lesions.89
Interestingly, there exists no significant difference in NEP/CD10 mRNA expression levels
in pancreatic carcinoma compared to that of pancreatitis tissues (data not shown).
Regarding protein expression, immunoreactivity for NEP/CD10 was detectable in a subset
of pancreatic carcinomas exhibiting a membranous staining pattern in tumor cells
(Figure 6). A positive staining was found in 6 of 24 pancreatic ductal adenocarcinomas
(25 %). However, the heterogeneous NEP/CD10 expression pattern was not associated
with tumor grading, staging and metastasis formation. In chronic pancreatitis 3 of 6
samples demonstrated a focal staining of residual ducts.
*b
c
d*
b
c
d
Fig.6: Immunohistochemical detection of NEP/CD10 expression in pancreatic adenocarcinomas as well as in chronic pancreatitis. Perineural (arrow indicating nerve) infiltrating ductal adenocarcinoma with membranous expression of NEP/CD10 (a). Ductal adenocarcinoma negative for NEP/CD10 (*), normal duodenal mucosa served as internal positive control (b). Chronic pancreatitis with focal expression of NEP/CD10 in residual ducts and intravascular neutrophils (arrow) (c, d). (Erhuma et. al.)89

- 15 - Introduction
1.5 Aim of the present investigation
Neutral endopeptidase is a membrane bound enzyme with various functions depending
on cell type or tissue origin. Only limited information however exists about the NEP/CD10
expression in physiological and patho-physiological conditions of the pancreas.
In this study, the main purpose is in the following steps explained:
NEP/CD10 expression: investigation of the relevance of NEP/CD10 expression in
pancreatic adenocarcinoma cell lines.
NEP/CD10 promoters methylation status: Examination of a subset of cases for
evidence of two NEP/CD10 promoters methylation and correlateion the results with
NEP/CD10 expression to determine the mechanism for the lack of NEP/CD10 expression
in pancreatic adenocarcinoma cell lines.
NEP/CD10 regulation: Either hypermethylation of the 5' CpG island or deacetylation of
chromatin results in a loss of NEP/CD10 expression in pancreatic adenocarcinoma cell
lines. To differentiate between both mechanisms pancreatic carcinoma cell lines were
exposed in separate to either the demethylating agent 5-aza-2'-deoxycytidine or
acetylation agents, butyric acid and valproic acid.
Biological function of NEP/CD10: Investigation of the biological function of NEP/CD10
in pancreatic exocrine carcinoma using pancreatic carcinoma cell line as a model,
transfected with pEGFP-C3 (Mock), NEP-pEGFP-C3 and mutated NEPH587E-pEGFP-C3 in
enzyme active site, as well as their effects on proliferation, motility and invasion via
induction or repression of diverse proteins that play a crucial role in biological
mechanisms.
Affecting of NEP/CD10 on signal cascades: Investigation of the influence of NEP/CD10
over expression on the proteins that play crucial roles in signal cascades that regulate
proliferation, motility and invasion via stimulation through cell membrane receptors
concluded our series of experiments.

- 16 - Materials and Methods
2 Materials and Methods
2.1 Pancreatic adenocarcinoma cell lines and culture conditions
The pancreatic adenocarcinoma cell lines that were used in this study PA-TU-T, HUP-T4,
HUP-T3, PA-TU-S, PA-TU-02, PANC-1, Capan-1, Capan-2 and MIA PaCa-2 were either
obtained from the Deutsche Sammlung für Mikroorganismen und Zelllinien (DSMZ;
Braunschweig, Germany) or the American Type Culture Collection (ATCC). Cells were
cultured in a humidified atmosphere containing 5 % CO2 at 37 °C. Their characteristics
and growth conditions are listed in table 4. All media were supplemented with 1 %
penicillin/streptomycin (Biochrom AG, Berlin, Germany). Cells were passaged every 4–7
days using trypsin-EDTA (Invitrogen, Karlsruhe, Germany) and 1x10⁵ cells were seeded
onto 25 cm² tissue culture flasks (Greiner Bio-one, Frickenhausen, Germany) grown until
confluence, then processed for mRNA or protein quantification respectively.
2.2 Plasmids
The following three plasmids were used to explore the biological function in the examined
pancreatic adenocarcinoma cell line PANC-1, pEGFP-C3 (BD Biosciences Clontech,
Heidelberg, Germany) was used to insert any desired investigated gene (Figure 7), NEP-
pEGFP-C3, CDS of NEP/CD10 cloned inside pEGFP-C3 and mutated NEPH587E-pEGFP-
C3, that has a mutation in the enzyme active site of NEP/CD10 (H587E) by substitution of
histidine with aspartic acid.
www.bdbiosciences.comwww.bdbiosciences.com Fig. 7: Structure of the used pEGFP-C3 plasmid in our study

- 17 - Materials and Methods
Table 4: Characteristics of pancreatic adenocarcinoma cell lines used in this study
Name and source Abbrev. Doubling time
and morphology Culture media Characteristics Metastasis Differentiation status
PA-TU-8988 T DSMZ
PA-TU-T
about 22 h, adherent cells growing in monolayers
DMEM/F12 5 % FCS 5 % Horse serum2 mM L-Glutamin
Liver metastases of a primary pancreatic adenocarcinima
no well
HUP-T4 DSMZ HUP-T4
about 38 h, epitheloid cells growing adherent in monolayers
MEM 10 % FCS 1 % non essential amino acides 1 % Na. pyruvate
Pancreas adenocarcinoma from malignant ascites
no poor
HUP-T3 DSMZ HUP-T3
about 38 h, epitheloid cells growing adherent in monolayers & clusters
MEM 10 % FCS 1 % non essential amino acides 1 % Na. pyruvate
Pancreas adenocarcinoma from malignant ascites
no well
PA-TU-8988 S DSMZ
PA-TU-S
about 40-60h, adherent epitheloid cells growing in monolayers
DMEM/F12 5 % FCS 5 % Horse serum2 mM L-Glutamin
Liver metastases of a primary pancreatic adenocarcinoma (sister of PATU-T)
yes, in particular
lung poor
PA-TU-8902 DSMZ
PA-TU-02
about 25-40 h, epithelial adherent cells growing in monolayers
DMEM/F12 5 % FCS 5 % Horse serum2 mM L-Glutamin
Primary ductal pancreatic adenocarcinoma (grade II)
yes, in lung poor
PANC-1 ATCC PANC-1
about 52 h, adherent cells growing in monolayers
DMEM/F12 5 % FCS 5 % Horse serum2 mM L-Glutamin
Liver metastases of a pancreatic ductal adenocarcinoma
yes undifferentiated
Capan-1 DSMZ
Capan-1
about 50-100 h, adherent fibroblastic semi-confluent monolayer
RPMI 1640 15 % FCS
Liver metastases of a pancreatic ductal adenocarcinoma
yes well
Capan-2 DSMZ
Capan-2
about 50-70 h, adherent epithelial-like cells growing in monolayer
RPMI 1640 15 % FCS
Pancreas adenocarcinoma yes well
MIAPaCa-2 ATCC
MIAPaCa-2
about 40 h, adherent cells growing in monolayers
DMEM/F12 1 % FCS 2.5 % Horse serum 1 % Na. pyruvate 4 mM L-Glutamin
Pancreatic adenocarcinoma yes well

- 18 - Materials and Methods
2.3 RNA isolation and cDNA synthesis
Pancreatic adenocarcinoma cell lines, 1x10⁵ cells were seeded into 25 cm² tissue culture
flasks (Greiner Bio-one) and were incubated to grow until confluence. Cells were lysed in
1 ml of TRIzol™ reagent (WKS, Frankfurt, Germany) and total cellular RNA was isolated
from cells according to the manufacturers instructions developed by Chomczynski &
Sacchi.90 The concentration and purity of total cellular RNA was quantified by
determination of optical density at 260, 280, 320 nm and integrity of the RNA was
confirmed by denaturing agarose gel electrophoresis. cDNA was prepared as further
described, 1 µg of RNA in total volume of 10 µl RNase free water, then incubated in trio-
thermo-block (Biometra, Göttingen, Germany) at 70 °C for 3 min followed by addition of
15 µl of master mix to each sample 5 x reaction buffer 5 µl; 0.0 M DTT 2.5 µl; 12.5 mM
dNTP-mix 1 µl; RNase free water 2.7 µl; 40U/µl RNasin 0.5 µl; 200U/µl superscript™ II
RNase H-reverse transcriptase 0.3 µl; 100ng/µl random primer 3 µl (Invitrogen, Karlsruhe,
Germany). The samples are incubated again in trio-thermo-block at 42 °C 45 min, 95 °C
3 min, 2 °C. The resulting complementary DNA (cDNA) was subjected either to
conventional PCR amplification or Real Time-PCR.
2.4 NEP/CD10 standard preparation
To quantitate NEP/CD10, standard was prepared using SP6 promotor + NEP/CD10 sense
primer: 5`-GATTTAGGTGACACTATAGAATACCTCCGAGAAAAGGTGGACAA-3` and
antisense primer: 5’ -TGAGTCCACCAGTCAACGAC-3` (Invitrogen). In the presence of
cDNA of cell type that expresses the required gene, NEP/CD10 was amplified by thermo-
cycler in a total volume of 50 µl containing: 1 µl of SP6-sense primer, 1 µl of antisense
primer, 1.5 µl MgCl2, 1 µl dNTP-mix, 40.2 RNase free water, 5 µl 10 X Taq buffer [500 mM
KCl, 100 mM Tris-HCl, pH 8.3], 0.3 µl 1.25 U Taq Polymerase (Qiagen, Hilden, Germany).
The tubes were incubated in thermo-cycler as follows, initial denaturation 95 °C, 5 min,
cycle 1 which repeated 35 times with the following parameters: denaturation 95 °C, 30 s;
annealing 60 °C, 30 s; extension 72 °C, 30 s, then followed by extension 72 °C, 10 min

- 19 - Materials and Methods
and at the end 2 °C. The samples were loaded on gel electrophoresis. The bands were
sliced, purified and eluted by using QIA quick Gel extraction kit (Qiagen).
RNA was transcribed in vitro using SP6 RNA polymerase (Roche, New Jersey, USA) in a
total volume of 20 µl containing: 13 µl of eluted DNA, 2 µl of rNTP-mix, 2 µl of 10 x buffer,
1 µl of RNase-Inhibitor, 2 µl of SP6-RNA polymerase and incubated in thermocycler at
37 °C for 2 h. The transcription template was eliminated with 5 µl of DNase I (verified by
PCR analysis) at 37 °C for 15 min and remaining RNA was precipitated using 2.5 µl of 9 M
lithium chloride, 75 µl of cold absolute alcohol (-20 °C). The mixture was kept at – 70 °C
for 30 min followed by centrifugation 14.000 rpm at 4 °C for 20 min. The supernatant was
removed, 100 µl of 70 % ethanol was added to the tubes followed by centrifugation
14.000 rpm at 4 °C for 10 min. Finally the pellet was left for a few min to dry, then 11 µl of
RNase free water was added to each tube. RNA standard was first quantified by
measuring the absorbance at 260, 280, 320 nm and then stored at –20 °C until use. As
described above the RNA standard 500 ng was co-reverse transcribed and amplified as
cDNA in thermo-cycler. In the Real Time-PCR analysis, quantitative analysis of
NEP/CD10 mRNAs was performed by incubating samples of cDNA with various
concentration of cDNA standard each in separate tube as indicated in the legend.
2.5 Quantitative RT-PCR
The purpose of a PCR (Polymerase Chain Reaction) is to make a huge number of copies
of a gene. There are three major steps in a PCR, which are repeated for 30 to 40 cycles.
Quantitative PCR was performed in a RG2000 Cycler (LTF, Wasserburg, Germany) by
using SYBR Green as double-strand DNA-specific binding dye and continuous
fluorescence monitoring. Amplification was carried out in a total volume of 20 µl
containing, 10 µl QuantiTect SYBR Green Master Mix, 8.5 µl RNase free water (Qiagen),
0.5 µl 10 pmole/µl of forward, revers primers (Table 5) and 1 µl of 1:10 diluted cDNA
prepared as described above. The PCR reactions were applied as follows, initial
denaturation 95 °C, 15 min, cycle 1 which repeated 40 times with the following
parameters: denaturation 95 °C, 20 s; annealing 60 °C, 30 s; extension 72 °C, 30 s.

- 20 - Materials and Methods
Fluorescence was acquired to cycling A on channel 1 (CH1). Melting curve analysis of
amplification products was performed at the end of PCR reaction by cooling the samples
to 60 °C, 5 s, then increasing the temperature 60-99 °C 1 s each temperature and
acquired to melt A on CH1 using the Roter-Gene software 4.6. Control reactions for
product identification consisted of: (i) Analyzing the melting points of the end product, (ii)
use of NTC as negative control to monitor the purity of the reagent and primers. (iii) At the
end 10 µl of each PCR product mixed with 2 µl loading buffer were visualized using
agarose gel electrophoresis and ethidium bromide staining to determine the length of the
PCR products.
Table 5: Number of primer sequences used in our study
Gene name Primer sequence Product size Annealing temp.
CD10 F: 5'-CTCCGAGAAAAGGTGGACAA-3` R: 5`-TGA GTCCACCAGTCAACGAC-3` 251 bp 60 °C
S100A4 F: 5'-TCTCTCCTCAGCGCTTCTTC-3` R: 5`-GCTGTCCAAGTTGCTCATCA-3` 239 bp 60 °C
Rac 1 F: 5'-ACTGTCCCAACACTCCCATC-3` R: 5`-TCGCTTCGTCAAACACTGTC-3` 207 bp 60 °C
Rho A F: 5'-AAGGACCAGTTCCCAGAGGT-3` R: 5`-ACTATCAGGGCTGTCGATGG-3` 195 bp 60 °C
Cdc42 F: 5'-TACTGCAGGGCAAGAGGATT-3` R: 5`-CCCAACAAGCAAGAAAGGAG-3` 172 bp 60 °C
LIMK 1 F: 5'-CAGGTGAGGTGATGGTGATG-3` R: 5`-GTCCTTGGCAAAGCTCACTC-3` 248 bp 60 °C
2.6 Flow cytometry
Flow cytometry is a method for analyzing the presence of antigens on cells by
immunofluorescence. The method involves labeling of cells with a fluorescent antibody,
then analyzing them using the flow cytometer. Fluorescence-activated cell sorting (FACS)
was performed to quantify the expression levels of NEP/CD10 on the surface of
pancreatic adenocarcinoma cell lines. The cells were incubated with phycoerythrin-
conjugated anti-human mouse NEP/CD10 mAb IgG (H10a IgG1) (BD Biosciences
Heidelberg, Germany) or iso IgG2a k (BD, pharmingen ) as control for 15 min, then fixed
- 21 - Materials and Methods
with 2 % para-formaldehyde (Fluka, Germany) for 10 min, followed by washing twice with
PBS (Applichem, Darmstadt, Germany). FACS data were acquired on a FACS calibur
(Beckton Dickinson, Heidelberg, Germany), fluorescence data of 10.000 events were
recorded and analyzed using CELL Quest software (Beckton Dickinson). Furthermore
fluorescence data were expressed in (MFI) mean fluorescence intensity.
2.7 Genomic DNA extraction
Genomic DNA was isolated from pancreatic adenocarcinoma cell lines using DNeasy
tissue kit (Qiagen) and its quality was assessed by spectrophotometry at 260 280, 320 nm
and visualized by 1 % agarose gel electrophoresis with ethidium bromide staining.
2.7.1 Bisulfite modification of DNA
Modifying DNA using sodium bisulfite to convert unmethylated CpG site to UpG with out
modifying methylated site, thus allowing their differentiation by methylation specific PCR
(MSP), restriction digestion (COBRA), or sequencing after PCR amplification. From each
pancreatic adenocarcinoma cell lines 2 µg DNA was denatured in a volume of 20 µl (18 µl,
2 µl 3 M NaOH, final concentration 0.3 M) (Carl Roth. Gmbh+Co) in water bath at 37 °C
for 15 min. After denaturation, 12 µl of 0.1 M hydroquinone (Sigma) and 208 µl of 3.6 M
sodium hydrogensulfite (Sigma) at pH 5 (400 µl of 3 M NaOH was added to sodium
hydrogensulfite), both prepared freshly, then added and after mixing, the samples were
incubated in a water bath at 55 °C for 16 h. Modified DNA was purified using wizard DNA
purification resin (Promega) according to the manufacturer’s protocol and eluted into 50 µl
of water. Modification was completed with 5 µl NaOH (final concentration 0.3 M) treatment
at water bath 37 °C for 15 min to remove the bisulfite product from the uracil ring, followed
by 1 µl glycogen 2 µg/µl, 55 µl 7.5 M ammonium acetate and 250 µl absolute ethanol
(Sigma). The samples were vigorously mixed, kept in –20 °C for 10 min, then centrifuged
13.000 rpm at RT for 10 min. The supernatants were removed, the pellets washed with
200 µl 75 % ethanol, followed by centrifugation 13.000 rpm at RT for 5 min. The
supernatants were removed, DNA was dried, then suspended in 50 µl TE buffer and used
immediately or stored at -20 °C.

- 22 - Materials and Methods
2.7.2 NEP/CD10 MSP primer design
Methprimer program available in internet was used to obtain the area in untranscripted
region of NEP/CD10 rich in CpG (Figure 8), that is indicator of promoter. The primers
were designed in CpG island area. The following points were considered: (i) primers were
designed to contain at least two times of CpG dinucleotides in their sequence. The
primers contained CpG sites, they were designed to amplify methylated and unmethylated
alleles equally (with a mixture of C or T used for the sense strand or a mixture of G or A
used for antisense primers); (ii) primers were designed to contain a maximum number of
thymidines converted from cytosines to avoid amplification of the no converted genomic
sequence.
Fig. 8: NEP/CD10 promoter region: The untranscripted region in NEP/CD10 sequence where locate
CpG island area in blue color that is an promoter indicator.
2.7.3 Methylation specific PCR assay
This assay is used to examine the methylation and unmethylated status of the gene
promoters. Methylation Specific PCR (MSP) was carried out for the cell lines PA-TU-T,
HUP-T4, HUP-T3, PA-TU-S, PA-TU-02, PANC-1, Capan-1, Capan-2, MIA PaCa-2 and
FTC-238 that served as a positive control. Using 25 µl of reaction solution 4 x (two
promoters to each methylated and unmethylated status) each sample (2.5 µl 10 x buffer,
2 µl 2.5 mM dNTP-mix, 4 µl 25 mM MgCl2, 0.5 µl Taq gold (Roch), 3 µl of sodium bisulfite-
treated DNA and 11 µl DNase free water), 1 µl methylated and unmethylated primers
forward, reverse (Invitrogen) of NEP/CD10 promoter 1 and 2. The cycling conditions were

- 23 - Materials and Methods
10 min at 95 °C, followed by 5 cycles of 94 °C for 30 s, 64 °C for 45 s and 72 °C for 45 s,
then 35 cycles of 94 °C for 30 s, 62 °C for 45 s and 72 °C for 45 s with final extension
elongated at 72 °C for 10 min, 4 °C. After amplification, PCR products were separated on
2 % agarose gels with ethidium bromide staining which gives a main product (Table 6).
Table 6: PCR primers of two NEP/CD10 promoters for MSP analysis
Primer pair Methylated set (f, rev) Unmethylated set (f, rev)
Product size
Annealing temp.
5`-GGGTCGGAGGGATGTTTAGGTGTTTC-3` NEP1 M
5`-CTAAACCGACACATCCCGACCAATAAACG-3` 197 bp 62 °C
5`-GTGGGTTGGAGGGATGTTTAGGTGTTTT-3` UM
5`-AAACTACTAAACCAACACATCCCAACCAATA-3` 206 bp 62 °C
5`-GCGGATGTACGGATTGAGAGGCG-3` NEP2 M
5`-CCACGAACTCCCAACGCCCTAACG-3` 195 bp 62 °C
5`-TGGGTGGATGTATGGATTGAGAGGTG-3` UM
5`-TCCCACAAACTCCCAACACCCTAACA-3` 200 bp 62 °C
2.8 Cell culture stimulation
Cell lines, PA-TU-T, HUP-T4, PA-TU-S, MIA PaCa-2 and PANC-1 were grown in
complete medium until sub confluence, followed by 24 h serum free medium interval
before stimulation for 24, 48, 72 h with the following reagents: 0 (untreated); 5-aza-2-
deoxycytidine (Sigma) 1 µM; sodium butyrate (Merck, Darmstadt, Germany) 2 mM BA;
and valproic acid (Sigma) 2 mM VPA. The medium was changed every day and after the
appropriate stimulation time cells were prepared for analysis of gene and protein
expression.
2.9 Transformation
Competent cells E. coli DH5 α (Invitrogen) and the three vectors pEGFP-C3 (BD
Biosciences Clontech), NEP-pEGFP-C3 and mutated NEPH587E-pEGFP-C3, with mutation
in enzyme active site, histidine was substituted with glutamic acid were used. The latter
two were prepared by Jens Wulfänger and René Keil (Institute of Medical Immunology,

- 24 - Materials and Methods
Martin Luther University). Plasmids were removed from -70 °C; thawed on ice. Three
1.5 ml tubes were labeled and placed on ice then competent cells were gently mixed and
40 µl was pipetted in each three labeled tubes followed by 250 ng from the plasmids
pEGFP-C3, NEP-pEGFP-C3 and mutated NEPH587E-pEGFP-C3 each in separate tube.
The tubes were incubated on ice for 30 min followed by heat shock at 42 °C for 45 s, then
placed on ice for 2 min; 500 µl SOC liquid medium (Invitrogen) was added to each tube
and left on shaker at 37 °C for 1 h. At this point, dry LB-agar (life tech., Scotland) plates
with 50 µg/ml kanamycin that were made earlier in fume hood for approximately 30 min or
until (remove lid plate) condensation drops were dried. The incubated tubes were
controlled when the medium turned turbid, under sterile hood 100 µl from each tube was
pipetted independently in suitable labeled plate followed by spreading the transformed
E. coli DH5 α bacteria over the plates with sterile glass rod. The plates were incubated
upside down in incubator at 37 °C over night. Under a sterile hood three sterile flasks
were filled with 100 ml LB (life tech., Scotland) and kanamycin 50 µg/ml, by stick wood
one clone (transformed bacteria) from each plate was picked out and dropped in every
flask in separate. The three flasks were kept on shaker at 37 °C over night. From each
transformed bacteria in turbid flasks 850 µl was pipetted in separated labeled tube and
150 µl of glycerol (Merck, Germany) was added to each tube, mixed and kept in –20 °C as
stock. The rest was transferred to 50 ml tube, each flask in two tubes. The tubes were
centrifuged at 4000 rpm for 10 min, then the supernatant was removed and discarded
from each tube. pEGFP-C3, NEP-pEGFP-C3 and mutated NEPH587E-pEGFP-C3 were
isolated by plasmid isolation kit under the instruction protocol (Qiagen). Integrity, purity of
the plasmids were confirmed by agarose gel electrophoresis and the concentration of
each plasmid type was quantified by determination of optical density at 260, 280, 320 nm.
2.10 Killing curve
Before transfection, a killing curve was performed with various concentrations of the
antibiotic to determine the amount of antibiotic required to kill the cells after one or two
weeks. Since pEGFP-C3 plasmid has a resistance gene sequence against Geneticin

- 25 - Materials and Methods
(Invitrogen), PANC-1 5x10⁴/well was seeded in 24 well plate and incubated to grow into
standard DMEM/F12 medium at 37 °C, 5 % CO2 in an incubator. After 48 h the medium
was changed and new medium with different concentrations of 0, 250, 500, 1000, 1500
and 2000 µg/ml Geneticin (Invitrogen) was added to the cells, in duplicate wells. The cells
were observed under microscope every 48 h, medium was aspirated out of the wells and
new medium with the appropriate concentration of Geneticin was added. After two weeks,
the Geneticin concentration 1.5 mg/ml which could kill PANC-1 cell line was used after
transfection to select clones.
2.11 Transfection and clone selection
To obtain the NEP/CD10 function in pancreatic adenocarcinoma cancer, PANC-1 cell that
has no endogenous NEP/CD10 expression was transfected with expression vectors for
pEGFP-C3, NEP-pEGFP-C3 and mutated NEPH587E-pEGFP-C3. In a six-well culture plate,
approximately 1x10⁵ cells/well was seeded in 2 ml of DMEM/F12 free of antibiotic
supplemented with 10 % FCS. The cells were cultured in a humidified atmosphere
containing 5 % CO2 at 37 °C in an incubator until the cells were 50-70 % confluent. The
following solutions were prepared in four 1.5 ml labeled sterile tubes. For each
transfection, in each three tubes in separate, 50 µl serum-free Opti-MEM (Invitrogen),
1 µg DNA (pEGFP-C3, NEP-pEGFP-C3, mutated NEPH587E-pEGFP-C3 plasmids) and in
the fourth tube 9 µl of Lipofectamine 2000 reagent 1 µg/µl (Invitrogen) was diluted into
150 µl of serum-free Opti-MEM (Invitrogen). For each tube with the different plasmids,
50 µl of Lipofectamine 2000-Opti-MEM complex was added. The tubes were gently mixed
and incubated at room temperature to combine for 20 min. During this time the cells were
washed with 2 ml of antibiotic-free medium followed with 1 ml of antibiotic-free DMEM/F12
supplement with 10 % FCS. Total 100 µl of pEGFP-C3, NEP-pEGFP-C3 and mutated
NEPH587E-pEGFP-C3–Lipofectamine 2000-Opti-MEM complex was added each in
separate well. The transfected cells were incubated at 37 °C over night in an incubator.
The medium was replaced with DMEM/F12 standard growth medium and the transfected
cells were controlled under fluorescent microscope whether intense green fluorescence

- 26 - Materials and Methods
colour could be seen, then incubated at 37 °C over night in an incubator. To select clones,
medium was replaced with Geneticin (Invitrogen) 1.5 mg/ml DMEM/F12 medium. Every
48 h new Geneticin 1.5 mg/ml medium was added to the cells and checked under
fluorescent microscope whether clones were formed. After two weeks, PANC-1-pEGFP-
C3, –NEP-pEGFP-C3 and mutated- NEPH587E-pEGFP-C3 clones (Table 7) were marked,
picked out, then pipetted in 96 well plates, each clone in one well which has Geneticin
(1.5 mg/ml) in DMEM/F12 standard growth medium. The plate was incubated at 37 °C in
an incubator, every 48 h medium was replaced until confluent. The desired clones of cells
were transferred to 24 well plate and so on, then sorted depending on intensity of green
fluorescent protein using FACS instrument by PD Dr. med. Dagmar Riemann (Institute of
Medical Immunology, Martin Luther University). The clones of cells were expanded, then
evaluated for mRNA and protein expression by Real Time-PCR and flow cytometer
respectively.
Table 7: Name and character of plasmid and clones used in the study
Name Used name NEP/CD10 expression Enzyme activity
pEGFP-C3 (express GFP) Mock1 no no
p-C3 (express no GFP) Mock2 no no
NEP-pEGFP-C3 Wild type NEP CL1 and 2 yes yes (high)
NEPH587E-pEGFP-C3 Mutated mNEP CL1 and 2 yes yes (low)
2.12 Freezing, thawing and adapting of transformed cells
2.12.1 Freezing cells
The selected Mock, NEP and mNEP clones that had low, middle and high expression of
NEP/CD10, were cultured to proliferate in DMEM/F12 standard growth medium with
1.5 mg/ml Geneticin in a humidified atmosphere containing 5 % CO2 at 37 °C in an
incubator until the cells were confluent in 75 cm2 cell culture flask. Every clone was
prepared and collected in preserved solution contain 90 % FCS and 10 % DMSO, then
divided in cryotubes (Greiner Bio-one) each tube containing 1 ml. The tubes were kept in

- 27 - Materials and Methods
a slow-freezing container in –20 °C overnight, then transferred to liquid nitrogen tank for
long preservation, using gloves and face protection.
2.12.2 Thawing cells
The desired clones suited for further investigation were thawed quickly using pre warmed
DMEM/F12 standard growth medium 37 °C in water bath to prevent them from dying.
Under sterile bank, the tube contents were transferred into 15 ml tube with regular
medium, then centrifuged at 1500 rpm for 10 min. The cells were resuspended in
DMEM/F12 standard growth medium with Geneticin 1.5 mg/ml, then transferred to cell
culture plates to grow over night. The cells were observed under microscope, the medium
was changed and cultured in an incubator to grow. Every 48 h medium was changed, the
cells were split when they became confluent and 1x10⁵ cells were pipetted in culture plate
with DMEM/F12 standard growth medium and Geneticin 1.5 mg/ml.
After three passages the clones were used to evaluate planned investigation.
2.13 Microarray gene expression analysis
Total cellular RNA of pancreatic adenocarcinoma cell lines PANC-1, Mock1 and NEP CL2
was lysed in 1 ml of TRIzol™ reagent (WKS) and total cellular RNA was isolated from
cells according to the manufacturers instructions developed by Chomczynski & Sacchi.90
The RNA integrity was confirmed by agarose-formaldehyde electrophoresis under
denaturing conditions in 2.2 M formaldehyde (Fluka) according to Maniatis et al., using the
MOPS buffer (Merck) system. Agarose is prepared by melting the required amount of
agarose in DEPC water (Sigma), (40 % formaldehyde and 10 x MOPS were diluted in
DEPC water to give 2.2 M formaldehyde and 1 x MOPS, respectively) then cooling to
approximately 60 °C. Prior to loading, RNA samples were heated to 65 °C for
approximately 10 min to denature any secondary structure, cooled on ice for 2 min and
2 µl of sterile loading buffer was added. Samples were loaded onto the gel, followed by
electrophoreses. Visualization of RNA was achieved by illumination with UV light. Typical
marker of RNA quality are 18S (~1900 bases) and 28S (~4800 bases) rRNA molecules.
RNA samples 40 µg of PANC-1, Mock and NEP CL2 were sent to RZPD in Rostock for
- 28 - Materials and Methods
application of Affymetrix chip array. Double stranded cDNA synthesis was performed
using a superscript double-stranded cDNA synthesis kit. In vitro where transcription of
biotin-labeled cRNA probes was done following the kit's instructions (Affymetrix). The
cRNA probes were chemically fragmented using a fragmentation buffer (Affymetrix) and
fragmented biotin-labeled cRNA was hybridized on Affymetrix human genome U133 2A
chips. Genechip® Human Genome U133A 2A could analyses about 54.700 transcripts,
this already containing 14.500 human characterized genes. On the used U133A 2A chips,
every transcript is existing as set of 11 probe pairs, where by every probe pairs comprises
one perfect-match and one miss-match. The perfect-match is the precise reverse
complement of transcript sequence and the miss-match is the same oligonucleotide
(25 mer) with bases substitution in the middle of transcript. Through comparison of
hybridization signals between perfect-match and miss-match specific or not specific
hybridization could be differentiated. The U133A 2A Chip of Mock was evaluated against
PANC-1 and NEP CL2 to determine the discrepancy of gene expressions. The data of
Affymetrix were changed to Excel data and the raw micro array data files were analyzed.
For illustration the Affymetrix data, the signals were classified in present (P), absent (A) or
marginal (M). The data were normalized using the robust multi-array average (RMA)
algorithm. Gene expression ratios were calculated. Ratios greater than 2.0 were
considered over expressed, otherwise they were considered as normal/under-expressed.
The data were exploited using Eva program by Ivonne Pöschel (Institute of Medical
Immunology, Martin Luther University).
2.14 Cell proliferation assay
Analysis of cell proliferation was performed on PANC-1, Mock1,2, wild type NEP1,2 and
mutated NEP1,2 clones using a MTT assay, first described by Mosmann.91 The product
3 -(4,5-Dimethyl-thiazol-2-yl)-2,5-diphenyl tetrazolium bromide (Sigma) is a yellow water
soluble tetrazolium dye that is reduced by living cells, but not by dead ones, to a purple
formazan product that is insoluble in aqueous solutions. The cells were cultured 4 times
into 96 wells plates 2x10³ cells/well in 200 µl of DMEM/F12 medium supplemented with
- 29 - Materials and Methods
2 mM L-glutamine, 1 % penicillin/streptomycin, heat inactivated 5 % FCS, 5 % horse
serum and allowed to attach for 24 h, followed by 72 h serum free medium to synchronize
the cells, Geneticin 1.5 mg/ml medium was added to Mocks and clones. After three days
starvation one plate was performed for MTT test as 0 h. The medium supplements with
5 % FCS was added to three well plates, Geneticin 1.5 mg/ml medium was added to
Mocks and clones, every day medium was changed. At each time point 24, 48, 72 h MTT
5 mg/ml (Sigma) 20 µl was added to each well and the plates were incubated at 37 °C for
4 h to allow the conversion of MTT to formazan by mitochondrial dehydrogenase. The
medium was then removed, formazan crystals were dissolved in 100 µl DMSO and gently
mixed. Formazan quantification was performed measuring the optical density at 570 nm
using 96 well multiscanner auto reader (TECAN, Austria GmbH). The proliferation rate
was expressed as OD and comparing Mock, NEP and mNEP clones with PANC-1 cells.
2.15 NEP/CD10 indirect immunofluorescence
Because PANC-1 cell line and established clones need an adhesive surface to grow on,
the glass slides were coated with poly-L-lysine hydrobromide (Sigma). In brief, the glass
slides were immersed in 50 % H2SO4 for 1 h using a porcelain rack, then washed for
30 min in running tab water followed by rinse with dH2O. The glass slides were immersed
in 40 µg/ml of poly-L-lysine hydrobromide at RT for 1 h, then washed in running tap water
for 1 h, followed by rinse 3 times 5 min each in dH2O. The glass slides were dried on filter
paper in dust-free area. The dried glass slides were arranged in porcelain rack and
completely covered with foil aluminium, then sterilized in dry autoclave at 180 °C for 2 h.
The confluent PANC-1, Mock, NEP and mNEP clones were detached from culture plates
by incubating them in trypsin-EDTA (Invitrogen). Detached cells were resuspended in
culture medium, then centrifuged. The pellets were resuspended again with new culture
medium, counted under microscope using haemocytometer. Total number 2x10⁴ cells/ml
of PANC-1, Mock, NEP and mNEP clones, 100 µl was dropped twice separately on each
sterilized glass slide coated with poly-L-lysine hydrobromide in culture dishes, incubated
in a humidified atmosphere containing 5 % CO2 at 37 °C in an incubator up to cells were

- 30 - Materials and Methods
semi confluent. The cells were rinsed with PBS once 5 min, followed by fixation with
paraformaldhyde 2 % in PBS at RT for 15 min, followed by 3 times washing 5 min each in
PBS. In every glass slide, the two areas with the fixed cells were closely circled with fatty
pen (DAKO A/S), then 100 µl of 1:40 mouse anti-human NEP mAb (ALB2, IgG2a,
immunotech, Hamburg, Germany) in one circle and 100 µl of 1:200 iso-IgG2a kappa
(Pharmingen) as control in the other spot. The glass slides were incubated in a wet
chamber at RT for 40 min, then washed with PBS 4 times, 5 min each, followed by
incubation with 50 µl of 1:100 diluted secondary antibody Cy3-conjugated anti-mouse IgG-
f(ab´)2-fragment (Dianova, Hamburg, Germany) at RT for 40 min, protected from light. The
cells were washed 4 times, 5 min each and 50 µl of 1:100 diluted 10 mg/ml Hoechst stain
(Sigma) was added at RT for 1 min, protected from light, followed by washing 4 times for
5 min each. The Fluorescent mounting medium (DAKO cytomation, Carpinteria USA) was
dispensed on the cells and the cover slide was applied on the glass slide. The expression
of NEP/CD10 was photographed using fluorescence microscope.
2.16 Cell cycle analysis
The cell cycle analysis was performed as follows. In brief, 3x10⁵ of PANC-1, Mock, wild
type NEP and mutated mNEP clones 4 times for each were seeded in small culture flasks
parallel with proliferation test and incubated to grow into DMEM/F12 with heat inactivated
5 % FCS, 5 % horse serum and 2 mM L-glutamine at 37 °C, 5 % CO2 in an incubator over
night. For starvation of the cells, serum free-medium was added to PANC-1 cell line and in
the same way, Geneticin in medium 1.5 mg/ml was also added to Mock, NEP and mNEP
clones, then incubated in a humidified atmosphere containing 5 % CO2 at 37 °C in
incubator 72 h.
The cells of one flask from each PANC-1, Mock, wild type NEP and mutated mNEP
clones as 0 h were prepared for cell cycle and the rest were cultured in 5 % FCS medium
for PANC-1 and 5 % FCS medium with Geneticin 1.5 mg/ml for Mock, NEP and mNEP
clones, then incubated in humidified atmosphere containing 5 % CO2 at 37 °C in an
incubator. Every day medium was changed and at target time point 24, 48 and 72 h the
- 31 - Materials and Methods
cells of each flask were prepared for cell cycle analysis. The cells were detached from
flasks by trypsin followed by washing twice with PBS, suspended in 150 µl 0.1 %
glucose/PBS, then 1.5 ml of cold ethanol (-20 °C) as drops was added and gently mixed
to fix the cells. The tubes were kept in refrigerator (4 °C) until performed for cell cycle
analysis. The fixed cells of PANC-1, Mock, NEP and mNEP clones were centrifuged at
1500 rpm for 3 min. The ethanol was discharged from the tubes followed by washing twice
with 1 ml PBS, then centrifuged at 1500 rpm for 3 min. PBS was discharged from the
tubes, the pellet of each tube was suspended in mixture of RNase A 0.02 ml (10 mg/ml)
(Sigma), in PBS and 0.3 ml (100 µg/ml) propidium iodide (Calbiochem, San Diego, CA),
dissolved in PBS, then incubated at 37 °C for 30 min in water bath. The DNA content was
then analyzed by a FACScan flow cytometer using the Cell Quest 3.1 software (Becton
Dickinson) for acquisition and the Mod Fit LT 2.0 software (Verity, Topsham, ME) for
analysis.
2.17 NEP/CD10 activity assay
Enzyme activity of NEP/CD10 was determined according to the method originally
described by Mari et al and modified for microassay.92,93 PA-TU-T, PA-TU-02, HUP-T4,
PANC-1, Mock, wild type and mutated NEP clones, 2x10⁵ cells/50 µl PBS were incubated
in PBS, with or without 10 µm thiorphan (Fluka), or 50 µM amastatin (Sigma) in separate
for 20 min in 96 well microtiter plate (Greiner Bio-one) on shake instrument (Infors AG,
Bottmingen, Germany) at 37 °C, then Suc-Ala-Ala-Phe-pNA substrate (Serva
electrophoresis Gmbh) and aminopeptidase N prepared by PD Dr. med. Dagmar Riemann
(Institute of Medical Immunology, Martin Luther University) were added in a volume of
200 µl (final concentration 1 mM, 0.5 U/ml, respectively) and incubated at 37 °C for
90 min. Optical density was measured at 405 nm using 96 well multiscanner auto reader
(TECAN). NEP/CD10 activity was expressed as the amount of hydrolyzed substrate
(µM/ min/1x106 cells).

- 32 - Materials and Methods
2.18 Cell migration assays
Cell migration is a fundamental function of normal cellular processes, including embryonic
development, angiogenesis, wound healing, immune response and inflammation.
Microporous membrane inserts are widely used for cell migration and invasion assays.
Migration experiments were performed using 10 mm tissue culture inserts with 8.0 µm
polycarbonate membranes (Greiner Bio-one) as described elsewhere with minor
modifications.94 3x10⁵ of PANC-1, Mock, wild type and mutated NEP clones were seeded
twice in 6 well culture plates and incubated to grow into DMEM/F12 with heat inactivated
5 % FCS, 5 % horse serum and 2 mM L-glutamine at 37 °C, 5 % CO2 in an incubator over
night. The growing cells were cultured in serum-free media for 48 h. The cells were
harvested, washed and resuspended in serum-free DMEM/F12. The cells were counted
and 200 µl was added to the upper chambers at concentrations of 2x10⁴ cells/well. Media
in lower chambers contained 1 % FCS. Cells were allowed to migrate at 37 °C for 18 h in
a humidified atmosphere containing 5 % CO2. Cells were washed with cold PBS, for
10 min, then fixed in 100 % methanol (Sigma), for 15 min followed by staining and
visualized with toluidine blue (Merck, Darmstadt, Germany), 0.1 % in 2.5 % sodium
acetate (Carl Roth, Karlsruhe, Germany). No migrated cells on upper side of the
membrane were removed with a cotton swab. Migrated cells attached to the lower side of
the membrane were enumerated using light microscope at 20 x magnification. Each data
point represents the average cell number of five independent microscopic fields from each
experiment. Statistical analyses were performed using an unpaired t-test.
2.19 Transfilter invasion assay
Invasion of adenocarcinoma cells into basement membrane has been used to
characterize involvement of ECM receptors and matrix degrading enzymes which play
roles in adenocarcinoma progression.
PANC-1, Mock, wild type and mutated NEP clones 3x10⁵ were seeded twice in 6 well
culture plates and incubated to grow into DMEM/F12 with heat inactivated 5 % FCS, 5 %
horse serum and 2 mM L-glutamine at 37 °C, 5 % CO2 in an incubator over night. The

- 33 - Materials and Methods
growing cells were cultured in serum-free media for 48 h. Cell culture inserts (Greiner Bio-
one) containing trans well filters with 8 µm pores were precoated on upper surfaces with
laminin 0.2 µg/ml (Sigma) and incubated under sterile bank at RT 2 h followed by 2 %
BSA (Sigma) in PBS to block nonspecific binding for 1 h. During this time, the cells were
harvested, washed and resuspended in serum-free DMEM/F12. The cells were counted,
200 µl of serum-free media containing a total of 1x10⁵ cells/ml of PANC-1, Mock, wild type
and mutated NEP clones were placed in the upper compartment, media in lower
chambers contained 1 % FCS and incubated at 37 °C for 16 h. Cells were washed with
cold PBS for 10 min then fixed in 100 % methanol (Sigma) for 15 min followed by staining
and visualized with toluidine blue (Merck) 0.1 % in 2.5 % sodium acetate (Carl Roth). The
top surface of the filters were wiped to remove all adherent cells. Cells that had migrated
to the lower surface of the filter were quantified by counting the number of cells in five
fields of view per filter, using 20 x magnification.
2.20 Extraction of total protein from cells
Total protein extracts were prepared from cells PANC-1, Mock, wild type and mutated
NEP clones using a protein lyses buffer 0.6 ml containing [20 mM HEPES pH 7.4, 1 %
Trition X-100, 2 mM EGTA (Sigma), 10 % glycerol (Merck), 1 mM DTT (Carl Roth)] and
protease inhibitors leupeptin (2 µg/ml) and pepstatin (1 µg/ml) (Roche) were added just
prior to the addition of lyses buffer to the cells. The tubes were centrifuged at 14.000 rpm
at 4 °C for 15 min. The supernatant which contains the protein was transferred in a new
1.5 ml tube. The protein concentrations in the extracts were quantified using the Bradford
method (Bio-RAD laboratory Gmbh) according to the manufacturer’s instructions. The
protein samples were stored at –20 °C for later analysis.
2.21 Western Blot
Western blot is a method used in molecular biosciences to detect proteins of interest in a
given sample from a mixture of a great number of proteins using specific labeling of the
target proteins with antibodies. Western blotting can give information about the size of

- 34 - Materials and Methods
target protein (with comparison to a size marker or ladder in kDa) and also give
information on protein expression (with comparison to a control such as untreated sample
or another cell type or tissue). An appropriate percentage of SDS-PAGE gel for protein of
interest is used to obtain optimal separation. Typically 10 and 12 % resolving gel is used
at the bottom with a pH 8.8 and a stacking gel (4-5 %) pH 6.8 is used to pack proteins
together after loading was pipetted separately in a mini-Protean II device (Bio-Rad). From
each extract of PANC-1, Mock, wild type and mutated NEP clones, 30 µg of total protein
was mixed with loading buffer (0.04 % bromophenol blue) (3:1) proportionally and
denatured at 95 °C for 5 min. The denatured proteins were loaded in slots of SDS-PAGE
gel, then electrophoresis was performed at 20-40 mA for about 2 h at room temperature.
Proteins are separated according to their mass into bands within each lane depending on
molecular weight of proteins using separating buffer that contained [3 g Tris (Fluka),
14.4 g glycine (Serva electrophoresis), 600 mg SDS (Sigma)] in 1 liter dH2O. After
electrophoresis, separated proteins were transferred to presoaked 0.2 µm PVDF
membranes (Amersham Biosciences, Freiburg, Germany) in methanol. The protein was
blotted using transfer buffer that contained 9 g Tris-HCl, 42 g glycine and 600 ml methanol
in 3 liter dH2O, at 1 A, 6 °C for 2 h using wet mini-Transblot cell, according to
manufacturer’s instructions. After transfer, the separated proteins were visualized using
ponceau stain (Sigma) to determine that proteins have migrated uniformly and evenly for
a few seconds followed by washing with tape water to remove excess stain. Membranes
were blocked in nonfat dry milk or bovine serum albumin dissolved in 1 x TBS-T (14 mM
Tris, 154 mM NaCl, 0.1 % Tween-20, pH 7.5) or 1 x PBS-T (154 mM NaCl, 0.1 % Tween-
20, pH 7.5) at RT for 1 h. Membranes were incubated with primary antibodies (table 7) at
4 °C over night. The membranes were washed in buffer depending on type of buffer used
in blocking, three times, 10 min each. The antigen-antibody complexes were detected on
membranes using the appropriate secondary antibodies conjugated to horseradish
peroxidase (Promega, Madison, WI) at 1:20.000 dilution in buffer for 1-2 h at RT. The
membranes were washed in buffer three times, 10 min each.

- 35 - Materials and Methods
Table 8: Name of antibodies that were used in western blot analysis
Antibody dilution block buffer second Ab. MW
S100A4 (Dianova Gmbh) 1:500 PBS-T + 3 % BSA goat anti rabbit 10 kDa
Rac 1/2/3 (Cell signaling Tech. Inc.) 1:500 TBS-T + 5 % N.F. milk goat anti rabbit 18 kDa
Cdc 42 (Cell signaling Tech. Inc.) 1:500 TBS-T + 5 % N.F. milk goat anti rabbit 18 kDa
Rho A (Cell signaling Tech. Inc.) 1:500 TBS-T + 5 % N.F. milk goat anti rabbit 21 kDa
LIMK 1(Cell signaling Tech. Inc.) 1:500 TBS-T + 5 % N.F. milk goat anti rabbit 60 kDa
Cofilin (Cell signaling Tech. Inc.) 1:500 TBS-T + 5 % N.F. milk goat anti rabbit 18 kDa
phospho-Cofilin (Cell signalingTech. Inc.) 1:500 TBS-T + 5 % N.F. milk goat anti rabbit 18 kDa
ß-Actin (Sigma) 1:10000 PBS-T + 3 % N.F. milk goat anti mouse 45 kDa
Stathmin (Cell signaling Tech. Inc.) 1:1000 TBS-T + 5 % N.F. milk goat anti rabbit 19 kDa
α-Tubuline (Invitrogen) 1:5000 PBS-T + 3 % BSA goat anti mouse 55 kDa
acet.Tubuline (Sigma) 1:5000 PBS-T + 3 % BSA goat anti mouse 55 kDa
GAPDH (Ambion) 1:10000 PBS-T + 3 % N.F. milk goat anti mouse 36 kDa
2.21.1 Protein detection and results evaluation
Membranes were developed using ECL (Enhanced Chemiluminescence's) (Amersham
Pharmacia Biotech). PVDF membrane was dipped in Pierce Western Blotting substrate
Reagents for 1 min. Immunoreactivity was detected by exposing to X-ray film, amersham
Hyper filmTM ECL (GE healthcare limited, Buckinghamshire, UK) in dark room for
appropriate times to detect signal, then developed by immersion the film in developer for
1 min followed by washing step with tape water for few seconds in dark. The film was
immersed in fixer solution (Amersham Pharmacia Biotech) for few minutes followed by
washing step with tape water for few seconds in light, then left to dry. Numeric data were
obtained by densitometry scanning analysis using Kodak Digital science 1D software
(Kodak Digital Science Electrophoresis Documentation and Analysis System 120).
2.21.2 Membrane stripping
Membranes can be reused again to detect additional interesting protein. The membranes
were immersed in stripping buffer pH 2.5 containing [15 g glycine, 0.5 ml tween-20 (Serva
electrophoresis) in 1 liter dH2O] to lose the antibody antigen immunoreactions followed by
washing with TBS-T or PBS-T buffer depending on which antibody will being used next,
three times 10 min each.

- 36 - Materials and Methods
2.22 Statistical analysis
All experiments were reproduced at least three times with different passages of the
pancreatic adenocarcinoma cell lines. The data of NEP/CD10 mRNA and protein
expression levels are presented as mean and statistical analysis was performed using
t-test. P<0.05 was considered statistically significant.

- 37 - Results
3 Results
3.1 Heterogeneous NEP/CD10 expression in different cell lines
3.1.1 NEP/CD10 mRNA expression
In vitro, the expression of NEP/CD10 was analyzed in 9 pancreatic adenocarcinoma cell
lines. The NEP/CD10 mRNA expression of pancreatic adenocarcinoma cell lines was
quantified in the presence of NEP/CD10 standard using a RG2000 cycler as described in
methods (Figure 9). The pancreatic adenocarcinoma cell lines can be subdivided into four
groups (Figure 10): one cell line with a high NEP/CD10 expression (PA-TU-T), one with
intermediate expression (HUP-T4), one with a low expression (HUP-T3) and six cell lines
(PA-TU-S, PA-TU-02, PANC-1, Capan-1, Capan-2 and MIA PaCa-2) where NEP/CD10
expression was not detected.
AA B
1 pg/µl
100 fg/µl
10 fg/µl
1 fg/µl
B
1 pg/µl
100 fg/µl
10 fg/µl
1 fg/µl
CC DD
Fig. 9: Amplification plots of NEP/CD10 standard. A: The melting curve analyses of the standard that is about 82ºC. B: Shows PCR amplification of four serial dilutions of standard as a graph of log fluorescence intensity versus number of PCR cycles. C: Shows the resulting standard curve as a graph of log concentration versus crossing point (1 fg, 10 fg, 100 fg, 1 pg). D: Shows the resulting standard curve and samples as a graph of log concentration versus crossing point.

- 38 - Results
0
10
20
30
40
50
60
PA-TU-T
HUP-T4
HUP-T3
PA-TU-S
PA-TU-02
PANC-1
Capan
-1
Capan
-2
MIA P
aCa-2
CD
10 m
RN
A e
xpre
ssio
n in
fg/µ
g R
NA
Fig. 10: Expression of NEP/CD10 mRNA. The RNA of examined pancreatic
adenocarcinoma cell lines was isolated, cDNA was prepared as described in materials and methods . NEP/CD10 mRNA expression was quantified using real time-PCR.
3.1.2 NEP/CD10 protein expression
NEP/CD10 protein immunoreactive on the cell surface membranes of 9 pancreatic
adenocarcinoma cell lines was measured by flow cytometry as described previously.
NEP/CD10 protein expression was similar to the NEP/CD10 mRNA expression data
(Figure 11). Regarding NEP/CD10 protein expression on the cell membranes of the cell
lines, the tested pancreatic adenocarcinoma cell lines were subdivided into four groups:
one cell line with a high NEP/CD10 expression (PA-TU-T), one with intermediate
expression (HUP-T4), one with a low expression (HUP-T3) and six cell lines (PA-TU-S,
PA-TU-02, PANC-1, CAPAN-1, CAPAN-2 and MIA PaCa-2) where NEP/CD10 expression
was not detected.
0
20
40
60
80
100
120
140
PA-TU-T
HUP-T4
HUP-T3
PA-TU-S
PA-TU-02
PANC-1
Capan
-1
Capan
-2
MIA P
aCa-2C
D10
pro
tein
exp
ress
ion
in M
FI
Fig. 11: NEP/CD10 protein expression. The pancreatic adenocarcinoma cell lines were reacted
with anti-NEP/CD10 as described above and NEP/CD10 protein immunoreactive on the cell surface membranes of pancreatic adenocarcinoma cell lines was performed by flow cytometry.

- 39 - Results
3.1.3 NEP/CD10 enzyme activity
NEP/CD10 enzyme activity of pancreatic adenocarcinoma cell lines, PA-TU-T, PA-TU-02,
HUP-T4 and PANC-1 was measured. From the result there is relation between protein
expression and enzyme activity. PA-TU-T that expresses high NEP/CD10 protein also has
high enzyme activity, HUP-T4 that expresses middle NEP/CD10 protein also has middle
enzyme activity. Whereas on the other side both cell lines PA-TU-02, PANC-1 have
neither NEP/CD10 protein expression nor enzyme activity (Figure 12). The NEP/CD10
enzyme activity in these cell lines was at the most inhibited by pretreatment with 10mM
thiorphan a specific inhibitor of NEP/CD10. Furthermore 50mM amastatin, a specific
inhibitor of CD13/APN also reduced enzyme activity of examined cell lines.
0
2
4
6
8
10
12
14
PA-TU
-T
HUP-T4
PA-TU
-02
PANC-1
Enzy
me
activ
ity [µ
M/m
in] 1mM Substrate
10µM Thiorphan50µM Amastatin
Fig. 12: NEP/CD10 enzyme activity. Characterization of the enzymatic activities responsible for
the release of paranitroaniline from Suc-Ala-Ala-Phe-pNA. Total cell number of PA-TU-T, HUP-T4,PA-TU-02 and PANC-1 (2x10(5)/50 µl) were incubated at 37°C with 1 mM Suc-Ala-Ala-Phe-pNA as substrate in the presence of exogenously added aminopeptidase N. Enzymatic activity was determined in presence or absence of 10 µM thiorphan or 50 µM amastatine as described in Materials and methods.
3.2 NEP/CD10 promoters and methylation status
Methylation status of NEP/CD10 promoters in examined pancreatic adenocarcinoma cell
lines was obtained using MSP method. The methylation status of the two promoters was
variable in examined cell lines (Figure 13).

- 40 - Results
M U M UM U M U M U
M U UM U M U M UCapan-1 - MIA Paca-2 Pos. con.
Promoter 2
PANC-1
U
MCapan-2
Promoter 1
Promoter 1
Promoter 2
M
HUP-T4 HUP-T3 PA–TU-S PA–TU-02 PA–TU-T M M U M UM U M U M U
M U UM U M U M UCapan-1 - MIA Paca-2 Pos. con.
Promoter 2
PANC-1
U
MCapan-2
Promoter 1
Promoter 1
Promoter 2
M
HUP-T4 HUP-T3 PA–TU-S PA–TU-02 PA–TU-T M
Fig.13: Methylation status of two NEP/CD10 promoters: DNA of examined pancreatic
adenocarcinoma cell line was treated with sodium bisulfite and PCR was evaluated using MSP technique as described in materials and methods. M= methylated; U= unmethylated
As shown more detailed in table 9, promoter 1 was hemimethylated (one allel was
methylated and the other not methylated) in all examined cell lines PA-TU-T, HUP-T4,
HUP-T3, PA-TU-S, PATU-T-02, PANC-1, Capan-1, Capan-2 and MIA Paca-2,
furthermore promoter 2 was hypermethylated (both allels are methylated) in MIA Paca-2,
hemimethylated in HUP-T4, PATU-T-02 and PANC-1, others were unmethylated, in
PA-TU-T, HUP-T3, PA-TU-S, Capan-1 and Capan-2.
Table 9:The distribution of NEP/CD10 promoters methylation
Cell lines Promoter 1 Promoter 2 methylated hemimethylated unmethylated methylated hemimethylated unmethylated
PA-TU-T HUP-T4 HUP-T3 PA-TU-S PA-TU-02 PANC-1 Capan-1 Capan-2 MIA Paca-2

- 41 - Results
3.3 NEP/CD10 regulation on pancreatic carcinoma cell lines
3.3.1 Regulation of NEP/CD10 mRNA expression
The influence of either histone acetylation and promoter demethylation reagents on the
NEP/CD10 mRNA expression of pancreatic adenocarcinoma cell lines was assessed by
Real Time-PCR. NEP/CD10 mRNA expression of PA-TU-T and HUP-T4 cell lines was
slightly up-regulated after stimulation with 1 µM 5-aza-2-deoxycytidine, while 2 mM butyric
acid (BA) and valproic acid (VPA) induced more than 1.5 fold NEP/CD10 mRNA
expression (Figure 14) (P<0.05). In contrast, the same reagents could not induce the
NEP/CD10 mRNA expression in PA-TU-S, PA-TU-02, PANC-1 and MIA PaCa-2 cell lines
(data not shown).
0.00E+005.00E-011.00E+001.50E+002.00E+002.50E+003.00E+003.50E+00
PA-TU-T
1 µM 5-
aza.
2 mM B
A
2 mM V
PA
HUP-T4
1 µM 5-
aza.
2 mM B
A
2 mM V
PA
CD
10 m
RN
A e
xpre
ssio
n (c
on.=
1.00
)
**
* * * *
Fig. 14: NEP/CD10 mRNA expression: PA-TU-T and HUP-T4 were stimulated with 1 µM 5-aza-
2-deoxycytidine (5-aza.), 2 mM butyric acid (BA) and 2 mM valproic acid (VPA) as described in materials and methods. RNA was isolated, then cDNA was transcribed and NEP/CD10 mRNA expression was quantified using real time-PCR.
3.3.2 Regulation of NEP/CD10 protein expression
The investigated cell lines were incubated with suitable concentrations of histone
acetylation and promoter demethylation reagents. At the end of incubation time, cells were
labelled with anti-CD10 antibody or with isotype control. Intensity of membrane NEP/CD10
expression was determined by means of flow cytometry. The NEP/CD10 protein
expression was slightly up-regulated after stimulation with 1 µM 5-aza-2-deoxycytidine on
PA-TU-T and HUP-T4 (Figure 15) cell lines, while 2 mM butyric acid (BA) and valproic

- 42 - Results
acid (VPA) induced more than 1.5 fold NEP/CD10 protein expression. In contrast, the
same reagents could not induce the NEP/CD10 protein expression in PA-TU-02, PANC-1
PA-TU-S and MIA PaCa-2 cell lines (data not shown).
0
50
100
150
200
250
PA-TU-T
1 µM 5-
aza.
2 mM B
A
2 mM V
PA
HUP-T4
1 µM 5-
aza.
2 mM B
A
2 mM V
PA
CD
10 p
rote
in e
xpre
ssio
n in
MFI
* *
* *
Fig. 15: NEP/CD10 protein expression: PA-TU-T and HUP-T4 were stimulated with 1 µM 5-aza-2-
deoxycytidine (5-aza.), 2 mM butyric acid (BA) and 2 mM valproic acid (VPA) as described in materials and methods. Protein NEP/CD10 expression on cell membrane of cell lines was quantified using flow cytometry as MFI.
3.4 Transfection and NEP/CD10 expression on PANC-1 clones
3.4.1 NEP/CD10 mRNA over expression upon gene transfection
PANC-1 cell line was transfected with plasmids, pEGFP-C3 (Mock) alone or with insert
encoding the CDS of wild type or mutated NEP. NEP/CD10 mRNA expression in PANC-1,
Mock, NEP and mNEP clones was obtained using a RG2000 Cycler. NEP/CD10 mRNA
expression in each NEP and mNEP clones was heterogeneous (Figure 16), that means in
comparison to PANC-1, NEP/CD10 mRNA expression in wild type NEP clones was
increased ~14 fold in NEP CL1 and ~64 fold in NEP CL2, whereas in mutated mNEP
clones, NEP/CD10 mRNA expression was ~3 fold in mNEP CL1 and ~10 fold in mNEP
CL2, statistically significant (< 0.05).

- 43 - Results
0,00E+001,00E+012,00E+013,00E+014,00E+015,00E+016,00E+017,00E+018,00E+01
PANC-1Mock
Mock
NEP CL1
NEP CL2
mNEP CL1
mNEP CL2
CD
10 m
RN
A e
xpre
ssio
n (c
on.=
1.00
)
* * **
* *
* * *
Fig.16: NEP/CD10 mRNA expression: Cellular RNA was isolated, then cDNA was
transcribed, and NEP/CD10 mRNA expression in PANC-1, Mock, NEP and mNEP clones was quantified using Real Time-PCR.
3.4.2 NEP/CD10 protein over expression upon gene transfection
The NEP/CD10 protein expression on the cell surface membranes of PANC-1, Mock, wild
type and mutated NEP clones was investigated using flow cytometry. As can be seen in
figure 17, NEP/CD10 protein expression was heterogeneous in wild type NEP and
mutated mNEP clones, that means in comparison to PANC-1, NEP/CD10 protein
expression in wild type NEP clones was increased ~16 fold in NEP CL1 and ~66 fold in
NEP CL2. Moreover in mutated mNEP clones, NEP/CD10 protein expression was
augmented ~6 fold in mNEP CL1 and ~21 fold in mNEP CL2. Statistical significance was
at the P≤ 0.05 level. This result is in good correlation to the mRNA expression of both the
types of transfectants.

- 44 - Results
PANC-1 PANC-1 Mock Mock
NEP CL1 NEP CL1 NEP CL2 NEP CL2
mNEP CL1 mNEP CL1 mNEP CL2 mNEP CL2
0
200
400
600
800
1000
1200
PANC-1Mock
Mock
NEP CL1
NEP CL2
mNEP CL1
mNEP CL2
CD
10 p
rote
in e
xpre
ssio
n in
MFI
* * *
* * *
* * *
* * *
Fig. 17: The expression of NEP/CD10 protein: PANC-1, Mock, NEP and mNEP clones were
immunoreacted with mab NEP/CD10 as described in materials and methods. NEP/CD10 protein expression on PANC-1, Mock, NEP and mNEP clones was quantified using flow cytometry (upper panel) and given in graphic as MFI (lower panel).
3.5 Immunofluorescence and localization of NEP/CD10
Localization pattern of the NEP/CD10 on pancreatic adenocarcinoma cell line PANC-1,
Mock, wild type and mutated NEP clones was assessed. The immunoreaction distribution
showed a general staining of whole plasma membrane as well as a positive
immunoreaction of cytoplasm (Figure 18). Since pancreatic adenocarcinoma cell line
PANC-1 was transfected with pEGFP-C3 plasmid, that express green fluorescence

- 45 - Results
protein in transfected cell line. The green fluorescent dye (Figure 18A) was distributed
over all the investigated cells (Mock), on the other side, on NEP and mNEP clones, the
green fluorescent dye was localized on the plasma membranes of the examined cells
(Figure 18B). After staining PANC-1, Mock, wild type and mutated NEP clones with
NEP/CD10 indirect PE-fluorescent Ab, no NEP/CD10 immunoreactive was observed on
PANC-1 and Mock (negative data not shown), but on the other side on wild type NEP and
mutated mNEP clones was found a strong immunoreaction on the plasma membrane and
in the cytoplasm. NEP/CD10 was localized on the plasma membranes and distributed in
the cytoplasm of the cells (Figure 18C). Since the CDS of NEP/CD10 was coupled with
CDS of green fluorescence protein in NEP clones, two filters were used (Figure 18D) to
confirm that NEP/CD10 antibody react specifically with NEP/CD10 protein, that coupled
with green fluorescence protein.
Fig. 18: Immunofluorescence localization of NEP/CD10: PANC-1, Mock, NEP and
mNEP clones were cultured on glass slides, then immunoreacted with mab NEP/CD10 as described in materials and methods. NEP/CD10 localization on PANC-1, Mock, NEP and mNEP clones was photographed using fluorescent microscope. Mock shows green fluorescent dye distribution over all the cells (A). NEP and mNEP clones show green fluorescent dye localized on plasma membrane, and cytoplasm (B). NEP and mNEP clones show a strong immunoreactions on plasma membrane and cytoplasm (C). Two filters were used to confirm that immunoreactions are specific for NEP/CD10 coupled with green fluorescence protein (D).

- 46 - Results
3.6 NEP/CD10 enzyme activity assay
In order to find out whether NEP/CD10 protein expression was associated with enzyme
activity, NEP/CD10 enzyme activity was examined by assessing the hydrolysis of
succinyl-Ala-Ala-Phe-p-nitroanilide in total of 2x10⁵ cells of PANC-1, Mock, wild type NEP
and mutated mNEP clones in absence or presence of 10 mM thiorphan or 50 mM
amastatin for 90 min. At the end of incubation time, the enzyme activity of NEP/CD10 was
measured using multi reader spectrophotometer suitable for 96 wells plate. As shown the
high NEP/CD10 expressing NEP CL2 clone also exhibited a high level of enzyme activity
(1000 %) comparing to PANC-1, whereas the moderate NEP/CD10 expressing NEP CL1
clone showed also moderate enzyme activity (800 %). Furthermore, mutated NEP clones,
that have mutation in enzyme active site of NEP/CD10 had very low enzyme activity.
These results demonstrated that the cell surface expression levels of NEP/CD10 were
correlated with enzymatic activity. The NEP/CD10 activity in these cell lines was at the
most inhibited by pretreatment with 10 mM thiorphan a specific inhibitor of NEP/CD10, the
significant enzyme reduction was (91 %, 78 %) in wild type NEP CL1, NEP CL2,
respectively. Furthermore 50 mM amastatin a specific inhibitor of CD13/APN also reduced
enzyme activity (46 %, 39 %) in wild type NEP CL1, NEP CL2 respectively (Figure 19).
Fig. 19: Enzyme activity of NEP/CD10: Characterization of the enzymatic activities responsible for the
release of paranitroaniline from Suc-Ala-Ala-Phe-pNA. Total cell number of PANC-1, Mock, NEP, and mNEP clones (2x10⁵/50 µl) were incubated at 37 °C with 1 mM Suc-Ala-Ala-Phe-pNA as substrate in the presence of exogenously added aminopeptidase N. Enzymatic activity was determined in presence or absence of 10 µM thiorphan or 50 µM amastatin as described in materials and methods.
05
1015
20253035
PANC-1Moc
kMoc
k
NEP CL1
NEP CL2
mNEP CL1
mNEP CL2
Enzy
me
activ
ity [µ
M/m
in] 1 mM Substrate
10 µM Thiorphan
50 mM Amastatin* * ** * *

- 47 - Results
3.7 NEP/CD10 and cell lines proliferation assay
The proliferation rate and cell viability of PANC-1, Mock, wild type NEP and mutated
mNEP clones were determined by MTT test every day (0, 24, 48, 72 h). Compared to
PANC-1, a proliferation arrest effect was observed on either wild type NEP CL1 and 2 but
only marginally on mutated mNEP CL1 and 2 clones. The reduced proliferate activity was
readily apparent in NEP CL1 and 2, the reduction rate from 0-72 h was 24-28 % and
30-44 % respectively. This diminshed rate is the same at all time points (0-72 h).
However, in mutated clones, mNEP CL1 and 2 the impaired proliferate activity was only
marginally, the inhibition rate from 0-72 h was 0-19 % and 0-12 % respectively
(Figure 20). The result was significant at all measuring time point 0-72 h (p ≤ 0.001) of
wild type NEP CL1 and 2.
0.0000.1000.2000.3000.4000.5000.6000.7000.8000.9001.000
PANC-1Mock
Mock
NEP CL1
NEP CL2
mNEP CL1
mNEP CL2
MTT
test
in O
D
0h 24h 48h 72h
*** ***
Fig. 20: Proliferation rate: Effect of NEP/CD10 on cell proliferation was examined using NEP/CD10
transfected PANC-1 adenocarcinoma cell line. The proliferation rate of PANC-1, Mock, NEP and mNEP clones was analyzed as described in Materials and Methods (p ≤ 0.001).
3.8 Cell cycle analysis by flow cytometry
In the same time of measurement the cells proliferation rate, the cells were prepared for
cell cycle to confirm proliferation rate result. The fixed cells were stained with PI, cell cycle
phase was assayed by flow cytometry in parallel with proliferation analysis after
synchronizing the cultured cells three days in serum free-medium as 0 h followed by

- 48 - Results
medium supplement with 5 % FCS for 24, 48 and 72 h. Histogram content of G0-G1, S-
and G2/M phase distribution in PANC-1, Mock, NEP clones was presented (Figure 21A).
Fig. 21A: Cell cycle: Histogram content of G0-G1-, S- and G2/M phase distribution in PANC-1, Mock wild type and mutated NEP clones where the cells left three days in serum-free medium, followed by medium supplements with 5 % FCS for 24 h. Cell cycle of PANC-1 and clones was analyzed.
The mean of three times cell cycle results was obtained. In 0 h where the cells left to grow
three days in serum free medium (Table 10), comparing to PANC-1 that has a markedly
induced G2/M accumulation in the cells of 36.1 %, the rates of G2/M phase were 10.3 %
in mock, 10.9 % in mock, 1.7 % in NEP CL1, 4.3 % in NEP CL2, 10.7 % in mNEP CL1
and 5.6 % in mNEP CL2 (P<0.05). The rate of S phase distribution was 13.4 % in PANC-
1, 12.2 % in mock, 13.9 % in mock, 21.4 % in NEP CL1, 26.2 % in NEP CL2, 26.0 % in
mNEP CL1 and 21.8 % in mNEP CL2. The rates of G0/G1 phase were 50.5 % in PANC-1,
Mock
G0-
G1
S G2-
M
MockMock
G0-
G1
S G2-
M
NEP CL1
G0-
G1
S G2-
M
NEP CL1
G0-
G1
S G2-
M
m NEP CL1
G0-
G1
S G2-
M
m NEP CL1
G0-
G1
S G2-
MG0-
G1
S G2-
M
m NEP CL2
G0-
G1
S G2-
M
m NEP CL2
G0-
G1
S G2-
M
PANC-1G
0-G
1
S G2-
M
PANC-1G
0-G
1
S G2-
M
NEP CL2
G0-
G1
S G2-
M
NEP CL2
G0-
G1
S G2-
M

- 49 - Results
77.5 % in mock, 75.2 % in mock, 76.9 % in NEP CL1, 69.5 % in NEP CL2, 63.6 % in
mNEP CL1 and 72.6 % in mNEP CL2 (Figure 21B).
Table 10: Cell cycle distribution of PANC-1 and clones at 0h (after 3 days starvation).
0 h PANC-1 Mock Mock NEP CL1 NEP CL2 mNEP CL1 mNEP CL2
G0-G1 50.5 ± 0.9 77.5 ± 1.6 75.2 ± 4.2 76.9± 1.7 69.5± 9.2 63.6 ± 1.4 72.6 ± 2.7
S 13.4 ± 1.7 12.2 ± 0.5 13.9 ± 3.0 21.4 ± 1.2 26.2± 4.9 26.0 ± 3.2 21.8 ± 3.4
G2-M 36.1± 2.6 10.3 ± 1.8 10.9 ± 1.2 1.7 ± 2.1 4.3± 4.7 10.4± 4.5 5.6± 6.1
0%
20%
40%
60%
80%
100%
120%
PANC-1
Mock
Mock
NEP
CL1
NEP
CL2
mNEP
CL1
mNEP
CL2
Cel
l cyc
le p
hase
in %
G0-G1 S G2-M
Fig. 21B: Cell cycle: The cells of PANC-1, Mock and clones were synchronized three days in serum
free medium (0h), then the fixed cells were stained with PI. The cell cycle distribution (G0-G1-, S- and G2/M phase) was analyzed using flow cytometer, mean ± SD.
Furthermore, in 24 h where the cells left to grow one day in medium supplements with 5 %
FCS (Table 11), comparing to PANC-1 G2/M accumulation in the cells were 30.3 %, while
the rates of G2/M phase were 20.4 % in mock, 20.5 % in mock, 4.4 % in NEP CL1,
13.0 % in NEP CL2, 17.0 % in mNEP CL1 and 16.5 % in mNEP CL2 (P<0.05).
Furthermore, the rate of S phase distribution was 35.9 % in PANC-1, 36.0 % in mock,
50.1 % in mock, 51.2 % in NEP CL1, 43.6 % in NEP CL2, 37.2 % in mNEP CL1 and
26.9 % in mNEP CL2. The rates of G0/G1 phase were 33.8 % in PANC-1, 43.6 % in
mock, 29.4 % in mock, 44.4 % in NEP CL1, 43.4 % in NEP CL2, 45.8 % in mNEP CL1
and 56.6 % in mNEP CL2. The result demonstrated maximal G2/M accumulation in
PANC-1, but in other side demonstrated minimal G2/M accumulation in NEP CL1,2 clones
(Figure 21C).

- 50 - Results
Table 11: Cell cycle distribution of PANC-1 and clones at 24h (after 1 day 5% FCS).
24 h PANC-1 Mock Mock NEP CL1 NEP CL2 mNEPCL1 mNEP CL2
G0-G1 33.8 ± 0.9 43.6 ± 6.0 29.4 ± 0.4 44.4± 1.7 43.4± 5.5 45.8± 4.0 56.6 ± 1.8
S 35.9 ± 7.6 36.0 ± 5.6 50.1 ± 7.7 51.2± 1.2 43.6± 3.6 37.2± 4.1 26.9 ± 8.6
G2-M 30.3 ± 7.4 20.4±11.4 20.5± 7.6 4.4 ± 2.1 13.0± 8.4 17.0± 7.3 16.5±10.0
0%
20%
40%
60%
80%
100%
120%
PANC-1
Mock
Mock
NEP
CL1
NEP
CL2
mNEP
CL1
mNEP
CL2
Cel
l cyc
le p
hase
in %
G0-G1 S G2-M
Fig. 21C: Cell cycle: The cells of PANC-1, Mock and clones were synchronized three days in serum with PI and the cell cycle distribution (G0-G1-, S- and G2/M phase) was analyzed using flow cytometer, mean ± SD.

- 51 - Results
3.9 NEP/CD10 expression and cell migration
The effect of NEP/CD10 expression on cell migration was analyzed using 10 mm cell
culture inserts with 8.0 µm pores containing polycarbonate membranes. Over expression
of NEP/CD10 decreased the migration rate of wild type NEP clones. The most reduced
migration rate was found with NEP CL2 80 %, NEP CL1 60 % (P<0.01). Furthermore, on
the other side the cell migration rate of mutated clones was slightly or not reduced: mNEP
CL2, 30 %, but mNEP CL1 a reduced migration rate was not observed (Figure 22).
PANC-1PANC-1 NEP CL 1NEP CL 1
NEP CL 2NEP CL 2 m NEP CL 1m NEP CL 1 m NEP CL 2m NEP CL 2
0
20
40
60
80
100
120
PANC-1Mock
Mock
NEP CL1
NEP CL2
mNEP CL1
mNEP CL2
Mig
ratio
n as
say
in %
* * *
* * *
* * *
Fig. 22: The migration assay: Effect of NEP/CD10 on cell migratory potential was examined
using NEP/CD10 transfected PANC-1 adenocarcinoma cell line. The cell migration of PANC-1, Mock, NEP and mNEP clones was photographed (upper panel) and analyzed in percentage as described in Materials and Methods (lower panel) (P < 0.01).
MockMock

- 52 - Results
3.10 NEP/CD10 expression and cell invasion
The effect of NEP/CD10 expression on cell invasion was analyzed using 10 mm tissue
culture inserts with 8.0 µm pores polycarbonate membranes coated with laminin. The
invasion rate was decreased in over expressed NEP/CD10 clones (Figure 23) NEP CL1
and NEP CL2. The most reduced invasion rate was on NEP CL2 60 %, then NEP CL1
40 % (P<0.01). Furthermore, on the other side the cell invasion rate of mutated clones
was slightly or not reduced. However, the reduced invasion rate was on mNEP CL2 20 %,
while on mNEP CL1 the reduced invasion rate was not observed. These result are
identical to the ones of the migration assay.
PANC-1PANC-1 MockMock NEP CL 1NEP CL 1
NEP CL 2NEP CL 2 m NEP CL 1m NEP CL 1 m NEP CL 2m NEP CL 2
020406080
100120140
PANC-1Mock
Mock
NEP CL1
NEP CL2
mNEP CL1
mNEP CL2
Inva
sion
ass
ay in
%
* * ** * *
* * *
Fig. 23: The invasion assay: Effect of NEP/CD10 on cell invasion was examined using NEP/CD10
transfected PANC-1 adenocarcinoma cell line. The cells invasion of PANC-1, Mock, NEP and mNEP clones was photographed (upper panel) and analyzed in percentage as described in Materials and Methods (lower panel).

- 53 - Results
3.11 Microarray gene expression analysis
To obtain the number of up- and down-regulated genes related with biological cell
mechanisms, as proliferation, adhesion, migration etc, the microarray data of PANC-1 and
NEP CL2, were evaluated against Mock. The data of Affymetrix were transformed to Excel
data. To illustrate the Affymetrix data, the signals were classified in present (P), absent (A)
or marginal (M). The signal log ratios provide strong hybridization differences between the
probes of both chips. The data were exploited using Eva program. The transcript profiles
data shown in figure 24A represents the signal of NEP CL2 vs. Mock, where slope was
(1.042). The graphic in figure 24B represents the number and interval of up-regulated
genes given in red color, whereas the number and interval of down-regulated genes is
shown in green color. The microarray data where ordered in a table as a general overview
to represent the total number and interval of down- and up-regulated genes (Figure 24C).
A
B
C
Signal of control
Sig
nal o
f Exp
erim
ent
Slope = 1.042 I000000
9 9 92 3 71 4 81 2 38 15 8
i n t e r v a l D( - ? , - 2 0 ] 9 9( - 2 0 , - 1 0 ] 1 0 2( - 1 0 , - 6 ] 1 1 0( - 6 , - 4 ] 1 7 3( - 4 , - 3 ] 1 9 8( - 3 , - 2 ] 6 9 4[ 2 , 3 ) 0[ 3 , 4 ) 0[ 4 , 6 ) 0[ 6 , 1 0 ) 0[ 1 0 , 2 0 ) 0[ 2 0 , ? ) 0
I000000
9 9 92 3 71 4 81 2 38 15 8
i n t e r v a l D( - ? , - 2 0 ] 9 9( - 2 0 , - 1 0 ] 1 0 2( - 1 0 , - 6 ] 1 1 0( - 6 , - 4 ] 1 7 3( - 4 , - 3 ] 1 9 8( - 3 , - 2 ] 6 9 4[ 2 , 3 ) 0[ 3 , 4 ) 0[ 4 , 6 ) 0[ 6 , 1 0 ) 0[ 1 0 , 2 0 ) 0[ 2 0 , ? ) 0
I000000
9 9 92 3 71 4 81 2 38 15 8
i n t e r v a l D( - ? , - 2 0 ] 9 9( - 2 0 , - 1 0 ] 1 0 2( - 1 0 , - 6 ] 1 1 0( - 6 , - 4 ] 1 7 3( - 4 , - 3 ] 1 9 8( - 3 , - 2 ] 6 9 4[ 2 , 3 ) 0[ 3 , 4 ) 0[ 4 , 6 ) 0[ 6 , 1 0 ) 0[ 1 0 , 2 0 ) 0[ 2 0 , ? ) 0
Fig. 24: Microarray data: NEP CL2 vs Mock that as signal in (A), number of decreased (D) in green clolour,
and increased (I) genes in red colour as graphic in (B) and table where the total number of decreased (D) and increased (I) genes in interval (C).

- 54 - Results
3.11.1 Differential gene transcriptions
To verify the microarray data of NEP CL2 vs. Mock, a number of target up- and down-
regulated genes were selected. These genes are related to essential biological
mechanisms belonging to cell cycle regulation, motility, invasion etc. These data were
classified in two tables, one of them (Table 12), includes the up regulated genes of
NEP/CD10 (MME) that increased about 10 fold compared to Mock.
Table 12: Genes that positively correlate with NEP/CD10
Gene probe Gene symbol Increase fold Gene name
203434_s_at MME 9.96 membrane metallo-endopeptidase
200951_s_at CCND2 2.62 cyclin D2
205411_at STK4 2.88 serine threonine kinase 4
222595_s_at DATF1 3.06 death associated transcription factor 1
203680_at PRKAR2B 3.33 protein kinase, cAMP-dependent, regulatory, type II, beta
220334_at RGS17 2.02 regulator of G-protein signalling 17
213418_at HSP70B 2.21 heat shock 70 kDa protein 6
203896_s_at PLCB4 2.29 phospholipase C, beta 4
203037_s_at MTSS1 1.53 metastasis suppressor 1
202896_s_at SIRPA 1.58 signal-regulatory protein alpha
201996_s_at SPEN 1.58 transcriptional regulator
205376_at INPP4B 1.60 inositol polyphosphate-4-phosphatase, type II
205659_at HDAC9 1.71 histone deacetylase 9
204420_at FOSL1 1.81 FOS-like antigen 1
209457_at DUSP5 1.93 dual specificity phosphatase 5
The second table includes a number of down regulated genes that have also a relation
with pivotal cell mechanisms like GTPase regulator, S100, Rho, Cdc42 and LIM, where all
of them were down regulated compared to Mock (Table 13).

- 55 - Results
Table 13: Genes that negatively correlate with NEP/CD10
Gene probe Gene symbol decrease fold Gene name
201508_at IGFBP4 -4.89 insulin-like growth factor-binding protein 4
205069_s_at FAK -4.55 GTPase regulator associated with the focal adhesion kinase pp125
204351_at S100P -4.33 S100 calcium-binding protein P
204989_s_at ITGB4 -3.17 integrin, beta 4
222853_at FLRT3 -3.10 fibronectin leucine rich transmembrane protein 3
204731_at TGFBR3 -2.97 transforming growth factor, beta receptor III
218693_at tetraspan NET-7 -2.94 transmembrane 4 superfamily member
206544_x_at SMARCA2 -2.88 SWISNF related, matrix associated, actin dependent regulator of chromatin, subfamily amember 2
223467_at AGS1 -2.48 activator of G protein signaling
205880_at PRKCM -2.13 protein kinase C, mu
208510_s_at PPARG -2.13 peroxisome proliferative activated receptor, gamma
203256_at CDH3 -2.08 cadherin 3, type 1, P-cadherin
201069_at MMP2 -3.17 matrix metalloproteinase 2
201850_at CAPG -2.51 capping protein (actin filament), gelsolin-like
211559_s_at CCNG2 -2.40 cyclin G2
201331_s_at STAT6 -2.29 signal transducer and activator of transcription 6
203758_at CTSO -2.28 cathepsin O
202729_s_at LTBP1 -2.07 latent transforming growth factor beta binding protein 1
203657_s_at CTSF -1.47 cathepsin F
227628_at (GEF) 1 -1.22 Rho guanine nucleotide exchange factor
218062_x_at CEP4 -1.09 Cdc42 effector protein 4; binder of Rho GTPases 4
224352_s_at CFL -0.31 cofilin isoform 1
200618_at LASP1 -0.56 LIM and SH3 protein 1
204338_s_at RGS4 -3.43 regulator of G-protein signaling 4
215111_s_at TSC-22 -2.09 transforming growth factor beta-stimulated protein
200965_s_at ABLIM -1.15 actin binding LIM protein 1
209539_at GEF -1.37 RacCdc42 guanine exchange factor
209040_s_at allele LMP7B -1.45 proteasome subunit LMP7
208829_at NGS-17 -0.97 tapasin

- 56 - Results
3.11.2 Validation of microarray data result
3.11.2.1 mRNA expression
To explore the microarray data of NEP CL2 vs. Mock, mRNA expression of S100A4,
Rac1, Rho A, Cdc42 and LIMK1 in PANC-1, Mocks, wild type and mutated NEP clones
was quantified using Real Time-PCR. Here, the result of S100A4 mRNA expression is
presented in figure 25. Regarding to PANC-1, S100A4 mRNA expression was highly
reduced in all, Mocks, wild type and mutated NEP clones. But on the other side,
compared with Mock, S100A4 mRNA expression was also reduced in wild type and
mutated NEP clones.
0.00E+002.00E-014.00E-016.00E-01
8.00E-011.00E+001.20E+00
PANC-1Mock
Mock
NEP CL1
NEP CL2
mNEP CL1
mNEP CL2
S100
A4
mR
NA
exp
ress
ion
(con
.=10
0)
*** *** *** ***
Fig. 25: S100A4 mRNA expression: Total RNA was isolated, then cDNA was transcribed and
S100A4 mRNA expression in PANC-1, Mock, NEP and mNEP clones was quantified using Real Time-PCR. Con. is PANC-1.
3.11.2.2 Protein expression
To control the mRNA expression of genes related to pivotal cell mechanisms, protein
expression in PANC-1, Mocks, wild type and mutated NEP clones was also investigated.
Western blot was performed to target proteins that induce signal transduction where by
promote proliferation, motility and invasion of the tumor cells like S100A4, Rac1/2/3,
Cdc42, Rho A, LIMK1, Cofilin, phospho-Cofilin, Stathmin, α-Tubulin and acetylated-
Tubulin. Generally comparing to PANC-1, all the examined GTPase proteins were clearly
down regulated in wild type NEP CL1,2 clones (Figure 26).

- 57 - Results
Stathmin 19 kDa
45 kDaß-Actin
Rac1/2/3
S100A4
ß-Actin
18 kDa
21 kDa
45 kDa
Cdc42
ß-Actin
21 kDa
45 kDa
Rho A
ß-Actin
21 kDa
45 kDa
LIMK 1
ß-Actin
70 kDa
45 kDa
Cofilin
ß-Actin
19 kDa
45 kDa
p-Cofilin
ß-Actin
19 kDa
45 kDa
mNEP
CL 1
mNEP
CL 2
Acet.-Tubulin
GAPDH
α-Tubulin
GAPDH
55 kDa
36 kDa
55 kDa
36 kDa
PANC-1
Mock
Mock
NEP C
L1NEP
CL
2
FTC-1
33
PA-T
U-T
Marke
r
Stathmin 19 kDa
45 kDaß-Actin
Stathmin 19 kDa
45 kDaß-Actin
Rac1/2/3
S100A4
ß-Actin
18 kDa
21 kDa
45 kDa
Rac1/2/3
S100A4
ß-Actin
18 kDa
21 kDa
45 kDa
Cdc42
ß-Actin
21 kDa
45 kDa
Cdc42
ß-Actin
21 kDa
45 kDa
Rho A
ß-Actin
21 kDa
45 kDa
Rho A
ß-Actin
21 kDa
45 kDa
LIMK 1
ß-Actin
70 kDa
45 kDa
LIMK 1
ß-Actin
70 kDa
45 kDa
Cofilin
ß-Actin
19 kDa
45 kDa
Cofilin
ß-Actin
19 kDa
45 kDa
p-Cofilin
ß-Actin
19 kDa
45 kDa
p-Cofilin
ß-Actin
19 kDa
45 kDa
mNEP
CL 1
mNEP
CL 2
Acet.-Tubulin
GAPDH
α-Tubulin
GAPDH
55 kDa
36 kDa
55 kDa
36 kDa
PANC-1
Mock
Mock
NEP C
L1NEP
CL
2
FTC-1
33
PA-T
U-T
Marke
r
mNEP
CL 1
mNEP
CL 2
Acet.-Tubulin
GAPDH
α-Tubulin
GAPDH
55 kDa
36 kDa
55 kDa
36 kDa
PANC-1
Mock
Mock
NEP C
L1NEP
CL
2
FTC-1
33
PA-T
U-T
Marke
r
Acet.-Tubulin
GAPDH
α-Tubulin
GAPDH
55 kDa
36 kDa
55 kDa
36 kDa
PANC-1
Mock
Mock
NEP C
L1NEP
CL
2
FTC-1
33
PA-T
U-T
Marke
r
Fig.26: Western blot data Immunoblot analysis of different proteins expression in pancreatic
adenocarcinoma PANC-1 cell line and clones. 30 µg of total cell lysate was electrophoresed on a 12% SDS polyacrylamide gel, then blotted on PVDF membranes. To each membrane desired antibody was added, then prepared to photograph as explained in materials and methods.

- 58 - Results
Furthermore, the examined proteins expression of S100A4, Rac1/2/3, Cdc42, Rho A,
LIMK1, Cofilin, phospho-Cofilin, Stathmin, α-Tubulin and acetylated-Tubulin were semi
quantified against PANC-1 and ß-Actin was used to normalize protein using Kodak Digital
science 1D software (Kodak Digital Science Electrophoresis Documentation and Analysis
System 120). The result was shown as relative expression in comparison to the PANC-1
(Table 14).
In fact, compared to PANC-1, protein expression of S100A4, Rac1/2/3, Cdc42, Rho A,
LIMK1 Cofilin and phospho-Cofilin was highly reduced in wild type NEP CL1,2 clones as
shown in table 14. Furthermore, the expression of mentioned protein was also reduced in
mutated NEP CL1,2 clones, where the reduction level except for S100A4 was always in
mutated NEP CL1,2 clones less than in wild type NEP CL1,2 clones. Stathmin protein
expression was in general obviously effected in wild type NEP CL1,2 clones. Moreover,
compared to PANC-1, protein expression of α-Tubulin was decreased in Mock, wild type
and mutated NEP CL1,2 clones, but on the other hand protein expression of acetylated-
Tubulin was up-regulated in wild type and in mutated NEP CL1,2 clones.
Table 14: Validation of western blot data using Kodak Digital science 1D software.
PANC-1 Mock Mock NEP CL1 NEP CL2 mNEP CL1 mNEP CL2
S100A4 100 45 61 5 25 0 0
Rac1/2/3 100 72 54 16 14 62 43
Cdc42 100 46 31 0 0 19 74
Rho A 100 84 81 20 32 89 42
LIMK 1 100 60 108 26 37 45 47
Cofilin 100 88 108 60 88 110 82
p-cofilin 100 63 121 33 84 117 99
Stathmin 100 84 119 113 78 117 108
α-Ttubilin 100 81 70 76 74 79 40
acet.Tub. 100 62 147 118 142 112 125
- 59 - Discussion
4 Discussion
NEP/CD10 expression and promoter status in pancreatic cell lines:
This study investigated the expression and regulation of neutral endopeptidase in nine cell
lines of pancreatic ductal adenocarcinoma. The results demonstrated heterogeneous
NEP/CD10 expression levels in the different analysed pancreatic adenocarcinoma cells
lines. Although the PA-TU-T and PA-TU-S cell lines derived from the same original tumor,
they exhibit a different cell morphology, differentiation status, gene expression pattern and
in vivo growth.95 In this work could be shown, that PA-TU-T cells expressed high levels of
NEP/CD10 mRNA and protein, whereas PA-TU-S expressed neither NEP/CD10 mRNA
nor protein. HUP-T4-derived tumor as a well differentiated papillo tubular carcinoma 96
expressed moderate NEP/CD10 mRNA and protein levels. HUP-T3 cells showed low
NEP/CD10 mRNA and protein expression. Expression of NEP/CD10 was not detected in
the cell lines PA-TU-02, PANC-1, Capan-1, Capan-2 and MIA PaCa-2. NEP/CD10
enzyme activity was also correlated with NEP/CD10 protein expression using flow
cytometry of examined pancreatic adenocarcinoma cell lines.
Although the different cell lines analyzed are of distinct differentiation status, 97-100 and also
exhibit a distinct in vivo growth (Table 4), the heterogeneous NEP/CD10 expression
pattern observed appears to be correlated with their biological behavior.
Heterogeneous expression of NEP/CD10 in different tumors suggests its transcriptional
regulation. The NEP/CD10 mRNA expression can be regulated by two alternative
promoters which control its tissue- and developmental stage-specific gene
expression.19,101 Both type 1 and 2 NEP/CD10 regulatory regions are characterized by the
presence of multiple transcription initiation sites and the absence of a TATA box and
consensus initiator elements. The type 2 promoter has functionally important transcription
factor binding sites, one of which is identical to CCAAT-binding transcription factor/nuclear
transcription factor Y (CBF/NFY), which might mediate tissue-specific expression of
NEP/CD10 by alternative splicing.102 Decreased NEP/CD10 expression in cancer can be

- 60 - Discussion
caused by hypermethylation of the NEP/CD10 promoter as shown e.g. in the human
prostate cancer cell line PC3.103 The NEP/CD10 promoters were examined using MSP
method and as previously shown in results (Figure 13, Table 9). Promoter 1 in the
examined pancreatic adenocarcinoma cell lines was hemimethylated whereas, the
promoter 2 was variable i.e. in a number of examined cell lines it is methylated but in the
others is not. From this results of examined cell lines it seems to be, there is not only
promoter methylation that has influence on NEP/CD10 transcription but also other factors
that also play together essential role in activation of NEP/CD10 promoter.
Regulation of NEP/CD10 expression in pancreatic adenocarcinoma cell lines:
To determine whether NEP/CD10 expression could be restored in vitro after epigenetic
treatments, pancreatic adenocarcinoma cell lines PA-TU-T, PA-TU-S (unmethylated),
HUP-T4, PA-TU-02 and PANC-1 (hemimethylated) and MIA PaCa-2 (methylated) were
treated with 5-aza-2’-deoxycytidine demethylating agent. However, exposure of the cell
lines to 5-aza-2’-deoxycytidine could not induce the transcription levels of NEP/CD10 in
the non-expressing lines (see 3.3). Furthermore the pancreatic adenocarcinoma cell lines
were exposed to both VPA and BA, members of the class of histone deacetylase
inhibitors which are discussed as one of the most promising class of new anti-cancer
drugs48 separately or combined with 5-aza-2’-deoxycytidine. VPA induced an 1.5 fold
higher NEP/CD10 expression in PATU-T and HUP-T4 cell lines whereas the effect of BA
was 2 fold in PATU-T. Inhibitors of histone deacetylase induce hyperacetylation in
chromatin usually resulting in activation of certain genes. In contrast, the same reagents
alone or in combination could not induce the NEP/CD10 protein expression in PA-TU-S,
PA-TU-02, PANC-1 and MIA PaCa-2 cell lines (data not shown). This result suggests that
methylation alone is not likely to control NEP/CD10 expression in these cell lines and it
seems that the methylation mechanism alone plays no crucial role in repression of
NEP/CD10 promoters of pancreatic adenocarcinoma cell lines.
On the other hand a reacetylation could be required for the increase of NEP/CD10
expression in cell lines that already express NEP/CD10 but not for the other cell lines that

- 61 - Discussion
do not express NEP/CD10. From these data it seems that the promoters could be
repressed with other biological mechanisms that work in correspondence with RNA
polymerase to initiate the transcription progress. One of the factors that could inhibit the
transcription status is mutation in promoter motifs, where transcription binding proteins
bind to accelerate the transcription machinery of the gene or may be a lack of expression
of one of transcription factors, that play vital role in transcription resulting in diminution of
transcription level of the gene.
NEP/CD10 transfection in pancreatic adenocarcinoma PANC-1 cell line:
Gene delivery to eukaryotic cells by transfection is one of the fundamental techniques to
study the regulation of gene expression and protein function.
Stable transfections that are experimentally useful are produced by introducing another
gene that can give the cell a selection advantage, typically resistance to a particular toxin.
After mitosis, the cells produced are exposed to the toxin. The transfected cells will
survive, while most of the normal cells (non-transfected cells) will die. After many rounds
of mitosis, only cells with the resistance and the desired genetic change will survive.
As a cell model to study NEP/CD10 function in pancreatic adenocarcinoma cells PANC-1
cells were used, a cell line of an aggressive pancreatic adenocarcinoma. It was
transfected with empty plasmid alone or with NEP/CD10 insert, wild type and mutated in
enzyme active site as a separate. Here to study the influence of NEP/CD10 enzyme
activity on cell mechanisms regulation, mutation was obtained in enzyme active site of
NEP/CD10 instead of using chemical inhibitors, like phosphoramidon or thiorphan that
have cross reaction with other proteases that may promote to negative influence of cell
progression.
Different clones were obtained and NEP/CD10 expression and enzyme activity of wild
type and mutated NEP clones were examined. High to moderate NEP/CD10 mRNA,
protein expression and enzyme activity were found in wild type NEP CL1,2, but in mutated
mNEP CL1,2 moderate to high NEP/CD10 mRNA and protein expression and reduced
enzyme activity.

- 62 - Discussion
NEP/CD10 over expression, proliferation and cell cycle phase:
Proliferation test was evaluated using MTT test to clarify the effect of NEP/CD10 over
expression (clones) on the proliferation rate of pancreatic adenocarcinoma cell line and
the role of this enzyme in regulation of proliferation rate of the examined cells in vitro. A
reduced proliferation rate of wild type NEP CL1,2 cells was found after 72 h serum
starvation condition (0 time). Subsequently, the lowest proliferation rate was demonstrated
also in wild type NEP CL1,2 cells under 5 % serum conditions after 24 h from 72 h serum
starvation condition (Figure 20). On the contrary, PANC-1, Mock- and mutated mNEP-
transfected cells could proliferate in the serum starvation condition, also proliferation rate
was increased under 5 % serum condition after 24 h from 72 h serum starvation condition.
Apparently, a variety of mitogenic growth factors such as bioactive peptides or cytokines
were released from tumor cells in an autocrine/paracrine fashion. However, these
substances may be down regulated through enzymatic degradation by over expressing
NEP/CD10 and this may lead to failure to proliferate in wild type NEP-transfected cells
under serum-free conditions after 72 h.
In fact, this result suggests the involvement of NEP/CD10 via its enzyme activity in the
regulation of proliferation rate through controlling the local concentrations of various
bioactive peptides that bind to their receptors on cell membrane and result in inducing
proliferation of the cells. This finding was in accordance with data of other malignancies
such as splenic B cells, NSCLC, SCCa cell lines of the lung and cervical carcinoma CaSki
cells indicating that NEP/CD10 expression was accompanied by inhibition of the
proliferation. 38,104-106
Furthermore, to confirm the proliferation rate result, in the same time the cell cycle phase
distribution of PANC-1 and clones was analysed using flow cytometry. DNA histograms
demonstrated presynthetic (G1), synthetic (S) and postsynthetic-mitotic (G2-M)
populations. The cell cycle phases are calculated and the results are given as
percentages of cells in the G1, S and G2-M phases. Interestingly, after 72 h of cells
starvation (0 h), more than 30 % of PANC-1 cells entered G2-M phase and slightly less in

- 63 - Discussion
Mocks, but on the other hand more than 70 % of the cells of wild type NEP CL1,2 and
mutated mNEP CL1,2 clones where in G0-G1 phase. In other words, the starvation
condition had no influence on the proliferation rate of PANC-1 and Mock, while wild type
NEP CL1,2 and mutated mNEP CL1,2 clones where affected. After 24 h from adding
medium supplements with 5 % FCS, the proliferation rate was induced in PANC-1, Mock
and mutated mNEP CL1,2 where 20-30 % of the cells entered the G2-M phase while wild
type NEP CL1,2 clones where delayed and still in S phase. This result harmonized with
the proliferation results, suggesting the involvement of enzyme activity of NEP/CD10 in
controlling of cell cycle. This result was the same in osteoarthritic (OA) chondrocytes.107
NEP/CD10 over expression, migration and invasion:
The effects of NEP/CD10 over expression as wild type or mutated NEP clones on
migration and invasion of pancreatic adenocarcinoma PANC-1 cell line were measured
(Chapter 3.9, 3.10). The present study could demonstrate that the migratory and invasive
potential of PANC-1 cells were markedly reduced by NEP transfection and that the
migratory ability of NEP-over expressing PANC-1 cells was marginally reduced by
mutation in NEP/CD10 enzyme active site. This result implies that increased NEP/CD10
expression might enzymatically, at least partially, contribute to a suppressive effect on
migratory and invasive potentials caused by bioactive peptides in pancreatic
adenocarcinoma cells. However, another mechanism independent on NEP/CD10 activity
may exist in this tumor. Iwase et. al. showed that NEP/CD10 in prostate cancer mediated
inhibition of cell adhesion and motility occurs in part through binding with
ezrin/radixin/moesin proteins and that interaction between NEP/CD10 and
ezrin/radixin/moesin proteins results from the potential of NEP/CD10 to recruit these
proteins from CD44.108 Similarly, in pancreatic adenocarcinoma NEP/CD10 may
contribute to reduced invasive and migratory potential both via enzymatic activity and by a
similar nonenzymatic mechanism. One could speculate that this interaction is inhibited by
the mutation in active site of NEP/CD10, being the reason for the non-reduced migratory
activity in mutated mNEP clones.

- 64 - Discussion
In prostate carcinoma, NEP/CD10 can regulate cell migration via mechanisms both
dependent and independent on its catalytic function.109 Furthermore, catalytically active
NEP/CD10 inhibits neuropeptide-mediated activation of the insulin growth factor-1 and the
resulting downstream activation of PI-3 kinase and Akt/PKB kinase.16 Recently, in prostate
cancer has been reported that NEP/CD10 and the PTEN tumor suppressor associate
directly through electrostatic interactions.110 In PMN cells, results demonstrate that
inhibition of NEP/CD10 significantly reduced the concentration of fMLP needed for eliciting
transmigration of PMN cells across intestinal epithelia.111
Considering the results of this study it seems that there is no one single effect or pathway
mediating NEP/CD10 functions in all different cells/tissues expressing this ectoenzyme.
NEP/CD10 over expression and signal cascade pathways:
The identification of molecular pathways that contribute to tumor cells proliferation, their
motility and invasion is essential for understanding how these activities are initiated in
tumor cells and how the tumor microenvironment contributes to cell migration. Elucidation
of mechanisms and molecules involved in most cell functions was the aim of the gene
expression experiments with the transfectants over expressing NEP/CD10. Using
microarray data, many target up- and down-regulated genes that related with pivotal
mechanisms inside the cells were selected and classified in details as up regulated genes
(Table 12) and down regulated genes (Table 13). Interesting target genes were confirmed
with Real-Time PCR. While Proteins are the functional molecules which operate
metabolic, developmental and regulatory pathways in a cell, tissue or an organism many
target genes were verified using western blot. S100A4 is a member of the S100 family of
calcium binding proteins and has been categorized as a metastasis-associated protein in
breast cancer.112 In addition to these data for breast cancer, an increase in S100A4
protein expression has been correlated with a worse prognosis for patients with colorectal,
gallbladder, urinary bladder, esophageal, nonsmall-cell lung, gastric, medulloblastoma,
pancreatic and hepatocellular cancers.113-117 Studies to determine the mechanistic basis
for S100A4 function have shown a potential role for S100A4 in several different facets of

- 65 - Discussion
tumor progression including motility, invasion and apoptosis.118,119 Interestingly, these
results could determine that PANC-1, as an aggressive pancreatic tumor cell line with high
proliferation rate, motility and invasive potential in vitro, expresses very high S100A4 as
compared to transfected PANC-1 cell line, wild type NEP CL1,2 and mutated mNEP
CL1,2 (Chap. 3.11, Figure 25, 26) which lost S100A4 expression. Anyhow, one could
found that in comparison to PANC-1, mutated mNEP CL1,2 express no S100A4 protein,
while in wild type NEP CL1,2 the expression was negligible.
Rho GTPases mediate housekeeping aspects of cell biology including cell size,
proliferation, apoptosis/survival, cytoarchitecture, cell polarity, cell adhesion and
membrane trafficking.120-123 They do so as signaling switches that regulate lipid
metabolism, microtubules-, actin-based structures, epithelial cell-junctions, cell cycle,
apoptosis regulatory proteins and transcription factors. There is abundant information
regarding the expression levels of Rho GTPases, the Rho family (Rho A and Rho C), the
Rac family (Rac1, Rac2 and Rac3) and the Cdc42 family in a large variety of human
tumors compared to those of normal tissues.
Rho pathway is the downstream signaling cascade that is activated by PI3K and leads to
ROCK stimulation, Myc phosphorylation and thrombospondin (TSP-1) repression. There
is also evidence of the disbalance between some Rho family members and RhoGDIs and
its correlation with invasion and metastasis in breast cancer.124 Many data indicating that
expression of Rho A correlates with tumor stage and aggressiveness have described in
breast cancer, melanoma cells, colorectal carcinoma, lung carcinoma, testicular germ cell
carcinoma and hepatocellular carcinoma cells.125-132 In these data, one could found that
Rho A expression was decreased in wild type NEP compared to PANC-1 and mutated
NEP clones. This may indicate that a role of NEP/CD10 enzyme activity in regulation of
Rho A expression via inactivation of bioactive peptides that induce signal cascades by
activation transmembrane receptors upstream of Rho GTPase.
Furthermore, other data indicated a vital role of Rac1/2/3 over expression, upstream
regulation of PAK1 in growth and metastasis of tumor cells, breast-, colorectal-, lung-

- 66 - Discussion
cancer, melanoma.133-136 In these data one could found that PANC-1, lacking NEP/CD10
expression with enhanced proliferation rate and potential invasion in vitro, expresses high
Rac1/2/3 expression, whereas wild type NEP clones with high NEP/CD10 and high
enzyme activity having reduced proliferation rate, migration and invasion in vitro, showed
a decline in Rac expression (Figure 26). More interestingly, mutated NEP clones that
express NEP/CD10 but with a mutation in enzyme active site have unchanged
proliferation rate, migration and invasion in vitro as compared to PANC-1 expressing high
Rac compared with wild type NEP clones.
Cdc42 plays also a vital role in signal cascades that regulate tumor growth and
invasiveness,137-139 which is in accordance with a high expression of Cdc42 in this work in
PANC-1 and in mutated mNEP clones but on the other hand there was no Cdc42
expression in wild type NEP clones (Figure 26).
Additionally, the downstream pathways of the corresponding GTPases that play pivotal
roles in Microtubules, Actin organization and polarization with effects on cell cycle and
motility of tumor cells via modulating intracellular signal transduction was also investigated
as schematically indicated in figure 27.
Stathmin, as downstream signal of Cdc42 is highly expressed in a wide variety of cancers
and its high level of expression seems to be necessary for the maintenance of
transformed phenotype.140-142 The levels of expression and phosphorylation of Stathmin
are regulated in response to a variety of signals that affect the state of proliferation and/or
differentiation of different cell types.143-145

- 67 - Discussion
Peptide
Proliferation, Migration, Invasion
PI 3K
PIP3Rac
PAK1
Cdc42/Rac-GTP
Stathmin
Rhoa
LIMK
CofilinCofilinPhosphatase
inaktivaktiv
Mikrotubuli-Polymerisation
Signalkaskade aktiviert
PI3K
RacRho A
Reorganisation desAktin-Zytoskelett
PI 3K
PIP3Rac
PAK1
Cdc42/Rac-GTP
Stathmin
LIMK
CofilinCofilinPhosphatase
inaktivaktiv
Signalkaskade nicht aktiviert
PI3K
RacRho A
NEPNEP
--COOHCOOH
--NH
NH
33
Zn2+
Reorganisation desAktin-Zytoskelett Mikrotubuli-Polymerisation
Peptide
Proliferation, Migration, Invasion
PI 3K
PIP3Rac
PAK1
Cdc42/Rac-GTP
Stathmin
Rhoa
LIMK
CofilinCofilinPhosphatase
inaktivaktiv
Mikrotubuli-Polymerisation
Signalkaskade aktiviert
PI3K
RacRho A
Reorganisation desAktin-Zytoskelett
PI 3K
PIP3Rac
PAK1
Cdc42/Rac-GTP
Stathmin
Rhoa
LIMK
CofilinCofilinPhosphatase
inaktivaktiv
Mikrotubuli-Polymerisation
Signalkaskade aktiviert
PI3K
RacRho A
Reorganisation desAktin-Zytoskelett
PI 3K
PIP3Rac
PAK1
Cdc42/Rac-GTP
Stathmin
LIMK
CofilinCofilinPhosphatase
inaktivaktiv
Signalkaskade nicht aktiviert
PI3K
RacRho A
NEPNEP
--COOHCOOH
--NH
NH
33
Zn2+Zn2+
Reorganisation desAktin-Zytoskelett Mikrotubuli-Polymerisation
Fig. 27: NEP/CD10 and signal cascade In the left side, the down stream signal is induced by
bioactive peptides (green color) and at the right side, the down stream signal is inhibited by NEP/CD10 expression (red color).
Stathmin was recently shown to increase the rate of transition of Tubulin polymers from
growth to shrinkage known as Catastrophe.146 Changes in the level of expression and the
state of phosphorylation of Stathmin are important in the regulation of the dynamics of
Microtubule polymerization, especially during cell cycle progression.147
Interestingly, in this study, wild type NEP clones that express high NEP/CD10 expression
have a reduced Stathmin expression, while mutated NEP clones have high Stathmin
expression as it was also found in PANC-1. We investigated also α-Tubulin and acetylated
Tubulin, which are regulated by Stathmin. In general, PANC-1 cell line has low expression
of acetylated Tubulin while wild type NEP and mutated NEP clones express highly
acetylated Tubulin. When Tubulin is acetylated, it is no longer active resulting in negative
influence on cell motility and invasion.
LIMK1 down stream of the Rho-GTPase family members, Rac, Rho and Cdc42, is a
serine/threonine kinase that regulates actin polymerization by phosphorylating and
inactivating its substrate, the Actin depolymerization factor, Cofilin.148-152 Cofilin regulates

- 68 - Discussion
Actin dynamics by severing actin filaments and sequestering the Actin monomer from the
pointed end of Actin filaments.153 However, once phosphorylated at serine 3 by LIMK1,
Cofilin can no longer bind to Actin, resulting in accumulation of Actin polymer.154-156 In
these data, LIMK1 expression was high in PANC-1 but reduced in all the transfectants,
wild type NEP and mutated NEP clones. Despite phospho-Cofilin expression was high in
PANC-1, mutated mNEP and low in wild type NEP clones, total Cofilin was also high in
PANC-1, mutated mNEP and low in wild type NEP clones.
However, not only Microtubules and Actin expression but its polarization play a crucial role
by affecting Microtubules and Actin cytoskeleton stabilization and destabilization of cells
that accelerate contraction of the cells during migration. Finally, from these data one could
demonstrate that in vitro, over expression of NEP/CD10 could decrease cell proliferation
rate, motility and invasion in vitro by influencing Rho-GTPase signal cascade, Roh A, Rac,
Cdc42, LIMK1, that regulate actin and Microtubules that play a vital role in multiple cellular
processes such as mitosis, migration, protein, organelle transport. The influence of
NEP/CD10 seems to be only partially dependent on the active site of the enzyme via
degrading bioactive peptides binding to extracellular receptors and activating intracellular
signal cascades.
Regarding to these data, NEP/CD10 seems to be a tumor suppressor gene that inhibits
tumor progress, possibly it could be used as gene therapy for pancreatic tumor patients
especially those with pancreatic tumor metastasis.

- 69 - Conclusion
5 Conclusion
In this study to explain the cell biological role of NEP/CD10 in controlling pancreatic
adenocarcinoma progression, PANC-1 cell line was used as models that derived from
poorly differentiated pancreas carcinomas.
In the examined exocrine pancreatic carcinoma cell lines only the cell lines that have no
ability to metastasis express NEP/CD10.
Demethylating reagent 5-aza-deoxy-2-citydine could not restore expression of NEP/CD10
in the examined pancreatic adenocarcinoma cell lines.
Acetylating reagents such as butyric acid and valproic acid could upregulate expression of
NEP/CD10 in the cell line that already expresses NEP/CD10, but could not restore
NEP/CD10 in the cell lines that do not express NEP/CD10.
PANC-1, an aggressive pancreatic adenocarcinoma cell line that has enhanced
proliferation and invasive potential rate, shows after transfection with wild type NEP/CD10
gene that, proliferation and invasive potential rate was reduced in vitro. On the other hand
after transfection with mutated NEP/CD10, the proliferation and invasive potential rate
was marginally or not reduced in vitro.
NEP/CD10 over expression has indirect influence on upstream and down stream signal
cascades that regulate proliferation and motility rate. This postulate as one of the possible
mechanisms of NEP/CD10 over expression one that works via controlling bioactive
peptides. Binding to their cell membrane receptors and initiation of signal cascades is
partially dependent on enzyme active site as schematically indicated in figure 27.

- 70 - Conclusion
Zusammenfassung: In dieser Arbeit wurde die zellbiologische Rolle von NEP/CD10 beim exokrinen
Pankreaskarzinom untersucht. Als Modelle wurden für diese Studie verschiedene
Pankreaskarzinomzelllinien, insbesondere die Zelllinie PANC-1, welche aus einem
undifferenzierten Pankreaskarzinom gewonnen wurde, verwendet. Die folgenden
zellbiologischen Parameter wurden (mit an die Bedingungen der Pankreaskarzinom-
Zelllinien adaptierten Methoden) quantitativ und qualitativ erfasst: mRNA Expression
(Realtime-PCR), Protein Expression (mittels Durchflusszytometrie), Enzymaktivität
(enzymatisch), Zellproliferation (MTT-Test), Zellmotilität (Migrationstest mit Transwell-
kammern) und andere.
Die folgenden Punkte beinhalten die wesentlichen Ergebnisse:
Von allen untersuchten Pankreaskarzinomzelllinien zeigten nur die Zelllinien, welche nicht
die Fähigkeit zur Metastasierung besitzen, die Expression von NEP/CD10.
Durch die Methylierung mittels 5-aza-deoxy-2-cytidin konnte die Expression von
NEP/CD10 in den untersuchten Pankreaskarzinomzellen nicht induziert werden.
Reagenzien für die Azetylierung wie Butter– oder Valproinsäure konnten die Expression
von NEP/CD10 in Pankreaskarzinomzellen, welche NEP/CD10 exprimieren, hoch
regulieren. Auf der anderen Seite zeigte sich, dass die Expression von NEP/CD10 in
Zelllinien, welche dieses Gen nicht exprimieren, nicht durch eine Azetylierung induziert
werden konnte.
Die aggressive Pankreaskarzinomzelllinie PANC-1, welche ein erhöhtes Proliferations-
und Invasionspotential besitz, zeigte in vitro nach Transfektion mit dem Wildtyp von
NEP/CD10, ein erniedrigtes Proliferations- und Invasionsverhalten. Andererseits
veränderte sich die Proliferations- und Invasionsrate nicht, wenn diese mit einer Mutante
des NEP/CD10 Gens transfiziert wurde.

- 71 - Conclusion
Aus den Daten lässt sich schließen, dass eine Überexpression von NEP/CD10 einen
indirekten Einfluss auf die Signalkaskaden (up- und downstream) hat, welche für die
Auslösung und Regulation der Proliferation und Motilität verantwortlich sind. Dabei könnte
eine Überexpression von NEP/CD10 einen inhibierenden Einfluss in diesen Kaskaden
durch den Abbau bioaktiver Peptide ausüben. Eine schematische Darstellung dieser
Vorstellung ist in Abbildung 27 zu finden.

- 72 - Prospective plane
6 Prospective plane
Among the ideas for further experiments suggested by these results the following ones
could be regarded:
NEP/CD10 promoter sequencing in pancreatic adenocarcinoma cell lines and tissues to
obtain information whether there are mutations in promoter consensus motifs where
transcription factors bind to accelerate transcription.
Investigation of transcription factors in pancreatic adenocarcinoma cell lines and tissues
that accelerate gene transcription, whether they are expressed or not and mutated or not.
Use of nude mice xenograft to study NEP/CD10 function in vivo using PANC-1 that
express no NEP/CD10, transfectants wild type and mutated NEP/CD10.
Transfection of NEP/CD10 in other cell lines that are not aggressive like, tumor grade I, or
lymph node metastasis cell lines and study the gene function in vitro and in vivo to explore
whether NEP/CD10 inhibits proliferation, invasion just in aggressive cell line or at all tumor
grade.

- 73 - References
7 References
1. Erin Brender, MD, Writer; Alison Burke, MA, Illustrator; Richard M. Glass, MD
(2005). Pancreatic cancer. Editor JAMA. 294:2934.
2. Ross MH, Reith EJ, Romrell LJ (1989). Histology: a text and atlas. 2nd ed.
Baltimore: Williams and Wilkins. 309-11.
3. Oertel JE, Heffess CS, Oertel YC (1992). Pancreas. In: Sternberg SS, ed. Histology
for pathologists. 2nd ed. New York, NY: Raven Press. 652–68.
4. Dayal Y, O'Briain DS (1981). The pathology of the pancreatic endocrine cells. In:
Delellis RA, ed. Diagnostic immunohistochemistry (Masson monographs in
diagnostic pathology). New York: Masson Publishing. 75-109.
5. Bordi C (1986). Endocrine pancreas. In: Spicer SS, ed. Histochemistry in athological
diagnosis. Marcel Dekker, Inc, NewYork, Ch 16:457-79.
6. Cotran RS, Kumar V, Robbins SL (1989). Robbins pathologic basis of disease. 4th
ed. Philadelphia: WB Saunders. 210–20.
7. Generoso U (2002). How far are we from the most accurate classification system for
chronic Pancreatitis? JOP. J. Pancreas (Online) 3:62-65.
8. Chassin D, Benifla JL, Delattre C, Fernandez H, Ginisty D, Janneau JL, Prade M,
Contesso G, Caillou B, Tournaire M, et. al. (1994). Identification of genes
overexpressed in adenocarcinomas through preferential expression screening in
trophoblasts. Cancer Res. 54:5217-23.
9. Vogelstein B, Kinzler KW (2004). Cancer genes and the pathways they control. Nat
Med. 10:789–99.

- 74 - References
10. Sanchez JA, Newman KD, Eichelberger MR et. al. (1990). The papillary-cystic
neoplasm of the pancreas. Arch. Surgery 125:1502-5.
11. Warshaw AL, Compton CC, Lewandrowski K et. al. (1990). Cystic adeno-
carcinomas of the pancreas: new clinical, radiologic and pathologic observations in
67 patients. Ann. Surgery. 212:432-43.
12. Lippincott JB Company (1992). Exocrine pancreas in: American Joint Committee on
Cancer: Manual for Staging of Cancer. 4th ed. Philadelphia. 109-13.
13. Schumacher M et. al. (1986). Primary structure of Torpedo californic a cetylcholin-
esterase deduced from its cDNA sequence. Nature 319:407–9.
14. Goding JW (2000). Ectoenzymes: physiology meets pathology. J. Leukoc. Biol.
67:285–311.
15. Sumitomo M, Shen R, Goldberg JS, Dai J, Navarro D and Nanus DM (2000).
Neutral endopeptidase promotes phorbol ester induced apoptosis in prostate cancer
cells by inhibiting neuropeptide-induced protein kinase C delta degradation. Cancer
Res. 60:6590-96.
16. Sumitomo M, Shen R, Walburg M, Dai J, Geng Y, Navarro D, et. al. (2000). Neutral
endopeptidase inhibits prostate cancer cell migration by blocking focal adhesion
kinase signaling. J. Clin. Invest. 106:1399-1407.
17. Lendeckel U, Kähne T, Riemann D, Neubert K, Arndt M and Reinhold D (2000). The
role of membrane peptidases in immune functions (Review). Adv. Exp. Med. Biol.
477:1-24.
18. Van der Velden VHJ, Hulsmann AR (1999). Peptidases structure, function and
modulation of peptide mediated effects in the human lung. Immunology. 29:445–56.

- 75 - References
19. Shipp MA and Look T (1993). Hematopoietic differentiation antigens that are
membrane-associated enzymes: Cutting is the key. Blood 82:1052-70.
20. Shipp MA, Richardson NE, Sayre PH et. al. (1988). Molecular cloning of the
common acute lymphoblastic leukaemia antigen (CALLA) identifies a type II integral
membrane protein. Proc. Natl. Acad. Sci. 85:4819-23.
21. Letarte M, Vera S, Tran R, Addis JBL, Onizuka RJ, Quackenbush EJ, Jongneel CV,
McInnes RR (1988). Common acute lymphocytic leukemia antigen is identical to
neutral endopeptidase. J. Exp. Med. 168:1247-53.
22. Malfroy B, Kuang WJ, Seeburg PH, Mason AJ and Schofield PR (1988) Molecular
cloning and amino acid sequence of human enkephalinase (neutral endopeptidase).
FEBS Lett 229:206-10.
23. Riemann D (2002). CD10. In: Wiley Encyclopedia of Molecular Medicine. John Wiley
& Sons, Inc. 5:544-47.
24. Oefner C, D'Arcy A, Hennig M, Winkler FK and Dale GE (2000). Structure of human
neutral endopeptidase (neprilysin) complexed with phosphoramidon. J. Mol. Biol.
296:341-49.
25. Barker PE, Shipp MA, D'Adamio L, Masteller EL and Reinherz EL (1989). The
common acute lymphoblastic leukemia antigen maps to chromosomal region 3
(q21-q27). J. Immunol. 142:283-87.
26. Tran-Paterson R, Willard HF and Letarte M (1989). The common acute
lymphoblastic leukemia antigen (neutral endopeptidase-3.4.24.11.) gene is located
on human chromosome 3. Cancer Genet. Cytogenet. 42:129-34.
27. Ishimaru F, Shipp MA (1995). Analysis of the human CD10/neutral endopeptidase
24.11 promoter region: two separate regulatory elements. Blood 85:3199–207.

- 76 - References
28. Iijima H, Gerard NP, Squassoni C, Ewig J, Face D, Drazen JM et. al. (1992). Exon
16 del: a novel form of human neutral endopeptidase (CALLA). Am. J. Physiol.
262:725–29.
29. Lambert DM, Mergen F, Berens CF, Poupaert JH, Dumont P (1995). Synthesis and
pharmacological properties of 2-[S-acetylthiorphan]-1,3- diacylaminopropan-2-ol
derivatives as chimeric lipid drug carriers containing an enkephalinase inhibitor.
Pharm. Res. 12:187-91.
30. Hamza H, Khalifa HB, Baumer P, Berard H, Lecomte JM (1999). Racecadotril
versus placebo in the treatment of acute diarrhoea in adults. Aliment. Pharmacol.
Ther. 13:15–19.
31. Lecomte JM (2000). An overview of clinical studies with racecadotril in adults. Int. J.
Antimicrob. Agents 14:81–87.
32. Prado D (2002). A multinational comparison of racecadotril and loperamide in the
treatment of watery diarrhoea in adults. Scand. J. Gastroenterol. 37:656–61.
33. de Felipe MC, Jimenez I, Castro A, Fuentes JA (1989). Antidepressant action of
imipramine and iprindole in mice is enhanced by inhibitors of enkephalin-degrading
peptidases. Eur. J. Pharmacol. 159:175-80.
34. Wilkinson IB, McEniery CM, Bongaerts KH, MacCallum H, Webb DJ, Cockcroft JR
(2001). Adrenomedullin (ADM) in the human forearm vascular bed: effect of neutral
endopeptidase inhibition and comparison with proadrenomedullin NH2-terminal 20
peptide (PAMP). Br. J. Clin. Pharmacol. 52:159-64.
35. Ohbayashi H, Yamaki K, Suzuki R, Kume H, Takagi K (1998). Neutral
endopeptidase 3.4.24.11 inhibition potentiates the inhibitory effects of type-C
natriuretic peptide on leukotriene D4-induced airway changes. Clin. Exp. Pharmacol.
Physiol. 25:986-91.

- 77 - References
36. de Gouw HW, Diamant Z, Kuijpers EA, Sont JK, Sterk PJ (1996). Role of neutral
endopeptidase in exercise-induced bronchoconstriction in asthmatic subjects. J.
Appl. Physiol. 81:673-8.
37. Nichol GM, O'Connor BJ, Lecomte JM, Chung KF, Barnes PJ (1992). Effect of
neutral endopeptidase inhibitor on airway function and bronchial responsiveness in
asthmatic subjects. Eur. J. Clin. Pharmacol. 42:491-4.
38. Gilles Salles, Hans-Reimer Rodwald, Bridget S, Chin, Ellis L, Reinherz and
Margaret A, Shipp (1993). Inhibition of CD10/neutral endopeptidase 24.11 promotes
B-cell reconstitution and maturation in vivo. Immunology. 90:7618-22.
39. Ritz J, Pepsidero JM, Notis-McConary J, et. al. (1980, 1982). A monoclonal antibody
to human acute lymphoblastic leukemia antigen. Nature 283:583-85, 76:4350-54.
40. Dowell BL, Borowitz MJ, Boyett JM, Pullen DJ, Crist WM, Quddus FF, Russell E C,
Falletta JM, Metzgar RS (1987). Immunologic and clinicopathologic features of
common acute lymphoblastic leukemia antigen-positive childhood T-cell leukemia. A
Pediatric Oncology Group Study. Cancer. 59:2020-6.
41. Greaves MF, Hariri G, Newman RA, Sutherland DR, Ritter MA and Ritz J (1983).
Selective expression of the common acute lymphoblastic leukemia (gp 100) antigen
on immature lymphoid cells and their malignant counterparts. Blood. 61:628-39.
42. Gregory CD, Tursz T, Edwards CF, Tetaud C, Talbot M, Caillou B, Rickinson A B
and Lipinski M (1987). Identification of a subset lymphoma of normal B cells with a
burkitt’s lymphoma (BL)-like phenotype. J. immunol. 139:313-18.
43. Harris NL, Bhan AK (1985). B-cell neoplasms of the lymphocytic, lympho-
plasmacytoid and plasma cell types: immunohistologic analysis and clinical
correlation. Hum. Pathol. 16:829-37.

- 78 - References
44. Stein H, Lennert K, Feller AC, Mason DY (1984). Immunohistochemical analysis of
human lymphoma: Correlation of histological and immunological categories. Adv.
Cancer Res. 42:67–147.
45. Weiss LM, Bindl JM, Picozzi VJ, Link MP and Warnke RA (1986). Lymphoblastic
lymphoma: an immunophenotype study of 26 cases with comparison to T cell acute
lymphoblastic leukaemia. Blood 67:474-78.
46. Plant JL, LeBien TW, Michael AF. Et. al. (1983). Stages of renal ontogenesis
identified with monoclonal antibodies reactive with lymphohematopoietic
differentiation antigens. J. Exp. Med. 157:155-72.
47. Metzger RS, Borowitz MJ, Jones NH, et. al. (1981). Distribution of common acute
lymphoblastic leukemia antigen In nonhematopoietic tissues. J. Exp. Mcd.
154:1249-54.
48. Braun MP, Martin PJ, Ledbetter LA, et. al. (1983). Granulocytes and cultured human
fibroblasts express common acute lymphoblastic antigen. Blood 61:718-25.
49. Carrel S, De Tribolet N, Gross N (1982). Expression of HLA-DR and common acute
lymphoblastic leukemia antigen on glioma cells. Eur. J. Immunol. 12:354-57.
50. Carrel S, Schmidt-Kessen A, Mach JP, et. al. (1983). Expression of common acute
lymphoblastic antigen [CALLA/ on human malignant melanoma cell lines. J.
Immunol.130:2456-60.
51. Seshadri R, Matthews C, Henerson DW, et. al. (1986). A human retino-blastoma cell
line expressing the common acute lymphoblastic leukemia antigen and displaying
an unusual chromosome abnormality. Cancer Genet. Cytogenet. 20:345-52.

- 79 - References
52. Mechtersheimer G, Moiler P, (1989). Expression of the common acute lymphoblastic
leukemia antigen (CD 10) in mesenchymal adenocarcinomas. Am. J. Pathol.
134:961-65.
53. Pesando JM, Tomaselli KJ, Lasarus H, et. al. (1983). Distribution and modulation of
a human leukemia-associated antigen (CALLA). J. Immunol. 131:2038-45.
54. Howell S, Kenney J, Yurner AJ (1992). A survey of membrane peptidases in two
human colonic cell lines. Caco-2 and HT-29. Biochem. J. 284:595-601.
55. Jalal F, Jumarie C, Bawab W, et. al. (1992). Polarized distribution of neutral
endopeptidase 24.11 at the cell surface of cultured human intestinal epithelial Caco-
2 cells. Biochem, J, 288:945-51.
56. Chu P, Arber DA (2000). Paraffin-section detection of CD10 in 505
nonhematopoietic neoplasms. Frequent expression in renal cell adenocarcinoma
and endometrial stromal sarcoma. Am. J. Clin. Pathol. 113:374-82.
57. Langner C, Ratschek M, Rehak P, et. al. (2004). CD10 is a diagnostic and
prognostic marker in renal malignancies. Histopathology 45:460-7.
58. Koiso K, Akaza H, Ohtani M, et. al. (1994). A new adenocarcinoma marker for
bladder cancer. Int. J. Urol. 1:33 -6.
59. Tawfic S, Niehans GA, Manivel JC (2003). The pattern of CD10 expression in
selected pathologic entities of the prostate gland. Hum. Pathol. 34:450-6.
60. Ordi J, Romagosa C, Tavassoli FA, et. al. (2003). A CD10 expression in epithelial
tissues and adenocarcinomas of the gynecologic tract: a useful marker in the
diagnosis of mesonephric, trophoblastic and clear cell adenocarcinomas. Am. J.
Surg. Pathol. 27:178-86.

- 80 - References
61. Shousha S, Gadir F, Peston D, et. al. (2004). CD10 immunostaining of bile
canaliculi in liver biopsies: change of staining pattern with the development of
cirrhosis. Histopathology 45:335-42.
62. Khin EE, Kikkawa F, Ino K, et. al. (2003). NEP/CD10 expression in the stroma of
epithelial ovarian adenocarcinoma. Int. J. Gynecol. Pathol. 22:175-80.
63. Ogawa H, Iwaya K, Izumi M, et. al. (2002). Expression of CD10 by stromal cells
during colorectal adenocarcinoma development. Hum. Pathol. 33:806 -11.
64. Notohara K, Hamazaki S, Tsukayama C, et. al. (2000). Solid-pseudopapillary
adenocarcinoma of the pancreas: immunohistochemical localization of
neuroendocrine markers and CD10. Am. J. Surg. Pathol. 24:1361-71.
65. Jorge Albores-Saavedra, MD, Karen W. Simpson, MD and Seth J. Bilello, MD
(2006). The clear cell variant of solid pseudopapillary adenocarcinoma of the
pancreas: A previously unrecognized pancreatic neoplasm. Am. J. Surg. Pathol.
30:1237–42.
66. Chen C, Jing W, Gulati P, Vargas H, French SW (2004). Melanocytic differentiation
in a solid pseudopapillary adenocarcinoma of the pancreas. J Gastroenterol.
39:579-83.
67. Lydia Deschamps MD, Adriana Handra-Luca MD, PhD, Dermot O’Toole MD, PhD,
Alain Sauvanet MD, Philippe Ruszniewski MD, Jacques Belghiti MD, Pierre
Bedossa MD, PhD, Anne Couvelard MD, PhD (2006). CD10 expression in
pancreatic endocrine adenocarcinomas: correlation with prognostic factors and
survival. Human Pathology 37:802–8.

- 81 - References
68. Broccolini A, Gidaro T, Morosetti R, Gliubizzi C, Servidei T, Pescatori M, Tonali PA,
Ricci E, Mirabella M (2006). Neprilysin participates in skeletal muscle regeneration
and is accumulated in abnormal muscle fibres of inclusion body myositis. J.
Neurochem. 96:777-89.
69. Fielitz J, Dendorfer A, Pregla R, Ehler E, Zurbrugg HR, Bartunek J, Hetzer R,
Regitz-Zagrosek V (2002). Neutral endopeptidase is activated in cardiomyocytes in
human aortic valve stenosis and heart failure. Circulation. 105:286-9.
70. Olerud JE, Usui ML, Seckin D, Chiu DS, Haycox CL, Song IS, Ansel JC, Bunnett
NW (1999). Neutral endopeptidase expression and distribution in human skin and
wounds. J. Invest. Dermatol. 112:873-81.
71. Guerin S, Mari B, Maulon L, Belhacene N, Marguet D, Auberger P (1997). CD10
plays a specific role in early thymic development. FASEB J. 11:376-81.
72. Baraniuk JN, Ohkubo K, Kwon OJ, Mak J, Ali M, Davies R, Twort C, Kaliner M,
Letarte M, Barnes PJ (1995). Localization of neutral endopeptidase (NEP) mRNA in
human bronchi. Eur. Respir. J. 8:1458-64.
73. Mari B, Breittmayer JP, Guerin S, Belhacene N, Peyron JF, Deckert M, Rossi B,
Auberger P (1994). High levels of functional endopeptidase 24.11 (CD10) activity on
human thymocytes: preferential expression on immature subsets. Immunology.
82:433-8.
74. Skryzdlo-Radomanska B, Pollard H, Schabowski J, Radwan P, Celinski K, Pokora J,
Gespach C (1994). [Activity of enkephalinase (EC.3.4.24.11). Neutral
endopeptidase in human digestive tract epithelial cells]. Wiad. Lek. 47:13-7.
75. Ohkubo K, Baraniuk JN, Hohman RJ, Kaulbach HC, Hausfeld JN, Merida M, Kaliner
MA (1993). Human nasal mucosal neutral endopeptidase (NEP): location,
quantitation and secretion. Am J Respir Cell Mol Biol. 9:557-67.

- 82 - References
76. Salles G, Rodewald HR, Chin BS, Reinherz EL, Shipp MA (1993). Inhibition of
CD10/neutral endopeptidase 24.11 promotes B-cell reconstitution and maturation in
vivo. Proc. Natl. Acad. Sci. U S A. 90:7618-22.
77. Wen-Bin Huang, Xiao-Jun Zhou, Jie-Yu Chen, Li-Hua Zhang, Kui Meng, Heng-Hui
Ma and Zhen-Feng Lu (2005). CD10-positive Stromal Cells in Gastric
Adenocarcinoma: Correlation with Invasion and Metastasis. Jpn. J. Clin. Oncol.
35:245-50.
78. Nurija Bilalovic, Berit Sandstad, Rastko Golouh, Jahn M Nesland, Ivan Selak and
Emina E Torlakovic (2004). CD10 protein expression in adenocarcinoma and
stromal cells of malignant melanoma is associated with adenocarcinoma
progression. Modern Pathology 17:1251–58.
79. Khin EE, Kikkawa F, Ino K, Suzuki T, Shibata K, Kajiyama H, Tamakoshi K, Mizutani
S (2003). Neutral endopeptidase/CD10 expression in the stroma of epithelial
ovarian adenocarcinoma. Int. J. Gynecol. Pathol. 22:175-80.
80. Kajiyama H, Shibata K, Terauchi M, Morita T, Ino K, Mizutani S, Kikkawa F (2005).
Neutral endopeptidase 24.11/CD10 suppresses progressive potential in ovarian
adenocarcinoma in vitro and in vivo. Clin. Cancer Res. 11:1798-808.
81. Ogawa H, Iwaya K, Izumi M, Kuroda M, Serizawa H, Koyanagi Y, Mukai K (2002).
Expression of CD10 by stromal cells during colorectal adenocarcinoma
development. Hum. Pathol. 33:806-11.
82. Uehara C, Ino K, Suzuki T, Kajiyama H, Kikkawa F, Nagasaka T, Mizutani S (2001).
Upregulation of Neutral endopeptidase expression and enzymatic activity during the
differentiation of human chorioadenocarcinoma cells. Placenta. 22:540-9.

- 83 - References
83. Mazur-Kolecka B, Frackowiak J (2006). Neprilysin protects human neuronal
progenitor cells against impaired development caused by amyloid-beta peptide.
Brain Res. 1124:10-8.
84. Poirier R, Wolfer DP, Welzl H, Tracy J, Galsworthy MJ, Nitsch RM, Mohajeri MH
(2006). Neuronal neprilysin over expression is associated with attenuation of Abeta-
related spatial memory deficit. Neurobiol. Dis. 24:475-83.
85. Bircan S, Candir O, Kapucuoglu N, Serel TA, Ciris M, Karahan N (2006). CD10
expression in urothelial bladder adenocarcinomas: a pilot study. Urol Int. 77:107-13.
86. Braham H, Trimeche M, Ziadi S, Mestiri S, Mokni M, Amara K, Hachana M, Sriha B,
Korbi S (2006). CD10 expression by fusiform stromal cells in nasopharyngeal
adenocarcinoma correlates with adenocarcinoma progression. Virchows Arch.
449:220-4.
87. Terauchi M, Kajiyama H, Shibata K, Ino K, Mizutani S, Kikkawa F (2005). Anti-
progressive effect of Neutral endopeptidase 24.11 (NEP/CD10) on cervical
adenocarcinoma in vitro and in vivo. Oncology. 69:52-62.
88. Piattelli A, Fioroni M, Iezzi G, Perrotti V, Stellini E, Piattelli M, Rubini C (2006). CD10
expression in stromal cells of oral cavity squamous cell adenocarcinoma: a clinic
and pathologic correlation. Oral Dis. 12:301-4.
89. Erhuma M, Kobel M, Mustafa T, Wulfanger J, Dralle H, Hoang-Vu C, Langner J,
Seliger B, Kehlen A (2007). Expression of Neutral endopeptidase (NEP/CD10) on
pancreatic tumor cell lines, pancreatitis and pancreatic tumor tissues. Int. J. Cancer
120:2393-400.
90. Chomczynski P, Sacchi N (1987). Single-step method of RNA isolation by acid
guanidinium thiocyanate-phenol-chloroform extraction. Anal Biochem. 162:156-9.

- 84 - References
91. Mosmann T (1983). Rapid colorimetric assay for cellular growth and survival:
application to proliferation and cytotoxicity assays. J. Immunol. Methods. 65:55-63.
92. Mari B, Checler F, Ponzio G, Peyron JF, Manie S, Farahifar D, Rossi B and
Auberger P (1992). Jurkat T cells express a functional Neutral endopeptidase
activity (CALLA) involved in T cell activation. EMBO J. 11: 3875-85.
93. Gabrilovac J, Cupic B, Breljak D, Zekusic M and Boranic M (2004). Expression of
CD13/aminopeptidase N and CD10/Neutral endopeptidase on cultured human
keratinocytes. Immunol. Lett. 91:39-47.
94. Aprikian AG, Tremblay L, Han K and Chevalier S (1997). Bombesin stimulates the
motility of human prostate-adenocarcinoma cells through tyrosine phosphorylation
of focal adhesion kinase and of integrin-associated proteins. Int. J. Cancer. 72:498–
504.
95. Elsasser HP, Lehr U, Agricola B, Kern HF (1992). Establishment and
characterisation of two cell lines with different grade of differentiation derived from
one primary human pancreatic adenocarcinoma. Virchows Arch B Cell Pathol. Incl.
Mol. Pathol. 61:295–306.
96. Nishimura N, Saito S, Kubota Y, Moto-o N, Taguchi K, Yamazaki K, Watanabe A,
Sasaki H (1993). Newly established human pancreatic carcinoma cell lines and their
lectin binding properties. Int. J. Pancreatol. 13:31-41.
97. Kyriazis AA, Kyriazis AP, Sternberg CN, Sloane NH, Loveless JD (1986).
Morphological, biological, biochemical and karyotypic characteristics of human
pancreatic ductal adenocarcinoma Capan-2 in tissue culture and the nude mouse.
Cancer Res. 46:5810-5.

- 85 - References
98. Michael Lieber, Joann Mazzetta, Walter Nelson-Rees, Michael Kaplan, George
Todaro (1975). Establishment of a continuous tumor-cell line (PANC-1) from a
human carcinoma of the exocrine pancreas. Int. J. of Cancer 15:741-47.
99. Tsutsumi S, Kuwano H, Morinaga N, Shimura T, Asao T (2001). Animal model of
para-aortic lymph node metastasis. Cancer Letters 169:77-85.
100. Elsasser HP, Lehr U, Agricola B, Kern HF (1993). Structural analysis of a new highly
metastatic cell line PA-TU-8902 from a primary human pancreatic adenocarcinoma.
Virchows Arch B Cell Pathol. Incl. Mol. Pathol. 64:201-7.
101. D'Adamio L, Shipp MA, Masteller EL, Reinherz EL (1989). Organization of the gene
encoding common acute lymphoblastic leukemia antigen (neutral endopeptidase
24.11): multiple miniexons and separate 5' untranslated regions. Proc. Natl. Acad.
Sci. USA 86:7103-7.
102. Ishimaru F, Mari B, Shipp MA (1997). The type 2 CD10/neutral endopeptidase 24.11
promoter: functional characterization and tissue-specific regulation by CBF/NF-Y
isoforms. Blood 89:4136-45.
103. Badar A, Usmani, Ruoqian Shen, Michael Janeczko, Christos N, Papandreou, Wen-
Hsiang Lee, William G, Nelson, Joel B, Nelson and David M, Nanus (2000).
Methylation of the Neutral Endopeptidase Gene Promoter in Human Prostate
Cancers. Clinical Cancer Research 1664:1664–70.
104. Ganju RK, Sunday M, Tsarwhas DG, Card A and Shipp MA (1994). NEP/CD10 in
non-small cell lung carcinomas. Relationship to cellular proliferation. J. Clin. Invest.
94:1784–91.

- 86 - References
105. Shipp MA, George ET, Chang-Yan Chen, Stephanie NS, Louis BH, Harald S, Mary
ES, Ellis LR (1991). CD10/Neutral Endopeptidase 24.11 Hydrolyzes Bombesin-Like
Peptides and Regulates the Growth of Small Cell Carcinomas of the Lung. PNAS
88:10662-66.
106. Mikio Terauchi, Hiroaki Kajiyama, Kiyosumi Shibata, Kazuhiko Ino, Shigehiko
Mizutani, Fumitaka Kikkawa (2005). Anti-Progressive Effect of Neutral
Endopeptidase 24.11 (NEP/CD10) on Cervical Carcinoma in vitro and in vivo.
Oncology 69:52-62.
107. Lapadula G, Iannone F, Zuccaro C, Covelli M, Patella V, Lobianco G, Pipitone V
(1995). Expression of membrane-bound peptidases (CD10 and CD26) on human
articular chondrocytes. Possible role of neuropeptidases in the pathogenesis of
osteoarthritis. Clin Exp Rheumatol.13:143-8.
108. Iwase A, Shen R, Navarro D, Nanus DM (2004). Direct binding of neutral
endopeptidase 24.11 to ezrin/radixin/moesin (ERM) proteins competes with the
interaction of CD44 with ERM proteins. J. Biol. Chem. 279:11898-905.
109. Sumitomo M, Milowsky MI, Shen R, Navarro D, Dai J, Asano T, Hayakawa M,
Nanus DM (2001). Neutral endopeptidase inhibits neuropeptide-mediated
transactivation of the insulin-like growth factor receptor Akt cell survival pathway.
Cancer Res. 61:3294-8.
110. Sumitomo M, Iwase A, Zheng R, Navarro D, Kaminetzky D, Shen R, Georgescu
MM, Nanus DM (2004). Synergy in tumor suppression by direct interaction of neutral
endopeptidase with PTEN. Cancer Cell 5:67-78.
111. Hofman P, Selva E, Le Negrate G, d'Andrea L, Guérin S, Rossi B, Auberger P
(1998). CD10 inhibitors increase f-Met-Leu-Phe-induced neutrophil transmigration.
J. Leukoc. Biol. 63:312-20.

- 87 - References
112. Rudland PS, Platt-Higgins A, Renshaw C, West CR, Winstanley JH, Robertson L,
Barraclough R (2000). Prognostic significance of the metastasis-inducing protein
S100A4 (p9Ka) in human breast cancer. Cancer Res. 60:1595–1603.
113. Mazzucchelli L (2002). Protein S100A4: too long overlooked by pathologists? Am. J.
Pathol. 160:7–13.
114. Cho YG, Nam SW, Kim TY, Kim YS, Kim CJ, Park JY, Lee JH, Kim HS, Lee JW,
Park CH, Song YH, Lee SH, Yoo NJ, Lee JY, Park WS (2003). Over expression of
S100A4 is closely related to the aggressiveness of gastric cancer. APMIS 111:539–
45.
115. Heman R, Fasheh R, Calabrese C, Frank AJ, Maclean KH, Allard D, Barraclough R,
Gilbertson RJ (2003). ERBB2 up-regulates S100A4 and several other prometastatic
genes in medulloblastoma. Cancer Res. 63:140–8.
116. Cui JF, Liu YK, Pan BS, Song HY, Zhang Y, Sun RX, Chen J, Feng JT, Tang ZY,
Yu YL, Shen HL, Yang PY (2004). Differential pmteomic analysis of human
hepatocellular carcinoma cell line metastasis-associated proteins. J. Cancer Res.
Clin. Oncol. 130: 615–22.
117. Missiaglia E, Blaveri E, Terris B, Wang YH, Costello E, Neoptolemos JP, Crnogorac-
Jurcevic T, Lemoine NR (2004). Analysis of gene expression in cancer cell lines
identifies candidate markers for pancreatic tumorigenesis and metastasis. Int. J.
Cancer 112:100–112.
118. Kriajevska MV, Cardenas MN, Grigorian MS, Ambartsumian NS, Georgiev GP,
Lukanidin EM (1994). Non-muscle myosin heavy chain as a possible target for
protein encoded by metastasis-related mts-1 gene. J. Biol. Chem. 269:19679–82.

- 88 - References
119. Takenaga K, Nakamura Y, Endo H, Sakiyama S (1994a). Involvement of S100-
related calcium-binding protein pEL98 (or mts 1) in cell motility and tumor cell
invasion. Jpn. J. Cancer Res. 85:831–39.
120. Van Aelst L, D’Souza-Schorey C (1997). Rho GTPases and signalling networks.
Genes Dev. 11:2295–322.
121. Aznar S, Lacal JC (2001). Rho signals to cell growth and apoptosis. Cancer Lett.
165:1–10.
122. Aznar S, Lacal JC (2001). Searching new targets for anticancer drug design: the
families of Ras, Rho GTPases and their effectors. Prog. Nucleic Acid Res. Mol. Biol.
67:193–234.
123. Schmitz AA, Govek EE, Bottner B, Van Aelst L (2000). Rho GTPases: signaling,
migration and invasion. Exp. Cell Res. 261:1–12.
124. Jiang WG, Watkins G, Lane J, Cunnick GH, Douglas-Jones A, et. al. (2003).
Prognostic value of rho GTPases and rho guanine nucleotide dissociation inhibitors
in human breast cancers. Clin. Cancer Res. 9:6432–40.
125. Fritz G, Brachetti C, Bahlmann F, Schmidt M, Kaina B (2002). Rho GTPases in
human breast tumors: expression and mutation analyses and correlation with
clinical parameters. Br. J. Cancer 87:635–44.
126. Fritz G, Just I, Kaina B (1999). Rho GTPases are over-expressed in human tumors.
Int. J. Cancer 81:682–87.
127. Eisenmann KM, McCarthy JB, Simpson MA, Keely PJ, Guan JL, et. al. (1999).
Melanoma chondroitin sulphate proteoglycan regulates cell spreading through
Cdc42, Ack-1 and p130cas. Nat. Cell Biol. 1:507–13.

- 89 - References
128. Lawrenson ID, Wimmer-Kleikamp SH, Lock P, Schoenwaelder SM, Down M, et. al.
(2002). Ephrin-A5 induces rounding, blebbing and deadhesion of EphA3-expressing
293T and melanoma cells by CrkII and Rho-mediated signalling. J. Cell Sci.
115:1059–72.
129. Attoub S, Noe V, Pirola L, Bruyneel E, Chastre E, et. al. (2000). Leptin promotes
invasiveness of kidney and colonic epithelial cells via phosphoinositide 3-kinase-,
rho- and rac-dependent signaling pathways. Faseb. J. 14:2329–38.
130. Varker KA, Phelps SH, King MM, Williams CL (2003). The small GTPase RhoA has
greater expression in small cell lung carcinoma than in nonsmall cell lung carcinoma
and contributes to their unique morphologies. Int. J. Oncol. 22:671–81.
131. Kamai T, Yamanishi T, Shirataki H, Takagi K, Asami H, et. al. (2004). Over
expression of RhoA, Rac1 and Cdc42 GTPases is associated with progression in
testicular cancer. Clin. Cancer Res. 10:4799–4805.
132. Takamura M, Sakamoto M, Genda T, Ichida T, Asakura H, et. al. (2001). Inhibition
of intrahepatic metastasis of human hepatocellular carcinoma by Rho-associated
protein kinase inhibitor Y-27632. Hepatology 33:577–81.
133. Mira JP, Benard V, Groffen J, Sanders LC, Knaus UG. (2000). Endogenous,
hyperactive Rac3 controls proliferation of breast cancer cells by a p21-activated
kinase-dependent pathway. PNAS 97:185–89.
134. Kawasaki Y, Sato R, Akiyama T. (2003). Mutated APC and Asef are involved in the
migration of colorectal tumor cells. Nat. Cell Biol. 5:211–15.
135. Jung ID, Lee J, Yun SY, Park CG, Choi WS, et. al. (2002). Cdc42 and Rac1 are
necessary for autotaxin-induced tumor cell motility in A2058 melanoma cells. FEBS
Lett. 532:351–56.

- 90 - References
136. Shieh DB, Godleski J, Herndon JE 2nd, Azuma T, Mercer H, et. al. (1999). Cell
motility as a prognostic factor in Stage I nonsmall cell lung carcinoma: the role of
gelsolin expression. Cancer 85:47–57.
137. Bouzahzah B, Albanese C, Ahmed F, Pixley F, Lisanti MP, et. al. (2001). Rho family
GTPases regulate mammary epithelium cell growth and metastasis through
distinguishable pathways. Mol. Med. 7:816–30.
138. Eisenmann KM, McCarthy JB, Simpson MA, Keely PJ, Guan JL, et. al. (1999).
Melanoma chondroitin sulphate proteoglycan regulates cell spreading through
Cdc42, Ack-1 and p130cas. Nat. Cell Biol. 1:507–13.
139. Abraham MT, Kuriakose MA, Sacks PG, Yee H, Chiriboga L, et. al. (2001). Motility-
related proteins as markers for head and neck squamous cell cancer. Laryngoscope
111:1285-89.
140. Brattsand G, Roos G, Marklund U, Ueda H, Landberg G, Nanberg R, Sideras P and
Gullberg M (1993). Quantitative analysis of the expression and regulation of an
activation-regulated phosphoprotein (oncoprotein 18) in normal and neoplastic cells.
Leukemia 7:569-79.
141. Ghosh PK anderson J, Cohen N, Takeshita K, Atweh GF and Lebowitz P(1993).
Expression of the leukemia-associated gene, p18, in normal and malignant tissues;
inactivation of expression in a patient with cleaved B cell lymphoma/leukemia.
Oncogene 8:2869-72.
142. Jeha S, Luo XN, Beran M, Kantarijan H and Atweh GF (1996). Antisense RNA
inhibition of phosphoprotein p18 expression abrogates the transformed phenotype
of leukemic cells. Cancer Res. 56:1445-50.
143. Sobel A (1991). Stathmin: a relay phosphoprotein for multiple signal transduction?.
Trends Biochem. Sci. 16:301-6.
- 91 - References
144. Luo XN, Arcasoy MO, Brickner HE, Mistry S, Schechter AD and Atweh GF (1991).
Regulated expression of p18, a major phosphoprotein of leukemic cells. J. Biol.
Chem. 266:21004-10.
145. Schubart UK, Xu J, Fan W, Genhong C, Goldstein H, Alpini G, Shafrhtz DA, Amat
JA, Muhammad F, Norton WT, et. al. (1992). Widespread differentiation stage-
specific expression of the gene encoding phosphoprotein p19 (metablastin) in
mammalian cells. Differentiation 51:21-32.
146. Belmont LD and Mitchison TJ (1996). Identification of a protein that interacts with
tubulin dimmers and increases the catastrophe rate of microtubules. Cell 84:623-31.
147. Marklund U, Larsson N, Melander H, Brattsand G and Gullberg M (1996).
Oncoprotein 18 is a phosphorylation-responsive regulator of microtubule dynamics.
EMBO J. 15:5290-98.
148. Gundersen GG and Cook TA (1999). Microtubules and signal transduction. Curr.
Opin. Cell Biol. 11:81–94.
149. Arber S, Barbayannis FA, Hanser H, Schneider C, Stanyon CA, Bernard O and
Caroni P (1998). Regulation of actin dynamics through phosphorylation of cofilin by
LIM-kinase. Nature 393:805–9.
150. Yang N, Higuchi O, Ohashi K, Nagata K, Wada A, Kangawa K, Nishida E and
Mizuno K (1998). Cofilin phosphorylation by LIM-kinase 1 and its role in Rac-
mediated actin reorganization. Nature 393:809–12.
151. Dan C, Kelly A, Bernard O and Minden A (2001). Cytoskeletal changes regulated by
the PAK4 serine/threonine kinase are mediated by LIM kinase 1 and cofilin. J. Biol.
Chem. 276: 32115–21.

- 92 - References
152. Maekawa M, Ishizaki T, Boku S, Watanabe N, Fujita A, Iwamatsu A, Obinata T,
Ohashi K, Mizuno K and Narumiya S (1999). Signaling from Rho to the actin
cytoskeleton through protein kinases ROCK and LIM-kinase. Science 285:895–98.
153. Carlier MF, Laurent V, Santolini J, Melki R, Didry D, Xia GX, Hong Y, Chua NH and
Pantaloni D (1997). Actin depolymerizing factor (ADF/cofilin) enhances the rate of
filament turnover: implication in actin-based motility. J. Cell Biol. 136:1307–22.
154. Moriyama K, Iida K and Yahara I (1996). Phosphorylation of Ser-3 of cofilin
regulates its essential function on actin. Genes Cells 1:73–78.
155. Agnew BJ, Minamide LS and Bamburg JR (1995). Reactivation of phosphorylated
actin depolymerizing factor and identification of the regulatory site. J. Biol. Chem.
270:17582–87.
156. Morgan TE, Lockerbie RO, Minamide LS, Browning MD and Bamburg JR (1993).
Isolation and characterization of a regulated form of actin depolymerizing factor. J.
Cell Biol. 122:623–33.

- 93 - Publications & Posters
Publications Mustafa T, Eckert A, Klonisch T, Kehlen A, Maurer P, Klintschar M, Erhuma M, Zschoyan
R, Gimm O, Dralle H, Schubert J, Hoang-Vu C (2005). Expression of the Epidermal
Growth Factor Seven-Transmembrane Member CD97 Correlates with Grading and
Staging in Human Oral Squamous Cell Carcinomas Cancer Epidemiol Biomarkers
Prev.14:108-119.
Erhuma M, Köbel M, Mustafa T, Wulfänger J, Dralle H, Hoang-Vu C, Langner J, Seliger
B, Kehlen A (2007). Expression of neutral endopeptidase (NEP/CD10) on pancreatic
tumor cell lines, pancreatitis and pancreatic tumor tissues. Int J Cancer.120:2393-400.
Erhuma M, Radam C, Schlaf G, Seliger B, Behre G, Altermann WW (2007). A novel HLA-
A*29 allele (A*2916) of a Caucasian relative to an ALL patient containing a point mutation
in a putatively conserved region which was identified through the loss of a specific
amplificate in a low-resolution SSP-PCR kit. Int J Immunogenet.34:235-6.
Schlaf G, Erhuma M, Seliger B, Foell J, Altermann WW (2007). A novel HLA-B*35
(B*3570) allele of a Caucasian family differing with one amino acid mismatch from HLA-
B*3503 allele in exon 4. Tissue Antigens.70:72-3.
Altermann WW, Erhuma M, Seliger B, Schlaf G (2007). A novel HLA-A*33 (A*3309) allele
in a Caucasian family that differs at protein position 66 from HLA-A*3308. Tissue
Antigens. 70:69-70.
Posters Erhuma M, Hoang- Vu C, Klonisch T, Langner J, Kehlen A (2002). Dipeptidyl peptidase
IV expression and regulation in pancreatic carcinoma. Poster. Mitteldeutscher
Chirurgenkongress, Leipzig.
Erhuma M, Hoang- Vu C, Klonisch T, Langner J, Kehlen A (2002). Dipeptidyl peptidase
IV expression and regulation in pancreatic carcinoma. Poster: Tagung der Deutschen
Anatomischen Gesellschaft, Würzburg.
Chen Z, Mustafa T, Erhuma M, Hombach- Klonisch S, Nguyen TP, Brauckhoff M, Dralle
H, Hoang- Vu C (2004). CD82: a novel metastasis suppressor gene in human thyroid
carcinoma. Poster. Congress of „International Association of Endocrine Surgeons”,
Uppsala, Schweden.

- 94 - Publications & Posters
UD. Immel, Erhuma M, T. Mustafa, M. Kleiber and M. Klintschar (2005). Y-chromosomal
STR haplotypes in an Arab population from Libya. Progress in Forensic Genetics 11-
Proceedings of the 21st International ISFG Congress Ponta Delgada, The Azores,
Portugal.
Z Chen, Erhuma M, K Rabara, B Trojanowicz, J Bialek, O Gimm, T Klonisch, R Finke, H
Dralle, C Hoang-Vu (2007). Expression of embryonic stem cell marker OCT4 in human
thyroid neoplasia. Abstract in Exp Clin Endocrinol Diabetes; 115 Salzburg, Austria.
Zhouxun Chen, Rainer Finke, Karoline Rabara, Erhuma Mabruk, Oliver Gimm, Thomas
Klonisch, Henning Dralle and Cuong Hoang-Vu (2007). Embryonic stem cell marker OCT4
is expressed in human thyroid neoplasia: new evidence supporting the thyroid fetal cell
carcinogenesis hypothesis. Abstract in American Association for Cancer Research Annual
Meeting;14-18 Los Angeles, CA, USA.

- 95 - Declaration
Eidesstattliche Erklärung Hiermit erkläre ich, die vorliegende Arbeit selbstständig und ohne fremde Hilfe und nur
unter Verwendung der angegebenen Quellen und Hilfsmittel angefertigt zu haben. Die
Stellen der Arbeit, die anderen Werken in Wort, Bild oder dem Sinn nach entnommen
sind, wurden als Entlehnung kenntlich gemacht. Es wurde weder diese noch eine andere
Arbeit zur Erlangung des Doktorgrades an einer anderen Einrichtung vorgelegt.
Halle (Saale), Mabruk Erhuma

Acknowledgment
Here with pleasure I am grateful to all the persons, who strongly supported me to carry out
this work.
First and foremost, my heartily profound thanks gratitude and appreciation are addressed
to my Prof. Dr. med. habil. Jürgen Langner, for the encouragement, good chance to post
graduate in the very interesting Immunology field, kindly help and strongly support.
My heartily profound thanks gratitude and appreciation are addressed to PD Dr. Cuong
Hoang-Vu, PD Dr. Astrid Kehlen and Prof. med. habil. Dr. rer. nat. Barbara Seliger, for
invaluable technical and editorial advice, suggestions, discussions and guidance were a
real support to complete this dissertation.
I would like to express my deepest gratitude and thanks for PD Dr. med. Dagmar
Riemann and Dipl. Biochem. Jens Wulfänger for strongly support and nicely help.
My deepest gratitude and thanks for Mrs. Kathrin Hammje, for nicely arrangement,
excellent technical support, Dipl. Biologin Yvonne Radestock for greatly help to perform
western blot result and Dr. Carsten Sekulla for kindly helping in statistic and fine
decoration of my thesis .
Furthermore, I would like to express my deepest gratitude and thanks to all staff members
of Immunology and ECHO lab for contributing to such an inspiring and pleasant
atmosphere.
Also my deepest gratitude and thanks for Univ.-Prof. Dr. Reinhard Dammann and his
team to learn methylation method.
I would like also sincerely to thank for strong help and acceptance to be a fellow in the
Biology Department, this thank goes to Prof. Hans-Jörg Ferenz, Prof. Frank Siegemund,
Prof. Gerald Moritz.
Finally, my deepest gratitude and thanks for my country, specially ministry of education for
deeply support and finance.

Angaben zur Person und zum Bildungsgang
Angaben zur Person Name Mabruk Erhuma H. Erhuma
Geschlecht männlich
Geboren am 19.08.1965
Familienstatus ledig
Staatsangehörigkeit Libyen
Bildungsgang und Beruf 1971-1976 Grundschule
1977-1979 Realschule
1980-1982 Gymnasium
1983-1986 Studium der Biologie/Fachgebiet Zoologie an der Alfateh
Universität in Tripolis-Libyen
1988-1999 wissenschaftlicher Mitarbeiter im Krankenhauslabor des
Zentralkrankenhauses Tripolis-Libyen
01.2000-08.2000 Deutschkurs am Goethe Institut Bonn
seit 09.2000 Gastwissenschaftlicher am Institut für Immunologie und im
Labor für experimentelle chirurgische Onkologie der
Medizinischen Fakultät der MLU Halle-Wittenberg
04.2004 Diplom Arbeit am Institut für Biologie der Martin-Luther-
Universität Halle-Wittenberg