4.3 aquality and greenhouse gases
TRANSCRIPT

4.3 AIR QUALITY AND GREENHOUSE GASES
4.3-1
This section examines the potential air quality and climate change impacts associated with the Proposed General Plan and Focused Growth Plan. This section is divided into Local Air Quality and Greenhouse Gases sections, each of which contains regulatory framework, existing conditions, standards of significance, and impact discussion subsections. In this section, “emission” refers to the actual quantity of pollutant, measured in pounds per day. “Concentration” refers to the amount of pollutant mate-rial per volumetric unit of air. Concentrations are measured in parts per mil-lion (ppm) or micrograms per cubic meter (μg/m3).
A. Local Air Quality
1. Regulatory Framework This section summarizes major federal, State, and City statutes, regulations and policies that would apply to the projects. At the federal level, the United States Environmental Protection Agency (EPA) administers the federal Clean Air Act (CAA). The California CAA is administered by the California Air Resources Board (CARB) at the State level and by the Air Pollution Control and Air Quality Management Districts at the regional and local levels. The South Coast Air Quality Management District (SCAQMD) includes portions of four counties in Southern California, including the portion of San Bernar-dino County containing the City of Chino. California is divided into 15 regional air basins for the purpose of managing air resources at the regional level. Air basins not in federal or State attain-ment for a particular pollutant are classified as moderate, serious, severe, or extreme. The City of Chino lies within the South Coast Air Basin (SCAB).
The regulatory framework described below details the federal and State agen-cies that are in charge of monitoring and controlling mobile and stationary source air pollutants and what measures are currently being taken to achieve and maintain healthful air quality in the SCAB. Mobile sources of air pollu-tion include on-road vehicles and off-road equipment such as airplanes, trains

C I T Y O F C H I N O
G E N E R A L P L A N D R A F T E I R A I R Q U A L I T Y A N D G R E E N H O U S E G A S E S
4.3-2
and agricultural and construction equipment.1 On-road vehicles such as cars, trucks, and buses are responsible for more than half of all air pollution in the SCAB. State and federal agencies such as CARB and the EPA establish emis-sion standards for mobile sources. Reducing mobile source emissions requires technological improvement of existing mobile sources and the examination of future mobile sources such as those associated with new or modification pro-jects. Stationary sources of air pollution are generally regulated through the permitting process as implemented by the local air district. a. Federal Regulations The EPA is responsible for enforcing the federal CAA. The EPA regulates emission sources that are under the exclusive authority of the federal govern-ment, such as aircraft, ships, and certain types of locomotives. The EPA has jurisdiction over emission sources outside State waters (e.g. beyond the outer continental shelf) and establishes various emission standards, including those for vehicles sold in states other than California (automobiles sold in Califor-nia must meet the stricter emission standards established by CARB). i. Criteria Pollutants and National Ambient Air Quality Standards The EPA is responsible for establishing National Ambient Air Quality Stan-dards (NAAQS), which are required under the 1970 federal CAA and subse-quent amendments. These standards represent the maximum levels of back-ground pollution considered safe, with an adequate margin of safety, to pro-tect the public health and welfare. The EPA developed primary and secon-dary ambient air quality standards in 1971. The primary NAAQS are in-tended to provide an adequate margin of safety to protect public health. The secondary standards are intended to protect the public welfare from known or anticipated adverse effects associated with the presence of ambient air pol-lutants (42 U.S.C. 7409[b][2]). The primary standards were established to include a margin of safety and consider the long-term exposure for the most
1 Scorecard 2009, Pollution Locator – Definitions of Air Pollution Source
Categories, The Pollution Information Site, http://www.scorecard.org/ env-releases/def/air_source.html, accessed on September 2, 2009.

C I T Y O F C H I N O
G E N E R A L P L A N D R A F T E I R A I R Q U A L I T Y A N D G R E E N H O U S E G A S E S
4.3-3
sensitive groups in the general population (i.e. children, senior citizens, and people with breathing difficulties). The EPA initially designated six pollutants of primary concern: ozone (O3), carbon monoxide (CO), sulfur dioxide (SO2), nitrogen dioxide (NO2), lead, and suspended particulates that are 10 microns or less in diameter (PM10). In 1997, the EPA promulgated a new eight-hour ozone standard of eight parts per hundred million (pphm) to replace the existing one-hour standard of 12 pphm, and a new standard for “fine” particulate matter that is 2.5 microns or less in diameter (PM2.5). The criteria pollutants are described below.
♦ Carbon Monoxide: CO, a colorless and odorless gas, interferes with the transfer of oxygen to the brain. It can cause dizziness and fatigue, and can impair central nervous system functions. CO is emitted almost ex-clusively from the incomplete combustion of fossil fuels. CO is a non-reactive air pollutant that dissipates relatively quickly, so ambient CO concentrations generally follow the spatial and temporal distributions of vehicular traffic.
♦ Ozone: Ground-level ozone, O3, is the principal component of smog. Ozone is not directly emitted into the atmosphere, but instead forms through a photochemical reaction of reactive organic gases (ROG) and nitrogen oxides (NOX), which are known as ozone precursors. Motor vehicles create the majority of ROG and nitrogen oxide emissions in San Bernardino County. Ozone levels are highest from late spring through autumn when precursor emissions are high and meteorological condi-tions are warm and stagnant.
Exposure to levels of ozone above current NAAQS can lead to human health effects such as lung inflammation, tissue damage, and impaired lung functioning. Ozone exposure is also associated with symptoms such as coughing, chest tightness, shortness of breath, and the worsening of asthma symptoms. The groups with the greatest risk for harmful health effects are outdoor workers, athletes, children, and others who spend greater amounts of time outdoors during smoggy periods. Elevated ozone levels can reduce crop and timber yields, as well as damage native

C I T Y O F C H I N O
G E N E R A L P L A N D R A F T E I R A I R Q U A L I T Y A N D G R E E N H O U S E G A S E S
4.3-4
plants. Ozone can also damage materials such as rubber, fabrics, and plastics.
♦ Nitrogen Dioxide: NO2, a reddish-brown gas, irritates the lungs. It can cause breathing difficulties at high concentrations. Like O3, NO2 is not directly emitted, but is formed through a reaction between nitric oxide (NO) and atmospheric oxygen. NO and NO2 are collectively referred to as nitrogen oxides (NOx) and are major contributors to O3 formation. NO2 also contributes to the formation of PM10 (see discussion of PM10 be-low).
♦ Sulfur Oxides: Sulfur oxides, primarily SO2, are a product of high-sulfur fuel combustion. The main sources of SO2 are coal and oil used in power stations, in industries and for domestic heating. Industrial chemical manufacturing is another source of SO2. SO2 is an irritant gas that attacks the throat and lungs. It can cause acute respiratory symptoms and dimin-ished ventilator function in children.
♦ Suspended Particulate Matter: Particulate matter is a complex mixture of tiny particles that consists of dry solid fragments, solid cores with liq-uid coatings, and small droplets of liquid. These particles vary greatly in shape, size, and chemical composition, and can be made up of many dif-ferent materials such as metals, soot, soil, and dust. Particles 10 microns or less in diameter (PM10) are defined as “respirable particulate matter.” Fine particles are 2.5 microns or less in diameter (PM2.5) and can contrib-ute significantly to regional haze and reduction of visibility.
Inhalable particulates come from smoke, dust, aerosols, and metallic ox-ides. Although particulates are found naturally in the air, most particu-late matter found in the area are emitted either directly or indirectly by motor vehicles, industry, construction, agricultural activities, and wind erosion of disturbed areas. Most PM2.5 is comprised of combustion prod-ucts such as smoke.
That portion of the SCAB containing the project area has been designated a “Severe 17” non-attainment area for the eight-hour ozone standard under Subpart 2 of Part D of the federal CAA, which became effective on June 15,

C I T Y O F C H I N O
G E N E R A L P L A N D R A F T E I R A I R Q U A L I T Y A N D G R E E N H O U S E G A S E S
4.3-5
2004.2 As a Severe 17 area subject to Subpart 2, and per section 181(a) of the federal CAA, the period of attainment for the eight-hour ozone standard will be no more than 17 years from the effective date of designation.3 Conse-quently, the SCAB must demonstrate attainment of the eight-hour ozone standard by June 15, 2021. Also, per the EPA’s final rule for implementing the 8-hour ozone standard, the 1-hour ozone standard was to be revoked “in full, including the associated designations and classifications, one year following the effective date of the designations for the eight-hour NAAQS [for ozone].”4 As such, the one-hour ozone standard was revoked in the SCAB on June 15, 2005. Requirements for transitioning from the one-hour to eight-hour ozone standard are de-scribed in the final rule. That portion of the SCAB containing the project area has been designated a non-attainment area for the PM10 standard, and was reclassified from a mod-erate to serious non-attainment area on February 8, 1993.5 That portion of the SCAB containing the project area has been designated a non-attainment area for the PM2.5 standard, effective April 5, 2005.6 Under Section 172(b) of the CAA, the SCAQMD has up to three years from the date of the final designation to submit a State Implementation Plan (SIP) that in-cludes, among other things, a demonstration showing how it will attain the
2 EPA 2004a. Air Quality Designations and Classifications for the 8-Hour
Ozone National Ambient Air Quality Standards; Early Action Compact Areas with Deferred Effective Dates; Final Rule. Federal Register 69(84):23857-23951.
3 EPA 2004b. Final Rule To Implement the 8-Hour Ozone National Ambi-ent Air Quality Standard – Phase 1; Final Rule. Federal Register 69(84):23951-24000,.,.
4 69 FR 23951. 5 58 FR 3334. 6 EPA, 2004c. Air Quality Designations and Classifications for the Fine
Particles (PM2.5) National Ambient Air Quality Standards; Final Rule. Federal Regis-ter 70(3):944-1019.

C I T Y O F C H I N O
G E N E R A L P L A N D R A F T E I R A I R Q U A L I T Y A N D G R E E N H O U S E G A S E S
4.3-6
ambient standards by the specified attainment date.7 The latest plan, the 2007 Air Quality Management Plan, was adopted by the SCAQMD Governing Board on June 1, 2007. Attainment of the PM2.5 standards must be achieved 10 years after the final designation date.8 Consequently, the SCAB must demonstrate attainment by April 5, 2015. In 2006, the EPA adopted revisions to the primary NAAQS for particulate matter. The EPA strengthened the 24-hour PM2.5 standard to 35 μg/m3 and retained the annual PM2.5 standard at 15 μg/m3. The agency retained the 24-hour PM10 standard of 150 μg/m3, and revoked the annual average PM10 stan-dard due to the lack of evidence linking health problems to long-term expo-sure to coarse particle pollution.9 In 2008, the EPA revised the primary standard for lead from 1.5 μg/m3 to 0.15 μg/m3 over a rolling three-month period, and revised the secondary standard to be identical to the primary standard. The 1978 lead NAAQS will be retained until one year after designations for the new standards, except in current nonattainment areas. The SCAB is in attainment of the 1978 lead NAAQS. CARB was required to provide the EPA with designation recommendations by October 2009 and on October 14, 2009 the CARB recommended to the EPA that the Los Angeles County portion of the SCAB be designated non-attainment for the new lead standard. With the exception of Imperial County (which was recommended for designation as attainment), the remaining por-tions of the State, including the City of Chino were recommended to be des-ignated as unclassifiable because there are insufficient monitoring data. The EPA has one year to review the recommendations and must promulgate final
7 70 FR 65984. 8 SCAQMD, 2005, Guidance Document for Addressing Air Quality Issues in
General Plans and Local Planning – A Reference for Local Governments Within the South Coast Air Quality Management District..
9 U.S. EPA PM Standards, 2008, http://www.epa.gov/particles/ standards.html, accessed on December 4, 2008.

C I T Y O F C H I N O
G E N E R A L P L A N D R A F T E I R A I R Q U A L I T Y A N D G R E E N H O U S E G A S E S
4.3-7
area designations by October 15, 2010. State implementation plans for nonat-tainment areas are due 18 months after the EPA makes the final designations. A nonattainment area must attain the new lead standard within five years of the nonattainment designation. Although the CARB was required to make area designation recommenda-tions by October 2009, the EPA recognizes that the current lead sampling network is not adequate in most areas. Therefore, the EPA may take an addi-tional two years to designate areas with insufficient data. New lead samplers will be deployed during this time period to collect additional data needed to identify designations for many areas with no or limited monitoring data. It is unknown at this time how this may affect the designation of the Chino area.10 The SCAB is designated attainment for CO, NO2, and SO2. The federal NAAQS are periodically reviewed and revised. The current fed-eral NAAQS are presented in Table 4.3-1, along with the State standards.11 b. State Regulations The EPA allows states the option of developing different (stricter) standards. California has generally set more stringent limits on the seven criteria pollut-ants (see Table 4.3-1). The California CAA, effective January 1, 1989, re-quires that districts implement regulations to reduce emissions from mobile sources through the adoption and enforcement of transportation control measures. The California CAA requires that a district must:
10 State of California, 2009. Transmittal Letter to EPA for New Federal
Lead Standard Area Designation Recommendations. California Air Resources Board. October 14. Accessed from the CARB website at http://www.arb.ca.gov/desig/ feddesig.htm on December 21, 2009.
11 California Air Resources Board. 2008, Ambient Air Quality Standards, http://www.arb.ca.gov/research/aaqs/aaqs2.pdf, accessed on August 18, 2009.

CI
TY
O
F
CH
IN
O
GE
NE
RA
L
PL
AN
D
RA
FT
E
IR
A
IR
Q
UA
LI
TY
A
ND
G
RE
EN
HO
US
E
GA
SE
S
4.3-
8
TA
BLE
4.3-
1 S
TA
TE
AN
D F
ED
ER
AL
AM
BIE
NT
AIR
QU
AL
ITY
ST
AN
DA
RD
S
Cal
ifor
nia
Stan
dard
sa Fe
dera
l Sta
ndar
dsb
Pollu
tant
A
vera
ging
Tim
e C
once
ntra
tion
c M
etho
dd Pr
imar
yc,e
Seco
ndar
yc,f
Met
hodg
1 H
our
0.09
ppm
(180
μg/
m3 )
-- O
zone
(O3)
8 H
ours
0.
07 p
pm (1
37 μ
g/m
3 ) U
ltrav
iole
t Ph
otom
etry
0.
075
ppm
(147
μg/
m3 )
Sam
e as
Pri
mar
y St
anda
rd
Ultr
avio
let
Phot
omet
ry
24 H
ours
50
μg/
m3
150 μg
/m3
Res
pira
ble
Pa
rtic
ulat
e M
atte
r (P
M10
) A
nnua
l
Ari
thm
etic
Mea
n 20
μg/
m3
Gra
vim
etri
c or
Be
ta A
tten
uatio
n –
Sam
e as
Pr
imar
y St
anda
rd
Iner
tial
Sepa
ratio
n an
d
Gra
vim
etic
Ana
lysis
24 H
ours
N
o Se
para
te S
tate
Sta
ndar
d 35
μg/
m3
Fine
Pa
rtic
ulat
e M
atte
r
(PM
2.5)
Ann
ual
Ari
thm
etic
Mea
n 12
μg/
m3
Gra
vim
etri
c or
Be
ta A
tten
uatio
n 15
μg/
m3
Sam
e as
Pri
mar
y St
anda
rd
Iner
tial S
epar
atio
n an
d G
ravi
met
ic
Ana
lysis
8 H
ours
9.
0 pp
m (1
0 μg
/m3 )
9 pp
m (1
0 m
g/m
3 )
1 H
our
20 p
pm (2
3 μg
/m3 )
35 p
pm (4
0 m
g/m
3 ) N
one
Non
-Disp
ersiv
e In
frar
ed P
hoto
met
ry
(ND
IR)
Car
bon
M
onox
ide
(C
O)
8 H
ours
(L
ake T
ahoe
) 6
ppm
(7 μ
g/m
3 )
Non
-disp
ersiv
e In
frar
ed P
hoto
met
ry
(ND
IR)
– –
–
Ann
ual
Ari
thm
etic
Mea
n 0.
030
ppm
(57
μg/
m3 )
0.05
3 pp
m (1
00 μ
g/m
3 ) N
itrog
en
Dio
xide
(N
O2)
1 H
our
0.18
ppm
(339
μg/
m3 )
Gas
Pha
se
Che
milu
min
esce
nce
–
Sam
e as
Pri
mar
y St
anda
rd
Gas
Pha
se
Che
milu
min
esce
nce
30 d
ays A
vg.
1.5 μg
/m3
– –
Cal
enda
r Q
uart
er
– 1.
5 μg
/m3
Sam
e as
Pri
mar
y St
anda
rd
Lead
h
Rol
ling
3-
Mon
th A
vg.i
–
Ato
mic
Abs
orpt
ion
0.15
μg/
m3
Sam
e as
Pri
mar
y St
anda
rd
Hig
h V
olum
e Sa
mpl
er a
nd
Ato
mic
Abs
orpt
ion
Ann
ual
Ari
thm
etic
Mea
n –
0.03
0 pp
m (8
0 μg
/m3 )
–
24 H
ours
0.
04 p
pm (1
05 μ
g/m
3 ) 0.
14 p
pm (3
65 μ
g/m
3 ) –
3 H
ours
–
– 0.
5 pp
m (1
300 μg
/m3 )
Sulfu
r D
ioxi
de
(SO
2)
1 H
our
0.25
ppm
(655
μg/
m3 )
Ultr
avio
let
Fluo
resc
ence
– –
Para
roso
anili
ne

CI
TY
O
F
CH
IN
O
GE
NE
RA
L
PL
AN
D
RA
FT
E
IR
A
IR
Q
UA
LI
TY
A
ND
G
RE
EN
HO
US
E
GA
SE
S
TA
BLE
4.3-
1 S
TA
TE
AN
D F
ED
ER
AL
AM
BIE
NT
AIR
QU
AL
ITY
ST
AN
DA
RD
S (C
ON
TIN
UED
)
4.3-
9
Cal
ifor
nia
Stan
dard
sa Fe
dera
l Sta
ndar
dsb
Pollu
tant
A
vera
ging
Tim
e C
once
ntra
tion
c M
etho
dd Pr
imar
yc,e
Seco
ndar
yc,f
Met
hodg
Visi
bilit
y
Red
ucin
g
Part
icle
s 8
Hou
rs
Extin
ctio
n co
effic
ient
of 0
.23
per
kilo
met
er–
visib
ility
of 1
0 m
iles o
r m
ore
(0.0
7–30
mile
s or
mor
e fo
r La
ke T
ahoe
) due
to p
artic
les w
hen
rela
tive
hum
idity
is le
ss th
an 7
0 pe
rcen
t. M
etho
d: B
eta
Att
enua
tion
and
Tra
nsm
ittan
ce th
roug
h Fi
lter
Tap
e.
No
Fede
ral S
tand
ards
Sulfa
tes
24 H
ours
25
μg/
m3
Ion
Chr
omat
ogra
phy
No
Fede
ral S
tand
ards
Hyd
roge
n Su
lfide
1
Hou
r 0.
03 p
pm (4
2 μg
/m3 )
Ultr
avio
let
Fluo
resc
ence
N
o Fe
dera
l Sta
ndar
ds
Vin
yl C
hlor
ideh
24 H
ours
0.
01 p
pm (2
6 μg
/m3 )
Gas
Chr
omat
ogra
phy
No
Fede
ral S
tand
ards
N
otes
: pp
m =
par
ts p
er m
illio
n; μ
g/m
3 = m
icro
gram
s per
cub
ic m
eter
. a
Cal
iforn
ia st
anda
rds f
or o
zone
, car
bon
mon
oxid
e (e
xcep
t Lak
e T
ahoe
), su
lfur
diox
ide
(1- a
nd 2
4-ho
ur),
nitr
ogen
dio
xide
, sus
pend
ed p
artic
ulat
e m
atte
r—PM
10, P
M2.
5, an
d vi
sibili
ty r
educ
ing
part
i-cl
es a
re v
alue
s tha
t are
not
to b
e ex
ceed
ed.
All
othe
rs a
re n
ot to
be
equa
led
or e
xcee
ded.
Cal
iforn
ia a
mbi
ent a
ir q
ualit
y st
anda
rds a
re li
sted
in th
e T
able
of S
tand
ards
in S
ectio
n 70
200
of T
itle
17 o
f th
e C
alifo
rnia
Cod
e of
Reg
ulat
ions
. b
Nat
iona
l sta
ndar
ds (o
ther
than
ozo
ne, p
artic
ulat
e m
atte
r, a
nd th
ose
base
d on
ann
ual a
vera
ges o
r an
nual
ari
thm
etic
mea
n) a
re n
ot to
be
exce
eded
mor
e th
an o
nce
a ye
ar.
The
ozo
ne st
anda
rd is
at
tain
ed w
hen
the
four
th h
ighe
st e
ight
-hou
r co
ncen
trat
ion
in a
yea
r, a
vera
ged
over
thre
e ye
ars,
is eq
ual t
o or
less
than
the
stan
dard
. Fo
r PM
10, t
he 2
4-ho
ur st
anda
rd is
att
aine
d w
hen
the
expe
cted
nu
mbe
r of
day
s per
cal
enda
r ye
ar w
ith a
24-
hour
ave
rage
con
cent
ratio
n ab
ove
150 μg
/m3 is
equ
al to
or
less
than
one
. Fo
r PM
2.5,
the
24-h
our
stan
dard
is a
ttai
ned
whe
n 98
per
cent
of t
he d
aily
co
ncen
trat
ions
, ave
rage
d ov
er th
ree
year
s, ar
e eq
ual t
o or
less
than
the
stan
dard
. C
onta
ct U
.S. E
PA fo
r fu
rthe
r cl
arifi
catio
n an
d cu
rren
t fed
eral
pol
icie
s. c
Con
cent
ratio
n ex
pres
sed
first
in u
nits
in w
hich
it w
as p
rom
ulga
ted.
Equ
ival
ent u
nits
giv
en in
par
enth
eses
are
bas
ed u
pon
a re
fere
nce
tem
pera
ture
of 2
5º C
and
a r
efer
ence
pre
ssur
e of
760
torr
. M
ost m
easu
rem
ents
of a
ir q
ualit
y ar
e to
be
corr
ecte
d to
a r
efer
ence
tem
pera
ture
of 2
5º C
and
a r
efer
ence
pre
ssur
e of
760
torr
; ppm
in th
is ta
ble
refe
rs to
ppm
by
volu
me,
or
mic
rom
oles
of p
ollu
t-an
t per
mol
e of
gas
. d
Any
equ
ival
ent p
roce
dure
whi
ch c
an b
e sh
own
to th
e sa
tisfa
ctio
n of
the
AR
B to
giv
e eq
uiva
lent
res
ults
at o
r ne
ar th
e le
vel o
f the
air
qua
lity
stan
dard
may
be
used
. e
Nat
iona
l Pri
mar
y St
anda
rds:
The
leve
ls of
air
qua
lity
nece
ssar
y, w
ith a
n ad
equa
te m
argi
n of
safe
ty, t
o pr
otec
t the
pub
lic h
ealth
. f N
atio
nal S
econ
dary
Sta
ndar
ds:
The
leve
ls of
air
qua
lity
nece
ssar
y to
pro
tect
the
publ
ic w
elfa
re fr
om a
ny k
now
n or
ant
icip
ated
adv
erse
effe
cts o
f a p
ollu
tant
. g
Ref
eren
ce m
etho
d as
des
crib
ed b
y th
e EP
A.
An
“equ
ival
ent m
etho
d” o
f mea
sure
men
t may
be
used
but
mus
t hav
e a
“con
siste
nt r
elat
ions
hip
to th
e re
fere
nce
met
hod”
and
mus
t be
appr
oved
by
the
EPA
. h
The
AR
B ha
s ide
ntifi
ed le
ad a
nd v
inyl
chl
orid
e as
“to
xic
air
cont
amin
ants
” w
ith n
o th
resh
old
leve
l of e
xpos
ure
for
adve
rse
heal
th e
ffect
s det
erm
ined
. T
hese
act
ions
allo
w fo
r th
e im
plem
enta
tion
of c
ontr
ol m
easu
res a
t lev
els b
elow
the
ambi
ent c
once
ntra
tions
spec
ified
for
thes
e po
lluta
nts.
i N
atio
nal l
ead
stan
dard
, rol
ling
3-m
onth
ave
rage
: fin
al r
ule
signe
d O
ctob
er 1
5, 2
008.

C I T Y O F C H I N O
G E N E R A L P L A N D R A F T E I R A I R Q U A L I T Y A N D G R E E N H O U S E G A S E S
4.3-10
♦ Demonstrate the overall effectiveness of the air quality program;
♦ Reduce non-attainment pollutants at a rate of 5 percent per year, or in-clude all feasible measures and an expeditious adoption schedule;
♦ Ensure no net increase in emissions from new or modified stationary sources;
♦ Reduce population exposure to severe non-attainment pollutants accord-ing to a prescribed schedule;
♦ Include any other feasible controls that can be implemented, or for which implementation can begin, within 10 years of adoption of the most re-cent air quality plan; and
♦ Rank control measures by cost effectiveness.12
The CARB has recently updated the standards for ozone and particulate mat-ter. In April 2005, CARB approved a new eight-hour ozone standard of 0.07 ppm and retained the one-hour ozone standard of 0.09 ppm after an extensive review of the scientific literature. Evidence from the reviewed studies indi-cates that significant harmful health effects could occur among both adults and children if exposed to levels above these standards. Extensive research reviewed by CARB indicates that exposure to outdoor PM10 and PM2.5 levels exceeding current NAAQS is associated with increased risk of hospitalization for lung and heart-related respiratory illness, including emergency room visits for asthma. Particulate matter exposure is also associ-ated with increased risk of premature deaths, especially in the elderly and people with pre-existing cardiopulmonary disease. In children, studies have shown associations between particulate matter exposure and reduced lung function and increased respiratory symptoms and illnesses. Besides reducing visibility, the acidic portion of particulate matter (nitrates, sulfates) can harm crops, forests, aquatic, and other ecosystems. In June 2002, CARB adopted new AAQS for PM10 and PM2.5, resulting from an extensive review of the
12 SCAQMD, 2003, Final 2003 Air Quality Management Plan.

C I T Y O F C H I N O
G E N E R A L P L A N D R A F T E I R A I R Q U A L I T Y A N D G R E E N H O U S E G A S E S
4.3-11
health-based scientific literature. The EPA recently updated the 24-hour standard for PM2.5 and eliminated the annual PM10 standard.
i. California Environmental Quality Act The California Environmental Quality Act (CEQA) was adopted in 1970 to inform governmental decision makers about potential environmental impacts of a project, discuss ways to reduce adverse impacts, and offer alternatives to a project. Under CEQA, the SCAQMD acts as a lead agency responsible for preparing an environmental analysis, and as a commenting agency responsible for reviewing air quality assessments prepared by other public agencies. ii. California Air Resources Board CARB, which is part of the California Environmental Protection Agency (Cal/EPA), is responsible for meeting the State requirements of the federal CAA, administering the California CAA, and establishing the California Ambient Air Quality Standards (CAAQS). The California CAA, as amended in 1992, requires all air districts in the State to endeavor to achieve and main-tain the CAAQS. CARB oversees the functions of local air pollution control districts and air quality management districts, which in turn administer air quality activities at the regional and county level. While pollutants regulated under the California CAA are similar to those regulated under the federal CAA, the CAAQS are generally more stringent than the corresponding fed-eral standards and incorporate additional standards for sulfates, hydrogen sul-fide, vinyl chloride, and visibility-reducing particles. CARB regulates mobile air pollution sources, such as motor vehicles, and is responsible for setting emission standards for vehicles sold in California and for other emission sources, such as consumer products and certain off-road equipment. CARB also monitors ambient air quality throughout the State. CARB highlights the potential health impacts associated with proximity to common air pollution sources so that those issues are considered in the plan-ning process. CARB makes advisory recommendations regarding the siting of new sensitive land uses near freeways, truck distribution centers, rail yards, marine ports, dry cleaners, gasoline-dispensing stations, and other air pollu-

C I T Y O F C H I N O
G E N E R A L P L A N D R A F T E I R A I R Q U A L I T Y A N D G R E E N H O U S E G A S E S
4.3-12
tion sources. These “advisory” recommendations include general setbacks or buffers from air pollution sources. Unlike industrial or stationary sources of air pollution, siting of new sensitive receptors does not require air quality permits or approval by air districts. iii. State Implementation Plan The State Implementation Plan (SIP) is a collection of documents that set forth the State’s strategies for achieving the air quality standards. The SCAQMD is responsible for preparing and implementing the portion of the SIP applicable to the SCAB. The SCAQMD adopts rules, regulations, and programs to attain State and federal air quality standards, and appropriates money (including permit fees) to achieve these objectives. iv. South Coast Air Quality Management District The SCAQMD is the air pollution control agency for Orange County and the urban portions of Los Angeles, Riverside, and San Bernardino Counties. The agency’s primary responsibility is assuring that the federal and State am-bient air quality standards are attained and maintained in the SCAB. SCAQMD is also responsible for adopting and enforcing rules and regulations concerning air pollutant sources, issuing permits for stationary sources of air pollutants, inspecting stationary sources of air pollutants, responding to citi-zen complaints, monitoring ambient air quality and meteorological condi-tions, awarding grants to reduce motor vehicle emissions and conducting pub-lic education campaigns, as well as many other activities. v. 2007 Air Quality Management Plan Every three years, the SCAQMD prepares an Air Quality Management Plan (AQMP) describing air quality improvement strategies to be submitted for inclusion in the SIP. The Final 2007 AQMP was adopted by the SCAQMD Governing Board on June 1, 2007. The 2007 plan, prepared by the SCAQMD in conjunction with CARB, the Southern California Association of Governments (SCAG) and the EPA, is intended to provide for continued progress toward cleaner air and to comply with State and federal require-ments. The plan meets State and federal CAA planning requirements for all
C I T Y O F C H I N O
G E N E R A L P L A N D R A F T E I R A I R Q U A L I T Y A N D G R E E N H O U S E G A S E S
4.3-13
areas under the jurisdiction of the SCAQMD, including the portion of San Bernardino County encompassing the City of Chino. The final plan includes a comprehensive strategy aimed at controlling pollu-tion from all sources, including stationary sources, on-road and off-road mo-bile sources, and area sources. Despite improvements in Southern Califor-nia’s air quality, the region is a federal non-attainment area for PM10, PM2.5, and 8-hour surface-level ozone. The Plan proposes attainment demonstration of the federal PM10, PM2.5, and ozone standards. vi. Toxic Air Contaminants The public’s exposure to toxic air contaminants (TACs) is a significant public health issue in California. TACs are a broad class of compounds known to cause morbidity or mortality (usually because they cause cancer). TACs are found in ambient air, especially in urban areas, and are caused by industry, agriculture, fuel combustion, and commercial operations (e.g. dry cleaners). Because chronic exposure can result in adverse health effects, TACs are regu-lated at the regional, State and federal level. The Air Toxics “Hot Spots” Information and Assessment Act requires opera-tors of specified facilities to submit to the SCAQMD comprehensive emis-sions inventories and reports. The SCAQMD uses this information to rank the facility into high-, medium- and low-priority categories based on the po-tential risk from the facility. High-priority facilities must prepare a health risk assessment and, if the risk is determined to be great enough, the facility is required to notify the surrounding population and may be required to de-velop and implement a risk reduction plan. Diesel-exhaust particulate matter (DPM) emissions were established as TACs in 1998. Diesel exhaust is the predominant TAC in urban air and is estimated to represent about two-thirds of the cancer risk from TACs (based on the Statewide average). Diesel exhaust is a complex mixture of gases, vapors, and fine particles. This complexity makes the evaluation of health effects of diesel exhaust a complex scientific issue. Some of the chemicals in diesel exhaust,

C I T Y O F C H I N O
G E N E R A L P L A N D R A F T E I R A I R Q U A L I T Y A N D G R E E N H O U S E G A S E S
4.3-14
such as benzene and formaldehyde, have been previously identified as TACs by the CARB, and are listed as carcinogens either under the State's Proposi-tion 65 or under the federal Hazardous Air Pollutants program. Diesel emis-sions generated within Chino and surrounding areas pose a potential hazard to residents and visitors. Following the identification of DPM as a TAC, the EPA adopted low-sulfur fuel standards which took effect in 2006 to significantly reduce DPM. At the State level, CARB has worked on developing strategies and regulations aimed at reducing the risk from diesel particulate matter. The overall strategy for achieving these reductions is found in the “Risk Reduction Plan to Reduce Particulate Matter Emissions from Diesel-Fueled Engines and Vehicles.”13 A stated goal of the plan is to reduce the cancer risk Statewide arising from ex-posure to diesel particulate matter 75 percent by 2010 and 85 percent by 2020. The SCAQMD provides guidance for assessing potential cancer risks resulting from DPM originating from mobile sources at facilities such as truck stops and warehouse distribution centers in its document “Health Risk Assessment Guidance for Analyzing Cancer risks from Mobile Source Diesel Idling Emis-sions for the CEQA Air Quality Analysis.”14 Guidance for more general sources has not been developed. A number of programs and strategies to re-duce diesel particulate matter that have been or are in the process of being developed include:15
13 State of California, 2005, California’s Diesel Risk Reduction Program. Cali-
fornia Air Resources Board, http://www.arb.ca.gov/diesel/mobile.htm accessed on March 13, 2006.
14 SCAQMD, 2003, Health Risk Assessment Guidance for Analyzing Cancer risks from Mobile Source Diesel Idling Emissions for the California Environmental Qual-ity Act (CEQA) Air Quality Analysis, http://www.aqmd.gov/ceqa/handbook/ mobile_toxic/diesel_analysis.doc accessed on October 31, 2008.
15 State of California, 2007, California Air Resources Board Programs. Cali-fornia Air Resources Board Internet Site, http://www.arb.ca. gov/html/programs.htm accessed on August 3, 2008.
C I T Y O F C H I N O
G E N E R A L P L A N D R A F T E I R A I R Q U A L I T Y A N D G R E E N H O U S E G A S E S
4.3-15
♦ The Carl Moyer Program: This program, administered by CARB, pro-vides grants to private companies, public agencies or individuals operat-ing heavy-duty diesel engines to cover an incremental portion of the cost of cleaner on-road, off-road, marine, locomotive, and agricultural irriga-tion pump engines.
♦ On-Road Heavy-Duty Diesel New Engine Program: This program develops strategies and regulations to reduce diesel emissions from new on-road diesel powered equipment. Emission control regulations have been coordinated with the EPA and require that new engines manufac-tured in and subsequent to 2004 meet new emissions requirements for particulates and other pollutants.
♦ Heavy-Duty Diesel In-Use Strategies Program: The goal of this pro-gram is to develop and implement strategies for reducing diesel emissions from existing on- and off-road diesel engines. To date, plans being devel-oped or implemented have targeted solid waste collection vehicles, on-road heavy-duty public fleet vehicles, and fuel delivery trucks. Generally these plans require that a percentage of the fleet, based on the age of the vehicles, be retrofitted on a predetermined schedule.
Other programs include:
♦ Off-Road Mobile Sources Emission Reduction Program: The goal of this program is to develop regulations to control emissions from diesel, gasoline, and alternative-fueled off-road mobile engines. These sources include a range of equipment from lawn mowers to construction equip-ment to locomotives.
♦ Heavy-Duty Vehicle Inspection and Periodic Smoke Inspection Pro-gram: This program provides periodic inspections to ensure that truck and bus fleets do not emit excessive amounts of smoke.
♦ Lower-Emission School Bus Program: Under this program, and in co-ordination with the California Energy Commission, CARB is developing guidelines to provide criteria for the purchase of new school buses and
C I T Y O F C H I N O
G E N E R A L P L A N D R A F T E I R A I R Q U A L I T Y A N D G R E E N H O U S E G A S E S
4.3-16
the retrofit of existing school buses to reduce particulate matter emis-sions.
CARB will continue to establish new programs and regulations for the con-trol of diesel particulate emissions as appropriate. The continued develop-ment and implementation of these programs and policies will ensure that the public exposure to diesel particulate matter will continue to decline. vii. Children’s Environmental Health Protection Act The Children’s Environmental Health Protection Act established specific requirements to determine if children are adequately protected from the harmful effects of air pollution. The Act requires CARB and the Office of Environmental Health Hazard Assessment to review all health-based CAAQS to determine if public health is adequately protected. It also requires a review of the air monitoring network to determine if it accurately measures the amount of pollutants in the air. Furthermore, the State’s list of TACs must be reviewed and Air Toxic Control Measures must be implemented in order to reduce exposure to TACs that cause children to be especially susceptible to illness. viii. Sensitive Receptors Sensitive receptors are people who are particularly susceptible to the adverse effects of air pollution. CARB has identified the following people who are most likely to be affected by air pollution: children under 14, the elderly over 65, athletes, and people with cardiovascular and chronic respiratory diseases. Locations that may contain a high concentration of these sensitive population groups include residential areas, hospitals, daycare facilities, elder care facili-ties, elementary schools, and parks. Both federal and State AAQS were de-veloped with the intent to protect sensitive receptors from the adverse im-pacts of air pollution.

C I T Y O F C H I N O
G E N E R A L P L A N D R A F T E I R A I R Q U A L I T Y A N D G R E E N H O U S E G A S E S
4.3-17
c. City of Chino i. Healthy Chino Coalition The California Healthy Cities and Communities (CHCC) network began in 1988 to promote clean, safe, and healthy places to live. In December 2004, the Chino City Council passed a resolution endorsing the Healthy Cities concept and formal participation in CHCC. Focus areas include creating safe, walkable neighborhoods, encouraging fitness by securing corporate sponsors and developing a Youth Fun Club, providing health and human services by reducing barriers to the City’s mental health services, supporting a healthcare center for low-income families, promoting nutrition with healthier alternatives in the school lunch program, and developing public education programs and organizations. The Healthy Chino Coalition also focuses on “fostering supportive environments, policies, and programs to promote physical activity, wellness and increased knowledge of healthy lifestyles.”16 ii. Air Quality Element The Air Quality Element contained within the Proposed General Plan and Focused Growth Plan contains policies and actions that support two main goals and three main objectives. The Air Quality Element’s Goals AQ-1 and AQ-2 call for preservation and improvement of air quality and a reduction in greenhouse gas (GHG) emissions. 2. Existing Conditions a. Geographic Setting The SCAB region includes parts of San Bernardino, Los Angeles, Riverside, and Orange Counties. The City of Chino is located approximately 30 miles east of the Pacific Ocean in southwestern San Bernardino County, within the SCAB. The mountains to the north and east of Chino tend to restrict airflow and concentrate pollutants in the valleys and low-lying areas below.
16 Center for Civic Partnerships, 2005, Connections. California Healthy Cit-
ies and Communities Newsletter, Vol. 16, No. 2.

C I T Y O F C H I N O
G E N E R A L P L A N D R A F T E I R A I R Q U A L I T Y A N D G R E E N H O U S E G A S E S
4.3-18
b. Climate The City of Chino, like the rest of the inland valley areas within the SCAB, is characterized by a Mediterranean climate consisting of warm, dry summers and mild, wet winters. The average annual precipitation is 13 inches, falling primarily from November to April. The average maximum temperature is about 78 degrees Fahrenheit (ºF), and the average minimum temperature is about 48 degrees ºF. The average summer and winter temperatures are 73 and 54 degrees ºF, respectively.17 The prevailing wind in the SCAB is from a westerly direction and allows for the areas within the basin to be influenced by the cool waters of the Pacific Ocean. Occasionally, however, high pressure over the Great Basin will result in hot, dry easterly winds that are regionally called “Santa Ana” winds. These winds that blow offshore typically bring some of the warmest temperatures of the year to coastal southern California and occur most often during the late summer or early fall months. During these Santa Ana wind events, air pollutants in the basin are pushed westward out to sea, resulting in some of the best air quality days for the residents of the inland valley areas. Generally speaking, the overall air quality within the basin is typically better during the winter months. Air quality in a particular location is a function of the kinds and amounts of pollutants being emitted into the air locally and throughout the basin and the dispersal rates of pollutants within the region. The major factors affecting pollutant dispersion are wind speed and direction, the vertical dispersion of pollutants (which is affected by inversions), and the local topography. Air quality is commonly expressed as the number of days in which air pollu-tion levels exceed State standards set by the CARB or federal standards set by the EPA. Table 4.3-2 summarizes the number of days per year during which
17 Western Regional Climate Center, 2009, Historical Climate Information;
Western U.S. Historical Summaries (Individual Stations)m http://www.wrcc.dri.edu accessed on August 4, 2009.

CI
TY
O
F
CH
IN
O
GE
NE
RA
L
PL
AN
D
RA
FT
E
IR
A
IR
Q
UA
LI
TY
A
ND
G
RE
EN
HO
US
E
GA
SE
S
4.3-
19
TA
BLE
4.3-
2 A
MB
IEN
T A
IR Q
UA
LIT
Y S
UM
MA
RY
– S
OU
TH
CO
AS
T A
IR B
AS
IN
Max
imum
Con
cent
rati
on
Num
ber
of D
ays
Exce
edin
g St
ate
Stan
dard
N
umbe
r of
Day
s
Exce
edin
g N
atio
nal S
tand
ard
Pollu
tant
A
vera
ge
Tim
e
Cal
ifor
nia
Am
bien
t
Air
Qua
lity
St
anda
rdsa
Att
ain-
men
t St
atus
Nat
iona
l A
mbi
ent
A
ir Q
ualit
y St
anda
rdsb
Att
ain-
men
t St
atus
c 20
03
2004
20
05
2006
20
07
2003
20
04
2005
20
06
2007
20
03
2004
20
05
2006
20
07
O3
1 ho
ur
0.09
ppm
N
(ext
rem
e)
N/A
N
/Ad
0.19
0.
16
0.18
0.
18
0.17
12
5 10
5 99
10
2 96
64
28
31
35
18
O3
8 ho
urs
0.07
ppm
N
0.
075
ppm
e N
(sev
ere)
0.
15
0.15
0.
15
0.14
0.
14
1 1
13
130
127
1e 11
e 11
e 11
4e 10
8e
CO
1
hour
20
ppm
A
35
ppm
A
12
.3
10.4
N
a N
a N
a 0
0 N
a N
a N
a 0
0 N
a N
a N
a
CO
8
hour
s 9
ppm
A
9
ppm
A
7.
3 6.
5 5.
9 6.
2 5.
3 0
0 0
0 0
0 0
0 0
0
NO
2 1
hour
0.
18 p
pmf
A
N/A
N
/A
0.16
0.
16
0.14
0.
14
0.11
0
0 0
0 0
N/A
N
/A
N/A
N
/A
N/A
NO
2 A
nnua
l 0.
030
ppm
A
0.
053
ppm
A
0.
03
0.03
0.
02
0.02
0.
02
N/A
N
/A
N/A
N
/A
N/A
0
Na
Na
Na
Na
SO2
1 ho
ur
0.25
ppm
A
N
/A
N/A
0.
03
0.04
N
a N
a N
a 0
0 N
a N
a N
a N
/A
N/A
N
/A
N/A
N
/A
SO2
24 h
ours
0.
04 p
pm
A
0.14
ppm
A
0.
01
0.02
N
a N
a N
a 0
0 N
a N
a N
a 0
0 N
a N
a N
a
SO2
Ann
ual
N/A
N
/A
0.03
ppm
A
0.
0 N
a N
a N
a N
a N
/A
N/A
N
/A
N/A
N
/A
Na
Na
Na
Na
Na
PM10
24
hou
rs
50 μ
g/m
3 N
15
0 μg
/m3
N (s
erio
us)
164
137
131
142
1,21
2 20
1h 21
0h 19
8h 24
1h 27
3h 2
0 0
0 2
PM10
A
nnua
l 20
μg/
m3
N
N/A
N
/A
55.1
53
.5
50.4
62
.3
72.2
N
a N
a N
a N
a N
a N
/A
N/A
N
/A
N/A
N
/A
PM2.
5 24
hou
rs
N/A
N
/A
35 μ
g/m
3 g
N
121
Na
Na
Na
Na
N/A
N
/A
N/A
N
/A
N/A
8
Na
Na
Na
Na
PM2.
5 A
nnua
l 12
μg/
m3
N
15 μ
g/m
3 N
24
.8
Na
Na
Na
Na
Na
Na
Na
Na
Na
Na
Na
Na
Na
Na
Lead
M
onth
ly
1.5 μg
/m3
A
N/A
N
/A
0.17
0.
03
0.03
0.
03
0.05
0
0 0
0 0
N/A
N
/A
N/A
N
/A
N/A
Lead
Q
uart
erly
N
/A
N/A
1.
5 μg
/m3
A
0.15
0.
03
0.03
0.
02
0.03
N
/A
N/A
N
/A
N/A
N
/A
0 0
0 0
0 N
otes
: pp
m =
par
ts p
er m
illio
n, μ
g/m
3 = m
icro
gram
s per
cub
ic m
eter
a
Cal
iforn
ia st
anda
rds f
or o
zone
, car
bon
mon
oxid
e (e
xcep
t at L
ake
Tah
oe),
sulfu
r di
oxid
e (1
-hou
r an
d 24
-hou
r), n
itrog
en d
ioxi
de, P
M10
, and
PM
2.5 a
re v
alue
s tha
t are
not
to b
e ex
ceed
ed.
All
othe
rs a
re n
ot to
be
equ
aled
or
exce
eded
.
b N
atio
nal s
tand
ards
(oth
er th
an fo
r oz
one,
par
ticul
ate
mat
ter,
and
thos
e ba
sed
on a
nnua
l ave
rage
s or
annu
al a
rith
met
ic m
eans
) are
not
to b
e ex
ceed
ed m
ore
than
onc
e a
year
.
c A
= a
ttai
nmen
t; N
= n
on-a
ttai
nmen
t; N
/A =
not
app
licab
le; N
a =
dat
a no
t ava
ilabl
e.
d The
fede
ral 1
-hou
r st
anda
rd fo
r oz
one
(0.1
2 pp
m) h
as b
een
revo
ked.
e T
he fe
dera
l 8-h
our
stan
dard
for
ozon
e w
as c
hang
ed fr
om 0
.08
ppm
to 0
.075
ppm
in 2
008;
num
ber
of d
ays e
xcee
ding
the
2008
stan
dard
. f T
he S
tate
1-h
our
stan
dard
for
nitr
ogen
dio
xide
was
cha
nged
from
0.2
5 pp
m to
0.1
8 pp
m in
200
7.
g The
fede
ral 2
4-ho
ur st
anda
rd fo
r PM
2.5 w
as c
hang
e fr
om 6
5 to
35 μg
/m3 in
200
6.
h Cal
cula
ted
days
= th
e es
timat
ed n
umbe
r of
day
s tha
t a m
easu
rem
ent w
ould
hav
e be
en g
reat
er th
an th
e le
vel o
f the
stan
dard
had
mea
sure
men
ts b
een
colle
cted
eve
ry d
ay.
Sour
ce:
Cal
iforn
ia A
ir Q
ualit
y D
ata
Stat
istic
s, ht
tp:/
/ww
w.a
rb.c
a.go
v/ad
am/w
elco
me.
htm
l, ac
cess
ed o
n A
ugus
t 18,
200
9
C I T Y O F C H I N O
G E N E R A L P L A N D R A F T E I R A I R Q U A L I T Y A N D G R E E N H O U S E G A S E S
4.3-20
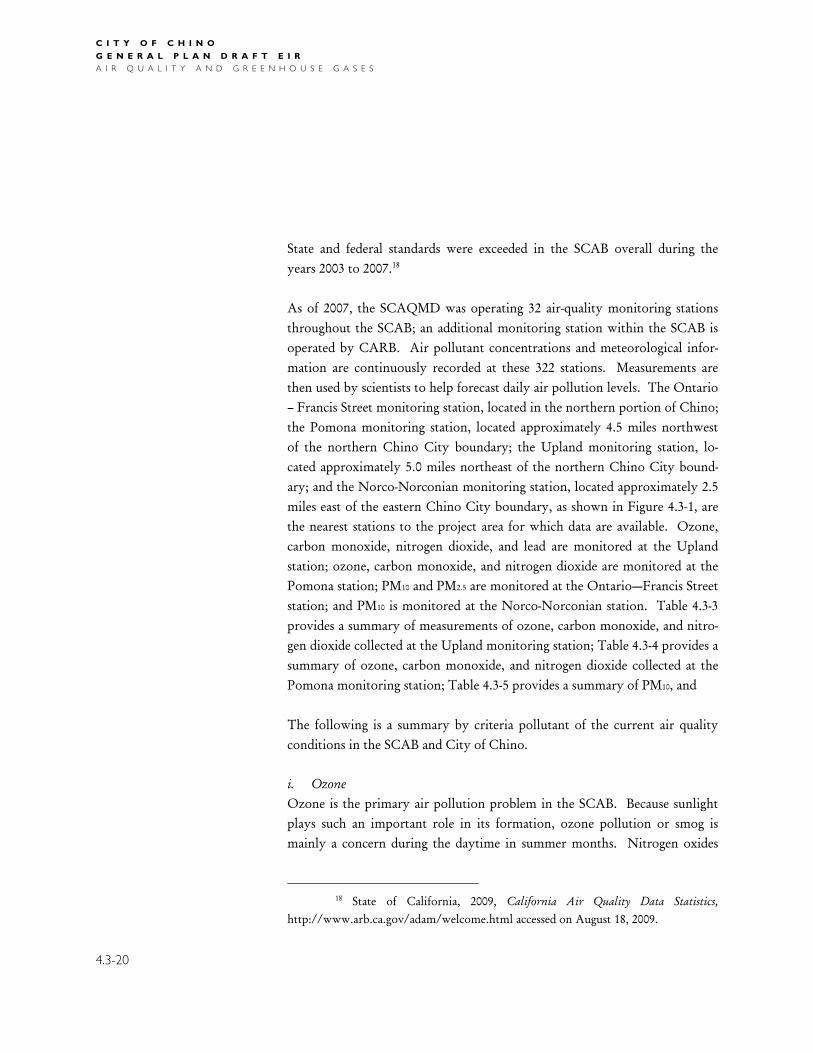
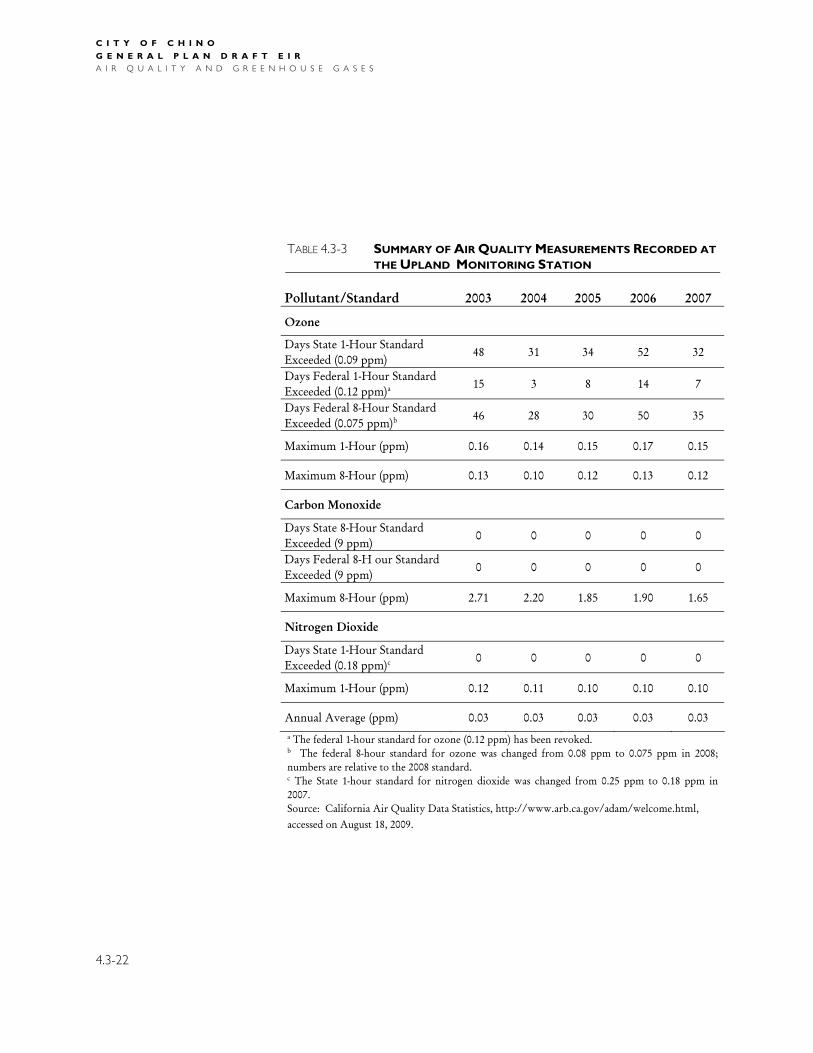
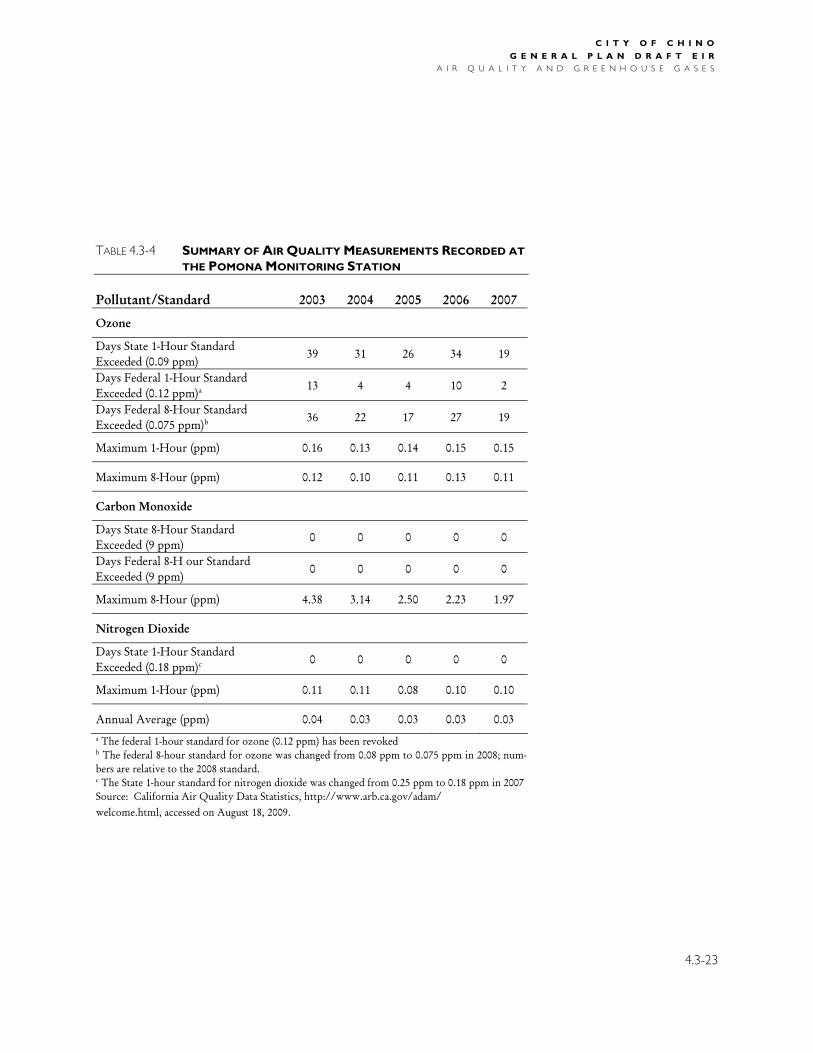
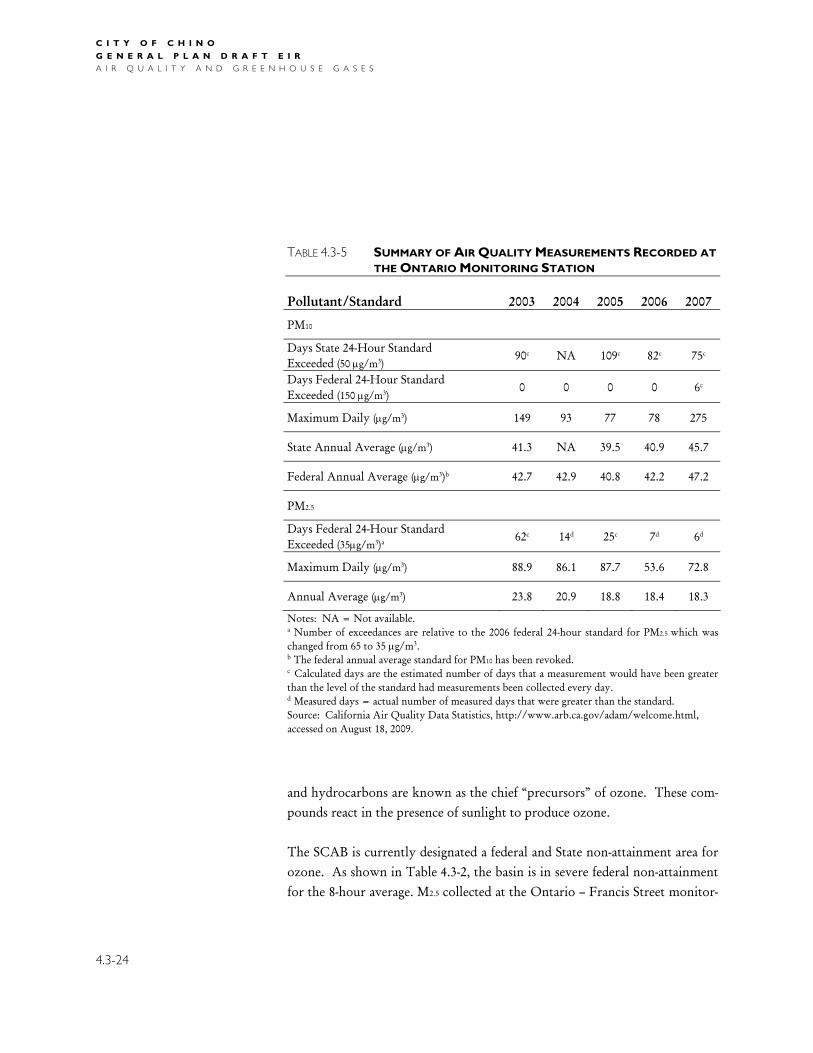
State and federal standards were exceeded in the SCAB overall during the years 2003 to 2007.18 As of 2007, the SCAQMD was operating 32 air-quality monitoring stations throughout the SCAB; an additional monitoring station within the SCAB is operated by CARB. Air pollutant concentrations and meteorological infor-mation are continuously recorded at these 322 stations. Measurements are then used by scientists to help forecast daily air pollution levels. The Ontario – Francis Street monitoring station, located in the northern portion of Chino; the Pomona monitoring station, located approximately 4.5 miles northwest of the northern Chino City boundary; the Upland monitoring station, lo-cated approximately 5.0 miles northeast of the northern Chino City bound-ary; and the Norco-Norconian monitoring station, located approximately 2.5 miles east of the eastern Chino City boundary, as shown in Figure 4.3-1, are the nearest stations to the project area for which data are available. Ozone, carbon monoxide, nitrogen dioxide, and lead are monitored at the Upland station; ozone, carbon monoxide, and nitrogen dioxide are monitored at the Pomona station; PM10 and PM2.5 are monitored at the Ontario—Francis Street station; and PM10 is monitored at the Norco-Norconian station. Table 4.3-3 provides a summary of measurements of ozone, carbon monoxide, and nitro-gen dioxide collected at the Upland monitoring station; Table 4.3-4 provides a summary of ozone, carbon monoxide, and nitrogen dioxide collected at the Pomona monitoring station; Table 4.3-5 provides a summary of PM10, and The following is a summary by criteria pollutant of the current air quality conditions in the SCAB and City of Chino. i. Ozone Ozone is the primary air pollution problem in the SCAB. Because sunlight plays such an important role in its formation, ozone pollution or smog is mainly a concern during the daytime in summer months. Nitrogen oxides
18 State of California, 2009, California Air Quality Data Statistics,
http://www.arb.ca.gov/adam/welcome.html accessed on August 18, 2009.
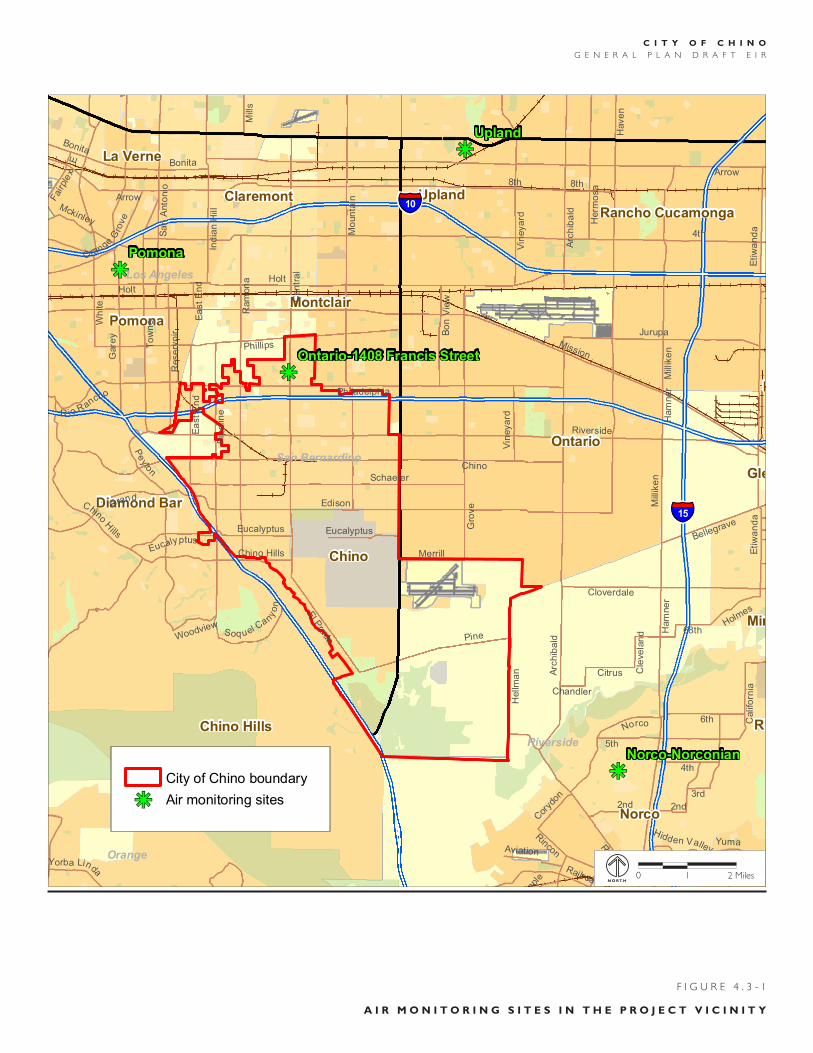
FIGURE AQ-1Air Monitoring Sites
in the Project Vicinity
kj
kj
kj
kjUpland
Pomona
Norco-Norconian
Ontario-1408 Francis Street
Ontario
Chino Hills
Chino
Norco
Pomona
Corona
Upland
Rancho Cucamonga
Yorba Linda
Montclair
Claremont
La Verne
Mira
Fo
Diamond Bar
Glen
Rive
Home Garde
§̈¦15
§̈¦10
4th
Mission
Arrow
Chino
Holt
8th
6th
Riverside
Have
n
Cen
tra
l
Edison
Gare
y
To
wn
e
5th
Mo
un
tain
Gro
ve
Arc
hib
ald
Phillips
Wh
ite
Ham
ne
r
Ram
on
a
River
Pip
elin
e
Etiw
an
da
Philadelphia
Pine
Schaefer
Pe
yto
n
Jurupa
Grand
2nd
Ind
ian
Hill
Bonita
LaP
a
l ma
Ma
in
10th
Vin
eya
rd
Railroad
Herm
osa
Rese
rvo
ir
ChinoH
ills
Ea
st
En
d
Lin
co
ln
Mill
ike
n
El P
rado
Sm
ith
Norco
Hellm
an
Bellegrave
Bo
nV
iew
Rincon
Merrill
Mill
s
Cloverdale
Orange
Gro
ve
E
Jo
y
Citrus
Califo
rnia
68th
Eucalyptus
Fairpl
ex
Green Rive
r
Holmes
Yuma
3rd
Cor
ydon
Sa
n A
nto
nio
Yorba Linda
Map
le
R io Rancho
Cresta
Park ridge
Promenade
Aviation
Soq uel Can
yo
n
Mckinley
Woodview
Serfas
Clu
b
Cle
ve
lan
d
Weir C
anyo
n
Hidden Valley
Chandler
Bonita
Ham
ne
rM
illik
en
8th
Etiw
an
da
Eucalyptus
Arc
hib
ald
Chino Hills
4th
Eucalyptus
Holt
Vin
eya
rd
2nd
Arrow
6th
Ea
st
En
d
San Bernardino
Riverside
Los Angeles
Orange
kj
kj
kj
kjUpland
Pomona
Norco-Norconian
Ontario-1408 Francis Street
Ontario
Chino Hills
Chino
Norco
Pomona
Corona
Upland
Rancho Cucamonga
Yorba Linda
Montclair
Claremont
La Verne
Mira
Fo
Diamond Bar
Glen
Rive
Home Garde
§̈¦15
§̈¦10
4th
Mission
Arrow
Chino
Holt
8th
6th
Riverside
Have
n
Cen
tra
l
Edison
Gare
y
To
wn
e
5th
Mo
un
tain
Gro
ve
Arc
hib
ald
Phillips
Wh
ite
Ham
ne
r
Ram
on
a
River
Pip
elin
e
Etiw
an
da
Philadelphia
Pine
Schaefer
Pe
yto
n
Jurupa
Grand
2nd
Ind
ian
Hill
Bonita
LaP
a
l ma
Ma
in
10th
Vin
eya
rd
Railroad
Herm
osa
Rese
rvo
ir
ChinoH
ills
Ea
st
En
d
Lin
co
ln
Mill
ike
n
El P
rado
Sm
ith
Norco
Hellm
an
Bellegrave
Bo
nV
iew
Rincon
Merrill
Mill
s
Cloverdale
Orange
Gro
ve
E
Jo
y
Citrus
Califo
rnia
68th
Eucalyptus
Fairpl
ex
Green Rive
r
Holmes
Yuma
3rd
Cor
ydon
Sa
n A
nto
nio
Yorba Linda
Map
le
R io Rancho
Cresta
Park ridge
Promenade
Aviation
Soq uel Can
yo
n
Mckinley
Woodview
Serfas
Clu
b
Cle
ve
lan
d
Weir C
anyo
n
Hidden Valley
Chandler
Bonita
Ham
ne
rM
illik
en
8th
Etiw
an
da
Eucalyptus
Arc
hib
ald
Chino Hills
4th
Eucalyptus
Holt
Vin
eya
rd
2nd
Arrow
6th
Ea
st
En
d
San Bernardino
Riverside
Los Angeles
Orange
N
M:\jobs2\4277\common_gis\figAQ-1.mxd 08/24/09
0 2Miles
City of Chino boundary
kj Air monitoring sites
F I G U R E 4 . 3 - 1
A i r M o n i t o r i n g s i t e s i n t h e p r o j e c t v i c i n i t y
c i t y o f c h i n oG E n E R a l P l a n D R a F T E I R
1 2 Milesn o r t h
0
C I T Y O F C H I N O
G E N E R A L P L A N D R A F T E I R A I R Q U A L I T Y A N D G R E E N H O U S E G A S E S
4.3-22
TABLE 4.3-3 SUMMARY OF AIR QUALITY MEASUREMENTS RECORDED AT THE UPLAND MONITORING STATION
Pollutant/Standard 2003 2004 2005 2006 2007
Ozone
Days State 1-Hour Standard Exceeded (0.09 ppm)
48 31 34 52 32
Days Federal 1-Hour Standard Exceeded (0.12 ppm)a
15 3 8 14 7
Days Federal 8-Hour Standard Exceeded (0.075 ppm)b
46 28 30 50 35
Maximum 1-Hour (ppm) 0.16 0.14 0.15 0.17 0.15
Maximum 8-Hour (ppm) 0.13 0.10 0.12 0.13 0.12
Carbon Monoxide
Days State 8-Hour Standard Exceeded (9 ppm)
0 0 0 0 0
Days Federal 8-H our Standard Exceeded (9 ppm)
0 0 0 0 0
Maximum 8-Hour (ppm) 2.71 2.20 1.85 1.90 1.65
Nitrogen Dioxide
Days State 1-Hour Standard Exceeded (0.18 ppm)c
0 0 0 0 0
Maximum 1-Hour (ppm) 0.12 0.11 0.10 0.10 0.10
Annual Average (ppm) 0.03 0.03 0.03 0.03 0.03 a The federal 1-hour standard for ozone (0.12 ppm) has been revoked. b The federal 8-hour standard for ozone was changed from 0.08 ppm to 0.075 ppm in 2008; numbers are relative to the 2008 standard. c The State 1-hour standard for nitrogen dioxide was changed from 0.25 ppm to 0.18 ppm in 2007. Source: California Air Quality Data Statistics, http://www.arb.ca.gov/adam/welcome.html, accessed on August 18, 2009.
C I T Y O F C H I N O
G E N E R A L P L A N D R A F T E I R A I R Q U A L I T Y A N D G R E E N H O U S E G A S E S
4.3-23
TABLE 4.3-4 SUMMARY OF AIR QUALITY MEASUREMENTS RECORDED AT
THE POMONA MONITORING STATION
Pollutant/Standard 2003 2004 2005 2006 2007
Ozone
Days State 1-Hour Standard Exceeded (0.09 ppm)
39 31 26 34 19
Days Federal 1-Hour Standard Exceeded (0.12 ppm)a
13 4 4 10 2
Days Federal 8-Hour Standard Exceeded (0.075 ppm)b
36 22 17 27 19
Maximum 1-Hour (ppm) 0.16 0.13 0.14 0.15 0.15
Maximum 8-Hour (ppm) 0.12 0.10 0.11 0.13 0.11
Carbon Monoxide
Days State 8-Hour Standard Exceeded (9 ppm)
0 0 0 0 0
Days Federal 8-H our Standard Exceeded (9 ppm)
0 0 0 0 0
Maximum 8-Hour (ppm) 4.38 3.14 2.50 2.23 1.97
Nitrogen Dioxide
Days State 1-Hour Standard Exceeded (0.18 ppm)c
0 0 0 0 0
Maximum 1-Hour (ppm) 0.11 0.11 0.08 0.10 0.10
Annual Average (ppm) 0.04 0.03 0.03 0.03 0.03 a The federal 1-hour standard for ozone (0.12 ppm) has been revoked b The federal 8-hour standard for ozone was changed from 0.08 ppm to 0.075 ppm in 2008; num-bers are relative to the 2008 standard. c The State 1-hour standard for nitrogen dioxide was changed from 0.25 ppm to 0.18 ppm in 2007 Source: California Air Quality Data Statistics, http://www.arb.ca.gov/adam/ welcome.html, accessed on August 18, 2009.
C I T Y O F C H I N O
G E N E R A L P L A N D R A F T E I R A I R Q U A L I T Y A N D G R E E N H O U S E G A S E S
4.3-24
TABLE 4.3-5 SUMMARY OF AIR QUALITY MEASUREMENTS RECORDED AT THE ONTARIO MONITORING STATION
Pollutant/Standard 2003 2004 2005 2006 2007
PM10
Days State 24-Hour Standard Exceeded (50 μg/m3)
90c NA 109c 82c 75c
Days Federal 24-Hour Standard Exceeded (150 μg/m3)
0 0 0 0 6c
Maximum Daily (μg/m3) 149 93 77 78 275
State Annual Average (μg/m3) 41.3 NA 39.5 40.9 45.7
Federal Annual Average (μg/m3)b 42.7 42.9 40.8 42.2 47.2
PM2.5
Days Federal 24-Hour Standard Exceeded (35μg/m3)a
62c 14d 25c 7d 6d
Maximum Daily (μg/m3) 88.9 86.1 87.7 53.6 72.8
Annual Average (μg/m3) 23.8 20.9 18.8 18.4 18.3
Notes: NA = Not available. a Number of exceedances are relative to the 2006 federal 24-hour standard for PM2.5 which was changed from 65 to 35 μg/m3. b The federal annual average standard for PM10 has been revoked. c Calculated days are the estimated number of days that a measurement would have been greater than the level of the standard had measurements been collected every day. d Measured days = actual number of measured days that were greater than the standard. Source: California Air Quality Data Statistics, http://www.arb.ca.gov/adam/welcome.html, accessed on August 18, 2009.
and hydrocarbons are known as the chief “precursors” of ozone. These com-pounds react in the presence of sunlight to produce ozone. The SCAB is currently designated a federal and State non-attainment area for ozone. As shown in Table 4.3-2, the basin is in severe federal non-attainment for the 8-hour average. M2.5 collected at the Ontario – Francis Street monitor-

C I T Y O F C H I N O
G E N E R A L P L A N D R A F T E I R A I R Q U A L I T Y A N D G R E E N H O U S E G A S E S
4.3-25
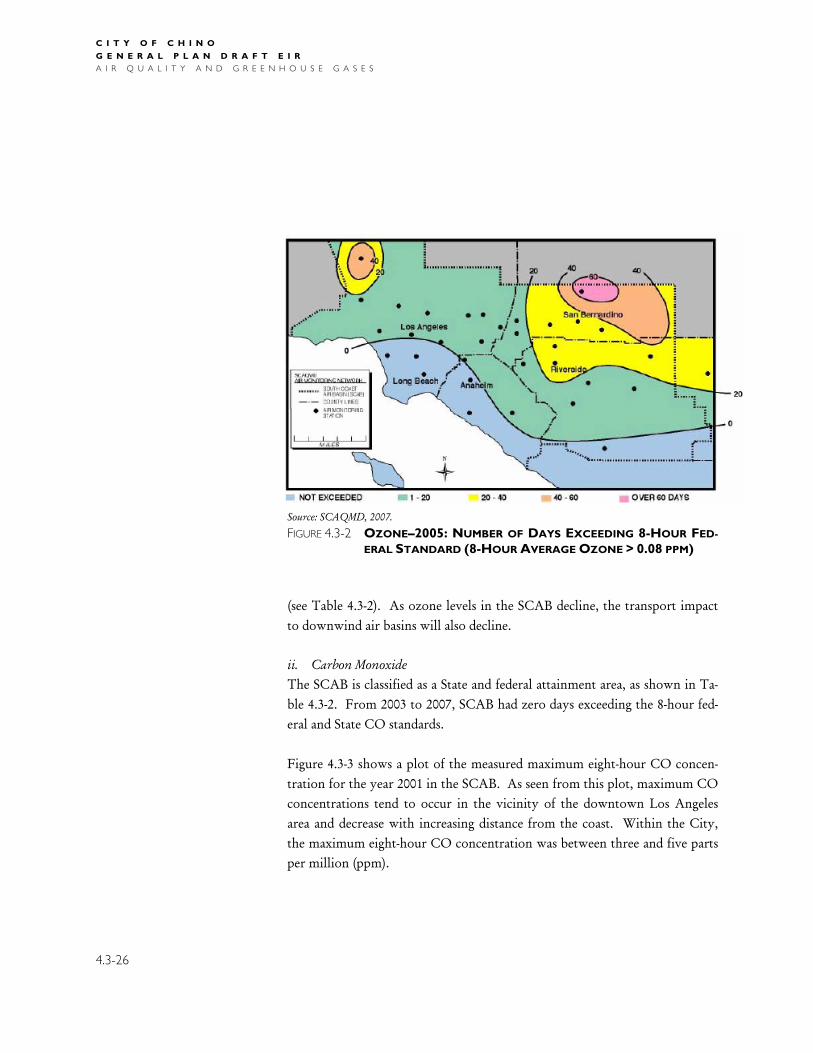
ing station; and Table 4.3-6 provides a summary of PM10 collected at the Norco – Norconian station.19 The SCAB has been classified as a transport contributor to downwind air basins. The Mojave Desert Air Basin, the Salton Sea Air Basin, the San Diego Air Basin, and the South Central Coast Air Basin are all affected by ozone concentrations from the SCAB. Figure 4.3-2 shows plots of the measured ozone exceedances for the year 2005 in the SCAB relative to the federal eight-hour standard. As seen from these plots, the number of days for which the ozone standards were exceeded gen-erally increases with distance from the coast. In the Chino area, the eight-hour standard was exceeded on 20 or fewer days. At the Upland monitoring station the 2008 national eight-hour ozone stan-dard was exceeded 46 days in 2003, 28 days in 2004, 30 days in 2005, 50 days in 2006, and 35 days in 2007. The State standard for one-hour ozone was ex-ceeded at the Upland monitoring station 48 days in 2003, 31 days in 2004, 34 days in 2005, 52 days in 2006, and 32 days in 2007. At the Pomona monitoring station the 2008 national eight-hour ozone stan-dard was exceeded 36 days in 2003, 22 days in 2004, 17 days in 2005, 27 days in 2006, and 19 days in 2007. The one-hour State standard for ozone was ex-ceeded at the Pomona monitoring station 39 days in 2003, 31 days in 2004, 26 days in 2005, 34 days in 2006, and 19 days in 2007. Although State and federal standards are being exceeded, ozone in the SCAB has improved substantially over the past 30 years. In 1984, the State one-hour ozone standard was exceeded 209 days, and the revoked national one-hour ozone standard was exceeded 175 days in the SCAB. In 2007, the State one-hour ozone standard was exceeded 96 days; and as a basis for comparison, the former national one-hour ozone standard was exceeded 18 days in the SCAB
19 State of California, 2009, California Air Quality Data Statistics, http://www.arb.ca.gov/adam/welcome.html accessed on August 18, 2009.
C I T Y O F C H I N O
G E N E R A L P L A N D R A F T E I R A I R Q U A L I T Y A N D G R E E N H O U S E G A S E S
4.3-26
Source: SCAQMD, 2007.
FIGURE 4.3-2 OZONE–2005: NUMBER OF DAYS EXCEEDING 8-HOUR FED-ERAL STANDARD (8-HOUR AVERAGE OZONE > 0.08 PPM)
(see Table 4.3-2). As ozone levels in the SCAB decline, the transport impact to downwind air basins will also decline. ii. Carbon Monoxide The SCAB is classified as a State and federal attainment area, as shown in Ta-ble 4.3-2. From 2003 to 2007, SCAB had zero days exceeding the 8-hour fed-eral and State CO standards. Figure 4.3-3 shows a plot of the measured maximum eight-hour CO concen-tration for the year 2001 in the SCAB. As seen from this plot, maximum CO concentrations tend to occur in the vicinity of the downtown Los Angeles area and decrease with increasing distance from the coast. Within the City, the maximum eight-hour CO concentration was between three and five parts per million (ppm).
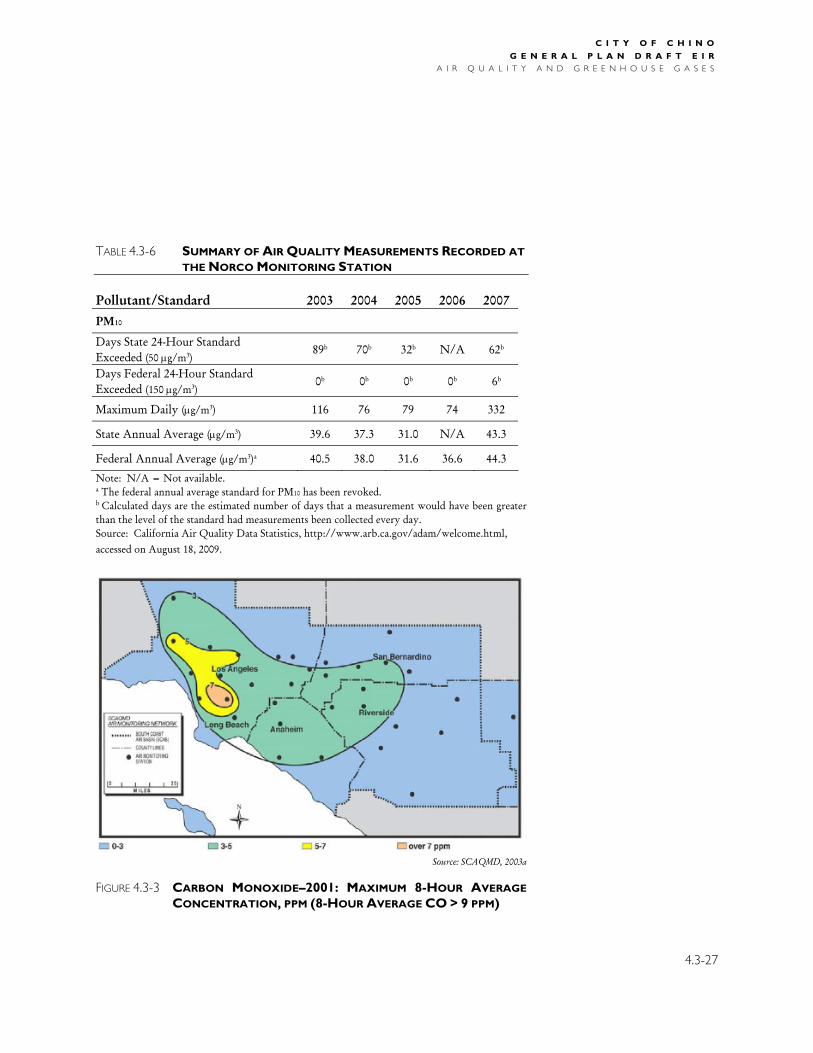
C I T Y O F C H I N O
G E N E R A L P L A N D R A F T E I R A I R Q U A L I T Y A N D G R E E N H O U S E G A S E S
4.3-27
TABLE 4.3-6 SUMMARY OF AIR QUALITY MEASUREMENTS RECORDED AT THE NORCO MONITORING STATION
Pollutant/Standard 2003 2004 2005 2006 2007 PM10
Days State 24-Hour Standard Exceeded (50 μg/m3)
89b 70b 32b N/A 62b
Days Federal 24-Hour Standard Exceeded (150 μg/m3)
0b 0b 0b 0b 6b
Maximum Daily (μg/m3) 116 76 79 74 332
State Annual Average (μg/m3) 39.6 37.3 31.0 N/A 43.3
Federal Annual Average (μg/m3)a 40.5 38.0 31.6 36.6 44.3 Note: N/A = Not available. a The federal annual average standard for PM10 has been revoked. b Calculated days are the estimated number of days that a measurement would have been greater than the level of the standard had measurements been collected every day. Source: California Air Quality Data Statistics, http://www.arb.ca.gov/adam/welcome.html, accessed on August 18, 2009.
Source: SCAQMD, 2003a
FIGURE 4.3-3 CARBON MONOXIDE–2001: MAXIMUM 8-HOUR AVERAGE CONCENTRATION, PPM (8-HOUR AVERAGE CO > 9 PPM)

C I T Y O F C H I N O
G E N E R A L P L A N D R A F T E I R A I R Q U A L I T Y A N D G R E E N H O U S E G A S E S
4.3-28
As seen in Tables 4.3-3 and 4.3-4, CO levels did not exceed State or federal standards during the period from 2003 to 2007 at either the Upland or Pomona monitoring stations. Small-scale, localized concentrations of carbon monoxide above the State and national standards have the potential to occur at intersections with stagnation points such as those that occur on major highways and heavily traveled and congested roadways. Localized high concentrations of CO are referred to as “CO hot spots,” and are a concern at congested intersections when automo-bile engines burn fuel less efficiently and their exhaust contains more CO. iii. PM10 Particulate matter is a complex mixture of very tiny solid or liquid particles composed of chemicals, soot, and dust. Ten microns is about one-seventh the diameter of a human hair. Sources of PM10 emissions in the SCAB consist mainly of urban activities, dust suspended by vehicle traffic, and secondary aerosols formed by reactions in the atmosphere. In general, particulate con-centrations near residential sources are typically greater during the coldest months of the year, when more fireplaces are in use and when meteorological conditions such as inversions prevent the dispersion of directly emitted con-taminants. Particles classified under the PM10 category are mainly emitted directly from activities that disturb the soil including travel on roads and construction, min-ing or agricultural operations. Other sources include windblown dust and the burning of fuels such as gasoline, oil, diesel, or wood. For several reasons related to the area’s dry climate and coastal location, the SCAB has special difficulty in developing adequate tactics to meet present State particulate standards. While emission controls for ozone also reduce levels of PM10, addi-tional controls aimed specifically at PM10 will be required to reduce the high levels. Currently, the SCAB is a State and federal non-attainment area for PM10. Table 4.3-2 shows that the 24-hour State PM10 standard was exceeded in the

C I T Y O F C H I N O
G E N E R A L P L A N D R A F T E I R A I R Q U A L I T Y A N D G R E E N H O U S E G A S E S
4.3-29
SCAB each year from 2003 through 2007. The much higher 24-hour federal PM10 standard was exceeded in the SCAB in 2003 and 2007. Figure 4.3-4 shows a plot of the measured annual average concentration of PM10 for the year 2005 in the SCAB. As seen from this plot, maximum aver-age annual PM10 concentrations tend to occur east of the City of Chino. In and around Chino, the average annual PM10 concentrations were below the old federal standard but above the State standard, and ranged from approxi-mately 30 μg/m3 to 50 μg/m3.
Source: SCAQMD, 2007.
FIGURE 4.3-4 PM10–2005: ANNUAL AVERAGE (ARITHMETIC MEAN) CON-
CENTRATION, μG/M3 At the Ontario–Francis Street monitoring station, the calculated number of days that the State PM10 standard was exceeded was 90 days in 2003, 109 days in 2005, 82 days in 2006, and 75 days in 2007 (see Table 4.3-5). There were insufficient data to evaluate the State standard for 2004. The calculated num-ber of days that the federal PM10 standard was exceeded was 6 days in 2006. PM10 measurements are typically collected every six days. Calculated days are
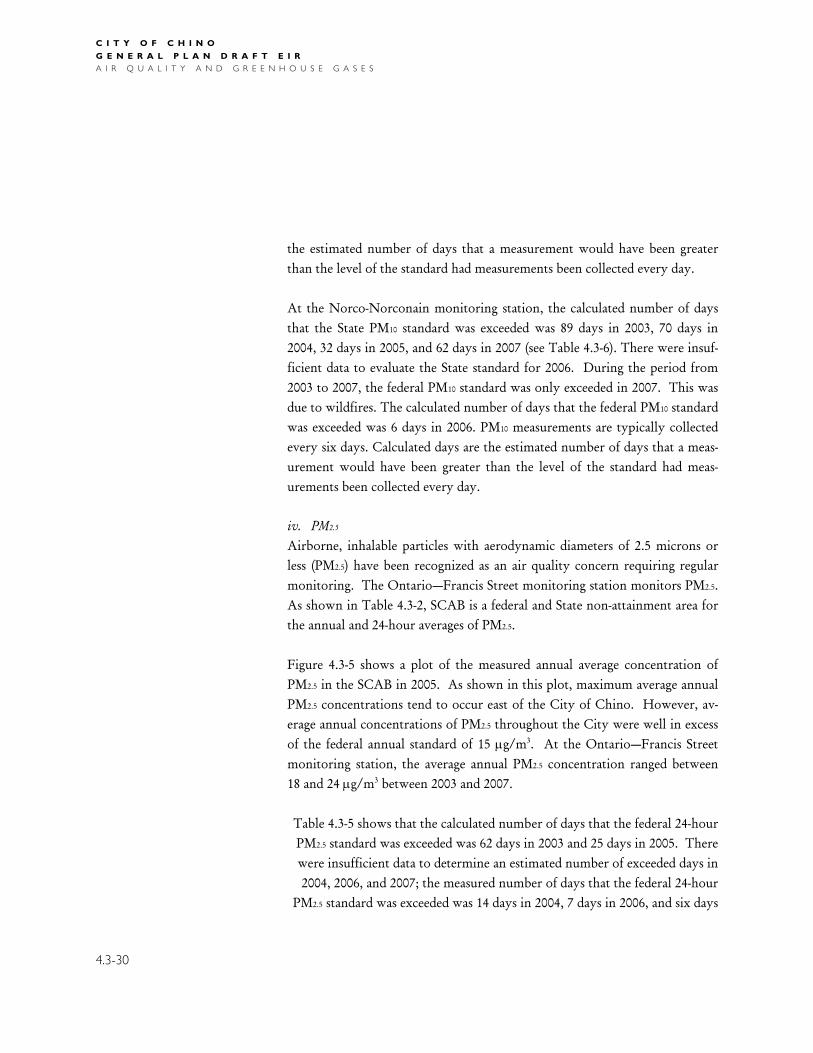
C I T Y O F C H I N O
G E N E R A L P L A N D R A F T E I R A I R Q U A L I T Y A N D G R E E N H O U S E G A S E S
4.3-30
the estimated number of days that a measurement would have been greater than the level of the standard had measurements been collected every day. At the Norco-Norconain monitoring station, the calculated number of days that the State PM10 standard was exceeded was 89 days in 2003, 70 days in 2004, 32 days in 2005, and 62 days in 2007 (see Table 4.3-6). There were insuf-ficient data to evaluate the State standard for 2006. During the period from 2003 to 2007, the federal PM10 standard was only exceeded in 2007. This was due to wildfires. The calculated number of days that the federal PM10 standard was exceeded was 6 days in 2006. PM10 measurements are typically collected every six days. Calculated days are the estimated number of days that a meas-urement would have been greater than the level of the standard had meas-urements been collected every day. iv. PM2.5
Airborne, inhalable particles with aerodynamic diameters of 2.5 microns or less (PM2.5) have been recognized as an air quality concern requiring regular monitoring. The Ontario—Francis Street monitoring station monitors PM2.5. As shown in Table 4.3-2, SCAB is a federal and State non-attainment area for the annual and 24-hour averages of PM2.5. Figure 4.3-5 shows a plot of the measured annual average concentration of PM2.5 in the SCAB in 2005. As shown in this plot, maximum average annual PM2.5 concentrations tend to occur east of the City of Chino. However, av-erage annual concentrations of PM2.5 throughout the City were well in excess of the federal annual standard of 15 μg/m3. At the Ontario—Francis Street monitoring station, the average annual PM2.5 concentration ranged between 18 and 24 μg/m3 between 2003 and 2007. Table 4.3-5 shows that the calculated number of days that the federal 24-hour PM2.5 standard was exceeded was 62 days in 2003 and 25 days in 2005. There were insufficient data to determine an estimated number of exceeded days in 2004, 2006, and 2007; the measured number of days that the federal 24-hour
PM2.5 standard was exceeded was 14 days in 2004, 7 days in 2006, and six days

C I T Y O F C H I N O
G E N E R A L P L A N D R A F T E I R A I R Q U A L I T Y A N D G R E E N H O U S E G A S E S
4.3-31
Source: SCAQMD, 2007.
FIGURE 4.3-5 PM2.5–2005: ANNUAL AVERAGE (ARITHMETIC MEAN) CON-
CENTRATION, μG/M3 in 2007. The number of days that the State PM2.5 standard was exceeded was not available. v. Other Criteria Pollutants The federal and State standards for NO2 and SO2 are being met in the SCAB and the latest pollutant trends suggest that these standards will not be ex-ceeded in the foreseeable future. States are required to make designation rec-ommendations for the revised NAAQS for lead by October 2009. The SCAB is in attainment of the much less restrictive 1978 lead NAAQS. c. Existing Sources of Emissions Emissions come from either stationary or mobile sources. Stationary sources are generally categorized as either point sources or area sources. Point sources are large emitters at an identified location such as power plants and manufacturing facilities. Area sources consist of small emissions in a general area such as water heaters and architectural coatings. Mobile sources are cate-gorized as either on-road or off-road. On-road mobile sources are vehicles on
C I T Y O F C H I N O
G E N E R A L P L A N D R A F T E I R A I R Q U A L I T Y A N D G R E E N H O U S E G A S E S
4.3-32
freeways and roadways. Off-road sources include trains, ships, construction equipment and other emitters that operate off freeways and roadways. Table 4.3-7 summarizes emissions to the SCAB in 2002, the most recent year for which a complete inventory is available.
SCAQMD is the primary agency responsible for regulating stationary sources and developing plans to achieve and maintain air quality standards in the SCAB. CARB and the EPA have jurisdiction over controlling emissions from mobile sources. 3. Standards of Significance The following significance criteria are used to determine impacts for the Pro-posed General Plan. The project would have a significant impact if it would:
♦ Conflict with or obstruct implementation of the applicable air quality plan.
♦ Violate any air quality standard or contribute substantially to an existing or projected air quality violation.
♦ Result in a cumulatively considerable net increase of any criteria pollut-ant for which the project area is in non-attainment under applicable fed-eral or State AAQS (including releasing emissions which exceed quantita-tive thresholds for ozone precursors or other pollutants).
♦ Expose sensitive receptors to substantial pollutant concentrations.
♦ Create objectionable odors affecting a substantial number of people. 4. Impact Discussion The following is an analysis of the air quality impacts due to adoption of the Proposed General Plan and the Focused Growth Plan. The methodologies for determining the potential impacts, as well as the impacts themselves, are the same for both alternatives. They are, therefore, discussed together. a. Implementation of Air Quality Plan As noted above, the SIP is a collection of documents that sets forth the State of California’s strategies for achieving air quality standards. The SCAQMD is

C I T Y O F C H I N O
G E N E R A L P L A N D R A F T E I R A I R Q U A L I T Y A N D G R E E N H O U S E G A S E S
4.3-33
TABLE 4.3-7 2002 EMISSIONS TO THE SCAB – AVERAGE ANNUAL DAY (TONS/DAY)a
Source Category VOC NOx CO SOx PM2.5 PM10
Stationary Sources
Fuel Combustion 7 35 53 2 6 6
Waste Disposal 7 2 1 <1 <1 <1
Cleaning and Surface Coatings
54 <1 <1 <1 1 <1
Petroleum Production and Marketing
35 <1 9 7 1 1
Industrial Processes 21 <1 2 <1 5 13
Solvent Evaporation 162 0 0 0 0 0
Misc. Processesb 16 55 62 12 47 206
Total Stationary Sources 302 93 127 22 60 227
Mobile Sources
On-Road Vehicles 362 628 3,676 4 18 25
Off-Road Vehicles 180 372 1,016 27 21 23
Total Mobile Sources 542 1,000 4,692 31 39 48
Total 844 1,093 4,819 53 99 275 a Values are rounded to the nearest integer. b Travel related road dust included. Source: 2007 SCAQMD, Appendix III.
the agency that regulates air quality in the SCAB and is responsible for pre-paring and implementing the portion of the SIP applicable to the SCAB. The SCAQMD adopts rules, regulations, and programs to attain State and federal air quality standards, and appropriates money (including permit fees) to achieve these objectives.
C I T Y O F C H I N O
G E N E R A L P L A N D R A F T E I R A I R Q U A L I T Y A N D G R E E N H O U S E G A S E S
4.3-34
The purpose of the 2007 revision to the AQMP for the SCAB is to set forth a comprehensive program that will lead the SCAB into compliance with all federal and State air quality planning requirements. The 2007 AQMP revi-sion is specifically designed to satisfy the SIP submittal requirements of the federal CAA to demonstrate attainment of the new 8-hour ozone and PM2.5 AAQS, the California CAA triennial update requirements, and to fulfill the SCAQMD’s commitment to update transportation emission budgets based on the latest approved motor vehicle emissions model and planning assump-tions.20 The plan is revised every three years. The SCAQMD Governing Board approved the 2007 AQMP on June 1, 2007 and forwarded the 2007 AQMP Transportation Conformity Budgets to CARB for approval and subsequent submittal to the EPA. CARB delayed adoption and directed its staff to work with SCAQMD to strengthen emis-sion reductions further under the plan. Through this coordinated effort, sev-eral strategies were identified to further reduce emissions and CARB adopted the 2007 South Coast AQMP (SCAQMP) as part of the 2007 SIP. Transportation emission budgets are based in part on the land uses established by the General Plan. The 2007 SCAQMP is based on Chino’s existing Gen-eral Plan. Therefore, the land uses under the Proposed General Plan and the Focused Growth Plan are not consistent with the 2007 SCAQMP. The Air Quality Element of the Proposed General Plan and the Focused Growth Plan contains policies that support two main objectives to preserve and improve air quality in Chino and the region. Objective AQ-1.1 contains policies and actions that would improve air quality through land use and transportation decisions. Objective AQ-1.2 contains policies that would sup-port local and regional air quality improvement efforts. These objectives would reduce emissions by reducing vehicle miles traveled. However, VMTs under the Proposed General Plan and the Focused Growth
20 SCAQMD, 2007, Final 2007 Air Quality Management Plan.

C I T Y O F C H I N O
G E N E R A L P L A N D R A F T E I R A I R Q U A L I T Y A N D G R E E N H O U S E G A S E S
4.3-35
Plan would be greater than VMTs under the existing General Plan. Because the land uses proposed in the Proposed General Plan and the land uses pro-posed in the Focused Growth Plan are inconsistent with the existing General Plan upon which the 2007 SCAQMP was based, the Proposed General Plan and the Focused Growth Plan would not conform to the planning assump-tions included in the 2007 SCAQMP. Consequently, the Proposed General Plan and the Focused Growth Plan would both conflict with the adopted air plan. This is a significant impact. b. Air Quality Standard There are currently no known air quality violations generated within the City of Chino. However, the Proposed General Plan and the Focused Growth Plan include commercial and industrial development. It is possible that as the Proposed General Plan or Focused Growth Plan develops, new stationary sources within these commercial and industrial areas could gener-ate air emissions that may have the potential to violate applicable standards. Examples of stationary sources that have the potential to generate emissions that could violate air quality standards are gas stations, medical centers, manu-facturing companies, and large wholesale facilities. Policy P5 under Objective AQ-1.1 in the Air Quality Element states that “the City shall, to the extent practicable, separate sensitive land uses from signifi-cant sources of air pollutants, toxic air contaminants, or odor emissions.” However, as discussed above, new stationary sources within these commercial and industrial areas could generate air emissions that may have the potential to violate applicable standards. The significance of this impact would have to be determined on a project-by-project basis, since the actual setback distances would be site-specific. Any future commercial or industrial use with the po-tential to generate emissions is subject to the SCAQMD rules, regulations, and permitting process. Compliance with the rules and regulations will likely prevent or minimize adverse air quality impacts from this future develop-ment. However, this cannot be assumed at this time. This is a potentially sig-nificant impact.
C I T Y O F C H I N O
G E N E R A L P L A N D R A F T E I R A I R Q U A L I T Y A N D G R E E N H O U S E G A S E S
4.3-36
Emissions from increased traffic on area roadways and project construction may also lead to air quality violations. Emissions due to operation and con-struction of the Proposed General Plan and Focused Growth Plan are dis-cussed below in subsection c. c. Increase Non-Attainment Pollutant The region is in attainment for all criteria pollutants except ozone, PM10, and PM2.5. The SCAB is non-attainment for the federal and State ozone standard. Because ozone is not emitted directly but forms in the atmosphere, it is more a regional concern than a direct effect of individual projects. As noted above, ozone pollution, or smog, is mainly a concern during the daytime in summer months because sunlight plays an important role in its formation. For PM10, the SCAB has a designation of non-attainment for the State and federal stan-dards, and is designated non-attainment for both federal and State PM2.5 stan-dards. An assessment of the anticipated air emissions resulting from construction and operation of the Proposed General Plan and the Focused Growth Plan was prepared using the URBEMIS 2007 computer program.21 The URBEMIS 2007 program is a tool used to estimate air emissions resulting from land de-velopment projects in the State of California. The model generates emissions from three basics sources: construction sources, area sources (e.g. fireplaces, natural gas heating, etc.), and operational sources (e.g. traffic). Inputs to UR-BEMIS 2007 include such items as the air basin containing the project, land uses, trip generation rates, trip lengths, vehicle fleet mix (percentage autos, medium truck, etc.), trip distribution (i.e. percent home to work, etc.), and as other parameters. i. Construction Emissions Air pollutants generated by the construction of projects that conform to the Proposed General Plan and the Focused Growth Plan would vary depending upon the number of projects occurring simultaneously, and the size of each individual project. Pollutants result from dust raised during grading, emis-
21 Rimpo & Associates, 2007, URBEMIS 2007 for Windows, Version 9.2.4.
C I T Y O F C H I N O
G E N E R A L P L A N D R A F T E I R A I R Q U A L I T Y A N D G R E E N H O U S E G A S E S
4.3-37
sions from construction vehicles, chemicals used during construction, and ultimately emissions generated during operation of approved uses. Fugitive dust emissions vary greatly during construction and are dependent on the amount and type of activity, silt content of the soil, and the weather. Vehicles moving over paved and unpaved surfaces, demolition, excavation, earth movement, grading, and wind erosion from exposed surfaces are all sources of fugitive dust. Construction operations are subject to the require-ments established in Rule 403 of the SCAQMD’s rules and regulations. The exact number and timing of all development projects that could occur under the Proposed General Plan and the Focused Growth Plan are un-known. To illustrate the potential air quality effects from projects that could occur in the City under the Proposed General Plan and the Focused Growth Plan, a speculative project was evaluated. This hypothetical project includes a 1-acre multi-family residential project that may be typical in the City. The 1-acre multi-family development is assumed to consist of the demolition of an existing structure with a volume of approximately 50,000 cubic feet and the construction of a 40-unit multi-family structure. Construction emissions were calculated using the URBEMIS 2007 computer program. URBEMIS 2007 output files are contained in Appendix 1. Table 4.3-8 shows the anticipated emissions from a 1-acre multi-family project assuming that the duration of construction is 12 months. As shown in Table 4.3-8, construction of a 40-unit multi-family project would not exceed the applicable SCAQMD significance thresholds. To estimate the effects of such projects over the 20-year horizon of the Pro-posed General Plan and the Focused Growth Plan, it was assumed that an average of approximately five projects equivalent to the 40-unit multi-family project could occur yearly.

C I T Y O F C H I N O
G E N E R A L P L A N D R A F T E I R A I R Q U A L I T Y A N D G R E E N H O U S E G A S E S
4.3-38
TABLE 4.3-8 YEARLY CONSTRUCTION EMISSIONS (POUNDS/DAY)
Pollutant
Small Multi-Family
Project
SCAQMD Significance Threshold
ROG 25 75
NOx 25 100
CO 14 550
SO2 0 150
PM10 – dust 21 –
PM10 – exhaust 1 –
PM10 22 150
PM2.5 – dust 4 –
PM2.5 – exhaust 1 –
PM2.5 5 55
Source: Rimpo and Associates, 2007, URBEMIS 2007 for Windows, Version 9.2.4.
The SCAQMD no longer recommends using quarterly emission thresholds. However, for comparative purposes, the previous SCAQMD quarterly thresholds and the average quarterly emissions are summarized in Table 4.3-9. As seen from Table 4.3-9, small individual projects are not expected to exceed the previous quarterly thresholds. In addition, if five small projects were con-structed simultaneously and were considered as a single project, emissions are not projected to exceed the thresholds. If more than five small projects were constructed simultaneously and the smaller projects were considered as a sin-gle project, they might exceed the previous quarterly thresholds. The Pro-posed General Plan and the Focused Growth Plan include policies under Ob-jective AQ-1.3 designed to reduce air pollution emissions during construction
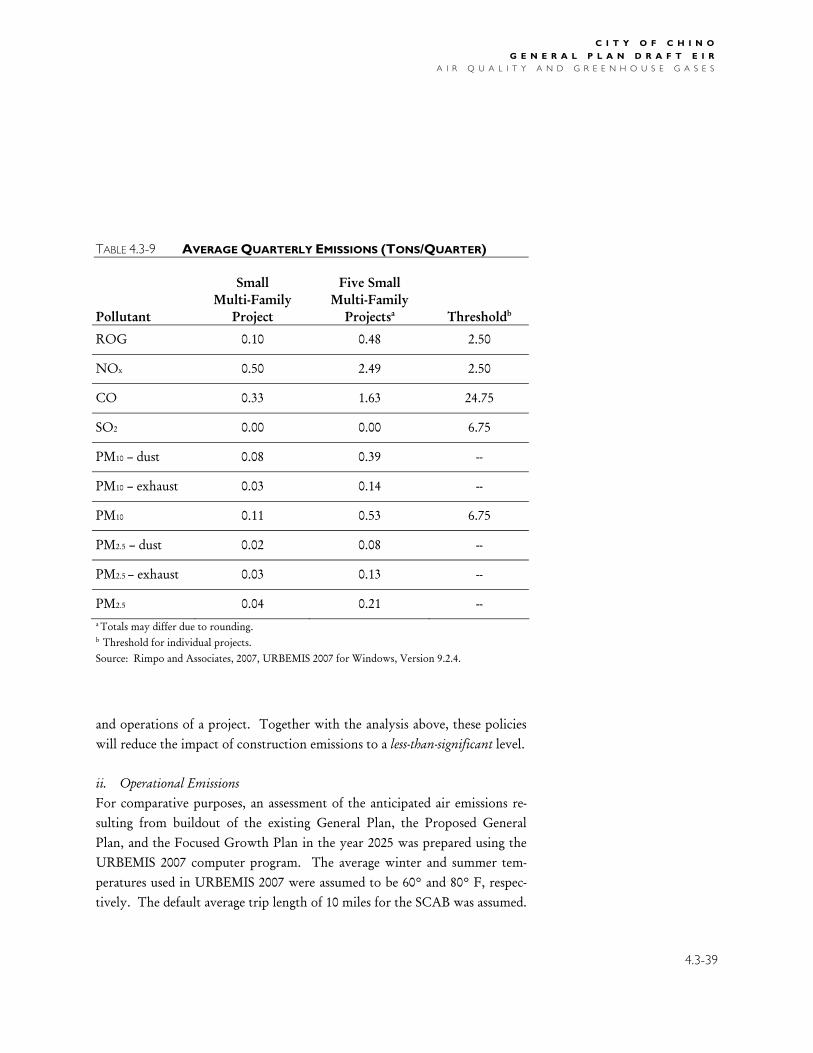
C I T Y O F C H I N O
G E N E R A L P L A N D R A F T E I R A I R Q U A L I T Y A N D G R E E N H O U S E G A S E S
4.3-39
TABLE 4.3-9 AVERAGE QUARTERLY EMISSIONS (TONS/QUARTER)
Pollutant
Small Multi-Family
Project
Five Small Multi-Family
Projectsa Thresholdb
ROG 0.10 0.48 2.50
NOx 0.50 2.49 2.50
CO 0.33 1.63 24.75
SO2 0.00 0.00 6.75
PM10 – dust 0.08 0.39 --
PM10 – exhaust 0.03 0.14 --
PM10 0.11 0.53 6.75
PM2.5 – dust 0.02 0.08 --
PM2.5 – exhaust 0.03 0.13 --
PM2.5 0.04 0.21 -- a Totals may differ due to rounding. b Threshold for individual projects. Source: Rimpo and Associates, 2007, URBEMIS 2007 for Windows, Version 9.2.4.
and operations of a project. Together with the analysis above, these policies will reduce the impact of construction emissions to a less-than-significant level. ii. Operational Emissions For comparative purposes, an assessment of the anticipated air emissions re-sulting from buildout of the existing General Plan, the Proposed General Plan, and the Focused Growth Plan in the year 2025 was prepared using the URBEMIS 2007 computer program. The average winter and summer tem-peratures used in URBEMIS 2007 were assumed to be 60° and 80° F, respec-tively. The default average trip length of 10 miles for the SCAB was assumed.
C I T Y O F C H I N O
G E N E R A L P L A N D R A F T E I R A I R Q U A L I T Y A N D G R E E N H O U S E G A S E S
4.3-40
A summary of the land uses modeled for the existing General Plan, the Pro-posed General Plan, and the Focused Growth Plan is shown in Table 4.3-10. URBEMIS 2007 contains a feature that reduces double counting of internal trips in a community plan area. Because trip generation rates account for both trip productions and attractions, assigning the gross trip generation for two land uses in a project double counts the trips between them. Gross in-ternal trips may be entered into URBEMIS 2007 so that internal trips are counted only once. It was assumed that 18.8 percent of all trips would be internal to Chino.22
Using the land use designations, along with URBEMIS 2007 default trip gen-eration rates for the SCAB, average daily emissions were estimated using URBEMIS 2007 assuming existing development, buildout of the existing General Plan, buildout of the Proposed General Plan, and buildout of the Focused Growth Plan. The results of the modeling, which include both mo-bile and area source emissions, are shown in Table 4.3-11. The URBEMIS 2007 output files contained in Appendix 1 indicate the specific inputs for each model run. It should be noted that the total vehicle miles traveled (VMTs) calculated by URBEMIS 2007 for the Proposed General Plan and the Focused General Plan are greater than the VMTs indicated in the traffic analysis. URBEMIS calculated that the Proposed General Plan and the Focused Growth Plan would generate 15,273,232.30 VMT and 15,533,032.86 VMT, respectively. The traffic analysis calculates that the Proposed General Plan and the Focused Growth Plan generate 3,864,855 VMT and 3,887,204 VMT, respectively. This is because, for roadway design purposes, the traffic analysis examines only the VMTs that occur within the City of Chino boundaries. The air emissions modeling examines the entire length of each trip, within and outside of the City of Chino boundaries, because this analysis examines the pollutants emitted into the entire air basin.
22 Harvey, Janet, Senior Transportation Engineering ManagerIteris Inc. Per-sonal e-mail communication with Dahlia Chazan, DC&E and Jesse Fleming, RE-CON, August 19, 2009.

C I T Y O F C H I N O
G E N E R A L P L A N D R A F T E I R A I R Q U A L I T Y A N D G R E E N H O U S E G A S E S
4.3-41
TABLE 4.3-10 LAND USES
Existing General Plan
Proposed General Plan
Focused Growth
General Plan Single-Family Housing (Dwelling Units)
26,487 26,115 25,926
Multi-Family Housing (Dwelling Units)
11,854 12,343 13,449
Mobile Home (Dwelling Units)
308 357 357
School (Acres) 333 353 353
City Park (Acres) 3,099 3,458 3,458
Regional Shopping Center (Square Feet)
3,082,875 4,046,478 4,046,477
Strip Mall (Square Feet) 6,307,027 6,044,251 6,825,371
General Office Building (Square Feet)
2,227,792 3,451,350 3,557,875
Office Park (Square Feet) 3,183,012 2,978,142 3,256,901
General Light Industry (Square Feet)
44,938,550 58,153,902 58,257,234
Industrial Park (Square Feet) 49,562,924 48,892,208 48,892,208
Agriculture/Open Space (Acres)
2,411 2,356 2,354
General Aviation 35 170 170
Correctional Facility (Acres) 323 323 323
As seen in Table 4.3-11, for the Proposed General Plan and the Focused Growth Plan the future emissions of ROG, NOx, CO, SOx, PM10, and PM2.5 are projected to be greater than the future emissions under the existing Gen-eral Plan. However, summer emissions of ROG, NOx, and CO, and winter
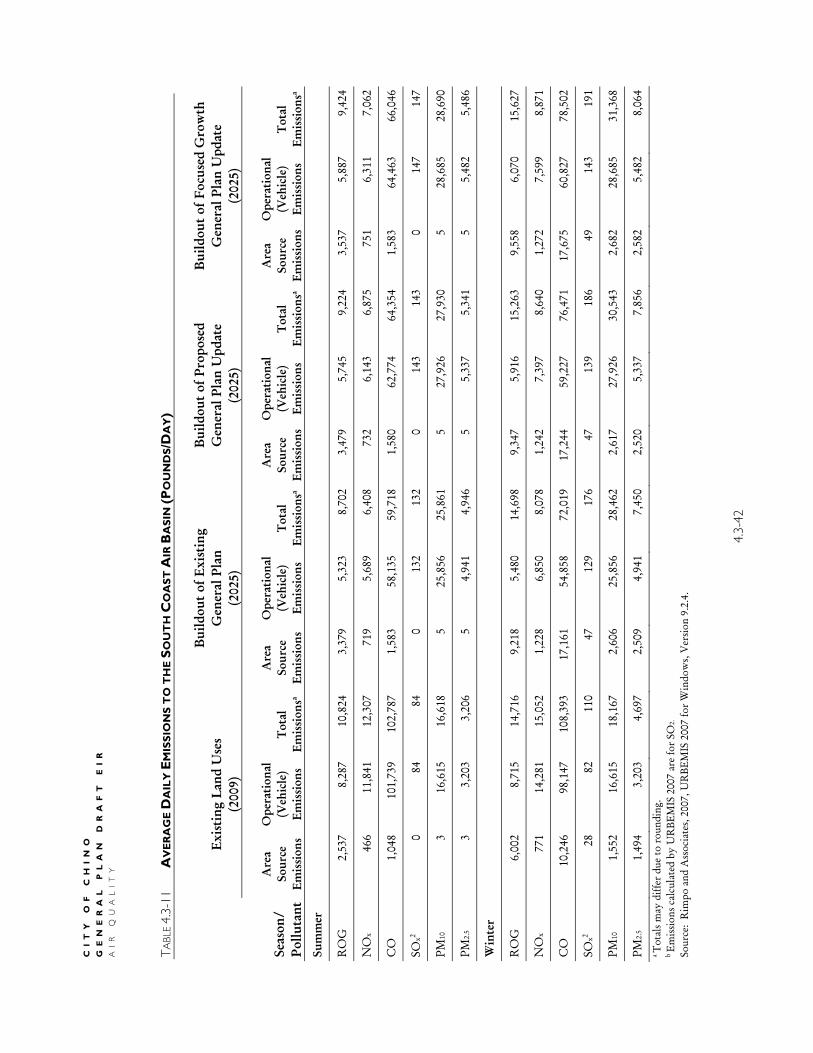
CI
TY
O
F
CH
IN
O
GE
NE
RA
L
PL
AN
D
RA
FT
E
IR
A
IR
Q
UA
LI
TY
4.3-
42
TA
BLE
4.3-
11
AV
ER
AG
E D
AIL
Y E
MIS
SIO
NS
TO
TH
E S
OU
TH
CO
AS
T A
IR B
AS
IN (
PO
UN
DS/D
AY
)
Exis
ting
Lan
d U
ses
(2
009)
Bui
ldou
t of
Exi
stin
g
Gen
eral
Pla
n
(202
5)
Bui
ldou
t of
Pro
pose
d
Gen
eral
Pla
n U
pdat
e
(202
5)
Bui
ldou
t of
Foc
used
Gro
wth
G
ener
al P
lan
Upd
ate
(2
025)
Seas
on/
Pollu
tant
Are
a
Sour
ce
Emis
sion
s
Ope
rati
onal
(V
ehic
le)
Emis
sion
s T
otal
Em
issi
onsa
Are
a
Sour
ce
Emis
sion
s
Ope
rati
onal
(V
ehic
le)
Emis
sion
s T
otal
Em
issi
onsa
Are
a
Sour
ce
Emis
sion
s
Ope
rati
onal
(V
ehic
le)
Emis
sion
s T
otal
Em
issi
onsa
Are
a
Sour
ce
Emis
sion
s
Ope
rati
onal
(V
ehic
le)
Emis
sion
s T
otal
Em
issi
onsa
Sum
mer
RO
G
2,53
7 8,
287
10,8
24
3,37
9 5,
323
8,70
2 3,
479
5,74
5 9,
224
3,53
7 5,
887
9,42
4
NO
x 46
6 11
,841
12
,307
71
9 5,
689
6,40
8 73
2 6,
143
6,87
5 75
1 6,
311
7,06
2
CO
1,
048
101,
739
102,
787
1,58
3 58
,135
59
,718
1,
580
62,7
74
64,3
54
1,58
3 64
,463
66
,046
SOx2
0 84
84
0
132
132
0 14
3 14
3 0
147
147
PM10
3
16,6
15
16,6
18
5 25
,856
25
,861
5
27,9
26
27,9
30
5 28
,685
28
,690
PM2.
5 3
3,20
3 3,
206
5 4,
941
4,94
6 5
5,33
7 5,
341
5 5,
482
5,48
6
Win
ter
RO
G
6,00
2 8,
715
14,7
16
9,21
8 5,
480
14,6
98
9,34
7 5,
916
15,2
63
9,55
8 6,
070
15,6
27
NO
x 77
1 14
,281
15
,052
1,
228
6,85
0 8,
078
1,24
2 7,
397
8,64
0 1,
272
7,59
9 8,
871
CO
10
,246
98
,147
10
8,39
3 17
,161
54
,858
72
,019
17
,244
59
,227
76
,471
17
,675
60
,827
78
,502
SOx2
28
82
110
47
129
176
47
139
186
49
143
191
PM10
1,
552
16,6
15
18,1
67
2,60
6 25
,856
28
,462
2,
617
27,9
26
30,5
43
2,68
2 28
,685
31
,368
PM2.
5 1,
494
3,20
3 4,
697
2,50
9 4,
941
7,45
0 2,
520
5,33
7 7,
856
2,58
2 5,
482
8,06
4 a T
otal
s may
diff
er d
ue to
rou
ndin
g.
b Em
issio
ns c
alcu
late
d by
UR
BEM
IS 2
007
are
for
SO2.
Sour
ce:
Rim
po a
nd A
ssoc
iate
s, 20
07, U
RBE
MIS
200
7 fo
r W
indo
ws,
Ver
sion
9.2.
4.
C I T Y O F C H I N O
G E N E R A L P L A N D R A F T E I R A I R Q U A L I T Y A N D G R E E N H O U S E G A S E S
4.3-43
emissions of NOx and CO in the future (year 2025) under the Proposed Gen-eral Plan and the Focused Growth Plan are projected to be less than existing (year 2009) emissions. Summer and winter emissions of ROG, NOx, and CO in the future (year 2025) under the existing General Plan are also projected to be less than the existing (year 2009) emissions. This is due to future im-provements in mobile source emissions, fleet turnover, better fuel efficiency, and cleaner vehicle exhaust. Future emissions of SOx, PM10, and PM2.5 are projected to be greater than the existing emissions because of the increase in residential and commercial uses.
As discussed above, the Proposed General Plan and the Focused Growth Plan include an Air Quality Element that seeks to reduce air pollution and mini-mize air quality impacts. Policies P1 through P8 and Actions A1 through A5 under Objective AQ-1.1 discussed above would promote mixed land use pat-terns, provide a diverse and efficient public transportation system, enhance pedestrian and bicycle linkage, improve intersection operations, promote ridesharing, and expand employment opportunities within Chino.
However, since the projected VMT and resulting emissions in year 2025 are anticipated to be greater those that would occur under buildout of the exist-ing General Plan, operation of the Proposed General Plan and the Focused Growth Plan would result in a significant impact. d. Expose Sensitive Receptors i. Carbon Monoxide Hot Spots Small-scale, localized concentrations of CO above the State and national stan-dards have the potential to occur near stagnation points of heavily traveled intersections. Localized, high concentrations of CO are referred to as “CO hot spots.” CO hot spots can occur when projects contribute traffic to area intersections. However, CO hot spots almost exclusively occur near intersec-tions with LOS E or worse in combination with relatively high traffic vol-umes on all roadways. The basin is in attainment of both the federal and S-tate CO standards, and background CO concentrations are well below federal and State limits. At buildout of the Proposed General Plan and the Focused Growth Plan, no intersections or roadway segments are anticipated to operate

C I T Y O F C H I N O
G E N E R A L P L A N D R A F T E I R A I R Q U A L I T Y A N D G R E E N H O U S E G A S E S
4.3-44
at substandard conditions. With the incorporation of traffic mitigation meas-ures, all studied intersections are projected to operate at LOS D or better. Therefore, as a result of the Proposed General Plan and the Focused Growth Plan, no direct significant localized CO impacts are anticipated at the inter-sections in the project vicinity. Impacts due to CO hot spots are less than significant. ii. Diesel Particulate Matter The health effects of exposure to diesel particulate matter generated by traffic on roadways have been raised as a concern. In April 2005, CARB published the Air Quality and Land Use Handbook: A Community Health Perspective. The handbook makes recommendations directed at protecting sensitive land uses while balancing a myriad of other land use issues (e.g. housing, transpor-tation needs, economics). It notes that the handbook is not regulatory or binding on local agencies and recognizes that application takes a qualitative approach. As reflected in the CARB handbook, there is currently no adopted standard for the significance of health effects from mobile sources. Therefore, the CARB has provided guidelines to help determine appropriate land uses near heavily traveled roadways. Of pertinence to this study, the CARB guidelines indicate that siting new sensitive land uses within 500 feet of a freeway, urban roads with 100,000 vehicles/day, or rural roads with 50,000 vehicles/day should be avoided when possible. The nearest heavily traveled roadways in the project vicinity are State Route 71 and State Route 60. The traffic analysis prepared for the project indicates that both of these roadways will carry more than 100,000 vehicles per day. The Proposed General Plan and the Focused Growth Plan both include resi-dential uses within 500 feet of both State Route 71 and State Route 60. Policy P5 under Objective AQ-1.1 in the Air Quality Element states that “the City shall, to the extent practicable, separate sensitive land uses from signifi-cant sources of air pollutants, toxic air contaminants, or odor emissions.” Policy P6 under the same objective calls for developers to evaluate potential impacts of projects near State Route 71 and State Route 60 and to fully miti-

C I T Y O F C H I N O
G E N E R A L P L A N D R A F T E I R A I R Q U A L I T Y A N D G R E E N H O U S E G A S E S
4.3-45
gate any impacts that are found. These policies would mitigate the impacts of the project on sensitive receptors to a less-than-significant level. Further, CARB has worked on developing strategies and regulations aimed at reducing the risk from diesel particulate matter. The overall strategy for achieving these reductions is found in the “Risk Reduction Plan to Reduce Particulate Matter Emissions from Diesel-Fueled Engines and Vehicles.” A stated goal of the plan is to reduce the cancer risk Statewide arising from ex-posure to diesel particulate matter 75 percent by 2010 and 85 percent by 2020. A number of programs and strategies to reduce diesel particulate matter that have been or are in the process of being developed include the Diesel Risk Reduction Program, which aims to reduce diesel particulate emissions over the next five to 15 years through improved automobile design and alternative fuel efficiency.23 e. Create Objectionable Odors The Proposed General Plan and the Focused Growth Plan could expose addi-tional people to objectionable odors by allowing new residential development near odor sources. Sources of odor include agriculture (farming and live-stock), chemical plants, composting operations, dairies, fiberglass molding, landfills, refineries, rendering plants, rail yards, and wastewater treatment plants. The Proposed General Plan and the Focused Growth Plan do not propose any specific new sources of odor that could affect sensitive receptors. Policy P5 under Objective AQ-1.1 in the Air Quality Element states that “the City shall, to the extent practicable, separate sensitive land uses from signifi-cant sources of air pollutants, toxic air contaminants, or odor emissions.” This would ensure that sensitive uses (including residences and schools) would be separated for odor generators. Impacts would be less than significant.
23 State of California, 2005, California’s Diesel Risk Reduction Program. Cali-
fornia Air Resources Board. November 29. Accessed from the CARB website at http://www.arb.ca.gov/diesel/mobile.htm on March 13, 2006.
C I T Y O F C H I N O
G E N E R A L P L A N D R A F T E I R A I R Q U A L I T Y A N D G R E E N H O U S E G A S E S
4.3-46
5. Cumulative Impacts As discussed above, the SCAB is a non-attainment area for ozone, PM10, and PM2.5. Development under the Proposed General Plan and the Focused Growth Plan in addition to growth in the region outside of Chino would lead to increased emissions of ozone precursors, PM10, and PM2.5, to the basin. The cumulative assessment of air quality impacts relies on the 2007 SCAQMP. In order to meet federal air quality standards in California, CARB required each AQMD to develop its own strategy for achieving the NAAQS. The SCAQMD Governing Board approved the 2007 SCAQMP and forwarded the 2007 SCAQMP Transportation Conformity Budgets to CARB for approval and subsequent submittal to the EPA. CARB delayed adoption and directed its staff to work with SCAQMD to strengthen emis-sion reductions further under the plan. Through this coordinated effort, sev-eral strategies were identified to further reduce emissions and CARB adopted the 2007 SCAQMP as part of the 2007 SIP. Transportation emission budgets are based in part on the land uses established by the General Plan. The 2007 SCAQMP is based on Chino’s existing Gen-eral Plan. Therefore, the land uses under the Proposed General Plan are not consistent with the 2007 SCAQMP. As discussed above, the 2007 SCAQMP is based on the existing General Plan. Because the significant air impact stems from an inconsistency between the Proposed General Plan and the Focused Growth Plan with the existing Gen-eral Plan upon which the 2007 SCAQMD is based, as well as results in emis-sions that are greater than future emissions under the existing General Plan, the only measure that can lessen this impact is the revision of the 2007 SCAQMP based on the Proposed General Plan. The Air Quality Element of the Proposed General Plan and the Focused Growth Plan contains policies that support two main objects and actions to preserve and improve air quality in Chino and the region. Objective AQ-1.1 contains policies and actions that would improve air quality through land use

C I T Y O F C H I N O
G E N E R A L P L A N D R A F T E I R A I R Q U A L I T Y A N D G R E E N H O U S E G A S E S
4.3-47
and transportation decisions. Objective AQ-1.2 contains policies that would support local and regional air quality improvement efforts. These objectives would reduce emissions by reducing VMT. However, because the land uses proposed in the Proposed General Plan and the Focused Growth Plan are inconsistent with the existing General Plan upon which the SCAQMP was based, the Proposed General Plan and the Focused Growth Plan would not conform to the planning assumptions included in the 2007 SCAQMP. Con-sequently, cumulative air quality impacts would be significant. 6. Impacts and Mitigation Measures While the Proposed General Plan and the Focused Growth Plan contain ob-jectives, policies, and actions that would reduce emissions, air quality impacts due to implementation of the Proposed General Plan and the Focused Growth Plan would be significant and unavoidable. Impact AQ-1: Because the land uses proposed in the Proposed General Plan and the Focused Growth Plan are inconsistent with the existing General Plan upon which the SCAQMP was based, the Proposed General Plan and the Focused Growth Plan would not conform to the planning assumptions in-cluded in the 2007 SCAQMP. The Proposed General Plan and the Focused Growth Plan would both increase the region’s VMT and air emissions be-yond what was assumed in the 2007 SCAQMP. Consequently, the Proposed General Plan and the Focused Growth Plan would both conflict with the adopted air plan, and would result in cumulative air quality impacts in the SCAB.
Significance After Mitigation: Significant and unavoidable. B. Greenhouse Gases
The earth’s climate is in a state of constant flux with periodic warming and cooling cycles. Extreme periods of cooling are termed “ice ages,” which may then be followed by extended periods of warmth. For most of the earth’s geo-logic history, these periods of warming and cooling have been the result of

C I T Y O F C H I N O
G E N E R A L P L A N D R A F T E I R A I R Q U A L I T Y A N D G R E E N H O U S E G A S E S
4.3-48
many complicated, interacting natural factors that include volcanic eruptions which spew gases and particles (dust) into the atmosphere; the amount of wa-ter, vegetation, and ice covering the earth’s surface; subtle changes in the earth’s orbit; and the amount of energy released by the sun (sun cycles). However, since the beginning of the Industrial Revolution around 1750, the average temperature of the earth has been increasing at a rate that is faster than can be explained by natural climate cycles alone. With the Industrial Revolution came an increase in the combustion of car-bon-based fuels such as wood, coal, oil, and “biofuels.” Industrial processes have also created emissions of substances that are not found in nature. This in turn has led to a marked increase in the emissions of gases that have been shown to influence the world’s climate. These gases, termed greenhouse gases (GHGs), influence the amount of heat that is trapped in the earth’s atmos-phere. Because recently observed increased concentrations of GHG in the atmosphere are related to increased emissions resulting from human activity, the current cycle of “global warming” is generally believed to be largely due to human activity. Of late, the issue of “global warming” has arguably be-come the most important and widely debated environmental issue in the United States and the world. The increase in the earth’s temperature is expected to have wide ranging ef-fects on the environment. Although global climate change is anticipated to affect all areas of the globe, there are numerous implications of direct impor-tance to California. Statewide average temperatures are anticipated to in-crease by between 3 and 10.5 °F by 2100. Some climate models indicate that this warming may be greater in the summer than in the winter. The increase in temperature could result in widespread adverse impacts to ecosystem health, agricultural production, water use and supply, and energy demand. The increasing atmospheric concentration of greenhouse gases resulting from human activities is changing the climate in ways that pose serious risks to Chino’s health, economy, and environment. Mass migration and/or loss of plant and animal species could occur. Global climate change could also lead to more extreme heat waves and heat-related stress in Chino, an increase in

C I T Y O F C H I N O
G E N E R A L P L A N D R A F T E I R A I R Q U A L I T Y A N D G R E E N H O U S E G A S E S
4.3-49
climate-sensitive diseases, wildland fires, more frequent and intense natural disasters such as drought, and increased levels of air pollution. 1. Regulatory Framework a. International The Coordinating Committee on the Ozone Layer was established by the United Nations Environment Program (UNEP) in 1977, and UNEP's Gov-erning Council adopted the World Plan of Action on the Ozone Layer. Con-tinuing efforts led to the signing in 1985 of the Vienna Convention on the Protection of the Ozone Layer. This resulted in the creation of the Montreal Protocol on Substances That Deplete the Ozone Layer (Montreal Protocol), an international treaty designed to protect the stratospheric ozone layer by phasing out production of ozone depleting substances (ODSs). The treaty was adopted on September 16, 1987 and went into force on January 1, 1989. Similar to the events that led to the Montreal Protocol, to address growing concern about global climate change, 191 countries including the United States joined an international treaty known as the United Nations Frame-work Convention on Climate Change (UNFCCC). The UNFCCC recog-nizes that the global climate is a shared resource that can be affected by indus-trial and other emissions of GHG, and that set an overall framework for in-tergovernmental efforts to tackle the challenges posed by global climate change. Under this treaty, governments gather and share information on GHG emissions, national policies and best practices; launch national strate-gies for addressing GHG emissions and adapting to expected impacts, includ-ing the provision of financial and technological support to developing coun-tries; and cooperate in preparing for adaptation to the impacts of climate change. The UNFCCC entered into force on March 21, 1994. However, this treaty generally lacked powerful, legally binding measures. The Kyoto Protocol (Protocol) was adopted in December 1997. The Kyoto Protocol shares the UNFCCC’s objective, principles, and institutions, as it significantly strengthens the UNFCCC by committing industrialized coun-tries to individual, legally binding targets to limit or reduce their GHG emis-

C I T Y O F C H I N O
G E N E R A L P L A N D R A F T E I R A I R Q U A L I T Y A N D G R E E N H O U S E G A S E S
4.3-50
sions. Only parties to the UNFCCC that have also become parties to the Protocol are bound by the Protocol’s commitments. More than 161 coun-tries, constituting 55 percent of global emissions, are under the protocol. Al-though former U.S Vice President Al Gore symbolically signed the Protocol in 1998, the Protocol has not been formally adopted by the U.S Senate, as is required. b. Federal The United States developed the Climate Change Action Plan (CCAP). The CCAP consists of initiatives that involve all economic sectors and aim at re-ducing all significant GHG emissions. The CCAP, backed by federal funding, cultivates cooperative partnerships between the government and the private sector to establish flexible and cost-effective ways to reduce GHG emissions within each sector. The CCAP encourages investments in new technologies, but also relies on previous actions and programs focused on saving energy and reducing emissions. The U.S. Environmental Protection Agency has proposed a determination that greenhouse gases endanger the public health and welfare of future genera-tions. This action would fall under the Clean Air Act and permit the EPA to regulate greenhouse gas emissions. c. State The State of California has passed a number of policies and regulations that either directly or indirectly relate to GHG emissions. i. Title 24 California Code of Regulations, Title 24, Part 6 is the California Energy Code. This code, originally enacted in 1978 in response to legislative man-dates, establishes energy efficiency standards for residential and non-residential buildings in order to reduce California’s energy consumption. The Code is updated periodically to incorporate and consider new energy effi-ciency technologies and methodologies as they become available. The most recent amendments to the Code are dated September 11, 2008. By reducing

C I T Y O F C H I N O
G E N E R A L P L A N D R A F T E I R A I R Q U A L I T Y A N D G R E E N H O U S E G A S E S
4.3-51
California’s energy consumption, emissions of GHG may also be reduced. In 2008, the California Energy Commission adopted new Energy Efficiency Standards for new residential, commercial, and industrial development. Title 24 also includes standards for retrofitting existing buildings to improve effi-ciency. The effective date for the 2008 Energy Efficiency Standards is January 1, 2010. All building permits submitted after this date will be required to adhere to the new standards. Anticipated GHG reductions associated with the Energy Efficiency Standards are discussed further in the impact section below. ii. Assembly Bill 1493 California Assembly Bill 1493 was enacted on July 22, 2002. It required the CARB to develop and adopt regulations that reduce GHG emitted by passen-ger vehicles and light duty trucks. Regulations adopted by CARB will apply to 2009 and later model year vehicles. iii. Executive Order S-3-05 Executive Order S-3-05, signed by Governor Schwarzenegger on June 1, 2005, established the following GHG emission reduction targets for the State of California: ♦ By 2010, reduce GHG emissions to 2000 levels; ♦ By 2020, reduce GHG emissions to 1990 levels; and ♦ By 2050, reduce GHG emissions to 80 percent below 1990 levels.
This executive order also directs the secretary of the Cal/EPA to oversee the efforts made to reach these targets, and to prepare biannual reports on the progress made toward meeting the targets and on the impacts to California related to global warming, including impacts to water supply, public health, agriculture, the coastline, and forestry. The report shall also prepare and re-port on mitigation and adaptation plans to combat the impacts. iv. Assembly Bill 32 In response to Executive Order S-3-05, the California legislature passed As-sembly Bill 32 (AB 32), the “California Global Warming Solutions Act of

C I T Y O F C H I N O
G E N E R A L P L A N D R A F T E I R A I R Q U A L I T Y A N D G R E E N H O U S E G A S E S
4.3-52
2006,” which was signed by Governor Arnold Schwarzenegger on September 27, 2006. It requires the CARB to adopt rules and regulations that would reduce GHG emissions to 1990 levels by 2020. It directs CARB to develop early action measures to reduce GHG emissions and prepare a Climate Change Scoping Plan to identify how to reach the 2020 limit. In June 2007, the CARB directed staff to pursue 37 early actions for reducing GHG emis-sions. In October 2007, the CARB staff expanded the list of early action measures to 44. These 44 measures could result in reductions of at least 42 million metric tons of CO2-equivalent (MMTCO2E).24 v. Executive Order S-01-07 Executive Order S-01-07, signed by Governor Schwarzenegger on January 18, 2007, directs that a Statewide goal be established to reduce the carbon inten-sity of California’s transportation fuels by at least 10 percent by 2020. AB 32 orders that a Low Carbon Fuel Standard (LCFS) for transportation fuels be established for California and directs the CARB to determine if a LCFS can be adopted as a discrete early action measure pursuant to AB 32. The CARB approved the LCFS as a discrete early action item with a regulation to be adopted and implemented by 2010 at its June 2007 hearing. EO S-01-07 also instructs the Cal/EPA to coordinate activities between the University of California, the California Energy Commission, and other State agencies to develop and propose a draft compliance schedule to meet the 2020 target. vi. Senate Bill 1078 Senate Bill 1078 (SB 1078) establishes a renewable portfolio standard (RPS) for electricity supply. The RPS requires that retail sellers of electricity, including investor-owned utilities and community choice aggregators, provide 20 per-cent of their supply from renewable sources by 2017. This target date was moved forward by SB 1078 to require compliance by 2010. In addition, elec-tricity providers subject to the RPS must increase their renewable share by at
24 State of California, 2007, Expanded List of Early Action Measures to Re-
duce Greenhouse Gas Emissions in California Recommended for Board Considera-tion, CARB.
C I T Y O F C H I N O
G E N E R A L P L A N D R A F T E I R A I R Q U A L I T Y A N D G R E E N H O U S E G A S E S
4.3-53
least 1 percent each year. The outcomes of this legislation will impact re-gional transportation powered by electricity. vii. Senate Bill 375 Senate Bill 375 (SB 375) requires CARB to set regional targets for GHG emis-sions. Its purpose is to reduce emissions by promoting high-density, mixed-use developments around mass transit hubs. SB 375 requires that Metropoli-tan Planning Organizations (MPOs) in California update their Regional Transportation Plans (RTPs) to promote this smart growth development. 2. South Coast Air Quality Management District (SCAQMD) Signifi-
cance Thresholds The SCAQMD’s governing board adopted interim GHG significance thresh-old on December 5, 2008 for projects where the SCAQMD is the lead agency. However, these thresholds focus on project-level CEQA documents, rather than program-level documents. Therefore, they were not used to establish significance criteria for this EIR. 3. Existing Conditions There are numerous GHGs, both naturally occurring and manmade. Table 4.3-12 summarizes some of the most common.25 Of the gases listed in Table 4.3-12, carbon dioxide, methane, and nitrous oxide are produced by both natural and anthropogenic (human) sources. The remaining gases (hydrofluorocarbons [HFCs; such as HFC-23], perfluorocarbons [PFCs; such as CF4], and sulfur hexafluoride [SF6]) are the result of human processes. The potential of a gas to trap heat and warm the atmosphere is measured by its “global warming potential” or GWP. Specifically, GWP is defined as the cumulative radiative forcing—both direct and indirect effects—integrated over
25 U.S. EPA, 2002, Greenhouse Gases and Global Warming Potential Values –
Excerpt from the Inventory of U.S. Greenhouse Emissions and Sinks: 1990-2000.
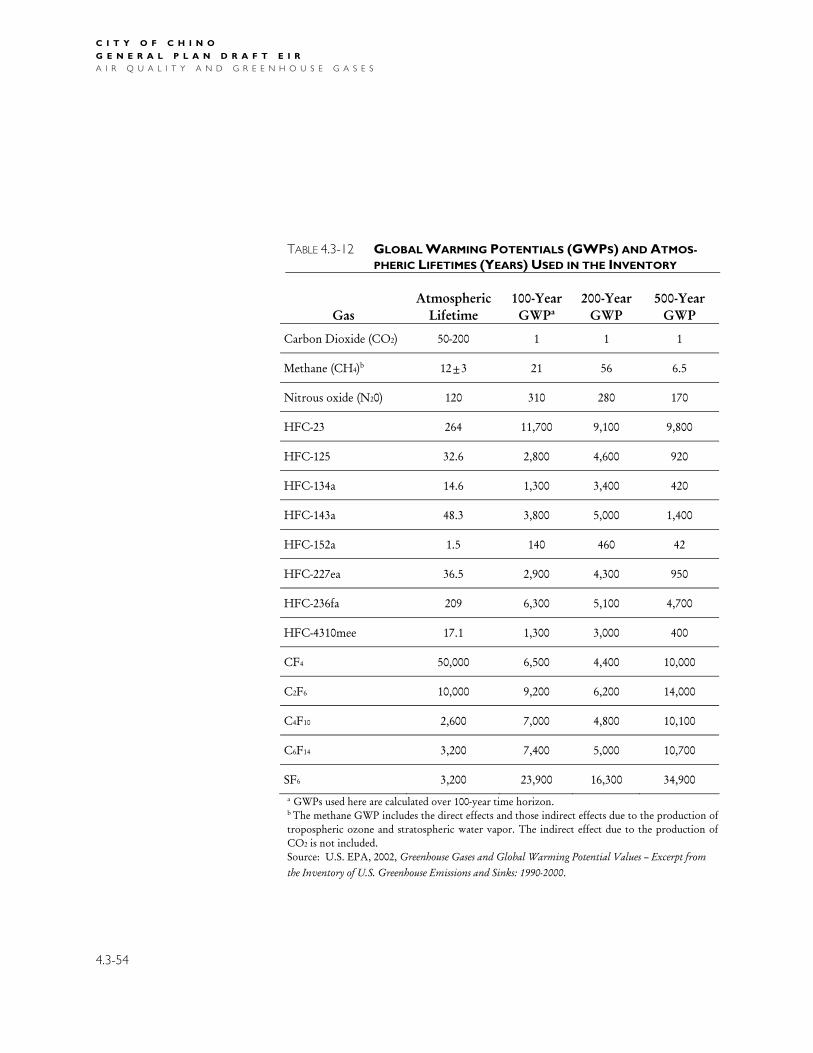
C I T Y O F C H I N O
G E N E R A L P L A N D R A F T E I R A I R Q U A L I T Y A N D G R E E N H O U S E G A S E S
4.3-54
TABLE 4.3-12 GLOBAL WARMING POTENTIALS (GWPS) AND ATMOS-PHERIC LIFETIMES (YEARS) USED IN THE INVENTORY
Gas Atmospheric
Lifetime 100-Year GWPa
200-Year GWP
500-Year GWP
Carbon Dioxide (CO2) 50-200 1 1 1
Methane (CH4)b 12±3 21 56 6.5
Nitrous oxide (N20) 120 310 280 170
HFC-23 264 11,700 9,100 9,800
HFC-125 32.6 2,800 4,600 920
HFC-134a 14.6 1,300 3,400 420
HFC-143a 48.3 3,800 5,000 1,400
HFC-152a 1.5 140 460 42
HFC-227ea 36.5 2,900 4,300 950
HFC-236fa 209 6,300 5,100 4,700
HFC-4310mee 17.1 1,300 3,000 400
CF4 50,000 6,500 4,400 10,000
C2F6 10,000 9,200 6,200 14,000
C4F10 2,600 7,000 4,800 10,100
C6F14 3,200 7,400 5,000 10,700
SF6 3,200 23,900 16,300 34,900 a GWPs used here are calculated over 100-year time horizon. b The methane GWP includes the direct effects and those indirect effects due to the production of tropospheric ozone and stratospheric water vapor. The indirect effect due to the production of CO2 is not included. Source: U.S. EPA, 2002, Greenhouse Gases and Global Warming Potential Values – Excerpt from the Inventory of U.S. Greenhouse Emissions and Sinks: 1990-2000.

C I T Y O F C H I N O
G E N E R A L P L A N D R A F T E I R A I R Q U A L I T Y A N D G R E E N H O U S E G A S E S
4.3-55
a period of time from the emission of a unit mass of gas relative to some reference gas.26 In addition to those shown in Table 4.3-12, there are other GHGs typically not considered when evaluating the effects on global climate change. These are short-lived gases such as CO, water vapor, tropospheric ozone, tropospheric aerosols (e.g. sulfur dioxide products, and black carbon), and other ambient air pollutants such as NOX and non-methane volatile organic compounds (NMVOCs). Because they are short-lived, concentrations of these gases tend to vary spatially and it is difficult to determine their global radiative forcing impacts. Therefore, GWPs are typically not attributed to these short-lived, spatially inhomogeneous atmospheric gases.27 Each year, the EPA prepares an inventory of GHG emissions and sinks. GHG sinks are places where GHGs are removed or sequestered. The report provides information on GHGs emission and sink sources and is used to de-velop policies and track progress. Inventories are submitted to the United Nations. The mf2004ost recent report, Inventory of U.S. Greenhouse Gas Emis-sions and Sinks: 1990–2007, was completed in April 2009.28 The EPA also provides guidance for states to develop GHG inventories. CARB is responsi-ble for developing the California Greenhouse Gas Inventory. The Inventory of California Greenhouse Gas Emissions and Sinks: 1990 to 2004 completed in December 2006 including subsequent revisions to the in-State electricity pro-duction estimates, is the most recent report for California.29 The inventory
26 U.S. EPA, 2002, Greenhouse Gases and Global Warming Potential Values –
Excerpt from the Inventory of U.S. Greenhouse Emissions and Sinks: 1990-2000. 27 U.S. EPA, 2002, Greenhouse Gases and Global Warming Potential Values –
Excerpt from the Inventory of U.S. Greenhouse Emissions and Sinks: 1990-2000. 28 U.S. EPA, 2009, Inventory of U.S. Greenhouse Gas Emissions and Sinks:
1990 – 2007. 29 State of California, 2006, Inventory of California Greenhouse Gas Emissions and Sinks: 1990 – 2004 and State of California, 2007, Revisions to the 1990 to 2004 Greenhouse Gas Emissions Inventory Report – Letter from Rosella Shapiro, California Energy Commission, to the California Air Resources Board, January 23.

C I T Y O F C H I N O
G E N E R A L P L A N D R A F T E I R A I R Q U A L I T Y A N D G R E E N H O U S E G A S E S
4.3-56
summarizes GHG emissions in California, supports AB 32, and serves as a basis for forecasting GHG emissions necessary for developing Climate Change Scoping Plan recommendations. Tables 4.3-13 and 4.3-14 summarize the national GHG emissions in 1990, 1995, 2000, and 2005 through 2007, and State GHG emissions from 1990 through 2004, respectively. Net GHG emissions are gross emissions minus GHG sinks. As seen in Ta-bles 4.3-12 and 4.3-13, in 2000 California emitted approximately 421 million metric tons of GHGs, compared to approximately 6,291 million metric tons of GHG emissions for the nation as a whole, or about 6.7 percent of the na-tion’s emissions. Tables 4.3-12 and 4.3-13 also illustrate that although Cali-fornia emits a substantial portion of the nation’s GHGs, California’s per cap-ita emissions are roughly half the national average. CARB has developed a year 2020 “business-as-usual” forecast, which repre-sents the GHG emissions that would be expected to occur without any of the recommended measures in the Scoping Plan. The 2020 “business-as-usual” emissions estimate was derived by projecting emissions from a past baseline year using growth factors specific to each of the different economic sectors. It is estimated that California year 2020 “business-as-usual” emissions will be 596 million metric tons carbon dioxide equivalent (MTCO2E). The recom-mended reduction measures would reduce these emissions by 169 million MTCO2E, resulting in Statewide emissions of 427 million MTCO2E.30 4. Standards of Significance The Proposed General Plan and Focused General Plan would create a signifi-cant impact on GHG emissions if they would:
30 State of California, 2009, Greenhouse Gas Inventory – 2020 Forecast,
http://www.arb.ca.gov/cc/inventory/data/forecast.htm accessed on August 24, 2009.

C I T Y O F C H I N O
G E N E R A L P L A N D R A F T E I R A I R Q U A L I T Y A N D G R E E N H O U S E G A S E S
4.3-57
TABLE 4.3-13 NET NATIONAL GREENHOUSE GAS EMISSIONS (TG CO2
EQUIVALENT)
Year CO2 CH4 N2O
HFCs, PFCs, and SF6
a Totalb National
Populationc
Total (Mg CO2 Eq) per Capita
1990 4,235.3 616.6 315.0 90.5 5,257.3 249,464,396 21.1
1995 4,556.9 615.8 334.1 105.5 5,612.3 262,803,276 21.4
2000 5,237.7 591.1 329.2 132.8 6,290.7 282,194,308 22.3
2005 4,968.1 561.7 315.9 140.2 5,985.9 295,895,897 20.2
2006 4,964.4 582.0 312.1 142.1 6,000.6 298,754,819 20.1
2007 5,040.8 585.3 311.9 149.5 6,087.5 301,621,157 20.2 Notes: Tg = terragrams = one million metric tons; Mg = megagrams = one metric ton. a Hydrofluorocarbons, perfluorocarbons, and sulfur hexafluoride b Totals may vary from the sum of the sources due to independent rounding c U.S. Census Bureau 2009. Source: U.S. EPA, 2009, Inventory of U.S. Greenhouse Gas Emissions and Sinks: 1990 – 2007.
♦ Generate GHG emissions, either directly or indirectly, that would have a significant impact on the environment. For the purposes of this analysis, it is assumed that any GHG emissions greater than 85 percent of those generated in 2005 would have a significant impact on the environment.
This threshold is based on the Statewide targets established by Executive Or-der S-3-05. Most experts agree that a reduction to 1990 levels by 2020 requires a reduction of 15 percent relative to 2005 levels in 2020. In addition, the Proposed General Plan and Focused Growth Plan would ex-perience a significant impact from global climate change if they would:
♦ Result in the exposure of Chino residents to hazards associated with cli-mate change.

C I T Y O F C H I N O
G E N E R A L P L A N D R A F T E I R A I R Q U A L I T Y A N D G R E E N H O U S E G A S E S
4.3-58
TABLE 4.3-14 NET CALIFORNIA GREENHOUSE GAS EMISSIONS (TG CO2 EQUIVALENT)
Year CO2 CH4 N2O
HFCs, PFCs, and SF6
a Totalb California
Populationc
Total (Mg CO2 Eq) per Capita
1990 301.6 26.0 32.7 7.1 367.4 29,950,111 12.3
1991 293.4 24.9 30.4 7.4 356.1 30,414,114 11.7
1992 299.9 23.8 30.5 7.9 362.2 30,875,920 11.7
1993 295.3 25.4 31.5 8.4 360.5 31,147,208 11.6
1994 313.9 25.4 30.0 8.9 378.2 31,317,179 12.1
1995 297.7 26.2 31.9 9.3 365.1 31,493,525 11.6
1996 302.3 25.5 30.8 11.4 370.0 31,780,829 11.6
1997 312.3 24.2 28.8 12.6 378.0 32,217,708 11.7
1998 330.3 25.3 29.2 8.9 393.7 32,682,794 12.0
1999 333.3 26.3 29.4 9.9 398.9 33,145,121 12.0
2000 352.6 26.4 31.4 10.5 420.9 34,004,051 12.4
2001 357.8 26.7 30.8 11.2 426.5 34,525,902 12.4
2002 351.0 27.1 34.5 12.0 424.6 34,963,856 12.1
2003 328.4 27.5 33.9 12.9 402.7 35,376,833 11.4
2004 342.9 27.9 33.3 14.2 418.3 35,721,991 11.7
Notes: Tg = terragrams = one million metric tons; Mg = megagrams = one metric ton
a Hydrofluorocarbons, perfluorocarbons, and sulfur hexafluoride b Totals may vary from the sum of the sources due to independent rounding c US Census Bureau, 2009. Source: State of California, 2006, Inventory of California Greenhouse Gas Emissions and Sinks: 1990 – 2004.

C I T Y O F C H I N O
G E N E R A L P L A N D R A F T E I R A I R Q U A L I T Y A N D G R E E N H O U S E G A S E S
4.3-59
5. Impact Discussion An assessment was made to estimate the total GHG emissions that would be emitted as a result of buildout of the Proposed General Plan and the Focused Growth Plan. Operational sources of GHG emissions include energy con-sumption, transportation, and solid waste. The three primary GHGs that would be emitted are CO2, CH4, and N2O. As discussed above, these GHGs have varying amounts of GWP. As shown in Table 4.3-12, the 100-year GWP for carbon dioxide, methane, and nitrous oxide are 1, 21, and 310, respectively. GHG emission factors are summarized in Table 4.3-15. Below is a summary of the GHG emissions due to existing land uses, buildout of the Proposed General Plan, and buildout of the Focused Growth Plan. Emissions were first calculated for “business as usual” conditions. “Business as usual” is considered to be development without implementation of emis-sions reduction measures. Then, the anticipated reductions were calculated and the resulting GHG emissions were compared to existing GHG emissions. GHG emissions calculations are contained in Appendix 2. A summary of the land uses modeled for the existing General Plan, the Proposed General Plan, and the Focused Growth Plan is shown in Table 4.3-10. It is important to note, throughout this impact discussion, that the majority of the development proposed in both the Proposed General Plan and the Fo-cused Growth Plan has already been approved by the City of Chino as part of the College Park and The Preserve Specific Plans, including a recent amend-ment to The Preserve adding the Edgewater Communities project. The City of Chino has existing development agreements with the master developers of College Park and The Preserve, obligating the City to continue to approve development at specific densities and intensities within these areas, as shown in the Proposed General Plan and Focused Growth Plan. This precludes the City from modifying land use and development patterns as a means to further mitigate greenhouse gas emissions within the two Specific Plan areas.

C I T Y O F C H I N O
G E N E R A L P L A N D R A F T E I R A I R Q U A L I T Y A N D G R E E N H O U S E G A S E S
4.3-60
TABLE 4.3-15 GHG EMISSION FACTORS
Gas
Vehicle Emission Factors
(lbs/gallon)a
Electricity Generation Emission Factors
(lbs/MWh)b
Natural Gas Combustion
Emission Factors (pound/
million ft3)c
Carbon Dioxide (CO2) 19.564 1,340 120,000
Methane (CH4) 0.00055 0.0111 2.3
Nitrous Oxide (N2O) 0.0002 0.0192 2.2 a BAAQMD, 2006, Source Inventory of Bay Area Greenhouse Gas Emissions. b U.S. DOE, 2002, Updated State-level Greenhouse Gas Emission Coefficients for Electricity Genera-tion 1998-2000, http://tonto.eia.doe.gov/FTPROOT/environment/e-supdoc-u.pdf accessed on February 16, 2007. c U.S. EPA, 2009, AP 42, Fifth Edition, Compilation of Air Pollutant Emission Factors, Volume 1: Stationary Point and Area Sources, Section 1.4, Natural Gas Combustion.
a. Existing Land Uses i. Transportation Vehicle emissions were estimated using the emission factors developed by the Bay Area Air Quality Management District (BAAQMD). This analysis of GHG emissions is based on the VMT calculated by the Iteris, Inc for traffic within Chino resulting from the existing land uses, the Proposed Gener-alPlan, and the Focused Growth Plan. This calculation was based on the same traffic model described in Section 4.13: Traffic and Circulation of this EIR.. The Southern California Air Quality Management District’s factors are not used because the BAAQMD emission factors are generalized, not specific to the Bay Area, and are therefore applicable here. The existing land uses generate 2,077,248 VMT. The vehicle population con-sists of passenger cars and light trucks. The EPA estimates that the average fuel economy for passenger cars is 23.9 miles per gallon (mpg), and the aver-

C I T Y O F C H I N O
G E N E R A L P L A N D R A F T E I R A I R Q U A L I T Y A N D G R E E N H O U S E G A S E S
4.3-61
age fuel economy for light trucks is 17.4 mpg.31 To be conservative, a fuel economy of 17.4 mpg was used to calculate vehicle emissions. Vehicle emis-sions associated with the existing uses generate 388,137 MTCO2E per year. ii. Energy Use (Electricity and Natural Gas) Due to the nature of the electrical grid, it is not possible to predict with cer-tainty where electrical power is generated. Therefore, GHG emissions result-ing from electricity generation associated with the existing land uses and the Proposed General Plan were estimated using national average emission factors developed by the U.S. Department of Energy and existing electricity con-sumption rates. The average consumption rates for residential, commercial, and industrial uses were obtained from consumption data published by the U.S. Energy Information Administration (EIA). In California in 2007, the average electricity consumption for a residential consumer was 580 kilowatt hours (kWh) per month per consumer and the average electricity consump-tion for an industrial consumer was 53,568 kWh per month.32 The average annual consumption rate for commercial uses was 14.1 kWh per square foot per year.33 For the purposes of this analysis, it was assumed that the electric-ity consumption for schools would be the same as for a commercial con-sumer. The existing land uses consume 620,466 kWh (approximately 620,467 megawatt hours [MWh]) per year. This would result in 378,869 MTCO2E per year. GHG emissions resulting from natural gas combustion were estimated using the emission factors developed by the EPA and existing natural gas consump-
31 U.S. EPA, 2005, Emission Facts: Greenhouse Gas Emissions from a Typi-
cal Passenger Vehicle. EPA420-F-05-004, http://www.epa.gov/OMS/climate/ 420f05004.pdf accessed on January 28, 2008.
32 U.S. EIA, 2007. Table 5, U.S. Average Monthly Bill by Sector, Census Division, and State, http://www.eia.doe.gov/cneaf/electricity/esr/table5.html ac-cessed on December 21, 2009.
33 U.S. EIA, 2006, 2003 Commercial Buildings Energy Consumption Survey: Consumption and Expenditures Tables. Table C14. Electricity Consumption and Expenditure Intensities for Non-Mall Buildings.
C I T Y O F C H I N O
G E N E R A L P L A N D R A F T E I R A I R Q U A L I T Y A N D G R E E N H O U S E G A S E S
4.3-62
tion rates. The average natural gas consumption rate in cubic feet per year are as follows: residential single-family consumer 62,384, residential multi-family consumer 37,547,64, commercial-retail consumer 34.8, commercial-office con-sumer 24, and industrial consumer 2,899,332 cubic feet per year.34 For the purposes of this analysis, it was assumed that the natural gas consumption for schools would be the same as for a commercial-office consumer. The existing land uses consume 5,044,611,313 cubic feet per year. This would result in 276,255 MTCO2E per year. iii. Water Use Water use and energy are often closely linked. The provision of potable water to residents consumes large amounts of energy associated with five stages: source and conveyance, treatment, distribution, end use, and wastewater treatment. This inventory estimated that delivered water for the existing land uses would have an embodied energy of 2,779 kWh/acre-foot or 0.0085 kWh/gallon.35 The existing land uses require 39.69 million gallons per day (MGD) based on existing land use acreages multiplied by generalized water duty factors.36 The embodied energy demand associated with this water use was converted to GHG emissions with the same electrical grid coefficients as the other purchased electricity. This would result in 75,191 MTCO2E per year. iv. Solid Waste The disposal of solid waste produces GHG emissions from anaerobic decom-position in landfills, incineration, transportation of waste, and disposal. The
34 Rimpo and Associates, 2007, URBEMIS 2007 for Windows, Version 9.2.4. 35 Torcellini et al., 2003. Consumptive Water Use for U.S. Power Produc-
tion. Technical Report # NREL-TP-550-33905. National Renewable Energy Labora-tory, Golden, CO.
36 Chazan, Dahlia, DC&E. Personal e-mail communication with Jesse Flemming, DC&E, December 16, 2009.
C I T Y O F C H I N O
G E N E R A L P L A N D R A F T E I R A I R Q U A L I T Y A N D G R E E N H O U S E G A S E S
4.3-63
existing land uses generate 141,496 tons of solid waste per year.37 The EPA’s Waste Reduction Model (WARM) was used to calculate the GHG emissions due to solid waste generated by the existing land uses. The WARM divides solid waste into many different categories including yard trimmings, paper products, metals, aluminum, glass, food waste, plastics, and other materials. An estimate of the distribution of these materials was obtained from the EPA.38 The solid waste associated with the existing land uses generate 85,234 MTCO2E per year. v. Total GHG Emission—Existing Land Uses Table 4.3-16 shows the GHG emissions, expressed as equivalent CO2 emis-sions, due to the existing land uses. As shown, the existing land uses emit 1,203,685 MTCO2E per year. b. Proposed General Plan i. Transportation Vehicle emissions were estimated as described above. The Proposed General Plan would generate 3,864,855 VMT. The vehicle population would likely consist of passenger cars and light trucks. To be conservative, a fuel economy of 17.4 mpg was used to calculate vehicle emissions. Vehicle emissions associ-ated with the Proposed General Plan would generate 722,154 MTCO2E per year. ii. Energy Use (Electricity and Natural Gas) GHG emissions resulting from electricity generation associated with the Pro-posed General Plan were estimated using national average emission factors developed by the U.S. Department of Energy and existing electricity con-sumption rates discussed above. Buildout of the Proposed General Plan
37 Chazan, Dahlia, DC&E. Personal e-mail communication with Jesse
Flemming, DC&E, August 18, 2009. 38 U.S. EPA, 2008, Waste Reduction Model, http://www.epa.gov/
climatechange/wycd/waste/calculators/Warm_home.html accessed on December 21, 2009.
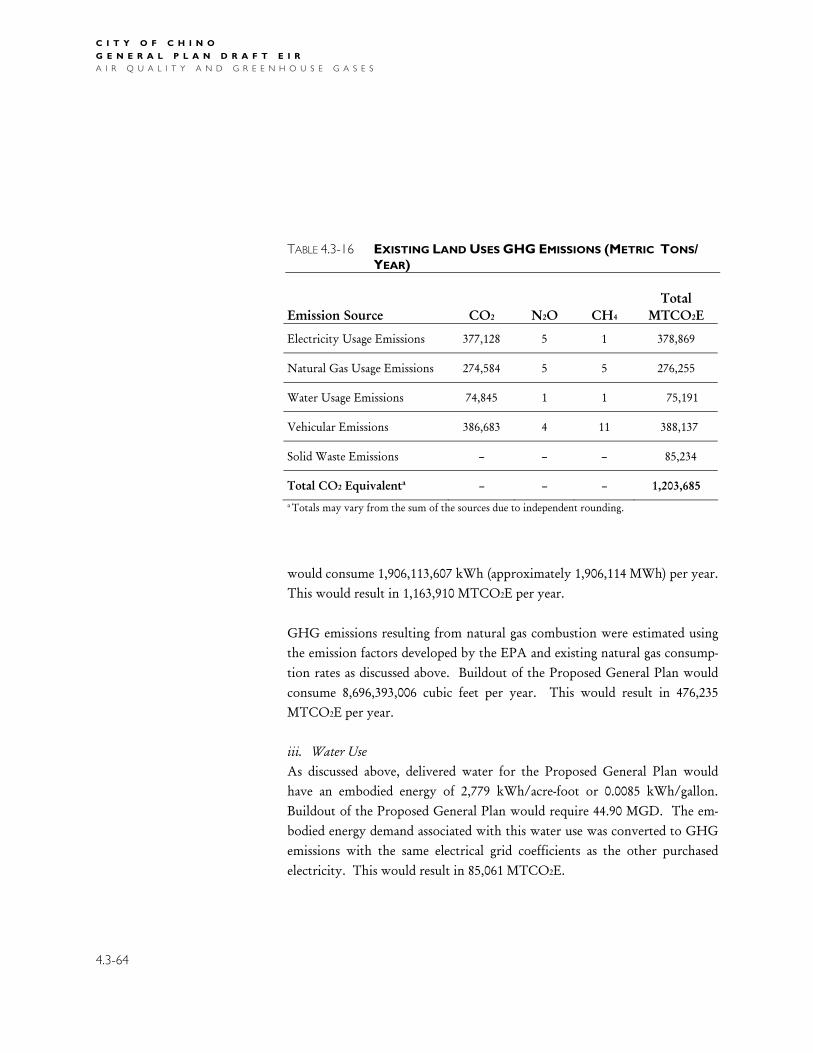
C I T Y O F C H I N O
G E N E R A L P L A N D R A F T E I R A I R Q U A L I T Y A N D G R E E N H O U S E G A S E S
4.3-64
TABLE 4.3-16 EXISTING LAND USES GHG EMISSIONS (METRIC TONS/ YEAR)
Emission Source CO2 N2O CH4 Total
MTCO2E
Electricity Usage Emissions 377,128 5 1 378,869
Natural Gas Usage Emissions 274,584 5 5 276,255
Water Usage Emissions 74,845 1 1 75,191
Vehicular Emissions 386,683 4 11 388,137
Solid Waste Emissions – – – 85,234
Total CO2 Equivalenta – – – 1,203,685 a Totals may vary from the sum of the sources due to independent rounding.
would consume 1,906,113,607 kWh (approximately 1,906,114 MWh) per year. This would result in 1,163,910 MTCO2E per year. GHG emissions resulting from natural gas combustion were estimated using the emission factors developed by the EPA and existing natural gas consump-tion rates as discussed above. Buildout of the Proposed General Plan would consume 8,696,393,006 cubic feet per year. This would result in 476,235 MTCO2E per year. iii. Water Use As discussed above, delivered water for the Proposed General Plan would have an embodied energy of 2,779 kWh/acre-foot or 0.0085 kWh/gallon. Buildout of the Proposed General Plan would require 44.90 MGD. The em-bodied energy demand associated with this water use was converted to GHG emissions with the same electrical grid coefficients as the other purchased electricity. This would result in 85,061 MTCO2E.

C I T Y O F C H I N O
G E N E R A L P L A N D R A F T E I R A I R Q U A L I T Y A N D G R E E N H O U S E G A S E S
4.3-65
iv. Solid Waste The EPA’s WARM was used to calculate the GHG emissions due to solid waste generated by the Proposed General Plan. Buildout of the Proposed General Plan would generate 185,420 tons of solid waste per year. The solid waste associated with the Proposed General Plan would generate 111,693 MTCO2E per year. v. Total GHG Emissions—Proposed General Plan Table 4.3-17 shows the projected GHG emissions, expressed as equivalent CO2 emissions, resulting from buildout of the Proposed General Plan under
“business as usual” conditions. These emissions do not account for any emis-sions reduction measures contained in the Scoping Plan. Reductions are dis-cussed below. As shown, the Proposed General Plan is projected to emit 2,559,052 MTCO2E per year under “business as usual” conditions.
vi. Emissions Reduction Measures The emissions reduction assumptions used for Chino are described below:
♦ In 2008, the California Energy Commission adopted Title 24 Energy Ef-ficiency Standards, which require implementation of energy-efficient technologies that reduce energy consumption in new residential, com-mercial and industrial development. The largest percentage reduction from Title 24 Standards will occur in new residential sector energy con-sumption. Title 24 is estimated to reduce new residential electricity con-sumption by 22.7 percent and natural gas consumption by 10 percent.39
Title 24 also includes standards for retrofitting existing buildings to im-prove efficiency. The California Energy Commission report, Options for Energy Efficiency in Existing Buildings, estimates the impact of ret-rofits on energy demand and consumption in existing residential units.
39 California Energy Commission, 2008, Update to the California Energy Effi-
ciency Standards for Residential and Nonresidential Buildings, http://www.energy.ca.gov/title24/2008standards/index.html accessed on December 21, 2009.

C I T Y O F C H I N O
G E N E R A L P L A N D R A F T E I R A I R Q U A L I T Y A N D G R E E N H O U S E G A S E S
4.3-66
♦
TABLE 4.3-17 PROPOSED GENERAL PLAN “BUSINESS AS USUAL” GHG EMISSIONS (METRIC TONS/YEAR)
Emission Source CO2 N2O CH4 Total
MTCO2E
Electricity Usage Emissions 1,158,562 17 1 1,163,910
Natural Gas Usage Emissions 473,354 9 9 476,235
Water Usage Emissions 84,670 1 1 85,061
Vehicular Emissions 719,449 7 20 722,154
Solid Waste Emissions - - - 111,693
Total CO2 Equivalenta - - - 2,559,052 a Totals may vary from the sum of the sources due to independent rounding.
Retrofits would be implemented through Title 24 requirements and through investor-owned utilities (IOUs) energy efficiency programs, and would include refrigerant charge and airflow and duct leakage to central air conditioning and furnace systems. By 2020, 5 percent of existing residential units built prior to Title 24 Building Standards are expected to save an average of 328 kWh of electricity and 74 therms of gas per year.40
♦ The California Green Building Initiative (Executive Order S-20-04) calls for modifications to Title 24 standards that will increase energy efficiency in new government and commercial buildings by 20 percent by 2015.41
40 California Energy Commission, 2005, Options for Energy Efficiency in Ex-
isting Buildings, Commission Report to California State Legislature, http://www.energy.ca.gov/2005publications/CEC-400-2005-039/CEC-400-2005-039-CMF.pddf, accessed on December 21, 2009.
41 California Energy Commission, 2009, http://www.energy.ca.gov/ greenbuilding, accessed on July 30, 2009.
C I T Y O F C H I N O
G E N E R A L P L A N D R A F T E I R A I R Q U A L I T Y A N D G R E E N H O U S E G A S E S
4.3-67
♦ California Executive Order S-14-08 requires California electricity provid-ers to expand their renewable energy portfolio to serve 33 percent of their load through renewable energy sources by 2020.42 Renewable en-ergy sources generally do not generate GHG emissions.
♦ According to a report by Smart Growth America, compact development with pedestrian-friendly design can reduce VMTs from 20 to 40 percent.43 The Proposed General Plan would result in 42 percent compact develop-ment and the Focused Growth Plan would result in 47 percent compact development. This analysis assumes new compact development occurring in Chino would result in a 20 percent reduction in VMTs.
♦ In April 2009, CARB adopted a Low Carbon Fuel Standard that will re-duce GHG emissions from transportation fuels by 10 percent by 2020.44 AB 118, the Alternative and Renewable Fuel and Vehicle Technology Program will support this regulation by financing development and de-ployment of low-carbon fuels such as plug-in hybrid, battery electric, fuel-cell, and fuels refined from organic waste.45
♦ AB 1493 directed CARB to adopt regulations that would decrease GHG emissions from new passenger vehicles through technical improvements, beginning with the 2009 model year. These regulations are expected to reduce emissions 30 percent in new passenger vehicles by 2016, and are es-timated to result in an 18 percent GHG emissions reduction across the passenger fleet.46
42 California Energy Commission 2009, http://www.energy.ca.gov/
renewables/index.html accessed on August 3, 2009. 43Smart Growth America, 2008, Growing Cooler: The Evidence on Urban De-
velopment and Climate Change, http://www.smartgrowthamerica.org/ gcindex.html, accessed on December 21, 2009.
44 State of California, 2009, News Release: California Adopts Low Carbon Fuel Standard, http://www.arb.ca.gov/newsrel/nr042309b.htm, accessed on April 23.
45 California Energy Commission, 2009, http://www.energy.ca.gov/ ab118/index.html, accessed on August 5.
46 California Clean Cars Campaign, 2006, Fact sheet: California’s Vehicle Global Warming Pollution Reduction Regulation: How it Works,

C I T Y O F C H I N O
G E N E R A L P L A N D R A F T E I R A I R Q U A L I T Y A N D G R E E N H O U S E G A S E S
4.3-68
Table 4.3-18 compares the existing GHG emissions and the year 2025 emis-sions under the Proposed General Plan. Since the model ends at 2020, further improvements in technology and effi-ciency could be expected to take effect by the General Plan horizon year of 2025. Therefore, the emission reduction measures listed above, expected to occur by 2020, may underestimate the full impact of reductions that will likely occur during the lifetime of the Proposed General Plan. As shown, buildout of the Proposed General Plan would result in emissions that are greater than 85 percent of existing GHG emissions. This is a signifi-cant impact. vii. General Plan Policies to Reduce Greenhouse Gas Emissions The Community Character Element contains Goal CC-3 which provides for the creation of livable neighborhoods that feature pedestrian-orientation and mixed uses. Objective CC-2.2 calls for the re-establishment of the Civic Cen-ter and surrounding Downtown as the heart of Chino. To that end, Policy P3 under Objective CC-2.2 calls for new development in the Downtown to include a vertical mix of uses. In addition, Objective CC-4.1 calls for the de-sign of neighborhoods to emphasize connectivity as a means of increasing pedestrian activity. Policy P1 under Objective CC-4.2 calls for the City to connect College Park and The Preserve to the City through vehicular connec-tions, bicycle and pedestrian paths, and public transportation. Similarly, Pol-icy P3 under Objective CC-4.2 calls for the Civic Center to have direct pedes-trian, bicycle and vehicular connections to all neighborhoods or commercial areas. Policy P4 under Objective CC-4.2 calls for neighborhoods to have di-rect pedestrian, bicycle, and vehicular connections to their focal points. Fi-nally, Goal CC-4 calls for the design of new and existing neighborhoods to be pedestrian-friendly.
http://www.calcleancars.org/factsheets/staffproposal.pdf, accessed on December 21, 2009.

C I T Y O F C H I N O
G E N E R A L P L A N D R A F T E I R A I R Q U A L I T Y A N D G R E E N H O U S E G A S E S
4.3-69
TABLE 4.3-18 COMPARISON OF EMISSIONS FOR YEAR 2005 BASELINE AND YEAR 2025 UNDER THE PROPOSED GENERAL PLAN
ASSUMING REDUCTIONS (CO2EQ PER YEAR)
Emission Source
Existing Conditions
2005
Year 2025 (Proposed
General Plan) with
Reductions
Year 2025 as Percentage of
Year 2005
Electricity Emissions 378,869 746,319 197%
Natural Gas Emissions 276,255 433,738 157%
Water Emissions 75,191 85,061 113%
Vehicular Emissions 388,137 476,275 123%
Solid Waste Emissions 85,234 111,693 131%
Total Emissions 1,203,685 1,853,086 154%
The Land Use Element contains Objective LU-1.2, which calls for the crea-tion and maintenance of neighborhoods that facilitate walking and bicycling in lieu of car travel. Policy P1 under Objective LU-1.2 calls for a walkability standard of one-quarter mile to transit stops and recreational areas for all resi-dential neighborhoods. Policy P1 also calls for a walkability standard of one-half mile to daily retail needs for all residential neighborhoods. Policy P2 calls for the City to encourage the development of complementary land uses not already present in residential neighborhoods, such as grocery stores, basic commercial services, parks and recreational fields, and schools, to promote walking and bicycling and reduce vehicle miles traveled. Action A2 under Objective LU-3.1 calls for the City to work with the Southern California Association of Governments (SCAG) when it prepares its Sustainable Com-munities Strategy (SCS) to ensure that sites from the Focused Growth Plan are included in the SCS. Goal LU-5 most explicitly addresses GHG emissions by calling for a reduction in Chino’s GHGs. Objective LU-5.1 promotes
C I T Y O F C H I N O
G E N E R A L P L A N D R A F T E I R A I R Q U A L I T Y A N D G R E E N H O U S E G A S E S
4.3-70
efficient, compact land use patterns to prevent sprawl and reduce automobile use. Policy P1 under Objective LU-5.1 calls for the City to facilitate infill development through active leadership and the strategic provision of infra-structure and services and supporting land uses. Policy P2 calls for the City to encourage mixed-use, infill development on brownfields, near public tran-sit, and on underutilized properties within the urban core. Policy P3 discour-ages strip commercial development. Policy P4 calls for the City to balance commercial and residential development within the City to reduce the num-ber of residents commuting long distances to work. Policy P5 5calls for the City to support development at the maximum density allowed by the Gen-eral Plan along Central Avenue, Riverside Drive, and Euclid Avenue, as a means to increase the number of residents with access to transit lines along those roadways. In order to meet its sustainable development goals, Action A2 under Objec-tive LU-5.2 calls for the City to develop a program to provide incentives for projects that support smart growth goals and reduce greenhouse gases, such as mixed-use, infill, and transit-oriented development projects. Objective LU-7.1 encourages new development at a rate that can be served by available and planned public infrastructure. Policy P1 under Objective LU-4.3 calls for the City to direct new growth into existing City or urban reserve areas. The Transportation Element also contains goals and policies that would re-duce carbon emissions. Goal TRA-2, for example, calls for the City to be integrated into the broader regional street network and transportation sys-tem. Policy P2 calls for the City to take an active participatory role in coor-dinated transportation planning with Caltrans, SANBAG, SCAG, and sur-rounding jurisdictions. Policy P4 under Goal TRA-1 dictates that the City shall require all new development to mitigate traffic impacted identified by a City-mandated traffic study or as required by the Congestion Management Plan (CMP)

C I T Y O F C H I N O
G E N E R A L P L A N D R A F T E I R A I R Q U A L I T Y A N D G R E E N H O U S E G A S E S
4.3-71
Goal TRA-7 calls for the minimization of the share of travel for single occu-pancy vehicles in Chino. Objective TRA-7.1 calls for the City to develop and implement Transportation Demand Management (TDM) programs in Chino. Goal TRA-9 would foster public transit as an enjoyable, reliable, safe, conven-ient, equitable, healthy, environmentally-friendly and economical travel choice in Chino. Policy P1 under Objective TRA-9.1 states that the City shall support and promote the development of passenger rail service to the Chino Transit Center. This Policy also states that the rail service should connect Chino residents and workers to other Metrolink stations. Policy P5 states that the City shall recommend increases in service to areas targeted for redevelopment or concentrations of transit-oriented development. Objective TRA-9.2 calls for an increase in the convenience of public transportation choices in Chino. Policy P1 under this Objective calls for increased fre-quency and operational hours of public transit service. Goal TRA-10 calls for fostering bicycling as a convenient, healthy and environmentally-friendly travel choice in Chino. Goal TRA-14 calls for the reduction of GHG emissions by reducing vehicle miles traveled and by increasing or encouraging the use of alternative fuels and transportation technologies. To that end, Objective TRA-14.1 calls for the City to review transportation funding to encourage a shift from single-occupancy vehicles to transit and other modes of transportation. Objective TRA-14.2 promotes the use of low- and zero-emission vehicles, and alterna-tive fuels, and other measures that directly reduce emissions from motor ve-hicles. Policy P2 under this Objective calls for the City to encourage trans-portation fleet standards to achieve the lowest emissions possible, using a mix of alternate fuels and low- and zero-emission vehicles. Action A1 calls for the City to develop a City-wide strategy to encourage the use of alternate fuels and low- and zero-emission vehicles, such as electric vehicle charging locations and conveniently-located alternative fueling stations. Goal OSC-4 in the Open Space and Conservation Element would require that the City minimize the consumption of energy and non-renewable resources,
C I T Y O F C H I N O
G E N E R A L P L A N D R A F T E I R A I R Q U A L I T Y A N D G R E E N H O U S E G A S E S
4.3-72
and promote environmental sustainability. Objective OSC-4.1 would require green building practices throughout the City. Policy P1 under this Objective dictates that new residential development shall meet the guidelines of the California Energy Star New Homes Program and be designed and con-structed to meet the State standards for energy efficiency (Title 24). Policy P1 also says that new nonresidential development shall also meet the State stan-dards for energy efficiency (Title 24). Policy P2 states that the City shall en-courage developers to give buyers of new homes the option of having solar panels. Under Policy P3 of this Objective, the City would encourage solar-oriented design, green roofs, and passive solar heating and cooling in all new residential, commercial and civic development. Policy P4 stipulates that trees should be planted on the south- and west-facing sides of new buildings to re-duce energy usage. Policy P6 would require that all new public buildings constructed by the City adhere to green building standards and meet the U.S. Green Building Council’s Leadership in Energy and Environmental Design (LEED) certifications for green buildings, or an equivalent standard. Policy P7 would require that all new residences sold with appliances install all En-ergy Star-rated appliances. In addition, it would require that all new resi-dences use compact florescent lights in all standard light installations, and that installation of these measures shall be confirmed. Objective OSC-4.2 would promote the conservation and efficient use of en-ergy resources throughout the City. Policy P1 under this Objective requires that all new vehicles purchased and operated by the City of Chino be alterna-tively-fueled or hybrid vehicles. Policy P2 says that the City shall collaborate with local energy suppliers and distributors to establish energy conservation programs, Energy Star® appliance change-out programs, rebates, vouchers, and other incentives to install energy-efficient technology and products. Goal OSC-5 calls for a reduction in GHG emissions by 15 percent below 2005 levels by 2030. Objective OSC-5.1 calls for the City to take appropriate actions to reduce GHG emissions and Chino’s contribution to global climate change. Policy P1 under this Objective calls for the City to promote land use patterns, a diverse and efficient public transportation system, and other rea-
C I T Y O F C H I N O
G E N E R A L P L A N D R A F T E I R A I R Q U A L I T Y A N D G R E E N H O U S E G A S E S
4.3-73
sonable measures that reduce the number and length of motor vehicle trips. City. Toward this end, Action A1 would require that the City Adopt a Cli-mate Action Plan within 18 months of adoption of the Proposed General Plan and the Focused Growth Plan that demonstrates how the City will achieve the needed reductions of greenhouse gas emissions. The Climate Ac-tion Plan will be developed in coordination with SANBAG and SCAQMD. Goal OSC-6 requires that the City prepare for the expected impacts of global climate change. Policy P1 requires that the City shall mitigate climate change by decreasing heat gain from pavement and other hard surfaces associated with infrastructure. viii. Hazards Associated with Climate Change Sea level rise and increases in wildland fires are likely in many places in Cali-fornia. However, Chino will not be subject to sea level rise due to its inland location. There is also limited danger from wildland fires, as described in Sec-tion 4.7 of this EIR covering Hazards. Chino is not currently in either a State Responsibility or Local Responsibility Area. Because of its flat topography and the limited amount of open space immediately surrounding Chino, in-creased temperature is unlikely to result in increases in wildland fires that would affect Chino. Climate change could also result in reduced water availability. Through the Proposed General Plan, Chino would prepare for the possibility of drought conditions. This includes policies in the Public Facilities and Services Ele-ment under Objective PFS-7.1. Policy P1 would require the City to acquire additional supplies of water, including local groundwater and recycling to meet future demands. Policy P2 state that the City shall establish water de-mand reduction standards for new development and redevelopment to reduce per capita and total demand for water. Policy P3 states that the City shall review proposed irrigation systems to ensure they provide required water efficiency. Policy P4 calls for the City to review proposed new development and significant redevelopment to determine whether all feasible water conser-

C I T Y O F C H I N O
G E N E R A L P L A N D R A F T E I R A I R Q U A L I T Y A N D G R E E N H O U S E G A S E S
4.3-74
vation measures are being implemented. These measures would limit the po-tential effects of climate change on water supply in Chino. The most likely direct impact on individuals in Chino as a result of climate change is exposure to more extreme heat events. The Proposed General Plan includes policies and actions under Goal OSC-6 designed to prepare Chino for the expected impacts of climate change. Policies P1 and P2 call for the City to reduce the effects of heat increase through reductions in heat island effect associated with paving and roofs. Action A1 calls for the City to pre-pare a program to deal with extreme heat events through approaches such as outreach and notification focused on sensitive populations and the establish-ment of new and maintenance of existing cooling centers. Therefore, the im-pacts of climate change during implementation of the Proposed General Plan would be less than significant. c. Focused Growth Plan i. Transportation Vehicle emissions were estimated as described above. The Focused Growth Plan would generate 3,887,204 VMT. The vehicle population would likely consist of passenger cars and light trucks. To be conservative, a fuel economy of 17.4 mpg was used to calculate vehicle emissions. It should also be noted that fuel economy is likely to improve in future years. Vehicle emissions as-sociated with the Focused Growth Plan would generate 726,330 MTCO2E per year. ii. Energy Use (Electricity and Natural Gas) GHG emissions resulting from electricity generation associated with the Fo-cused Growth Plan were estimated using national average emission factors developed by the U.S. Department of Energy and existing electricity con-sumption rates discussed above. Buildout of the Focused Growth Plan would consume 1,930,560,964 kWh (approximately 1,930,561 MWh) per year. This would result in 1,178,838 MTCO2E.

C I T Y O F C H I N O
G E N E R A L P L A N D R A F T E I R A I R Q U A L I T Y A N D G R E E N H O U S E G A S E S
4.3-75
GHG emissions resulting from natural gas combustion were estimated using the emission factors developed by the EPA and existing natural gas consump-tion rates as discussed above. Buildout of the Focused Growth Plan would consume 8,770,168,693 cubic feet per year. This would result in 480,275 MTCO2E per year. iii. Water Use As discussed above, delivered water for the Focused Growth Plan would have an embodied energy of 2,779 kWh/acre-foot or 0.0085 kWh/gallon. Buildout of the Focused Growth Plan would require 45.20 million gallons per day (MGD). The embodied energy demand associated with this water use was converted to GHG emissions with the same electrical grid coefficients as the other purchased electricity. This would result in 85,629 MTCO2E per year. iv. Solid Waste The EPA’s WARM was used to calculate the GHG emissions due to solid waste generated by the Focused Growth Plan. Buildout of the Focused Growth Plan would generate 188,705 tons of solid waste per year. The solid waste associated with the Focused Growth Project would generate 113,671 MTCO2E. v. Total GHG Emissions— Focused Growth Plan Table 4.3-19 shows the projected GHG emissions, expressed as equivalent CO2 emissions, resulting from buildout of the Focused Growth Plan under “business as usual” conditions. These emissions do not account for any emis-sions reduction measures contained in the Scoping Plan. Reductions are dis-cussed below. As shown, the Focused Growth Plan is projected to emit 2,584,742 MTCO2E per year under “business as usual” conditions. vi. Emissions Reduction Measures The emission reduction measures discussed above for the Proposed General Plan would also apply to the Focused Growth Plan. Table 4.3-20 compares the existing GHG emissions and the year 2025 emissions under the Proposed General Plan.

C I T Y O F C H I N O
G E N E R A L P L A N D R A F T E I R A I R Q U A L I T Y A N D G R E E N H O U S E G A S E S
4.3-76
TABLE 4.3-19 FOCUSED GROWTH PLAN “BUSINESS AS USUAL” GHG EMISSIONS (METRIC TONS/YEAR)
Emission Source CO2 N2O CH4 Total
MTCO2Ea
Electricity Usage Emissions 1,173,421 17 1 1,178,838
Natural Gas Usage Emissions 477,370 9 9 480,275
Water Usage Emissions 85,236 1 1 85,629
Vehicular Emissions 723,610 7 20 726,330
Solid Waste Emissions – – – 113,671
Total CO2 Equivalenta – – – 2,584,742 a Totals may vary from the sum of the sources due to independent rounding.
TABLE 4.3-20 COMPARISON OF EMISSIONS FOR YEAR 2005 BASELINE AND YEAR 2025 UNDER THE FOCUSED GROWTH PLAN AS-
SUMING REDUCTIONS(CO2EQ PER YEAR)
Emission Source
Existing Conditions
2005
Year 2025 (Focused
Growth Plan) with
Reductions
Year 2025 as Percentage of
Year 2005
Electricity Emissions 378,869 755,399 199%
Natural Gas Emissions 276,255 437,795 158%
Water Emissions 75,191 85,629 114%
Vehicular Emissions 388,137 473,800 122%
Solid Waste Emissions 85,234 113,671 133%
Total Emissions 1,203,685 1,866,293 155%

C I T Y O F C H I N O
G E N E R A L P L A N D R A F T E I R A I R Q U A L I T Y A N D G R E E N H O U S E G A S E S
4.3-77
As shown, buildout of the Focused Growth Plan would result in emissions that are greater than 85 percent of existing GHG emissions. This is a signifi-cant impact. vii. General Plan Policies to Reduce Greenhouse Gas Emissions The Focused Growth Plan would be subject to the same policies designed to reduce GHGs as the Proposed General Plan. viii. Hazards Associated with Climate Change The Focused Growth Plan would be subject to the same policies related to the hazards associated with climate change as the Proposed General Plan. It would also experience a less-than-significant impact in this regard. 6. Cumulative Impacts As discussed above, CARB has developed a year 2020 “business-as-usual” fore-cast, which represents the emissions that would be expected to occur without any of the recommended measures in the Scoping Plan. It is estimated that California year 2020 “business-as-usual” emissions will be 596 million MTCO2E. The recommended reduction measures would reduce these emis-sions by 169 million MTCO2E resulting in Statewide emissions of 427 million MTCO2E.47 However, implementation of the Proposed General Plan and the Focused Growth Plan would not result in a 15 percent reduction in GHG emissions below existing levels, resulting in significant direct impacts. These GHG emissions would also be cumulatively significant. 7. Impacts and Mitigation Measures Impact AQ-2: While the Proposed General Plan and the Focused Growth Plan contain objectives, policies, and actions that would reduce emissions, implementation would result in emissions that are greater than 85 percent of existing GHG emissions. Impacts would be significant and unavoidable.
47 State of California, 2009, Greenhouse Gas Inventory – 2020 Forecast,
http://www.arb.ca.gov/cc/inventory/data/forecast.htm, accessed on August 24, 2009.
C I T Y O F C H I N O
G E N E R A L P L A N D R A F T E I R A I R Q U A L I T Y A N D G R E E N H O U S E G A S E S
4.3-78
Mitigation Measure AQ-2: Objective OSC-5.1 Action A1 would be in-cluded in the Open Space and Conservation Element as follows:
Adopt a Climate Action Plan within 18 months of adoption of this General Plan that demonstrates how the City will achieve the needed reductions of GHG emissions. The Climate Action Plan shall be de-veloped in coordination with SANBAG and SCAQMD.
Significance After Mitigation: Significant and unavoidable.