aquality - notikewin and keg rivers water quality...
TRANSCRIPT
Notikewin and Keg River Water Quality
Monitoring Program 2016
The County of Northern Lights and the North Peace
Applied Research Association (NPARA)
Prepared for:
County of Northern Lights
600-7th Avenue NW Box 10
Manning, Alberta T0H 2M0
and
North Peace Applied Research Association
116-4th Avenue SW
Manning, Alberta T0H 2M0
March 2017
Prepared by:
Aquality Environmental Consulting Ltd.
#204, 7205 Roper Road NW
Edmonton, AB, Canada, T6B 3J4
NOTIKEWIN AND KEG RIVER WATER QUALITY 2016 PAGE 1
©2017 Aquality Environmental Consulting Ltd.
Notikewin and Keg Rivers Water Quality
Monitoring Program 2016
The County of Northern Lights and the North Peace
Applied Research Association (NPARA)
Signature Page
Prepared by: Prepared by: Reviewed and Approved by:
Javan Green, B.Sc.
Biologist
Joshua Haag, B.Sc., P.Biol.
Biologist
Corey Stefura, M.Sc. P.Biol.
Senior Biologist, Operations
Manager
NOTIKEWIN AND KEG RIVER WATER QUALITY 2016 PAGE 2
©2017 Aquality Environmental Consulting Ltd.
Executive Summary
In October of 2011, Aquality Environmental Consulting Ltd. undertook a pilot water quality monitoring
study on the Notikewin River, on behalf of the County of Northern Lights and the North Peace Applied
Research Association. Monitoring continued at these same sites in the Spring, Early Summer, Late
Summer, and Fall in 2012 and 2013. Monitoring was expanded in 2013 with the addition of a single site
on the Keg River. Two sites on the Notikewin River were excluded from the monitoring program in 2014
and sampling frequency was reduced to the Spring and the Fall. In 2015, an additional sampling site was
added on the Keg River, with a total of four locations sampled in the Spring and Fall in 2015. Sampling in
2016 continued at these four locations, with sampling events in the Spring, mid-Summer, and Fall.
Results from the monitoring program in 2016 are in generally in good agreement with historical results,
with some notable variations due to climatological differences from previous years. Impediments to
water quality continue to be driven primarily by nutrients and metals, and are dominated by particulate
forms likely associated with soil, sediment, and particulate organic matter. Correspondingly, the greatest
reductions in water quality continue to be observed during the Spring sampling period, when high runoff
occurs due to snowmelt. Bacteria and pesticides continue to show little or no significant impairment to
overall water quality for the system. Water quality in both the Notikewin and Keg rivers is generally
categorized as “Fair” to “Good” based on the overall results of the Water Quality Index calculations, with
the average water quality scores of 82% for both systems across the sampling periods.
Increased sampling on the Keg River has allowed for differences in water quality and their causes to be
explored in more detail in 2015 and 2016. While the poorest water quality was generally observed in the
Spring in the Notikewin River system, this pattern reversed in the Fall with the poorest quality found in
the Keg River system at that time. While water quality is generally most impaired due to spring runoff,
overall background quality is lower in the Keg River. This may be reflective of differences in both
underlying substrates as well as land uses, as the rates and nature of land disturbance differ between
the two basins. The inclusion of summer sampling has allowed increased resolution of seasonal
fluctuations that would otherwise have been missed by sampling only the other two events.
Trends in water quality appear to be consistent and well-explained by seasonal variation and inter-
annual climatological differences. With the additional sampling location included on the Keg River,
similar patterns have been identified, though confidence in these patterns is reduced due to the short
monitoring period. Due to the absence or low rates of exceedances for pesticides and bacteria over the
course of the monitoring program, these parameter groups could be considered for removal from the
sampling program in future years. This removal would allow either for cost reductions for the program,
or for an increase in the spatial or temporal scope and resolution of sampling for the remaining
parameters. The information on the system gained by the inclusion of summer sampling supports
maintaining, if not expanding, the number of sampling events per year. Sampling further upstream on
both rivers would provide more reliable information on baseline conditions, but accessibility could
present logistical difficulties.
NOTIKEWIN AND KEG RIVER WATER QUALITY 2016 PAGE 3
©2017 Aquality Environmental Consulting Ltd.
Contents
Table of Contents
Executive Summary ............................................................................................................... 2
Contents ............................................................................................................................... 3
Table of Contents ...........................................................................................................................3
List of Figures .................................................................................................................................4
List of Tables ..................................................................................................................................4
1 Introduction ............................................................................................................... 5
2 Methods .................................................................................................................... 5
2.1 Sampling Locations ..............................................................................................................6
2.2 Water Quality Parameters ...................................................................................................8
2.3 River Water Quality Index Calculations ................................................................................8
2.4 Background Climate and Flow Information ..........................................................................9
2.4.1 Climate Information .............................................................................................................. 9
2.4.2 Notikewin and Keg Rivers River Flow Information ............................................................... 9
3 Results ..................................................................................................................... 12
3.1 Routine ............................................................................................................................. 12
3.2 Nutrients .......................................................................................................................... 15
3.3 Metals .............................................................................................................................. 19
3.4 Bacteria ............................................................................................................................ 21
3.5 Pesticides .......................................................................................................................... 23
3.6 River Water Quality Index ................................................................................................. 24
4 Discussion ................................................................................................................ 26
4.1 Routine ............................................................................................................................. 26
4.2 Nutrients .......................................................................................................................... 26
4.3 Metals .............................................................................................................................. 27
4.4 Bacteria ............................................................................................................................ 28
4.5 Pesticides .......................................................................................................................... 29
4.6 Overall Water Quality ........................................................................................................ 29
5 Conclusions and Recommendations .......................................................................... 30
6 References ............................................................................................................... 32
7 Appendices .............................................................................................................. 35
7.1 Detailed Water Quality Parameter Lists ............................................................................. 35
7.1.1 Routine Water Quality Parameters ..................................................................................... 35
7.1.2 Nutrient Water Quality Parameters .................................................................................... 35
7.1.3 Bacteria Water Quality Parameters .................................................................................... 35
7.1.4 Pesticides Water Quality Parameters ................................................................................. 36
7.1.5 Metals Water Quality Parameters ...................................................................................... 37
7.2 River Water Quality Index Calculations .............................................................................. 38
7.2.1 Overview ............................................................................................................................. 38
7.2.2 Calculation Details ............................................................................................................... 38
7.2.3 Objectives Used in the Water Quality Index ....................................................................... 39
NOTIKEWIN AND KEG RIVER WATER QUALITY 2016 PAGE 4
©2017 Aquality Environmental Consulting Ltd.
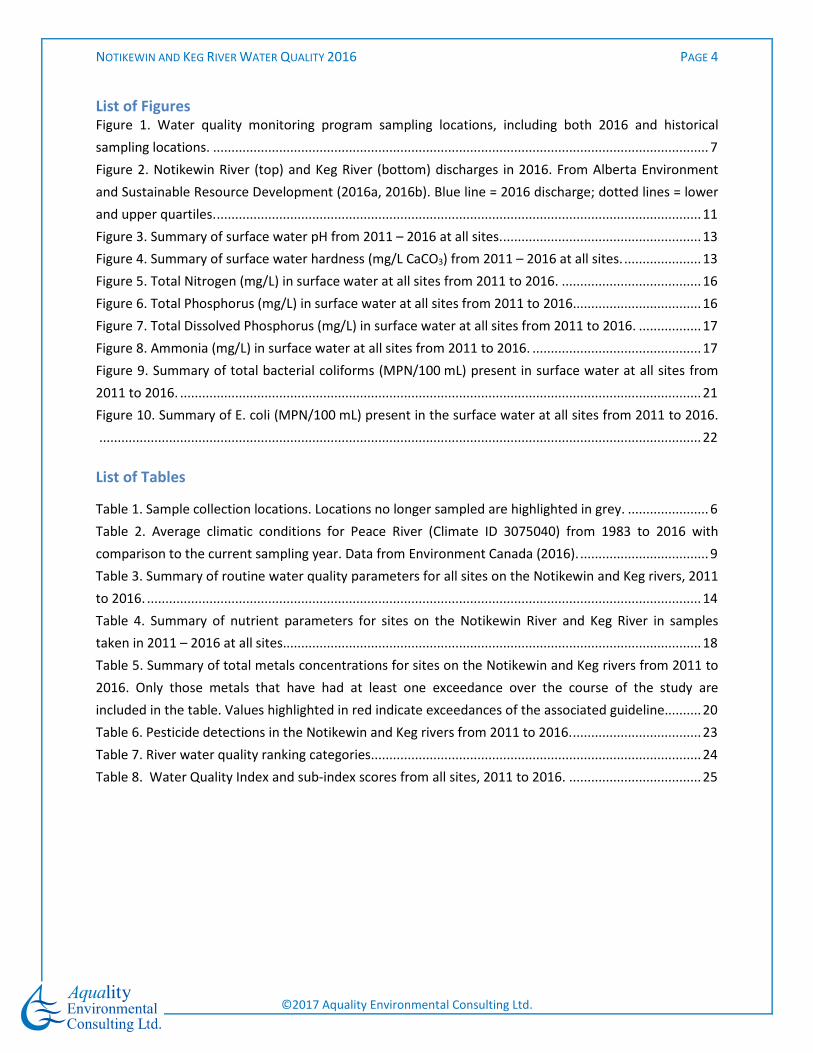
List of Figures Figure 1. Water quality monitoring program sampling locations, including both 2016 and historical
sampling locations. ....................................................................................................................................... 7
Figure 2. Notikewin River (top) and Keg River (bottom) discharges in 2016. From Alberta Environment
and Sustainable Resource Development (2016a, 2016b). Blue line = 2016 discharge; dotted lines = lower
and upper quartiles. .................................................................................................................................... 11
Figure 3. Summary of surface water pH from 2011 – 2016 at all sites. ...................................................... 13
Figure 4. Summary of surface water hardness (mg/L CaCO3) from 2011 – 2016 at all sites. ..................... 13
Figure 5. Total Nitrogen (mg/L) in surface water at all sites from 2011 to 2016. ...................................... 16
Figure 6. Total Phosphorus (mg/L) in surface water at all sites from 2011 to 2016................................... 16
Figure 7. Total Dissolved Phosphorus (mg/L) in surface water at all sites from 2011 to 2016. ................. 17
Figure 8. Ammonia (mg/L) in surface water at all sites from 2011 to 2016. .............................................. 17
Figure 9. Summary of total bacterial coliforms (MPN/100 mL) present in surface water at all sites from
2011 to 2016. .............................................................................................................................................. 21
Figure 10. Summary of E. coli (MPN/100 mL) present in the surface water at all sites from 2011 to 2016.
.................................................................................................................................................................... 22
List of Tables
Table 1. Sample collection locations. Locations no longer sampled are highlighted in grey. ...................... 6
Table 2. Average climatic conditions for Peace River (Climate ID 3075040) from 1983 to 2016 with
comparison to the current sampling year. Data from Environment Canada (2016). ................................... 9
Table 3. Summary of routine water quality parameters for all sites on the Notikewin and Keg rivers, 2011
to 2016. ....................................................................................................................................................... 14
Table 4. Summary of nutrient parameters for sites on the Notikewin River and Keg River in samples
taken in 2011 – 2016 at all sites.................................................................................................................. 18
Table 5. Summary of total metals concentrations for sites on the Notikewin and Keg rivers from 2011 to
2016. Only those metals that have had at least one exceedance over the course of the study are
included in the table. Values highlighted in red indicate exceedances of the associated guideline.......... 20
Table 6. Pesticide detections in the Notikewin and Keg rivers from 2011 to 2016. ................................... 23
Table 7. River water quality ranking categories.......................................................................................... 24
Table 8. Water Quality Index and sub-index scores from all sites, 2011 to 2016. .................................... 25
NOTIKEWIN AND KEG RIVER WATER QUALITY 2016 PAGE 5
©2017 Aquality Environmental Consulting Ltd.
1 Introduction
In October 2011, the County of Northern Lights (“the County”) and the North Peace Applied Research
Association (“NPARA”) retained Aquality Environmental Consulting Ltd. (“Aquality”) to design and carry
out a pilot water quality study on the Notikewin River. The purpose of the study was to gather baseline
information in preparation of future planning on the Notikewin River. The results of the study provided
a basis for more comprehensive monitoring by identifying candidate sites for water quality monitoring,
gathering data on a complete suite of parameters, and determining parameters of interest.
In 2012, monitoring of four sites continued during the Spring, Early Summer, Late Summer, and Fall, to
determine if the results from 2011 were representative and to determine the seasonal patterns of
various parameters. Sampling continued at the same sites as in 2013, with the addition of a single site
on the Keg River to provide a comparison between the two rivers.
A reduced subset of sites and seasons was selected in 2014, to reduce the overall cost of the monitoring
program. Based on seasonal and spatial trends observed from 2011 to 2014, a subset of sites on the
Notikewin River was selected for monitoring (Site 1 at the Green – White Area boundary and Site 4 at
the confluence with the Peace River), and the single site selected in 2013 on the Keg River. Based on
seasonal patterns observed in previous years, sampling was reduced to twice per year in the Spring and
Fall, but still included the full suite of parameters sampled in previous years. In 2015, an additional
sampling location was added on the Keg River, bringing the total number of sampling locations to four
with two on each river. In 2016, sampling continued with the two sites on the Notikewin and two on the
Keg, with samples collected during the Spring, Summer, and Fall. Summer sampling was conducted
following regional summer storm events.
2 Methods
Sampling of the surface water quality monitoring sites on the Notikewin and Keg rivers was carried out
three times in 2016: on April 12-27 during the Spring, August 3 during the Summer, and September 21
during the Fall. Samples were collected by County/NPARA staff following methodologies provided by
Aquality, adhering to Alberta Environment’s 2006 “Aquatic Ecosystems Field Sampling Protocols” and
laboratory-recommended sample-handling practices. Samples were preserved as dictated by the
sampling protocols, immediately stored on ice, and transported to the Exova laboratory in Edmonton.
Sample condition, including temperature and sample bottle integrity, were verified by Exova staff upon
receipt. Samples for the Notikewin and Keg Rivers were collected on different dates due to differences
in timing of spring break-up. Microbiological parameters in 2016 were not analyzed in the fall, due to
courier delays that resulted in the water samples exceeding their hold times.
NOTIKEWIN AND KEG RIVER WATER QUALITY 2016 PAGE 6
©2017 Aquality Environmental Consulting Ltd.
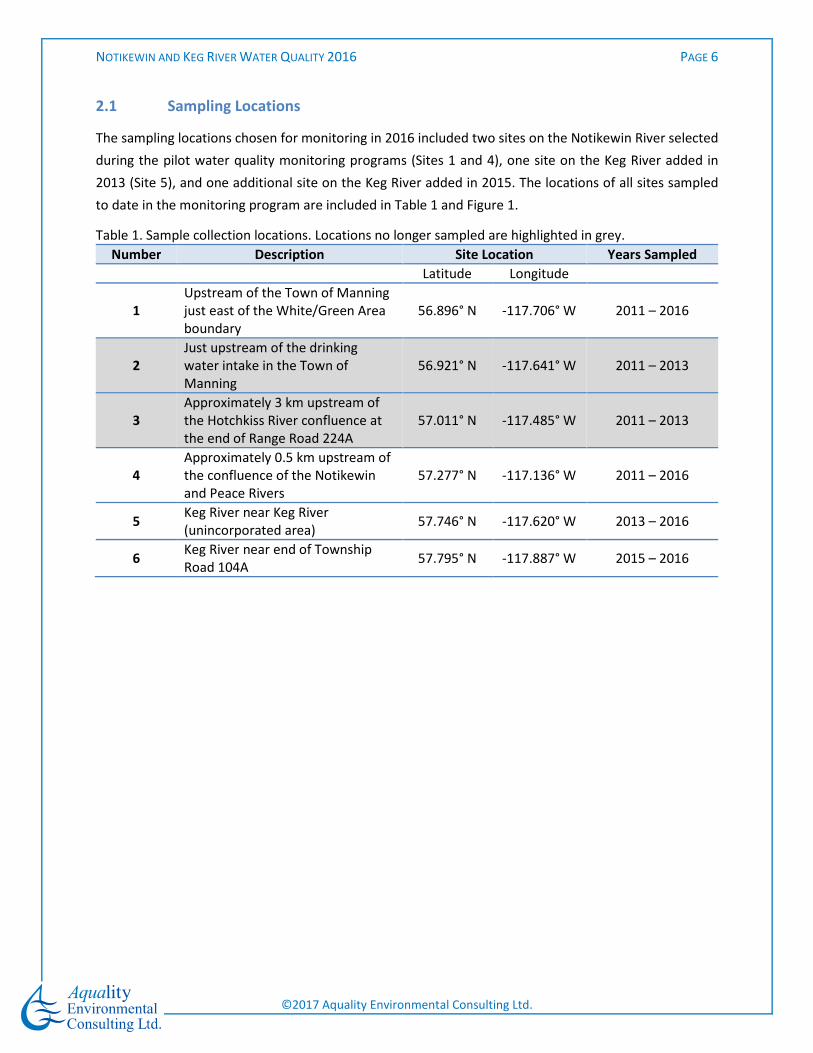
2.1 Sampling Locations
The sampling locations chosen for monitoring in 2016 included two sites on the Notikewin River selected
during the pilot water quality monitoring programs (Sites 1 and 4), one site on the Keg River added in
2013 (Site 5), and one additional site on the Keg River added in 2015. The locations of all sites sampled
to date in the monitoring program are included in Table 1 and Figure 1.
Table 1. Sample collection locations. Locations no longer sampled are highlighted in grey.
Number Description Site Location Years Sampled
Latitude Longitude
1
Upstream of the Town of Manning
just east of the White/Green Area
boundary
56.896° N -117.706° W 2011 – 2016
2
Just upstream of the drinking
water intake in the Town of
Manning
56.921° N -117.641° W 2011 – 2013
3
Approximately 3 km upstream of
the Hotchkiss River confluence at
the end of Range Road 224A
57.011° N -117.485° W 2011 – 2013
4
Approximately 0.5 km upstream of
the confluence of the Notikewin
and Peace Rivers
57.277° N -117.136° W 2011 – 2016
5 Keg River near Keg River
(unincorporated area) 57.746° N -117.620° W 2013 – 2016
6 Keg River near end of Township
Road 104A 57.795° N -117.887° W 2015 – 2016
NOTIKEWIN AND KEG RIVER WATER QUALITY 2016 PAGE 7
©2017 Aquality Environmental Consulting Ltd.
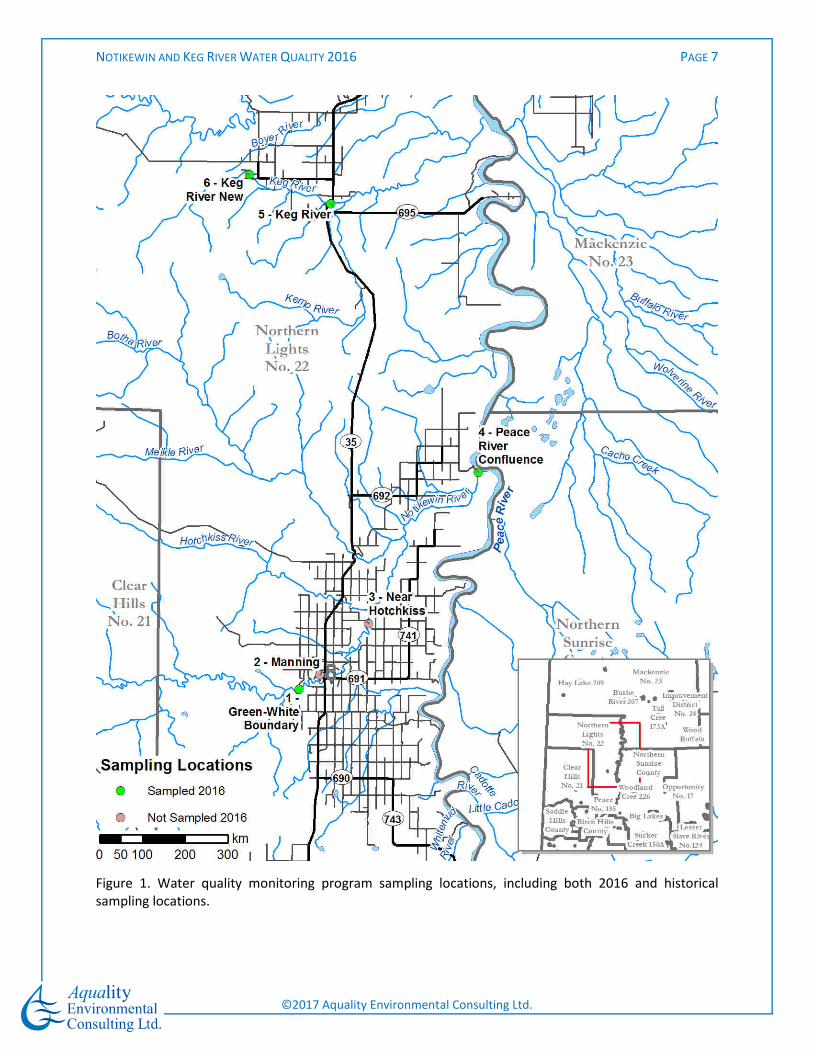
Figure 1. Water quality monitoring program sampling locations, including both 2016 and historical
sampling locations.
NOTIKEWIN AND KEG RIVER WATER QUALITY 2016 PAGE 8
©2017 Aquality Environmental Consulting Ltd.
2.2 Water Quality Parameters
Two (2) sites on the Notikewin River and two (2) sites on the Keg River were sampled for surface water
quality that included:
• Routine Water Chemistry
• Nutrients
• Bacteria
• Pesticides
• Total and Dissolved Metals
For a detailed list of parameters included in each category, please see Section 7.1: Detailed Water
Quality Parameter Lists. All parameter groups continue to be sampled at every event in 2016.
The water quality parameters included in the monitoring program were used to provide the County and
NPARA with an assessment of current water quality conditions on the Notikewin River and Keg River.
Select parameters have been compared to environmental quality guidelines to identify water quality
risks. Guidelines used for comparison in this study include the Canadian Council of Ministers of the
Environment (CCME) Canadian Environmental Quality Guidelines for the Protection of Freshwater
Aquatic Life (CEQG-FAL) or Protection of Agricultural Water Uses (CEQG-AWU) (CCME 2013), the
Environmental Quality Guidelines for Alberta Surface Waters (EQGASW) (Alberta Environment and
Sustainable Resource Development, 2014). The EQGASW includes site-specific objectives, which in some
instances have not been determined for this basin (e.g., nitrogen and phosphorus); the Alberta Surface
Water Quality Guidelines for the Protection of Freshwater Aquatic Life (EQGASW-FAL) (Alberta
Environment, 1999) were included to provide a guideline for these parameters. Additionally, water
quality was assessed using a modified version of Alberta Environment and Sustainable Resource
Development’s River Water Quality Index (see Section 2.3: River Water Quality Index Calculations), to
facilitate easy visualization of patterns in water quality over time and between sites.
2.3 River Water Quality Index Calculations
We continued to apply a modification of Alberta Environment and Sustainable Resources Development
(ESRD) River Water Quality Index to the results of the study in 2016. This index, first applied to the
results of this program in 2013, is used to quantify overall health of major rivers in Alberta based on a
suite of core indicators. These indicators reflect watershed health and allow for consistent reporting
which enables stakeholders and authorities to effectively compare and incorporate the overall findings
of watershed assessments and compare with other work (ESRD 2012). The indicators also simplify the
large suite of measured parameters down to four simple sub-indices of water quality and an overall
index score, creating easily-interpretable summaries of an otherwise unwieldy number of water quality
parameters. Higher scores for the overall index and sub-indices indicates higher water quality and fewer
potential impairments to aquatic health. For 2016, we have adapted ESRD’s index to reflect the data
NOTIKEWIN AND KEG RIVER WATER QUALITY 2016 PAGE 9
©2017 Aquality Environmental Consulting Ltd.
that is collected by the County of Northern Lights, with updated guidelines to reflect changes in
guidelines that have occurred at the Provincial and Federal levels. An overview of the calculation of the
Index is provided in Section 7.2: River Water Quality Index Calculations.
2.4 Background Climate and Flow Information
2.4.1 Climate Information
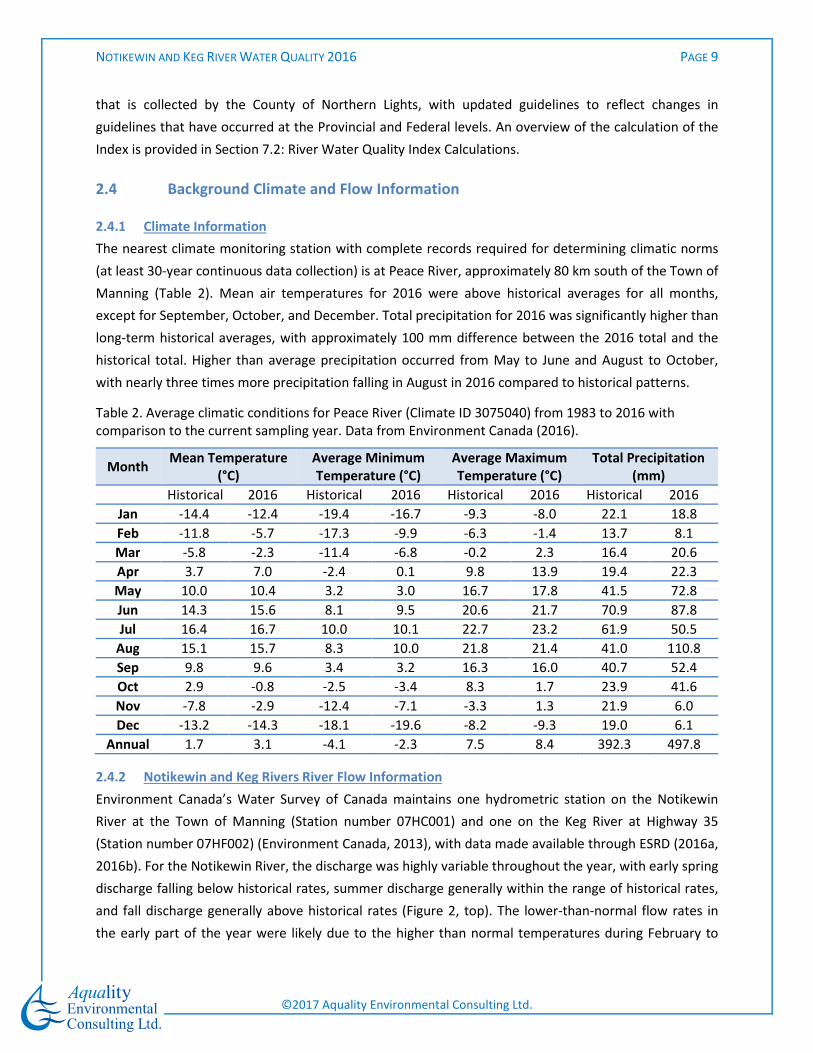
The nearest climate monitoring station with complete records required for determining climatic norms
(at least 30-year continuous data collection) is at Peace River, approximately 80 km south of the Town of
Manning (Table 2). Mean air temperatures for 2016 were above historical averages for all months,
except for September, October, and December. Total precipitation for 2016 was significantly higher than
long-term historical averages, with approximately 100 mm difference between the 2016 total and the
historical total. Higher than average precipitation occurred from May to June and August to October,
with nearly three times more precipitation falling in August in 2016 compared to historical patterns.
Table 2. Average climatic conditions for Peace River (Climate ID 3075040) from 1983 to 2016 with
comparison to the current sampling year. Data from Environment Canada (2016).
Month Mean Temperature
(°C)
Average Minimum
Temperature (°C)
Average Maximum
Temperature (°C)
Total Precipitation
(mm)
Historical 2016 Historical 2016 Historical 2016 Historical 2016
Jan -14.4 -12.4 -19.4 -16.7 -9.3 -8.0 22.1 18.8
Feb -11.8 -5.7 -17.3 -9.9 -6.3 -1.4 13.7 8.1
Mar -5.8 -2.3 -11.4 -6.8 -0.2 2.3 16.4 20.6
Apr 3.7 7.0 -2.4 0.1 9.8 13.9 19.4 22.3
May 10.0 10.4 3.2 3.0 16.7 17.8 41.5 72.8
Jun 14.3 15.6 8.1 9.5 20.6 21.7 70.9 87.8
Jul 16.4 16.7 10.0 10.1 22.7 23.2 61.9 50.5
Aug 15.1 15.7 8.3 10.0 21.8 21.4 41.0 110.8
Sep 9.8 9.6 3.4 3.2 16.3 16.0 40.7 52.4
Oct 2.9 -0.8 -2.5 -3.4 8.3 1.7 23.9 41.6
Nov -7.8 -2.9 -12.4 -7.1 -3.3 1.3 21.9 6.0
Dec -13.2 -14.3 -18.1 -19.6 -8.2 -9.3 19.0 6.1
Annual 1.7 3.1 -4.1 -2.3 7.5 8.4 392.3 497.8
2.4.2 Notikewin and Keg Rivers River Flow Information
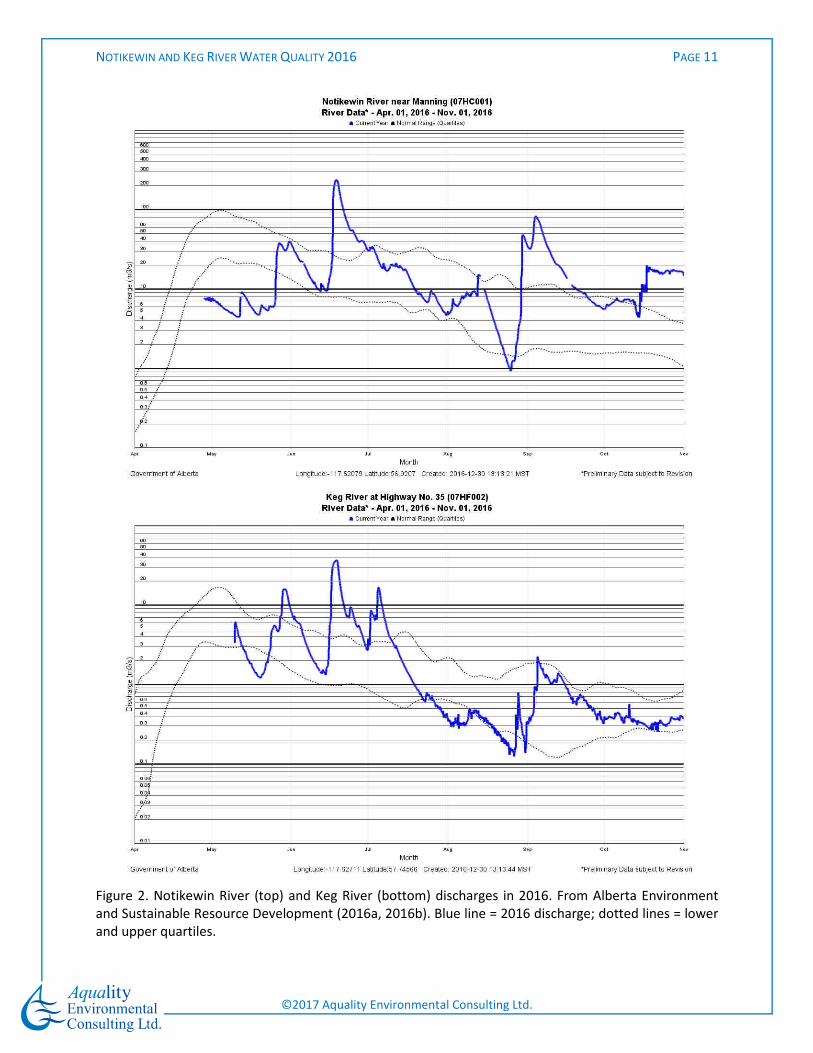
Environment Canada’s Water Survey of Canada maintains one hydrometric station on the Notikewin
River at the Town of Manning (Station number 07HC001) and one on the Keg River at Highway 35
(Station number 07HF002) (Environment Canada, 2013), with data made available through ESRD (2016a,
2016b). For the Notikewin River, the discharge was highly variable throughout the year, with early spring
discharge falling below historical rates, summer discharge generally within the range of historical rates,
and fall discharge generally above historical rates (Figure 2, top). The lower-than-normal flow rates in
the early part of the year were likely due to the higher than normal temperatures during February to
NOTIKEWIN AND KEG RIVER WATER QUALITY 2016 PAGE 10
©2017 Aquality Environmental Consulting Ltd.
April, allowing a greater proportion of the snowpack to melt prior to river break-up and the spring
freshet. Discharges on the Keg River followed a similar pattern, except that spring discharges were
closer to historical norms (Figure 2, bottom). For both rivers, the elevated precipitation that occurred
from May to June and August to October was apparent as peaks in discharge followed significant
precipitation events.
NOTIKEWIN AND KEG RIVER WATER QUALITY 2016 PAGE 11
©2017 Aquality Environmental Consulting Ltd.
Figure 2. Notikewin River (top) and Keg River (bottom) discharges in 2016. From Alberta Environment
and Sustainable Resource Development (2016a, 2016b). Blue line = 2016 discharge; dotted lines = lower
and upper quartiles.
NOTIKEWIN AND KEG RIVER WATER QUALITY 2016 PAGE 12
©2017 Aquality Environmental Consulting Ltd.
3 Results
3.1 Routine
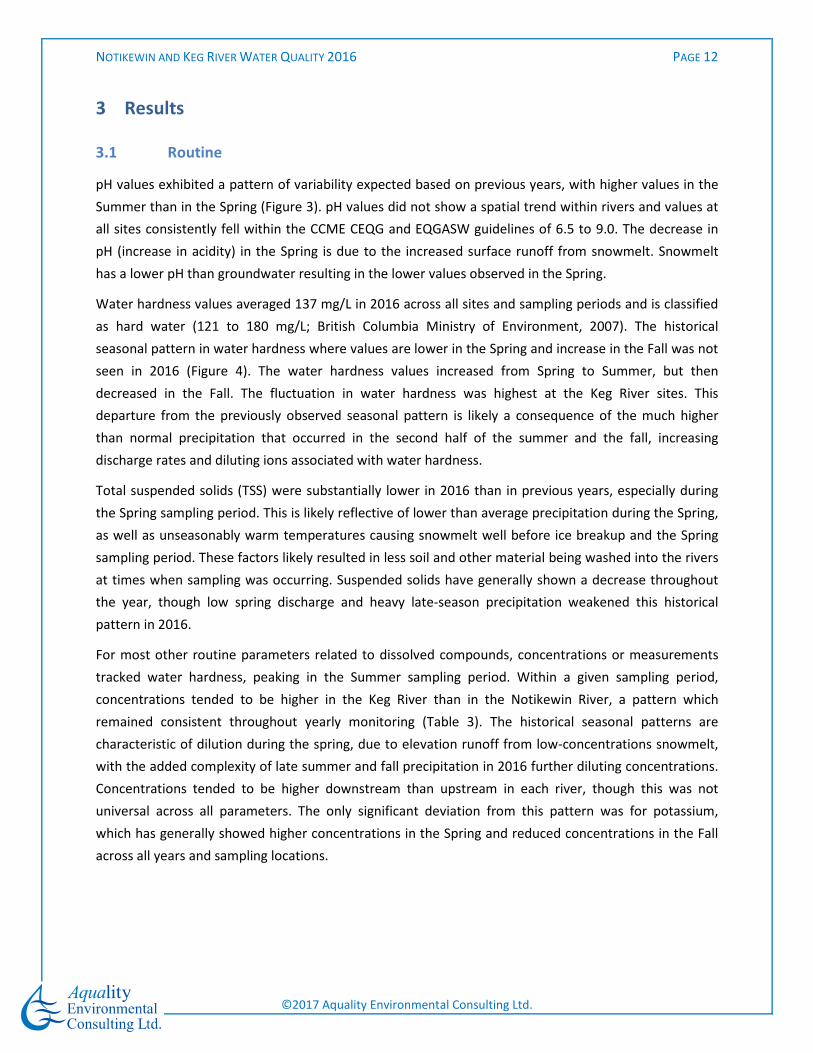
pH values exhibited a pattern of variability expected based on previous years, with higher values in the
Summer than in the Spring (Figure 3). pH values did not show a spatial trend within rivers and values at
all sites consistently fell within the CCME CEQG and EQGASW guidelines of 6.5 to 9.0. The decrease in
pH (increase in acidity) in the Spring is due to the increased surface runoff from snowmelt. Snowmelt
has a lower pH than groundwater resulting in the lower values observed in the Spring.
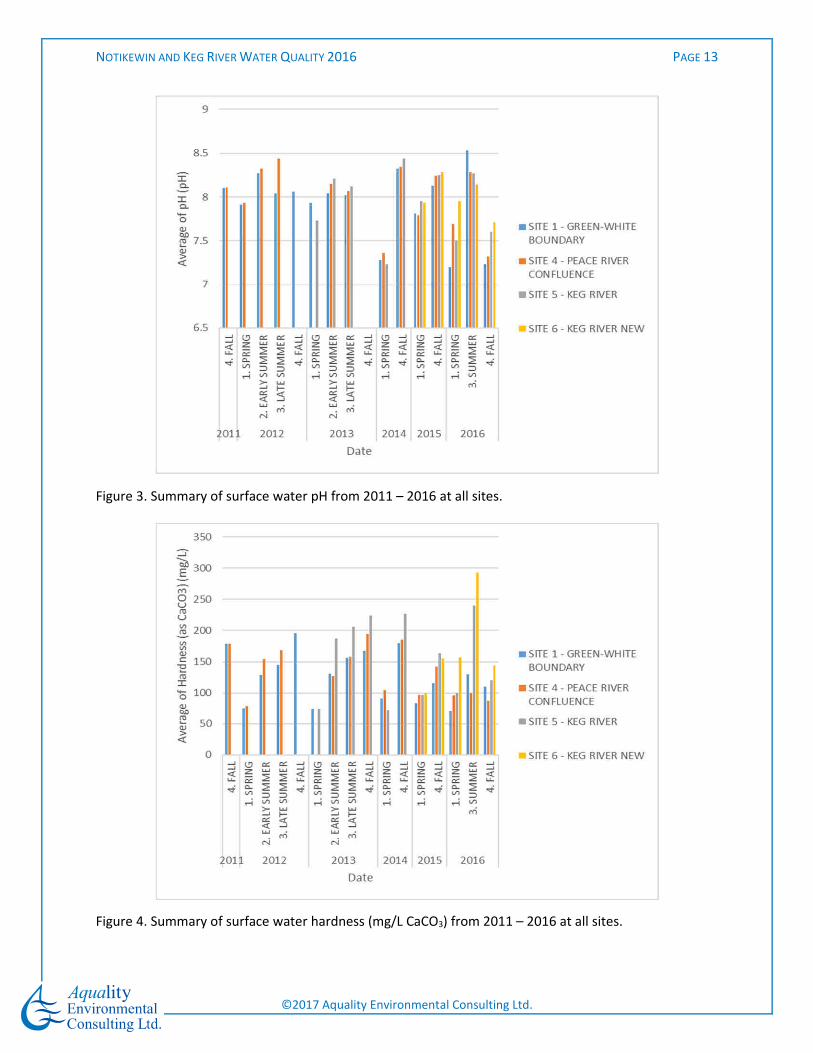
Water hardness values averaged 137 mg/L in 2016 across all sites and sampling periods and is classified
as hard water (121 to 180 mg/L; British Columbia Ministry of Environment, 2007). The historical
seasonal pattern in water hardness where values are lower in the Spring and increase in the Fall was not
seen in 2016 (Figure 4). The water hardness values increased from Spring to Summer, but then
decreased in the Fall. The fluctuation in water hardness was highest at the Keg River sites. This
departure from the previously observed seasonal pattern is likely a consequence of the much higher
than normal precipitation that occurred in the second half of the summer and the fall, increasing
discharge rates and diluting ions associated with water hardness.
Total suspended solids (TSS) were substantially lower in 2016 than in previous years, especially during
the Spring sampling period. This is likely reflective of lower than average precipitation during the Spring,
as well as unseasonably warm temperatures causing snowmelt well before ice breakup and the Spring
sampling period. These factors likely resulted in less soil and other material being washed into the rivers
at times when sampling was occurring. Suspended solids have generally shown a decrease throughout
the year, though low spring discharge and heavy late-season precipitation weakened this historical
pattern in 2016.
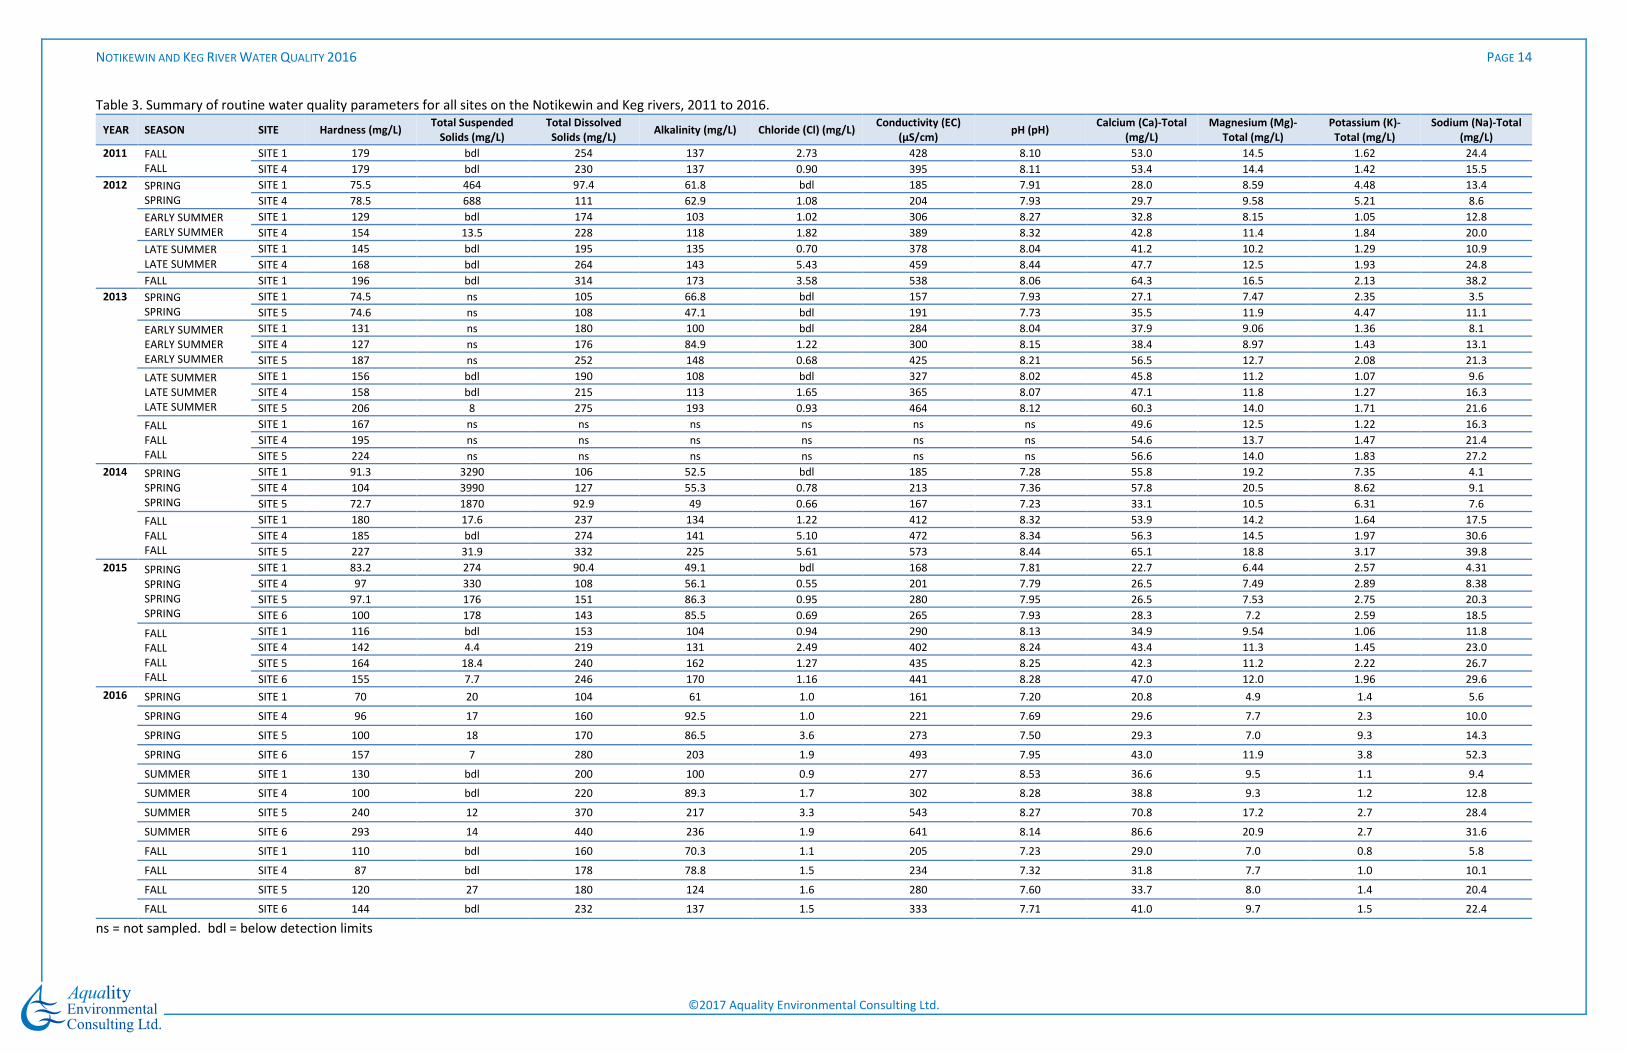
For most other routine parameters related to dissolved compounds, concentrations or measurements
tracked water hardness, peaking in the Summer sampling period. Within a given sampling period,
concentrations tended to be higher in the Keg River than in the Notikewin River, a pattern which
remained consistent throughout yearly monitoring (Table 3). The historical seasonal patterns are
characteristic of dilution during the spring, due to elevation runoff from low-concentrations snowmelt,
with the added complexity of late summer and fall precipitation in 2016 further diluting concentrations.
Concentrations tended to be higher downstream than upstream in each river, though this was not
universal across all parameters. The only significant deviation from this pattern was for potassium,
which has generally showed higher concentrations in the Spring and reduced concentrations in the Fall
across all years and sampling locations.
NOTIKEWIN AND KEG RIVER WATER QUALITY 2016 PAGE 13
©2017 Aquality Environmental Consulting Ltd.
Figure 3. Summary of surface water pH from 2011 – 2016 at all sites.
Figure 4. Summary of surface water hardness (mg/L CaCO3) from 2011 – 2016 at all sites.
NOTIKEWIN AND KEG RIVER WATER QUALITY 2016 PAGE 14
©2017 Aquality Environmental Consulting Ltd.
Table 3. Summary of routine water quality parameters for all sites on the Notikewin and Keg rivers, 2011 to 2016.
YEAR SEASON SITE Hardness (mg/L) Total Suspended
Solids (mg/L)
Total Dissolved
Solids (mg/L) Alkalinity (mg/L) Chloride (Cl) (mg/L)
Conductivity (EC)
(µS/cm) pH (pH)
Calcium (Ca)-Total
(mg/L)
Magnesium (Mg)-
Total (mg/L)
Potassium (K)-
Total (mg/L)
Sodium (Na)-Total
(mg/L)
2011 FALL
FALL
SITE 1 179 bdl 254 137 2.73 428 8.10 53.0 14.5 1.62 24.4
SITE 4 179 bdl 230 137 0.90 395 8.11 53.4 14.4 1.42 15.5
2012 SPRING
SPRING
SITE 1 75.5 464 97.4 61.8 bdl 185 7.91 28.0 8.59 4.48 13.4
SITE 4 78.5 688 111 62.9 1.08 204 7.93 29.7 9.58 5.21 8.6
EARLY SUMMER
EARLY SUMMER
SITE 1 129 bdl 174 103 1.02 306 8.27 32.8 8.15 1.05 12.8
SITE 4 154 13.5 228 118 1.82 389 8.32 42.8 11.4 1.84 20.0
LATE SUMMER
LATE SUMMER
SITE 1 145 bdl 195 135 0.70 378 8.04 41.2 10.2 1.29 10.9
SITE 4 168 bdl 264 143 5.43 459 8.44 47.7 12.5 1.93 24.8
FALL SITE 1 196 bdl 314 173 3.58 538 8.06 64.3 16.5 2.13 38.2
2013 SPRING
SPRING
SITE 1 74.5 ns 105 66.8 bdl 157 7.93 27.1 7.47 2.35 3.5
SITE 5 74.6 ns 108 47.1 bdl 191 7.73 35.5 11.9 4.47 11.1
EARLY SUMMER
EARLY SUMMER
EARLY SUMMER
SITE 1 131 ns 180 100 bdl 284 8.04 37.9 9.06 1.36 8.1
SITE 4 127 ns 176 84.9 1.22 300 8.15 38.4 8.97 1.43 13.1
SITE 5 187 ns 252 148 0.68 425 8.21 56.5 12.7 2.08 21.3
LATE SUMMER
LATE SUMMER
LATE SUMMER
SITE 1 156 bdl 190 108 bdl 327 8.02 45.8 11.2 1.07 9.6
SITE 4 158 bdl 215 113 1.65 365 8.07 47.1 11.8 1.27 16.3
SITE 5 206 8 275 193 0.93 464 8.12 60.3 14.0 1.71 21.6
FALL
FALL
FALL
SITE 1 167 ns ns ns ns ns ns 49.6 12.5 1.22 16.3
SITE 4 195 ns ns ns ns ns ns 54.6 13.7 1.47 21.4
SITE 5 224 ns ns ns ns ns ns 56.6 14.0 1.83 27.2
2014 SPRING
SPRING
SPRING
SITE 1 91.3 3290 106 52.5 bdl 185 7.28 55.8 19.2 7.35 4.1
SITE 4 104 3990 127 55.3 0.78 213 7.36 57.8 20.5 8.62 9.1
SITE 5 72.7 1870 92.9 49 0.66 167 7.23 33.1 10.5 6.31 7.6
FALL
FALL
FALL
SITE 1 180 17.6 237 134 1.22 412 8.32 53.9 14.2 1.64 17.5
SITE 4 185 bdl 274 141 5.10 472 8.34 56.3 14.5 1.97 30.6
SITE 5 227 31.9 332 225 5.61 573 8.44 65.1 18.8 3.17 39.8
2015 SPRING
SPRING
SPRING
SPRING
SITE 1 83.2 274 90.4 49.1 bdl 168 7.81 22.7 6.44 2.57 4.31
SITE 4 97 330 108 56.1 0.55 201 7.79 26.5 7.49 2.89 8.38
SITE 5 97.1 176 151 86.3 0.95 280 7.95 26.5 7.53 2.75 20.3
SITE 6 100 178 143 85.5 0.69 265 7.93 28.3 7.2 2.59 18.5
FALL
FALL
FALL
FALL
SITE 1 116 bdl 153 104 0.94 290 8.13 34.9 9.54 1.06 11.8
SITE 4 142 4.4 219 131 2.49 402 8.24 43.4 11.3 1.45 23.0
SITE 5 164 18.4 240 162 1.27 435 8.25 42.3 11.2 2.22 26.7
SITE 6 155 7.7 246 170 1.16 441 8.28 47.0 12.0 1.96 29.6
2016 SPRING SITE 1 70 20 104 61 1.0 161 7.20 20.8 4.9 1.4 5.6
SPRING SITE 4 96 17 160 92.5 1.0 221 7.69 29.6 7.7 2.3 10.0
SPRING SITE 5 100 18 170 86.5 3.6 273 7.50 29.3 7.0 9.3 14.3
SPRING SITE 6 157 7 280 203 1.9 493 7.95 43.0 11.9 3.8 52.3
SUMMER SITE 1 130 bdl 200 100 0.9 277 8.53 36.6 9.5 1.1 9.4
SUMMER SITE 4 100 bdl 220 89.3 1.7 302 8.28 38.8 9.3 1.2 12.8
SUMMER SITE 5 240 12 370 217 3.3 543 8.27 70.8 17.2 2.7 28.4
SUMMER SITE 6 293 14 440 236 1.9 641 8.14 86.6 20.9 2.7 31.6
FALL SITE 1 110 bdl 160 70.3 1.1 205 7.23 29.0 7.0 0.8 5.8
FALL SITE 4 87 bdl 178 78.8 1.5 234 7.32 31.8 7.7 1.0 10.1
FALL SITE 5 120 27 180 124 1.6 280 7.60 33.7 8.0 1.4 20.4
FALL SITE 6 144 bdl 232 137 1.5 333 7.71 41.0 9.7 1.5 22.4
ns = not sampled. bdl = below detection limits
NOTIKEWIN AND KEG RIVER WATER QUALITY 2016 PAGE 15
©2017 Aquality Environmental Consulting Ltd.
3.2 Nutrients
Beginning in 2014, the Province of Alberta had begun moving away from blanket guidelines for water
quality that apply across the province (especially nutrients), due to high natural variability in background
conditions (Alberta Environment and Sustainable Resource Development 2014). However, due to a lack
of site-specific objectives for the region, the original Alberta Surface Water Quality Guidelines (Alberta
Environment, 1999) were used for this study.
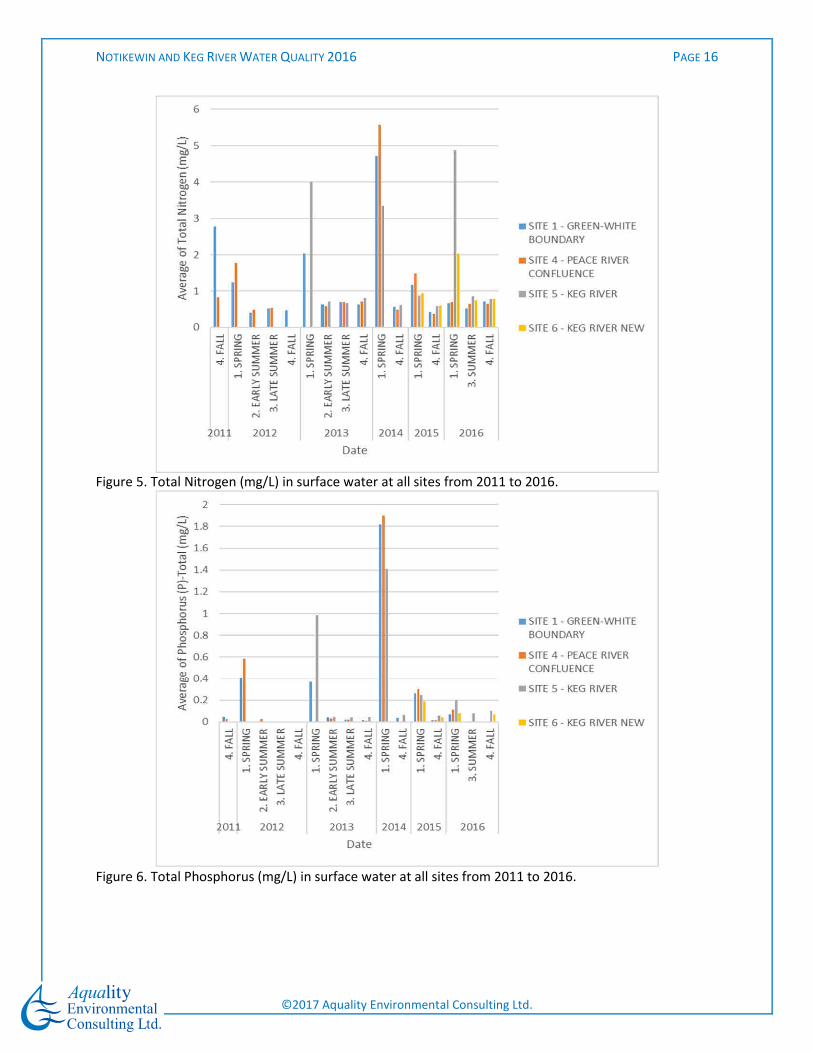
Total nitrogen (TN) concentrations were at their seasonal averages in 2016, with exception of the Keg
River sites in the Spring, which were above. Exceedances for TN were detected at both sites on the Keg
River in the Spring, but Notikewin River samples were below the guideline for TN of 1.0 mg/L (Figure 5).
Total phosphorus (TP) concentrations were above the guideline of 0.05 mg/L at all sites in the Spring,
but only sites on the Keg River (Sites 5 and 6) exceeded in the Fall (Figure 6). TP concentrations in the
Spring were generally below seasonal averages, while concentrations in the Fall were generally at or
above seasonal averages for the Keg River, but below average for the Notikewin River.
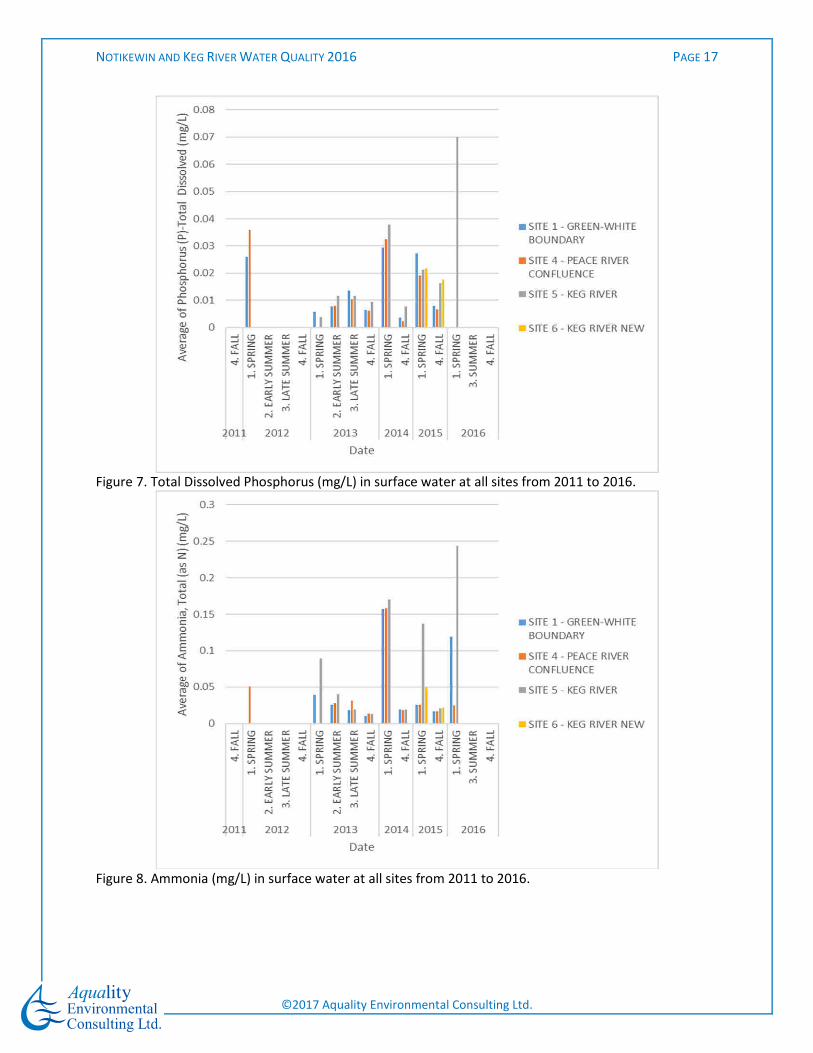
Dissolved fractions of the major nutrients (ammonia, nitrate, and nitrate for nitrogen, and dissolved
phosphorus for phosphorus) generally contributed little to TN and TP concentrations throughout the
year (Figure 7, Figure 8, and Table 4), indicating that the majority of nutrients entering the system are in
particulate form, either strongly bound to soil particles or in the form of particulate organic matter. This
indicates that only a limited amount of the nutrient inputs into the system are in an immediately bio-
available form to be taken up by aquatic plants or algae, though they can contribute to enrichment of
the system on longer time scales. The exception to this was for Site 5 in the Spring, where a substantial
proportion of the already elevated TN and TP concentrations comprised dissolved forms. This pattern
was not observed at Site 6 on the Keg River in the Spring, suggesting a concentrated source of nutrients
in both dissolved and particulate forms entered the river in the Spring between the two sampling
locations.
In 2016, concentrations of most nutrient parameters were slightly higher in the Keg River than in the
Notikewin River, consistently throughout the year. This suggests differences in parent materials and/or
land use practices between the two basins, which may require different management strategies for
mitigation.
The results for all the nutrient parameters are summarized in Table 4.
NOTIKEWIN AND KEG RIVER WATER QUALITY 2016 PAGE 16
©2017 Aquality Environmental Consulting Ltd.
Figure 5. Total Nitrogen (mg/L) in surface water at all sites from 2011 to 2016.
Figure 6. Total Phosphorus (mg/L) in surface water at all sites from 2011 to 2016.
NOTIKEWIN AND KEG RIVER WATER QUALITY 2016 PAGE 17
©2017 Aquality Environmental Consulting Ltd.
Figure 7. Total Dissolved Phosphorus (mg/L) in surface water at all sites from 2011 to 2016.
Figure 8. Ammonia (mg/L) in surface water at all sites from 2011 to 2016.
NOTIKEWIN AND KEG RIVER WATER QUALITY 2016 PAGE 18
©2017 Aquality Environmental Consulting Ltd.
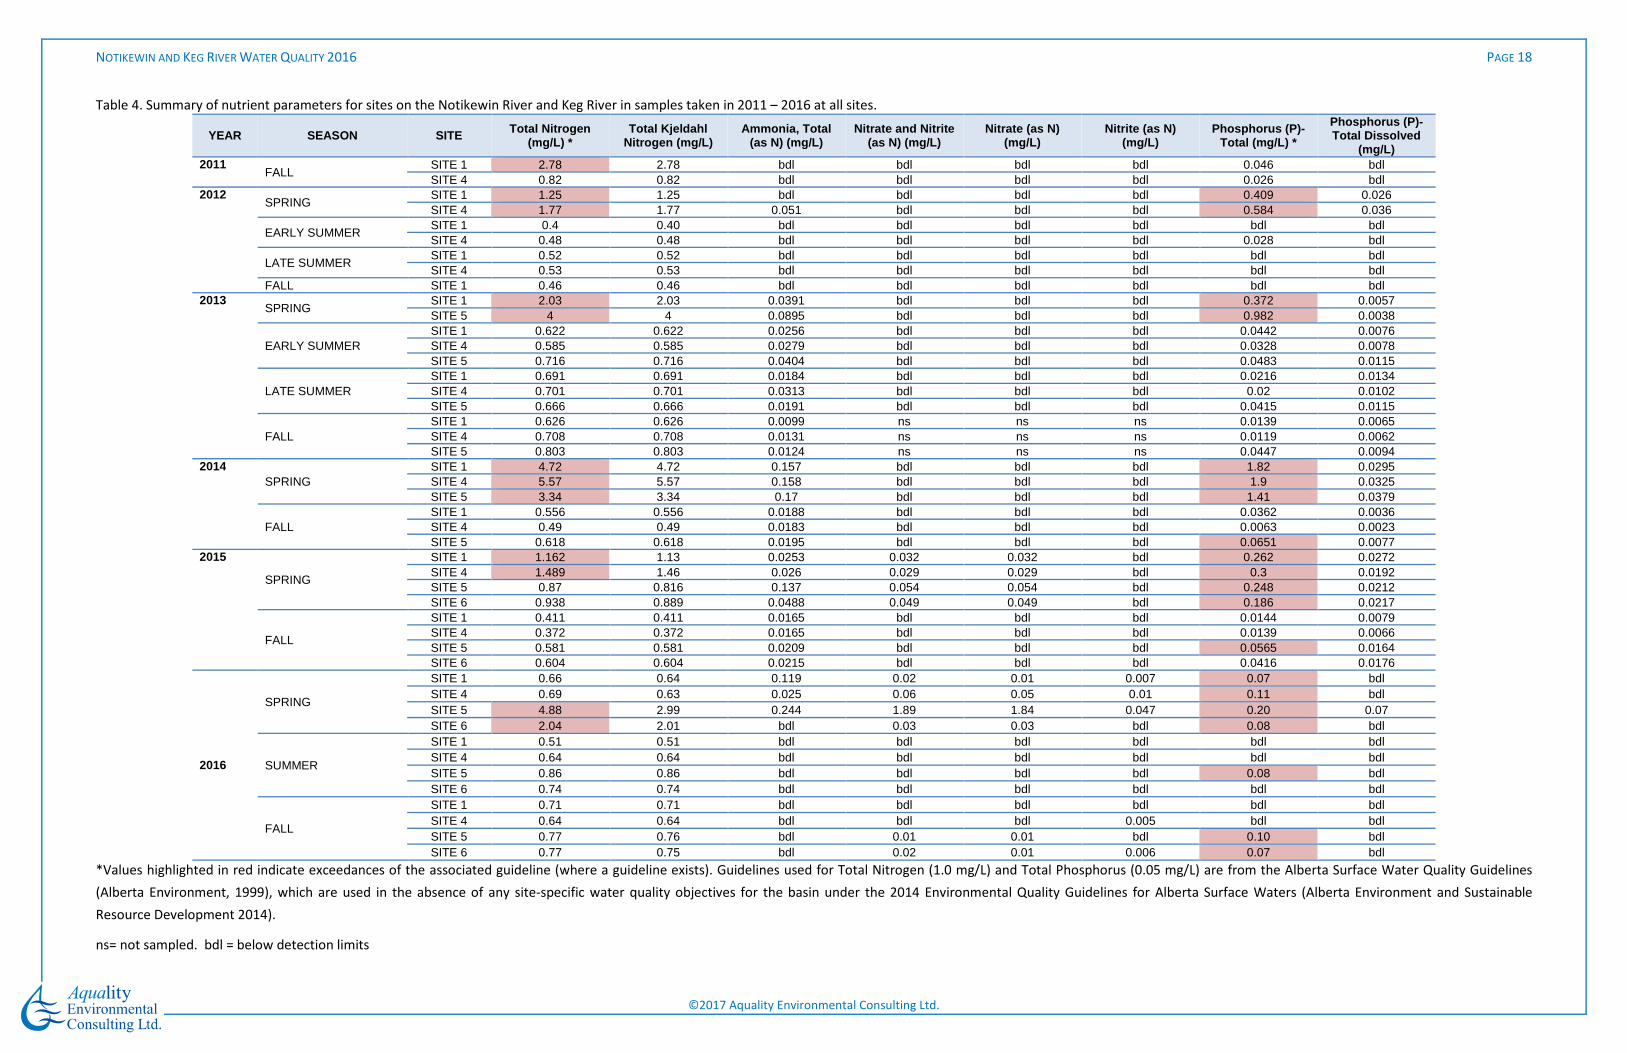
Table 4. Summary of nutrient parameters for sites on the Notikewin River and Keg River in samples taken in 2011 – 2016 at all sites.
YEAR SEASON SITE Total Nitrogen (mg/L) *
Total Kjeldahl Nitrogen (mg/L)
Ammonia, Total (as N) (mg/L)
Nitrate and Nitrite (as N) (mg/L)
Nitrate (as N) (mg/L)
Nitrite (as N) (mg/L)
Phosphorus (P)-Total (mg/L) *
Phosphorus (P)-Total Dissolved
(mg/L) 2011
FALL SITE 1 2.78 2.78 bdl bdl bdl bdl 0.046 bdl SITE 4 0.82 0.82 bdl bdl bdl bdl 0.026 bdl
2012 SPRING
SITE 1 1.25 1.25 bdl bdl bdl bdl 0.409 0.026 SITE 4 1.77 1.77 0.051 bdl bdl bdl 0.584 0.036
EARLY SUMMER SITE 1 0.4 0.40 bdl bdl bdl bdl bdl bdl SITE 4 0.48 0.48 bdl bdl bdl bdl 0.028 bdl
LATE SUMMER SITE 1 0.52 0.52 bdl bdl bdl bdl bdl bdl SITE 4 0.53 0.53 bdl bdl bdl bdl bdl bdl
FALL SITE 1 0.46 0.46 bdl bdl bdl bdl bdl bdl 2013
SPRING SITE 1 2.03 2.03 0.0391 bdl bdl bdl 0.372 0.0057 SITE 5 4 4 0.0895 bdl bdl bdl 0.982 0.0038
EARLY SUMMER SITE 1 0.622 0.622 0.0256 bdl bdl bdl 0.0442 0.0076 SITE 4 0.585 0.585 0.0279 bdl bdl bdl 0.0328 0.0078 SITE 5 0.716 0.716 0.0404 bdl bdl bdl 0.0483 0.0115
LATE SUMMER SITE 1 0.691 0.691 0.0184 bdl bdl bdl 0.0216 0.0134 SITE 4 0.701 0.701 0.0313 bdl bdl bdl 0.02 0.0102 SITE 5 0.666 0.666 0.0191 bdl bdl bdl 0.0415 0.0115
FALL SITE 1 0.626 0.626 0.0099 ns ns ns 0.0139 0.0065 SITE 4 0.708 0.708 0.0131 ns ns ns 0.0119 0.0062 SITE 5 0.803 0.803 0.0124 ns ns ns 0.0447 0.0094
2014 SPRING
SITE 1 4.72 4.72 0.157 bdl bdl bdl 1.82 0.0295 SITE 4 5.57 5.57 0.158 bdl bdl bdl 1.9 0.0325 SITE 5 3.34 3.34 0.17 bdl bdl bdl 1.41 0.0379
FALL SITE 1 0.556 0.556 0.0188 bdl bdl bdl 0.0362 0.0036 SITE 4 0.49 0.49 0.0183 bdl bdl bdl 0.0063 0.0023 SITE 5 0.618 0.618 0.0195 bdl bdl bdl 0.0651 0.0077
2015
SPRING
SITE 1 1.162 1.13 0.0253 0.032 0.032 bdl 0.262 0.0272 SITE 4 1.489 1.46 0.026 0.029 0.029 bdl 0.3 0.0192 SITE 5 0.87 0.816 0.137 0.054 0.054 bdl 0.248 0.0212 SITE 6 0.938 0.889 0.0488 0.049 0.049 bdl 0.186 0.0217
FALL
SITE 1 0.411 0.411 0.0165 bdl bdl bdl 0.0144 0.0079 SITE 4 0.372 0.372 0.0165 bdl bdl bdl 0.0139 0.0066 SITE 5 0.581 0.581 0.0209 bdl bdl bdl 0.0565 0.0164 SITE 6 0.604 0.604 0.0215 bdl bdl bdl 0.0416 0.0176
2016
SPRING
SITE 1 0.66 0.64 0.119 0.02 0.01 0.007 0.07 bdl SITE 4 0.69 0.63 0.025 0.06 0.05 0.01 0.11 bdl SITE 5 4.88 2.99 0.244 1.89 1.84 0.047 0.20 0.07 SITE 6 2.04 2.01 bdl 0.03 0.03 bdl 0.08 bdl
SUMMER
SITE 1 0.51 0.51 bdl bdl bdl bdl bdl bdl SITE 4 0.64 0.64 bdl bdl bdl bdl bdl bdl SITE 5 0.86 0.86 bdl bdl bdl bdl 0.08 bdl SITE 6 0.74 0.74 bdl bdl bdl bdl bdl bdl
FALL
SITE 1 0.71 0.71 bdl bdl bdl bdl bdl bdl SITE 4 0.64 0.64 bdl bdl bdl 0.005 bdl bdl SITE 5 0.77 0.76 bdl 0.01 0.01 bdl 0.10 bdl SITE 6 0.77 0.75 bdl 0.02 0.01 0.006 0.07 bdl
*Values highlighted in red indicate exceedances of the associated guideline (where a guideline exists). Guidelines used for Total Nitrogen (1.0 mg/L) and Total Phosphorus (0.05 mg/L) are from the Alberta Surface Water Quality Guidelines
(Alberta Environment, 1999), which are used in the absence of any site-specific water quality objectives for the basin under the 2014 Environmental Quality Guidelines for Alberta Surface Waters (Alberta Environment and Sustainable
Resource Development 2014).
ns= not sampled. bdl = below detection limits
NOTIKEWIN AND KEG RIVER WATER QUALITY 2016 PAGE 19
©2017 Aquality Environmental Consulting Ltd.
3.3 Metals
Water samples were analyzed for 29 different metals, for both total and dissolved forms in 2016 (see
Section 7.1.5: Metals Water Quality Parameters). Calcium, Magnesium, Sodium, and Potassium were
reported in Section 3.1 due to their close relationship with, and strong contributions to hardness,
alkalinity, and salinity.
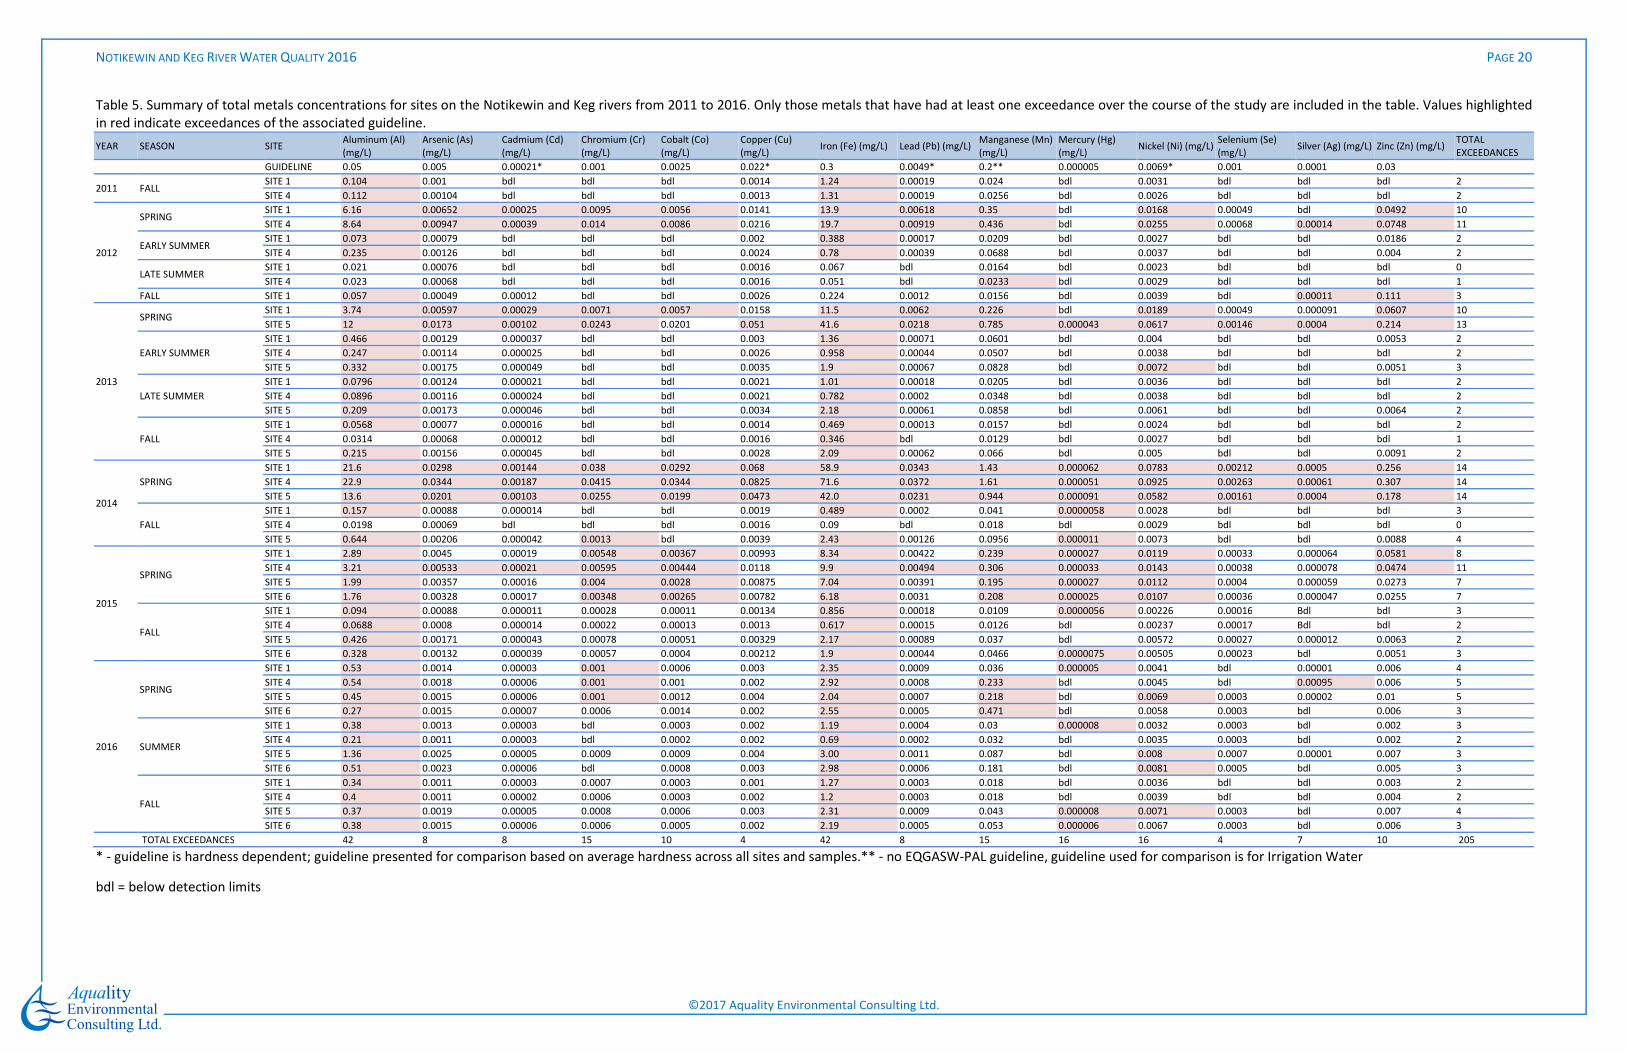
Of the sampled metals, 14 have exceeded their respective guidelines for total metals on at least one
occasion (Table 5). Seven metals exceeded guidelines on at least one occasion in 2016, including
Aluminum, Chromium, Iron, Manganese, Mercury, Nickel, and Silver. Aluminum and Iron exceeded
guidelines with the greatest frequency, with exceedances for all samples collected in 2016 and for all
historical samples except for four (91% of samples in total) throughout the entire monitoring program.
Chromium, Manganese, Mercury, and Nickel showed exceedances in at least a quarter of the samples
collected across all locations and sampling periods retained in the program. Guideline exceedances for
these four metals were most frequent in the Spring, with only six out of a total of 62 (<10% of the total)
exceedances across all of these metals occurring during the other sampling seasons. Despite the
exceedances observed, overall concentrations of metals in 2016 were lower than in previous years,
especially during the Spring sampling period. As with nutrients, this is likely a consequence of lower
precipitation and discharge in the spring, due to lower than average precipitation and earlier snowmelt
than in previous years.
Metal concentrations were largely driven by particulate forms, with dissolved components generally
contributing a minor fraction to the total concentration. The majority of exceedances across all sites and
sampling seasons have historically occurred in the Spring (66 % of exceedances). Taken together, these
two findings indicate that the majority of metal loadings into these systems are the result of sediment-
laden runoff entering the systems during Spring runoff conditions. In 2016, a slightly greater proportion
of exceedances occurred in the Keg River compared to the Notikewin River (54% versus 46% of total
exceedances), in contract to the pattern observed in 2015. Concentrations in the Keg River also tended
to be higher than those in the Notikewin River for most metals, with detected exceedances in the
Summer and Fall, but more variable in the Spring. This indicates that background concentrations may be
higher in the Keg River but pulses of metals during runoff are sometimes higher in the Notikewin River.
NOTIKEWIN AND KEG RIVER WATER QUALITY 2016 PAGE 20
©2017 Aquality Environmental Consulting Ltd.
Table 5. Summary of total metals concentrations for sites on the Notikewin and Keg rivers from 2011 to 2016. Only those metals that have had at least one exceedance over the course of the study are included in the table. Values highlighted
in red indicate exceedances of the associated guideline.
YEAR SEASON SITE Aluminum (Al)
(mg/L)
Arsenic (As)
(mg/L)
Cadmium (Cd)
(mg/L)
Chromium (Cr)
(mg/L)
Cobalt (Co)
(mg/L)
Copper (Cu)
(mg/L) Iron (Fe) (mg/L) Lead (Pb) (mg/L)
Manganese (Mn)
(mg/L)
Mercury (Hg)
(mg/L) Nickel (Ni) (mg/L)
Selenium (Se)
(mg/L) Silver (Ag) (mg/L) Zinc (Zn) (mg/L)
TOTAL
EXCEEDANCES
GUIDELINE 0.05 0.005 0.00021* 0.001 0.0025 0.022* 0.3 0.0049* 0.2** 0.000005 0.0069* 0.001 0.0001 0.03
2011 FALL SITE 1 0.104 0.001 bdl bdl bdl 0.0014 1.24 0.00019 0.024 bdl 0.0031 bdl bdl bdl 2
SITE 4 0.112 0.00104 bdl bdl bdl 0.0013 1.31 0.00019 0.0256 bdl 0.0026 bdl bdl bdl 2
2012
SPRING SITE 1 6.16 0.00652 0.00025 0.0095 0.0056 0.0141 13.9 0.00618 0.35 bdl 0.0168 0.00049 bdl 0.0492 10
SITE 4 8.64 0.00947 0.00039 0.014 0.0086 0.0216 19.7 0.00919 0.436 bdl 0.0255 0.00068 0.00014 0.0748 11
EARLY SUMMER SITE 1 0.073 0.00079 bdl bdl bdl 0.002 0.388 0.00017 0.0209 bdl 0.0027 bdl bdl 0.0186 2
SITE 4 0.235 0.00126 bdl bdl bdl 0.0024 0.78 0.00039 0.0688 bdl 0.0037 bdl bdl 0.004 2
LATE SUMMER SITE 1 0.021 0.00076 bdl bdl bdl 0.0016 0.067 bdl 0.0164 bdl 0.0023 bdl bdl bdl 0
SITE 4 0.023 0.00068 bdl bdl bdl 0.0016 0.051 bdl 0.0233 bdl 0.0029 bdl bdl bdl 1
FALL SITE 1 0.057 0.00049 0.00012 bdl bdl 0.0026 0.224 0.0012 0.0156 bdl 0.0039 bdl 0.00011 0.111 3
2013
SPRING SITE 1 3.74 0.00597 0.00029 0.0071 0.0057 0.0158 11.5 0.0062 0.226 bdl 0.0189 0.00049 0.000091 0.0607 10
SITE 5 12 0.0173 0.00102 0.0243 0.0201 0.051 41.6 0.0218 0.785 0.000043 0.0617 0.00146 0.0004 0.214 13
EARLY SUMMER
SITE 1 0.466 0.00129 0.000037 bdl bdl 0.003 1.36 0.00071 0.0601 bdl 0.004 bdl bdl 0.0053 2
SITE 4 0.247 0.00114 0.000025 bdl bdl 0.0026 0.958 0.00044 0.0507 bdl 0.0038 bdl bdl bdl 2
SITE 5 0.332 0.00175 0.000049 bdl bdl 0.0035 1.9 0.00067 0.0828 bdl 0.0072 bdl bdl 0.0051 3
LATE SUMMER
SITE 1 0.0796 0.00124 0.000021 bdl bdl 0.0021 1.01 0.00018 0.0205 bdl 0.0036 bdl bdl bdl 2
SITE 4 0.0896 0.00116 0.000024 bdl bdl 0.0021 0.782 0.0002 0.0348 bdl 0.0038 bdl bdl bdl 2
SITE 5 0.209 0.00173 0.000046 bdl bdl 0.0034 2.18 0.00061 0.0858 bdl 0.0061 bdl bdl 0.0064 2
FALL
SITE 1 0.0568 0.00077 0.000016 bdl bdl 0.0014 0.469 0.00013 0.0157 bdl 0.0024 bdl bdl bdl 2
SITE 4 0.0314 0.00068 0.000012 bdl bdl 0.0016 0.346 bdl 0.0129 bdl 0.0027 bdl bdl bdl 1
SITE 5 0.215 0.00156 0.000045 bdl bdl 0.0028 2.09 0.00062 0.066 bdl 0.005 bdl bdl 0.0091 2
2014
SPRING
SITE 1 21.6 0.0298 0.00144 0.038 0.0292 0.068 58.9 0.0343 1.43 0.000062 0.0783 0.00212 0.0005 0.256 14
SITE 4 22.9 0.0344 0.00187 0.0415 0.0344 0.0825 71.6 0.0372 1.61 0.000051 0.0925 0.00263 0.00061 0.307 14
SITE 5 13.6 0.0201 0.00103 0.0255 0.0199 0.0473 42.0 0.0231 0.944 0.000091 0.0582 0.00161 0.0004 0.178 14
FALL
SITE 1 0.157 0.00088 0.000014 bdl bdl 0.0019 0.489 0.0002 0.041 0.0000058 0.0028 bdl bdl bdl 3
SITE 4 0.0198 0.00069 bdl bdl bdl 0.0016 0.09 bdl 0.018 bdl 0.0029 bdl bdl bdl 0
SITE 5 0.644 0.00206 0.000042 0.0013 bdl 0.0039 2.43 0.00126 0.0956 0.000011 0.0073 bdl bdl 0.0088 4
2015
SPRING
SITE 1 2.89 0.0045 0.00019 0.00548 0.00367 0.00993 8.34 0.00422 0.239 0.000027 0.0119 0.00033 0.000064 0.0581 8
SITE 4 3.21 0.00533 0.00021 0.00595 0.00444 0.0118 9.9 0.00494 0.306 0.000033 0.0143 0.00038 0.000078 0.0474 11
SITE 5 1.99 0.00357 0.00016 0.004 0.0028 0.00875 7.04 0.00391 0.195 0.000027 0.0112 0.0004 0.000059 0.0273 7
SITE 6 1.76 0.00328 0.00017 0.00348 0.00265 0.00782 6.18 0.0031 0.208 0.000025 0.0107 0.00036 0.000047 0.0255 7
FALL
SITE 1 0.094 0.00088 0.000011 0.00028 0.00011 0.00134 0.856 0.00018 0.0109 0.0000056 0.00226 0.00016 Bdl bdl 3
SITE 4 0.0688 0.0008 0.000014 0.00022 0.00013 0.0013 0.617 0.00015 0.0126 bdl 0.00237 0.00017 Bdl bdl 2
SITE 5 0.426 0.00171 0.000043 0.00078 0.00051 0.00329 2.17 0.00089 0.037 bdl 0.00572 0.00027 0.000012 0.0063 2
SITE 6 0.328 0.00132 0.000039 0.00057 0.0004 0.00212 1.9 0.00044 0.0466 0.0000075 0.00505 0.00023 bdl 0.0051 3
2016
SPRING
SITE 1 0.53 0.0014 0.00003 0.001 0.0006 0.003 2.35 0.0009 0.036 0.000005 0.0041 bdl 0.00001 0.006 4
SITE 4 0.54 0.0018 0.00006 0.001 0.001 0.002 2.92 0.0008 0.233 bdl 0.0045 bdl 0.00095 0.006 5
SITE 5 0.45 0.0015 0.00006 0.001 0.0012 0.004 2.04 0.0007 0.218 bdl 0.0069 0.0003 0.00002 0.01 5
SITE 6 0.27 0.0015 0.00007 0.0006 0.0014 0.002 2.55 0.0005 0.471 bdl 0.0058 0.0003 bdl 0.006 3
SUMMER
SITE 1 0.38 0.0013 0.00003 bdl 0.0003 0.002 1.19 0.0004 0.03 0.000008 0.0032 0.0003 bdl 0.002 3
SITE 4 0.21 0.0011 0.00003 bdl 0.0002 0.002 0.69 0.0002 0.032 bdl 0.0035 0.0003 bdl 0.002 2
SITE 5 1.36 0.0025 0.00005 0.0009 0.0009 0.004 3.00 0.0011 0.087 bdl 0.008 0.0007 0.00001 0.007 3
SITE 6 0.51 0.0023 0.00006 bdl 0.0008 0.003 2.98 0.0006 0.181 bdl 0.0081 0.0005 bdl 0.005 3
FALL
SITE 1 0.34 0.0011 0.00003 0.0007 0.0003 0.001 1.27 0.0003 0.018 bdl 0.0036 bdl bdl 0.003 2
SITE 4 0.4 0.0011 0.00002 0.0006 0.0003 0.002 1.2 0.0003 0.018 bdl 0.0039 bdl bdl 0.004 2
SITE 5 0.37 0.0019 0.00005 0.0008 0.0006 0.003 2.31 0.0009 0.043 0.000008 0.0071 0.0003 bdl 0.007 4
SITE 6 0.38 0.0015 0.00006 0.0006 0.0005 0.002 2.19 0.0005 0.053 0.000006 0.0067 0.0003 bdl 0.006 3
TOTAL EXCEEDANCES
42 8 8 15 10 4 42 8 15 16 16 4 7 10 205
* - guideline is hardness dependent; guideline presented for comparison based on average hardness across all sites and samples.** - no EQGASW-PAL guideline, guideline used for comparison is for Irrigation Water
bdl = below detection limits
NOTIKEWIN AND KEG RIVER WATER QUALITY 2016 PAGE 21
©2017 Aquality Environmental Consulting Ltd.
3.4 Bacteria
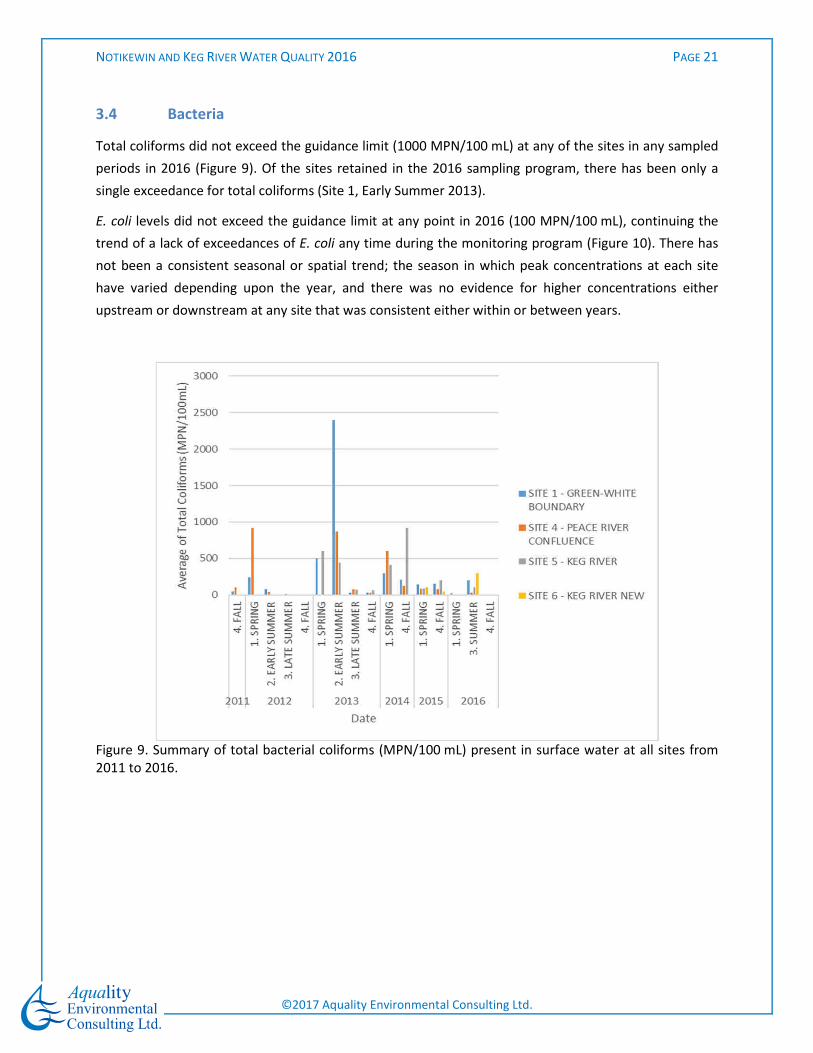
Total coliforms did not exceed the guidance limit (1000 MPN/100 mL) at any of the sites in any sampled
periods in 2016 (Figure 9). Of the sites retained in the 2016 sampling program, there has been only a
single exceedance for total coliforms (Site 1, Early Summer 2013).
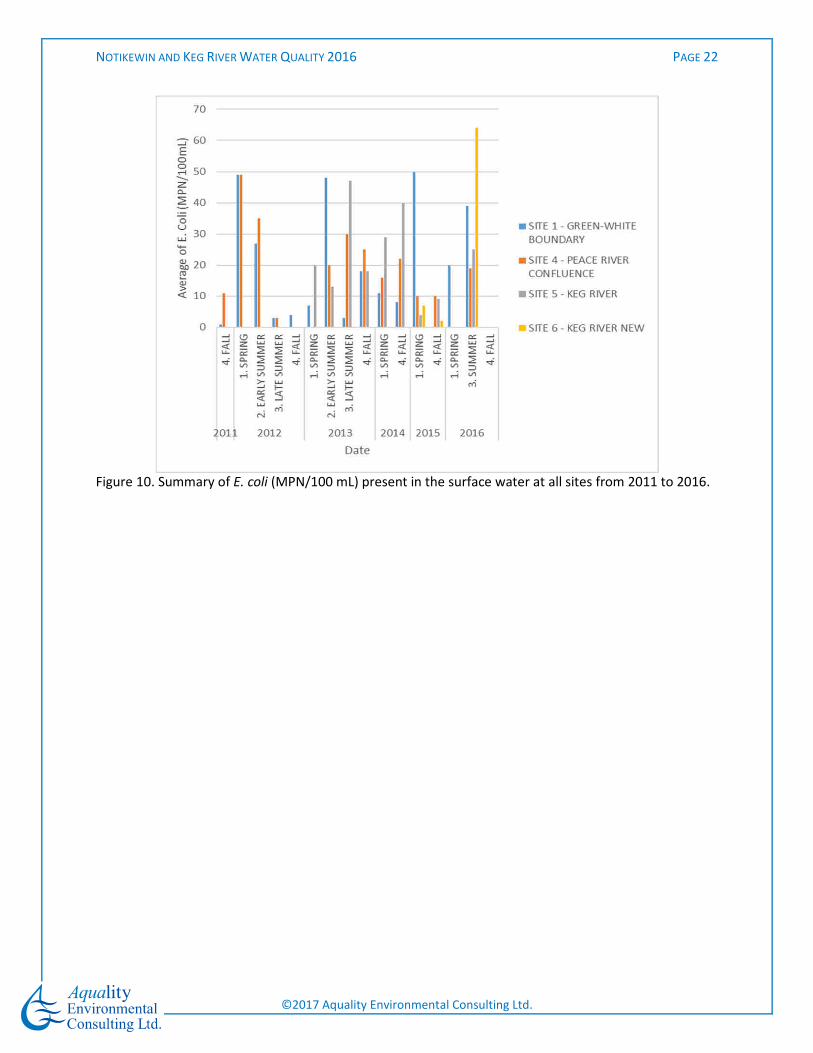
E. coli levels did not exceed the guidance limit at any point in 2016 (100 MPN/100 mL), continuing the
trend of a lack of exceedances of E. coli any time during the monitoring program (Figure 10). There has
not been a consistent seasonal or spatial trend; the season in which peak concentrations at each site
have varied depending upon the year, and there was no evidence for higher concentrations either
upstream or downstream at any site that was consistent either within or between years.
Figure 9. Summary of total bacterial coliforms (MPN/100 mL) present in surface water at all sites from
2011 to 2016.
NOTIKEWIN AND KEG RIVER WATER QUALITY 2016 PAGE 22
©2017 Aquality Environmental Consulting Ltd.
Figure 10. Summary of E. coli (MPN/100 mL) present in the surface water at all sites from 2011 to 2016.
NOTIKEWIN AND KEG RIVER WATER QUALITY 2016 PAGE 23
©2017 Aquality Environmental Consulting Ltd.
3.5 Pesticides
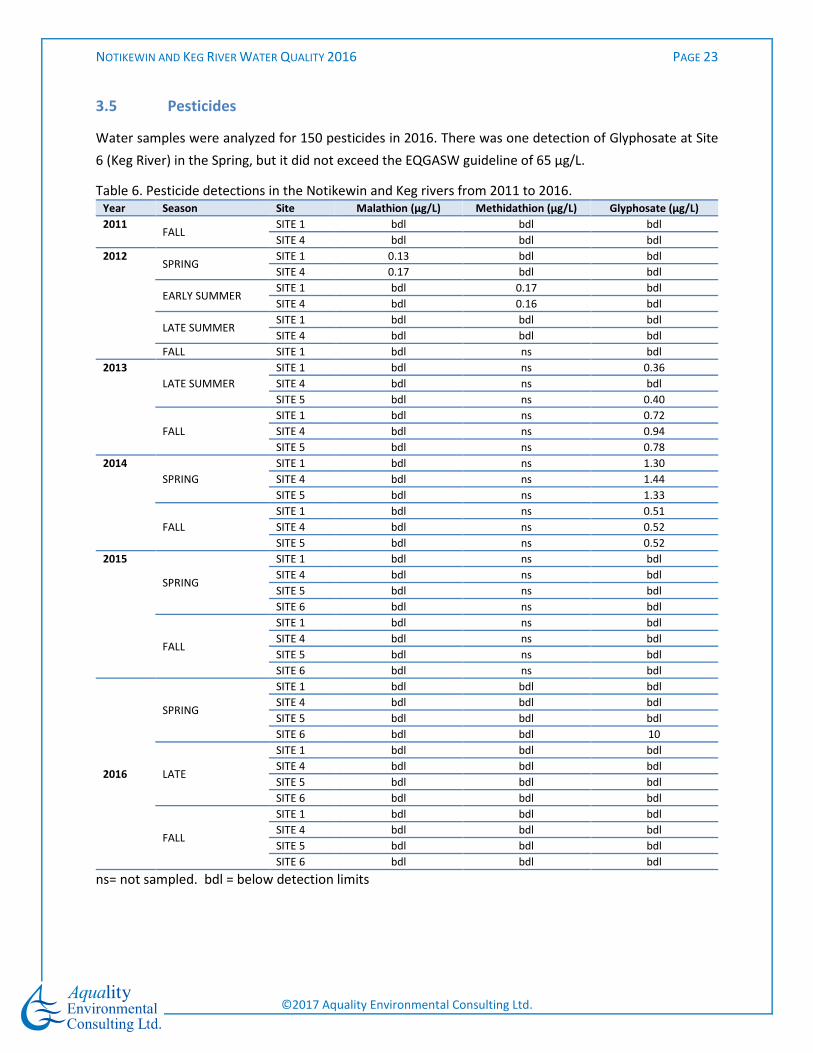
Water samples were analyzed for 150 pesticides in 2016. There was one detection of Glyphosate at Site
6 (Keg River) in the Spring, but it did not exceed the EQGASW guideline of 65 µg/L.
Table 6. Pesticide detections in the Notikewin and Keg rivers from 2011 to 2016.
Year Season Site Malathion (µg/L) Methidathion (µg/L) Glyphosate (µg/L)
2011 FALL
SITE 1 bdl bdl bdl
SITE 4 bdl bdl bdl
2012 SPRING
SITE 1 0.13 bdl bdl
SITE 4 0.17 bdl bdl
EARLY SUMMER SITE 1 bdl 0.17 bdl
SITE 4 bdl 0.16 bdl
LATE SUMMER SITE 1 bdl bdl bdl
SITE 4 bdl bdl bdl
FALL SITE 1 bdl ns bdl
2013
LATE SUMMER
SITE 1 bdl ns 0.36
SITE 4 bdl ns bdl
SITE 5 bdl ns 0.40
FALL
SITE 1 bdl ns 0.72
SITE 4 bdl ns 0.94
SITE 5 bdl ns 0.78
2014
SPRING
SITE 1 bdl ns 1.30
SITE 4 bdl ns 1.44
SITE 5 bdl ns 1.33
FALL
SITE 1 bdl ns 0.51
SITE 4 bdl ns 0.52
SITE 5 bdl ns 0.52
2015
SPRING
SITE 1 bdl ns bdl
SITE 4 bdl ns bdl
SITE 5 bdl ns bdl
SITE 6 bdl ns bdl
FALL
SITE 1 bdl ns bdl
SITE 4 bdl ns bdl
SITE 5 bdl ns bdl
SITE 6 bdl ns bdl
2016
SPRING
SITE 1 bdl bdl bdl
SITE 4 bdl bdl bdl
SITE 5 bdl bdl bdl
SITE 6 bdl bdl 10
LATE
SITE 1 bdl bdl bdl
SITE 4 bdl bdl bdl
SITE 5 bdl bdl bdl
SITE 6 bdl bdl bdl
FALL
SITE 1 bdl bdl bdl
SITE 4 bdl bdl bdl
SITE 5 bdl bdl bdl
SITE 6 bdl bdl bdl
ns= not sampled. bdl = below detection limits
NOTIKEWIN AND KEG RIVER WATER QUALITY 2016 PAGE 24
©2017 Aquality Environmental Consulting Ltd.
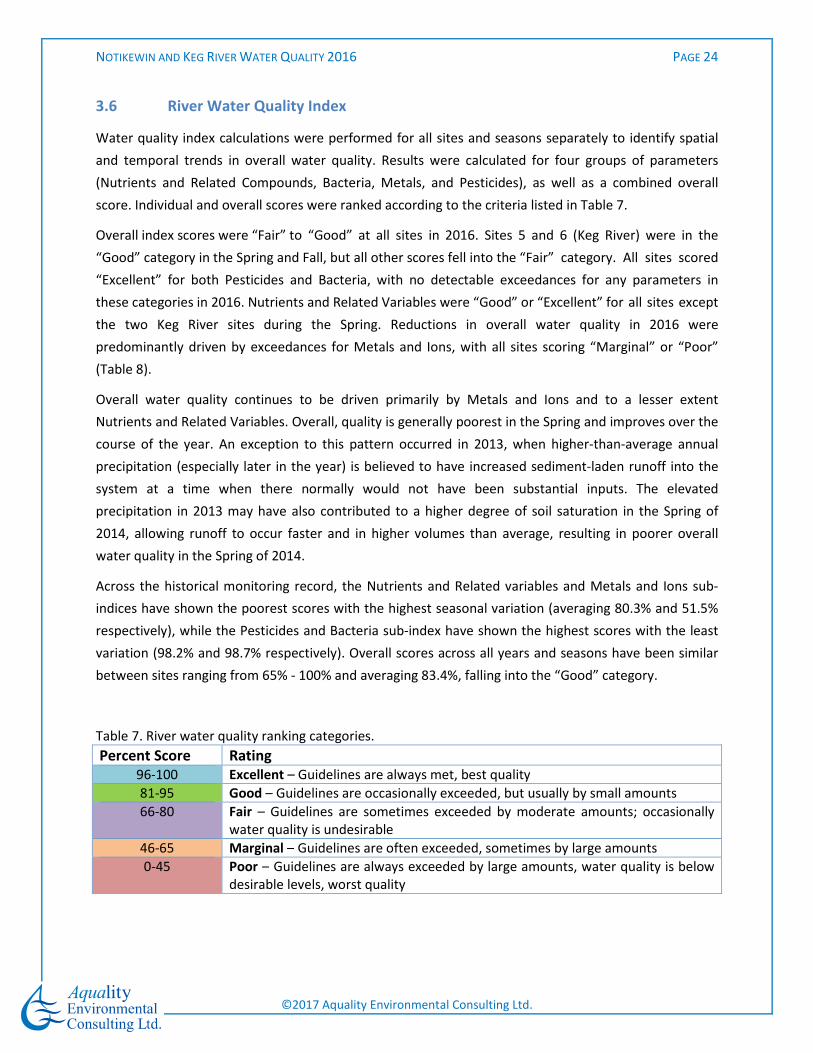
3.6 River Water Quality Index
Water quality index calculations were performed for all sites and seasons separately to identify spatial
and temporal trends in overall water quality. Results were calculated for four groups of parameters
(Nutrients and Related Compounds, Bacteria, Metals, and Pesticides), as well as a combined overall
score. Individual and overall scores were ranked according to the criteria listed in Table 7.
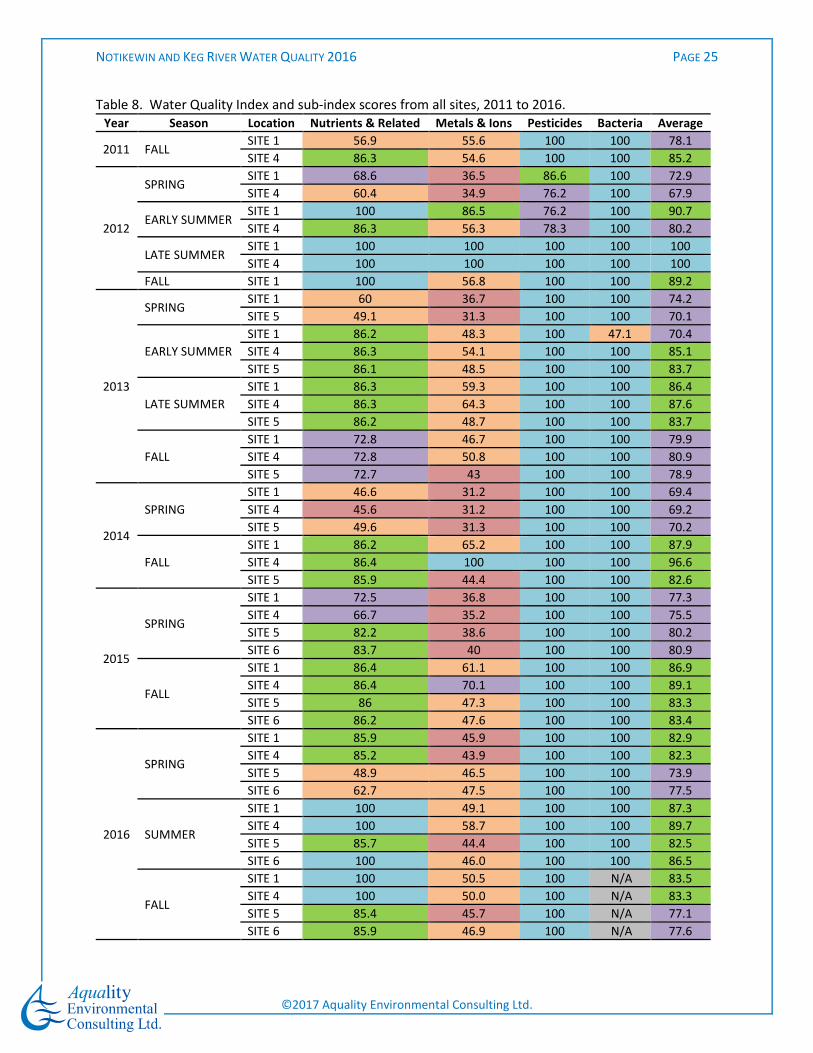
Overall index scores were “Fair” to “Good” at all sites in 2016. Sites 5 and 6 (Keg River) were in the
“Good” category in the Spring and Fall, but all other scores fell into the “Fair” category. All sites scored
“Excellent” for both Pesticides and Bacteria, with no detectable exceedances for any parameters in
these categories in 2016. Nutrients and Related Variables were “Good” or “Excellent” for all sites except
the two Keg River sites during the Spring. Reductions in overall water quality in 2016 were
predominantly driven by exceedances for Metals and Ions, with all sites scoring “Marginal” or “Poor”
(Table 8).
Overall water quality continues to be driven primarily by Metals and Ions and to a lesser extent
Nutrients and Related Variables. Overall, quality is generally poorest in the Spring and improves over the
course of the year. An exception to this pattern occurred in 2013, when higher-than-average annual
precipitation (especially later in the year) is believed to have increased sediment-laden runoff into the
system at a time when there normally would not have been substantial inputs. The elevated
precipitation in 2013 may have also contributed to a higher degree of soil saturation in the Spring of
2014, allowing runoff to occur faster and in higher volumes than average, resulting in poorer overall
water quality in the Spring of 2014.
Across the historical monitoring record, the Nutrients and Related variables and Metals and Ions sub-
indices have shown the poorest scores with the highest seasonal variation (averaging 80.3% and 51.5%
respectively), while the Pesticides and Bacteria sub-index have shown the highest scores with the least
variation (98.2% and 98.7% respectively). Overall scores across all years and seasons have been similar
between sites ranging from 65% - 100% and averaging 83.4%, falling into the “Good” category.
Table 7. River water quality ranking categories.
Percent Score Rating
96-100 Excellent – Guidelines are always met, best quality
81-95 Good – Guidelines are occasionally exceeded, but usually by small amounts
66-80 Fair – Guidelines are sometimes exceeded by moderate amounts; occasionally
water quality is undesirable
46-65 Marginal – Guidelines are often exceeded, sometimes by large amounts
0-45 Poor – Guidelines are always exceeded by large amounts, water quality is below
desirable levels, worst quality
NOTIKEWIN AND KEG RIVER WATER QUALITY 2016 PAGE 25
©2017 Aquality Environmental Consulting Ltd.
Table 8. Water Quality Index and sub-index scores from all sites, 2011 to 2016.
Year Season Location Nutrients & Related Metals & Ions Pesticides Bacteria Average
2011 FALL SITE 1 56.9 55.6 100 100 78.1
SITE 4 86.3 54.6 100 100 85.2
2012
SPRING SITE 1 68.6 36.5 86.6 100 72.9
SITE 4 60.4 34.9 76.2 100 67.9
EARLY SUMMER SITE 1 100 86.5 76.2 100 90.7
SITE 4 86.3 56.3 78.3 100 80.2
LATE SUMMER SITE 1 100 100 100 100 100
SITE 4 100 100 100 100 100
FALL SITE 1 100 56.8 100 100 89.2
2013
SPRING SITE 1 60 36.7 100 100 74.2
SITE 5 49.1 31.3 100 100 70.1
EARLY SUMMER
SITE 1 86.2 48.3 100 47.1 70.4
SITE 4 86.3 54.1 100 100 85.1
SITE 5 86.1 48.5 100 100 83.7
LATE SUMMER
SITE 1 86.3 59.3 100 100 86.4
SITE 4 86.3 64.3 100 100 87.6
SITE 5 86.2 48.7 100 100 83.7
FALL
SITE 1 72.8 46.7 100 100 79.9
SITE 4 72.8 50.8 100 100 80.9
SITE 5 72.7 43 100 100 78.9
2014
SPRING
SITE 1 46.6 31.2 100 100 69.4
SITE 4 45.6 31.2 100 100 69.2
SITE 5 49.6 31.3 100 100 70.2
FALL
SITE 1 86.2 65.2 100 100 87.9
SITE 4 86.4 100 100 100 96.6
SITE 5 85.9 44.4 100 100 82.6
2015
SPRING
SITE 1 72.5 36.8 100 100 77.3
SITE 4 66.7 35.2 100 100 75.5
SITE 5 82.2 38.6 100 100 80.2
SITE 6 83.7 40 100 100 80.9
FALL
SITE 1 86.4 61.1 100 100 86.9
SITE 4 86.4 70.1 100 100 89.1
SITE 5 86 47.3 100 100 83.3
SITE 6 86.2 47.6 100 100 83.4
2016
SPRING
SITE 1 85.9 45.9 100 100 82.9
SITE 4 85.2 43.9 100 100 82.3
SITE 5 48.9 46.5 100 100 73.9
SITE 6 62.7 47.5 100 100 77.5
SUMMER
SITE 1 100 49.1 100 100 87.3
SITE 4 100 58.7 100 100 89.7
SITE 5 85.7 44.4 100 100 82.5
SITE 6 100 46.0 100 100 86.5
FALL
SITE 1 100 50.5 100 N/A 83.5
SITE 4 100 50.0 100 N/A 83.3
SITE 5 85.4 45.7 100 N/A 77.1
SITE 6 85.9 46.9 100 N/A 77.6
NOTIKEWIN AND KEG RIVER WATER QUALITY 2016 PAGE 26
©2017 Aquality Environmental Consulting Ltd.
4 Discussion
4.1 Routine
Routine water quality parameters provide a general overview of the ionic compounds that dominate
water chemistry. They include those compounds that contribute most strongly to salinity, conductivity,
water hardness, and can be indicative of certain land-use practices.
Generally, the waters of both the Notikewin and Keg rivers were fresh, hard, and slightly alkaline. There
was no strong evidence of human influences on water quality based on routine parameters, (e.g.,
increased salinity due to road salting). In 2016, there was a trend towards increasing concentrations of
most routine ions from upstream to downstream on the Notikewin River, but not the Keg River, but the
trends in the Notikewin were neither strong nor universal across all routine parameters. There was a
strong trend for increasing concentrations of routine ions from the Spring to Summer sampling events,
followed by a decrease in the Fall. Based on the associated seasonality of snowmelt and precipitation,
the patterns observed appear primarily to be driven by influxes of snowmelt and precipitation, which
result in the dilution of the associated ions. The Keg River generally had higher concentrations of most
routine ions compared to the Notikewin River, with correspondingly higher hardness, alkalinity, and
conductivity. Both rivers appear to be well-buffered and resistant to changes in pH, and pH values all fell
within EQGASW guidelines of 6.5 to 9.0.
There were no issues with water quality and the health of aquatic ecosystems identified from
measurements of routine water quality variables.
4.2 Nutrients
As in previous years, the analysis of nutrients focused on nitrogen and phosphorus as these are
generally the most important nutrient pollutants in aquatic systems. Both nitrogen and phosphorus can
contribute to eutrophication, where elevated nutrient levels result in elevated plant and algal growth.
Eutrophication in aquatic systems has several negative impacts on the ecosystem including reduced
visibility underwater (which can affect the ability of predators to capture prey and the ability of light to
penetrate deeper water regions) (US EPA 2011) and diminished oxygen levels causing fish death (FAO
1996). Phosphorus is usually considered to be the limiting nutrient in aquatic ecosystems that is the
primary driver of eutrophication (FAO 1996; Sharpley et al. 2003; Schindler 2006).
Due to the number and magnitude of guideline exceedances recorded, nitrogen was a greater concern
than phosphorus in the pilot study in 2011. However, the frequency and magnitude of exceedances
since has been generally dominated by phosphorus. Exceedances for Total Nitrogen and Total
Phosphorus have mostly been limited to the Spring sampling period, and appear to be driven by the
influx of particulate forms of nitrogen and phosphorus (either bound to soil particles or in particulate
organic matter) from runoff.
NOTIKEWIN AND KEG RIVER WATER QUALITY 2016 PAGE 27
©2017 Aquality Environmental Consulting Ltd.
In 2016, concentrations of both Total Nitrogen and Total Phosphorus were below historical averages on
the Notikewin River. Spring concentrations of Total Nitrogen on the Keg River were above historical
averages, as were Fall concentrations of Total Phosphorus. In 2014 and 2015, TP and TN concentrations
were higher in the Notikewin River than the Keg River in the Spring, but lower in the Fall. This suggests,
potential differences in geological parent materials and/or land use practices between the two basins.
However, in 2016, TP and TN concentrations in the Keg River were generally higher than in Notikewin
River throughout the Spring, Summer, and Fall. The Keg River has consistently shown a strong peak in
Total Nitrogen concentrations in the Spring throughout all years. This pattern, while present in the
Notikewin River samples, has been less consistent and with lower peaks over the course of the study.
The peak in Nitrogen in the Keg River in the Spring followed historical patterns, but the lower-than-
average concentrations at the Notikewin sites and the large dissolved fraction suggests possible external
inputs that were not previously present or detectable.
Because of the generally low concentrations of nutrients outside of the spring freshet period, there
appears to be limited risk of eutrophication of the Notikewin and Keg rivers at the current time. The
consistent strong peaks in TN concentrations in the Keg River in the Spring may warrant further
investigation, to determine whether this pattern is caused by human activities and if there are any
actions that could be taken to mitigate the impacts.
4.3 Metals
Seven metals exceeded their respective guidelines in 2016, compared to 14 metals with exceedances
over the course of the entire monitoring program. Metal concentrations followed a strong seasonal
pattern with elevated concentrations and frequencies of exceedance occurring in the Spring. When
exceedances have occurred, concentrations have generally been dominated by particulate (not
dissolved) forms. Combined with the timing of exceedances and the high suspended solids/turbidity
seen during these periods, this indicates that the majority of metals entering the system are likely bound
to (or form constituents of) soil and other mineral particles.
Of the seven metals that had guideline exceedances in 2016, only Aluminum, Iron, Mercury, and Nickel
had exceedances outside of the Spring sampling period. The frequency of exceedances was highest in
the Keg River in 2016, contributing 54% of total exceedances, the majority of which occurred during the
Spring. Spring concentrations for some metals were higher in the Notikewin River, but metals
concentrations detected in the Summer and Fall were generally higher in the Keg River. This pattern is
similar to that seen for nutrients, suggesting that background concentrations may be higher in the Keg
River, but pulses of metals during runoff are sometimes higher in the Notikewin River.
Despite the observed exceedances, overall concentrations of metals were lower in 2016 than in previous
years. This was pronounced in the Spring, associated with the lower than average precipitation and
earlier snowmelt as previously noted. The similarly reduced concentrations of TSS support the
NOTIKEWIN AND KEG RIVER WATER QUALITY 2016 PAGE 28
©2017 Aquality Environmental Consulting Ltd.
suggestion that most of the elevated metals concentrations are brought into the system bound to or as
components of soil particles through erosive processes.
The Metals sub-index of the Water Quality Index indicates that water quality based on metals generally
falls into the “Poor” to “Marginal” categories, with occasionally improvements occurring outside of the
spring runoff period. This pattern was seen in 2015 and throughout the historical record of the sampling
program. Metal concentrations appear to represent the greatest impediment to surface water quality in
the Notikewin and Keg rivers. The contribution of metals is likely due to the influx of soil, sediments, and
mineral particulates into the rivers during spring runoff given the strong seasonal pattern of metal
concentrations and exceedances, and Aluminum and Iron are both major natural constituents of clay
and soil particles. Therefore, elevated metal concentrations are likely driven by heavy seasonal sediment
loadings into the rivers, and may more broadly reflect issues with erosion and sedimentation rather than
metals contamination per se. The differential in relative quality due to the most frequently encountered
metals between the Notikewin and Keg rivers suggests differences in geological parent materials and/or
land use practices, with greater frequencies of exceedances in the Notikewin River in the Spring, but
higher sustained concentrations of these metals in the Keg River in the Fall.
4.4 Bacteria
Concentrations of total coliforms and E. coli have generally been low for all sites over the course of the
monitoring program. E. coli concentrations have never exceeded the guidelines at any sites while total
coliforms have exceeded the guidelines once in the 2013 sampling locations. Total coliform
concentrations in 2016 were below seasonal averages in the Spring and Fall, and above seasonal
averages in the Summer. E. coli concentrations were generally within the same range as historical levels
in Summer, but below them in the Spring and Fall.
E. coli is a single species of bacteria that forms a subset of total coliforms; it is the most common
bacterium in the human intestinal tract, and is common in most warm-blooded animals (Health Canada,
2006b). The presence of E. coli indicates fecal contamination from warm-blooded animal sources.
Sources of contamination include municipal sewage discharge, failing septic systems, livestock farming
operations, and wildlife. Certain groups of E. coli are pathogenic, causing severe adverse health effects
or even death when consumed in sufficient concentrations (Health Canada, 2006b). The lack of elevated
E. coli concentrations during periods of elevated surface runoff suggests there are few issues with fecal
contamination from terrestrial sources within the Notikewin and Keg rivers.
Total coliforms (of which E. coli forms a subset) are a broad group of bacteria found in water from both
natural (e.g. sediment) and anthropogenic (e.g. human and/or animal waste) sources (Health Canada,
2006a). Elevated concentrations of total coliforms may be indicative of large amounts of decaying
organic matter entering a given system. Elevated concentrations of total coliforms observed in Spring
likely reflect naturally occurring coliform bacteria present in soil and decaying organic matter which is
washed into the rivers with spring runoff. Total coliforms are not necessarily harmful, but they are
NOTIKEWIN AND KEG RIVER WATER QUALITY 2016 PAGE 29
©2017 Aquality Environmental Consulting Ltd.
indicative of contaminated or stagnant waters. Conversely, E. coli have a much greater likelihood of
adverse health effects on humans or animals and their presence in high concentrations in water bodies
often indicates contamination from sewage systems or agricultural runoff.
The Bacteria sub-index of the Water Quality Index indicates that water quality based on bacteria has
almost exclusively fallen into the “Excellent” category for the sampling locations retained in the
program, except for the single noted exceedance of total coliforms in 2013., which occurred during a
year of especially high precipitation and runoff. The lack of any trend in bacterial concentrations
combined with the infrequency of exceedances suggests that bacteria are of negligible concern to water
quality in these systems. However, since sampling on the Keg River has occurred for a shorter period
than on the Notikewin River, there is a greater degree of uncertainty in predicting trends from the Keg
river. Despite the high water quality from an ecosystem health perspective, any water drawn from
either of these two systems will still require adequate treatment before use as a drinking water source.
4.5 Pesticides
The general category of pesticides includes herbicides, insecticides, and fungicides. Pesticide use in
Alberta is widespread and they are frequently encountered in surface waters due to the high intensity of
agricultural activities. Pesticides are frequently of concern in water quality monitoring studies because
of the high density of water bodies in the province, their method of application, and the ease with which
they may enter surface water bodies.
Only three pesticides have been detected over the course of the monitoring program: Malathion and
Methidathion in 2012, and Glyphosate in 2013, 2014, and 2016. No detections of any pesticides
occurred in 2015, though it should be noted that sampling was only conducted during the Spring and Fall
in 2015.
The Pesticides sub-index of the Water Quality Index indicates pesticides generally fall into the
“Excellent” category, having fallen to “Good” for only one sample and “Fair” for three samples over the
course of the monitoring program. Most pesticides have either been absent or below detection limits,
and when detected, the magnitude of pesticide exceedances has generally been low. Results from
monitoring program indicate that pesticides have little impact on the overall water quality within either
the Notikewin or the Keg River systems.
4.6 Overall Water Quality
Overall, water quality in the Notikewin and Keg rivers is good, with Water Quality Index scores in 2016
averaging 82%. This average score falls within the “Good” category, indicating that guidelines are
occasionally exceeded by small amounts. Spring and Fall scores from the Keg River sites fell within the
“Fair” category, while scores from the Notikewin River sites fell within the “Good” category. Summer
scores fell within the “Good” category for all four sites. Scores were consistently lower at the Keg River
sites than the Notikewin River. Exceedances due to metal concentrations contributed the most to
NOTIKEWIN AND KEG RIVER WATER QUALITY 2016 PAGE 30
©2017 Aquality Environmental Consulting Ltd.
reduced water quality, followed by nutrients and related compounds. No exceedances for either
bacteria or pesticides were detected in 2016, resulting in scores of excellent for both of these sub-
indices.
Although more variable than some previous years, results from 2016 still agree with the general
historical trend of the greatest impairment of water quality during the Spring and improvement through
to the Fall. While variation between years has existed, the patterns of this variation are largely explained
by climatological variation. Results from the Water Quality Index, both overall and for the individual sub-
indices, generally support that these two systems have relatively good water quality. The greatest
sources of impairment come from high concentrations of nutrients and metals associated with influxes
of soil, sediment, and particulate organic matter that occur within the Spring period and occasionally
during periods of exceptionally high precipitation.
5 Conclusions and Recommendations
Water quality in the Notikewin and Keg rivers has historically displayed strong seasonal patterns, and
this trend has continued with the results from 2016. Notable variations were due to climatological
differences from previous years. The poorest water quality occurs in the Spring, and overall quality
improves and stabilizes by Fall. The reduced water quality in the early part of the year appears to be
driven by metals and nutrients brought into the rivers from increased surface runoff due to snow melt
and early season precipitation. Based on comparisons of particulate versus dissolved fractions of the
compounds of interest, the metals and nutrients are largely particulate and likely enter the system as
organic matter (nutrients), bound to soil particles (nutrients and metals), or as components of soil and
mineral particles (metals). Pesticides and bacteria have not been significant recurring pollutants to date.
The lower-than-average precipitation in the spring and occurrence of at least some snowmelt prior to
ice breakup and Spring water quality sampling in 2016 was reflected in reduced discharges in both
rivers, though more so in the Notikewin River. The results of this change from previously observed
climatic conditions demonstrate that a major proportion of the metals that enter these river systems are
either bound to or as constituents of clay and other soil particles. The number of exceedances for metals
in 2016 (especially during the Spring) was somewhat lower than in previous years, but the magnitude of
exceedances was substantially lower, resulting in higher than seasonal scores for the Metals sub-index
of the River Water Quality Index. Exceedances for nutrients remained high in the Keg River in the Spring,
despite the reduced influxes of particulate matter, that suggests an unknown factor is contributing to
the higher background concentrations in that system compared to the Notikewin River.
Although the concentrations of phosphorus and nitrogen observed in the Spring are of concern, these
levels are not maintained through the year. The peak in nitrogen observed in the Keg River during the
Spring followed the expected seasonal pattern, but there may have been additional contributing factors
based on the size of the dissolved nitrogen fraction. The risk to the aquatic environment is generally
NOTIKEWIN AND KEG RIVER WATER QUALITY 2016 PAGE 31
©2017 Aquality Environmental Consulting Ltd.
further reduced as these nutrients occur predominantly in particulate form where they are not
biologically available for aquatic plant or algae growth. The Spring peak on the Keg River had a large
dissolved nitrogen fraction, so future monitoring should continue to determine if this is a developing
pattern, as it could indicate an increasing risk of eutrophication within the Keg River.
The addition of one site along the Keg River in 2015 allowed the water quality monitoring program a
broader view of patterns of water quality and begin to identify regional differences that may contribute
to patterns of aquatic health. Results from the Notikewin River have been largely consistent with
expected seasonal and inter-annual variation in precipitation, run-off, and discharges. Results from the
Keg River have showed similar patterns, but the additional years of monitoring at Sites 5 and 6 will allow
greater confidence in the results, and with continued sampling at these sites the patterns observed in
2016 can be explored with more detail and rigour. Addition of the Summer sampling event provides
information regarding patterns, showing seasonal fluctuations that were previously undetected in 2014
and 2015 by the Spring and Fall sampling events alone.
Based on the findings from 2016 and comparisons with previous years, we recommend that sampling
continue in 2017 at all four sites retained in the monitoring program to continue to assess the
differences between the two basins. Trends in water quality on the Notikewin River have been well-
established. Future monitoring of the Keg River with the additional sampling location will allow for
recognition of trend for that basin. Due to the continued infrequency of exceedances for bacteria and
pesticides, it may be worthwhile considering removing them from the sampling program. This would
allow for either a cost reduction or to expand the scope of sampling in other areas. Based on the
relatively weak upstream-to-downstream patterns observed for nutrient and metals exceedances, it is
unclear whether the sources are natural, anthropogenic, or a combination of both. An expansion of
sampling locations upstream beyond the majority of agricultural and human developments in the two
rivers would provide additional data to determine the parameter inputs. This would help to determine
whether the sources of these exceedances could be reasonably mitigated through conservation and
restoration activities or development of new best management practices. However, it is recognized that
river accessibility is a strong impediment in these areas, and that further upstream sampling may be too
hazardous to undertake.
NOTIKEWIN AND KEG RIVER WATER QUALITY 2016 PAGE 32
©2017 Aquality Environmental Consulting Ltd.
6 References
Alberta Biodiversity Monitoring Institute (ABMI). 2010. ABMI Human Footprint Map (2010 Version 1.1)
Vector Digital Data. Alberta Biodiversity Monitoring Institute, Edmonton, Alberta.
Alberta Biodiversity Monitoring Institute (ABMI). 2015. ABMI Wall-to-wall Land Cover Map 2012 Version
1.0 Vector Digital Data. Alberta Biodiversity Monitoring Institute, Edmonton, Alberta.
Alberta Environment. 1999. Surface Water Quality Guidelines for Use in Alberta. Alberta Environment,
Government of Alberta, Edmonton, Alberta.
Alberta Environment. 2005. Overview of Pesticide Data in Alberta Surface Waters Since 1995. Prepared
by Anne-Marie Anderson, Environmental Monitoring and Evaluation Branch. Edmonton, Alberta.
Alberta Environment and Sustainable Resource Development. 2012. Guide to Reporting on Common
Indicators Used in State of the Watershed Reports. October 2012.
Alberta Environment and Sustainable Resource Development. 2014. Environmental Quality Guidelines
for Alberta Surface Waters. Alberta Environment and Sustainable Resource Development,
Government of Alberta, Edmonton, Alberta.
Alberta Environment and Parks. 2015a. Notikewin River at Manning (07HC001) River Flows and Levels.
Alberta Environment and Sustainable Resource Development, Edmonton, Alberta.
Alberta Environment and Parks. 2015b. Keg River at Highway No. 35 (07HF002) River Flows and Levels.
Alberta Environment and Sustainable Resource Development, Edmonton, Alberta.
British Columbia Ministry of Environment. 1987. Water quality criteria for Copper: overview report.
Government of British Columbia, Victoria, British Columbia.
British Columbia Ministry of Environment. 2001. Water quality criteria for Aluminum: overview report.
Government of British Columbia, Victoria, British Columbia.
British Columbia Ministry of Environment. 2007. Hardness in Groundwater, Water Stewardship
Information Series. Government of British Columbia, Victoria, British Columbia.
British Columbia Ministry of Environment. 2008. Ambient water quality guidelines for Iron. Prepared by
B. Phippen, C. Horvath, R. Nordin and N. Nagpal for the Science and Information Branch, Water
Stewardship Division, British Columbia Ministry of Environment.
Canadian Council of Ministers of the Environment. 2013. Canadian Environmental Quality Guidelines
Summary Tables. Canadian Council of Ministers of the Environment, Winnipeg, Manitoba.
Accessed online at http://st-ts.ccme.ca/.
Depew DC, Burgess NM, Anderson R, Baker RB, Bhavsar SP, Bodaly RA, Eckley CS, Evans MS, Gantner N,
Graydon JA, Jacobs K, LeBlanc JE, St. Louis VL, Campbell LM. 2013. An Overview of Mercury
NOTIKEWIN AND KEG RIVER WATER QUALITY 2016 PAGE 33
©2017 Aquality Environmental Consulting Ltd.
Concentrations in Freshwater Fish Species: A National Fish Mercury Dataset for Canada.
Canadian Journal of Fisheries and Aquatic Sciences 70: 1-616.
Environment Canada. 2013. Water Survey of Canada Archived Hydrometric Data. Water Survey of
Canada, Environment Canada, Gatineau, Québec.
Food and Agriculture Organization of the United Nations (FAO). 1996. Control of water pollution from
agriculture, FAO irrigation and drainage paper 55. Prepared by Edwin D. Ongley, GEMS/Water
Collaborating Centre, Canada Centre for Inland Waters for the Natural Resources Management
and Environment Department of the FAO. Rome, Italy.
Gensemera RW and Playleb RC. 1999. The Bioavailability and Toxicity of Aluminum in Aquatic
Environments. Critical Reviews in Environmental Science and Technology 29(4): 315-450.
Gervais JA, Luukinen B, Buhl K, and Stone D. 2009. Malathion Technical Fact Sheet; National Pesticide
Information Center, Oregon State University Extension Services.
http://npic.orst.edu/factsheets/malatech.html.
Haynes WM, ed. 2013. "Properties of the Elements and Inorganic Compounds," in CRC Handbook of
Chemistry and Physics, 94th Edition (Internet Version 2014), W. M. Haynes, ed., CRC
Press/Taylor and Francis, Boca Raton, FL.
Health Canada. 2006a. Total coliforms. Health Canada, Government of Canada, Ottawa, Ontario.
Health Canada. 2006b. E. coli. Health Canada, Government of Canada, Ottawa, Ontario.
Health Canada. 2009. Mercury and Human Health. Government of Canada, Ottawa, Ontario.
Henderson AM, Gervais JA, Luukinen B, Buhl K, Stone D. 2010. Glyphosate Technical Fact Sheet; National
Pesticide Information Center, Oregon State University Extension Services.
http://npic.orst.edu/factsheets/glyphotech.pdf.
IPCS (1998) Copper. Geneva, World Health Organization, International Programme on Chemical Safety
(Environmental Health Criteria 200).
Monsanto International sarl and Monsanto Eurioe sa. 2010. The agronomic benefits of glyphosate in
Europe – Benefits of glyphosate per market use – REVIEW. 82 pp. Monsanto International sarl
and Monsanto Eurioe sa.
UMA Engineering. 2007. Aquatic Weed and Algae Control in Irrigation Canals Report. Report prepared
for Alberta Agriculture and Food. Lethbridge, Alberta.
U.S. Environmental Protection Agency (US EPA). 2002. Methidathion Facts. EPA 738-F-01-007.
U.S. Environmental Protection Agency (US EPA). 2011. Water Quality Criteria for Nitrogen and
Phosphorus Pollution. Accessed online at http://water.epa.gov/.
NOTIKEWIN AND KEG RIVER WATER QUALITY 2016 PAGE 34
©2017 Aquality Environmental Consulting Ltd.
Schindler DW. 2006. Recent advances in the understanding and management of eutrophication.
Limnology and Oceanography 51(1.2):356–363.
Sharpley AN, Daniel T, Sims T, Lemunyon J, Stevens R, and Parry R. 2003. Agricultural Phosphorus and
Eutrophication, Second Edition. United States Department of Agriculture, Agricultural Research
Service, Pennsylvania.
Tu M, Hurd C, and Randall JM. 2001. Weed Control Methods Handbook. The Nature Conservancy. Online
at http://www.invasive.org/gist/handbook.html.
Vance DB. 1994. Iron - the environmental impact of a universal element. National Environmental Journal
4(3):24-25.
NOTIKEWIN AND KEG RIVER WATER QUALITY 2016 PAGE 35
©2017 Aquality Environmental Consulting Ltd.
7 Appendices
7.1 Detailed Water Quality Parameter Lists
7.1.1 Routine Water Quality Parameters
• Total Suspended Solids (TSS)
• Total Dissolved Solids (TDS)
• Turbidity
• Alkalinity, Total (as CaCO3)
• Alkalinity, Partial (as CaCO3)
• Bicarbonate (HCO3-)
• Carbonate (CO32-)
• Chloride (Cl-)
• Conductivity (EC)
• Hardness (as CaCO3)
• Hydroxide (OH-)
• Ion Balance
• pH
• Sulfate (SO4-)
7.1.2 Nutrient Water Quality Parameters
• Ammonia (NH3 as N)
• Nitrate (NO3- as N)
• Nitrite (NO2- as N)
• Nitrate and Nitrite (NO3- - NO2
- as N)
• Total Kjeldahl Nitrogen (TKN)
• Total Nitrogen (TN)
• Phosphorus (P)-Total Dissolved (TDP)
• Phosphorus (P)-Total (TP)
7.1.3 Bacteria Water Quality Parameters
• E. coli
• Total Coliforms
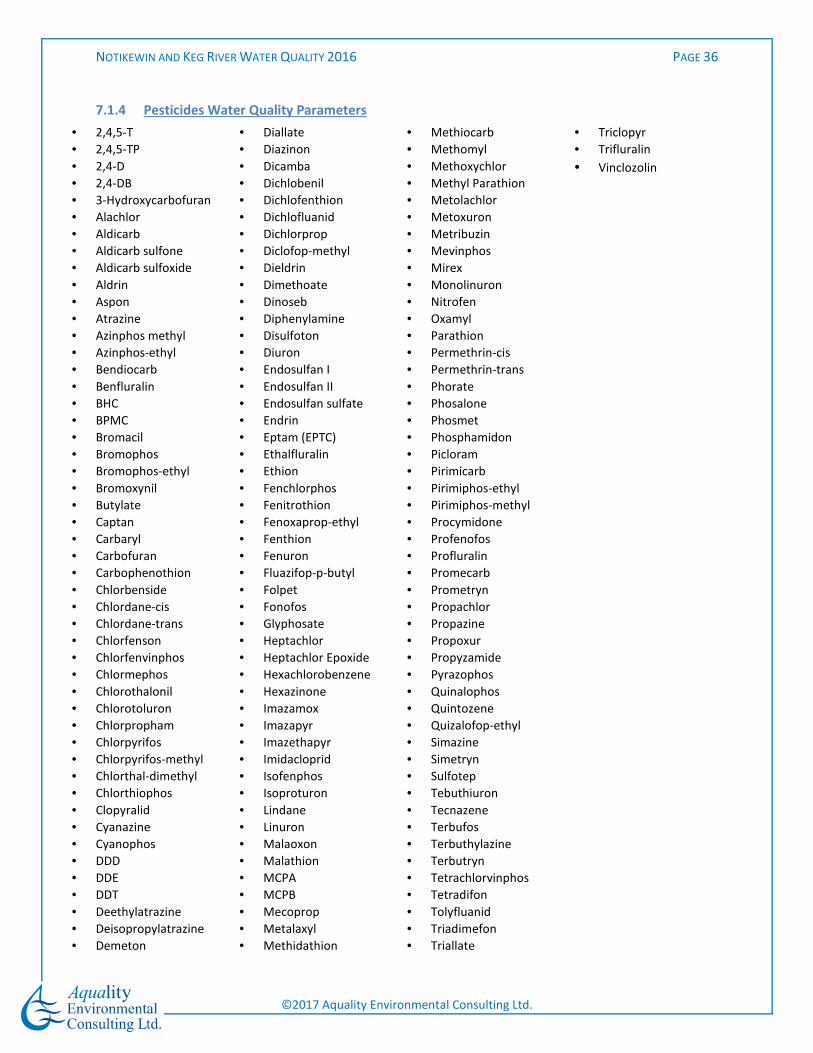
NOTIKEWIN AND KEG RIVER WATER QUALITY 2016 PAGE 36
©2017 Aquality Environmental Consulting Ltd.
7.1.4 Pesticides Water Quality Parameters
• 2,4,5-T
• 2,4,5-TP
• 2,4-D
• 2,4-DB
• 3-Hydroxycarbofuran
• Alachlor
• Aldicarb
• Aldicarb sulfone
• Aldicarb sulfoxide
• Aldrin
• Aspon
• Atrazine
• Azinphos methyl
• Azinphos-ethyl
• Bendiocarb
• Benfluralin
• BHC
• BPMC
• Bromacil
• Bromophos
• Bromophos-ethyl
• Bromoxynil
• Butylate
• Captan
• Carbaryl
• Carbofuran
• Carbophenothion
• Chlorbenside
• Chlordane-cis
• Chlordane-trans
• Chlorfenson
• Chlorfenvinphos
• Chlormephos
• Chlorothalonil
• Chlorotoluron
• Chlorpropham
• Chlorpyrifos
• Chlorpyrifos-methyl
• Chlorthal-dimethyl
• Chlorthiophos
• Clopyralid
• Cyanazine
• Cyanophos
• DDD
• DDE
• DDT
• Deethylatrazine
• Deisopropylatrazine
• Demeton
• Diallate
• Diazinon
• Dicamba
• Dichlobenil
• Dichlofenthion
• Dichlofluanid
• Dichlorprop
• Diclofop-methyl
• Dieldrin
• Dimethoate
• Dinoseb
• Diphenylamine
• Disulfoton
• Diuron
• Endosulfan I
• Endosulfan II
• Endosulfan sulfate
• Endrin
• Eptam (EPTC)
• Ethalfluralin
• Ethion
• Fenchlorphos
• Fenitrothion
• Fenoxaprop-ethyl
• Fenthion
• Fenuron
• Fluazifop-p-butyl
• Folpet
• Fonofos
• Glyphosate
• Heptachlor
• Heptachlor Epoxide
• Hexachlorobenzene
• Hexazinone
• Imazamox
• Imazapyr
• Imazethapyr
• Imidacloprid
• Isofenphos
• Isoproturon
• Lindane
• Linuron
• Malaoxon
• Malathion
• MCPA
• MCPB
• Mecoprop
• Metalaxyl
• Methidathion
• Methiocarb
• Methomyl
• Methoxychlor
• Methyl Parathion
• Metolachlor
• Metoxuron
• Metribuzin
• Mevinphos
• Mirex
• Monolinuron
• Nitrofen
• Oxamyl
• Parathion
• Permethrin-cis
• Permethrin-trans
• Phorate
• Phosalone
• Phosmet
• Phosphamidon
• Picloram
• Pirimicarb
• Pirimiphos-ethyl
• Pirimiphos-methyl
• Procymidone
• Profenofos
• Profluralin
• Promecarb
• Prometryn
• Propachlor
• Propazine
• Propoxur
• Propyzamide
• Pyrazophos
• Quinalophos
• Quintozene
• Quizalofop-ethyl
• Simazine
• Simetryn
• Sulfotep
• Tebuthiuron
• Tecnazene
• Terbufos
• Terbuthylazine
• Terbutryn
• Tetrachlorvinphos
• Tetradifon
• Tolyfluanid
• Triadimefon
• Triallate
• Triclopyr
• Trifluralin
• Vinclozolin
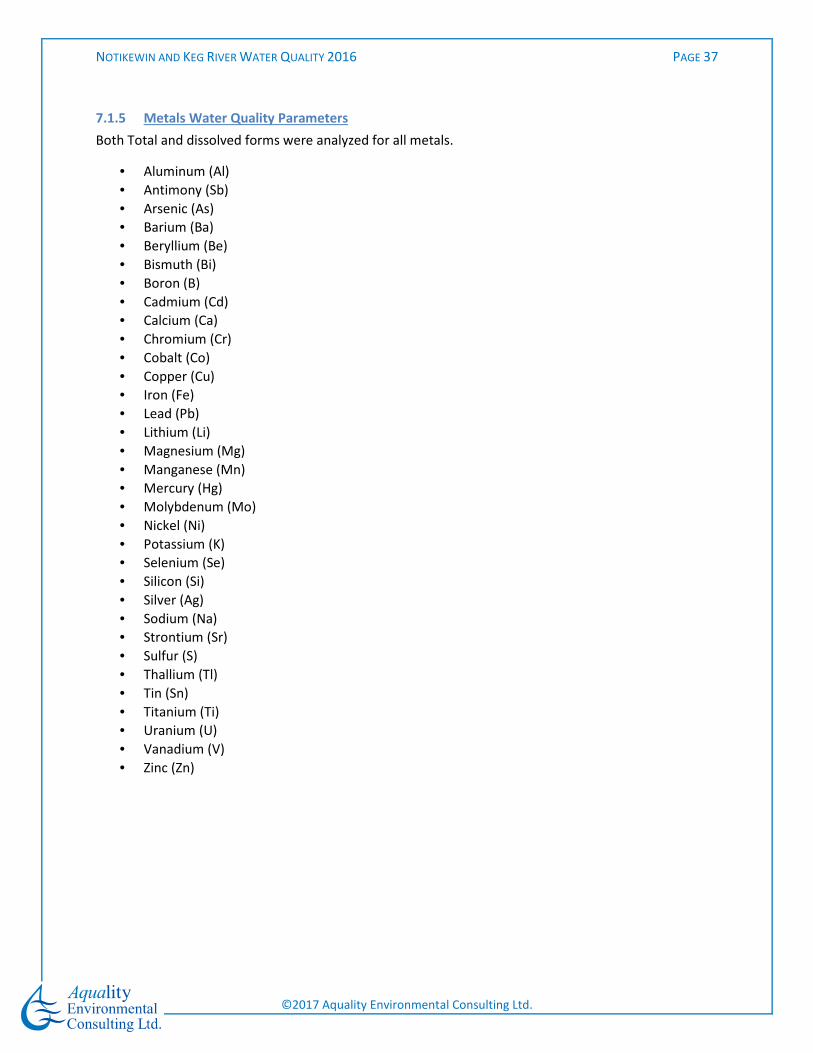
NOTIKEWIN AND KEG RIVER WATER QUALITY 2016 PAGE 37
©2017 Aquality Environmental Consulting Ltd.
7.1.5 Metals Water Quality Parameters
Both Total and dissolved forms were analyzed for all metals.
• Aluminum (Al)
• Antimony (Sb)
• Arsenic (As)
• Barium (Ba)
• Beryllium (Be)
• Bismuth (Bi)
• Boron (B)
• Cadmium (Cd)
• Calcium (Ca)
• Chromium (Cr)
• Cobalt (Co)
• Copper (Cu)
• Iron (Fe)
• Lead (Pb)
• Lithium (Li)
• Magnesium (Mg)
• Manganese (Mn)
• Mercury (Hg)
• Molybdenum (Mo)
• Nickel (Ni)
• Potassium (K)
• Selenium (Se)
• Silicon (Si)
• Silver (Ag)
• Sodium (Na)
• Strontium (Sr)
• Sulfur (S)
• Thallium (Tl)
• Tin (Sn)
• Titanium (Ti)
• Uranium (U)
• Vanadium (V)
• Zinc (Zn)
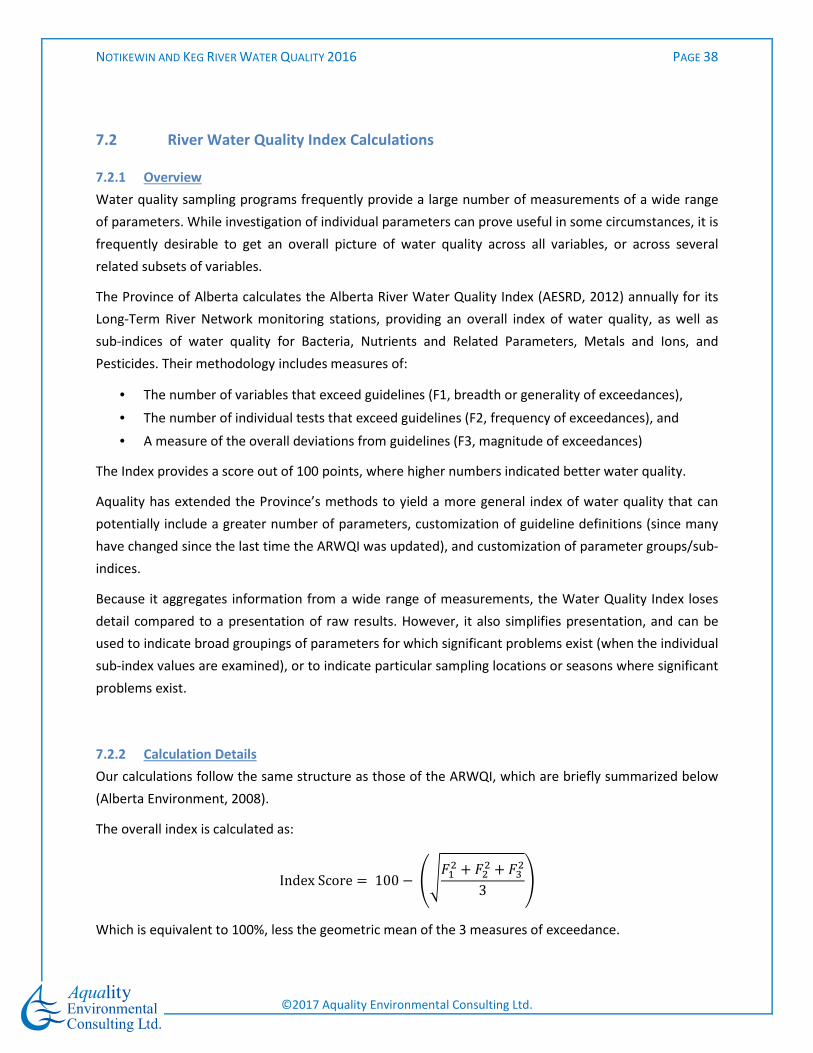
NOTIKEWIN AND KEG RIVER WATER QUALITY 2016 PAGE 38
©2017 Aquality Environmental Consulting Ltd.
7.2 River Water Quality Index Calculations
7.2.1 Overview
Water quality sampling programs frequently provide a large number of measurements of a wide range
of parameters. While investigation of individual parameters can prove useful in some circumstances, it is
frequently desirable to get an overall picture of water quality across all variables, or across several
related subsets of variables.
The Province of Alberta calculates the Alberta River Water Quality Index (AESRD, 2012) annually for its
Long-Term River Network monitoring stations, providing an overall index of water quality, as well as
sub-indices of water quality for Bacteria, Nutrients and Related Parameters, Metals and Ions, and
Pesticides. Their methodology includes measures of:
• The number of variables that exceed guidelines (F1, breadth or generality of exceedances),
• The number of individual tests that exceed guidelines (F2, frequency of exceedances), and
• A measure of the overall deviations from guidelines (F3, magnitude of exceedances)
The Index provides a score out of 100 points, where higher numbers indicated better water quality.
Aquality has extended the Province’s methods to yield a more general index of water quality that can
potentially include a greater number of parameters, customization of guideline definitions (since many
have changed since the last time the ARWQI was updated), and customization of parameter groups/sub-
indices.
Because it aggregates information from a wide range of measurements, the Water Quality Index loses
detail compared to a presentation of raw results. However, it also simplifies presentation, and can be
used to indicate broad groupings of parameters for which significant problems exist (when the individual
sub-index values are examined), or to indicate particular sampling locations or seasons where significant
problems exist.
7.2.2 Calculation Details
Our calculations follow the same structure as those of the ARWQI, which are briefly summarized below
(Alberta Environment, 2008).
The overall index is calculated as:
Index Score = 100 − ����� + ��� + ���3 �
Which is equivalent to 100%, less the geometric mean of the 3 measures of exceedance.
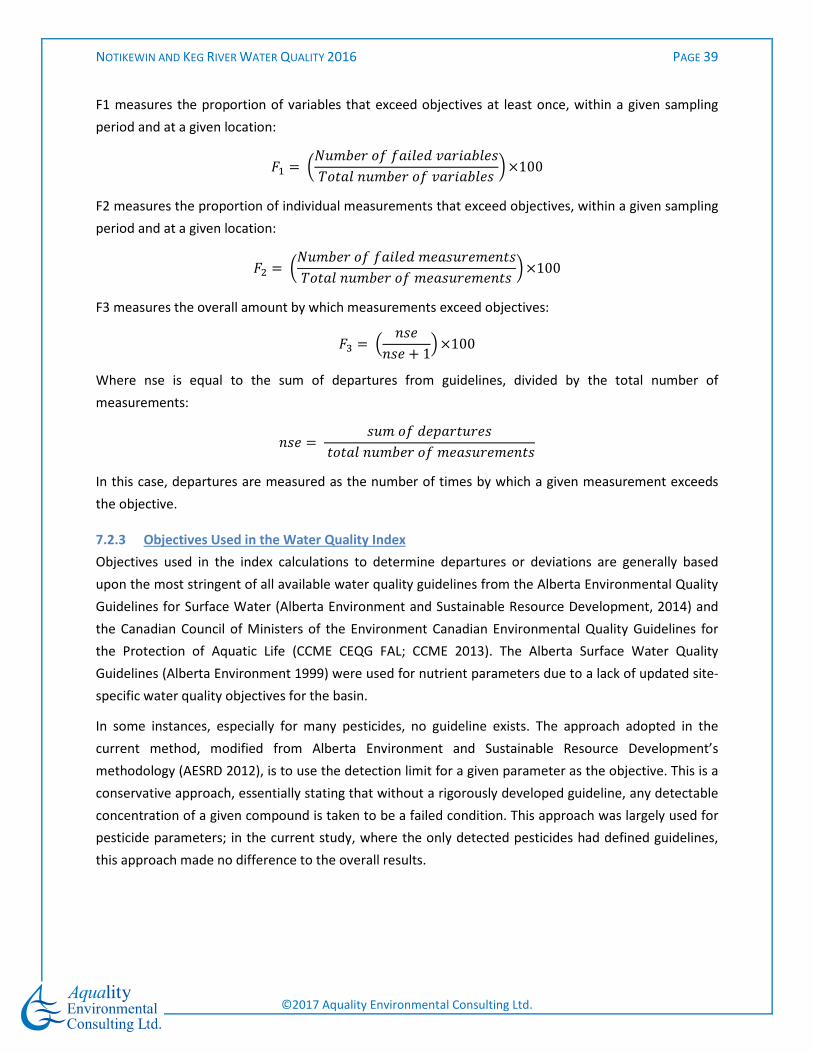
NOTIKEWIN AND KEG RIVER WATER QUALITY 2016 PAGE 39
©2017 Aquality Environmental Consulting Ltd.
F1 measures the proportion of variables that exceed objectives at least once, within a given sampling
period and at a given location:
�� = ������� � !"#�$ %!�"!�#�&'�(!# )����� � %!�"!�#�& * ×100
F2 measures the proportion of individual measurements that exceed objectives, within a given sampling
period and at a given location:
�� = ������� � !"#�$ ��!&�����)(&'�(!# )����� � ��!&�����)(& * ×100
F3 measures the overall amount by which measurements exceed objectives:
�� = , )&�)&� + 1- ×100
Where nse is equal to the sum of departures from guidelines, divided by the total number of
measurements:
)&� = &�� � $�.!�(���& (�(!# )����� � ��!&�����)(&
In this case, departures are measured as the number of times by which a given measurement exceeds
the objective.
7.2.3 Objectives Used in the Water Quality Index
Objectives used in the index calculations to determine departures or deviations are generally based
upon the most stringent of all available water quality guidelines from the Alberta Environmental Quality
Guidelines for Surface Water (Alberta Environment and Sustainable Resource Development, 2014) and
the Canadian Council of Ministers of the Environment Canadian Environmental Quality Guidelines for
the Protection of Aquatic Life (CCME CEQG FAL; CCME 2013). The Alberta Surface Water Quality
Guidelines (Alberta Environment 1999) were used for nutrient parameters due to a lack of updated site-
specific water quality objectives for the basin.
In some instances, especially for many pesticides, no guideline exists. The approach adopted in the
current method, modified from Alberta Environment and Sustainable Resource Development’s
methodology (AESRD 2012), is to use the detection limit for a given parameter as the objective. This is a
conservative approach, essentially stating that without a rigorously developed guideline, any detectable
concentration of a given compound is taken to be a failed condition. This approach was largely used for
pesticide parameters; in the current study, where the only detected pesticides had defined guidelines,
this approach made no difference to the overall results.