30 key energy trends - université de sherbrooke
TRANSCRIPT
30 KEY ENERGY TRENDSin the IEA & Worldwide30 KEY ENERGY TRENDSin the IEA & Worldwide
30th ANNIVERSARYOF THE INTERNATIONAL
ENERGY AGENCY
Couv WEB 16/03/04 17:33 Page 1

30 KEY ENERGY TRENDSin the IEA & Worldwide
30th ANNIVERSARYOF THE INTERNATIONAL
ENERGY AGENCY
Garde + Page2 16/03/04 17:01 Page 1

Garde + Page2 16/03/04 17:01 Page 2
Since the creation of the International Energy Agency thirty years ago,the world energy scene has changed significantly. Energy production ismore diverse by type and geographically, demand growth is shiftingoutside the IEA countries, technology has made tremendous progressand environmental concerns have emerged as a driver for energy policies.
For the Agency’s 25th Anniversary, we produced 25 graphs and tables tocapture the high points of a quarter century of change – first at worldlevel, then among our Member countries.The brochure was well received.On the occasion of the IEA’s 30th Anniversary we have produced a similarbrochure, adding five new graphs for our thirty years.
As this rapid survey shows, our Members’ energy policies have beenguided by the concepts laid down in the International Energy Program of1974, the 1977 IEA Principles for Energy Policy and the 1993 Shared Goals.They have evolved with the challenges to promote the IEA’s “Three E’s” ofenergy security, economic growth and environmental protection.
But new factors bring new challenges. The need to ensure adequatefinancing of energy investment in liberalised markets, the dramaticemergence of new large consumers outside of the OECD and therecognition of a shameful degree of energy poverty for more than aquarter of the world’s population, add new concerns for policymakers.To understand and respond effectively, OECD countries need accurateand timely data, detailed analysis, and exchanges of expertise – all ofwhich are core activities of the IEA. With these tools and closecooperation with Member countries, the IEA is well-positioned to facethese new and evolving challenges.
Looking forward, we believe the IEA will continue to play an importantrole advising its Members on global energy policy.We will count ourselvesfortunate if we can achieve as much in the next thirty years as wasachieved in the first.
Claude MandilExecutive Director
Doc World 18/03/04 17:30 Page 3

IEA participating
countries are
Australia
Austria
Belgium
Canada
Czech Republic
Denmark
Finland
France
Germany
Greece
Hungary
Ireland
Italy
Japan
Republic of Korea
Luxembourg
Netherlands
New Zealand
Norway
Portugal
Spain
Sweden
Switzerland
Turkey
United Kingdom
United States
Doc World 18/03/04 17:30 Page 4
WORLD
1. World Energy Supply
2. Regional Energy Supply
3. Regional Oil Production
4. Regional Gas Production
5. Regional Coal Production
6. Annual Growth of Renewables Supply
7. World Electricity Generation
8. Final Consumption by Sector
9. Selected World Energy Indicators
10. Regional CO2 Emissions
11. Crude Oil Prices
12. Energy and Poverty
IEA
13. IEA Energy Supply
14. IEA Electricity Generation
15. IEA Oil Net Imports by Origin
16. Strategic Stocks of IEA Importing Countries
17. A Sectoral View of IEA Energy Demand
18. Final Energy Demand and Savings
19. Selected IEA Energy Indicators
20. Energy Intensity Effects by End-Use Sector
21. Selected Fuel Price Indices
22. IEA Government Budgets for Energy R&D
OUTLOOK
23. Increase in World Energy Production and Consumption
24. World Primary Energy Demand Outlook
25. Regional Primary Energy Demand Outlook
26. Global Oil Import Dependency
27. CO2 Emissions Outlook
28. Investment Needs in the Energy Sector
INDICATORS
29. Regional Indicators
30. OECD Country Indicators
Doc World 18/03/04 17:31 Page 5

■ Over the 30-year period of 1971 to 2001, the world’s total primary energy supplyincreased by 84%, reaching just over 10 000 Mtoe (million tonnes of oilequivalent). This equates to a compound growth rate of about 2.1% per annum.By comparison, world population grew by 1.6% and Gross Domestic Product by3% over the same period.
■ Energy supply growth was fairly constant over the period, except in 1974-1975and in the early 1980s as a consequence of the first two oil shocks, and in theearly 1990s following the dissolution of the Soviet Union.
■ In 1973, oil was by far the largest component in total primary energy supply, with45.1%. This share has fallen to only 35% in 2001.
■ The share of coal dropped slightly, from around 25% to just over 23% in 2001.The share of combustible renewables and waste - mainly wood and charcoal, oftenreferred to as traditional biomass, used for cooking in developing countries – hasremained stable over the past 30 years, at around 11%.
■ Natural gas and nuclear have experienced a significant increase from 16.2% and0.9% respectively in 1973 to 21.2% and 6.9% in 2001.
World Energy Supply*
6
WORLDFigure1
* Total Primary Energy Supply (TPES). Excludes international marine bunkers and electricity trade.** Other includes geothermal, solar, wind and heat, etc.Sources: Energy Balances of OECD Countries; Energy Statistics and Balances of Non-OECD Countries.
Other**
Natural gasOil
Combustible renewables & waste
Coal Nuclear
Hydro
Mto
e
01 0002 0003 0004 0005 0006 0007 0008 0009 000
10 00011 000
1971 1974 1977 1980 1983 1986 1989 1992 1995 1998 2001
Doc World 18/03/04 17:31 Page 6
*Total Primary Energy Supply (TPES). Excludes international marine bunkers and electricity trade.**Does not include China.Sources: Energy Balances of OECD Countries; Energy Statistics and Balances of Non-OECD Countries.
Figure 2WORLD
Middle East1.1% Middle East
3.9%
OECD62.3%
OECD53.2%
Africa 3.5%
LatinAmerica
3.7%
LatinAmerica
4.5%Asia** 6.2%Asia** 11.5%China 7.2%
China 11.5%Non-OECDEurope 1.6%
Non-OECDEurope 1.0%
Former USSR14.4%
Former USSR9.3%
Africa 5.1%
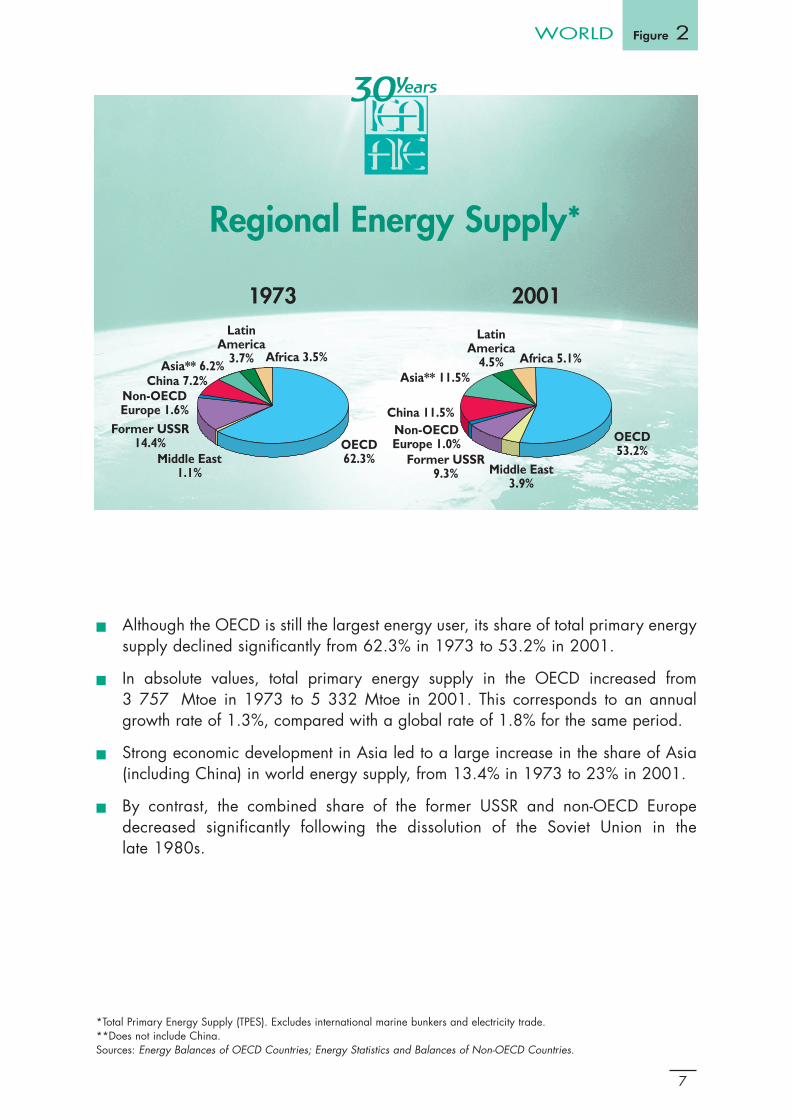
■ Although the OECD is still the largest energy user, its share of total primary energysupply declined significantly from 62.3% in 1973 to 53.2% in 2001.
■ In absolute values, total primary energy supply in the OECD increased from3 757 Mtoe in 1973 to 5 332 Mtoe in 2001. This corresponds to an annualgrowth rate of 1.3%, compared with a global rate of 1.8% for the same period.
■ Strong economic development in Asia led to a large increase in the share of Asia(including China) in world energy supply, from 13.4% in 1973 to 23% in 2001.
■ By contrast, the combined share of the former USSR and non-OECD Europedecreased significantly following the dissolution of the Soviet Union in thelate 1980s.
Regional Energy Supply*
7
1973 2001
Doc World 18/03/04 17:31 Page 7

■ World oil production increased by 44% over the same 30-year period from 1971to 2001, which experienced 84% growth in world total primary energy supply.In 2002, the production reached nearly 3 550 million tonnes or about 77 millionbarrels per day.
■ Growth was not constant over the period as production declined in the aftermathof two oil shocks.
■ In 2002, the Middle East region’s share of supply was 28.5% of the world total.However, both production and share varied significantly over the period, with theMiddle East representing 37% in 1973 falling to less than 19% in 1985.
■ The OECD share increased from roughly 24% in 1973 to nearly 28.5% in 2002,on par with the Middle East as the largest oil-producing regions in the world. Thedevelopment of oil production in both the North Sea and Mexico contributed tothis increase.
■ Meanwhile the share of the former Soviet Union fell from 15% in 1973 to 13%in 2002.
Regional Oil Production
8
WORLDFigure3
0
500
1 000
1 500
2 000
2 500
3 000
3 500
4 000
1971 1974 1977 1980 1983 1986 1989 1992 1995 1998 2001
Mt
*Does not include China.Sources: Energy Statistics and Balances of Non-OECD Countries; Oil Information.
OECD Total Middle East Former USSR Non-OECD Europe
China Asia* Latin America Africa
Doc World 18/03/04 17:31 Page 8

* Does not include China.Source: Natural Gas Information.
Figure4WORLD
■ World natural gas production in the 30 years from 1971 to 2001 increased at anannual average of 2.7%, compared to 2.1% growth in global TPES over the sameperiod. In 2002, global production exceeded 2 600 billion cubic meters (BCM),representing an increase of 136% over the 1971 level.
■ While OECD production over the period has risen in absolute terms, its shareof world production has decreased from nearly 73% in 1971 to just under 43%in 2002.
■ The former USSR and non-OECD Europe have provided the second largest shareof global natural gas production over the entire period, accounting for 22% in theearly 1970s and for 29% in 2002.
■ The main increase in the use of natural gas has been for power generation, whichwith an average annual increase of 4.3%, more than tripled over the period.
Regional Gas Production
9
0
500
1 000
1 500
2 000
2 500
3 000
1971 1974 1977 1980 1983 1986 1989 1992 1995 1998 2001
Bill
ion
Cub
ic M
etre
s
OECD Total Middle East Former USSR Non-OECD Europe
China Asia* Latin America Africa
Doc World 18/03/04 17:31 Page 9
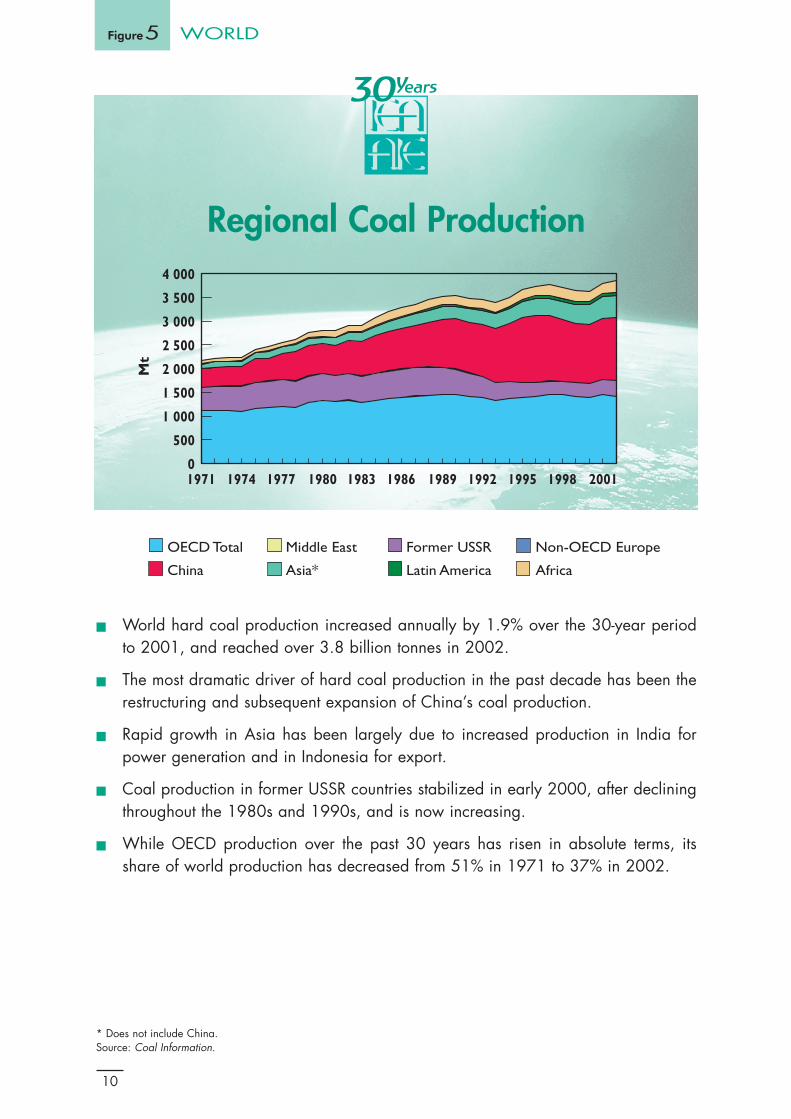
■ World hard coal production increased annually by 1.9% over the 30-year periodto 2001, and reached over 3.8 billion tonnes in 2002.
■ The most dramatic driver of hard coal production in the past decade has been therestructuring and subsequent expansion of China’s coal production.
■ Rapid growth in Asia has been largely due to increased production in India forpower generation and in Indonesia for export.
■ Coal production in former USSR countries stabilized in early 2000, after decliningthroughout the 1980s and 1990s, and is now increasing.
■ While OECD production over the past 30 years has risen in absolute terms, itsshare of world production has decreased from 51% in 1971 to 37% in 2002.
Regional Coal Production
10
WORLDFigure5
Mt
500
1 000
1 500
2 000
2 500
3 000
3 500
4 000
01971 1974 1977 1980 1983 1986 1989 1992 1995 1998 2001
* Does not include China.Source: Coal Information.
OECD Total Middle East Former USSR Non-OECD Europe
China Asia* Latin America Africa
Doc World 18/03/04 17:31 Page 10

■ Total renewables supply experienced annual growth of 2.1% from 1971 to 2000,almost identical to the annual growth in TPES. However, the “other” categorycomprising geothermal, solar, wind and tide recorded a much higher annualgrowth of over 9%.
■ The supply of combustible renewables is concentrated in non-OECD countries whereextensive use of wood and other biomass for cooking, heating and small industryis common.
■ Due to a very low 1971 base and to recent rapid development, wind energygeneration experienced the highest increase, over 52% per year followed by solarat over 32%.
■ The most rapid growth of non-combustible “other” renewables like solar and windenergy has occurred in OECD member countries where government policies havestimulated expansion of these energy sources.
Annual Growth of Renewables Supply
11
2.1% 2.1% 1.8%2.7%
9.4%
0%
2%
4%
6%
8%
10%
12%
TPES Renewables CRW* Hydro Other
annu
al g
row
th r
ate
52.1%
8.4%
Wind Tide, other
32.6%
SolarGeothermal
8.8%
WORLD Figure6
* Combustible renewables & waste.Source: Renewables Information.
Doc World 18/03/04 17:31 Page 11

Other** Natural gasOilCoal Nuclear Hydro
* Excludes pumped storage.** Includes geothermal, solar, wind and combustible renewables & waste.Sources: Energy Balances of OECD Countries; Energy Statistics and Balances of Non-OECD Countries.
■ World electricity generation rose at an average annual rate of 3.7% from 1971to 2001, greater than the 2.1% growth in total primary energy supply. Thisincrease was largely due to more electrical appliances, development of electricalheating in several developed countries and rural electrification programmes indeveloping countries.
■ The share of thermal electricity production has gradually fallen, from just under75% in 1971 to 65% in 2001. This decrease was due to a progressive moveaway from oil, which fell from over 21% to 7.5%.
■ Oil for power generation has been displaced in particular by dramatic growth innuclear electricity generation, which rose from 2% in 1971 to just over 17% in 2001.
■ The share of coal remained stable, near 38% while that of natural gas increasedfrom 13% to 18%.
■ The share of hydro-electricity decreased from 23% to 16.6%. The share of newand renewable energies, such as solar, wind and geothermal, grew but remainslimited. In 2001, it accounted for only 1.7% of total electricity production.
World Electricity Generation*
12
WORLDFigure7
0
2 000
4 000
6 000
8 000
10 000
12 000
14 000
16 000
TW
h
1971 1974 1977 1980 1983 1986 1989 1992 1995 1998 2001
Doc World 18/03/04 17:31 Page 12

■ The overall breakdown of world total final consumption by sector did not varygreatly over the 30 years.
■ Industry remains the main energy user. Its share fell, however, from 37.7% in 1973to 34% in 2001.
■ The share of transport rose from 24.2% in 1973 to just under 30% in 2001.
■ Other sectors (residential, services and agriculture) represent roughly one third of totalconsumption. Services are a growing component, especially in developed countries.
■ If biomass (which accounts for 11% of world total primary energy supply) wereincluded, the share of household consumption would be much larger, since woodand charcoal are used mainly for cooking in many developing countries.
13
Transport29.9%
Non-energyUse 3.3% Industry
34.0%Other sectors32.8%
Transport24.2%
Non-energyUse 3.6%
Other sectors34.5%
Industry37.7%
WORLD Figure8
* Excludes combustible renewables & waste.Sources: Energy Balances of OECD Countries; Energy Statistics and Balances of Non-OECD Countries.
1973 2001
Final Consumption* by Sector
Doc World 18/03/04 17:31 Page 13

■ World energy demand has continued to increase even while the efficiency of manyvehicles and energy-using appliances has improved. Both developed and developingcountries are responsible for the growth.
■ Improvements in energy efficiency in developed countries over the recent past did notlead to decreases in energy demand, because higher living standards have resultedin higher consumer expectations. For example, vehicle efficiency improved butconsumers chose to buy larger cars and drive more.
■ In developing countries, rural and urban electrification programmes, together withthe development of transport and industrialisation, led to a strong increase in energydemand. The increase in demand was often faster than the growth in population.
■ Energy intensities across countries and regions vary dramatically according to factorssuch as geography and climate, population density and growth, economic situationand growth, the energy mix and the country-specific factors.
14
WORLDFigure9
1971
=100
1971 1974 1977 1980 1983 1986 1989 1992 1995 1998 200160
80
100
120
140
160
180
200
* Total Primary Energy Supply.** Total Final Consumption.Sources: Energy Statistics and Balances of Non-OECD Countries.
TPES* TPES Per Capita TPES/GDP TFC**/GDP
Selected World Energy Indicators
Doc World 18/03/04 17:32 Page 14

*Emissions from fuel combustion only. Emissions are estimated using the IEA energy balances and the default methods and emissionfactors from the Revised 1996 IPCC Guidelines.** Does not include China.Source: CO2 Emissions from Fuel Combustion.
Figure10WORLD
■ Global emissions of carbon dioxide have risen by 68% since 1971. At the beginningof this period, the current OECD countries were responsible for 66% of the total.As a consequence of rapidly increasing emissions in the developing world, the OECDcontributed 53% to the total in 2001.
■ Two significant downturns can be seen in OECD CO2 emissions, following the oilshocks of the mid-1970s and early 1980s. Emissions from the economies in transitiondeclined over the last decade, helping to offset the OECD increases between 1990and the present. This decline did not stabilise global emissions as emissions indeveloping countries grew.
■ Disaggregating the emissions data shows substantial variations within individualsectors. In the early part of the period, electricity generation accounted for themajority of the increase. More recently, transport has been the fastest growing sectorin terms of emissions.
■ Fossil fuel shares in overall emissions changed slightly during the period. The relativeweight of coal in global emissions has remained at approximately 40% since the early1970s. The share of natural gas has increased from 14% in 1973 to 20% in 2001.Oil’s share decreased from 51% to 42%. Fuel switching and the increasing use of non-fossil energy sources reduced the CO2/TPES ratio by almost 9% over the past 30 years.
15
02 0004 0006 0008 000
10 00012 00014 00016 00018 00020 00022 00024 00026 000
Mill
ion
tonn
es o
f CO
2
1971 1974 1977 1980 1983 1986 1989 1992 1995 1998 2001
Bunkers
OECD Total Middle East Former USSR Non-OECD Europe
China Asia** Latin America Africa
Regional CO2 Emissions*
Doc World 18/03/04 17:32 Page 15

■ The 1973 OPEC oil embargo had a major price impact as Arabian Light pricessurged from $1.84/bbl in 1972 to $10.77 in 1974. The only other experience ofthis kind of dramatic rise in prices was during the period of the Iranian revolutionand the Iran-Iraq conflict.
■ The first spike after 1973 came in 1981, in the wake of the Iranian revolution, whenprices rose to an all-time high of nearly $40. Prices declined gradually after thiscrisis. They dropped considerably in 1986 when Saudi Arabia increased its oilproduction substantially.
■ The first Gulf crisis in 1990 brought a new peak. In 1997, crude oil prices startedto decline due to the impact of the Asian financial crisis.
■ Prices started to increase again in 1999 with OPEC target reductions andtightening stocks. A dip occurred in 2001 and 2002, but the expectation of war inIraq raised prices to over $30 in the first quarter of 2003. Prices remained high inthe latter part of 2003 and early 2004.
■ After the 1986 oil price decrease, the real price of crude oil has remainedrelatively stable.
Crude Oil Prices
16
WORLDFigure11
0
5
10
15
20
25
30
35
40
1970 1973 1976 1979 1982 1985 1988 1991 1994 1997 2000 2003
Iran-Iraq War
Iranian Revolution
OPEC Oil Embargo
Invasion of Kuwait
Second Gulf Crisis
OPEC TargetReductionsAsian Financial Crisis
End of Administrative
Pricing
USD
/bbl
Sources: Energy Prices and Taxes. 1970 - 1984 Arabian Light prices from the Oil Economists' Handbook. 1985 - 2003 Dubai M1(Adj) prices from Platts. Crude oil prices refer to the simple average of daily prices. Real prices are calculated using the GDPdeflator for GDP at market prices from OECD Economic Outlook N°74 that was rebased with base year 1970 = 100.
Nominal Price Real Price
Doc World 18/03/04 17:32 Page 16
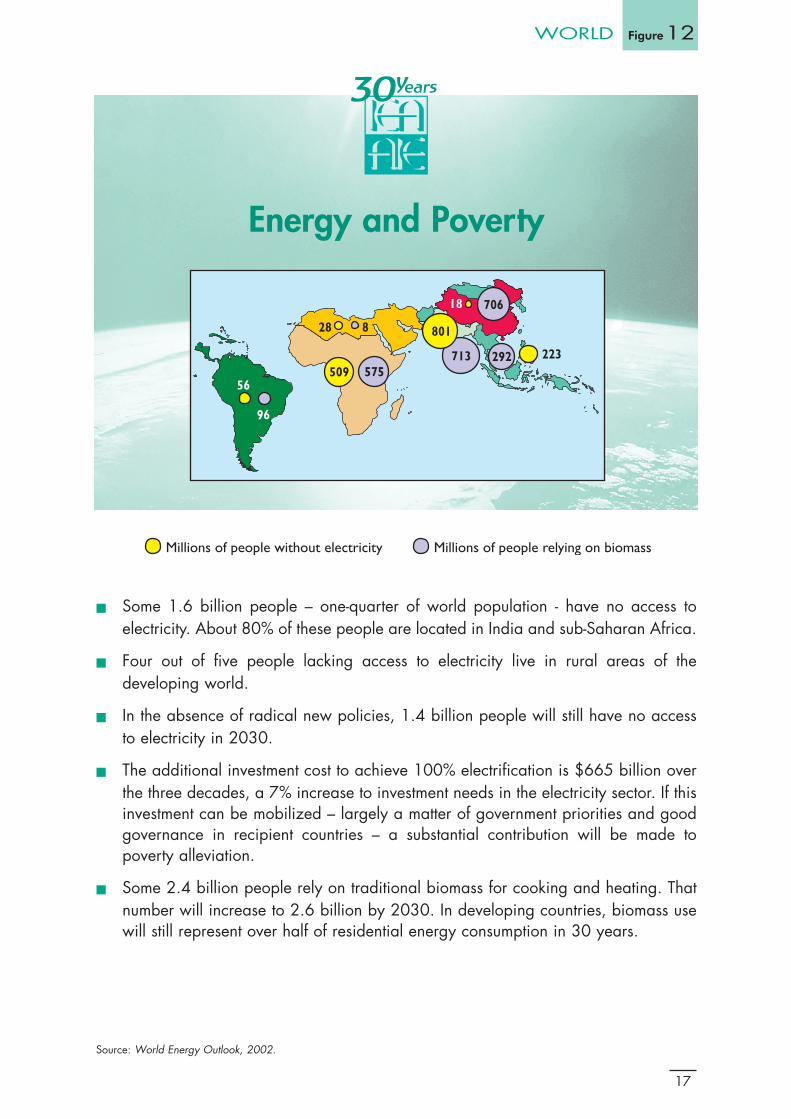
■ Some 1.6 billion people – one-quarter of world population - have no access toelectricity. About 80% of these people are located in India and sub-Saharan Africa.
■ Four out of five people lacking access to electricity live in rural areas of thedeveloping world.
■ In the absence of radical new policies, 1.4 billion people will still have no accessto electricity in 2030.
■ The additional investment cost to achieve 100% electrification is $665 billion overthe three decades, a 7% increase to investment needs in the electricity sector. If thisinvestment can be mobilized – largely a matter of government priorities and goodgovernance in recipient countries – a substantial contribution will be made topoverty alleviation.
■ Some 2.4 billion people rely on traditional biomass for cooking and heating. Thatnumber will increase to 2.6 billion by 2030. In developing countries, biomass usewill still represent over half of residential energy consumption in 30 years.
Energy and Poverty
17
28 8
575509
96
56
801
713
70618
223292
WORLD Figure12
Source: World Energy Outlook, 2002.
Millions of people without electricity Millions of people relying on biomass
Doc World 18/03/04 17:32 Page 17

■ Except during the two oil shocks in 1973 and the early 1980s, IEA energy supplyconstantly increased over the 30 years. IEA supply went up by 56%, lower than the84% observed globally.
■ Oil remains by far the major contributor to supply, even though its share fell from54% in 1973 to 41% in 2001. Oil supply peaked in 1978, and then fell by 19%from 1979 to 1983. Since then it has increased steadily. In 2001, it reached thehighest level yet, at over 2 060 Mtoe.
■ Since 1995, natural gas has become the second largest contributor, overtaking coalin the supply mix. In 2001, natural gas accounted for 21.4% and coal for 20.5%.
■ Nuclear energy experienced the largest growth both in absolute and relative terms:2001 nuclear production was twelve times larger than in 1973, and nuclearrepresented 11.6% of total supply in 2001.
■ The share of renewable energies (including hydro) remained around 6%.
IEA Energy Supply*
18
IEAFigure 13
Mto
e
0
1 000
2 000
3 000
4 000
5 000
6 000
1971 1974 1977 1980 1983 1986 1989 1992 1995 1998 2001
*Total Primary Energy Supply (TPES).**Includes geothermal, solar, wind and combustible renewables & waste, etc.Source: Energy Balances of OECD Countries.
Other**Natural gasOilCoal Nuclear Hydro
Doc IEA 19/03/04 15:16 Page 18
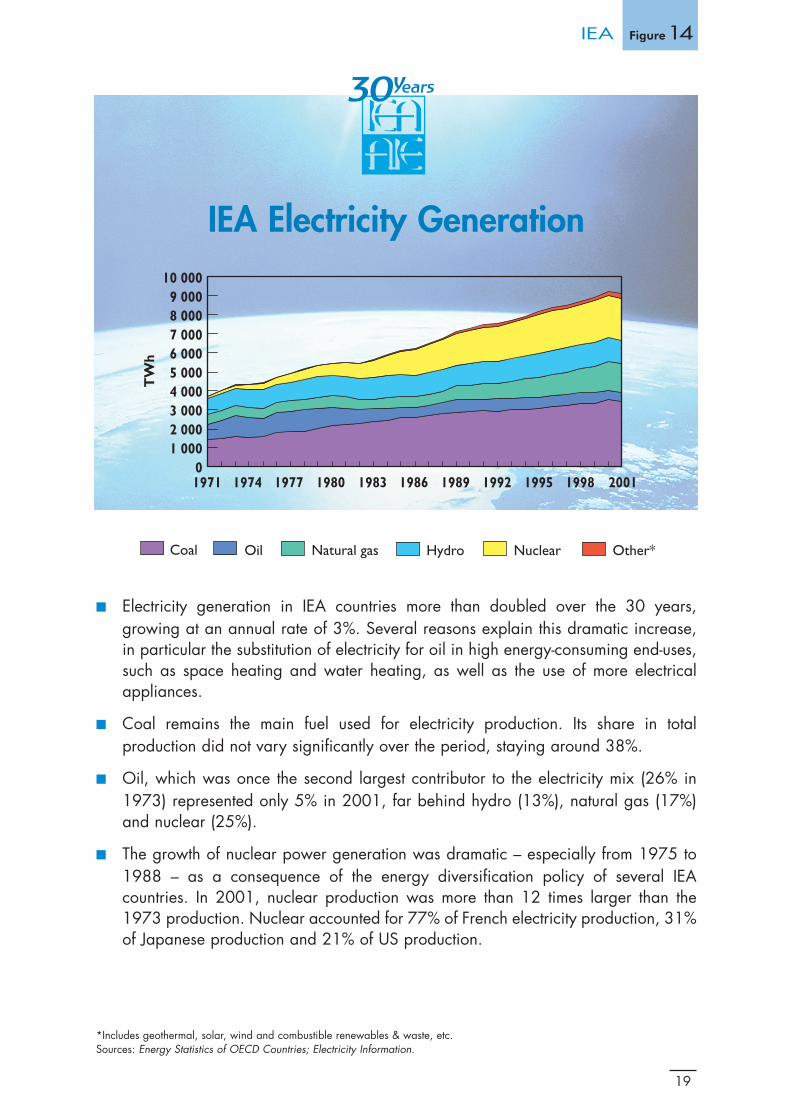
■ Electricity generation in IEA countries more than doubled over the 30 years,growing at an annual rate of 3%. Several reasons explain this dramatic increase,in particular the substitution of electricity for oil in high energy-consuming end-uses,such as space heating and water heating, as well as the use of more electricalappliances.
■ Coal remains the main fuel used for electricity production. Its share in totalproduction did not vary significantly over the period, staying around 38%.
■ Oil, which was once the second largest contributor to the electricity mix (26% in1973) represented only 5% in 2001, far behind hydro (13%), natural gas (17%)and nuclear (25%).
■ The growth of nuclear power generation was dramatic – especially from 1975 to1988 – as a consequence of the energy diversification policy of several IEAcountries. In 2001, nuclear production was more than 12 times larger than the1973 production. Nuclear accounted for 77% of French electricity production, 31%of Japanese production and 21% of US production.
IEA Electricity Generation
19
TW
h
01 0002 0003 0004 0005 0006 0007 0008 0009 000
10 000
1971 1974 1977 1980 1983 1986 1989 1992 1995 1998 2001
IEA Figure14
*Includes geothermal, solar, wind and combustible renewables & waste, etc.Sources: Energy Statistics of OECD Countries; Electricity Information.
Other*Natural gasOilCoal NuclearHydro
Doc IEA 19/03/04 15:16 Page 19

■ Net oil imports of IEA member countries in 2001 reached 1300 million tons (Mt),nearly the same level as in the late 1970s. In 1978, net imports accounted for 69%of IEA countries’ total oil supply, compared to 62% in 2002.
■ Net oil imports declined significantly in the late 1970s and early 1980s falling fromover 1 300 Mt in 1978 to a low of 847 Mt in 1985. Development of the oil fieldsin the North Sea and the substitution of other fuels for oil in electricity generationcontributed to this decline.
■ In 2002, IEA countries received 42% of their net imports from the Middle East,compared to 58% in 1978. The share of Africa remained fairly stable over theperiod, at just under 20%. Former USSR, as the third largest supplier in 2002,provided some 200 Mt, with its share increasing from 4.5% to over 15% over theperiod.
■ OPEC supplied the IEA with roughly 42% of its total oil imports in 2002, comparedto its high point of 70% in 1978.
IEA Oil Net Imports by Origin*
20
IEAFigure15
0
200
400
600
800
1 000
1 200
1 400
Mill
ion
met
ric
tonn
es
1978 1980 1982 1984 1986 1988 1990 1992 1994 1996 1998 2000 2002
* Oil is defined as crude oil, NGLs, feedstocks, and all finished petroleum products. Net imports are total IEA imports from aspecific region less IEA exports to the specific region.Source: Oil Information.
Non-IEA OECD
Latin America Africa
AsiaNon-OECD Europe Non specified/other
Former USSR Middle East
Doc IEA 19/03/04 15:16 Page 20

■ Between 1974 and 1980, the IEA’s minimum requirement for strategic oil stocksrose from the initial level of 60 days of net imports to 90 days for all netimporting member countries. Strategic stocks include both crude oil and refinedpetroleum products.
■ Stocks peaked in the mid-1980s at around 150 days of net imports. Since then,they have been falling steadily.
■ Total strategic stocks are comprised of both public (government and agency) andindustry stocks. Currently, about one third is public and two thirds are industry stocks.
■ With net imports likely to increase through the next decade, compliance withstock requirements will result in additional stock building; closer work with non-member countries on emergency response issues will also be necessary.
Strategic Stocks of IEAImporting Countries
21
0
20
40
60
80
100
120
140
160
1975 1979 1983 1987 1991 1995 1999 2002
Day
s of
Net
Impo
rts
Minimum IEA requirements
IEA Figure16
* Public stocks include stockholding agency and government stocks.Sources: Monthly Oil Statistics. IEA Emergency Reserve Issues, and regular reports to the IEA Standing Group on EmergencyQuestions (SEQ) on the emergency reserve situation.
Industry Public*
Doc IEA 19/03/04 15:16 Page 21

■ Historically, growth in energy demand relative to Gross Domestic Product in IEAcountries has differed according to sector.
■ Electricity demand has grown along with GDP. Energy input in electricity generationgrew in line with electricity demand.
■ Energy consumption in the transport sector has also increased as economies expanded.
■ In the case of stationary fossil fuel end uses, however, there were two periods ofdecline in energy consumption relative to GDP. These followed the 1973 and 1979oil shocks. Demand for stationary fossil fuel end uses was affected by the oil priceincreases, whereas electricity demand was not.
A Sectoral View of IEA Energy Demand
22
IEAFigure17
Mto
e
0
500
1 000
1 500
2 000
9 000 11 000 13 000 15 000 17 000 19 000 21 000 23 000
Transport
Electricity demand
Energy in electricitygeneration*
Stationary fossil fuelend uses
1971 2001
Gross domestic product in billion 1995 US dollars (purchasing power parities)
* Excludes autoproducers for the United States.Source: Energy Balances of OECD Countries.
Doc IEA 19/03/04 15:17 Page 22

■ IEA countries have achieved significant energy savings since the first oil price shock.These savings came as energy efficiency improved across most sectors and end uses.A recent IEA study estimates that without these savings final energy consumption in1998 in a group of eleven IEA countries* would have been 50% higher than itactually was.
■ Actual energy use, including the effect of energy savings grew only a modest 20%between 1973 and 1998, while without the savings the growth would have beenmore than 80% over the period.
■ However, the rates of energy savings have slowed significantly since the late 1980s.Both energy demand and CO2 emissions grew much faster after 1990 than before.
■ The slowing rates of energy savings indicate that the oil price shocks in the 1970sand the resulting energy policies did more to control growth in energy demand andCO2 emissions than energy efficiency and climate policies implemented in the 1990s.
Final Energy Demand and Savings
23
Actualenergy use
Additional energy use
without savings
0
500
1 000
1 500
2 000
2 500
3 000
3 500
4 000
1973 1976 1979 1982 1985 1988 1991 1994 1997
Mto
e
50%
IEA Figure18
* Australia, Denmark, Finland, France, Germany, Italy, Japan, Norway, Sweden, the UK and the US, together denoted IEA-11. Themethodology used for the IEA study requires time series going back to 1973 with detailed energy and activity data. IEA-11represents the countries for which these data were available. Together IEA-11 accounts for more than 80% of IEA total energydemand and thus the results shown for this group well represent the overall IEA development.Source: Oil Crises and Climate Challenges: 30 Years of Energy Use in IEA Countries, IEA/OECD 2004.
Doc IEA 19/03/04 15:17 Page 23

■ Sharp improvements in the efficiency of key end uses, shifts to electricity, and someshifts in manufacturing output and consumer behaviour occurred in many IEAcountries between 1971 and 2001. As a consequence, energy consumption (TFC)per unit of GDP fell significantly, particularly in the 1979-1990 period.
■ Contributing to the trend were higher fuel prices, long-term technological progress,government energy efficiency programmes and regulations. Overall growth in percapita GDP, combined with higher living standards and slow population growth,produced steadily rising demand after 1985.
■ The ratio of energy supply to economic growth (TPES/GDP) fell less than the ratioof energy consumption to economic growth (TFC/GDP), because of increased useof electricity. The main reason for this is that electricity generating losses outweighedintensity improvements achieved in end uses such as household appliances.
■ Among IEA countries, the ratio of energy consumption to GDP varies by as much asa factor of two. Apart from energy prices, winter weather is a key element in thesevariations, as are raw materials processing techniques, the distance goods must beshipped, home size and other lifestyle factors.
Selected IEA Energy Indicators
24
IEAFigure19
5060708090
100110120130140150160
1971
=100
1971 1974 1977 1980 1983 1986 1989 1992 1995 1998 2001
*TPES: Total Primary Energy Supply.** TFC: Total Final Consumption.Source: Energy Balances of OECD Countries.
TPES* TPES per capita TPES/GDP TFC**/GDP
Doc IEA 19/03/04 15:17 Page 24

■ For the group of 11 IEA countries (IEA-11), energy intensities** fell in all sectors since1973, but at different rates. The strongest decline came in manufacturing wherethe intensity fell by 41% over the 1973 to 1998 period. Generally the manufacturingoutput mix in most IEA countries shifted moderately towards less energy intensiveproducts. Together the energy intensity effect and the effect of structural changes reducedIEA-11 manufacturing energy use per value-added by 50% between 1973 and 1998.
■ The service and household sectors trailed manufacturing in terms of total intensityreductions, with slightly stronger reductions than the average for the whole economy.
■ Freight and passenger transport have pulled up the average economy-wide intensityeffect. Although individual trucks have become more efficient, the energy intensitydecline per tonne-km is modest due to a trend towards trucks carrying lighter goods.Similarly, major improvements were made to engines and other car components, butthese were largely offset by heavier and more powerful cars for passenger travel.
■ The rate of intensity decline has slowed in all sectors since the late 1980s. Theintensity effect for the whole economy declined by as much as 2.0% per year onaverage between 1973 and 1990. After 1990, the decline rate was down to only0.7% per year. This tendency of slowing energy savings rates is confirmed acrossmost sectors when more recent data are available.
Energy Intensity Effectsby End-Use Sector*
25
50%
60%
70%
80%
90%
100%
110%
1973 1975 1977 1979 1981 1983 1985 1987 1989 1991 1993 1995 19971973
Ene
rgy
inte
nsit
y ef
fect
s =
100%
IEA Figure20
* For IEA-11: Australia, Denmark, Finland, France, Germany, Italy, Japan, Norway, Sweden, the UK and the US. ** The energy intensities in the figure represent the weighted sums of disaggregated intensities for each sector.Source: Oil Crises and Climate Challenges: 30 Years of Energy Use in IEA Countries, IEA/OECD 2004.
Freight transport Passenger travel Total economy
Service Households Manufacturing
Doc IEA 19/03/04 15:17 Page 25
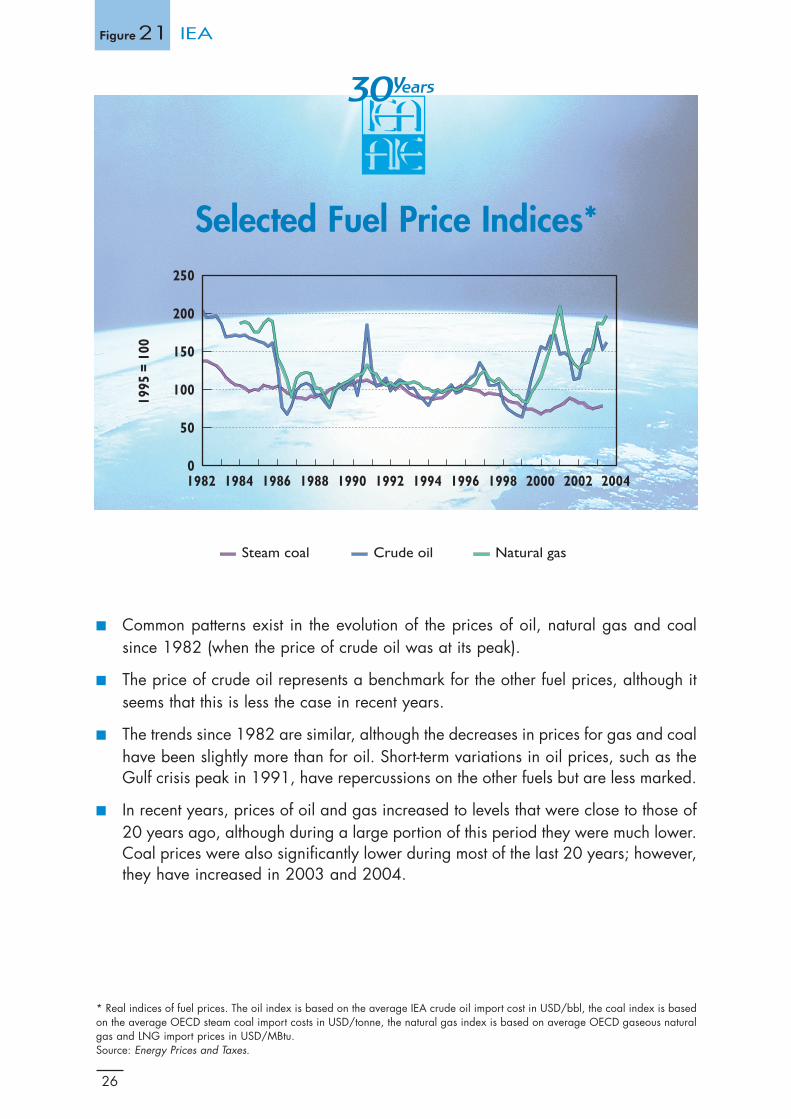
■ Common patterns exist in the evolution of the prices of oil, natural gas and coalsince 1982 (when the price of crude oil was at its peak).
■ The price of crude oil represents a benchmark for the other fuel prices, although itseems that this is less the case in recent years.
■ The trends since 1982 are similar, although the decreases in prices for gas and coalhave been slightly more than for oil. Short-term variations in oil prices, such as theGulf crisis peak in 1991, have repercussions on the other fuels but are less marked.
■ In recent years, prices of oil and gas increased to levels that were close to those of20 years ago, although during a large portion of this period they were much lower.Coal prices were also significantly lower during most of the last 20 years; however,they have increased in 2003 and 2004.
Selected Fuel Price Indices*
26
IEAFigure21
0
50
100
150
200
250
1982 1984 1986 1988 1990 1992 1994 1996 1998 2000 2002 2004
1995
= 1
00
* Real indices of fuel prices. The oil index is based on the average IEA crude oil import cost in USD/bbl, the coal index is basedon the average OECD steam coal import costs in USD/tonne, the natural gas index is based on average OECD gaseous naturalgas and LNG import prices in USD/MBtu.Source: Energy Prices and Taxes.
Steam coal Crude oil Natural gas
Doc IEA 19/03/04 15:17 Page 26
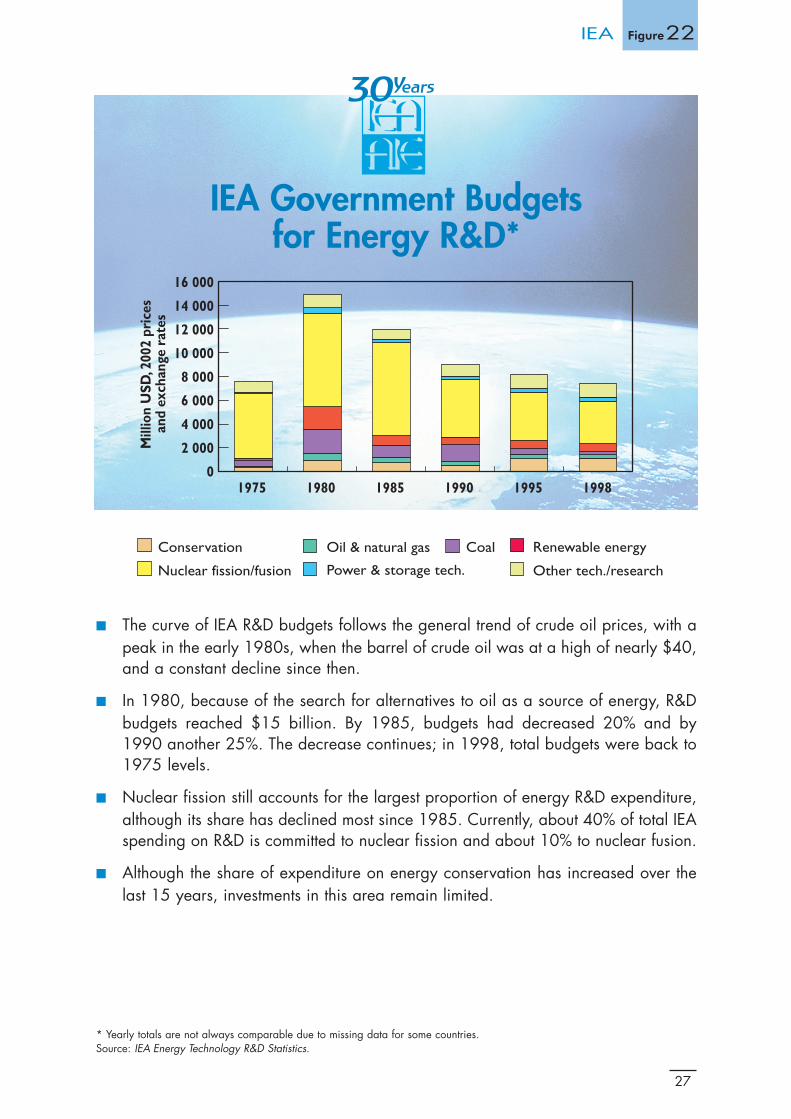
■ The curve of IEA R&D budgets follows the general trend of crude oil prices, with apeak in the early 1980s, when the barrel of crude oil was at a high of nearly $40,and a constant decline since then.
■ In 1980, because of the search for alternatives to oil as a source of energy, R&Dbudgets reached $15 billion. By 1985, budgets had decreased 20% and by1990 another 25%. The decrease continues; in 1998, total budgets were back to1975 levels.
■ Nuclear fission still accounts for the largest proportion of energy R&D expenditure,although its share has declined most since 1985. Currently, about 40% of total IEAspending on R&D is committed to nuclear fission and about 10% to nuclear fusion.
■ Although the share of expenditure on energy conservation has increased over thelast 15 years, investments in this area remain limited.
IEA Government Budgetsfor Energy R&D*
27
0
2 000
4 000
6 000
8 000
10 000
12 000
14 000
16 000
1975 1980 1985 1990 1995 1998
Mill
ion
USD
, 200
2 pr
ices
and
exch
ange
rat
es
IEA Figure22
* Yearly totals are not always comparable due to missing data for some countries.Source: IEA Energy Technology R&D Statistics.
Conservation Oil & natural gas Coal Renewable energy
Nuclear fission/fusion Power & storage tech. Other tech./research
Doc IEA 19/03/04 15:17 Page 27

■ Unless governments introduce new energy policies, growth in world energyproduction and consumption in the next three decades is projected to be 65%higher than the growth in the past 30 years.
■ There will be a pronounced shift in the geographical sources of incremental energysupplies over the next three decades in response to a combination of cost,geological and technical factors.
■ Almost all growth in energy production over the next 30 years will come from non-OECD countries.
■ More than 70% of energy demand growth over the next three decades will comefrom outside the OECD.
Increase in World EnergyProduction and Consumption
28
OUTLOOKFigure 23
0
1 000
2 000
3 000
4 000
5 000
6 000
7 000
Production Consumption Production Consumption
Mto
e
1971-2000 2001-2030
Source: World Energy Investment Outlook, 2003 Insights.
OECD Transition economies Developing countries
Doc Outlook 19/03/04 15:15 Page 28

29
OUTLOOK Figure 24
* Total Primary Energy Supply (TPES).** Includes bunkers.Source: World Energy Outlook, 2002.
■ Without policy changes, world energy demand is projected to increase steadilyat 1.7% per year through 2030, less than the 2.1% annual growth over the past30 years.
■ In that event, fossil fuels will remain the primary sources of energy and will meet90% of the increase in demand to 2030.
■ Among fossil fuels, natural gas will grow fastest, but oil will remain the mostimportant energy source. Oil demand will increase from 75 mb/d in 2000 to120 mb/d in 2030. Coal, which remains important in power generation becauseof its low cost, will still account for 24% of TPES.
■ Renewables will grow in importance, while the share of nuclear power in worldenergy supply will drop.
0
2 000
4 000
6 000
8 000
10 000
12 000
14 000
16 000
2000 2005 2010 2015 2020 2025 2030
Mto
e
Other renewablesNatural gasOil**Coal Nuclear Hydro
World Primary EnergyDemand* Outlook
Doc Outlook 19/03/04 15:15 Page 29

30
OUTLOOKFigure 25
■ A structural shift in the shares of different regions in world energy demand is likelyto occur between now and 2030 with the OECD share of world energy demandfalling from 58% in 2000 to 47% in 2030.
■ More than 62% of the increase in world primary energy demand between 2000and 2030 will come from the developing countries, particularly Asia.
■ The increase in demand for China represents about a fifth of the total increase inworldwide demand from 2000 to 2030. As an example, demand for oil in Chinawill be double that of Japan by 2030. The total share of Asia – including China –will amount to 27% in 2030.
■ The increase in the share of the developing regions in world energy demand resultsfrom their rapid economic and population growth, industrialisation andurbanisation. The replacement of non-commercial biomass by commercial fuels willalso help to boost demand.
Regional Primary EnergyDemand* Outlook
0
2 000
4 000
6 000
8 000
10 000
12 000
14 000
16 000
2000 2010 2020 2030
Mto
e
* Total Primary Energy Supply (TPES).** Includes Former USSR and Non-OECD Europe.Source: World Energy Outlook, 2002.
OECD Middle East Transition economies**
Bunkers Latin America Africa Other Asia
China
Doc Outlook 19/03/04 15:15 Page 30

■ A significant regional shift is likely to occur between now and 2030 in world oildemand with the majority of the growth in developing countries, particularly Asia.
■ Oil import dependence is expected to increase in all major oil consumingregions. OECD increases will come from a combination of oil consumptiongrowth and depletion of indigenous oil reserves in the United Kingdom, Norwayand North America.
■ Concerning natural gas import dependency, the biggest markets - particularlyNorth America and Europe - will become much more dependent on importsbetween now and 2030.
■ Asia will see the largest growth in import dependence. India and China will importaround 90% of their oil requirements by 2030.
■ Oil supply security is becoming an important political issue in Asia. Governmentsin both India and China have agreed to establish strategic oil reserves.
■ OECD’s share of global oil demand will decline significantly from 60% in 2000 to48% in 2030.
31
OUTLOOK Figure 26
Source: World Energy Outlook, 2002.
Global Oil Import Dependency
0
20
40
60
80
100
OECDPacific
OECDEurope
OECDN. America
SouthAsia
China East Asia
Net
Impo
rts
as %
of O
il Su
pply
20102000 2030
Doc Outlook 19/03/04 15:16 Page 31

■ Projections through the year 2030 show a continuing increase in global carbondioxide emissions, if no new policies and measures are put in place. Under thisscenario, emissions are projected to grow by 69%, slightly more than the growthof 66% in energy supply. The most rapid increases are seen as occurring inNon-OECD countries, where emissions will more than double over the period.
■ The share of OECD emissions in total emissions will decrease from 54% in 2000 to42% in 2030. Meanwhile, China’s share alone will increase from 13% to 17%.
■ Power generation, which currently accounts for around 40% of the emissions willcontribute almost half the increase (or 8 billion tonnes) in global emissions between2000 and 2030. Transport will account for more than a quarter, residential,commercial and industrial sectors for the rest.
■ The average carbon content of energy – CO2 emissions per unit of aggregateprimary energy consumption – will increase over the next 30 years. The main causeof this reversal will be the declining share of nuclear and hydro power in the globalenergy mix.
32
OUTLOOKFigure 27
Source: World Energy Outlook, 2002.
CO2 Emissions Outlook
0
5 00010 00015 00020 00025 00030 00035 00040 00045 000
Mill
ion
tonn
es o
f CO
2
2000 2005 2010 2015 2020 2025 2030
OECD
Bunkers Latin America Africa Other Asia
China Transition economiesMiddle East
Doc Outlook 19/03/04 15:16 Page 32

■ More than $16 trillion, or $550 billion a year, needs to be invested in energy-supplyinfrastructure worldwide over the three decades to 2030, an amount equal to 1% ofprojected gross domestic product.
■ The electricity sector alone will need to spend almost $10 trillion to meet a projecteddoubling of world electricity demand, accounting for 60% of total energy investment.If the investments in the oil, gas and coal industries that are needed to supply fuel topower stations are included, this share reaches more than 70%. Transmission anddistribution will account for more than power production.
■ Total investments in the oil and gas sectors will each amount to more than$3 trillion, or around 19% of global energy investment. Coal investment will be almost$400 billion, or 2%.
■ For the energy sector as a whole, 51% of investment in production will be simply to replaceexisting and future capacity. The rest will be needed to meet the increase in demand.
■ Almost half of total energy investment will take place in developing countries, whereproduction and demand are expected to increase most.
■ In today’s liberalised energy markets – in which financing energy projects is increasinglythe role of the private sector – governments must act to create the right enabling conditions.
33
OUTLOOK Figure28
* Exploration and development.** Transmission and distribution.Source: World Energy Investment Outlook, 2003 Insights.
Investment Needs inthe Energy Sector
Total investment: 16 trillion dollars
Oil19%
Electricity60%
Coal2%
Gas19%
E&D*
LNG Chain
T&D** andStorage
55%
37%
8%
Powergeneration
T&D**54%
46%
Mining
Shipping and ports
12%
88%
Refining
E&D* 72%
13%15%Other
Doc Outlook 19/03/04 15:16 Page 33
34
INDICATORS Figure 29
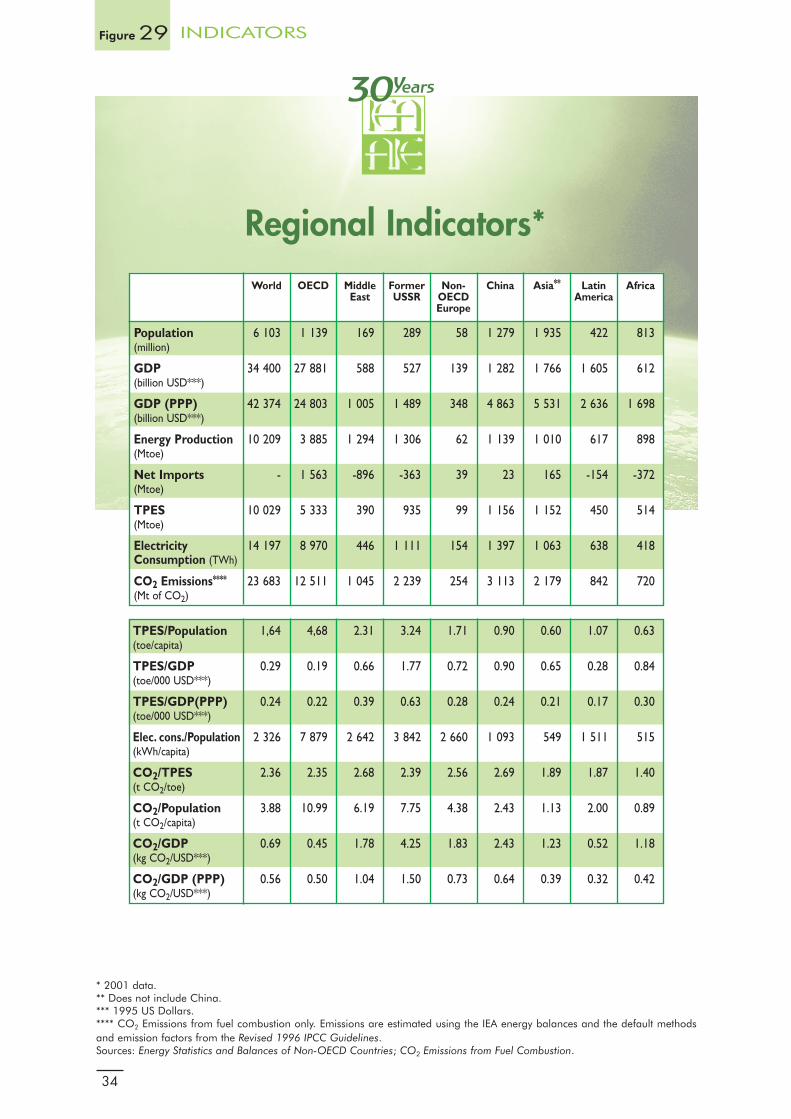
Regional Indicators*
* 2001 data.** Does not include China.*** 1995 US Dollars.**** CO2 Emissions from fuel combustion only. Emissions are estimated using the IEA energy balances and the default methodsand emission factors from the Revised 1996 IPCC Guidelines. Sources: Energy Statistics and Balances of Non-OECD Countries; CO2 Emissions from Fuel Combustion.
World OECD Middle Former Non- China Asia** Latin Africa East USSR OECD America
Europe
Population 6 103 1 139 169 289 58 1 279 1 935 422 813(million)
GDP 34 400 27 881 588 527 139 1 282 1 766 1 605 612(billion USD***)
GDP (PPP) 42 374 24 803 1 005 1 489 348 4 863 5 531 2 636 1 698(billion USD***)
Energy Production 10 209 3 885 1 294 1 306 62 1 139 1 010 617 898(Mtoe)
Net Imports - 1 563 -896 -363 39 23 165 -154 -372(Mtoe)
TPES 10 029 5 333 390 935 99 1 156 1 152 450 514(Mtoe)
Electricity 14 197 8 970 446 1 111 154 1 397 1 063 638 418Consumption (TWh)
CO2 Emissions**** 23 683 12 511 1 045 2 239 254 3 113 2 179 842 720(Mt of CO2)
TPES/Population 1,64 4,68 2.31 3.24 1.71 0.90 0.60 1.07 0.63(toe/capita)
TPES/GDP 0.29 0.19 0.66 1.77 0.72 0.90 0.65 0.28 0.84(toe/000 USD***)
TPES/GDP(PPP) 0.24 0.22 0.39 0.63 0.28 0.24 0.21 0.17 0.30(toe/000 USD***)
Elec. cons./Population 2 326 7 879 2 642 3 842 2 660 1 093 549 1 511 515(kWh/capita)
CO2/TPES 2.36 2.35 2.68 2.39 2.56 2.69 1.89 1.87 1.40(t CO2/toe)
CO2/Population 3.88 10.99 6.19 7.75 4.38 2.43 1.13 2.00 0.89(t CO2/capita)
CO2/GDP 0.69 0.45 1.78 4.25 1.83 2.43 1.23 0.52 1.18(kg CO2/USD***)
CO2/GDP (PPP) 0.56 0.50 1.04 1.50 0.73 0.64 0.39 0.32 0.42(kg CO2/USD***)
Doc Indicators 19/03/04 10:28 Page 34
35
INDICATORS Figure 30
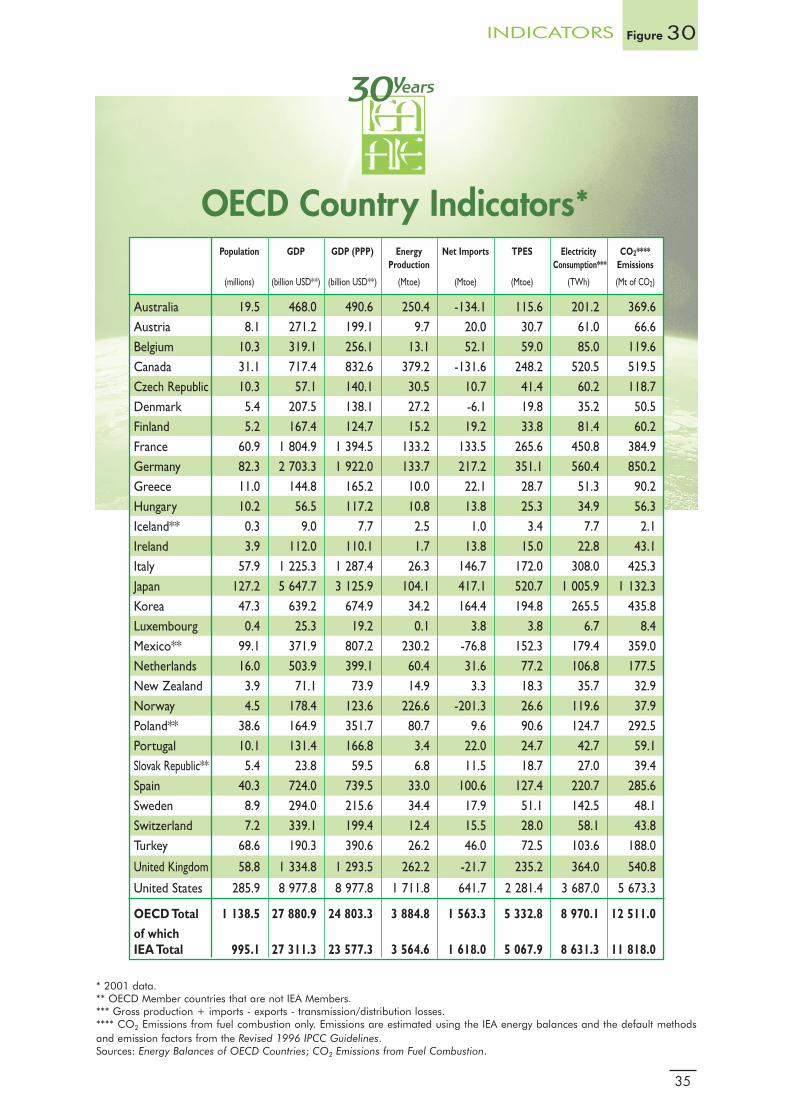
OECD Country Indicators*
* 2001 data.** OECD Member countries that are not IEA Members.*** Gross production + imports - exports - transmission/distribution losses.**** CO2 Emissions from fuel combustion only. Emissions are estimated using the IEA energy balances and the default methodsand emission factors from the Revised 1996 IPCC Guidelines. Sources: Energy Balances of OECD Countries; CO2 Emissions from Fuel Combustion.
Population GDP GDP (PPP) Energy Net Imports TPES Electricity CO2****Production Consumption*** Emissions
(millions) (billion USD**) (billion USD**) (Mtoe) (Mtoe) (Mtoe) (TWh) (Mt of CO2)
Australia 19.5 468.0 490.6 250.4 -134.1 115.6 201.2 369.6Austria 8.1 271.2 199.1 9.7 20.0 30.7 61.0 66.6Belgium 10.3 319.1 256.1 13.1 52.1 59.0 85.0 119.6Canada 31.1 717.4 832.6 379.2 -131.6 248.2 520.5 519.5Czech Republic 10.3 57.1 140.1 30.5 10.7 41.4 60.2 118.7Denmark 5.4 207.5 138.1 27.2 -6.1 19.8 35.2 50.5Finland 5.2 167.4 124.7 15.2 19.2 33.8 81.4 60.2France 60.9 1 804.9 1 394.5 133.2 133.5 265.6 450.8 384.9Germany 82.3 2 703.3 1 922.0 133.7 217.2 351.1 560.4 850.2Greece 11.0 144.8 165.2 10.0 22.1 28.7 51.3 90.2Hungary 10.2 56.5 117.2 10.8 13.8 25.3 34.9 56.3Iceland** 0.3 9.0 7.7 2.5 1.0 3.4 7.7 2.1Ireland 3.9 112.0 110.1 1.7 13.8 15.0 22.8 43.1Italy 57.9 1 225.3 1 287.4 26.3 146.7 172.0 308.0 425.3Japan 127.2 5 647.7 3 125.9 104.1 417.1 520.7 1 005.9 1 132.3Korea 47.3 639.2 674.9 34.2 164.4 194.8 265.5 435.8Luxembourg 0.4 25.3 19.2 0.1 3.8 3.8 6.7 8.4Mexico** 99.1 371.9 807.2 230.2 -76.8 152.3 179.4 359.0Netherlands 16.0 503.9 399.1 60.4 31.6 77.2 106.8 177.5New Zealand 3.9 71.1 73.9 14.9 3.3 18.3 35.7 32.9Norway 4.5 178.4 123.6 226.6 -201.3 26.6 119.6 37.9Poland** 38.6 164.9 351.7 80.7 9.6 90.6 124.7 292.5Portugal 10.1 131.4 166.8 3.4 22.0 24.7 42.7 59.1Slovak Republic** 5.4 23.8 59.5 6.8 11.5 18.7 27.0 39.4Spain 40.3 724.0 739.5 33.0 100.6 127.4 220.7 285.6Sweden 8.9 294.0 215.6 34.4 17.9 51.1 142.5 48.1Switzerland 7.2 339.1 199.4 12.4 15.5 28.0 58.1 43.8Turkey 68.6 190.3 390.6 26.2 46.0 72.5 103.6 188.0
United Kingdom 58.8 1 334.8 1 293.5 262.2 -21.7 235.2 364.0 540.8
United States 285.9 8 977.8 8 977.8 1 711.8 641.7 2 281.4 3 687.0 5 673.3
OECD Total 1 138.5 27 880.9 24 803.3 3 884.8 1 563.3 5 332.8 8 970.1 12 511.0of which IEA Total 995.1 27 311.3 23 577.3 3 564.6 1 618.0 5 067.9 8 631.3 11 818.0
Doc Indicators 19/03/04 10:28 Page 35

Garde + Page2 16/03/04 17:01 Page 2

INTERNATIONAL ENERGY AGENCY9, rue de la Fédération - 75739 Paris Cedex 15
www.iea.org
INTERNATIONAL ENERGY AGENCY9, rue de la Fédération - 75739 Paris Cedex 15
Couv WEB 16/03/04 17:33 Page 2