21. in situ stress at the cÔte d ivoire-ghana marginal
TRANSCRIPT
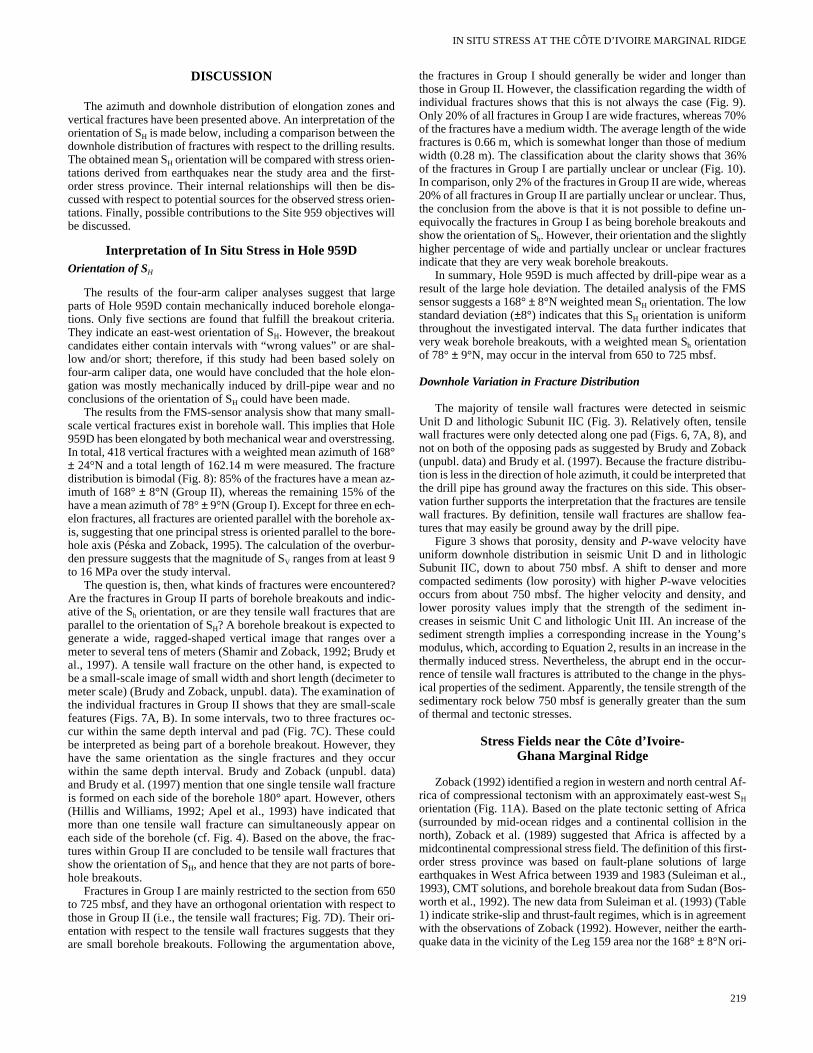
Mascle, J., Lohmann, G.P., and Moullade, M. (Eds.), 1998Proceedings of the Ocean Drilling Program, Scientific Results, Vol. 159
betweenllel to thestrate a
ises thele distrore, theive margin
orizon- thems froms the sted thatld in
21. IN SITU STRESS AT THE CÔTE D’IVOIRE-GHANA MARGINAL RIDGEFROM FMS LOGGING IN HOLE 959D 1
Maria Ask2
ABSTRACT
The orientation of the in situ stress between 550 and 925 meters below seafloor in Hole 959D has been derived from theanalysis of caliper and electrical images of Formation MicroScanner data. Because of a high hole deviation (5°−13°), drill pipewear has enlarged the hole in a northerly direction. As a result, the four-arm caliper analyses cannot distinguish mechanically and stress induced borehole elongations. The FMS data show that one of the principal stresses is paraborehole axis and that mainly tensile wall fractures have formed in the borehole wall. The tensile wall fractures demon168° ± 8°N weighted mean orientation of the maximum horizontal stress. The upper 750 mbsf of the borehole comprmajority of the tensile wall fractures, whereas they only occur sporadically below this depth. The change in the downhoi-bution of fractures coincides with the transition from weaker to more compacted, stronger sedimentary rock. Furthermintegration of seismic and physical properties data suggests that this depth corresponds to the boundary between passevolution and continent/ocean transform faulting.
The orientation of the maximum horizontal stress in Hole 959D is almost perpendicular to the east-west maximum htal stress orientation of the first-order stress province in western and north central Africa. Through comparisons with (1) ori-entations of the maximum horizontal stress in Hole 959D, (2) the maximum horizontal stress of three focal mechanisearthquakes in Ghana, and (3) the strike of the continental margin, it is suggested that lateral strength contrasts acrosCôted’Ivoire-Ghana Transform Margin are the most probable source for the observed stress orientations. It is further suggesediment loading and lateral variation in crustal thickness and density may only have a minor influence on the stress fiethisarea.
tinks Our m
ariv(F
Cos
helateod
mtur thoR
sit
top M
o-es.e ar-rm-es).andtion
gs.e so-o-alisturb
po- nearria-asts.ituCIGe-
be-r is,
pectsed-
fri-dis-(Zo-
ly re-
INTRODUCTION
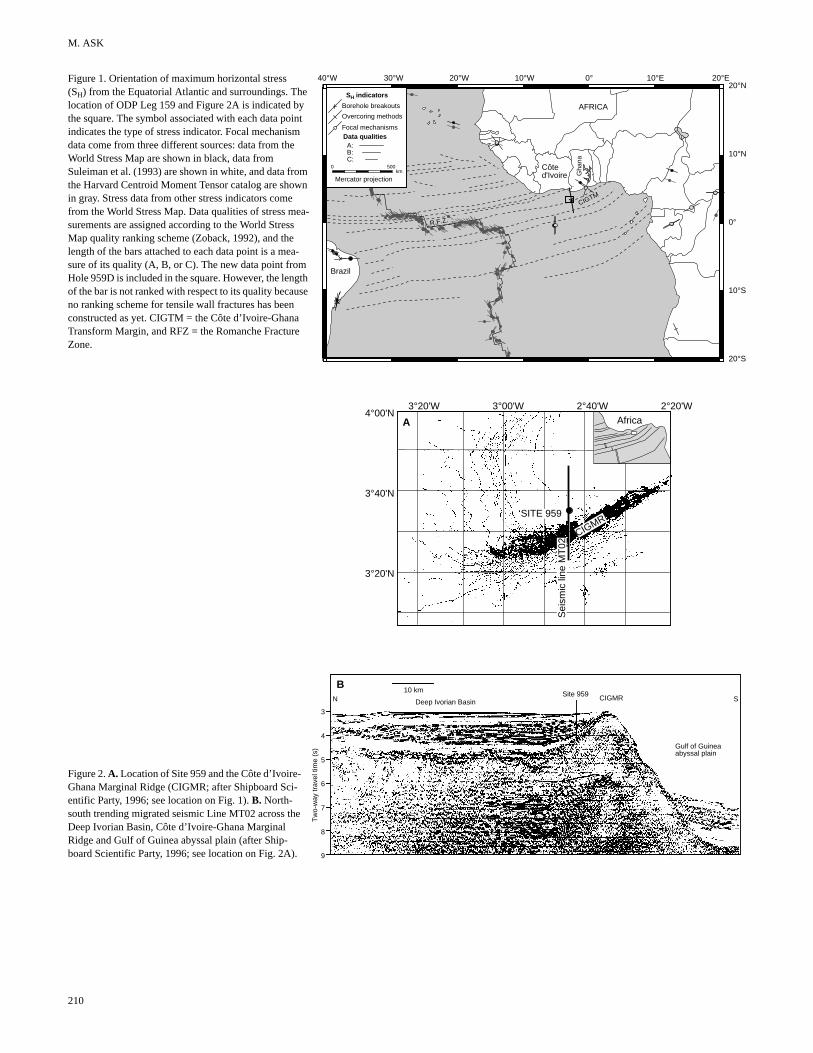
The Côte d’Ivoire-Ghana (CIG) Transform Margin was invesgated during Ocean Drilling Program (ODP) Leg 159 (Fig. 1). Traform faults are the third major category of plate boundaries (Isacal., 1968), and they occur in both continental and oceanic crust.objective of Leg 159 was to understand better the different structthermal, and sedimentary processes that operate at the transformgin.
The morphology and structure of the CIG Transform Margin well known from several geophysical cruises and submarine d(cf. Mascle et al., 1996). Two main features have been identified 2): (1) the continent-ocean transition is steep and narrow (20−30 km),and (2) the transform margin is bounded by the well-expressed d’Ivoire-Ghana Marginal Ridge (CIGMR) that is the southernmpart of the continental domain. The northern flank of the CIGMRfilled with sediments of the Deep Ivorian Basin, whereas its soutflank towers by about 3000 m over the Gulf of Guinea Abyssal P(Fig. 2B). Both the Deep Ivorian Basin and CIGMR were generaas a consequence of Early Cretaceous rifting of the northern SAtlantic. The CIGMR is believed to have been influenced by adtional tectonic and thermal processes related to syn-transformtion. The CIGMR connects laterally with the Romanche FracZone, which offsets the Mid-Atlantic Ridge by 945 km and wheretransform motion still is active. Site 959 is situated in southernmDeep Ivorian Basin, about 3 km north of the crest of the CIGMThis study is mainly devoted to investigating the orientation of in stress in Hole 959D.
The orientation of in situ stress in the lithosphere is due superposition of local, regional, and global stress sources. Comtions of global and regional stress data, such as the World Stress
1Mascle, J., Lohmann, G.P., and Moullade, M. (Eds.), 1998. Proc. ODP, Sci.Results, 159: College Station, TX (Ocean Drilling Program).
2Engineering Geology, Royal Institute of Technology, S-100 44 Stockholm, Swe-den. [email protected]
-s- etneal,
ar-
eesig.
ôtet
isrnind
uthi-o-eest.u
aila-
ap
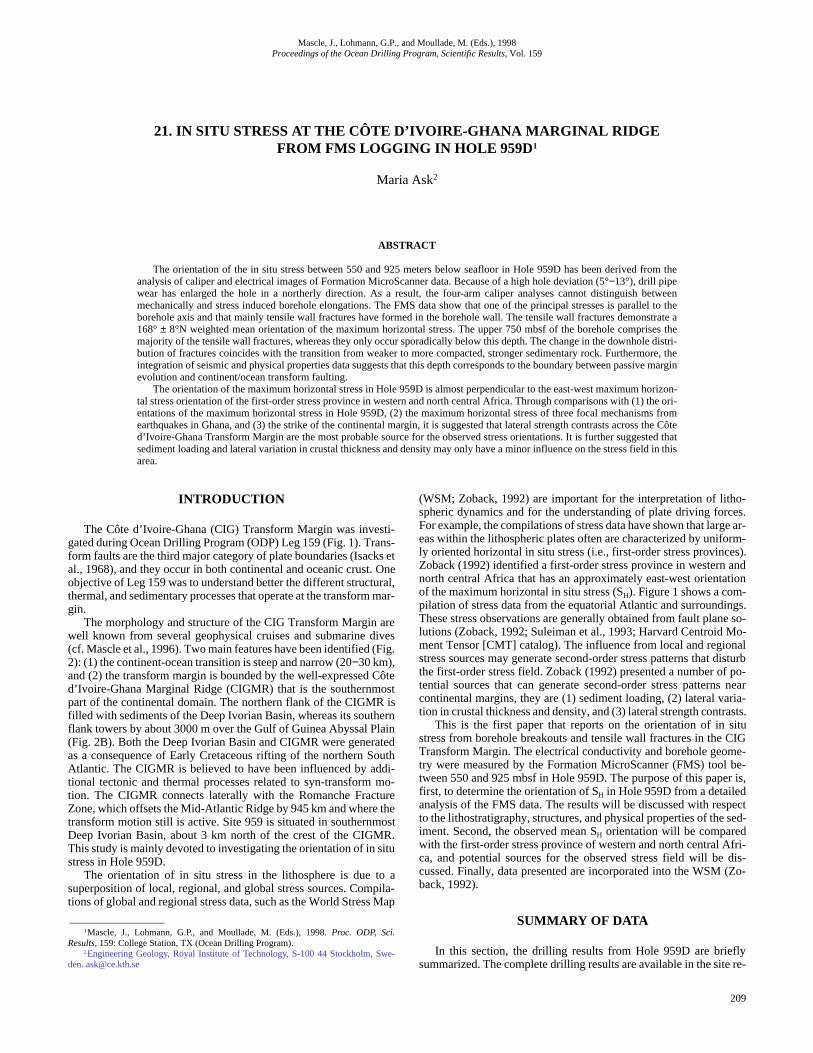
(WSM; Zoback, 1992) are important for the interpretation of lithspheric dynamics and for the understanding of plate driving forcFor example, the compilations of stress data have shown that largeas within the lithospheric plates often are characterized by unifoly oriented horizontal in situ stress (i.e., first-order stress provincZoback (1992) identified a first-order stress province in western north central Africa that has an approximately east-west orientaof the maximum horizontal in situ stress (SH). Figure 1 shows a com-pilation of stress data from the equatorial Atlantic and surroundinThese stress observations are generally obtained from fault planlutions (Zoback, 1992; Suleiman et al., 1993; Harvard Centroid Mment Tensor [CMT] catalog). The influence from local and regionstress sources may generate second-order stress patterns that dthe first-order stress field. Zoback (1992) presented a number oftential sources that can generate second-order stress patternscontinental margins, they are (1) sediment loading, (2) lateral vation in crustal thickness and density, and (3) lateral strength contr
This is the first paper that reports on the orientation of in sstress from borehole breakouts and tensile wall fractures in the Transform Margin. The electrical conductivity and borehole geomtry were measured by the Formation MicroScanner (FMS) tool tween 550 and 925 mbsf in Hole 959D. The purpose of this papefirst, to determine the orientation of SH in Hole 959D from a detailedanalysis of the FMS data. The results will be discussed with resto the lithostratigraphy, structures, and physical properties of the iment. Second, the observed mean SH orientation will be comparedwith the first-order stress province of western and north central Aca, and potential sources for the observed stress field will be cussed. Finally, data presented are incorporated into the WSM back, 1992).
SUMMARY OF DATA
In this section, the drilling results from Hole 959D are briefsummarized. The complete drilling results are available in the site
209
M. ASK
Borehole breakouts
Overcoring methods
Focal mechanisms
SH indicators
A:B:C:
Mercator projectionkm
5000
40°W 30°W 20°W 10°W 0° 20°E10°E20°N
10°N
0°
10°S
20°S
R.F.Z.
Brazil
Gha
na
Côted'Ivoire
AFRICA
CIGTM
Data qualities
Figure 1. Orientation of maximum horizontal stress (SH) from the Equatorial Atlantic and surroundings. The location of ODP Leg 159 and Figure 2A is indicated by the square. The symbol associated with each data point indicates the type of stress indicator. Focal mechanism data come from three different sources: data from the World Stress Map are shown in black, data from Suleiman et al. (1993) are shown in white, and data from the Harvard Centroid Moment Tensor catalog are shown in gray. Stress data from other stress indicators come from the World Stress Map. Data qualities of stress mea-surements are assigned according to the World Stress Map quality ranking scheme (Zoback, 1992), and the length of the bars attached to each data point is a mea-sure of its quality (A, B, or C). The new data point from Hole 959D is included in the square. However, the length of the bar is not ranked with respect to its quality because no ranking scheme for tensile wall fractures has been constructed as yet. CIGTM = the Côte d’Ivoire-Ghana Transform Margin, and RFZ = the Romanche Fracture Zone.
SITE 959
AfricaA
3°20'W 3°00'W 2°40'W 2°20'W4°00'N
3°40'N
3°20'NS
eism
ic li
ne M
T02
CIGMR
Deep Ivorian Basin
10 km Site 959 CIGMR
3
4
5
6
7
8
9
Tw
o-w
ay tr
avel
tim
e (s
) Gulf of Guineaabyssal plain
SN
B
Figure 2. A. Location of Site 959 and the Côte d’Ivoire- Ghana Marginal Ridge (CIGMR; after Shipboard Sci-entific Party, 1996; see location on Fig. 1). B. North-south trending migrated seismic Line MT02 across the Deep Ivorian Basin, Côte d’Ivoire-Ghana Marginal Ridge and Gulf of Guinea abyssal plain (after Ship-board Scientific Party, 1996; see location on Fig. 2A).
210
IN SITU STRESS AT THE CÔTE D’IVOIRE MARGINAL RIDGE
rtybsf
re-
port chapter of Site 959 (Shipboard Scientific Party, 1996). This isfollowed by a short presentation of existing stress data in western Af-rica and the equatorial Atlantic.
Drilling Results
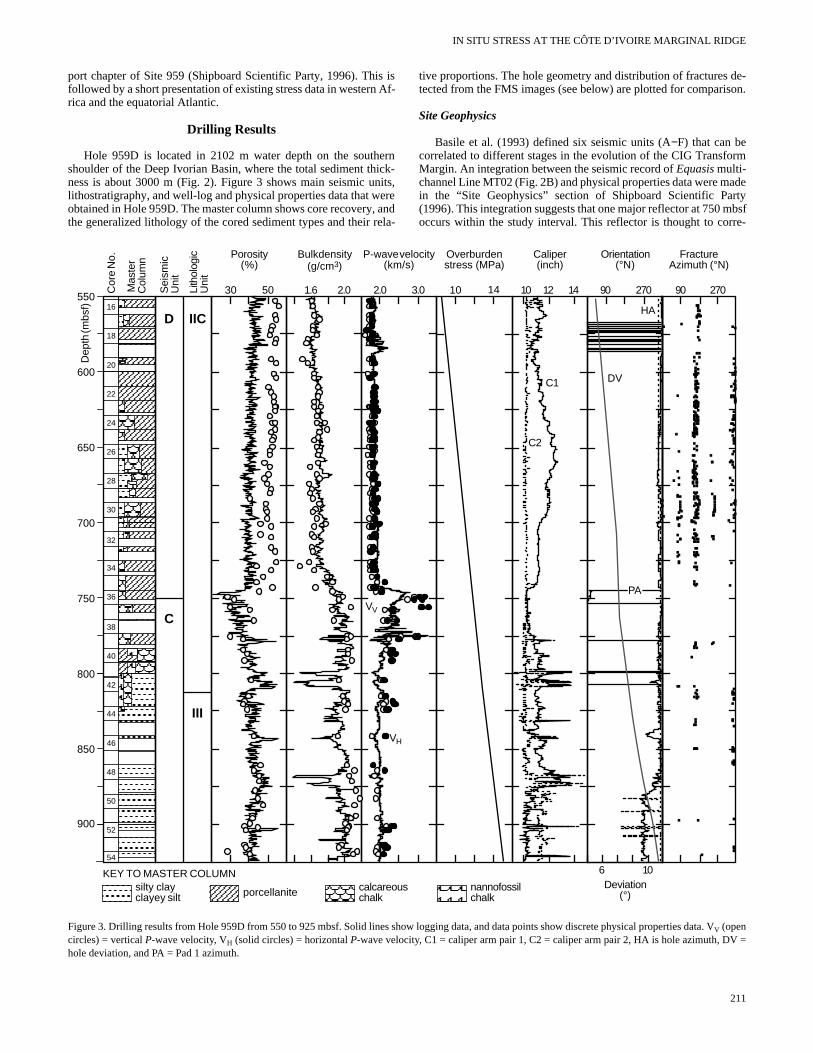
Hole 959D is located in 2102 m water depth on the southernshoulder of the Deep Ivorian Basin, where the total sediment thick-ness is about 3000 m (Fig. 2). Figure 3 shows main seismic units,lithostratigraphy, and well-log and physical properties data that wereobtained in Hole 959D. The master column shows core recovery, andthe generalized lithology of the cored sediment types and their rela-
tive proportions. The hole geometry and distribution of fractures de-tected from the FMS images (see below) are plotted for comparison.
Site Geophysics
Basile et al. (1993) defined six seismic units (A−F) that can becorrelated to different stages in the evolution of the CIG TransformMargin. An integration between the seismic record of Equasis multi-channel Line MT02 (Fig. 2B) and physical properties data were madein the “Site Geophysics” section of Shipboard Scientific Pa(1996). This integration suggests that one major reflector at 750 moccurs within the study interval. This reflector is thought to cor
16
18
20
22
24
26
28
30
32
34
36
38
40
42
44
46
48
50
52
54
550
650
700
600
750
800
850
900
silty clayclayey silt porcellanite calcareous
chalknannofossilchalk
D
C
IIC
III
30 50
Porosity(%)
Sei
smic
Uni
t
Lith
olog
icU
nit
1.6 2.0
Bulk density(g/cm3)
P-wave velocity(km/s)
2.0 3.0
C1
C2
10 12 14
Caliper(inch)
DV
PA
90 270
Orientation(°N)
6 10Deviation
(°)
90 270
FractureAzimuth (°N)
Overburdenstress (MPa)
10 14
KEY TO MASTER COLUMN
Dep
th (m
bsf)
Mas
ter
Col
umn
Cor
e N
o.
VH
VV
HA
Figure 3. Drilling results from Hole 959D from 550 to 925 mbsf. Solid lines show logging data, and data points show discrete physical properties data. VV (opencircles) = vertical P-wave velocity, VH (solid circles) = horizontal P-wave velocity, C1 = caliper arm pair 1, C2 = caliper arm pair 2, HA is hole azimuth, DV =hole deviation, and PA = Pad 1 azimuth.
211
M. ASK
ow5
) aubre
h
nsgon%ths %
Bd
T
r lbdt
de s aboss
f 2.2
pon-
in- di-
bsf, de-sti-o 3.1omstantents
y are
n. Inter
eightlcu-.8 be-lues
hasbsf
totalesti-
(1)ter-
og.entecha-wereiled
datarding that Leg
erentand two
as the
tickes.nedainoorusries
opyper-t in
spond to the change from continental/ocean transform faulting to pas-sive margin evolution.
Lithostratigraphy
The sequence between 550 and 812.3 mbsf corresponds to litho-logic Subunit IIC. It consists of porcellanite that, because of alter-ation, is virtually barren of all siliceous flora and fauna. Porcellaniteoccurs with a distinct color banding ranging from 10 cm to 2.5 mthick, which reflects variation in the organic matter and pyrite con-tent, and in the degree of bioturbation. Micrite occurs at various lev-els within this subunit, but systematically increases in the lower part.Because of an increase in carbonate content below 600 mbsf, the li-thology changes from porcellanite with clay, to porcellanite with mi-crite, and subsequently to porcellanite nannofossil chalk. The age ofsediment within the subunit ranges from early Miocene to late Pale-ocene.
Lithologic Unit III is encountered in the sequence between 812.3and 925 mbsf. The unit is composed of black claystone and claystonewith nannofossils. Alternating beds of late Paleocene claystone, nan-nofossil claystone, and micritic claystone are encountered in the up-per 19.3 m of the unit. The interval from 831.6 to 898.2 mbsf is dom-inated by grayish black massive claystone. This interval is early Pa-leocene to Maastrichtian in age and is slightly to moderatelybioturbated. Claystone, glauconitic claystone with pyrite, and clay-stone with pyrite of Maastrichtian age are observed down to 925mbsf.
Structural Geology
Structures observed between 550 and 925 mbsf in Hole 959D in-clude bedding planes, microfaults, and veins. The upper 50 m of theinterval is characterized by shallowly dipping beds (<12°). Belthere is a general increase in bedding dips with depth, to about 2925 mbsf. Apparently anastomozing faults (i.e., interlacing faultsfect mainly diatomites, porcellanites and micrites of lithologic Sunit IIC. Planar normal faults are well developed, and veins are tively common in the porcellanite of this subunit. Planar normfaults are well developed in the black claystone of Unit III, and tthread-like veins of pyrite are commonly observed.
Physical Properties and Downhole Measurements
Discrete and continuous measurements of porosity, bulk deand P-wave velocity were collected from cores and downhole lorespectively (Fig. 3). The discrete measurements of porosity shdecreasing trend (55%−50%) from 550 to 700 mbsf, whereas the cotinuous measurements of porosity generally decrease from 4540%. This difference is mainly attributed to porosity rebound in cores because of the removal of the overburden pressure. It ilowed by a 50-m-long section with more scattered values (44−54%), that partly overlaps the data from the log measurements.the discrete and continuous measurements of bulk density anP-wave velocity have rather constant values down to 750 mbsf.bulk density ranges generally from 1.55 to 1.75 g/cm3 and the P-wavevelocity increases from about 1.8 to 1.9 km/s. There is a more owell pronounced offset in the three properties at about 750 mwhich corresponds to the boundary between seismic Units D an
Below 750 mbsf, the porosity data from both discrete and conuous measurements generally demonstrate a good corresponThis suggests that the removal of the overburden pressure hadinfluence on the porosity in the cores, and thus that the sectionwell lithified. The porosity drops to the minimum value of 28%750 mbsf, which is followed by decreasing values to 46% at a880 mbsf. The last 50 m of the interval is characterized by decreaporosity values to about 40% at 925 mbsf. Values of bulk den
212
,° atf--la-alin
itys,w a- toefol-
oth he
esssf, C.in-nce.
little aretutingity
from discrete measurements increase slowly to the maximum og/cm3 at 880 mbsf. Scattered values between 1.85 and 2.2 g/cm3 aremeasured from 880 to 925 mbsf. There is generally good corresdence between core and log data of bulk density and P-wave velocityin sections with good recovery. Exceptions to this trend occur intervals with low recovery and in sections with increased boreholeameter (i.e., washouts). Minimum values (≈1.5 g/cm3) are measuredin two big washout zones from 795 to 812 mbsf and 865 to 885 mrespectively. The continuous measurements of bulk density arerived from a nuclear logging tool that has a shallow depth of invegation, and hence is sensitive to washouts. Higher values (2.1 tkm/s) of P-wave velocity from discrete measurements occur fr750 to 790 mbsf. Below, the log measurements are rather conand range generally from 1.9 to 2 km/s. The discrete measuremare consistently greater down to 850 mbsf, whereas they mostlof comparable value from 850 to 925 mbsf. The P-wave velocity inthe cores is measured in both the horizontal and vertical directiogeneral, the P-wave velocities in the horizontal direction are greathan those in the vertical direction.
The total vertical stress is often assumed to be equal to the wof overlying sediments. The weight of overlying sediments is calated from ρgz where ρ is the bulk density, g is the gravity force (9m/s2), and z is the depth. Because of the good correspondencetween the core and log data, I used bulk density and depth vafrom both data sets in the calculation. However, only core databeen used for the calculation of the vertical stress from 0 to 395 mas this section was not logged. Figure 3 shows that the estimatedvertical stress increases linearly from 9 to 16 MPa over the invgated depth interval.
In Situ Stress Data
Figure 1 is a compilation of data from three different sources:the WSM, (2) earthquake moment tensors for western Africa demined by Suleiman et al. (1993), and (3) the Harvard CMT catal
The WSM is a compilation of stress data from several differmethods of stress measurement, although earthquake focal mnisms are most abundant. The data from Suleiman et al. (1993) determined by seismic waveform inversions as part of a detastudy of seven earthquakes and waveform inversions. After theare converted to P and T axes, they are ranked from A to D accoto the WSM ranking scheme (Zoback, 1992). It should be noteda double earthquake was recorded at 0.13°W, 5.18°N, near the159 area, and both focal mechanisms are shown to be quite diff(16° and 305°N, respectively). Table 1 lists data from the WSM Suleiman et al. (1993). There is some redundancy between thedata sets. Suspected duplicates are marked in Table 1, wherecomplete data set is shown in Figure 1.
The CMT data are primarily located along the mid-AtlanRidge. Most of the data indicate strike-slip transform earthquaAccording to Zoback (1992), CMT data should generally be assigto quality C if no additional study of the data was made. The mreason is that the resolution of the CMT inversion is relatively pfor the vertical dip-slip components of faulting in shallow focevents (Sipkin, 1986). At present, CMT data from plate boundaare not incorporated into the WSM.
THEORY FOR BOREHOLE BREAKOUTSAND TENSILE WALL FRACTURES
Borehole Breakouts
Radial, circumferential and shear stresses (σr, σθ, τrθ, respec-tively) are formed around a borehole as it is being drilled. Anisotrin the tectonic far-field principal stresses, and differences in temature and properties of the formation and the drilling fluid resul
IN SITU STRESS AT THE CÔTE D’IVOIRE MARGINAL RIDGE
sl
9
ew
s1 aeerr
prin-atterntion
ikethe al.,ress aret thedlesn thendex-
id)
s per
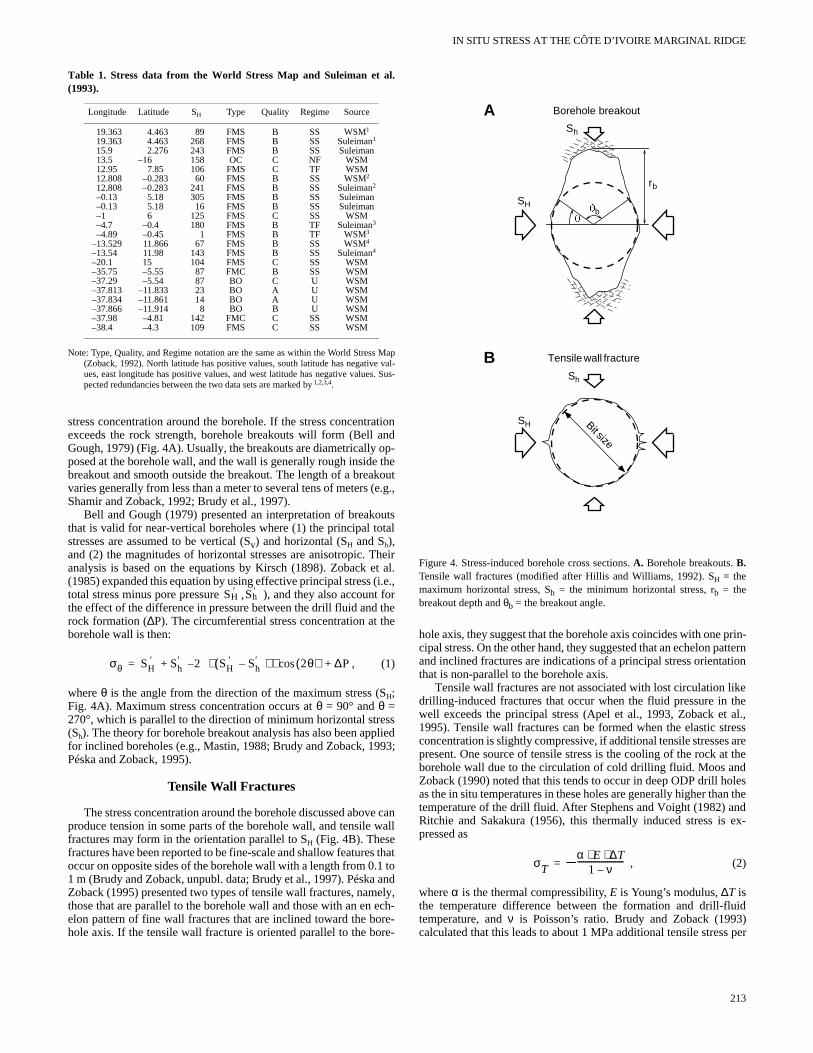
stress concentration around the borehole. If the stress concentrationexceeds the rock strength, borehole breakouts will form (Bell andGough, 1979) (Fig. 4A). Usually, the breakouts are diametrically op-posed at the borehole wall, and the wall is generally rough inside thebreakout and smooth outside the breakout. The length of a breakoutvaries generally from less than a meter to several tens of meters (e.g.,Shamir and Zoback, 1992; Brudy et al., 1997).
Bell and Gough (1979) presented an interpretation of breakoutsthat is valid for near-vertical boreholes where (1) the principal totalstresses are assumed to be vertical (Sv) and horizontal (SH and Sh),and (2) the magnitudes of horizontal stresses are anisotropic. Theiranalysis is based on the equations by Kirsch (1898). Zoback et al.(1985) expanded this equation by using effective principal stress (i.e.,total stress minus pore pressure ), and they also account forthe effect of the difference in pressure between the drill fluid and therock formation (∆P). The circumferential stress concentration at theborehole wall is then:
, (1)
where θ is the angle from the direction of the maximum stress (SH;Fig. 4A). Maximum stress concentration occurs at θ = 90° and θ =270°, which is parallel to the direction of minimum horizontal stre(Sh). The theory for borehole breakout analysis has also been appfor inclined boreholes (e.g., Mastin, 1988; Brudy and Zoback, 19Péska and Zoback, 1995).
Tensile Wall Fractures
The stress concentration around the borehole discussed abovproduce tension in some parts of the borehole wall, and tensile fractures may form in the orientation parallel to SH (Fig. 4B). Thesefractures have been reported to be fine-scale and shallow featureoccur on opposite sides of the borehole wall with a length from 0.1 m (Brudy and Zoback, unpubl. data; Brudy et al., 1997). PéskaZoback (1995) presented two types of tensile wall fractures, namthose that are parallel to the borehole wall and those with an en elon pattern of fine wall fractures that are inclined toward the bohole axis. If the tensile wall fracture is oriented parallel to the bo
SH′ ,Sh
′
σθ SH′ Sh
′ 2– SH′ Sh
′–( ) 2θ( )cos⋅ ⋅ ∆P+ +=
Table 1. Stress data from the World Stress Map and Suleiman et al.(1993).
Note: Type, Quality, and Regime notation are the same as within the World Stress Map(Zoback, 1992). North latitude has positive values, south latitude has negative val-ues, east longitude has positive values, and west latitude has negative values. Sus-pected redundancies between the two data sets are marked by 1,2,3,4.
Longitude Latitude SH Type Quality Regime Source
19.363 4.463 89 FMS B SS WSM1
19.363 4.463 268 FMS B SS Suleiman1
15.9 2.276 243 FMS B SS Suleiman13.5 –16 158 OC C NF WSM12.95 7.85 106 FMS C TF WSM12.808 –0.283 60 FMS B SS WSM2
12.808 –0.283 241 FMS B SS Suleiman2
–0.13 5.18 305 FMS B SS Suleiman–0.13 5.18 16 FMS B SS Suleiman–1 6 125 FMS C SS WSM–4.7 –0.4 180 FMS B TF Suleiman3
–4.89 –0.45 1 FMS B TF WSM3–13.529 11.866 67 FMS B SS WSM4
–13.54 11.98 143 FMS B SS Suleiman4
–20.1 15 104 FMS C SS WSM–35.75 –5.55 87 FMC B SS WSM–37.29 –5.54 87 BO C U WSM–37.813 –11.833 23 BO A U WSM–37.834 –11.861 14 BO A U WSM–37.866 –11.914 8 BO B U WSM–37.98 –4.81 142 FMC C SS WSM–38.4 –4.3 109 FMS C SS WSM
sied3;
canall
that tondly,ch-e-e-
hole axis, they suggest that the borehole axis coincides with one cipal stress. On the other hand, they suggested that an echelon pand inclined fractures are indications of a principal stress orientathat is non-parallel to the borehole axis.
Tensile wall fractures are not associated with lost circulation ldrilling-induced fractures that occur when the fluid pressure in well exceeds the principal stress (Apel et al., 1993, Zoback et1995). Tensile wall fractures can be formed when the elastic stconcentration is slightly compressive, if additional tensile stressespresent. One source of tensile stress is the cooling of the rock aborehole wall due to the circulation of cold drilling fluid. Moos anZoback (1990) noted that this tends to occur in deep ODP drill hoas the in situ temperatures in these holes are generally higher thatemperature of the drill fluid. After Stephens and Voight (1982) aRitchie and Sakakura (1956), this thermally induced stress is pressed as
, (2)
where α is the thermal compressibility, E is Young’s modulus, ∆T isthe temperature difference between the formation and drill-flutemperature, and ν is Poisson’s ratio. Brudy and Zoback (1993calculated that this leads to about 1 MPa additional tensile stres
σTα E ∆T⋅ ⋅
1 ν–-----------------------–=
SH
Sh
b
rb
Bit size
SH
Sh
Borehole breakout
Tensile wall fracture
A
B
Figure 4. Stress-induced borehole cross sections. A. Borehole breakouts. B.Tensile wall fractures (modified after Hillis and Williams, 1992). SH = themaximum horizontal stress, Sh = the minimum horizontal stress, rb = thebreakout depth and θb = the breakout angle.
213
M. ASK
bef
e
ct
i
o e
n
o
o a ,
ioufoic
e
i
dh
i
mores than
s en-tionalidate
e-
olet al.,
tton-te the
251-f thee to cur-anges
yticrfacesble-, al- Be- depthzard
specto ob-d se-turessticshted
andis areonga-FMSs and dis-
rvalaliper or
his is C2er is mm
imilart 279ria-
eas-m orcom-
1°C cooling in common rock types. Brudy and Zoback (unpudata) wrote that tensile failure will occur at the borehole wall whthe stress concentration exceeds tensile strength (T). By using etive principal stresses , their formula becomes
, (3)
where σT is thermally induced stress from Equation 2 and Pb is the mud pressure.
DOWNHOLE MEASUREMENTS WITH THE FMS
The FMS tool consists of four orthogonally positioned caliparms with micro-resistivity electrodes mounted on each pad. Tpads are mounted in sequence, Pads 1 to 4. Pad 1 is the referenfrom which the orientation with respect to north is measured. The collects two types of data, namely, conventional four-arm calipdata and FMS images of the small-scale variations in the electrconductivity.
Four-Arm Caliper Device of FMS Tool
The four-arm caliper records the distance between each opparm pair (C1 and C2) and the orientation of the tool with respect tonorth and to the vertical. Measurements are made during pullingtool up the borehole, with a vertical sampling frequency of one msurement per 152 mm. The four-arm caliper tool will only recordborehole elongation if it has a width greater than the pad width alength greater than the pad length. The tool spirals slowly while bepulled up as a result of the tension and twisting of the cable. This rtion normally stops if an elongation zone with a greater width alength than that of the pad dimensions is reached as the caliper becfixed in the elongated grooves. The program used for the breakoutlyses shows the downhole variation in caliper readings (C1 and C2)orientation data. Sections with breakout candidates are selectedthe data are stacked over this depth interval in so-called contourdifference plots. This gives an impression of the mean borehole conwithin the interval.
Plumb and Hickman (1985) postulated five criteria for separatbetween stress-induced borehole elongations (borehole breakand mechanically induced ones (e.g., drill pipe wear and washoTheir breakout criteria (listed below) have been slightly modified this study, mainly because of limitations in the breakout analyzprogram, which requires a certain number of data points to producontour and difference plot.
Breakout criteria used in this study:
1. The rotation of the logging tool has to stop completely.2. The difference in caliper readings in breakouts should exc
12 mm.3. The smaller caliper reading has to be close to bit size, or if
smaller caliper reading is greater than bit size, it should exhless variation than the larger caliper.
4. The length of the breakout has to exceed 1 m.5. The direction of elongation must not consistently coinci
with the azimuth of the high side of the borehole wall when tborehole deviates from the vertical.
Drill-pipe wear often produces a mechanically induced elongatin boreholes with a deviation larger than 1° from the vertical (Fucand Clauss, 1987). By entering cut-off values into the breakout alyzing program, the difference between Pad 1 and hole azimuth
SH′ and Sh
′( )
σθ SH′ Sh
′ 2 SH′ Sh
′–( ) 2θ( )cos σT 2 Pb T≤⋅–+⋅ ⋅–+=
214
l.n
fec-
rhee padoolercal
sitethethea-
ad aingta-
ndmesna-
and andandtour
nguts)ts).r
nge a
ed
thebit
ee
onhsna-s is
calculated for all sections of the borehole that has a deviation of than 1°. When the difference between the two data sets is les10°, the data are ignored (cf. “wrong values” in Fig. 5).
The data collected from the breakout analyzing program watered into a dedicated program that calculates statistics on direcdata according to Mardia (1972). Each individual breakout candis weighted by its own length to enhance dominant SH orientations,and the weighted statistical mean SH orientation and the standard dviation are calculated in the program.
FMS Sensor of FMS Tool
The FMS-tool maps the electrical conductivity of the borehwall using an array of small, pad-mounted electrodes (Ekstrom e1987). The configuration used during Leg 159 contained 16 bushaped electrodes on each of four orthogonal pads to generaFMS images. Each pad covers 24° of the borehole wall for themm-sized bit (9.88 in). Thus, the four pads cover about 27% oborehole wall. During logging, a current flows from each electroda single return electrode located at the top of the tool. The buttonrent is recorded as a series of curves that represent relative chof micro-conductivity in the rock caused by either (1) electrolconduction in the pore space or (2) cation exchanges on the suof clay minerals. The current intensity is converted into variaintensity FMS images. The vertical resolution is about 2.5 mmthough thinner features of high conductivity may be detected.cause of the electrode geometry, the pads have a very shallowof investigation (a few centimeters beyond the borehole wall) (Peet al., 1992).
The downhole images of each pad, oriented in space with reto the north, are shown by the analyzing program. It is possible ttain the strike and dip of a plane by pointing with the cursor anlecting interesting sections. For this analysis, only vertical feaare of interest. After completion of analyzing the FMS data, station directional data by Mardia (1972) are used to obtain a weigstatistical mean SH orientation for the data.
RESULTS
The information from the FMS tool includes four-arm caliper FMS sensor data. The results from the four-arm caliper analyspresented first to show the occurrence of prominent borehole eltions. This is followed by a presentation of the results from the sensor to show the existence of small-scale borehole elongationfractures. The interpretation of the orientation of in situ stress iscussed in the in situ stress section of this chapter.
Four-Arm Caliper Device of FMS Tool
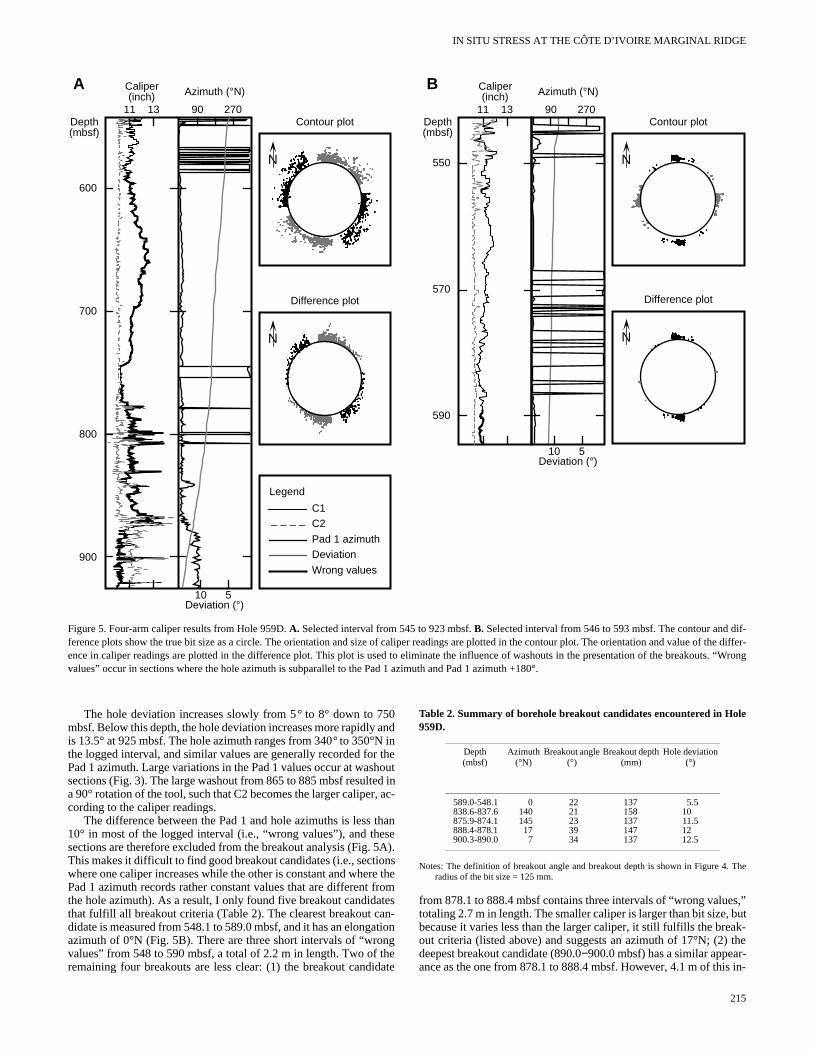
Figure 3 shows that caliper readings vary with depth. The intefrom 550 to 750 mbsf has rather constant values of the smaller c(C2 = ≈254 mm or 10 in), which is close to the bit size (251 mm9.88 in), and two bell-shaped trends in the larger caliper (C1). Tfollowed by a 25-m-long section with similar values of C1 and(254–267 mm or 10–10.5 in). Below 775 mbsf, the smaller calipoften fairly close to bit size, but peak values (washouts) up to 381(15 in) are repeatedly encountered. The larger caliper has a speak value distribution to the smaller one, and is generally aboumm (11 in). The size of C1 down to 775 mbsf is reflected in vations in the lithology in that (1) increases in C1 coincide with incres in the clay and micrite content, and (2) C1 values of ~279 mless (≤11 in) are measured in sections that are predominantly posed of porcellanite (60% or more) (Fig. 3).
IN SITU STRESS AT THE CÔTE D’IVOIRE MARGINAL RIDGE
Difference plot
N
Contour plot
N
Legend
C1C2
Pad 1 azimuthDeviation
Wrong values
600
700
800
900
Depth(mbsf)
Caliper(inch)
11 13
Azimuth (°N)
90 270
Deviation (°)510
A
Contour plot
Difference plot
N
N550
590
Depth(mbsf)
570
Caliper(inch)
11 13
Azimuth (°N)
90 270
Deviation (°)510
B
Figure 5. Four-arm caliper results from Hole 959D. A. Selected interval from 545 to 923 mbsf. B. Selected interval from 546 to 593 mbsf. The contour and dif-ference plots show the true bit size as a circle. The orientation and size of caliper readings are plotted in the contour plot. The orientation and value of the differ-ence in caliper readings are plotted in the difference plot. This plot is used to eliminate the influence of washouts in the presentation of the breakouts. “Wrongvalues” occur in sections where the hole azimuth is subparallel to the Pad 1 azimuth and Pad 1 azimuth +180°.
,
5oef
anhd
,”utk-he
in-
The hole deviation increases slowly from 5° to 8° down to 750mbsf. Below this depth, the hole deviation increases more rapidlyis 13.5° at 925 mbsf. The hole azimuth ranges from 340° to 350°Nthe logged interval, and similar values are generally recorded forPad 1 azimuth. Large variations in the Pad 1 values occur at wassections (Fig. 3). The large washout from 865 to 885 mbsf resultea 90° rotation of the tool, such that C2 becomes the larger calipercording to the caliper readings.
The difference between the Pad 1 and hole azimuths is less 10° in most of the logged interval (i.e., “wrong values”), and thesections are therefore excluded from the breakout analysis (Fig. This makes it difficult to find good breakout candidates (i.e., sectiwhere one caliper increases while the other is constant and wherPad 1 azimuth records rather constant values that are different the hole azimuth). As a result, I only found five breakout candidathat fulfill all breakout criteria (Table 2). The clearest breakout cadidate is measured from 548.1 to 589.0 mbsf, and it has an elongazimuth of 0°N (Fig. 5B). There are three short intervals of “wrovalues” from 548 to 590 mbsf, a total of 2.2 m in length. Two of tremaining four breakouts are less clear: (1) the breakout candi
and inthehoutd in ac-
thanseA).ns the
romtesn-tiongeate
from 878.1 to 888.4 mbsf contains three intervals of “wrong valuestotaling 2.7 m in length. The smaller caliper is larger than bit size, bbecause it varies less than the larger caliper, it still fulfills the breaout criteria (listed above) and suggests an azimuth of 17°N; (2) tdeepest breakout candidate (890.0−900.0 mbsf) has a similar appear-ance as the one from 878.1 to 888.4 mbsf. However, 4.1 m of this
Table 2. Summary of borehole breakout candidates encountered in Hole959D.
Notes: The definition of breakout angle and breakout depth is shown in Figure 4. Theradius of the bit size = 125 mm.
Depth(mbsf)
Azimuth (°N)
Breakout angle (°)
Breakout depth (mm)
Hole deviation(°)
589.0-548.1 0 22 137 5.5838.6-837.6 140 21 158 10875.9-874.1 145 23 137 11.5888.4-878.1 17 39 147 12900.3-890.0 7 34 137 12.5
215
M. ASK
td
aen9 th slya
n %ratho l
tu
o
thedthedsifi-se
ionribu- of 10c-
heann-hem inte-30
IIA areac-ths,un- and
a
toal-is-c-uressf
and.curesre-f.
andarre that
ost725omc-
for
e an of
di- inx-red
inup
h of-r of
terval consists of “wrong values,” suggesting that it is more affecby drill-pipe wear. If the sections with “wrong values” are includethe total length of the five breakout candidates is 64.3 m andweighted mean azimuth is 3° ± 10°N.
FMS Sensor of FMS Tool
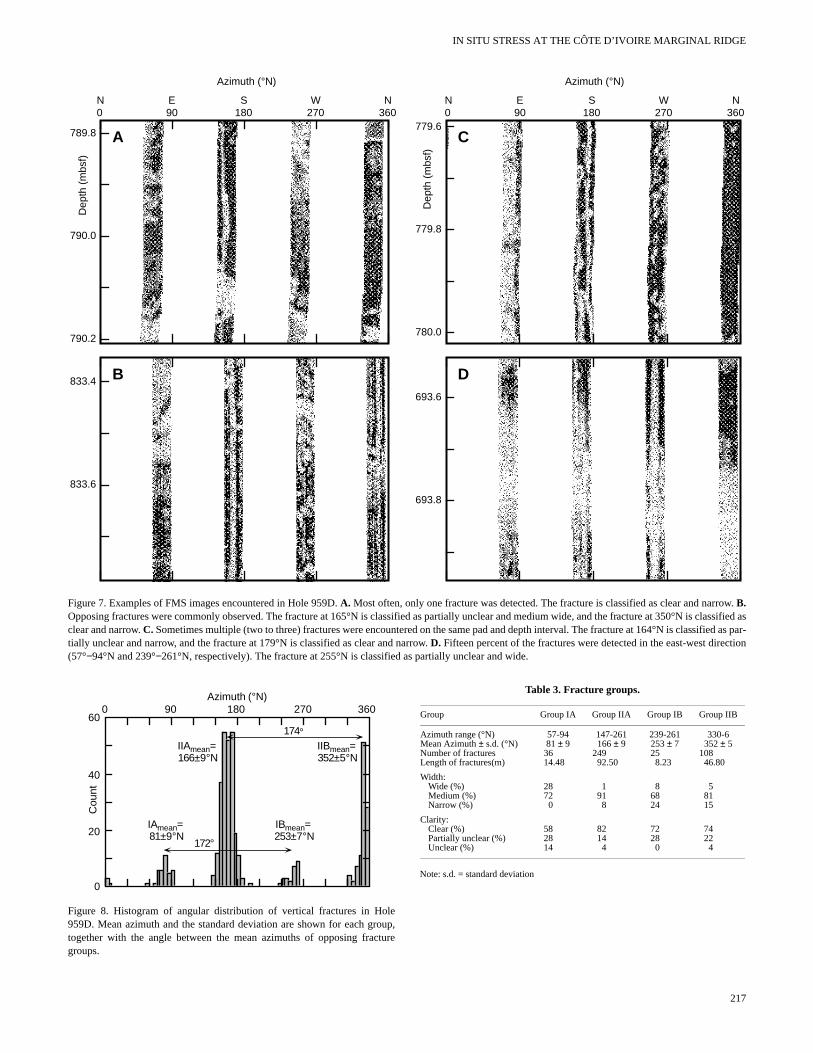
A large number of small-scale and highly conductive fracturesdetected parallel to the borehole axis in Hole 959D (Fig. 6). Thfractures are not present in the cores. Their individual lengths rafrom 0.04 to 9.57 m, and the average and median lengths are 0.30.26 m, respectively. The majority of the fractures are parallel toborehole axis, and typical examples are shown in Figure 7. Only tobservations of the en echelon “chevron” pattern of wall fracturesobserved at 577.6, 593.6 and 597.7 mbsf, respectively. Becauonly a moderate tool rotation, the measurements have been mainstricted to four directions that roughly lie in the point of the comp(i.e., 57−94°N, 147−196°N, 239−261°N, and 330−6°N). Neverthe-less, a clear pattern in both the downhole and angular distributiofractures is observed. There is a distinct change in the downholetribution of fractures at about 750 mbsf (Fig. 6). The majority (84of all fractures is detected above this depth. Below 750 mbsf, ftures are only measured in short sections, covering a total lengless than 30 m of the borehole. A bimodal angular distribution is served in the fractures that are parallel to the borehole axis (Fig.
In order to simplify the further presentation and increase the city, the fractures are grouped with respect to their azimuth (TableIn addition, the appearance of individual fractures varies, both wrespect to the clarity (i.e., conductivity contrast between the fracand the surrounding sediment) and the width of the fractures. Efracture has therefore been classified qualitatively regarding th
0 90 180 270 360
Azimuth (°N)
900
600
650
700
850
800
750
550
N E S W N
Depth(mbsf)
Figure 6. Distribution of small-scale vertical fractures in Hole 959D. Theshaded area shows parts of the borehole wall that are outside the measuredsection. Note that the size of the data points is greater than the length of thefracture.
216
ed,
the
resege andhereearee of re-ss
ofdis-)c- ofb-
8).ar-3).ithre
achse
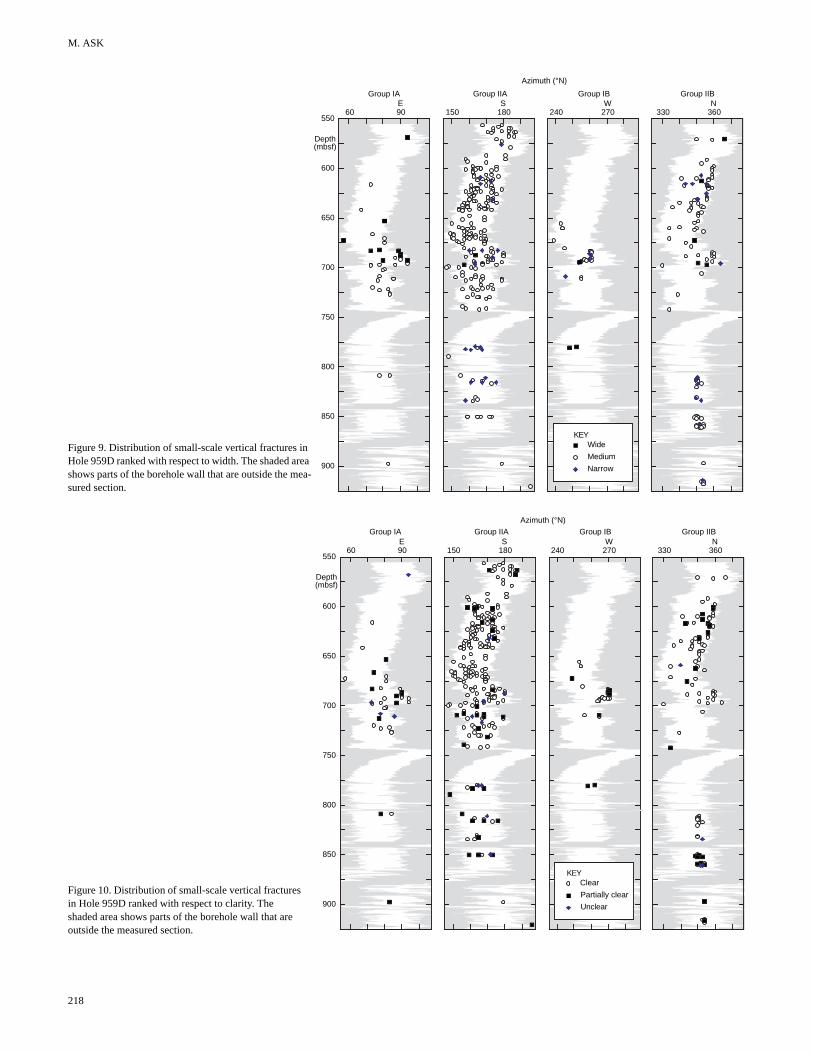
two characteristics. I used three types of description for clarity of fracture (i.e., clear, partially unclear, and unclear), and for their wi(i.e., wide, medium, and narrow). This classification is purely bason visual comparison of the data and examples of fractures clascation are included in the caption of Figure 7. The primary purpoof the classification is to determine if there is any systematic variatin the fracture’s appearance, such as the depth and angular disttion of the various types of fractures. The downhole distributionwide, medium, and narrow fractures is shown in Figure 9. Figuredepicts the distribution of clear, partially unclear, and unclear fratures.
Most fractures (60% of 418 fractures) have azimuths within trange from 147° to 196°N (Group IIA). They have a weighted meazimuth of 166° ± 9°N. The fractures are generally measured in abudance above 750 mbsf and between 775 and 850 mbsf. Most of t(91%) have medium width (Fig. 9). Narrow fractures occur mainlyfour sections: in porcellanite at ~ 620 mbsf, in two clay- and micririch intervals at 680 and 780 mbsf, and in black claystone at 8mbsf. Two wide fractures are measured at ~ 680 mbsf. Group consists mostly of clear fractures (82% of 249 fractures); thesemost abundant above 750 mbsf (Fig. 10). Almost 15% of the frtures are classified as partially unclear. They occur at most depexcept for the interval between 630 and 680 mbsf. A total of nine clear fractures was detected, and most of them occur between 660750 mbsf.
A total of 108 fractures (26%) is sorted into Group IIB, with weighted mean azimuth of 352° ± 5°N. The fractures are mainly dis-tributed within two intervals, from 570 to 700 mbsf and from 815 865 mbsf. Group IIB contains a slightly lower percentage of normwide fractures (81%) compared to Group IIA, but they are evenly dtributed over the two fracture intervals (Fig. 9). The five wide fratures in this group are located above 700 mbsf. The narrow fract(15%) are mostly restricted to two intervals, from 620 to 660 mband from 810 to 860 mbsf. The percentage of clear, partially clear unclear fractures in Group IIB is similar to that in Group IIA (Fig10). The clear fractures constitute 74% of all fractures, and they ocin both of the two fracture intervals. The partially unclear fractur(22%) have a more distinct depth distribution; most of them are stricted to the intervals from 590 to 675 mbsf and 850 to 870 mbs
The angle between the weighted mean azimuth of Groups IIA IIB is 174°, which is slightly less than the theoretical value for planfeatures (180°). However, many of the fractures in Group IIB ameasured near the edge of the FMS sensor (Fig. 6), suggestingmore fractures exist outside the measured interval.
Group I consists of the remaining 15% of the fractures, and mof them are measured in a restricted depth interval from 650 to mbsf (Figs. 9, 10). Fractures in Group IA have an azimuth range fr57° to 94°N and they mostly occur in the clay- and micrite-rich setion between 650 and 725 mbsf. The weighted mean azimuththese fractures is 81° ± 9°N. Fractures in Group IB occur over ashorter depth interval, from 650 to 710 mbsf. These fractures havazimuth range from 239° to 261°N and a weighted mean azimuth253° ± 7°N. About 70% of the fractures in both groups have a meum width (Fig. 9). However, whereas the remaining 10 fracturesGroup IA are classified as wide, those in Group IB are, with two eceptions, classified as narrow. Narrow fractures were not measuin Group IA. The majority (72% of 25 fractures) of the fractures Group IB are clear (Fig. 10). The corresponding number for GroIA is 58% (of 36 fractures). The angle between the mean azimutGroups IA and IB is 172°, which is similar to that of Group II. However, most of the fractures in Group I were measured in the centethe FMS sensors (Fig. 6).
IN SITU STRESS AT THE CÔTE D’IVOIRE MARGINAL RIDGE
n
DB
A
0 90 180 270 360N E S W N
C
0 90 180 270 360N E S W N
789.8
790.0
790.2
Dep
th (
mbs
f)
833.4
833.6
693.6
693.8
779.6
779.8
780.0
Dep
th (
mbs
f)
Azimuth (°N) Azimuth (°N)
Figure 7. Examples of FMS images encountered in Hole 959D. A. Most often, only one fracture was detected. The fracture is classified as clear and narrow. B.Opposing fractures were commonly observed. The fracture at 165°N is classified as partially unclear and medium wide, and the fracture at 350°N is classified asclear and narrow. C. Sometimes multiple (two to three) fractures were encountered on the same pad and depth interval. The fracture at 164°N is classified as par-tially unclear and narrow, and the fracture at 179°N is classified as clear and narrow. D. Fifteen percent of the fractures were detected in the east-west directio(57°−94°N and 239°−261°N, respectively). The fracture at 255°N is classified as partially unclear and wide.
IIAmean=166±9°N
IIBmean=352±5°N
IBmean=253±7°N
IAmean=81±9°N
174°
172°
60
40
20
0
0 90 180 270 360
Cou
nt
Azimuth (°N)
Figure 8. Histogram of angular distribution of vertical fractures in Hole959D. Mean azimuth and the standard deviation are shown for each group,together with the angle between the mean azimuths of opposing fracturegroups.
Table 3. Fracture groups.
Note: s.d. = standard deviation
Group Group IA Group IIA Group IB Group IIB
Azimuth range (°N) 57-94 147-261 239-261 330-6Mean Azimuth ± s.d. (°N) 81 ± 9 166 ± 9 253 ± 7 352 ± 5Number of fractures 36 249 25 108Length of fractures(m) 14.48 92.50 8.23 46.80
Width:Wide (%) 28 1 8 5Medium (%) 72 91 68 81Narrow (%) 0 8 24 15
Clarity:Clear (%) 58 82 72 74Partially unclear (%) 28 14 28 22Unclear (%) 14 4 0 4
217
M. ASK
60 90E
330 360N
240 270W
Wide
Medium
Narrow
KEY
150 180S
Azimuth (°N)
Group IA Group IIA Group IB Group IIB
550
600
650
700
750
800
850
900
Depth(mbsf)
Figure 9. Distribution of small-scale vertical fractures in Hole 959D ranked with respect to width. The shaded area shows parts of the borehole wall that are outside the mea-sured section.
Clear
Partially clear
Unclear
KEY
240 270W
330 360N
150 180S
60 90E
Azimuth (°N)
Group IA Group IIA Group IB Group IIB
550
600
650
700
750
800
850
900
Depth(mbsf)
Figure 10. Distribution of small-scale vertical fractures in Hole 959D ranked with respect to clarity. The shaded area shows parts of the borehole wall that are outside the measured section.
218
IN SITU STRESS AT THE CÔTE D’IVOIRE MARGINAL RIDGE
a lon
aos
6tu ae- aob
eirovy
dr
aou
thctuhar frhe
5ctrthv
an of 9).0%ide
ium%
0).as
us,un-and
res
aMS
hat
iceandbackibu-hatser-silea-
cre
ndin-heg’s
thecur-ys-
theum
DISCUSSION
The azimuth and downhole distribution of elongation zones andvertical fractures have been presented above. An interpretation of theorientation of SH is made below, including a comparison between thedownhole distribution of fractures with respect to the drilling results.The obtained mean SH orientation will be compared with stress orien-tations derived from earthquakes near the study area and the first-order stress province. Their internal relationships will then be dis-cussed with respect to potential sources for the observed stress orien-tations. Finally, possible contributions to the Site 959 objectives willbe discussed.
Interpretation of In Situ Stress in Hole 959DOrientation of SH
The results of the four-arm caliper analyses suggest that largeparts of Hole 959D contain mechanically induced borehole elonga-tions. Only five sections are found that fulfill the breakout criteria.They indicate an east-west orientation of SH. However, the breakoutcandidates either contain intervals with “wrong values” or are shlow and/or short; therefore, if this study had been based solelyfour-arm caliper data, one would have concluded that the hole egation was mostly mechanically induced by drill-pipe wear and conclusions of the orientation of SH could have been made.
The results from the FMS-sensor analysis show that many smscale vertical fractures exist in borehole wall. This implies that H959D has been elongated by both mechanical wear and overstresIn total, 418 vertical fractures with a weighted mean azimuth of 1± 24°N and a total length of 162.14 m were measured. The fracdistribution is bimodal (Fig. 8): 85% of the fractures have a meanimuth of 168° ± 8°N (Group II), whereas the remaining 15% of thhave a mean azimuth of 78° ± 9°N (Group I). Except for three en echelon fractures, all fractures are oriented parallel with the boreholeis, suggesting that one principal stress is oriented parallel to the bhole axis (Péska and Zoback, 1995). The calculation of the overden pressure suggests that the magnitude of SV ranges from at least 9to 16 MPa over the study interval.
The question is, then, what kinds of fractures were encounterAre the fractures in Group II parts of borehole breakouts and indative of the Sh orientation, or are they tensile wall fractures that aparallel to the orientation of SH? A borehole breakout is expected tgenerate a wide, ragged-shaped vertical image that ranges ometer to several tens of meters (Shamir and Zoback, 1992; Brudal., 1997). A tensile wall fracture on the other hand, is expectebe a small-scale image of small width and short length (decimetemeter scale) (Brudy and Zoback, unpubl. data). The examination ofthe individual fractures in Group II shows that they are small-scfeatures (Figs. 7A, B). In some intervals, two to three fractures cur within the same depth interval and pad (Fig. 7C). These cobe interpreted as being part of a borehole breakout. However, have the same orientation as the single fractures and they owithin the same depth interval. Brudy and Zoback (unpubl. daand Brudy et al. (1997) mention that one single tensile wall fractis formed on each side of the borehole 180° apart. However, ot(Hillis and Williams, 1992; Apel et al., 1993) have indicated thmore than one tensile wall fracture can simultaneously appeaeach side of the borehole (cf. Fig. 4). Based on the above, the tures within Group II are concluded to be tensile wall fractures tshow the orientation of SH, and hence that they are not parts of borhole breakouts.
Fractures in Group I are mainly restricted to the section from 6to 725 mbsf, and they have an orthogonal orientation with respethose in Group II (i.e., the tensile wall fractures; Fig. 7D). Their oentation with respect to the tensile wall fractures suggests that are small borehole breakouts. Following the argumentation abo
l-onn-o
ll-leing.
8°rez-
x-re-ur-
d?c-e
er a et
to to
lec-ldeycura)reerstonac-at-
0 toi-eye,
the fractures in Group I should generally be wider and longer ththose in Group II. However, the classification regarding the widthindividual fractures shows that this is not always the case (Fig.Only 20% of all fractures in Group I are wide fractures, whereas 7of the fractures have a medium width. The average length of the wfractures is 0.66 m, which is somewhat longer than those of medwidth (0.28 m). The classification about the clarity shows that 36of the fractures in Group I are partially unclear or unclear (Fig. 1In comparison, only 2% of the fractures in Group II are wide, where20% of all fractures in Group II are partially unclear or unclear. Ththe conclusion from the above is that it is not possible to define equivocally the fractures in Group I as being borehole breakouts show the orientation of Sh. However, their orientation and the slightlyhigher percentage of wide and partially unclear or unclear fractuindicate that they are very weak borehole breakouts.
In summary, Hole 959D is much affected by drill-pipe wear asresult of the large hole deviation. The detailed analysis of the Fsensor suggests a 168° ± 8°N weighted mean SH orientation. The lowstandard deviation (±8°) indicates that this SH orientation is uniformthroughout the investigated interval. The data further indicates tvery weak borehole breakouts, with a weighted mean Sh orientationof 78° ± 9°N, may occur in the interval from 650 to 725 mbsf.
Downhole Variation in Fracture Distribution
The majority of tensile wall fractures were detected in seismUnit D and lithologic Subunit IIC (Fig. 3). Relatively often, tensilwall fractures were only detected along one pad (Figs. 6, 7A, 8), not on both of the opposing pads as suggested by Brudy and Zo(unpubl. data) and Brudy et al. (1997). Because the fracture distrtion is less in the direction of hole azimuth, it could be interpreted tthe drill pipe has ground away the fractures on this side. This obvation further supports the interpretation that the fractures are tenwall fractures. By definition, tensile wall fractures are shallow fetures that may easily be ground away by the drill pipe.
Figure 3 shows that porosity, density and P-wave velocity haveuniform downhole distribution in seismic Unit D and in lithologiSubunit IIC, down to about 750 mbsf. A shift to denser and mocompacted sediments (low porosity) with higher P-wave velocitiesoccurs from about 750 mbsf. The higher velocity and density, alower porosity values imply that the strength of the sediment creases in seismic Unit C and lithologic Unit III. An increase of tsediment strength implies a corresponding increase in the Younmodulus, which, according to Equation 2, results in an increase inthermally induced stress. Nevertheless, the abrupt end in the ocrence of tensile wall fractures is attributed to the change in the phical properties of the sediment. Apparently, the tensile strength ofsedimentary rock below 750 mbsf is generally greater than the sof thermal and tectonic stresses.
Stress Fields near the Côte d’Ivoire-Ghana Marginal Ridge
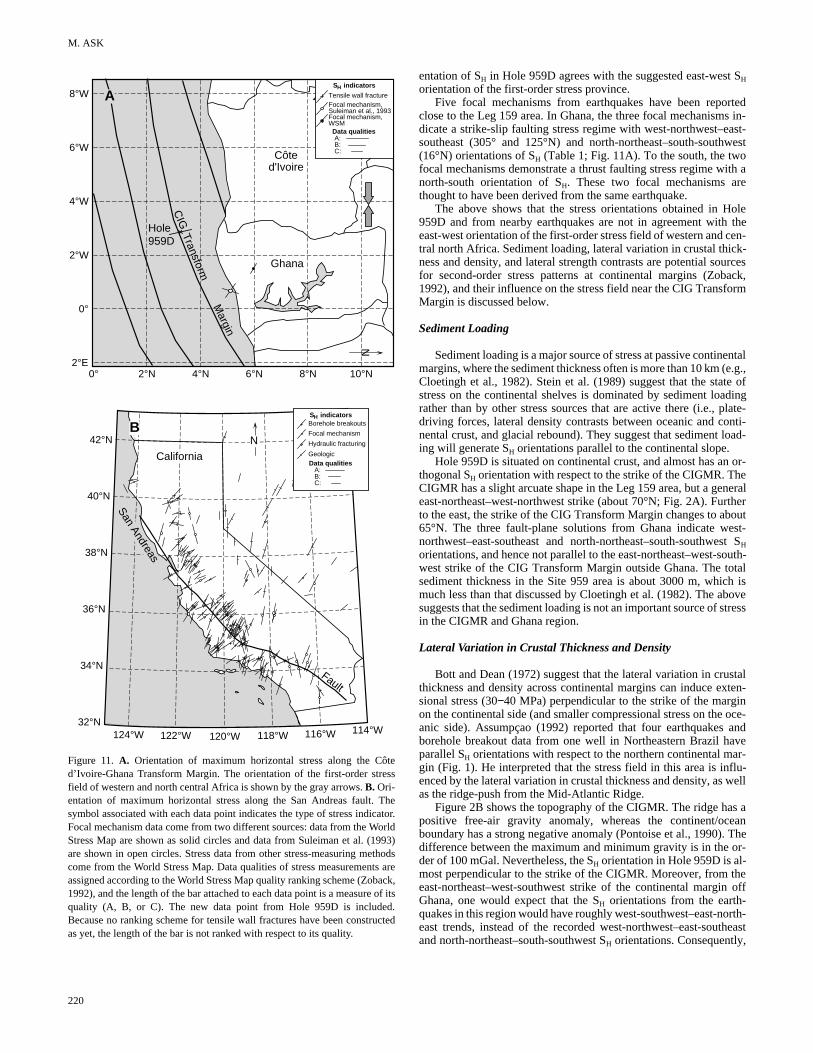
Zoback (1992) identified a region in western and north central Af-rica of compressional tectonism with an approximately east-west SH
orientation (Fig. 11A). Based on the plate tectonic setting of Africa(surrounded by mid-ocean ridges and a continental collision in thenorth), Zoback et al. (1989) suggested that Africa is affected by amidcontinental compressional stress field. The definition of this first-order stress province was based on fault-plane solutions of largeearthquakes in West Africa between 1939 and 1983 (Suleiman et al.,1993), CMT solutions, and borehole breakout data from Sudan (Bos-worth et al., 1992). The new data from Suleiman et al. (1993) (Table1) indicate strike-slip and thrust-fault regimes, which is in agreementwith the observations of Zoback (1992). However, neither the earth-quake data in the vicinity of the Leg 159 area nor the 168° ± 8°N ori-
219
M. ASK
st-est
ith ae
ole theen-k-urcesack,orm
ntale.g.,e ofdinglate-nti-
oad-
or-eneralheroutst-t S
outh-talh isovetress
stalten-
in oce-andve
ar-flu-well
s aan Theor-
he off
rth-heast
u
N
Focal mechanism,Suleiman et al., 1993
Tensile wall fracture
Focal mechanism,WSM
SH indicators
Data qualitiesA:B:C:
B
A
Margin
CIG
Transform Ghana
Côted'Ivoire
California
San AndreasFault
A:B:C:
Data qualities
Borehole breakouts
Focal mechanism
Geologic
Hydraulic fracturing
SH indicators
N
0° 2°N 4°N 6°N 8°N 10°N
0°
2°W
4°W
6°W
8°W
2°E
124°W 122°W 120°W 118°W 116°W 114°W
34°N
36°N
38°N
40°N
42°N
32°N
Hole959D
Figure 11. A. Orientation of maximum horizontal stress along the Côd’Ivoire-Ghana Transform Margin. The orientation of the first-order strefield of western and north central Africa is shown by the gray arrows. B. Ori-entation of maximum horizontal stress along the San Andreas fault. symbol associated with each data point indicates the type of stress indicFocal mechanism data come from two different sources: data from the WStress Map are shown as solid circles and data from Suleiman et al. (1are shown in open circles. Stress data from other stress-measuring mecome from the World Stress Map. Data qualities of stress measurementassigned according to the World Stress Map quality ranking scheme (Zob1992), and the length of the bar attached to each data point is a measurequality (A, B, or C). The new data point from Hole 959D is includeBecause no ranking scheme for tensile wall fractures have been constras yet, the length of the bar is not ranked with respect to its quality.
220
entation of SH in Hole 959D agrees with the suggested east-west SH
orientation of the first-order stress province.Five focal mechanisms from earthquakes have been reported
close to the Leg 159 area. In Ghana, the three focal mechanisms in-dicate a strike-slip faulting stress regime with west-northwest–easoutheast (305° and 125°N) and north-northeast–south-southw(16°N) orientations of SH (Table 1; Fig. 11A). To the south, the twofocal mechanisms demonstrate a thrust faulting stress regime wnorth-south orientation of SH. These two focal mechanisms arthought to have been derived from the same earthquake.
The above shows that the stress orientations obtained in H959D and from nearby earthquakes are not in agreement witheast-west orientation of the first-order stress field of western and ctral north Africa. Sediment loading, lateral variation in crustal thicness and density, and lateral strength contrasts are potential sofor second-order stress patterns at continental margins (Zob1992), and their influence on the stress field near the CIG TransfMargin is discussed below.
Sediment Loading
Sediment loading is a major source of stress at passive continemargins, where the sediment thickness often is more than 10 km (Cloetingh et al., 1982). Stein et al. (1989) suggest that the statstress on the continental shelves is dominated by sediment loarather than by other stress sources that are active there (i.e., pdriving forces, lateral density contrasts between oceanic and conental crust, and glacial rebound). They suggest that sediment ling will generate SH orientations parallel to the continental slope.
Hole 959D is situated on continental crust, and almost has anthogonal SH orientation with respect to the strike of the CIGMR. ThCIGMR has a slight arcuate shape in the Leg 159 area, but a geeast-northeast–west-northwest strike (about 70°N; Fig. 2A). Furtto the east, the strike of the CIG Transform Margin changes to ab65°N. The three fault-plane solutions from Ghana indicate wenorthwest–east-southeast and north-northeast–south-southwesH
orientations, and hence not parallel to the east-northeast–west-swest strike of the CIG Transform Margin outside Ghana. The tosediment thickness in the Site 959 area is about 3000 m, whicmuch less than that discussed by Cloetingh et al. (1982). The absuggests that the sediment loading is not an important source of sin the CIGMR and Ghana region.
Lateral Variation in Crustal Thickness and Density
Bott and Dean (1972) suggest that the lateral variation in cruthickness and density across continental margins can induce exsional stress (30−40 MPa) perpendicular to the strike of the margon the continental side (and smaller compressional stress on theanic side). Assumpçao (1992) reported that four earthquakes borehole breakout data from one well in Northeastern Brazil haparallel SH orientations with respect to the northern continental mgin (Fig. 1). He interpreted that the stress field in this area is inenced by the lateral variation in crustal thickness and density, as as the ridge-push from the Mid-Atlantic Ridge.
Figure 2B shows the topography of the CIGMR. The ridge hapositive free-air gravity anomaly, whereas the continent/oceboundary has a strong negative anomaly (Pontoise et al., 1990).difference between the maximum and minimum gravity is in the der of 100 mGal. Nevertheless, the SH orientation in Hole 959D is al-most perpendicular to the strike of the CIGMR. Moreover, from teast-northeast–west-southwest strike of the continental marginGhana, one would expect that the SH orientations from the earth-quakes in this region would have roughly west-southwest–east-noeast trends, instead of the recorded west-northwest–east-soutand north-northeast–south-southwest SH orientations. Consequently,
tess
Theator.orld993)thodss areack, of itsd.cted
IN SITU STRESS AT THE CÔTE D’IVOIRE MARGINAL RIDGE
le
el
ott t
Zrreinauh
t Frupr
aao RseCgv
ot
ouo
s Sasr
the strike therder sug-f the
eratementeralt al-tressn inbleormrea.
ationer- So-
ateeannsityar-e
wo, the the the the1A).
and the
iseastar a re-d thef theIGpegin,thee re-
is.
de-
are
eenonsd 1
as either the SH orientations in Hole 959D or those from focal mech-anisms in Ghana are parallel to the strike of the continental margin, Iconclude that the stress field there is not dominated by the lateralvariation in crustal thickness and density.
Figure 2B shows that the topography of the CIGMR (Fig. 2B)must result in stress amplification of in situ stress in the direction thatis perpendicular to the strike of the ridge, at least over the 3000-m-long depth interval over which the CIGMR towers above the Gulf ofGuinea abyssal plain. This indicates that although the magnitude ofcompressional stress perpendicular to the ridge decreases as the resultof the lateral variation in crustal thickness, they become amplified asthe result of the local topography.
Lateral Strength Contrasts
Zoback et al. (1987) suggested a new model of how the orienta-tion of in situ stress changes across a strike-slip fault as the result oflateral variation in strength. In their model, the strength contrast ispresumed to be the effect of a fault of low frictional shear strengthembedded in a frictionally strong crust; far from the fault, shearstresses are high and contained by the frictional strength of the crust,whereas shear stresses on planes parallel to the fault are quite low.Hence, the principal stresses become re-oriented so as to minimizeshear stress on planes parallel to the fault and the fault becomes aprincipal stress plane. According to this model, the orientation of SH
becomes nearly orthogonal to the fault if the regional compression isat an angle to the fault of more than 45°. However, if the angle isthan 45°, the orientation of SH becomes almost parallel to the strikof the fault.
The model by Zoback et al. (1987) was originally formed to plain the variation of in situ stress across the San Andreas fauCalifornia. Various types of in situ stress measurements and geological and geophysical indicators (Fig. 11B) demonstrate thaSH orientations in a 100- to 125-km wide zone on either side ofSan Andreas fault are oriented almost perpendicular (75°−85°) to thestrike of the fault (Mount and Suppe, 1987; Zoback et al., 1987;back, 1991; Mount and Suppe, 1992). The data show that themuch strike-slip and normal faulting to the east of the fault, whethe deformation is wholly compressional and dominated by foldstrike-slipping, and reverse faulting west of the San Andreas fClassical faulting theory cannot explain compression at such a angle to a strike-slip fault because the Pacific and North Americanplate motions are slightly convergent. Thus, they suggest thacause of the presumed low shear strength in the San Andreas interpreted independently from heat-flow data (e.g., Lachenband Sass, 1980), the regional stress fields have rotated by apmately 50°.
The angle between the strike of the CIG Transform Margin the SH orientations from the three focal mechanisms in Ghanabout 50° and 65° to the east-northeast–west-southwest strike CIG Transform Margin (Fig. 11B). The angle between the meanH
orientation of 168°N in Hole 959D and the strike of the CIGM(≈70°N) is almost perpendicular (≈88°). Thus, these observationdemonstrate SH orientations that suggest that the first-order strfield of western and north central Africa does not exist near the Transform Margin. It is hypothesized that lateral variation in strenin the CIG Transform Margin is the source of the observed detions. One focal mechanism has an oblique (49°), and the two focal mechanisms in Ghana have steeper angles (65°) with respect tothe strike of the CIG Transform Margin. These oblique angles cbe indicative in that these earthquakes are situated close to the bof the zone where re-orientation of SH occurs. If this assumption icorrect, it indicates that the zone of re-orientation is about 100wide. This is of similar size to the zone of re-orientation near theAndreas fault. Only four measurements do not allow unquestionconclusions to be drawn about the state of stress; neverthelesstress observation closest to the transform margin has a near-pe
ess
x-t inherthehe
o-e isasg,lt.
igh
be-ault,choxi-
nd isf theS
ssIGthia-her
ldrder
kmanble, thepen-
dicular orientation with respect to the strike of the CIGMR, and three stress observations at larger distances have angles to theof the CIG Transform Margin of more than 45°. This suggests thatCIG Transform Margin is a weak fault that generates a second-ostress province. The stress orientations of the focal mechanismsgest that the weak fault affects a 100-km-wide zone to the north omargin in which the principal stresses become re-oriented.
Speculations on SH Orientation and Source of Stress in the CIGMR
Above, I have presented three potential sources that can gensecond-order stress patterns along continental margins; sediloading, lateral variation in crustal thickness and density, and latvariation in strength. Although only four measurements does nolow for certain conclusions to be drawn about a second-order sprovince and its sources, I have argued that the lateral variatiostrength within the CIG Transform Margin is the most probasource for the observed data. This implies that the CIG TransfMargin acts as a weak fault, at least in the CIGMR and Ghana aHowever, because the argumentation is based on my interpretthat the SH orientation is 168°N in Hole 959D, and because this intpretation was not totally unequivocal, I will briefly discuss how anH
orientation of 78°N in Hole 959D compares with the two former ptential stress sources.
According to Stein et al. (1989), sediment loading will generSH orientations parallel to the continental slope, and Bott and D(1972) suggest that lateral variation in crustal thickness and dealso result in SH orientations that are parallel to the continental mgin. An SH orientation of 78°N in Hole 959D is subparallel to th70°N strike of the CIGMR, which would suggest that these tsources influence the stress field. However, as pointed out aboveSH orientations of the three focal mechanisms are not parallel totransform margin off Ghana. The angular differences betweeneast-northeast–west-southwest striking continental margin andthree focal mechanisms are about 50° and 65° (Table 1 and Fig. 1This observation supports my interpretation of the SH orientation inHole 959D—that the CIG Transform Margin acts as a weak fault, that lateral variation in the strength controls the stress field nearCIG Transform Margin.
Contributions to the Site 959 Objectives
The main contribution from the drilling objectives of Site 959the hypothesis that the CIG Transform Margin is a weak fault, at lin the region of the CIGMR. This implies that it has a low shestrength and is capable of sustaining only low shear stresses. Assult, the principal stresses become re-oriented near the fault, anfault becomes a principal stress plane. These characteristics ofault must have had great influence on the evolution of the CTransform Margin; for example, they may have influenced the tyof deformation in sediments and rocks on both sides of the marand they may have simplified vertical and horizontal slip along fault. However, because only a few stress data are available in thgion at this stage, it is not possible to further verify the hypothes
CONCLUSIONS
The orientation of horizontal stress in Hole 959D has been rived from the FMS tool. My findings about the SH orientation inHole 959D and the downhole distribution of tensile wall fractures as follows:
1. The four-arm caliper analyses could not distinguish betwmechanically and stress-induced borehole elongatibecause of similar values of the hole azimuth and the Paazimuth.
221
M. ASK
1-
-th
5
terab
7o
eo. Me
tho
lr
aut
m
n ai
mrgs
e
freer
d
r
Tu
e
ao
mar-
re-B
97ien-
s-
or-
ysisF.
obal
es-
San
.
rees:
ng
fault:
-slip
ofgth.
.,rnd
tion:wer
stalerva-
onse-
km
ver-
ityean.
di-
rs ofons
2. The FMS-sensor data show that one of the principal stresses isparallel to the borehole axis. The calculation of the overburdenpressure suggests that the magnitude of SV ranges at least from9 to 16 MPa in the studied interval.
3. The analysis of the FMS-sensor data suggests that tensile wallfractures occur in the borehole wall, and that they have a ± 8°N weighted mean SH orientation. The low standard deviation (±8°) indicates that this SH orientation is uniform throughout the investigated interval. The data further indicates very weak borehole breakouts, with a weighted mean Sh orien-tation of 78° ± 9°N, may occur in the interval from 650 to 72mbsf.
4. There is a distinct change in the downhole distribution of sile wall fractures. The depth of change coincides with a tsition from weaker to stronger sediments at about 750 mApparently, the strength of the sedimentary rock below mbsf is generally greater than the sum of thermal and tectstresses.
The obtained SH orientation in Hole 959D has been comparwith the orientation of the first-order stress field of western and ncentral Africa and the orientation of focal mechanisms in Ghanafindings about the SH orientation in Hole 959D, with respect to the rgional stress field and potential stress sources, are as follows:
1. The SH orientation in Hole 959D is almost perpendicular to east-west SH orientation of the first-order stress province western and north central Africa. Moreover, the SH orienta-tions of the three focal mechanisms in Ghana have an angmore than 45° with respect to the strike of the CIG TransfoMargin.
2. The available stress data suggests that SH becomes re-orientedin a 100-km-wide zone to the north of the CIG Transform Mgin and that the CIG Transform Margin is a weak fault. Fthermore, the data suggests that sediment loading and lavariation in crustal thickness and density may only have anor influence on the stress field in this area.
ACKNOWLEDGMENTS
The borehole analyzing programs “Caliper 1.0 für Windows” a“FMSImage 2.1β” are provided by the Geophysikalisches Institutthe University of Karlsruhe, Germany, and I would like to thank Bgit Müller and Martin Brudy for their assistance with these prograThe manuscript benefited from the reviews I received from BiMüller and Martin Brudy (University of Karlsruhe), David Moo(Stanford University), and Ove Stephansson (Royal Institute of Tnology). Much appreciation is due Francisco Gomez (Cornell Uversity) who generated the stress map on Figure 1 and who proothe English of the final version of the manuscript. Graham B(Cornell University) is acknowledged for proofreading an earlier vsion of the English of the manuscript. This work has been suppoby grants G-GU 03447-355 and G-GU 03447-242 from the SweNatural Science Research Council.
REFERENCES
Apel, R., Zoback, M.D., and Fuchs, K., 1993. Drilling-induced tensile frac-tures in the KTB pilot hole. Log Analyst, 34:1–48.
Assumpçao, M., 1992. The regional intraplate stress field in South AmeJ. Geophys. Res., 97:11889–11903.
Basile, C., Mascle, J., Popoff, M., Bouillin, J.P., and Mascle, G., 1993.Côte d’Ivoire-Ghana transform margin: a marginal ridge structdeduced from seismic data. Tectonophysics, 222:1–19.
Bell, J.S., and Gough, D.I., 1979. Northeast-southwest compressive strAlberta: evidence from oil wells. Earth Planet. Sci. Lett., 45:475–482.
Bosworth, W., Strecker, M.R., and Blisniuk, P.M., 1992. Integration of EAfrican Paleostress and present-day stress data: implications for cnental stress field dynamics. J. Geophys. Res., 97:11851–11865.
222
68°
at
n-n-sf.
50nic
drth
y-
ef
e ofm
r-r-erali-
dt
r-s.it
ch-ni-readwr-tedish
ica.
here
ss in
stnti-
Bott, M.H.P., and Dean, D.S., 1972. Stress systems at young continental gins. Nature Phys. Sci., 235:23–25.
Brudy, M., and Zoback, M.D., 1993. Compressive and tensile failure of boholes arbitrarily-inclined to principal stress axes: application to the KTboreholes, Germany. Int. J. Rock. Mech. Min. Sci. & Geomech. Abstr.,30:1035–1038.
Brudy, M., Zoback, M.D., Fuchs, K., Rummel, F., and Baumgärtner, J., 19Estimation of the complete stress tensor to 8 km depth in the KTB sctific drill holes: implications for crustal strength. J. Geophys. Res., 102:18453–18475.
Cloetingh, S.A.P.L., Wortel, M.J.R., and Vlaar, N.J., 1982. Evolution of pasive continental margins and initiation of subduction zones. Nature,297:139–142.
Ekstrom, M.P., Dahan, C., Chen, M.-Y., Lloyd, P., and Rossi, D.J., 1987. Fmation imaging with microelectrical scanning arrays. Log Analyst,28:294–306.
Fuchs, K., and Clauss, B., 1987. Borehole breakout method for stress deter-mination: theory and practice. Univ. of Karlsruhe, Germany.
Hillis, R.R., and Williams, A.F., 1992. Borehole breakouts and stress analin the Timor Sea. In Hurst, A., Griffiths, C.M., and Worthington, P.(Eds.),Geological Applications of Wireline Logs II. Geol. Soc. Spec.Publ. London, 65:157–168.
Isacks, B., Oliver, J., and Sykes, L.R., 1968. Seismology and the new gltectonics. J. Geophys. Res., 73:5855–5899.
Kirsch, G., 1898. Die Theorie der Elastizität und die Bedürfnisse der Ftigkeitslehre. VDIM-Z, 42:797–807.
Lachenbruch, A.H., and Sass, J.H., 1980. Heat flow and energetics of theAndreas fault zone. J. Geophys. Res, 85:6185–6223.
Mardia, K.V., 1972. Statistics of Directional Data: London (AcademicPress).
Mascle, J., Lohmann, G.P., Clift, P.D., et al., 1996. Proc. ODP, Init. Repts.,159: College Station, TX (Ocean Drilling Program).
Mastin, L., 1988. Effect of borehole deviation on breakout orientationsJ.Geophys. Res., 93:9187–9195.
Moos, D., and Zoback, M.D., 1990. Utilization of observations of well bofailure to constrain the orientation and magnitude of crustal stressapplication to continental, Deep Sea Drilling Project, and Ocean DrilliProgram boreholes. J. Geophys. Res., 95:9305–9325.
Mount, V.S., and Suppe, J., 1987. State of stress near the San Andreasimplications for wrench tectonics. Geology, 15:525–538.
————, 1992. Present-day stress orientations adjacent to active strikefaults: California and Sumatra. J. Geophys. Res., 97:11995–12013.
Péska, P., and Zoback, M.D., 1995. Compressive and tensile failureinclined well bores and determination of in situ stress and rock strenJ. Geophys. Res., 100:12791–12811.
Pezard, P.A., Hiscott, R.N., Lovell, M.A., Collela, A., and Malinverno, A1992. Evolution of the Izu-Bonin intraoceanic forearc basin, westePacific, from cores and FMS images. In Hurst, A., Griffiths, C.M., anWorthington, P.F. (Eds.), Geological Applications of Wireline Logs II.Geol. Soc. Spec. Publ. London, 65:43–69.
Plumb, R.A., and Hickman, S.H., 1985. Stress-induced borehole elongaa comparison between the four-arm dipmeter and the borehole televiein the Auburn geothermal well. J. Geophys. Res., 90:5513–5521.
Pontoise, B., Bonvalot, S., Mascle, J., and Basile, C., 1990. Structure crude la marge transformante de Côte d’Ivoire-Ghana deduite des obsetions de gravimétrie en mer. C. R. Acad. Sci. Ser. 2, 310:527–534.
Ritchie, R.H., and Sakakura, A.Y., 1956. Asymptotic expansions of solutiof the heat conduction equation in internally bounded cylindrical geomtry. J. Appl. Phys., 27:1453–1459.
Shamir, G., and Zoback, M.D., 1992. Stress orientation profile to 3.5 depth near the San Andreas Fault at Cajon Pass, California. J. Geophys.Res., 97:5059–5080.
Shipboard Scientific Party, 1996. Site 959. In Mascle, J., Lohmann, G.P.,Clift, P.D., et al., Proc. ODP, Init. Repts., 159: College Station, TX(Ocean Drilling Program), 65–150.
Sipkin, S.A., 1986. Estimation of earthquake source parameters by the insion of waveform data: global seismicity, 1981-1983. Bull. Seismol. Soc.Am., 76:1515–1541.
Stein, C.A., Cloetingh, S., and Wortel, R., 1989. SEASAT-derived gravconstraints on stress and deformation in the northeastern Indian OcGeophys. Res. Lett., 16:823–826.
Stephens, G., and Voight, B., 1982. Hydraulic fracturing theory for contions of thermal stress. Int. J. Rock Mech. Min. Sci., 19:279–284.
Suleiman, A.S., Doser, D.I., and Yarwood, D.R., 1993. Source parameteearthquakes along the coastal margin of West Africa and comparis
IN SITU STRESS AT THE CÔTE D’IVOIRE MARGINAL RIDGE
a n
o
.oe
os-
n,y,ll,.,in,
with earthquakes in other coastal margin settings. Tectonophysics,222:79–91.
Zoback, M.D., 1991. State of stress and crustal deformation along wtransform faults. Philos. Trans. R. Soc. London A, 337:141–150.
Zoback, M.D., Barton, C., Brudy, M., Chang, C., Moos, D., Péska, P., Vernik, L., 1995. A review of some new methods for determining thesitu stress state from observations of borehole failure with applicatioborehole stability and enhanced production in the North Sea. In Fejer-skov, M., and Myrvang, A.M., Rock Stresses in the North Sea, 13-14 Feb-ruary, 1995, Trondheim, Norway: Trondheim, Norway (SINTEF), 6–21.
Zoback, M.D., Moos, D., Mastin, L., and Anderson, R.N., 1985. Well bbreakouts and in situ stress. J. Geophys. Res., 90:5523–5530.
Zoback, M.D., Zoback, M.L., Mount, V.S., Suppe, J., Eaton, J.P., Healy, JOppenheimer, D.H., Reasenberg, P.A., Jones, L.M., Raleigh, C.B., WI.G., Scotti, O., and Wentworth, C.M., 1987. New evidence on the statstress of the San Andreas Fault. Science, 238:1105–1111.
eak
ndin to
re
H.,ng, of
Zoback, M.L., 1992. First- and second-order patterns of stress in the lithphere: the world stress map project. J. Geophys. Res., 97:11703–11728.
Zoback, M.L., Zoback, M.D., Adams, J., Assumpção, M., Bell, S., BergmaE.A., Blümling, P., Brereton, N.R., Denham, D., Ding, J., Fuchs, K., GaN., Gregersen, S., Gupta, H.K., Gvishiani, A., Jacob, K., Klein, R., KnoP., Magee, M., Mercier, J.L., Müller, B.C., Paquin, C., Rajendran, KStephansson, O., Suarez, G., Suter, M., Udias, A., Xu, Z.H., and ZhizhM., 1989. Global patterns of tectonic stress. Nature, 341:291–298.
Date of initial receipt: 16 September 1996Date of acceptance: 30 April 1997Ms 159SR-026
223