2017 alabama kids count data book - voices · 4 3 2017 alabama kids count data book ... nine...
TRANSCRIPT
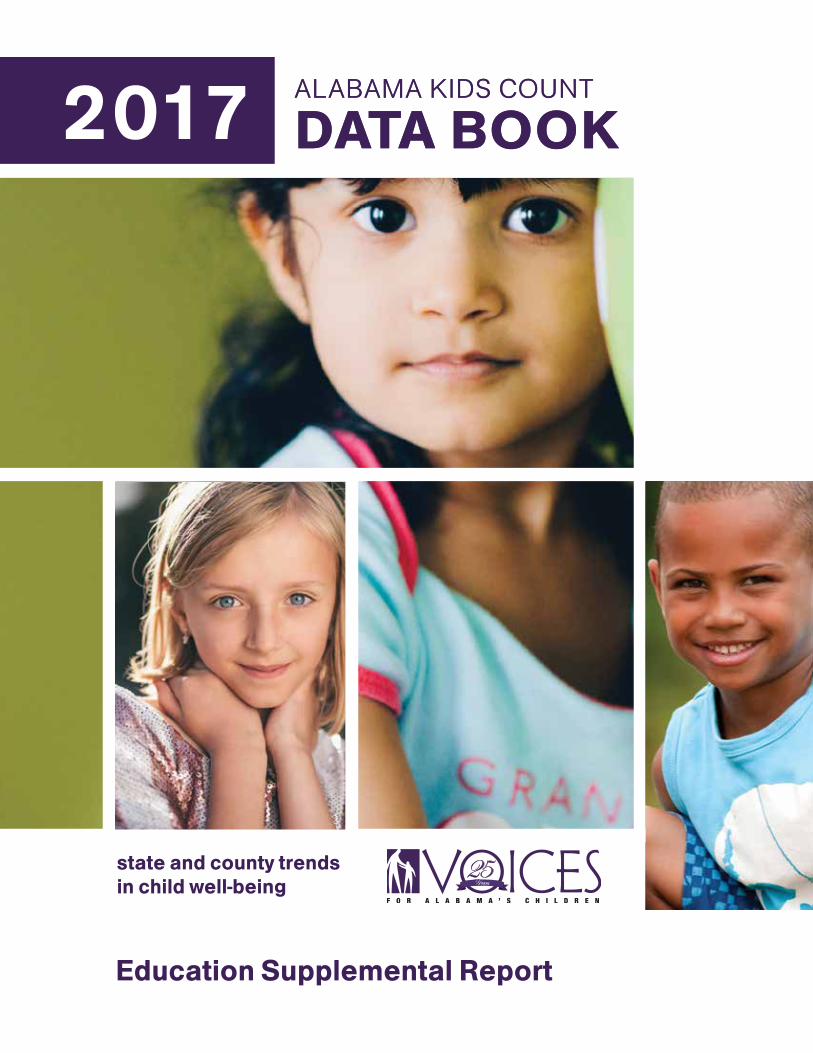
ALABAMA KIDS COUNT DATA BOOK2017 ALABAMA KIDS COUNT DATA BOOK2017
state and county trends in child well-being
Education Supplemental Report
Y
VOICES FOR ALABAMA’S CHILDREN | 2017 Alabama Kids Count Data Book 2
2017 BOARD OF DIRECTORS
Anita Archie | Montgomery, ALJeremy Arthur | Montgomery, AL Nancy Young Fortner | Huntsville, AL Frank A. Franklin, MD | Birmingham, ALGwen Hall | Birmingham, AL Penney P. Hartline | Birmingham, AL Judd A. Harwood | Birmingham, AL Anitra Belle Henderson | Mobile, AL V. Ellen Jackson | Birmingham, AL Quentin P. Riggins | Montgomery, AL Deak Rushton | Birmingham, AL Francis E. Rushton, Jr., MD | Birmingham, ALJoanne Schrantz | Auburn, AL B. Joyce Stallworth, Ph.D. | Tuscaloosa, AL Jera Stribbling | Birmingham, ALMichon Trent | Mobile, AL
VOICES FOR ALABAMA’S CHILDREN STAFF:
Melanie R. Bridgeforth, MSW Executive Director
Kayla Farnon Communications Director
Rebecca Jackson Director of Community Engagement
Chessie Mann Executive Assistant
Rhonda L. Mann Policy & Research Director
CONTACT US:
Post Office Box 4576 Montgomery, AL 36103-4576Phone: 334-213-2410 | Fax: 334-213-2413 [email protected] | www.alavoices.org
OUR
MISSION
ABOUT VOICES FOR ALABAMA’S CHILDREN AND ALABAMA KIDS COUNT
VOICES for Alabama’s Children, founded in 1992, is a 501(c)(3) statewide nonpartisan organization whose mission is to ensure the well-being of Alabama’s children through research, public awareness, and advocacy. Alabama Kids Count is a project of VOICES for Alabama’s Children and the Annie E. Casey Foundation. Our annual research publication, the Alabama Kids Count Data Book, is the most trusted source of research on child well-being for all 67 counties in Alabama. For more than 20 years, the Data Book has served as both a benchmark and roadmap for how children are faring and is used to raise visibility of children’s issues, identify areas of need, set priorities in child well-being and inform decision-making at the state and local levels.
To ensure the well-being of Alabama’s
children through research, public
awareness, and advocacy.
VOICES FOR ALABAMA’S CHILDREN | www.alavoices.org 3
Copyright © 2017 Alabama Kids Count. Permission to copy any or all of this report is granted as long as: VOICES for Alabama’s Children, 2017 Alabama Kids Count Data Book is cited as the source.
The 2017 Alabama Kids Count Data Book can be viewed, downloaded or ordered on the internet at http://www.alavoices.org/research/alabama-kids-count/ or by calling 334.213.2410 or emailing [email protected].
Prepared by Melanie R. Bridgeforth, Executive Director, Rhonda L. Mann, Policy & Research Director and Kayla Farnon, Communications Director
Statistical research and analysis byPublic Affairs Research Council of Alabama Ryan Hankins, Executive DirectorJoe Adams, Ph.D.Kenesha Reynolds, Ph.D.
Data Book Project ConsultantDon Bogie, Ph.D., Professor Emeritusof Sociology, Auburn University, Montgomery
Graphic Design and Art Direction by Errol Hylton, Typiconica, Art Director
Published by VOICES for Alabama’s ChildrenMelanie R. Bridgeforth, MSW, Executive Director
Complete state and county data profiles are available online at http://www.alavoices.org/research/alabama-kids-count/
SPONSORS
SPECIAL ACKNOWLEDGMENTS
Alabama Administrative Office of CourtsDr. Rich Hobson, Executive Director, Administrative Director of Courts
Alabama Department of Early Childhood EducationSecretary Jeana Ross
Alabama State Department of EducationMichael Sentance, State Superintendent of Education
Alabama Department of Human ResourcesCommissioner Nancy Buckner
Alabama Department of LaborFitzgerald Washington, Secretary of the Department of Labor
Alabama Department of Public HealthScott Harris, M.D., State Health Officer
Alabama Department of Rehabilitation ServicesCommissioner Jane Elizabeth Burdeshaw
VOICES for Alabama’s Children
gratefully acknowledges the following
for their assistance in compilation of information
for the 2017 Alabama Kids Count Data Book.
We thank our sponsors for their support and acknowledge that the findings and conclusions presented in the Alabama Kids Count Data Book are those of the author(s) alone and do not necessarily reflect the opinions of these foundations, organizations or individuals.

VOICES FOR ALABAMA’S CHILDREN | 2017 Alabama Kids Count Data Book 4
VOICES FOR ALABAMA’S CHILDREN | www.alavoices.org 5
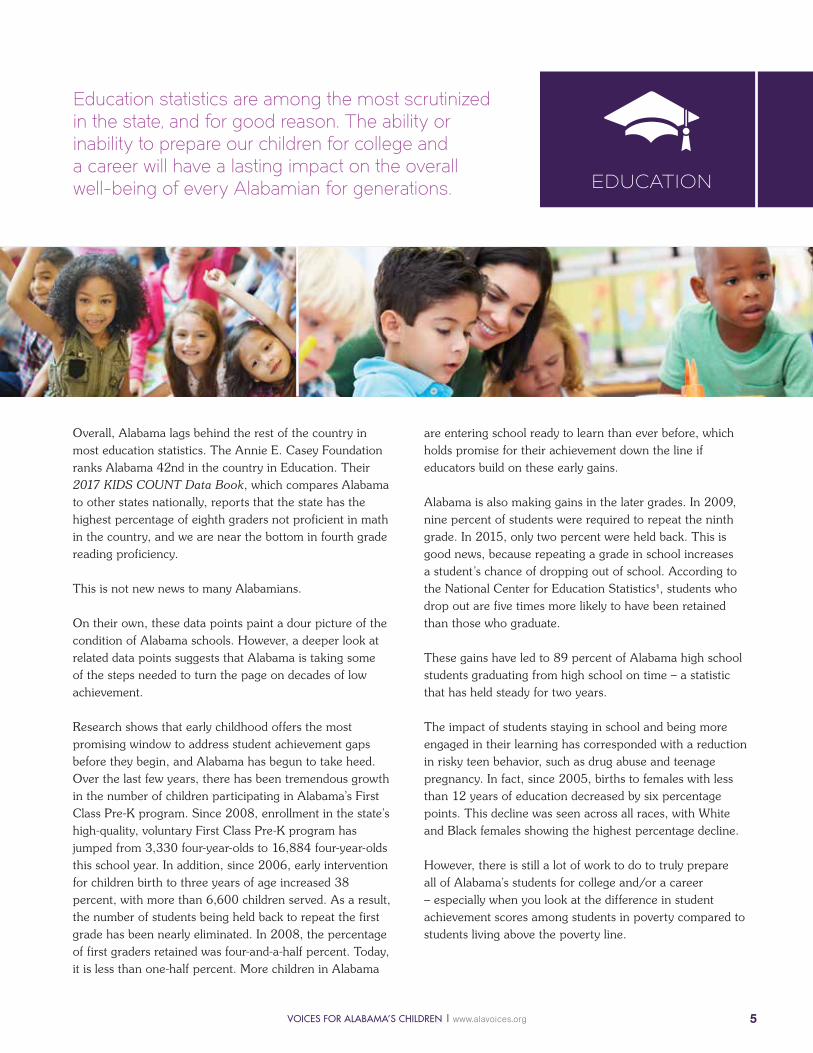
Education statistics are among the most scrutinized in the state, and for good reason. The ability or inability to prepare our children for college and a career will have a lasting impact on the overall well-being of every Alabamian for generations. EDUCATION
are entering school ready to learn than ever before, which holds promise for their achievement down the line if educators build on these early gains.
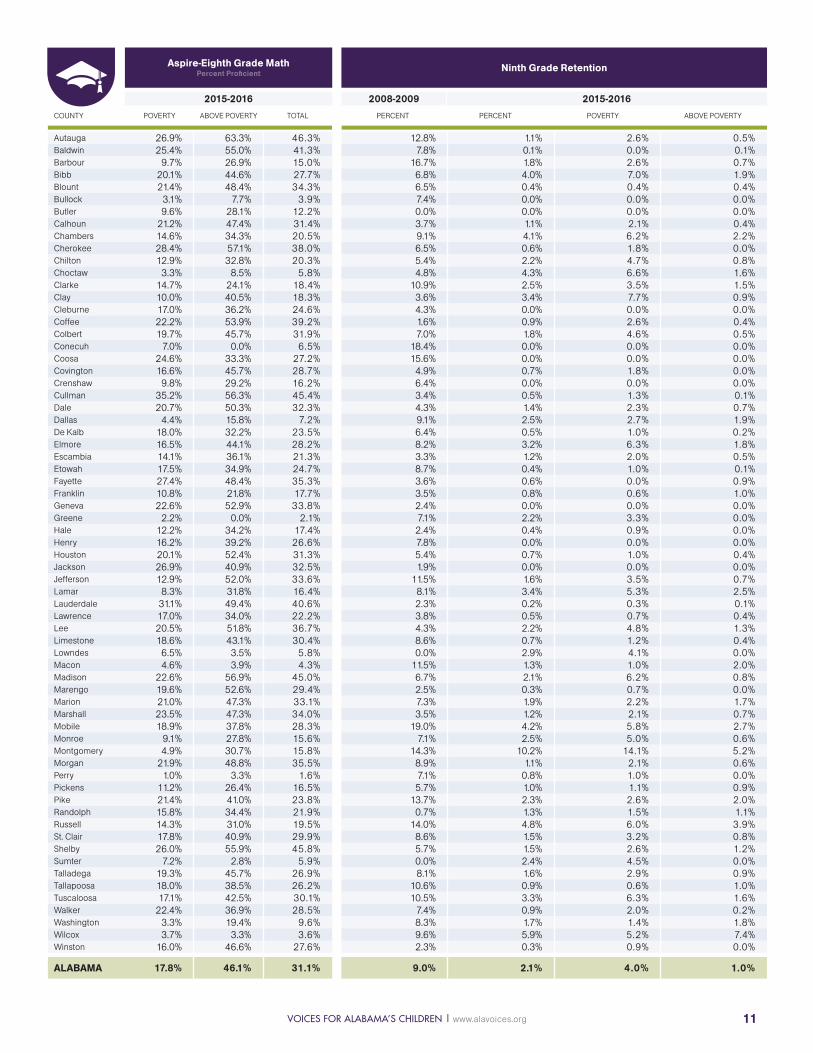
Alabama is also making gains in the later grades. In 2009, nine percent of students were required to repeat the ninth grade. In 2015, only two percent were held back. This is good news, because repeating a grade in school increases a student’s chance of dropping out of school. According to the National Center for Education Statistics1, students who drop out are five times more likely to have been retained than those who graduate.
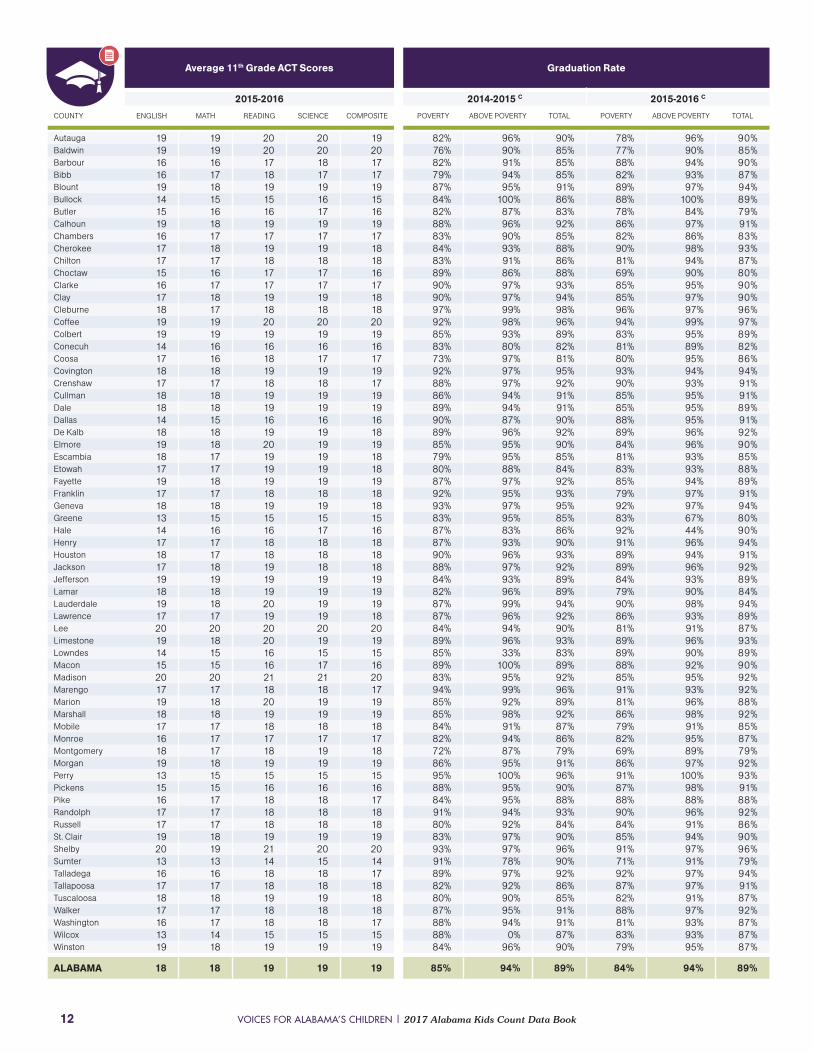
These gains have led to 89 percent of Alabama high school students graduating from high school on time – a statistic that has held steady for two years.
The impact of students staying in school and being more engaged in their learning has corresponded with a reduction in risky teen behavior, such as drug abuse and teenage pregnancy. In fact, since 2005, births to females with less than 12 years of education decreased by six percentage points. This decline was seen across all races, with White and Black females showing the highest percentage decline.
However, there is still a lot of work to do to truly prepare all of Alabama’s students for college and/or a career – especially when you look at the difference in student achievement scores among students in poverty compared to students living above the poverty line.
Overall, Alabama lags behind the rest of the country in most education statistics. The Annie E. Casey Foundation ranks Alabama 42nd in the country in Education. Their 2017 KIDS COUNT Data Book, which compares Alabama to other states nationally, reports that the state has the highest percentage of eighth graders not proficient in math in the country, and we are near the bottom in fourth grade reading proficiency.
This is not new news to many Alabamians.
On their own, these data points paint a dour picture of the condition of Alabama schools. However, a deeper look at related data points suggests that Alabama is taking some of the steps needed to turn the page on decades of low achievement.
Research shows that early childhood offers the most promising window to address student achievement gaps before they begin, and Alabama has begun to take heed. Over the last few years, there has been tremendous growth in the number of children participating in Alabama’s First Class Pre-K program. Since 2008, enrollment in the state’s high-quality, voluntary First Class Pre-K program has jumped from 3,330 four-year-olds to 16,884 four-year-olds this school year. In addition, since 2006, early intervention for children birth to three years of age increased 38 percent, with more than 6,600 children served. As a result, the number of students being held back to repeat the first grade has been nearly eliminated. In 2008, the percentage of first graders retained was four-and-a-half percent. Today, it is less than one-half percent. More children in Alabama
VOICES FOR ALABAMA’S CHILDREN | 2017 Alabama Kids Count Data Book 6
EDUCATION
DISCUSSION AND
KEY POINTS
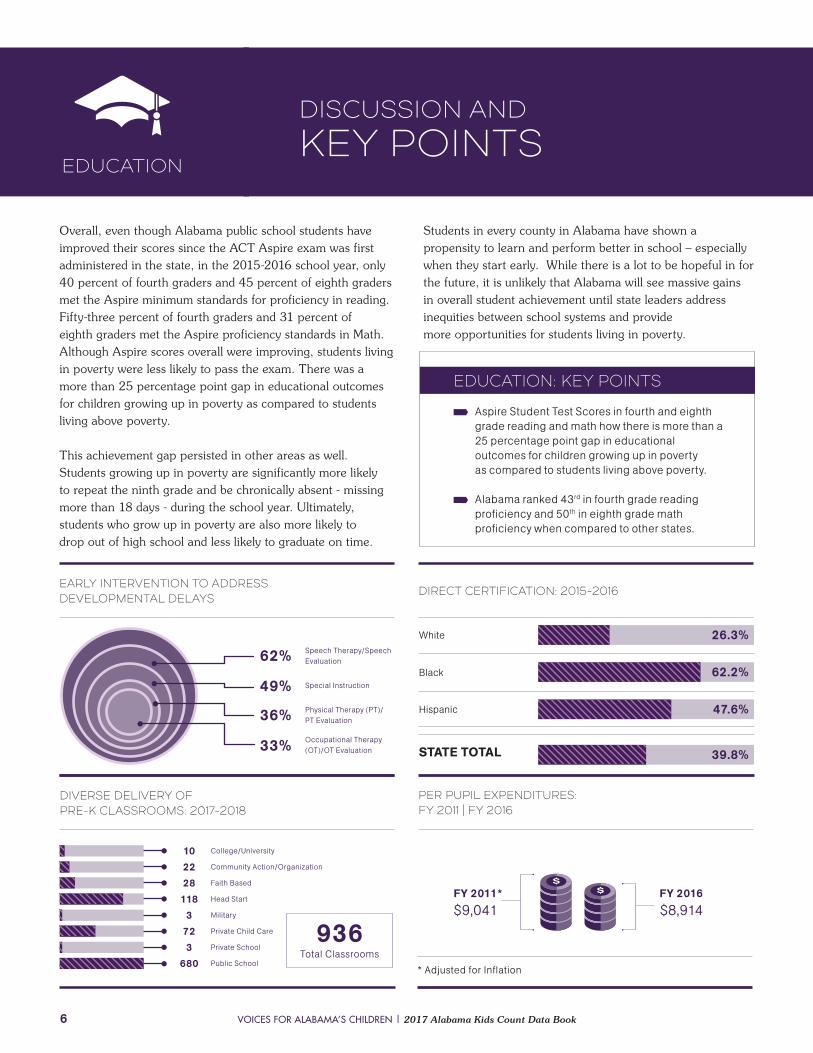
DIRECT CERTIFICATION: 2015-2016
White
Black
Hispanic
STATE TOTAL
26.3%
62.2%
47.6%
39.8%
PER PUPIL EXPENDITURES: FY 2011 | FY 2016
FY 2011*$9,041
FY 2016$8,914
* Adjusted for Inflation
DIVERSE DELIVERY OF PRE-K CLASSROOMS: 2017-2018
EARLY INTERVENTION TO ADDRESS DEVELOPMENTAL DELAYS
62% Speech Therapy/Speech Evaluation
College/University
Community Action/Organization
Faith Based
Head Start
Military
Private School
Private Child Care
Public School
Special Instruction
Physical Therapy (PT)/ PT Evaluation
Occupational Therapy (OT)/OT Evaluation
36%
49%
33%
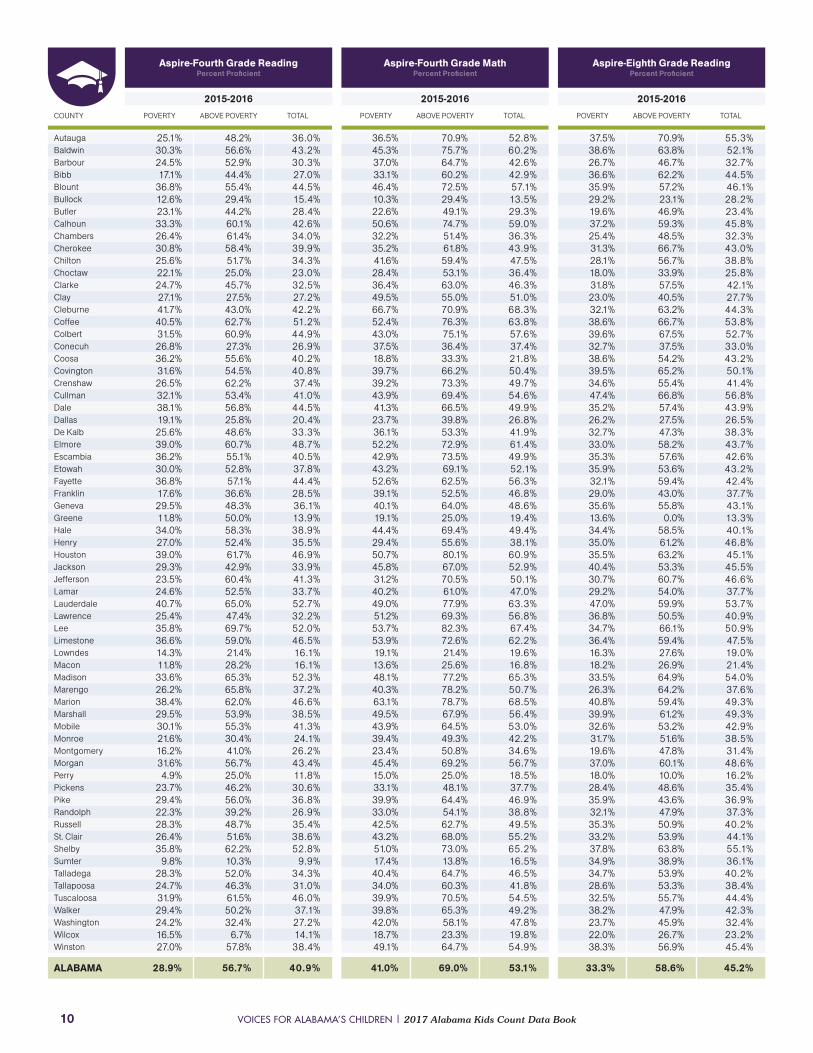
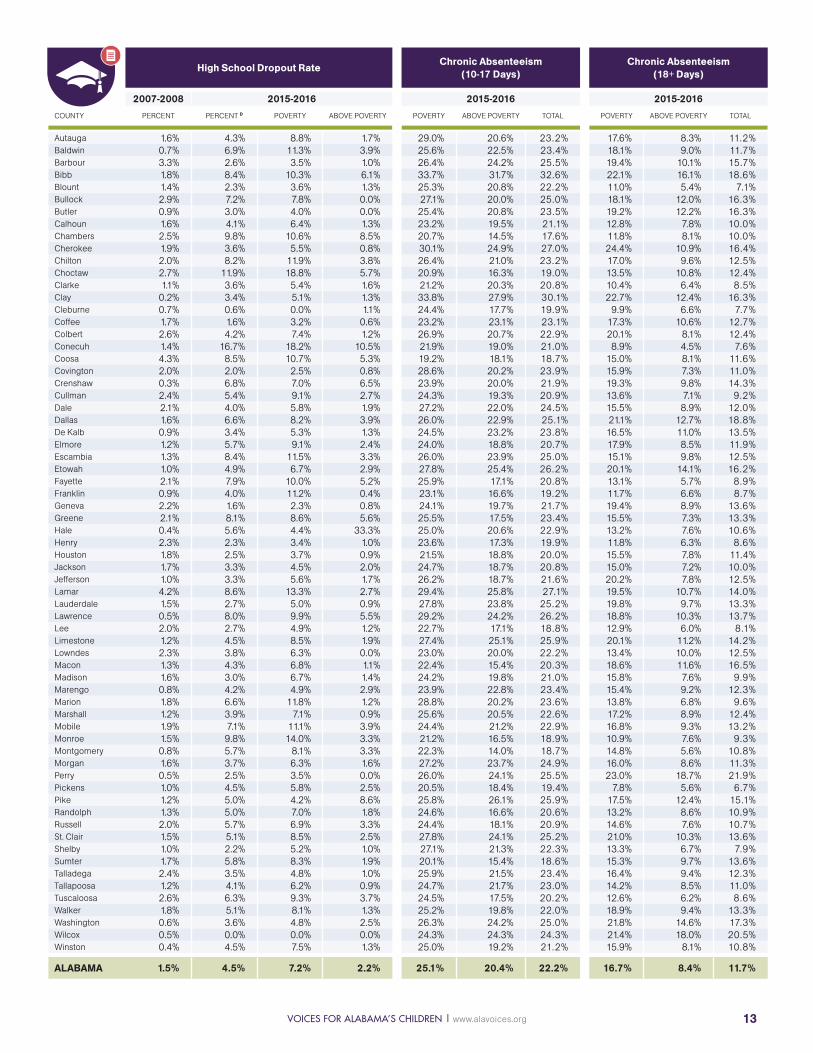
Overall, even though Alabama public school students have improved their scores since the ACT Aspire exam was first administered in the state, in the 2015-2016 school year, only 40 percent of fourth graders and 45 percent of eighth graders met the Aspire minimum standards for proficiency in reading. Fifty-three percent of fourth graders and 31 percent of eighth graders met the Aspire proficiency standards in Math. Although Aspire scores overall were improving, students living in poverty were less likely to pass the exam. There was a more than 25 percentage point gap in educational outcomes for children growing up in poverty as compared to students living above poverty. This achievement gap persisted in other areas as well. Students growing up in poverty are significantly more likely to repeat the ninth grade and be chronically absent - missing more than 18 days - during the school year. Ultimately, students who grow up in poverty are also more likely to drop out of high school and less likely to graduate on time.
Students in every county in Alabama have shown a propensity to learn and perform better in school – especially when they start early. While there is a lot to be hopeful in for the future, it is unlikely that Alabama will see massive gains in overall student achievement until state leaders address inequities between school systems and provide more opportunities for students living in poverty.
EDUCATION: KEY POINTS
Aspire Student Test Scores in fourth and eighth grade reading and math how there is more than a 25 percentage point gap in educational outcomes for children growing up in poverty as compared to students living above poverty.
Alabama ranked 43rd in fourth grade reading proficiency and 50th in eighth grade math proficiency when compared to other states.
1022
1183
723
28
680
936Total Classrooms
VOICES FOR ALABAMA’S CHILDREN | www.alavoices.org 7
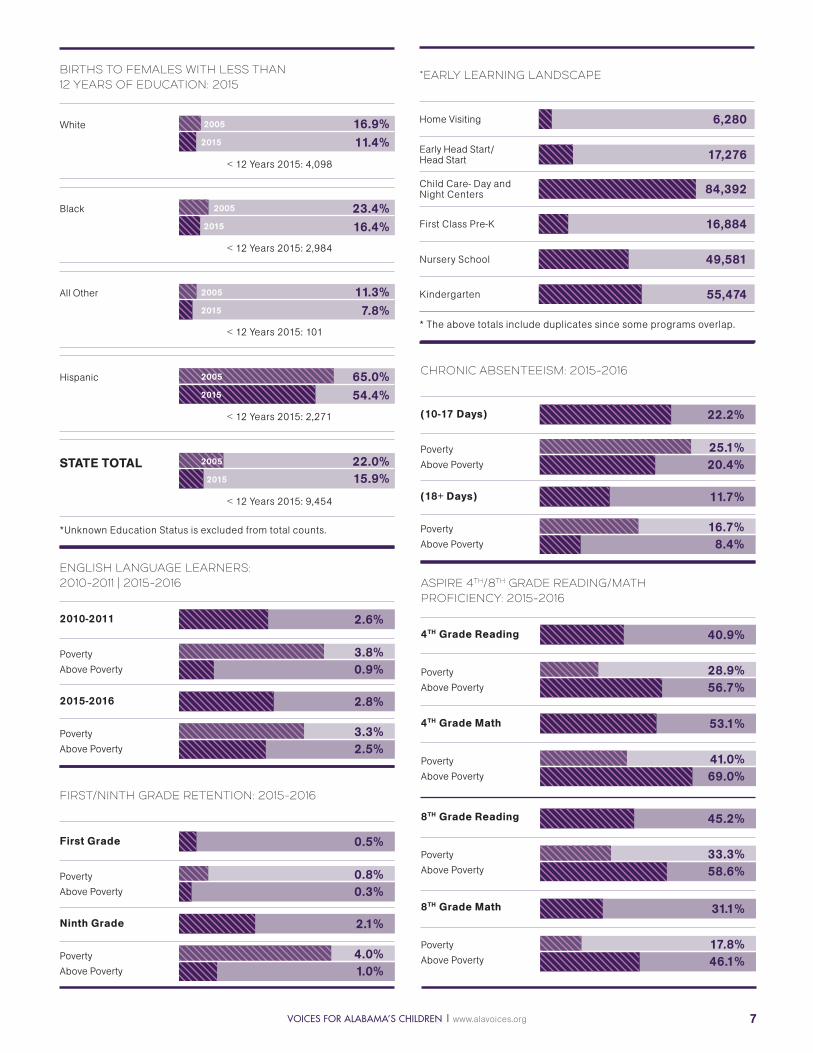
FIRST/NINTH GRADE RETENTION: 2015-2016
ENGLISH LANGUAGE LEARNERS: 2010-2011 | 2015-2016
CHRONIC ABSENTEEISM: 2015-2016
BIRTHS TO FEMALES WITH LESS THAN 12 YEARS OF EDUCATION: 2015
STATE TOTAL 22.0%
23.4%
16.9%
< 12 Years 2015: 9,454
< 12 Years 2015: 2,984
< 12 Years 2015: 4,098
15.9%
16.4%
11.4%
2005
2005
2005
2005
2005
2015
2015
2015
2015
2015
*Unknown Education Status is excluded from total counts.
Hispanic
All Other
Black
White
11.3%
< 12 Years 2015: 101
7.8%
65.0%
< 12 Years 2015: 2,271
54.4%
ASPIRE 4TH/8TH GRADE READING/MATH PROFICIENCY: 2015-2016
Poverty
Poverty
Poverty
Poverty
Above Poverty
Above Poverty
Above Poverty
Above Poverty
28.9%
33.3%
41.0%
17.8%
56.7%
58.6%
69.0%
46.1%
40.9%
45.2%
53.1%
31.1%
4TH Grade Reading
8TH Grade Reading
4TH Grade Math
8TH Grade Math
*EARLY LEARNING LANDSCAPE
17,276Early Head Start/ Head Start
84,392Child Care- Day and Night Centers
16,884First Class Pre-K
49,581Nursery School
55,474Kindergarten
Home Visiting 6,280
* The above totals include duplicates since some programs overlap.
Poverty
Poverty
Poverty
Poverty
Above Poverty
Above Poverty
Above Poverty
Above Poverty
3.8%
25.1%
3.3%
16.7%
0.9%
20.4%
2.5%
8.4%
2.6%
22.2%
2.8%
11.7%
2010-2011
(10-17 Days)
2015-2016
(18+ Days)
Poverty
Poverty
Above Poverty
Above Poverty
0.8%
4.0%
0.3%
1.0%
0.5%
2.1%
First Grade
Ninth Grade
VOICES FOR ALABAMA’S CHILDREN | 2017 Alabama Kids Count Data Book 8
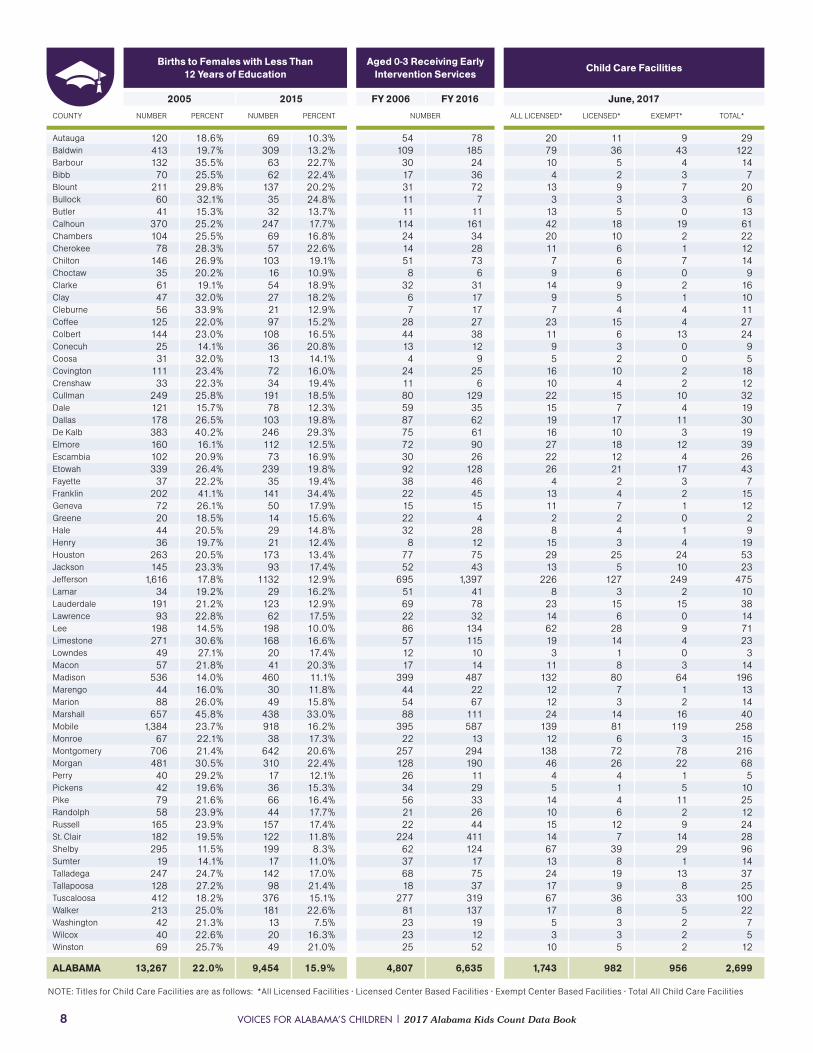
Autauga 120 18.6% 69 10.3% 54 78 20 11 9 29Baldwin 413 19.7% 309 13.2% 109 185 79 36 43 122Barbour 132 35.5% 63 22.7% 30 24 10 5 4 14Bibb 70 25.5% 62 22.4% 17 36 4 2 3 7Blount 211 29.8% 137 20.2% 31 72 13 9 7 20Bullock 60 32.1% 35 24.8% 11 7 3 3 3 6Butler 41 15.3% 32 13.7% 11 11 13 5 0 13Calhoun 370 25.2% 247 17.7% 114 161 42 18 19 61Chambers 104 25.5% 69 16.8% 24 34 20 10 2 22Cherokee 78 28.3% 57 22.6% 14 28 11 6 1 12Chilton 146 26.9% 103 19.1% 51 73 7 6 7 14Choctaw 35 20.2% 16 10.9% 8 6 9 6 0 9Clarke 61 19.1% 54 18.9% 32 31 14 9 2 16Clay 47 32.0% 27 18.2% 6 17 9 5 1 10Cleburne 56 33.9% 21 12.9% 7 17 7 4 4 11Coffee 125 22.0% 97 15.2% 28 27 23 15 4 27Colbert 144 23.0% 108 16.5% 44 38 11 6 13 24Conecuh 25 14.1% 36 20.8% 13 12 9 3 0 9Coosa 31 32.0% 13 14.1% 4 9 5 2 0 5Covington 111 23.4% 72 16.0% 24 25 16 10 2 18Crenshaw 33 22.3% 34 19.4% 11 6 10 4 2 12Cullman 249 25.8% 191 18.5% 80 129 22 15 10 32Dale 121 15.7% 78 12.3% 59 35 15 7 4 19Dallas 178 26.5% 103 19.8% 87 62 19 17 11 30De Kalb 383 40.2% 246 29.3% 75 61 16 10 3 19Elmore 160 16.1% 112 12.5% 72 90 27 18 12 39Escambia 102 20.9% 73 16.9% 30 26 22 12 4 26Etowah 339 26.4% 239 19.8% 92 128 26 21 17 43Fayette 37 22.2% 35 19.4% 38 46 4 2 3 7Franklin 202 41.1% 141 34.4% 22 45 13 4 2 15Geneva 72 26.1% 50 17.9% 15 15 11 7 1 12Greene 20 18.5% 14 15.6% 22 4 2 2 0 2Hale 44 20.5% 29 14.8% 32 28 8 4 1 9Henry 36 19.7% 21 12.4% 8 12 15 3 4 19Houston 263 20.5% 173 13.4% 77 75 29 25 24 53Jackson 145 23.3% 93 17.4% 52 43 13 5 10 23Jefferson 1,616 17.8% 1132 12.9% 695 1,397 226 127 249 475Lamar 34 19.2% 29 16.2% 51 41 8 3 2 10Lauderdale 191 21.2% 123 12.9% 69 78 23 15 15 38Lawrence 93 22.8% 62 17.5% 22 32 14 6 0 14Lee 198 14.5% 198 10.0% 86 134 62 28 9 71Limestone 271 30.6% 168 16.6% 57 115 19 14 4 23Lowndes 49 27.1% 20 17.4% 12 10 3 1 0 3Macon 57 21.8% 41 20.3% 17 14 11 8 3 14Madison 536 14.0% 460 11.1% 399 487 132 80 64 196Marengo 44 16.0% 30 11.8% 44 22 12 7 1 13Marion 88 26.0% 49 15.8% 54 67 12 3 2 14Marshall 657 45.8% 438 33.0% 88 111 24 14 16 40Mobile 1,384 23.7% 918 16.2% 395 587 139 81 119 258Monroe 67 22.1% 38 17.3% 22 13 12 6 3 15Montgomery 706 21.4% 642 20.6% 257 294 138 72 78 216Morgan 481 30.5% 310 22.4% 128 190 46 26 22 68Perry 40 29.2% 17 12.1% 26 11 4 4 1 5Pickens 42 19.6% 36 15.3% 34 29 5 1 5 10Pike 79 21.6% 66 16.4% 56 33 14 4 11 25Randolph 58 23.9% 44 17.7% 21 26 10 6 2 12Russell 165 23.9% 157 17.4% 22 44 15 12 9 24St. Clair 182 19.5% 122 11.8% 224 411 14 7 14 28Shelby 295 11.5% 199 8.3% 62 124 67 39 29 96Sumter 19 14.1% 17 11.0% 37 17 13 8 1 14Talladega 247 24.7% 142 17.0% 68 75 24 19 13 37Tallapoosa 128 27.2% 98 21.4% 18 37 17 9 8 25Tuscaloosa 412 18.2% 376 15.1% 277 319 67 36 33 100Walker 213 25.0% 181 22.6% 81 137 17 8 5 22Washington 42 21.3% 13 7.5% 23 19 5 3 2 7Wilcox 40 22.6% 20 16.3% 23 12 3 3 2 5Winston 69 25.7% 49 21.0% 25 52 10 5 2 12
ALABAMA 13,267 22.0% 9,454 15.9% 4,807 6,635 1,743 982 956 2,699
Births to Females with Less Than 12 Years of Education
Aged 0-3 Receiving Early Intervention Services Child Care Facilities
2005 2015 FY 2006 FY 2016 June, 2017COUNTY NUMBER PERCENT NUMBER PERCENT NUMBER ALL LICENSED* LICENSED* EXEMPT* TOTAL*
NOTE: Titles for Child Care Facilities are as follows: *All Licensed Facilities • Licensed Center Based Facilities • Exempt Center Based Facilities • Total All Child Care Facilities
VOICES FOR ALABAMA’S CHILDREN | www.alavoices.org 9
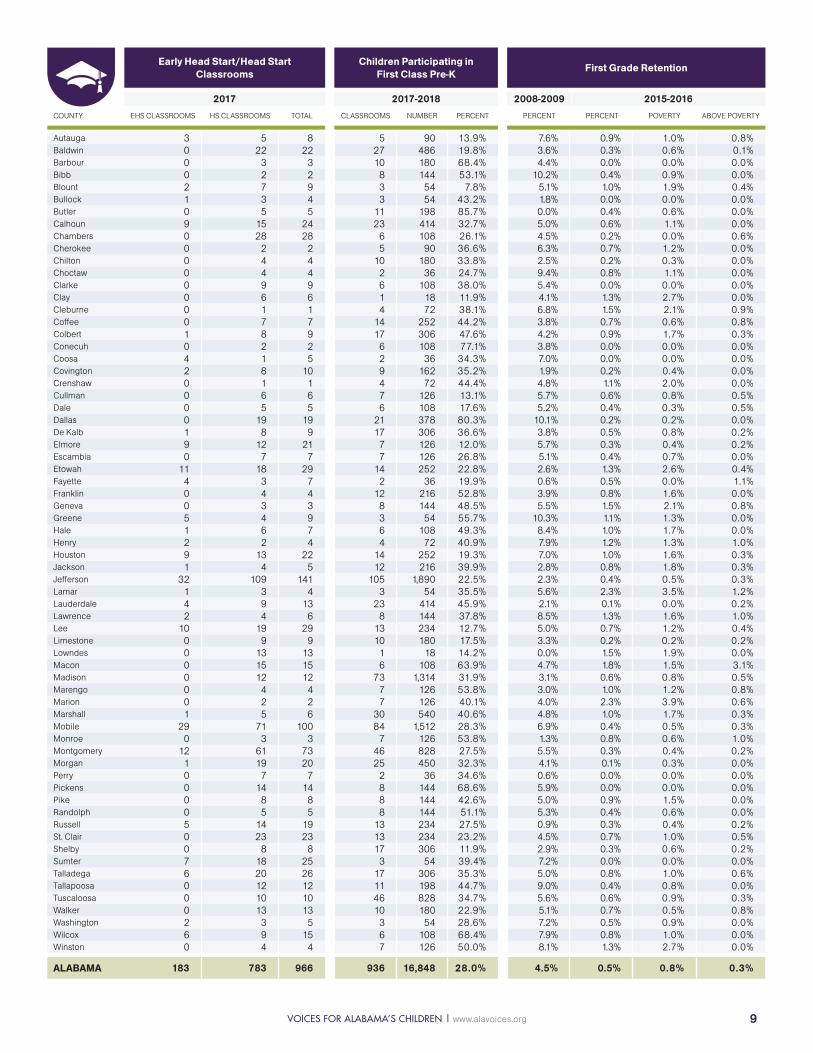
Early Head Start/Head Start Classrooms
Children Participating in First Class Pre-K First Grade Retention
2017 2017-2018 2008-2009 2015-2016COUNTY EHS CLASSROOMS HS CLASSROOMS TOTAL CLASSROOMS NUMBER PERCENT PERCENT PERCENT POVERTY ABOVE POVERTY
Autauga 3 5 8 5 90 13.9% 7.6% 0.9% 1.0% 0.8%Baldwin 0 22 22 27 486 19.8% 3.6% 0.3% 0.6% 0.1%Barbour 0 3 3 10 180 68.4% 4.4% 0.0% 0.0% 0.0%Bibb 0 2 2 8 144 53.1% 10.2% 0.4% 0.9% 0.0%Blount 2 7 9 3 54 7.8% 5.1% 1.0% 1.9% 0.4%Bullock 1 3 4 3 54 43.2% 1.8% 0.0% 0.0% 0.0%Butler 0 5 5 11 198 85.7% 0.0% 0.4% 0.6% 0.0%Calhoun 9 15 24 23 414 32.7% 5.0% 0.6% 1.1% 0.0%Chambers 0 28 28 6 108 26.1% 4.5% 0.2% 0.0% 0.6%Cherokee 0 2 2 5 90 36.6% 6.3% 0.7% 1.2% 0.0%Chilton 0 4 4 10 180 33.8% 2.5% 0.2% 0.3% 0.0%Choctaw 0 4 4 2 36 24.7% 9.4% 0.8% 1.1% 0.0%Clarke 0 9 9 6 108 38.0% 5.4% 0.0% 0.0% 0.0%Clay 0 6 6 1 18 11.9% 4.1% 1.3% 2.7% 0.0%Cleburne 0 1 1 4 72 38.1% 6.8% 1.5% 2.1% 0.9%Coffee 0 7 7 14 252 44.2% 3.8% 0.7% 0.6% 0.8%Colbert 1 8 9 17 306 47.6% 4.2% 0.9% 1.7% 0.3%Conecuh 0 2 2 6 108 77.1% 3.8% 0.0% 0.0% 0.0%Coosa 4 1 5 2 36 34.3% 7.0% 0.0% 0.0% 0.0%Covington 2 8 10 9 162 35.2% 1.9% 0.2% 0.4% 0.0%Crenshaw 0 1 1 4 72 44.4% 4.8% 1.1% 2.0% 0.0%Cullman 0 6 6 7 126 13.1% 5.7% 0.6% 0.8% 0.5%Dale 0 5 5 6 108 17.6% 5.2% 0.4% 0.3% 0.5%Dallas 0 19 19 21 378 80.3% 10.1% 0.2% 0.2% 0.0%De Kalb 1 8 9 17 306 36.6% 3.8% 0.5% 0.8% 0.2%Elmore 9 12 21 7 126 12.0% 5.7% 0.3% 0.4% 0.2%Escambia 0 7 7 7 126 26.8% 5.1% 0.4% 0.7% 0.0%Etowah 11 18 29 14 252 22.8% 2.6% 1.3% 2.6% 0.4%Fayette 4 3 7 2 36 19.9% 0.6% 0.5% 0.0% 1.1%Franklin 0 4 4 12 216 52.8% 3.9% 0.8% 1.6% 0.0%Geneva 0 3 3 8 144 48.5% 5.5% 1.5% 2.1% 0.8%Greene 5 4 9 3 54 55.7% 10.3% 1.1% 1.3% 0.0%Hale 1 6 7 6 108 49.3% 8.4% 1.0% 1.7% 0.0%Henry 2 2 4 4 72 40.9% 7.9% 1.2% 1.3% 1.0%Houston 9 13 22 14 252 19.3% 7.0% 1.0% 1.6% 0.3%Jackson 1 4 5 12 216 39.9% 2.8% 0.8% 1.8% 0.3%Jefferson 32 109 141 105 1,890 22.5% 2.3% 0.4% 0.5% 0.3%Lamar 1 3 4 3 54 35.5% 5.6% 2.3% 3.5% 1.2%Lauderdale 4 9 13 23 414 45.9% 2.1% 0.1% 0.0% 0.2%Lawrence 2 4 6 8 144 37.8% 8.5% 1.3% 1.6% 1.0%Lee 10 19 29 13 234 12.7% 5.0% 0.7% 1.2% 0.4%Limestone 0 9 9 10 180 17.5% 3.3% 0.2% 0.2% 0.2%Lowndes 0 13 13 1 18 14.2% 0.0% 1.5% 1.9% 0.0%Macon 0 15 15 6 108 63.9% 4.7% 1.8% 1.5% 3.1%Madison 0 12 12 73 1,314 31.9% 3.1% 0.6% 0.8% 0.5%Marengo 0 4 4 7 126 53.8% 3.0% 1.0% 1.2% 0.8%Marion 0 2 2 7 126 40.1% 4.0% 2.3% 3.9% 0.6%Marshall 1 5 6 30 540 40.6% 4.8% 1.0% 1.7% 0.3%Mobile 29 71 100 84 1,512 28.3% 6.9% 0.4% 0.5% 0.3%Monroe 0 3 3 7 126 53.8% 1.3% 0.8% 0.6% 1.0%Montgomery 12 61 73 46 828 27.5% 5.5% 0.3% 0.4% 0.2%Morgan 1 19 20 25 450 32.3% 4.1% 0.1% 0.3% 0.0%Perry 0 7 7 2 36 34.6% 0.6% 0.0% 0.0% 0.0%Pickens 0 14 14 8 144 68.6% 5.9% 0.0% 0.0% 0.0%Pike 0 8 8 8 144 42.6% 5.0% 0.9% 1.5% 0.0%Randolph 0 5 5 8 144 51.1% 5.3% 0.4% 0.6% 0.0%Russell 5 14 19 13 234 27.5% 0.9% 0.3% 0.4% 0.2%St. Clair 0 23 23 13 234 23.2% 4.5% 0.7% 1.0% 0.5%Shelby 0 8 8 17 306 11.9% 2.9% 0.3% 0.6% 0.2%Sumter 7 18 25 3 54 39.4% 7.2% 0.0% 0.0% 0.0%Talladega 6 20 26 17 306 35.3% 5.0% 0.8% 1.0% 0.6%Tallapoosa 0 12 12 11 198 44.7% 9.0% 0.4% 0.8% 0.0%Tuscaloosa 0 10 10 46 828 34.7% 5.6% 0.6% 0.9% 0.3%Walker 0 13 13 10 180 22.9% 5.1% 0.7% 0.5% 0.8%Washington 2 3 5 3 54 28.6% 7.2% 0.5% 0.9% 0.0%Wilcox 6 9 15 6 108 68.4% 7.9% 0.8% 1.0% 0.0%Winston 0 4 4 7 126 50.0% 8.1% 1.3% 2.7% 0.0%
ALABAMA 183 783 966 936 16,848 28.0% 4.5% 0.5% 0.8% 0.3%
VOICES FOR ALABAMA’S CHILDREN | 2017 Alabama Kids Count Data Book 10
Autauga 25.1% 48.2% 36.0% 36.5% 70.9% 52.8% 37.5% 70.9% 55.3%Baldwin 30.3% 56.6% 43.2% 45.3% 75.7% 60.2% 38.6% 63.8% 52.1%Barbour 24.5% 52.9% 30.3% 37.0% 64.7% 42.6% 26.7% 46.7% 32.7%Bibb 17.1% 44.4% 27.0% 33.1% 60.2% 42.9% 36.6% 62.2% 44.5%Blount 36.8% 55.4% 44.5% 46.4% 72.5% 57.1% 35.9% 57.2% 46.1%Bullock 12.6% 29.4% 15.4% 10.3% 29.4% 13.5% 29.2% 23.1% 28.2%Butler 23.1% 44.2% 28.4% 22.6% 49.1% 29.3% 19.6% 46.9% 23.4%Calhoun 33.3% 60.1% 42.6% 50.6% 74.7% 59.0% 37.2% 59.3% 45.8%Chambers 26.4% 61.4% 34.0% 32.2% 51.4% 36.3% 25.4% 48.5% 32.3%Cherokee 30.8% 58.4% 39.9% 35.2% 61.8% 43.9% 31.3% 66.7% 43.0%Chilton 25.6% 51.7% 34.3% 41.6% 59.4% 47.5% 28.1% 56.7% 38.8%Choctaw 22.1% 25.0% 23.0% 28.4% 53.1% 36.4% 18.0% 33.9% 25.8%Clarke 24.7% 45.7% 32.5% 36.4% 63.0% 46.3% 31.8% 57.5% 42.1%Clay 27.1% 27.5% 27.2% 49.5% 55.0% 51.0% 23.0% 40.5% 27.7%Cleburne 41.7% 43.0% 42.2% 66.7% 70.9% 68.3% 32.1% 63.2% 44.3%Coffee 40.5% 62.7% 51.2% 52.4% 76.3% 63.8% 38.6% 66.7% 53.8%Colbert 31.5% 60.9% 44.9% 43.0% 75.1% 57.6% 39.6% 67.5% 52.7%Conecuh 26.8% 27.3% 26.9% 37.5% 36.4% 37.4% 32.7% 37.5% 33.0%Coosa 36.2% 55.6% 40.2% 18.8% 33.3% 21.8% 38.6% 54.2% 43.2%Covington 31.6% 54.5% 40.8% 39.7% 66.2% 50.4% 39.5% 65.2% 50.1%Crenshaw 26.5% 62.2% 37.4% 39.2% 73.3% 49.7% 34.6% 55.4% 41.4%Cullman 32.1% 53.4% 41.0% 43.9% 69.4% 54.6% 47.4% 66.8% 56.8%Dale 38.1% 56.8% 44.5% 41.3% 66.5% 49.9% 35.2% 57.4% 43.9%Dallas 19.1% 25.8% 20.4% 23.7% 39.8% 26.8% 26.2% 27.5% 26.5%De Kalb 25.6% 48.6% 33.3% 36.1% 53.3% 41.9% 32.7% 47.3% 38.3%Elmore 39.0% 60.7% 48.7% 52.2% 72.9% 61.4% 33.0% 58.2% 43.7%Escambia 36.2% 55.1% 40.5% 42.9% 73.5% 49.9% 35.3% 57.6% 42.6%Etowah 30.0% 52.8% 37.8% 43.2% 69.1% 52.1% 35.9% 53.6% 43.2%Fayette 36.8% 57.1% 44.4% 52.6% 62.5% 56.3% 32.1% 59.4% 42.4%Franklin 17.6% 36.6% 28.5% 39.1% 52.5% 46.8% 29.0% 43.0% 37.7%Geneva 29.5% 48.3% 36.1% 40.1% 64.0% 48.6% 35.6% 55.8% 43.1%Greene 11.8% 50.0% 13.9% 19.1% 25.0% 19.4% 13.6% 0.0% 13.3%Hale 34.0% 58.3% 38.9% 44.4% 69.4% 49.4% 34.4% 58.5% 40.1%Henry 27.0% 52.4% 35.5% 29.4% 55.6% 38.1% 35.0% 61.2% 46.8%Houston 39.0% 61.7% 46.9% 50.7% 80.1% 60.9% 35.5% 63.2% 45.1%Jackson 29.3% 42.9% 33.9% 45.8% 67.0% 52.9% 40.4% 53.3% 45.5%Jefferson 23.5% 60.4% 41.3% 31.2% 70.5% 50.1% 30.7% 60.7% 46.6%Lamar 24.6% 52.5% 33.7% 40.2% 61.0% 47.0% 29.2% 54.0% 37.7%Lauderdale 40.7% 65.0% 52.7% 49.0% 77.9% 63.3% 47.0% 59.9% 53.7%Lawrence 25.4% 47.4% 32.2% 51.2% 69.3% 56.8% 36.8% 50.5% 40.9%Lee 35.8% 69.7% 52.0% 53.7% 82.3% 67.4% 34.7% 66.1% 50.9%Limestone 36.6% 59.0% 46.5% 53.9% 72.6% 62.2% 36.4% 59.4% 47.5%Lowndes 14.3% 21.4% 16.1% 19.1% 21.4% 19.6% 16.3% 27.6% 19.0%Macon 11.8% 28.2% 16.1% 13.6% 25.6% 16.8% 18.2% 26.9% 21.4%Madison 33.6% 65.3% 52.3% 48.1% 77.2% 65.3% 33.5% 64.9% 54.0%Marengo 26.2% 65.8% 37.2% 40.3% 78.2% 50.7% 26.3% 64.2% 37.6%Marion 38.4% 62.0% 46.6% 63.1% 78.7% 68.5% 40.8% 59.4% 49.3%Marshall 29.5% 53.9% 38.5% 49.5% 67.9% 56.4% 39.9% 61.2% 49.3%Mobile 30.1% 55.3% 41.3% 43.9% 64.5% 53.0% 32.6% 53.2% 42.9%Monroe 21.6% 30.4% 24.1% 39.4% 49.3% 42.2% 31.7% 51.6% 38.5%Montgomery 16.2% 41.0% 26.2% 23.4% 50.8% 34.6% 19.6% 47.8% 31.4%Morgan 31.6% 56.7% 43.4% 45.4% 69.2% 56.7% 37.0% 60.1% 48.6%Perry 4.9% 25.0% 11.8% 15.0% 25.0% 18.5% 18.0% 10.0% 16.2%Pickens 23.7% 46.2% 30.6% 33.1% 48.1% 37.7% 28.4% 48.6% 35.4%Pike 29.4% 56.0% 36.8% 39.9% 64.4% 46.9% 35.9% 43.6% 36.9%Randolph 22.3% 39.2% 26.9% 33.0% 54.1% 38.8% 32.1% 47.9% 37.3%Russell 28.3% 48.7% 35.4% 42.5% 62.7% 49.5% 35.3% 50.9% 40.2%St. Clair 26.4% 51.6% 38.6% 43.2% 68.0% 55.2% 33.2% 53.9% 44.1%Shelby 35.8% 62.2% 52.8% 51.0% 73.0% 65.2% 37.8% 63.8% 55.1%Sumter 9.8% 10.3% 9.9% 17.4% 13.8% 16.5% 34.9% 38.9% 36.1%Talladega 28.3% 52.0% 34.3% 40.4% 64.7% 46.5% 34.7% 53.9% 40.2%Tallapoosa 24.7% 46.3% 31.0% 34.0% 60.3% 41.8% 28.6% 53.3% 38.4%Tuscaloosa 31.9% 61.5% 46.0% 39.9% 70.5% 54.5% 32.5% 55.7% 44.4%Walker 29.4% 50.2% 37.1% 39.8% 65.3% 49.2% 38.2% 47.9% 42.3%Washington 24.2% 32.4% 27.2% 42.0% 58.1% 47.8% 23.7% 45.9% 32.4%Wilcox 16.5% 6.7% 14.1% 18.7% 23.3% 19.8% 22.0% 26.7% 23.2%Winston 27.0% 57.8% 38.4% 49.1% 64.7% 54.9% 38.3% 56.9% 45.4%
ALABAMA 28.9% 56.7% 40.9% 41.0% 69.0% 53.1% 33.3% 58.6% 45.2%
Aspire-Fourth Grade ReadingPercent Proficient
Aspire-Fourth Grade MathPercent Proficient
Aspire-Eighth Grade ReadingPercent Proficient
2015-2016 2015-2016 2015-2016COUNTY POVERTY ABOVE POVERTY TOTAL POVERTY ABOVE POVERTY TOTAL POVERTY ABOVE POVERTY TOTAL
VOICES FOR ALABAMA’S CHILDREN | www.alavoices.org 11
Autauga 26.9% 63.3% 46.3% 12.8% 1.1% 2.6% 0.5%Baldwin 25.4% 55.0% 41.3% 7.8% 0.1% 0.0% 0.1%Barbour 9.7% 26.9% 15.0% 16.7% 1.8% 2.6% 0.7%Bibb 20.1% 44.6% 27.7% 6.8% 4.0% 7.0% 1.9%Blount 21.4% 48.4% 34.3% 6.5% 0.4% 0.4% 0.4%Bullock 3.1% 7.7% 3.9% 7.4% 0.0% 0.0% 0.0%Butler 9.6% 28.1% 12.2% 0.0% 0.0% 0.0% 0.0%Calhoun 21.2% 47.4% 31.4% 3.7% 1.1% 2.1% 0.4%Chambers 14.6% 34.3% 20.5% 9.1% 4.1% 6.2% 2.2%Cherokee 28.4% 57.1% 38.0% 6.5% 0.6% 1.8% 0.0%Chilton 12.9% 32.8% 20.3% 5.4% 2.2% 4.7% 0.8%Choctaw 3.3% 8.5% 5.8% 4.8% 4.3% 6.6% 1.6%Clarke 14.7% 24.1% 18.4% 10.9% 2.5% 3.5% 1.5%Clay 10.0% 40.5% 18.3% 3.6% 3.4% 7.7% 0.9%Cleburne 17.0% 36.2% 24.6% 4.3% 0.0% 0.0% 0.0%Coffee 22.2% 53.9% 39.2% 1.6% 0.9% 2.6% 0.4%Colbert 19.7% 45.7% 31.9% 7.0% 1.8% 4.6% 0.5%Conecuh 7.0% 0.0% 6.5% 18.4% 0.0% 0.0% 0.0%Coosa 24.6% 33.3% 27.2% 15.6% 0.0% 0.0% 0.0%Covington 16.6% 45.7% 28.7% 4.9% 0.7% 1.8% 0.0%Crenshaw 9.8% 29.2% 16.2% 6.4% 0.0% 0.0% 0.0%Cullman 35.2% 56.3% 45.4% 3.4% 0.5% 1.3% 0.1%Dale 20.7% 50.3% 32.3% 4.3% 1.4% 2.3% 0.7%Dallas 4.4% 15.8% 7.2% 9.1% 2.5% 2.7% 1.9%De Kalb 18.0% 32.2% 23.5% 6.4% 0.5% 1.0% 0.2%Elmore 16.5% 44.1% 28.2% 8.2% 3.2% 6.3% 1.8%Escambia 14.1% 36.1% 21.3% 3.3% 1.2% 2.0% 0.5%Etowah 17.5% 34.9% 24.7% 8.7% 0.4% 1.0% 0.1%Fayette 27.4% 48.4% 35.3% 3.6% 0.6% 0.0% 0.9%Franklin 10.8% 21.8% 17.7% 3.5% 0.8% 0.6% 1.0%Geneva 22.6% 52.9% 33.8% 2.4% 0.0% 0.0% 0.0%Greene 2.2% 0.0% 2.1% 7.1% 2.2% 3.3% 0.0%Hale 12.2% 34.2% 17.4% 2.4% 0.4% 0.9% 0.0%Henry 16.2% 39.2% 26.6% 7.8% 0.0% 0.0% 0.0%Houston 20.1% 52.4% 31.3% 5.4% 0.7% 1.0% 0.4%Jackson 26.9% 40.9% 32.5% 1.9% 0.0% 0.0% 0.0%Jefferson 12.9% 52.0% 33.6% 11.5% 1.6% 3.5% 0.7%Lamar 8.3% 31.8% 16.4% 8.1% 3.4% 5.3% 2.5%Lauderdale 31.1% 49.4% 40.6% 2.3% 0.2% 0.3% 0.1%Lawrence 17.0% 34.0% 22.2% 3.8% 0.5% 0.7% 0.4%Lee 20.5% 51.8% 36.7% 4.3% 2.2% 4.8% 1.3%Limestone 18.6% 43.1% 30.4% 8.6% 0.7% 1.2% 0.4%Lowndes 6.5% 3.5% 5.8% 0.0% 2.9% 4.1% 0.0%Macon 4.6% 3.9% 4.3% 11.5% 1.3% 1.0% 2.0%Madison 22.6% 56.9% 45.0% 6.7% 2.1% 6.2% 0.8%Marengo 19.6% 52.6% 29.4% 2.5% 0.3% 0.7% 0.0%Marion 21.0% 47.3% 33.1% 7.3% 1.9% 2.2% 1.7%Marshall 23.5% 47.3% 34.0% 3.5% 1.2% 2.1% 0.7%Mobile 18.9% 37.8% 28.3% 19.0% 4.2% 5.8% 2.7%Monroe 9.1% 27.8% 15.6% 7.1% 2.5% 5.0% 0.6%Montgomery 4.9% 30.7% 15.8% 14.3% 10.2% 14.1% 5.2%Morgan 21.9% 48.8% 35.5% 8.9% 1.1% 2.1% 0.6%Perry 1.0% 3.3% 1.6% 7.1% 0.8% 1.0% 0.0%Pickens 11.2% 26.4% 16.5% 5.7% 1.0% 1.1% 0.9%Pike 21.4% 41.0% 23.8% 13.7% 2.3% 2.6% 2.0%Randolph 15.8% 34.4% 21.9% 0.7% 1.3% 1.5% 1.1%Russell 14.3% 31.0% 19.5% 14.0% 4.8% 6.0% 3.9%St. Clair 17.8% 40.9% 29.9% 8.6% 1.5% 3.2% 0.8%Shelby 26.0% 55.9% 45.8% 5.7% 1.5% 2.6% 1.2%Sumter 7.2% 2.8% 5.9% 0.0% 2.4% 4.5% 0.0%Talladega 19.3% 45.7% 26.9% 8.1% 1.6% 2.9% 0.9%Tallapoosa 18.0% 38.5% 26.2% 10.6% 0.9% 0.6% 1.0%Tuscaloosa 17.1% 42.5% 30.1% 10.5% 3.3% 6.3% 1.6%Walker 22.4% 36.9% 28.5% 7.4% 0.9% 2.0% 0.2%Washington 3.3% 19.4% 9.6% 8.3% 1.7% 1.4% 1.8%Wilcox 3.7% 3.3% 3.6% 9.6% 5.9% 5.2% 7.4%Winston 16.0% 46.6% 27.6% 2.3% 0.3% 0.9% 0.0%
ALABAMA 17.8% 46.1% 31.1% 9.0% 2.1% 4.0% 1.0%
Aspire-Eighth Grade MathPercent Proficient Ninth Grade Retention
2015-2016 2008-2009 2015-2016COUNTY POVERTY ABOVE POVERTY TOTAL PERCENT PERCENT POVERTY ABOVE POVERTY
VOICES FOR ALABAMA’S CHILDREN | 2017 Alabama Kids Count Data Book 12
Autauga 19 19 20 20 19 82% 96% 90% 78% 96% 90%Baldwin 19 19 20 20 20 76% 90% 85% 77% 90% 85%Barbour 16 16 17 18 17 82% 91% 85% 88% 94% 90%Bibb 16 17 18 17 17 79% 94% 85% 82% 93% 87%Blount 19 18 19 19 19 87% 95% 91% 89% 97% 94%Bullock 14 15 15 16 15 84% 100% 86% 88% 100% 89%Butler 15 16 16 17 16 82% 87% 83% 78% 84% 79%Calhoun 19 18 19 19 19 88% 96% 92% 86% 97% 91%Chambers 16 17 17 17 17 83% 90% 85% 82% 86% 83%Cherokee 17 18 19 19 18 84% 93% 88% 90% 98% 93%Chilton 17 17 18 18 18 83% 91% 86% 81% 94% 87%Choctaw 15 16 17 17 16 89% 86% 88% 69% 90% 80%Clarke 16 17 17 17 17 90% 97% 93% 85% 95% 90%Clay 17 18 19 19 18 90% 97% 94% 85% 97% 90%Cleburne 18 17 18 18 18 97% 99% 98% 96% 97% 96%Coffee 19 19 20 20 20 92% 98% 96% 94% 99% 97%Colbert 19 19 19 19 19 85% 93% 89% 83% 95% 89%Conecuh 14 16 16 16 16 83% 80% 82% 81% 89% 82%Coosa 17 16 18 17 17 73% 97% 81% 80% 95% 86%Covington 18 18 19 19 19 92% 97% 95% 93% 94% 94%Crenshaw 17 17 18 18 17 88% 97% 92% 90% 93% 91%Cullman 18 18 19 19 19 86% 94% 91% 85% 95% 91%Dale 18 18 19 19 19 89% 94% 91% 85% 95% 89%Dallas 14 15 16 16 16 90% 87% 90% 88% 95% 91%De Kalb 18 18 19 19 18 89% 96% 92% 89% 96% 92%Elmore 19 18 20 19 19 85% 95% 90% 84% 96% 90%Escambia 18 17 19 19 18 79% 95% 85% 81% 93% 85%Etowah 17 17 19 19 18 80% 88% 84% 83% 93% 88%Fayette 19 18 19 19 19 87% 97% 92% 85% 94% 89%Franklin 17 17 18 18 18 92% 95% 93% 79% 97% 91%Geneva 18 18 19 19 18 93% 97% 95% 92% 97% 94%Greene 13 15 15 15 15 83% 95% 85% 83% 67% 80%Hale 14 16 16 17 16 87% 83% 86% 92% 44% 90%Henry 17 17 18 18 18 87% 93% 90% 91% 96% 94%Houston 18 17 18 18 18 90% 96% 93% 89% 94% 91%Jackson 17 18 19 18 18 88% 97% 92% 89% 96% 92%Jefferson 19 19 19 19 19 84% 93% 89% 84% 93% 89%Lamar 18 18 19 19 19 82% 96% 89% 79% 90% 84%Lauderdale 19 18 20 19 19 87% 99% 94% 90% 98% 94%Lawrence 17 17 19 19 18 87% 96% 92% 86% 93% 89%Lee 20 20 20 20 20 84% 94% 90% 81% 91% 87%Limestone 19 18 20 19 19 89% 96% 93% 89% 96% 93%Lowndes 14 15 16 15 15 85% 33% 83% 89% 90% 89%Macon 15 15 16 17 16 89% 100% 89% 88% 92% 90%Madison 20 20 21 21 20 83% 95% 92% 85% 95% 92%Marengo 17 17 18 18 17 94% 99% 96% 91% 93% 92%Marion 19 18 20 19 19 85% 92% 89% 81% 96% 88%Marshall 18 18 19 19 19 85% 98% 92% 86% 98% 92%Mobile 17 17 18 18 18 84% 91% 87% 79% 91% 85%Monroe 16 17 17 17 17 82% 94% 86% 82% 95% 87%Montgomery 18 17 18 19 18 72% 87% 79% 69% 89% 79%Morgan 19 18 19 19 19 86% 95% 91% 86% 97% 92%Perry 13 15 15 15 15 95% 100% 96% 91% 100% 93%Pickens 15 15 16 16 16 88% 95% 90% 87% 98% 91%Pike 16 17 18 18 17 84% 95% 88% 88% 88% 88%Randolph 17 17 18 18 18 91% 94% 93% 90% 96% 92%Russell 17 17 18 18 18 80% 92% 84% 84% 91% 86%St. Clair 19 18 19 19 19 83% 97% 90% 85% 94% 90%Shelby 20 19 21 20 20 93% 97% 96% 91% 97% 96%Sumter 13 13 14 15 14 91% 78% 90% 71% 91% 79%Talladega 16 16 18 18 17 89% 97% 92% 92% 97% 94%Tallapoosa 17 17 18 18 18 82% 92% 86% 87% 97% 91%Tuscaloosa 18 18 19 19 18 80% 90% 85% 82% 91% 87%Walker 17 17 18 18 18 87% 95% 91% 88% 97% 92%Washington 16 17 18 18 17 88% 94% 91% 81% 93% 87%Wilcox 13 14 15 15 15 88% 0% 87% 83% 93% 87%Winston 19 18 19 19 19 84% 96% 90% 79% 95% 87%
ALABAMA 18 18 19 19 19 85% 94% 89% 84% 94% 89%
Average 11th Grade ACT Scores Graduation Rate
2015-2016 2014-2015 C 2015-2016 C
COUNTY ENGLISH MATH READING SCIENCE COMPOSITE POVERTY ABOVE POVERTY TOTAL POVERTY ABOVE POVERTY TOTAL
VOICES FOR ALABAMA’S CHILDREN | www.alavoices.org 13
High School Dropout Rate Chronic Absenteeism (10-17 Days)
Chronic Absenteeism (18+ Days)
2007-2008 2015-2016 2015-2016 2015-2016COUNTY PERCENT PERCENT D POVERTY ABOVE POVERTY POVERTY ABOVE POVERTY TOTAL POVERTY ABOVE POVERTY TOTAL
Autauga 1.6% 4.3% 8.8% 1.7% 29.0% 20.6% 23.2% 17.6% 8.3% 11.2%Baldwin 0.7% 6.9% 11.3% 3.9% 25.6% 22.5% 23.4% 18.1% 9.0% 11.7%Barbour 3.3% 2.6% 3.5% 1.0% 26.4% 24.2% 25.5% 19.4% 10.1% 15.7%Bibb 1.8% 8.4% 10.3% 6.1% 33.7% 31.7% 32.6% 22.1% 16.1% 18.6%Blount 1.4% 2.3% 3.6% 1.3% 25.3% 20.8% 22.2% 11.0% 5.4% 7.1%Bullock 2.9% 7.2% 7.8% 0.0% 27.1% 20.0% 25.0% 18.1% 12.0% 16.3%Butler 0.9% 3.0% 4.0% 0.0% 25.4% 20.8% 23.5% 19.2% 12.2% 16.3%Calhoun 1.6% 4.1% 6.4% 1.3% 23.2% 19.5% 21.1% 12.8% 7.8% 10.0%Chambers 2.5% 9.8% 10.6% 8.5% 20.7% 14.5% 17.6% 11.8% 8.1% 10.0%Cherokee 1.9% 3.6% 5.5% 0.8% 30.1% 24.9% 27.0% 24.4% 10.9% 16.4%Chilton 2.0% 8.2% 11.9% 3.8% 26.4% 21.0% 23.2% 17.0% 9.6% 12.5%Choctaw 2.7% 11.9% 18.8% 5.7% 20.9% 16.3% 19.0% 13.5% 10.8% 12.4%Clarke 1.1% 3.6% 5.4% 1.6% 21.2% 20.3% 20.8% 10.4% 6.4% 8.5%Clay 0.2% 3.4% 5.1% 1.3% 33.8% 27.9% 30.1% 22.7% 12.4% 16.3%Cleburne 0.7% 0.6% 0.0% 1.1% 24.4% 17.7% 19.9% 9.9% 6.6% 7.7%Coffee 1.7% 1.6% 3.2% 0.6% 23.2% 23.1% 23.1% 17.3% 10.6% 12.7%Colbert 2.6% 4.2% 7.4% 1.2% 26.9% 20.7% 22.9% 20.1% 8.1% 12.4%Conecuh 1.4% 16.7% 18.2% 10.5% 21.9% 19.0% 21.0% 8.9% 4.5% 7.6%Coosa 4.3% 8.5% 10.7% 5.3% 19.2% 18.1% 18.7% 15.0% 8.1% 11.6%Covington 2.0% 2.0% 2.5% 0.8% 28.6% 20.2% 23.9% 15.9% 7.3% 11.0%Crenshaw 0.3% 6.8% 7.0% 6.5% 23.9% 20.0% 21.9% 19.3% 9.8% 14.3%Cullman 2.4% 5.4% 9.1% 2.7% 24.3% 19.3% 20.9% 13.6% 7.1% 9.2%Dale 2.1% 4.0% 5.8% 1.9% 27.2% 22.0% 24.5% 15.5% 8.9% 12.0%Dallas 1.6% 6.6% 8.2% 3.9% 26.0% 22.9% 25.1% 21.1% 12.7% 18.8%De Kalb 0.9% 3.4% 5.3% 1.3% 24.5% 23.2% 23.8% 16.5% 11.0% 13.5%Elmore 1.2% 5.7% 9.1% 2.4% 24.0% 18.8% 20.7% 17.9% 8.5% 11.9%Escambia 1.3% 8.4% 11.5% 3.3% 26.0% 23.9% 25.0% 15.1% 9.8% 12.5%Etowah 1.0% 4.9% 6.7% 2.9% 27.8% 25.4% 26.2% 20.1% 14.1% 16.2%Fayette 2.1% 7.9% 10.0% 5.2% 25.9% 17.1% 20.8% 13.1% 5.7% 8.9%Franklin 0.9% 4.0% 11.2% 0.4% 23.1% 16.6% 19.2% 11.7% 6.6% 8.7%Geneva 2.2% 1.6% 2.3% 0.8% 24.1% 19.7% 21.7% 19.4% 8.9% 13.6%Greene 2.1% 8.1% 8.6% 5.6% 25.5% 17.5% 23.4% 15.5% 7.3% 13.3%Hale 0.4% 5.6% 4.4% 33.3% 25.0% 20.6% 22.9% 13.2% 7.6% 10.6%Henry 2.3% 2.3% 3.4% 1.0% 23.6% 17.3% 19.9% 11.8% 6.3% 8.6%Houston 1.8% 2.5% 3.7% 0.9% 21.5% 18.8% 20.0% 15.5% 7.8% 11.4%Jackson 1.7% 3.3% 4.5% 2.0% 24.7% 18.7% 20.8% 15.0% 7.2% 10.0%Jefferson 1.0% 3.3% 5.6% 1.7% 26.2% 18.7% 21.6% 20.2% 7.8% 12.5%Lamar 4.2% 8.6% 13.3% 2.7% 29.4% 25.8% 27.1% 19.5% 10.7% 14.0%Lauderdale 1.5% 2.7% 5.0% 0.9% 27.8% 23.8% 25.2% 19.8% 9.7% 13.3%Lawrence 0.5% 8.0% 9.9% 5.5% 29.2% 24.2% 26.2% 18.8% 10.3% 13.7%Lee 2.0% 2.7% 4.9% 1.2% 22.7% 17.1% 18.8% 12.9% 6.0% 8.1%Limestone 1.2% 4.5% 8.5% 1.9% 27.4% 25.1% 25.9% 20.1% 11.2% 14.2%Lowndes 2.3% 3.8% 6.3% 0.0% 23.0% 20.0% 22.2% 13.4% 10.0% 12.5%Macon 1.3% 4.3% 6.8% 1.1% 22.4% 15.4% 20.3% 18.6% 11.6% 16.5%Madison 1.6% 3.0% 6.7% 1.4% 24.2% 19.8% 21.0% 15.8% 7.6% 9.9%Marengo 0.8% 4.2% 4.9% 2.9% 23.9% 22.8% 23.4% 15.4% 9.2% 12.3%Marion 1.8% 6.6% 11.8% 1.2% 28.8% 20.2% 23.6% 13.8% 6.8% 9.6%Marshall 1.2% 3.9% 7.1% 0.9% 25.6% 20.5% 22.6% 17.2% 8.9% 12.4%Mobile 1.9% 7.1% 11.1% 3.9% 24.4% 21.2% 22.9% 16.8% 9.3% 13.2%Monroe 1.5% 9.8% 14.0% 3.3% 21.2% 16.5% 18.9% 10.9% 7.6% 9.3%Montgomery 0.8% 5.7% 8.1% 3.3% 22.3% 14.0% 18.7% 14.8% 5.6% 10.8%Morgan 1.6% 3.7% 6.3% 1.6% 27.2% 23.7% 24.9% 16.0% 8.6% 11.3%Perry 0.5% 2.5% 3.5% 0.0% 26.0% 24.1% 25.5% 23.0% 18.7% 21.9%Pickens 1.0% 4.5% 5.8% 2.5% 20.5% 18.4% 19.4% 7.8% 5.6% 6.7%Pike 1.2% 5.0% 4.2% 8.6% 25.8% 26.1% 25.9% 17.5% 12.4% 15.1%Randolph 1.3% 5.0% 7.0% 1.8% 24.6% 16.6% 20.6% 13.2% 8.6% 10.9%Russell 2.0% 5.7% 6.9% 3.3% 24.4% 18.1% 20.9% 14.6% 7.6% 10.7%St. Clair 1.5% 5.1% 8.5% 2.5% 27.8% 24.1% 25.2% 21.0% 10.3% 13.6%Shelby 1.0% 2.2% 5.2% 1.0% 27.1% 21.3% 22.3% 13.3% 6.7% 7.9%Sumter 1.7% 5.8% 8.3% 1.9% 20.1% 15.4% 18.6% 15.3% 9.7% 13.6%Talladega 2.4% 3.5% 4.8% 1.0% 25.9% 21.5% 23.4% 16.4% 9.4% 12.3%Tallapoosa 1.2% 4.1% 6.2% 0.9% 24.7% 21.7% 23.0% 14.2% 8.5% 11.0%Tuscaloosa 2.6% 6.3% 9.3% 3.7% 24.5% 17.5% 20.2% 12.6% 6.2% 8.6%Walker 1.8% 5.1% 8.1% 1.3% 25.2% 19.8% 22.0% 18.9% 9.4% 13.3%Washington 0.6% 3.6% 4.8% 2.5% 26.3% 24.2% 25.0% 21.8% 14.6% 17.3%Wilcox 0.5% 0.0% 0.0% 0.0% 24.3% 24.3% 24.3% 21.4% 18.0% 20.5%Winston 0.4% 4.5% 7.5% 1.3% 25.0% 19.2% 21.2% 15.9% 8.1% 10.8%
ALABAMA 1.5% 4.5% 7.2% 2.2% 25.1% 20.4% 22.2% 16.7% 8.4% 11.7%
VOICES FOR ALABAMA’S CHILDREN | 2017 Alabama Kids Count Data Book 14
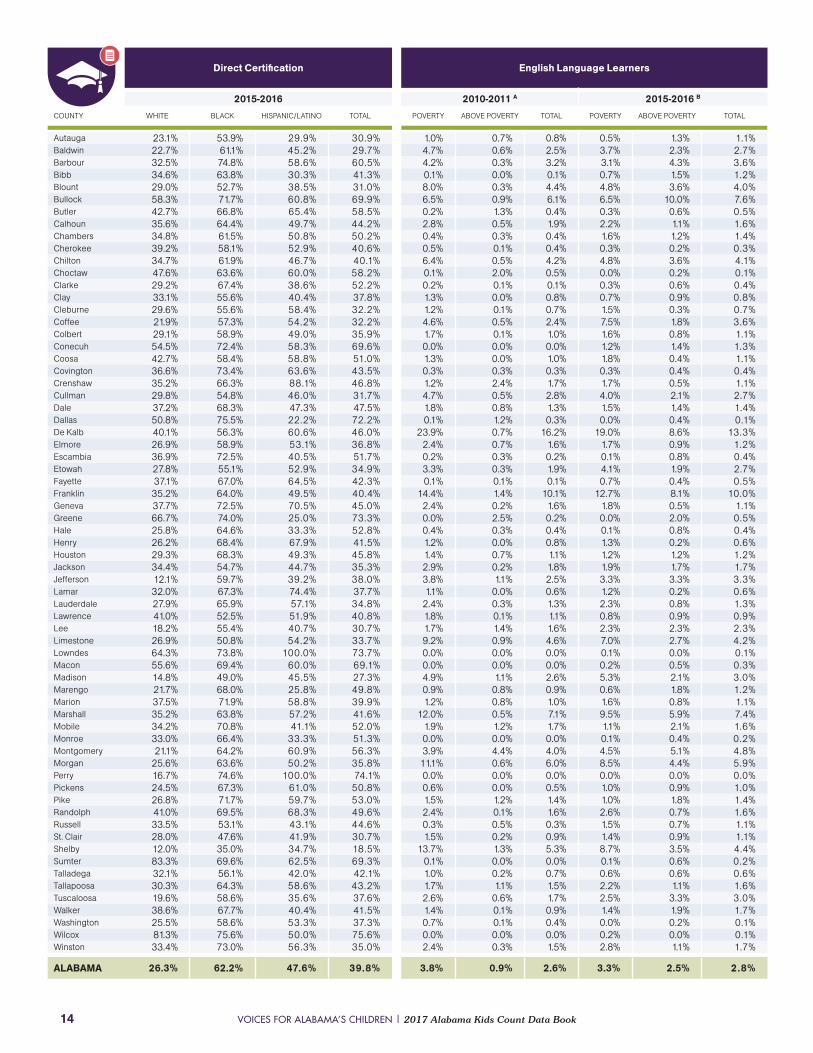
Autauga 23.1% 53.9% 29.9% 30.9% 1.0% 0.7% 0.8% 0.5% 1.3% 1.1%Baldwin 22.7% 61.1% 45.2% 29.7% 4.7% 0.6% 2.5% 3.7% 2.3% 2.7%Barbour 32.5% 74.8% 58.6% 60.5% 4.2% 0.3% 3.2% 3.1% 4.3% 3.6%Bibb 34.6% 63.8% 30.3% 41.3% 0.1% 0.0% 0.1% 0.7% 1.5% 1.2%Blount 29.0% 52.7% 38.5% 31.0% 8.0% 0.3% 4.4% 4.8% 3.6% 4.0%Bullock 58.3% 71.7% 60.8% 69.9% 6.5% 0.9% 6.1% 6.5% 10.0% 7.6%Butler 42.7% 66.8% 65.4% 58.5% 0.2% 1.3% 0.4% 0.3% 0.6% 0.5%Calhoun 35.6% 64.4% 49.7% 44.2% 2.8% 0.5% 1.9% 2.2% 1.1% 1.6%Chambers 34.8% 61.5% 50.8% 50.2% 0.4% 0.3% 0.4% 1.6% 1.2% 1.4%Cherokee 39.2% 58.1% 52.9% 40.6% 0.5% 0.1% 0.4% 0.3% 0.2% 0.3%Chilton 34.7% 61.9% 46.7% 40.1% 6.4% 0.5% 4.2% 4.8% 3.6% 4.1%Choctaw 47.6% 63.6% 60.0% 58.2% 0.1% 2.0% 0.5% 0.0% 0.2% 0.1%Clarke 29.2% 67.4% 38.6% 52.2% 0.2% 0.1% 0.1% 0.3% 0.6% 0.4%Clay 33.1% 55.6% 40.4% 37.8% 1.3% 0.0% 0.8% 0.7% 0.9% 0.8%Cleburne 29.6% 55.6% 58.4% 32.2% 1.2% 0.1% 0.7% 1.5% 0.3% 0.7%Coffee 21.9% 57.3% 54.2% 32.2% 4.6% 0.5% 2.4% 7.5% 1.8% 3.6%Colbert 29.1% 58.9% 49.0% 35.9% 1.7% 0.1% 1.0% 1.6% 0.8% 1.1%Conecuh 54.5% 72.4% 58.3% 69.6% 0.0% 0.0% 0.0% 1.2% 1.4% 1.3%Coosa 42.7% 58.4% 58.8% 51.0% 1.3% 0.0% 1.0% 1.8% 0.4% 1.1%Covington 36.6% 73.4% 63.6% 43.5% 0.3% 0.3% 0.3% 0.3% 0.4% 0.4%Crenshaw 35.2% 66.3% 88.1% 46.8% 1.2% 2.4% 1.7% 1.7% 0.5% 1.1%Cullman 29.8% 54.8% 46.0% 31.7% 4.7% 0.5% 2.8% 4.0% 2.1% 2.7%Dale 37.2% 68.3% 47.3% 47.5% 1.8% 0.8% 1.3% 1.5% 1.4% 1.4%Dallas 50.8% 75.5% 22.2% 72.2% 0.1% 1.2% 0.3% 0.0% 0.4% 0.1%De Kalb 40.1% 56.3% 60.6% 46.0% 23.9% 0.7% 16.2% 19.0% 8.6% 13.3%Elmore 26.9% 58.9% 53.1% 36.8% 2.4% 0.7% 1.6% 1.7% 0.9% 1.2%Escambia 36.9% 72.5% 40.5% 51.7% 0.2% 0.3% 0.2% 0.1% 0.8% 0.4%Etowah 27.8% 55.1% 52.9% 34.9% 3.3% 0.3% 1.9% 4.1% 1.9% 2.7%Fayette 37.1% 67.0% 64.5% 42.3% 0.1% 0.1% 0.1% 0.7% 0.4% 0.5%Franklin 35.2% 64.0% 49.5% 40.4% 14.4% 1.4% 10.1% 12.7% 8.1% 10.0%Geneva 37.7% 72.5% 70.5% 45.0% 2.4% 0.2% 1.6% 1.8% 0.5% 1.1%Greene 66.7% 74.0% 25.0% 73.3% 0.0% 2.5% 0.2% 0.0% 2.0% 0.5%Hale 25.8% 64.6% 33.3% 52.8% 0.4% 0.3% 0.4% 0.1% 0.8% 0.4%Henry 26.2% 68.4% 67.9% 41.5% 1.2% 0.0% 0.8% 1.3% 0.2% 0.6%Houston 29.3% 68.3% 49.3% 45.8% 1.4% 0.7% 1.1% 1.2% 1.2% 1.2%Jackson 34.4% 54.7% 44.7% 35.3% 2.9% 0.2% 1.8% 1.9% 1.7% 1.7%Jefferson 12.1% 59.7% 39.2% 38.0% 3.8% 1.1% 2.5% 3.3% 3.3% 3.3%Lamar 32.0% 67.3% 74.4% 37.7% 1.1% 0.0% 0.6% 1.2% 0.2% 0.6%Lauderdale 27.9% 65.9% 57.1% 34.8% 2.4% 0.3% 1.3% 2.3% 0.8% 1.3%Lawrence 41.0% 52.5% 51.9% 40.8% 1.8% 0.1% 1.1% 0.8% 0.9% 0.9%Lee 18.2% 55.4% 40.7% 30.7% 1.7% 1.4% 1.6% 2.3% 2.3% 2.3%Limestone 26.9% 50.8% 54.2% 33.7% 9.2% 0.9% 4.6% 7.0% 2.7% 4.2%Lowndes 64.3% 73.8% 100.0% 73.7% 0.0% 0.0% 0.0% 0.1% 0.0% 0.1%Macon 55.6% 69.4% 60.0% 69.1% 0.0% 0.0% 0.0% 0.2% 0.5% 0.3%Madison 14.8% 49.0% 45.5% 27.3% 4.9% 1.1% 2.6% 5.3% 2.1% 3.0%Marengo 21.7% 68.0% 25.8% 49.8% 0.9% 0.8% 0.9% 0.6% 1.8% 1.2%Marion 37.5% 71.9% 58.8% 39.9% 1.2% 0.8% 1.0% 1.6% 0.8% 1.1%Marshall 35.2% 63.8% 57.2% 41.6% 12.0% 0.5% 7.1% 9.5% 5.9% 7.4%Mobile 34.2% 70.8% 41.1% 52.0% 1.9% 1.2% 1.7% 1.1% 2.1% 1.6%Monroe 33.0% 66.4% 33.3% 51.3% 0.0% 0.0% 0.0% 0.1% 0.4% 0.2%Montgomery 21.1% 64.2% 60.9% 56.3% 3.9% 4.4% 4.0% 4.5% 5.1% 4.8%Morgan 25.6% 63.6% 50.2% 35.8% 11.1% 0.6% 6.0% 8.5% 4.4% 5.9%Perry 16.7% 74.6% 100.0% 74.1% 0.0% 0.0% 0.0% 0.0% 0.0% 0.0%Pickens 24.5% 67.3% 61.0% 50.8% 0.6% 0.0% 0.5% 1.0% 0.9% 1.0%Pike 26.8% 71.7% 59.7% 53.0% 1.5% 1.2% 1.4% 1.0% 1.8% 1.4%Randolph 41.0% 69.5% 68.3% 49.6% 2.4% 0.1% 1.6% 2.6% 0.7% 1.6%Russell 33.5% 53.1% 43.1% 44.6% 0.3% 0.5% 0.3% 1.5% 0.7% 1.1%St. Clair 28.0% 47.6% 41.9% 30.7% 1.5% 0.2% 0.9% 1.4% 0.9% 1.1%Shelby 12.0% 35.0% 34.7% 18.5% 13.7% 1.3% 5.3% 8.7% 3.5% 4.4%Sumter 83.3% 69.6% 62.5% 69.3% 0.1% 0.0% 0.0% 0.1% 0.6% 0.2%Talladega 32.1% 56.1% 42.0% 42.1% 1.0% 0.2% 0.7% 0.6% 0.6% 0.6%Tallapoosa 30.3% 64.3% 58.6% 43.2% 1.7% 1.1% 1.5% 2.2% 1.1% 1.6%Tuscaloosa 19.6% 58.6% 35.6% 37.6% 2.6% 0.6% 1.7% 2.5% 3.3% 3.0%Walker 38.6% 67.7% 40.4% 41.5% 1.4% 0.1% 0.9% 1.4% 1.9% 1.7%Washington 25.5% 58.6% 53.3% 37.3% 0.7% 0.1% 0.4% 0.0% 0.2% 0.1%Wilcox 81.3% 75.6% 50.0% 75.6% 0.0% 0.0% 0.0% 0.2% 0.0% 0.1%Winston 33.4% 73.0% 56.3% 35.0% 2.4% 0.3% 1.5% 2.8% 1.1% 1.7%
ALABAMA 26.3% 62.2% 47.6% 39.8% 3.8% 0.9% 2.6% 3.3% 2.5% 2.8%
Direct Certification English Language Learners
2015-2016 2010-2011 A 2015-2016 B
COUNTY WHITE BLACK HISPANIC/LATINO TOTAL POVERTY ABOVE POVERTY TOTAL POVERTY ABOVE POVERTY TOTAL
VOICES FOR ALABAMA’S CHILDREN | www.alavoices.org 15
Homeless Students Per Pupil Expenditures*Adjusted for Inflation
2014-2015 2015-2016 FY2011 FY2016COUNTY POVERTY ABOVE POVERTY TOTAL POVERTY ABOVE POVERTY TOTAL DOLLARS* DOLLARS
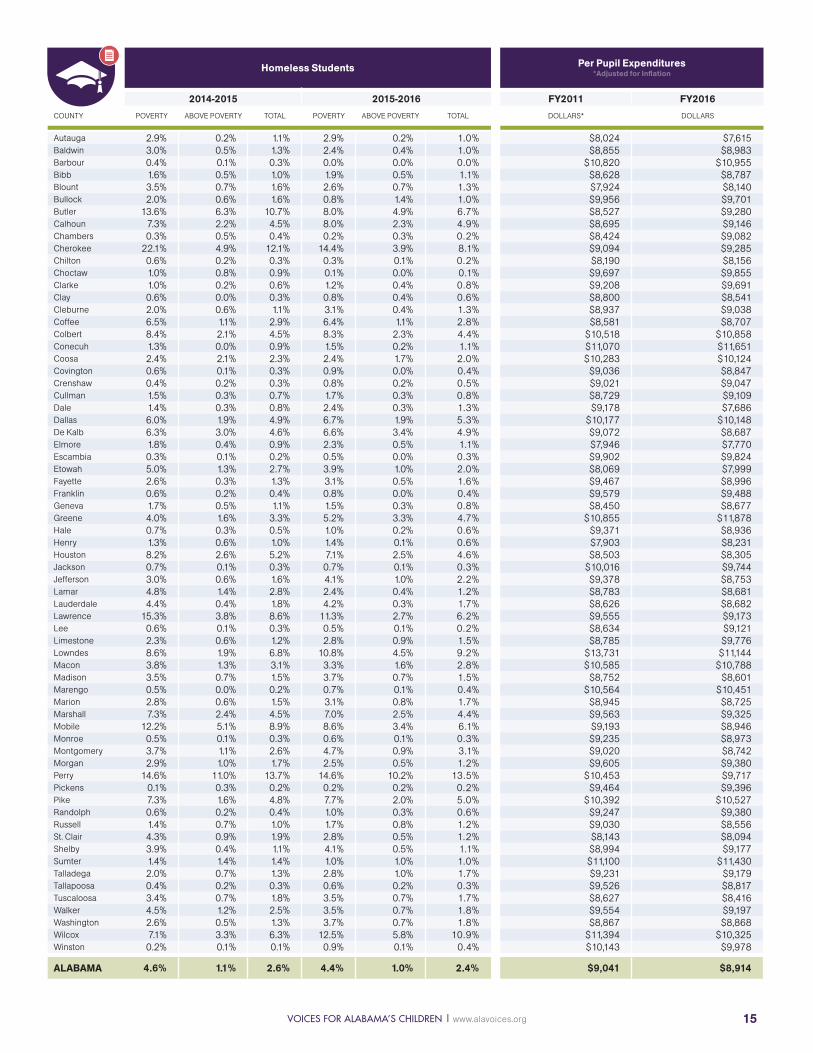
Autauga 2.9% 0.2% 1.1% 2.9% 0.2% 1.0% $8,024 $7,615Baldwin 3.0% 0.5% 1.3% 2.4% 0.4% 1.0% $8,855 $8,983Barbour 0.4% 0.1% 0.3% 0.0% 0.0% 0.0% $10,820 $10,955Bibb 1.6% 0.5% 1.0% 1.9% 0.5% 1.1% $8,628 $8,787Blount 3.5% 0.7% 1.6% 2.6% 0.7% 1.3% $7,924 $8,140Bullock 2.0% 0.6% 1.6% 0.8% 1.4% 1.0% $9,956 $9,701Butler 13.6% 6.3% 10.7% 8.0% 4.9% 6.7% $8,527 $9,280Calhoun 7.3% 2.2% 4.5% 8.0% 2.3% 4.9% $8,695 $9,146Chambers 0.3% 0.5% 0.4% 0.2% 0.3% 0.2% $8,424 $9,082Cherokee 22.1% 4.9% 12.1% 14.4% 3.9% 8.1% $9,094 $9,285Chilton 0.6% 0.2% 0.3% 0.3% 0.1% 0.2% $8,190 $8,156Choctaw 1.0% 0.8% 0.9% 0.1% 0.0% 0.1% $9,697 $9,855Clarke 1.0% 0.2% 0.6% 1.2% 0.4% 0.8% $9,208 $9,691Clay 0.6% 0.0% 0.3% 0.8% 0.4% 0.6% $8,800 $8,541Cleburne 2.0% 0.6% 1.1% 3.1% 0.4% 1.3% $8,937 $9,038Coffee 6.5% 1.1% 2.9% 6.4% 1.1% 2.8% $8,581 $8,707Colbert 8.4% 2.1% 4.5% 8.3% 2.3% 4.4% $10,518 $10,858Conecuh 1.3% 0.0% 0.9% 1.5% 0.2% 1.1% $11,070 $11,651Coosa 2.4% 2.1% 2.3% 2.4% 1.7% 2.0% $10,283 $10,124Covington 0.6% 0.1% 0.3% 0.9% 0.0% 0.4% $9,036 $8,847Crenshaw 0.4% 0.2% 0.3% 0.8% 0.2% 0.5% $9,021 $9,047Cullman 1.5% 0.3% 0.7% 1.7% 0.3% 0.8% $8,729 $9,109Dale 1.4% 0.3% 0.8% 2.4% 0.3% 1.3% $9,178 $7,686Dallas 6.0% 1.9% 4.9% 6.7% 1.9% 5.3% $10,177 $10,148De Kalb 6.3% 3.0% 4.6% 6.6% 3.4% 4.9% $9,072 $8,687Elmore 1.8% 0.4% 0.9% 2.3% 0.5% 1.1% $7,946 $7,770Escambia 0.3% 0.1% 0.2% 0.5% 0.0% 0.3% $9,902 $9,824Etowah 5.0% 1.3% 2.7% 3.9% 1.0% 2.0% $8,069 $7,999Fayette 2.6% 0.3% 1.3% 3.1% 0.5% 1.6% $9,467 $8,996Franklin 0.6% 0.2% 0.4% 0.8% 0.0% 0.4% $9,579 $9,488Geneva 1.7% 0.5% 1.1% 1.5% 0.3% 0.8% $8,450 $8,677Greene 4.0% 1.6% 3.3% 5.2% 3.3% 4.7% $10,855 $11,878Hale 0.7% 0.3% 0.5% 1.0% 0.2% 0.6% $9,371 $8,936Henry 1.3% 0.6% 1.0% 1.4% 0.1% 0.6% $7,903 $8,231Houston 8.2% 2.6% 5.2% 7.1% 2.5% 4.6% $8,503 $8,305Jackson 0.7% 0.1% 0.3% 0.7% 0.1% 0.3% $10,016 $9,744Jefferson 3.0% 0.6% 1.6% 4.1% 1.0% 2.2% $9,378 $8,753Lamar 4.8% 1.4% 2.8% 2.4% 0.4% 1.2% $8,783 $8,681Lauderdale 4.4% 0.4% 1.8% 4.2% 0.3% 1.7% $8,626 $8,682Lawrence 15.3% 3.8% 8.6% 11.3% 2.7% 6.2% $9,555 $9,173Lee 0.6% 0.1% 0.3% 0.5% 0.1% 0.2% $8,634 $9,121Limestone 2.3% 0.6% 1.2% 2.8% 0.9% 1.5% $8,785 $9,776Lowndes 8.6% 1.9% 6.8% 10.8% 4.5% 9.2% $13,731 $11,144Macon 3.8% 1.3% 3.1% 3.3% 1.6% 2.8% $10,585 $10,788Madison 3.5% 0.7% 1.5% 3.7% 0.7% 1.5% $8,752 $8,601Marengo 0.5% 0.0% 0.2% 0.7% 0.1% 0.4% $10,564 $10,451Marion 2.8% 0.6% 1.5% 3.1% 0.8% 1.7% $8,945 $8,725Marshall 7.3% 2.4% 4.5% 7.0% 2.5% 4.4% $9,563 $9,325Mobile 12.2% 5.1% 8.9% 8.6% 3.4% 6.1% $9,193 $8,946Monroe 0.5% 0.1% 0.3% 0.6% 0.1% 0.3% $9,235 $8,973Montgomery 3.7% 1.1% 2.6% 4.7% 0.9% 3.1% $9,020 $8,742Morgan 2.9% 1.0% 1.7% 2.5% 0.5% 1.2% $9,605 $9,380Perry 14.6% 11.0% 13.7% 14.6% 10.2% 13.5% $10,453 $9,717Pickens 0.1% 0.3% 0.2% 0.2% 0.2% 0.2% $9,464 $9,396Pike 7.3% 1.6% 4.8% 7.7% 2.0% 5.0% $10,392 $10,527Randolph 0.6% 0.2% 0.4% 1.0% 0.3% 0.6% $9,247 $9,380Russell 1.4% 0.7% 1.0% 1.7% 0.8% 1.2% $9,030 $8,556St. Clair 4.3% 0.9% 1.9% 2.8% 0.5% 1.2% $8,143 $8,094Shelby 3.9% 0.4% 1.1% 4.1% 0.5% 1.1% $8,994 $9,177Sumter 1.4% 1.4% 1.4% 1.0% 1.0% 1.0% $11,100 $11,430Talladega 2.0% 0.7% 1.3% 2.8% 1.0% 1.7% $9,231 $9,179Tallapoosa 0.4% 0.2% 0.3% 0.6% 0.2% 0.3% $9,526 $8,817Tuscaloosa 3.4% 0.7% 1.8% 3.5% 0.7% 1.7% $8,627 $8,416Walker 4.5% 1.2% 2.5% 3.5% 0.7% 1.8% $9,554 $9,197Washington 2.6% 0.5% 1.3% 3.7% 0.7% 1.8% $8,867 $8,868Wilcox 7.1% 3.3% 6.3% 12.5% 5.8% 10.9% $11,394 $10,325Winston 0.2% 0.1% 0.1% 0.9% 0.1% 0.4% $10,143 $9,978
ALABAMA 4.6% 1.1% 2.6% 4.4% 1.0% 2.4% $9,041 $8,914
VOICES FOR ALABAMA’S CHILDREN | 2017 Alabama Kids Count Data Book 16
DATA HIGHLIGHTS
• In 2015, Births to Females With Less Than 12 Years of Education decreased by six percentage points since 2005. This decline was seen across all races, with White and Black Females showing the highest percentage decline.
• Access to First Class Pre-K has increased from two percent during the 2005-06 school year to 28 percent during the 2017-18 school year.
• There has been tremendous growth in the number of children participating in Alabama’s First Class Pre-K program, over the past 3 years, from 7,344 in 2014-15 school year to 14,688 in the 2017-18 school year.
• When adjusted for inflation, educational spending per pupil remained roughly the same from 2011 ($9,041) to 2016 ($8,914).
• Early intervention of children birth to three years of age increased 38 percent since 2006, serving more than 6,600 children.
• First grade retention decreased 4 percentage points from 2008-09 school year to 2015-16, while ninth grade retention fell approximately 7 percentage points during the same period.
Source: Special tabulations provided by Alabama Department of Public Health, Center for Health Statistics.
CHILD CARE FACILITIES
The number of licensed or exempt facilities located within a county as of July 2017. “Licensed facilities” are those that are licensed by the Alabama Department of Human Resources (DHR). This indicator encompasses family care homes (serving six children or less), group child care homes (serving 7-12 children) and licensed child care centers (serving 12 or more children). “Exempt child care centers” are faith-based programs/schools that have submitted required documents to DHR and have received a letter of exemption. Homes where children are cared for by relatives or friends, as well as those that operate as businesses, but are not licensed by DHR, are not included in these numbers. Source: Special tabulations provided by the Alabama Department of Human Resources, Child Care Services Division.
CHILDREN PARTICIPATING IN FIRST CLASS PRE-K
The number of children (four years of age) participating in First Class Pre-K divided by the estimated number of all children of that age.
First Class Pre-K classrooms are funded through Alabama’s First Class Pre-K program, which uses a diverse delivery grant structure to create high-quality Pre-K classrooms in both public schools and private programs (such as child care and faith-based centers). The program meets each of the ten quality standards measured
AVERAGE 11TH GRADE ACT (AMERICAN COLLEGE TEST) SCORES The average test scores on the English, mathematics, reading, and science components of the ACT and the composite scores for all four components for public school students enrolled in the 11th grade in 2015-2016. Scores can range from 1 (lowest) to 36 (highest) on each of these components and for the composite. The ACT is now administered to all 11th graders at no cost to the students.
Source: Special tabulations provided by the Alabama State Department of Education.
ASPIRE MATH AND READING SCORES
The percent of total public school students enrolled in grades 4 and 8 scoring at the “proficient level” (i.e., Levels 3 and 4 combined) on the ACT Aspire test in mathematics and reading. Level 3 and 4 scores are defined as those which meet or exceed benchmark scores for the specified subject and grade level. Students who exceed benchmark scores are considered on target for college readiness by the time they reach the 11th grade.
Source: Special tabulations provided by the Alabama State Department of Education.
BIRTHS TO FEMALES WITH LESS THAN 12 YEARS OF EDUCATION
Number of live births to females with less than 12 years of schooling, expressed as a percentage of all live births.
EDUCATION
EDUCATION DEFINITIONS
AND SOURCES
VOICES FOR ALABAMA’S CHILDREN | www.alavoices.org 17
LIST OF INDICATORS
• Children Participating in
First Class Pre-K
• Early Head Start and
Head Start Classrooms
• Births to Females with Less
Than 12 Years of Education
• Age 0-3 Receiving Early
Intervention Services
• Child Care Center Capacity
• First Grade Retention
• Ninth Grade Retention
• Direct Certification
• Average 11th Grade
ACT Scores
• Graduation Rate
• Aspire Fourth Grade Reading
• Aspire Fourth Grade Math
• Aspire Eighth Grade Reading
• Aspire Eighth Grade Math
• Chronic Absenteeism (10-17 Days)
• Chronic Absenteeism (18+ Days)
• English Language Learners
• High School Dropout Rate
• Homeless Students
• Per Pupil Expenditures
These children can therefore be certified to receive free meal benefits without the household having to submit an application. Certain foster care, migrant, runaway, and homeless children may also qualify in this way and become certified for free meals without submitting an application, based on documentation submitted to the district by an appropriate state or local agency. The eligibility of directly certified students is not subject to the verification process.
Source: United States Department of Agriculture, The National School Lunch Program Direct Certification Improvement Study: Main Report https://fns-prod.azureedge.net/sites/default/files/ops/NSLPDirectCertificationImprovement.pdf
EARLY HEAD START AND HEAD START CLASSROOMS
The number of Early Head Start/Head Start classrooms in each county as of June 2017 for the 2016-2017 program year. Head Start grantees served a total of 14,688 children aged birth to five years in Early Head Start and Head Start classrooms.
Source: Special tabulations provided by the Alabama Department of Early Childhood Education.
ENGLISH LANGUAGE LEARNERS
The number of language-minority students enrolled in grades K-12 that are limited in English proficiency, expressed as a percentage of total enrollment. The determination of “English proficiency” is based on various assessment criteria and includes migrant children and youth.
Source: Special tabulations provided by the Alabama State Department of Education.
annually by the National Institute for Early Education Research (NIEER). First Class Pre-K providers coordinate with schools to facilitate children’s successful transition into kindergarten. Each First Class Pre-K class typically serves 18 children.
Source: Special tabulations provided by the Alabama Department of Early Childhood Education.
CHILDREN AGED 0-3 RECEIVING EARLY INTERVENTION SERVICES
Number of children aged 0-3 receiving services through the Alabama Early Intervention System. This includes both children with developmental delays and children with diagnoses that increase the risk for developmental delays (e.g., cerebral palsy, spina bifida, etc.). Data are reported for the fiscal year.
Source: Special tabulations provided by the Alabama Department of Rehabilitation Services, which is the lead agency for Alabama’s Early Intervention System.
CHRONIC ABSENTEEISM
Students who miss ten or more school days in a given school year for any reason – including excused or unexcused absences.
Source: Special tabulations provided by the Alabama State Department of Education.
DIRECT CERTIFICATION
Under direct certification, states and districts can use information provided by Supplemental Nutrition Assistance Program (SNAP), Temporary Assistance for Needy Families (TANF), and Food Distribution Program on Indian Reservations (FDPIR) agencies to establish that a student is a member of a household participating in one of these programs and is thus automatically eligible to receive free meals.
VOICES FOR ALABAMA’S CHILDREN | 2017 Alabama Kids Count Data Book 18
DATA HIGHLIGHTS
• In the 2015-2016 school year, approximately 40 percent of fourth graders and 45 percent of eighth graders met the Aspire minimum standards for proficiency in Reading.
• Fifty three percent of fourth graders and 31 percent of eighth graders met the Aspire proficiency standards in Math, during the school year 2015- 2016.
• During the 2015-2016 school year, 22 percent of students missed 10-17 days of school and nearly 12 percent missed 18 or more days of school. Being absent from school, especially in the earlier years, contributes to poor educational outcomes especially in reading.
• The Alabama State Department of Education defines chronic absenteeism as students who miss 15 or more days of school – excused or unexcused.
• In 2016, more than 6,600 children aged 0-3 years of age received early intervention services to address developmental delays identified in early screenings and assessments. The most prevalent service is speech therapy at 62 percent.
Housing and Urban Development, this indicator also includes children whose families are “doubled up” (i.e., living with relatives, friends, etc.) because they cannot otherwise secure adequate housing.
Source: Special tabulations provided by the Alabama State Department of Education.
NINTH GRADE RETENTION
The number of students enrolled in the ninth grade during the specified school years who were not promoted to the tenth grade. This number is expressed as a percentage of the total number of students enrolled in the ninth grade. Data reported are for public schools only.
Source: Special tabulations provided by the Alabama State Department of Education.
PER PUPIL EXPENDITURES
Public school revenue from all sources (federal, state and local) divided by the average number of students enrolled per day for the years specified.
Note: All dollar amounts are adjusted for inflation to reflect 2016 dollars.
Source: Special tabulations provided by the Alabama State Department of Education.
* Complete state and county data profiles are available online at http://www.alavoices.org/research/alabama-kids-count/bama_kids_count
Please note: Population sub-groups are listed and referred to the way the agency or organization providing the data references the sub-groups. Though you will see varying nomenclature used, the way we refer to population sub-groups throughout the 2017 Alabama Kids Count Data Book is intentional in order to be as accurate as possible in representing the data.
FIRST GRADE RETENTION
The number of students enrolled in the first grade during the specified school years who were not promoted to the second grade. This number is expressed as a percentage of all students enrolled in the first grade. Data are reported for public schools only.
Source: Special tabulations provided by the Alabama State Department of Education.
GRADUATION RATE
The number of students who were considered as a graduate in the 2015-2016 school year. The number is expressed as a percentage of all students in the cohort.
Source: Special tabulations provided by the Alabama State Department of Education.
HIGH SCHOOL DROPOUT RATE
The percent of students enrolled in grades 9-12 who left school during the year specified and did not immediately enroll in another school. Data are reported for public schools only.
Source: Special tabulations provided by the Alabama State Department of Education.
HOMELESS STUDENTS
The number of students enrolled in grades K-12 identified as homeless at any point during the 2015-2016 school year. This number is expressed as a percentage of total enrollment.
Students are considered homeless if they lack a fixed, regular and adequate residence. This indicator includes students who live in emergency shelters, transitional housing shelters, motels, hotels, vehicles, etc. Unlike the definition of homeless used by the Department of
EDUCATION
EDUCATION DEFINITIONS
AND SOURCES
VOICES FOR ALABAMA’S CHILDREN | www.alavoices.org 19
Visit the KIDS COUNT data center for access to hundreds of child well-being indicators at your fingertips to support smart decision making and good policies for children and families at datacenter.kidscount.org.
CHART NOTES
* Adjusted for inflation
A Poverty based on Free/Reduced Lunch. Direct Certification was not used at this time.
B Poverty based on Direct Certification.
C Graduation Rate is calculated by only one subgroup at a time, and poverty is determined by a flag that is set in the calculated graduation data.
D Calculated by cohort only one subgroup at a time, and poverty is determined by a flag that is set in the calculated graduation data.
Endnotes:
1 Educational Leadership, What Research Says About... / Grade Retention by Jane L. David http://www.ascd.org/publications/educational-leadership/mar08/vol65/num06/Grade-Retention.aspx

VOICES FOR ALABAMA’S CHILDREN | 2017 Alabama Kids Count Data Book
Post Office Box 4576Montgomery, AL 36103Phone: 334-213-2410
Fax: 334-213-2413www.alavoices.org
Y
Education Supplemental Report