florida kids count
TRANSCRIPT

KIDS COUNT Data Center
Training Guide
The Annie E. Casey Foundation

Florida KIDS COUNT is part of a Nationwide KIDS COUNT Network, a funded effort of the Annie E. Casey Foundation. The KIDS COUNT Network is a national and state-by-state effort to track the status of children in the United States using multiple data sources. By providing policy makers and citizens with benchmarks of child well-being, KIDS COUNT seeks to enrich local, state, and national discussions concerning ways to secure better futures for all children.
The objective of Florida KIDS COUNT is to inform Floridians and their policy makers about the quality of life for Florida’s children, and to build leadership and accountability for action. Using selected key well-being indicators and general demographic profiles, Florida KIDS COUNT continues to provide a consistent and reliable source of information that is adaptable to a variety of uses, such as policy analysis, grant and proposal writing, community needs assessments and education.
Florida KIDS COUNTDepartment of Child & Family StudiesLouis de la Parte Florida Mental Health InstituteCollege of Behavioral & Community SciencesUniversity of South Florida
13301 Bruce B Downs Blvd., MHC2502Tampa FL 33612813-974-7411www.floridakidscount.org
Susan Weitzel, DirectorCindi Shockley, CoordinatorCindy McCann, Coordinator
Florida KIDS COUNT in partnership with the Annie E. Casey Foundation has developed this training guide for the new Data Center. The KIDS COUNT Data Center provides easy online access to the latest data on child well-being nationwide. Find hundreds of indicators on such topics as education, employment and income, health, poverty, and youth risk factors for all U.S. states and many cities, counties, and school districts. Advocates, journalists, policymakers, practitioners, and all concerned citizens can find data for planning, preparing reports, crafting policies, or identifying and addressing needs in their communities. The Data Center offers multiple ways to customize and share information, including a mobile site that you can access on the go.

The Data Center may be reached via the Florida KIDS COUNT website www.floridakidscount.org. Click the Data
tab.
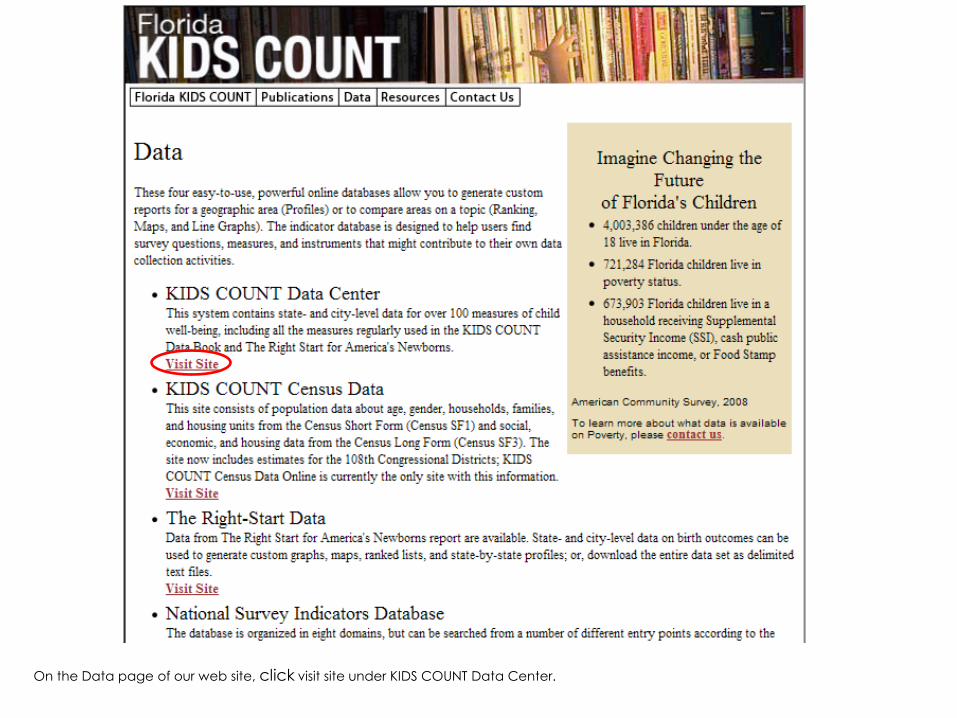
On the Data page of our web site, click visit site under KIDS COUNT Data Center.

The KIDS COUNT Data Center• Warehouse of indicators across multiple areas of child
and family well-being:
- Demographics
- Economic well-being
- Education
- Health
- Family & community
- Safety & risk
• National, state, county, city-level data
• Data by age, sex, race, ethnicity and immigrant status
• One-stop shop for city, county, state, and national information on children
and families
• Rank states, cities and counties
• Generate customized maps, graphs and trend lines
• Feature automatically updated maps and graphs on your own website or
blog
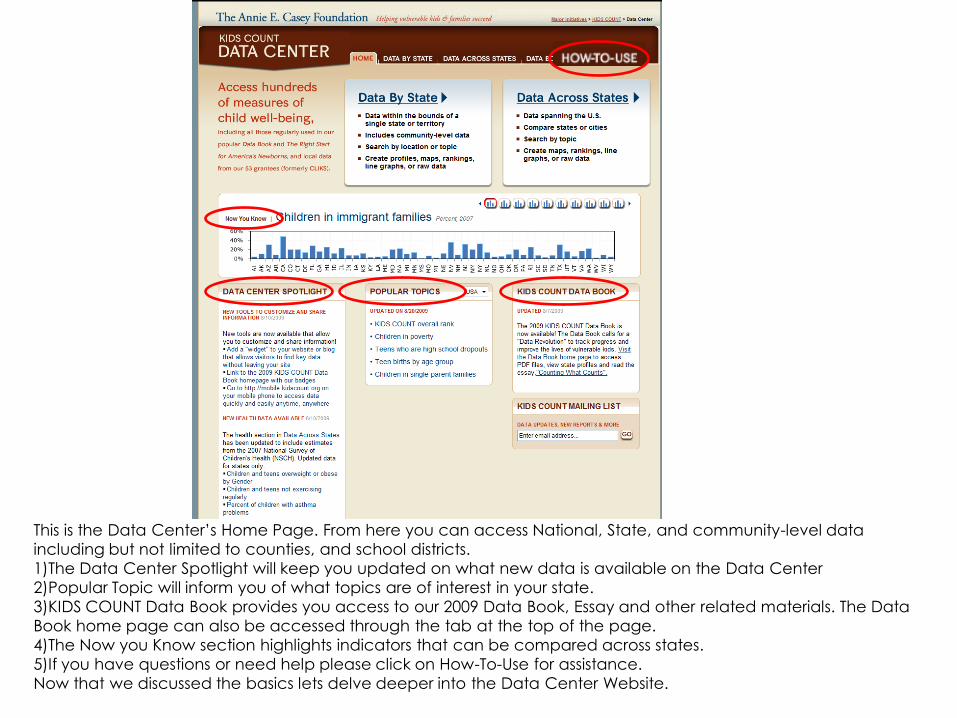
This is the Data Center’s Home Page. From here you can access National, State, and community-level data
including but not limited to counties, and school districts.
1)The Data Center Spotlight will keep you updated on what new data is available on the Data Center
2)Popular Topic will inform you of what topics are of interest in your state.
3)KIDS COUNT Data Book provides you access to our 2009 Data Book, Essay and other related materials. The Data
Book home page can also be accessed through the tab at the top of the page.
4)The Now you Know section highlights indicators that can be compared across states.
5)If you have questions or need help please click on How-To-Use for assistance.
Now that we discussed the basics lets delve deeper into the Data Center Website.

Let’s first take a look at what can be found under “Data by State” Data under this category is maintained by the
KIDS COUNT grantee in each state. In this section you will find community-level data including but not limited to
county-level data and school district data (this level may not be available for every state). You can create profiles,
maps, rankings within your state and line graphs*. You will also be able to download raw data* for further
manipulation. Data under this section cannot be compared between states since the methodology for collecting
data may differ across states. Now let’s get started.*Some functions not available for every indicator.

After clicking on Data By State you will be able to pick our state, Florida. Once you click Florida you will be taken to
our state’s page on the Data Center.

On the state’s main page you will have access to:
1) Featured indicators and data state grantee highlights and feels are important in that state.
2) Contact information for the state grantee. If you have questions or are unable to find data you are looking for please contact
them.
3) You can access the state’s profile by clicking on View the Profile for This State. You will be able to view all the data available
for that state.
4) You will be able to view data by geography by clicking on View Community-level profiles. Here you are given the option of
picking from the geographies available for that indicator (counties, school districts-if available, etc.).
5) You can also pick an indicator of interest under Rankings, Maps or Trend Graphs by Topic. Here you will be given the option
of Ranking, Mapping and or creating Graphs for any indicator you desire.

Let’s look at the state profile in more detail before moving on to functions available to manipulate data. The state
profile contains all of the data that is available for that state. The profile defaults to the Featured Indicators that the
state grantee has chosen to highlight, but much more data are available. These profiles can be printed and
handed out at presentations, conferences, meetings etc.
Under Indicators you are given various options for what data to view:
1) You can view the Featured Indicators highlighted by the grantees
2) You can view all of the Indicators the Texas grantee has available on the site
3) You can view the 10 Key Indicators found in the Data Book, used to rank states on child well-being.
4) You can view indicators broken out by Category (Demographics, Education, Economic Well-being, Family and
Community, Health, Safety and Risk, Other)
5) Finally you can customize the profile to include indicators you would like.
If you are interested in seeing notes/source information please be sure to check the Show box.
From this page you can also select another location in Texas. For example you can create a profile for your county.
This can be done be selecting another location.
Now let’s see how we can view and customize data for indicators of interest.

Return to the state page and choose an indicator from the list under Rankings, Maps, or Trend Graphs by Topic.

Once you select an indicator of interest you are given the option of Ranking the data available (in this case
counties), of mapping the data and or creating a line graph using the data*. Once you determine how you
would like to display data you may customize it further.
1) You can pick the geographic area (in this example you have the option of viewing data for counties, but for
other indicators other options maybe available- school districts for example. Please check here for other
options).
2) You can pick which year you would like to be visible.
3) And if you would like to present data in percent or number format
This screen shots shows the mapping function. Data that is represented in the map is provided below the map
with appropriate definitions found at the very bottom of the page. *Some functions not available for every indicator.

Before going on to discuss what you can do with this map I would like to bring your attention to the Related
KIDS COUNT Data section on the right of your screen. Here you can access more information related to the
indicator you picked. Now lets look at the tools available and show you what can be done with this map. These
options are available for the line graphs and rankings as well.
The tools can be found in the TOOLBOX. You can print and email your map which are pretty standard functions.
The next couple of slides will show the advanced functions new to the Data Center.

By clicking on Share you will be provided with the option of sharing your map or line graph through Facebook,
Twitter and other social networking sites.

By Clicking on Add Image to Your site and filling out the brief information requested, you will be able to post the
map and or chart onto your site. The data that is visible on the map or line graph will automatically be updated
once data on the Data Center is updated for that indicator. This means that the most current data available will
be available on the map or chart you post on your site. You can do this by taking this piece of code and
imbedding it to your HTML program.

By accessing How To Save This Image you will be able to save the map and use it to post in presentations,
reports, etc.

In addition to sharing data on your social networking sites, posting data on your websites and incorporating
information into your reports and presentation you can also download data for further in-depth analysis by
clicking on Raw Data.*
These tools and options are available for the line graphs* as well. These options are not only available for
indicators found under Data by State but also for those available under Data Across State. Now lets go take a
look at what data is available under Data Across States.* Some functions not available for all indicators.

Data found in Data Across States is maintained by the Annie E. Casey Foundation with help from Child Trends
and the Population Reference Bureau. Data comes from the U.S. Census and Federal agencies. Data you find
here is the most recent data available on child wellbeing. Data in this section can be compared across states
and cities since the methodology used to collect the data is consistent. You will be able to perform the same
functions as those shown above only for indicators available at the state and city-level. Let’s click on Data
Across States.

You will be taken to a page that looks like this. Here you will be able to access the National Profile, which will
show you KIDS COUNT’s ten key indicators used to rank states on how they are doing when it comes to their
children’s well-being. You will also be provided with the option of customizing your profile, here you will be
able to pick and choose which indicators you want included in your National Profile.
The state rankings can be found under “Other Indicators”.

Under Rankings, Maps and Trend Lines by Topic you can choose an indicator of interest. Let’s pick 4th graders who
scored below basic reading level.

Under 123 Ranking you can rank the states on their performances. This can be done by clicking “Numerical by
Value” under Sort order/by. You can see from above that Massachusetts has the best performance when it
comes to 4th grade basic reading scores. This ranking function is also available for data in Data By States, only
counties or school districts will be ranked with respect to each other.

Here is what the map looks like for data
under Data Across States. As mentioned
previously the same functions are
available for maps in this section as
previously mentioned.
Additional resources and information
related to this topic can be found under
Related Resources.
Definitions, sources and notes can be
found at the bottom of the page.

From the Main Data Center Page or the Data Book tab you can access the Data Book Home Page. Here you
can access the 2009 Data Book, Essay and Data Brief. You can also access Indicator Briefs for each of the 10
key indicators, our How-to Videos, State and National Profiles, the Overall State Rankings and much more.
Here is where you can access our new widget and mobile site.

Every year KIDS COUNT creates new tools. These tools are provided to enhance the visibility of the Data Center as well as increasing access people have to information. Go online to the Data Book page and show different tools available:
1) The widget can be posted onto your organization’s website. This will allow your users to access the 10 key indicators found in the Data Book without leaving your site. We are looking to increased the amount of data that can be accessed from our widget this year.
2) We also created a mobile phone enhanced site. This allows people to access child well-being data anytime, anywhere. This site also contains data on the 10 key indicators in the Data Book. We are also looking to expand data this coming year.
3) Finally, we have created “badges” that will allow people to connect to the Data Center from your site. You can provide people with access to data easily by incorporating our badge online.

The following are examples of how media sources
around the country are using the new tools.


To learn more about what data is available, please contact us.
Florida KIDS COUNT
Susan Weitzel, Director
Cindy Shockley, Coordinator
Cindy McCann, Coordinator
Telephone: (813) 974-7411
www.floridakidscount.org