2016-2017 - cdta.org transportation system. ... development engine. ... demand management program...
TRANSCRIPT

2016-2017 Annual Report

From The Chairman 1
From The Chief Executive Officer 2
Our Mission, Vision & Values 3
Ridership Statistics 2016-2017 5
Board of Directors 7
CDTA Financials 18
Table of Contents

On behalf of our Board of Directors, I am proud to present the Capital District Transportation Authority Annual Report. Serving as the Capital Region’s mobility leader, we have focused on improving accessibility, enhancing mobility options and growing our customer base to provide a transformative transportation system.
During the past several years, we have focused on making CDTA the best it can be. Our effort to broaden the great work done by our company and our employees has expanded our footprint beyond transit service in the Capital Region. Our vision to be more than a bus company has resulted in CDTA serving as a community resource, a valued partner and a key component of the region’s economic development engine.
That ambitious vision has resulted in CDTA taking on new challenges, pursing new opportunities and serving as a leader on regional programming to enhance mobility in a way that wouldn’t have been likely even 10 years ago.
We are providing better options to travel throughout the region, and those will take shape over the next year. Our regional bike-share program, CDPHP Cycle! launched this summer and we are continuing work on taxi oversight. These programs complement the introduction of ride-sharing by adding choices to customer travel routines, and work well alongside our Navigator smartcard and mobile ticketing system, which offers seamless payments across travel modes.
All of this is possible thanks to a forward-thinking business plan that directs our day-to-day activities. Outstanding financial practices, strong and effective advocacy for improving transit services, enhanced partnerships that increase ridership and revenue, and consistent community outreach are at the core of our operation and the focus of our Board.
CDTA is poised to do more. More for its customers, more for its partners, and more for the region. Our services carry more people than ever before and our route network is primed for the expansion of our BusPlus service to the region’s busiest roadways. Our equipment and facilities are modern and attractive, while our employees are committed to our ambitious innovation platform.
It’s the dedication and commitment of the Board of Directors and the entire organization that has put us in a position to offer this wide menu of mobility options to the community and position us as a regional leader.
Sincerely,
David M. StackrowCDTA Board Chairman
From the Chairman
1

On behalf of the 690 employees who make up CDTA, I am pleased to present this year’s Annual Report. We closed our 2017 fiscal year with strong ridership, a responsibly-balanced budget, and the introduction of additional mobility options across the region.
We continue to sharpen our image, while strengthening our community engagement to focus on solidifying regional economic development and quality of life. This work is a direct result of the vision that the Board of Directors has established and the efforts of our employees to provide our communities a wide menu of mobility options.We are excited to join forces with the Capital
District Physicians Health Plan, better known as CDPHP, on our regional bike-share program called CDPHP Cycle! This new mobility option offers a healthy and affordable way to explore the region, and connect with CDTA services. The program now offers 160 bicycles at more than 40 stations throughout the Capital Region with expansion to 320 bikes the following year.
Our work to provide regulatory oversight and enhance the customer experience of regional taxicab industry is well underway with the development a common ordinance that will ultimately be adopted by the legislative bodies in each community. Once that is complete, we will work with the taxi companies to move towards customer service features that will provide consistency in access to information and rates.
We see all of these mobility options tied together with our new smartcard and mobile ticketing prepayment system Navigator. Smart cards are now in the hands of more than 6,000 customers, since the public roll-out in January. Our retail network is being updated, our online portal is easier to use, and we will begin offering mobile payment options to customers by the end of 2017.
CDTA is committed to innovation, cutting-edge thinking and deploying new technology to address community needs. All of these efforts driven by the skills of our workforce, provides a new landscape for the region. One that offers a deep and wide menu of transportation options, access to economic prosperity, and a renewed sense of optimism for the people who live and work here.
Sincerely,
Carm BasileCEO
From the Chief Executive Officer
2

Our Mission
Our Vision
CDTA works to accomplish this mission by:
CDTA plans, finances, implements, and delivers transit services that take people where they want to go in the Capital Region safely, efficiently, and at a reasonable cost.
• Continually identifying ways to increase transit ridership and revenue.
• Taking a leadership role to help mold regional growth and improve the transportation network.
• Balancing regional needs for social service, congestion relief and basic access.
• CDTA is a growing, vibrant company that seeks to continually increase ridership and the use of its facilities by providing services that people want and need.
• CDTA delivers lifeline services to those who need them and provides a full range of transit options for the choice rider in the Capital Region.
• CDTA plans for the mobility needs of the Capital Region with a predictable and reliable stream of funding sources to meet those needs.
• CDTA is a multi-modal transportation provider, delivering comprehensive transit services, as well as a transportation demand management program that includes vanpool, carpool, and incentive-based ride sharing with a focus on city and suburban locations that have a demonstrated need.
• Delivering a range of transportation services that meets a diversity of markets and customers.
• Developing innovative ways to attract and retain a high quality workforce.
• Identifying appropriate funding sources to meet the region’s transportation needs.
• CDTA is responsive to the environment and operates equipment that features the most efficient systems available. In addition, CDTA undertakes continual outreach to enroll the region’s travelers in efforts to move toward an environmentally-responsible approach to travel.
• CDTA works in partnership with state, regional, and local agencies to advocate for transit-oriented development in the Capital Region and is advancing infrastructure that will meet current and future mobility needs.
• CDTA undertakes frequent assessments of the region and seeks community input to effectively position the organization to anticipate and meet market changes and expansions.
3

Our Values• CDTA designs services people want and
delivers services people can rely on. We treat customers, the community, and each other with respect and integrity.
• CDTA is a flexible and innovative mobility company that responds to changing needs of the Capital Region. We are proactive in meeting the needs of our region. Stakeholder relations and input are integral to our planning and development efforts.
• CDTA operates a financially stable organization that places importance on cost-recovery and operating efficiency in order to deliver optimal service in the Capital Region.
• CDTA takes a leadership role in helping to mold regional growth and advocate for mobility. CDTA works with local planning and business organizations to help shape regional growth in a way that provides congestion relief and basic access.
• CDTA meets the needs of both the transit-dependent rider and the choice rider by delivering a wide range of transportation alternatives and by working to ensure that its services are easy to identify, use, and pay for.
• CDTA helps employers connect their employees to the workplace, delivering commuter solutions that make daily work connections efficient, economical, and reliable.
• CDTA employees are the heart and soul of the organization leading innovation and productivity. We promote a positive work environment by supporting each other through effective communication, teamwork, and an appreciation for our diverse abilities and contributions.
4

Ridership StatisticsTotal Ridership 16,870,207
Fixed Route 16,402,879
NX 168,893
STAR 298,435
Annual Bikes on Buses 70,361Annual Wheelchair Boardingson Fixed Route 985,272
Information SourcesCustomer Service Center (518) 482-8822
STAR Reservation Center (518) 482-2022
Corporate Sales (518) 437-6876
Total Calls Answered Annually 450,000
Company Web Site www.cdta.org
Web Site Visits Annually 14.1 million
Buildings and FacilitiesAdministrative Headquarters 110 Watervliet Avenue • Albany, NY 12206
Schenectady Division 2401 Maxon Road Extension • Schenectady, NY 12308
Troy Division 40 Hoosick Street • Troy, NY 12180
Rensselaer Rail Station 525 East Street • Rensselaer, NY 12144
Saratoga Springs Train Station 26 Station Lane • Saratoga Springs, NY 12866
Customer Service/Training Center 85 Watervliet Avenue • Albany, NY 12206
Fares (Effective April 1, 2017)Base Fare $1.50
Day Pass $4.00
Weekend Rolling Swiper $55.00
31-Day Rolling Swiper $65.00
10 Trip Card $13.00
STAR $2.50
NX (varies by zone) $4.00 - $7.00
5
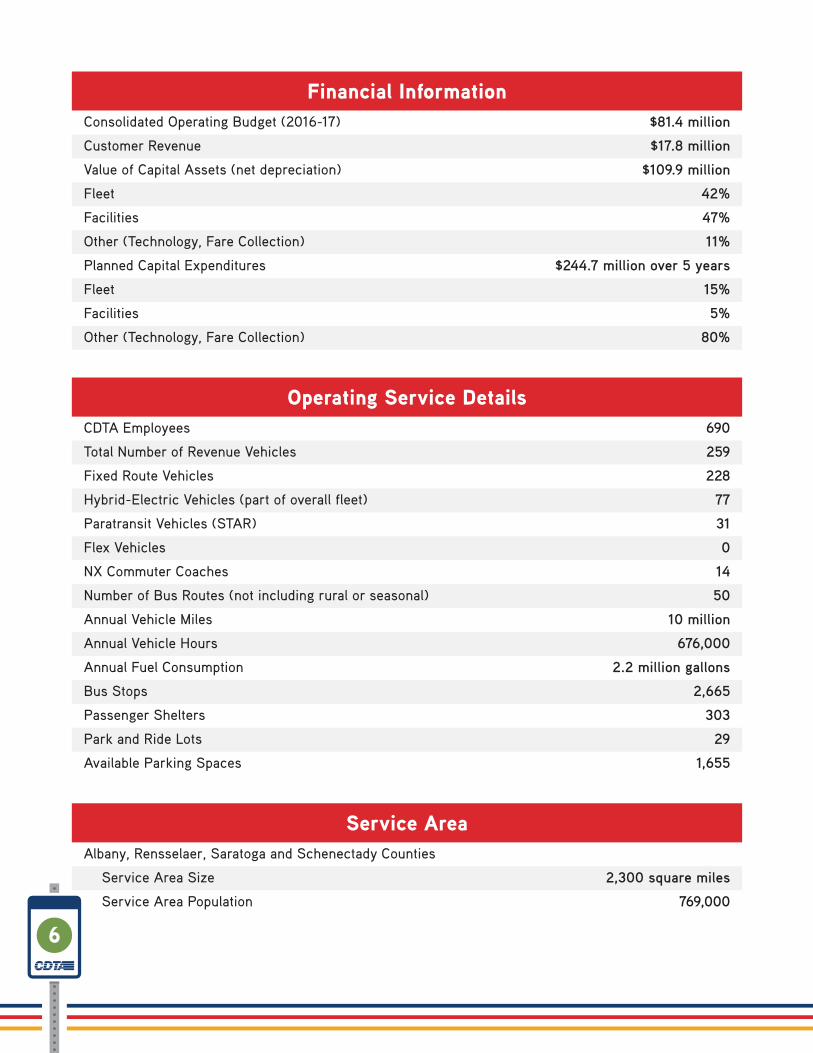
Financial InformationConsolidated Operating Budget (2016-17) $81.4 million
Customer Revenue $17.8 million
Value of Capital Assets (net depreciation) $109.9 million
Fleet 42%
Facilities 47%
Other (Technology, Fare Collection) 11%
Planned Capital Expenditures $244.7 million over 5 years
Fleet 15%
Facilities 5%
Other (Technology, Fare Collection) 80%
Operating Service DetailsCDTA Employees 690
Total Number of Revenue Vehicles 259
Fixed Route Vehicles 228
Hybrid-Electric Vehicles (part of overall fleet) 77
Paratransit Vehicles (STAR) 31
Flex Vehicles 0
NX Commuter Coaches 14
Number of Bus Routes (not including rural or seasonal) 50
Annual Vehicle Miles 10 million
Annual Vehicle Hours 676,000
Annual Fuel Consumption 2.2 million gallons
Bus Stops 2,665
Passenger Shelters 303
Park and Ride Lots 29
Available Parking Spaces 1,655
Service AreaAlbany, Rensselaer, Saratoga and Schenectady Counties
Service Area Size 2,300 square miles
Service Area Population 769,000
6

David M. StackrowChairman, Represents Rensselaer County
David Stackrow is the Chairman of the CDTA Board of Directors and the CDTA Governance Committee. He has been a Board member since October 1995.
Mr. Stackrow is President/Secretary and managing partner of Scott, Stackrow and Co., CPAs, P.C. He holds a Bachelor of Business Administration degree from Siena College, is an Independent Director of the Rensselaer Tobacco Asset Securitization Corporation, Trustee of the CDTA/ATU 1321 Pension Plan, Treasurer for the Challenger Learning Center of the Greater Capital Region, and he is a Past President of the La Salle Institute Alumni
Association, Past Board Chair of La Salle Institute of Troy, New York, and a Past Grand Knight of the Rensselaer Council 267 Knights of Columbus.
Mr. Stackrow is also active in the American Public Transportation Association (APTA) where he serves a member of APTA’s Board of Directors. He is Chair, APTA Transit Board Members Committee, Chair, APTA Audit Committee, and a member of APTA’s Legislative, Diversity Council, Procurement Steering, Finance, Member Services, Human Resources, and Mid-sized Operations Committees.
Georgeanna Nugent Vice-Chairperson, Represents Saratoga County
Georgeanna (Georgie) Nugent is CDTA Board Vice Chairwoman and a member of the board’s Governance Committee and Planning and Stakeholder Relations Committee. She received her Master of Science degree in environmental science and engineering from the Colorado School of Mines and bachelor’s degrees in environmental science and geology from SUNY Plattsburgh.
Ms. Nugent is an avid horse racing fan, partner with Epona Racing Stable and serves as a member of the New York Racing Association (NYRA) Board of Directors. She is a 2008 graduate of Leadership Saratoga, served one year on the Saratoga Springs Design Review Commission, and is actively involved with educational grant and scholarship programs for students in the STEM field. She lives in Saratoga Springs.
Board of Directors
7

Arthur YoungTreasurer, Represents Albany County
Arthur Young Jr., appointed to the CDTA Board in October 1995, is a retired officer of Key Bank of New York after more than 49 years in banking. At the time of his retirement from Key, Mr. Young was a Senior Vice President and Manager of the bank’s Legal and Recovery Division, Secretary of the bank’s Board of Directors, President and CEO of Key Financial Services, and a Director of Key Leasing, Inc.
Mr. Young is a Trustee, Investment Officer and past President of the J.O. Wells Albany Memorial Hospital Nursing Education Foundation, Director of VNA Albany Home Health Care Corp., Director and past Governor of the Albany Colony of Mayflower Descendants, Director and Elder of the New York State Society of May Flower Descendants, Director and Treasurer of the Capital District Pop Warner Family History Association Trustee Director of Capital District Genealogy Society and member of the Bethlehem Historical Association Executive Committee.
Mr. Young has been the CDTA Treasurer since 1998, is a current member of the Performance Oversight Committee, past Chairman of the Performance Oversight and Stakeholder Relations Committee, a former member of the Audit committee and Chairman of the investment committee. He and his wife Anne reside in Delmar.
Joseph M. Spairana, Jr.Secretary, Represents Rensselaer County
Joseph Spairana, Jr., appointed to the CDTA Board in December 2008, is retired from the New York State Department of Transportation with 35 years of service. At the time of his retirement, Mr. Spairana was Engineer in Charge, responsible for construction operations for major roadway and bridge improvement projects throughout the Capital Region.
Mr. Spairana serves on the Board of Directors of the Lansingburgh Boys and Girls Club and is active in their Futures and Events Committee. Mr. Spairana is a member of the Performance Oversight Committee and a former member of the Planning and Stakeholder Relations Committees. He is a lifelong resident of Rensselaer County and lives with his family in Wynantskill.
8

Norm MillerRepresents Schenectady County
Norman Miller has been a member of the CDTA Board since July 2006. Mr. Miller is president of Leadership Management of New York, Inc., a strategic development company that specializes in planning, organization and management development, executive leadership and team building. He retired from the United States Air Force with 33 years of service and serves as a member of the Schenectady Military A airs Council. Mr. Miller is currently the Princetown Town Judge. He is a member of the Scotia Rotary Club and a founding member of the Albany County Safe Haven organization in Altamont. Active in his community, he was a member of the Princetown Comprehensive Planning Committee. He was a member of the 1988 Olympic Bobsled Coaching Staff.
Mr. Miller is a member of the CDTA Planning and Stakeholder Relations Committee. He and his wife reside in Princetown.
Denise FigueroaRepresents Albany County Denise Figueroa joined the Board in December 2003. Ms. Figueroa is a founding member and current Executive Director of the Independent Living Center of the Hudson Valley, established in 1987.
Ms. Figueroa is a Governor appointee to the Most Integrated Setting Coordinating Council and the Justice Center Advisory Board. Former Chair of the NYS Independent Living Council and Former President of the National Council on Independent Living. Former Chair and current board member of the New York Association on Independent Living. She holds a M.S. from the University of San Francisco and a B.A. from Brooklyn College, City University of New York. Ms. Figueroa is one of the original members of the Disabled Advisory Committee. She currently resides in Cohoes.
9

Mark SchaefferRepresents Albany County
Mark Schaefer joined the Board in June 2016. Mr. Schaeffer is a retired computer professional who spent 29 years working for New York State, at the Department of Health and the Department of Social Services.
He is an active citizen who is concerned about issues regarding energy, sustainability, environmental health, land use and transportation, social justice and political democracy. He has been influenced by the ideas of new urbanism and transit-oriented development. Mr. Schaefer is a regular CDTA customer and uses our services frequently to travel throughout the Capital Region.
He commuted regularly to work by bus and has made a number of suggestions to improve our service network throughout the years. Mr. Schaefer resides in Albany.
Corey BixbyRepresents Labor (Non Voting Union Member)
Corey Bixby has been a CDTA Board member since June 2014. Corey has been a Schenectady bus operator since November of 2006.
Mr. Bixby says he was interested in the Labor Position because he wanted to be a voice for his colleagues and learn all of the different aspects of the organization.
Corey who is originally from Corning, NY currently resides in Latham with his wife Maria and son Joseph.
10

CDTA Senior Staff
Carm BasileChief Executive Officer
Frederick C. GilliamDirector of Transportation
Christopher G. DesanyVice President of Planning
and Infrastructure
Michael P. CollinsVice President of Finance
and Administration
Amanda AveryGeneral Counsel
Lance ZarconeDirector of Maintenance
11

A Partner to the CommunityProud to be an active, caring member of the Capital Region, CDTA partners with organizations to provide assistance and resources to causes that are important to the region and its people. We are campaign participants with the Make-a-Wish Foundation, the American Cancer Society, the United Way of the Greater Capital Region, the Ronald McDonald House, the U.S. Marines’ Toys for Tots program and more.
We don’t just participate in causes and events – we champion these efforts. CDTA is recognized as Corporate Challenge winners for raising the most money for the Make-a-Wish Foundation’s Adopt an Angel campaign. Our work with the American Cancer Society raised nearly $10,000 for the Real Men Wear Pink campaign through T-shirt sales, an employee-led barbecue and other fundraisers. We spearhead a Toys for Tots campaign each year and host more 500 hundred school kids with an annual Fall Festival held at our headquarters.
Our largest charitable effort is with the United Way of the Greater Capital Region. In the past three years, we have increased employee giving by 66% from $29,000 to more than $86,000; were awarded the United Way Campaign of Distinction in both 2015 and 2016. We support the Ronald McDonald House radiothon that raises $200,000 annually, while CDTA employees volunteer at the Ronald McDonald House. We are also active supporters of key regional events including Albany’s Tulip Festival, Saratoga’s Victorian Stroll, First Night and the Capital Holiday Lights in the Park.
12
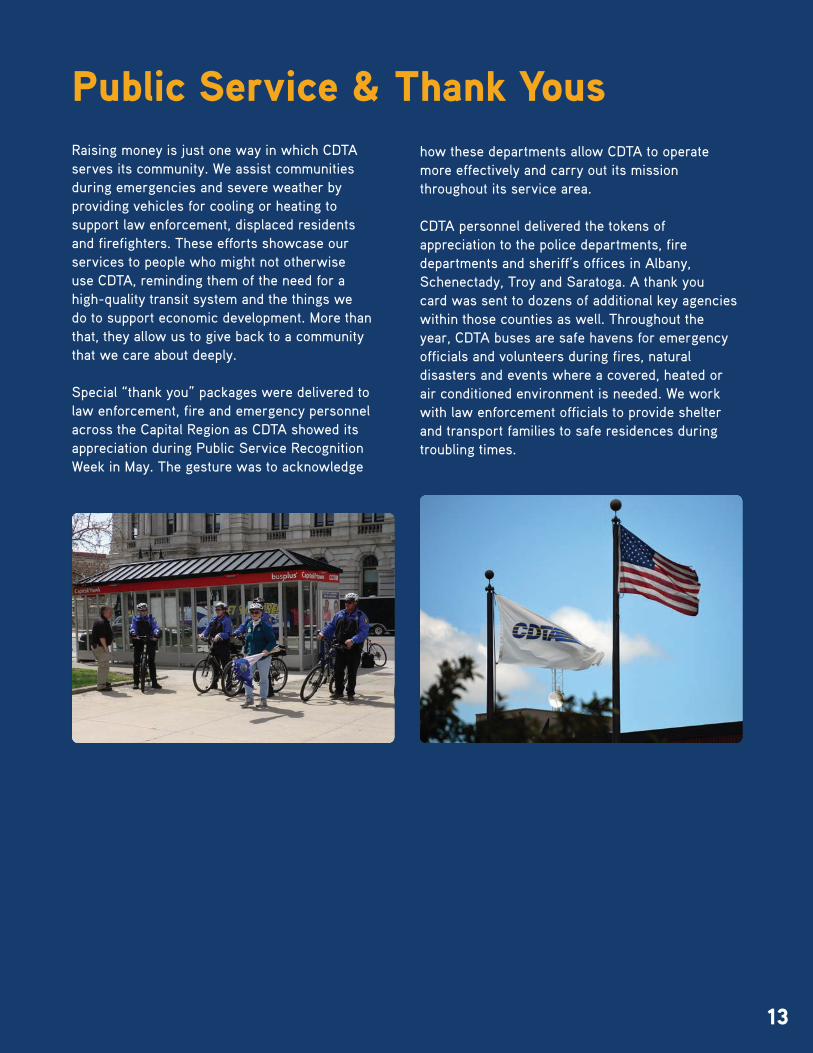
Public Service & Thank YousRaising money is just one way in which CDTA serves its community. We assist communities during emergencies and severe weather by providing vehicles for cooling or heating to support law enforcement, displaced residents and firefighters. These efforts showcase our services to people who might not otherwise use CDTA, reminding them of the need for a high-quality transit system and the things we do to support economic development. More than that, they allow us to give back to a community that we care about deeply.
Special “thank you” packages were delivered to law enforcement, fire and emergency personnel across the Capital Region as CDTA showed its appreciation during Public Service Recognition Week in May. The gesture was to acknowledge
how these departments allow CDTA to operate more effectively and carry out its mission throughout its service area.
CDTA personnel delivered the tokens of appreciation to the police departments, fire departments and sheriff’s offices in Albany, Schenectady, Troy and Saratoga. A thank you card was sent to dozens of additional key agencies within those counties as well. Throughout the year, CDTA buses are safe havens for emergency officials and volunteers during fires, natural disasters and events where a covered, heated or air conditioned environment is needed. We work with law enforcement officials to provide shelter and transport families to safe residences during troubling times.
13

We remain focused on designing our route network to be easy to both understand and to use, removing perceived barriers and making transit accessible to everyone. This enhances value via new fare products and improving the customer experience with emerging technologies, including a strong digital presence.
More than 11 million pages were viewed at www.cdta.org last year, with real time passenger information being accessed more than 5 million times. More than 80% of customers access CDTA through mobile devices, driving down comments related to on-time performance and improving relationships between customers and operating personnel. CDTA offers a mobile application for customers to access real time information, scheduling, news and to provide feedback. Our CDTA iRide application has been downloaded nearly 50,000 times and was accessed more than 1 million times in 2016. In the coming year, the application will be rebranded to support our Navigator mobile ticketing offerings. The Navigator smartcard and mobile ticket program offers easier purchasing, account management, better security and incentives. Navigator streamlines CDTA’s current offering with the addition of balance protection, auto-load capability, and easy interface for online ordering. Navigator will offer utilization across the region’s transportation network including bus services, car and bike sharing, taxi services, all with one card or tap of your smartphone.
Our customer service unit handles more than 500,000 calls annually and our employees respond to comments in a prompt, professional manner (less than 10 business days) more than 90% of the time. Social media accounts provide customers with new information and the ability to immediately respond to inquiries. We operate a monthly customer research program that allows us to stay abreast of what customers want. The report provides traditional demographics, and industry benchmarks in safety, operational efficiency and customer service. All of these elements have allowed us to respond quickly to customers, offer new tools to assist their travels and increased our relevance across the region.
Better Service for All
14

Enter bike-share. This year, the Capital Region’s first bike-share program was announced to frenzied buzz. CDPHP Cycle! offers the region an exciting, healthy and sustainable mode of transportation to connect riders with local businesses. Social Bicycles of Brooklyn, New York was awarded the two-year contract to launch and oversee operations of the program across Albany, Saratoga Springs, Schenectady and Troy.
CDPHP Cycle! will allow people to rent bicycles within a network of self-serving stations at various locations throughout the Capital Region. The program will be part of CDTA’s menu of services,
providing connectivity to the transit system, opening new and different travel opportunities throughout the region.
When fully deployed, more than 300 bikes will be available throughout the region with the ability to connect to CDTA’s Navigator. Memberships and on-street kiosks will be an integral part of the new program, offering bike users multiple use and payment options.
CDPHP Cycle! began offering 160 bikes at approximately 40 stations in Summer 2017.
CDPHP Cycle!
15

CDTA ridership was effectively flat last year, with a total boarding count of just under 17,000,000 trips. The slight decrease comes about due to a variety of small factors including fuel costs and severe weather. CDTA continued to invest resources towards its most productive routes and saw positive returns continuing to demonstrate the importance of focusing resources on proven corridors.
Our route network is productive and responsive to the demands of customers. We have grown ridership, improved the depth of the system, and designed it to better serve residential and employment locations. The services offered by CDTA are complimentary to economic development initiatives and flexible to meet the changing needs of our communities. CDTA’s Transit Development Plan has provided a strong foundation, working to
increase ridership by nearly 25% over the last 5 years through proactive recommendations. Ridership continues to be fueled by Universal Access (UA) agreements with major employers and colleges that provide access across CDTA’s route network. UA agreements now generate more than 4 million boardings annually, or just shy of 25% of CDTA’s total ridership.
Development activities throughout the Capital Region have added to transit’s growing profile along with the desire to return to urban living. All of this has occurred while the price of gasoline is at 10-year lows. Technology improvements and growth of mobile devices have made riding easier and more convenient. CDTA’s focus on clean, modern equipment and facilities only adds to the efforts to improve the company’s visibility and image, which support ridership trends.
Strength in Ridership
16

We were awarded funding through a competitive New York State Department of Transportation (NYSDOT) grant that will support the Washington and Lark Safety Improvement project.
This funding will support CDTA’s plans to improve customer and pedestrian safety at the Lark and Washington intersection, one of the most difficult intersections in the City of Albany. The $1.3 million project includes the installation of a major customer waiting area and a new BusPlus station at the Albany Public Library. It also includes intersection redesign work aimed at reducing traffic congestion and increasing safety.
CDTA received an additional $1.8 million in State Transit Operating Assistance (STOA) as part of the 2016-17 New York State Budget. The addition brings CDTA’s STOA funding package to $35.7 million while an additional $3.6 million will be provided to support capital needs. Additional capital funds are likely to be available through a multi-year New York State Department of Transportation plan.
“We applaud the efforts of the Governor and the Legislature for recognizing the important role transit plays not only here in the Capital Region but across upstate New York communities,” said CDTA Chairman, David M. Stackrow. “Transportation is a direct link to growth and vitality in our communities and with this increase
This project is part of a larger vision that CDTA has for the Washington-Western Corridor. Building on the success of its limited-stop BRT service BusPlus along Route 5, which was implemented in 2011, two more BRT lines are in the works. The “Purple Line” will run from downtown Albany to Crossgates Mall along the Washington-Western corridor and the “Blue Line” which will run from downtown Albany to Waterford along the River Corridor (Route 32). Both projects are under development and expected to be fully functional over the next three to five years.
Construction on the Washington Lark project will begin in 2017.
in funding, CDTA will continue to do what we do best - connecting people to jobs, to opportunities and spurring economic growth.”
CDTA’s Board of Directors has approved and adopted the Authority's $84.5 million operating budget and Capital Plan for fiscal year 2018. Additional state funding and capital money will support the Authority’s vision of a stronger and more vibrant CDTA. Some of the highlights include the development of the Uncle Sam Transit Center in Troy, Lark and Washington Safety Improvements in Albany, a new communications system and further development of two additional BusPlus lines (River Corridor and Washington/Western corridor).
Additional State Funding Package
Grant Support for Key Projects
17
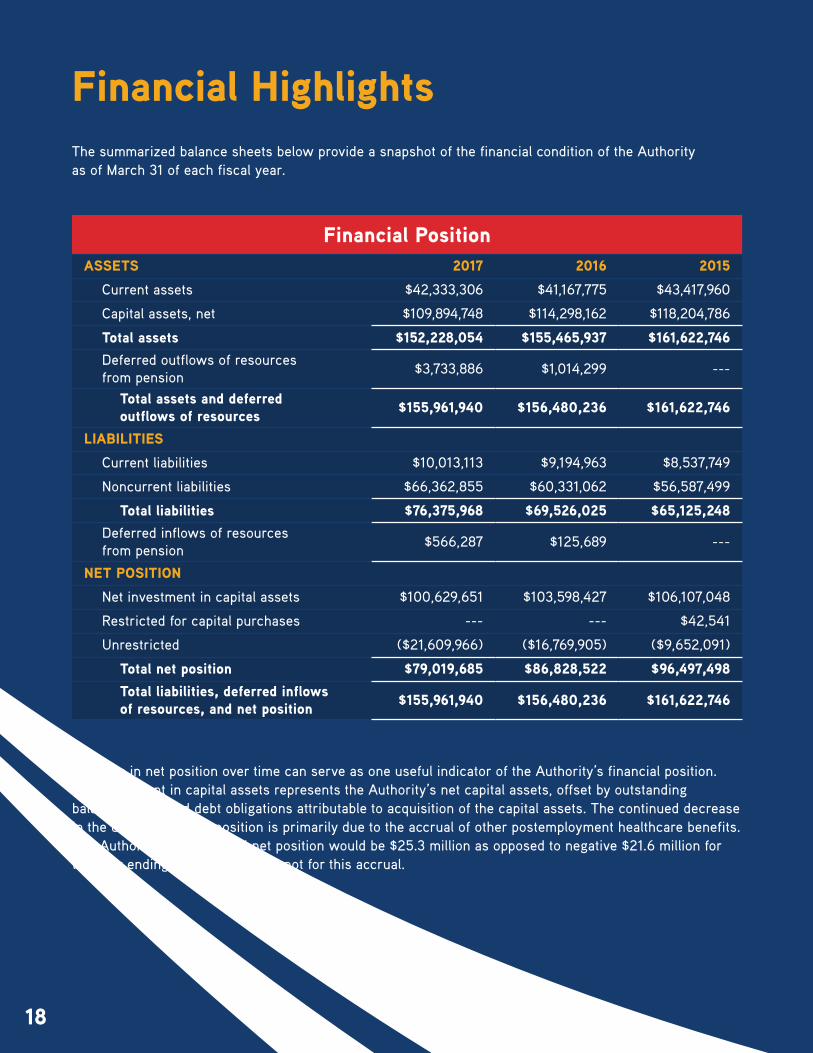
Financial PositionASSETS 2017 2016 2015
Current assets $42,333,306 $41,167,775 $43,417,960
Capital assets, net $109,894,748 $114,298,162 $118,204,786
Total assets $152,228,054 $155,465,937 $161,622,746
Deferred outflows of resources from pension $3,733,886 $1,014,299 ---
Total assets and deferred outflows of resources $155,961,940 $156,480,236 $161,622,746
LIABILITIES
Current liabilities $10,013,113 $9,194,963 $8,537,749
Noncurrent liabilities $66,362,855 $60,331,062 $56,587,499
Total liabilities $76,375,968 $69,526,025 $65,125,248
Deferred inflows of resources from pension $566,287 $125,689 ---
NET POSITION
Net investment in capital assets $100,629,651 $103,598,427 $106,107,048
Restricted for capital purchases --- --- $42,541
Unrestricted ($21,609,966) ($16,769,905) ($9,652,091)
Total net position $79,019,685 $86,828,522 $96,497,498
Total liabilities, deferred inflows of resources, and net position $155,961,940 $156,480,236 $161,622,746
Financial HighlightsThe summarized balance sheets below provide a snapshot of the financial condition of the Authority as of March 31 of each fiscal year.
Changes in net position over time can serve as one useful indicator of the Authority’s financial position. Net investment in capital assets represents the Authority’s net capital assets, offset by outstanding balances of related debt obligations attributable to acquisition of the capital assets. The continued decrease in the unrestricted net position is primarily due to the accrual of other postemployment healthcare benefits. The Authority’s unrestricted net position would be $25.3 million as opposed to negative $21.6 million for the year ending March 31, 2017 if not for this accrual.
18

Revenue SummaryOPERATING REVENUES 2017 2016 2015
Passenger fares $18,353,335 $17,185,297 $17,325,473
Access Transit $458,137 $388,521 $332,156
Advertising $1,084,517 $1761,263 $650,733
Rail station parking and rentals $3,425,336 $3,315,837 $3,253,626
Total operating revenues $23,321,325 $21,650,918 $21,561,988
NON-OPERATING REVENUES:
Federal operating assistance $17,609,934 $17,949,081 $15,762,159
State and local government funding $41,091,925 $40,221,143 $37,498,420
Mortgage recording tax $11,078,587 $10,187,391 $9,675,039
Investment income $129,567 $187,688 $320,424
Capital contributions $7,873,541 $8,792,600 $4,828,992
Total non-operating revenue $77,783,554 $77,337,903 $68,085,034
Total revenue $101,104,879 $98,988,821 $89,647,022
Current assets increased $1.2 million in 2017 largely due to the increase in cash at year end. Capital assets decreased $4.4 million from 2016 as a result of depreciation exceeding capital additions of $9.7 million. Deferred outflows of resources of $3.7 million are related to the Authority’s participation in the New York State and Local Employees’ Retirement System (ERS), and reflect the difference between projected and actual earnings on plan investments, assumption changes, and pension payments made subsequent to the actuarial measurement date of the plan.
Total liabilities at March 31, 2017 increased $6.8 million primarily due to increased other postemployment healthcare benefits ($5.4 million) and net pension liability ($2.7 million). The increase was partially offset by a decrease in capital lease obligations from bus purchases and a reduction in the estimated provision for claims and settlements.
Operating revenues increased $1.7 million from 2016 after being essentially flat from 2015 to 2016. All operational areas increased this year with the most significant increase in advertising of $0.3 million and passenger fares of $1.2 million. Advertising revenue increased due to an increase in sales of the contractor, which provided additional income above minimum guarantees. Passenger fares increased due to several new universal access agreements as well as renewals of existing agreements at increased amounts.
19

Non-operating revenues increased slightly from 2016 based on minor fluctuations. Federal operating assistance declined $0.3 million (increased $2.2 million from 2015 to 2016) while state and local funding increased $0.9 million (increased $2.7 million from 2015 to 2016). Mortgage recording tax increased $0.9 million (increased $0.5 million from 2015 to 2016), but capital contributions decreased by $0.9 million due to less grant-funded capital assets purchased (increased $4.0 million from 2015 to 2016). The increases during 2016 were caused primarily from an increase in grant funded bus purchases and the start of the Adirondack Trailways project, for which the Authority acted as a pass-through entity.
Investment Income 0.1%
Passenger Fares 18.2%
Access Transit 0.4%
Advertising 1.1%
Rail Station 3.4%
Federal Operating Assistance 17.4%
State and Local Government 40.6%
Mortgage Recording 11.0%
Capital Contributions 7.8%
The chart below summarizes 2017 revenue by source and percentage of revenue in each category.
20

Expense SummaryOPERATING EXPENSES 2017 2016 2015
Salaries and wages $40,873,247 $38,653,942 $36,484,155
Payroll taxes and employee benefits $12,611,041 $12,122,281 $11,997,659
Pension costs $2,997,170 $2,706,230 $2,947,048
Other postemployment benefits $7,504,179 $6,902,518 $5,671,146
Maintenance $7,591,617 $9,255,109 $7,103,138
Transportation $17,590,965 $16,586,052 $12,140,861
Ridership information $978,365 $817,437 $743,113
Other $3,225,205 $3,600,295 $4,010,286
Insurance, claims and settlements $196,652 $674,454 $736,420
Utilities $735,279 $697,643 $939,093
$94,303,720 $92,015,961 $82,772,919
Depreciation $14,103,969 $13,652,774 $12,917,574
Total operating expenses $108,407,689 $105,668,735 $95,690,493
NON-OPERATING EXPENSES
Other non-operating expenses, net $506,027 $2,911,870 $1,227,396
Total expenses $108,913,716 $108,580,605 $96,917,889
Operating expenses including depreciation increased $2.7 million from 2016 (increased $10 million from 2015 to 2016). Personnel and transportation expenses increased $3.6 million and $1.0 million respectively but were partially offset by decreases in maintenance ($1.7 million), other ($0.4 million), and insurance ($0.5 million).
The most significant increase was in personnel expenses. Wages increased by $2.2 million and benefits such as health care, postemployment benefits, and pensions increased $1.4 million. The wage increase is related to changes in collective bargaining agreements as well as overtime required to meet increased service levels. The increase in benefits has three specific factors: increased health care costs, increased expense related to the ERS pension plan, primarily due to the change in the discount rate used from 7.5% to 7.0%, and increased other postemployment benefits expense as actuarially calculated.
Decreases in maintenance and other are a result of less contracted services used, specifically related to projects in design phases like River BRT and the new Computer Aided Dispatch/Automatic Vehicle Locater (CAD/AVL) project. Insurance decreases are a result of a reduction in the estimated liability compared to last year.
The increase from 2015 to 2016 was primarily due to increased salaries and related benefits (2.2 million), from a new union contract negotiated during 2016, as well as an increase of $1.2 million in the actuarially determined expense for other postemployment benefits. Transportation expenses increased primarily due to a $4.4 million expense for the Adirondack Trailways project as discussed previously.
21

Other Non-Operating 0.5%
Salaries and Wages 37.5%
Payroll Taxes and Employee Benefits 11.6%
Pension Costs 2.7%
Other Postemployment Benefits 6.9%
Maintenance 7.0%
Transportation 16.2%
Ridership Information 0.8%
Other 3.0%
Insurance, Claims and Settlements 0.2%
Utilities 0.7%
Depreciation 12.9%
Capital Assets and Long-Term DebtCapital assets, net of accumulated depreciation, are as follows:
2017 2016 2015
Land and improvements $1,529,981 $1,529,981 $1,529,981
Construction-in-progress $715,403 --- $1,159,294
Buildings and improvements $47,989,796 $50,324,686 $53,079,317
Revenue equipment $55,972,830 $58,770,320 $57,538,853
Service equipment and vehicles $2,415,013 $1,118,152 $1,008,983
Furniture and equipment $1,271,725 $2,555,023 $3,888,358
$109,894,748 $114,298,162 $118,204,786
The Authority’s capital assets net of depreciation represent over 70% of the Authority’s total assets. Capital asset additions of $9.7 million in 2017 consisted primarily of vehicles and were offset by $14.1 million of depreciation.
In prior years, the Authority entered into two capital lease agreements to purchase transit buses. Principal payments on the capital leases, which extend through November 2023, totaled $1.4 million each year.
Expenses
22

Annual boardings were almost 16.9 million during 2017, the first time in the past several years the Authority did not break its own ridership record. Although ridership in FY2017 was not a record, ridership remains near record levels and demonstrates the Authority’s relevance to the region. The Authority continues to expand mobility options in the Capital Region and will be starting a Bike Share program this summer with about 150 bikes and 40 bike stations spread around the four counties served. Next summer we plan on doubling the number of bikes and stations. New York State recently passed legislation authorizing the Authority to enter into agreements with municipalities to oversee administrative and licensing functions of taxi companies. This will lead to improving the regions taxi service and providing more mobility alternatives for the public.
The Authority continues to develop relationships with major employers as it has done with educational partners. The Authority’s current Universal Access Agreements (UAA) with educational partners has provided ridership growth that accounts for about 25% of ridership. Initiating and developing additional UAA with major employers will better position the Authority to continue its success and grow its business.
At the State level, the Authority has worked with elected officials to expand transportation services throughout the region. Over the past couple of years, the State has provided additional State Operating Assistance and just recently passed a five-year capital plan that will strengthen the Authority’s ability to support its capital plan to purchase buses and improve and maintain facilities. New York State continues to be a great partner in supporting operations and capital commitments to the Authority.
At the federal level, the direction of certain funding streams is uncertain. Most federal funds are typically eligible for capital replacements and operating costs related to the maintenance of federally funded assets. But the federal Small Starts Program is in jeopardy which could impact two Bus Rapid Transit (BRT) projects that are in the Small Starts pipeline. Most of the cost of the River Corridor BRT and the Washington/Western BRT are expected to be funded through the federal Small Starts program. The Authority is concerned, and has been working with federal elected officials to continue the Small Starts program.
Other than Federal, State, and Local funding matters, the Authority continues to address some vehicles in its fleet that have passed their useful life. The continued operation of these vehicles has caused maintenance expenses to rise while at the same time causing newer vehicles to be used at a faster rate creating higher overall maintenance costs. The new State capital program should help alleviate this challenge.
The Authority is providing the latest in technological customer amenities to the region where possible. In 2018, the Authority will fully phase-out the use of magnetic stripe media and replace it with Smart Card and Mobile Ticketing. This will provide customers more convenient choices for riding the bus. The Authority has also begun to develop its computer aided dispatch and automatic vehicle locator (CAD/AVL) technology. These projects will enhance the customer experience by making the Authority’s operations easier to use and as efficient as possible.
Factors Impacting the Authority’s Future
23

Balance SheetsMARCH 31, 2017 2016
ASSETS
CURRENT ASSETS
Cash $11,672,562 $9,291,738
Investments $20,523,463 $21,501,090
Government grants receivable $3,978,046 $4,398,725
Other receivables and prepaid expenses $2,471,476 $2,768,200
Materials, parts, and supplies $3,687,759 $3,208,022
$42,333,306 $41,167,775
NONCURRENT ASSETS
Capital assets, net $109,894,748 $114,298,162
Total assets $152,228,054 $155,465,937
DEFERRED OUTFLOWS OF RESOURCES
Deferred outflows of resources from pension 3,733,886 1,014,299
Total assets and deferred outflows of resources 155,961,940 156,480,236
LIABILITIES
CURRENT LIABILITIES
Accounts payable and accrued expenses $6,844,324 $6,312,297
Current portion of capital lease obligations $1,472,242 $1,434,638
Unearned passenger revenue $1,696,547 $1,448,028
$10,013,113 $9,194,963
NONCURRENT LIABILITIES
Capital lease obligations $7,792,855 $9,265,097
Estimated provision for claims and settlements $8,225,000 $8,837,800
Other postemployment benefits $46,905,630 $41,506,279
Net pension liability $3,439,370 $721,886
$66,362,855 $60,331,062
Total liabilities $76,375,968 $69,526,025
DEFERRED INFLOWS OF RESOURCES
Deferred inflows of resources from pension $566,287 $125,689
NET POSITION
Net investment in capital assets $100,629,651 $103,598,427
Unrestricted ($21,609,966) ($16,769,905)
Total net position $79,019,685 $86,828,522
Total liabilities, deferred inflows of resources, and net position $155,961,940 $156,480,236
24

Statements of Revenues, Expenses, and Change in Net PositionFOR THE YEARS ENDED MARCH 31, 2017 2016
OPERATING REVENUES
Passenger fares $18,353,335 $17,185,297
Access Transit $458,137 $388,521
Advertising $1,084,517 $761,263
Rail station parking and rentals $3,425,336 $3,315,837
Total operating revenues $23,321,325 $21,650,918
OPERATING EXPENSES
Salaries and wages $40,873,247 $38,653,942Payroll taxes and employee benefits $12,611,041 $12,122,281Pension costs $2,997,170 $2,706,230Other postemployment benefits $7,504,179 $6,902,518Maintenance $7,591,617 $9,255,109Transportation $17,590,965 $16,586,052
Ridership information $978,365 $817,437Insurance, claims and settlements $196,652 $674,454Utilities $735,279 $697,643Other $3,225,205 $3,600,295
Total operating expenses before depreciation $94,303,720 $92,015,961
Operating loss before depreciation ($70,982,395) ($70,365,043)Depreciation ($14,103,969) ($13,652,774)
Operating loss ($ 85,086,364) ($84,017,817)NON-OPERATING REVENUES (EXPENSES)
Federal operating assistance $17,609,934 $17,949,081
State and local government funding $41,091,925 $40,221,143
Mortgage recording tax $11,078,587 $10,187,391
Investment income $129,567 $187,688
Other non-operating expenses ($506,027) ($2,911,870)
Total non-operating net revenues $69,403,986 $65,633,433
Change in net position before capital contributions ($15,682,378) ($18,384,384)
Capital contributions $7,873,541 $8,792,600
Change in net position ($7,808,837) ($9,591,784)
NET POSITION - BEGINNING OF YEAR $86,828,522 $96,420,306
Net position - end of year $79,019,685 $86,828,522
25

Statements of Cash FlowsOPERATING ACTIVITIES 2017 2016
Cash received from passengers $18,898,578 $18,302,226Cash payments to suppliers for goods and services ($30,878,593) ($31,041,288)Cash payments to employees for salaries and benefits ($58,147,791) ($55,642,072)Other operating revenues received $4,967,990 $4,465,621
Net operating activities ($65,159,816) ($63,915,513)
NON CAPITAL FINANCING ACTIVITIESOperating assistance, governmental funding and mortgage recording tax received $70,201,125 $68,357,775
Other non-operating expenses ($227,708) ($1,454,055)
Net non-capital financing activities $69,973,417 $66,903,720
CAPITAL AND RELATED FINANCING ACTIVITIESProceeds from sales of capital assets $2,512 $16,995Acquisition of capital assets ($9,716,027) ($10,918,965) Payments for interest ($265,359) ($301,994)Capital contributed under grants $7,873,541 $8,792,600Payments on capital lease obligations ($1,434,638) ($1,398,003)
Net capital and related financing activities ($3,539,971) ($3,809,367)
INVESTING ACTIVITIESInterest received on investments $419,768 $429,731Proceeds from sales and maturities of investments $290,690,258 $13,609,188Purchases of investments ($290,002,832) ($13,690,508)
Net investing activities $1,107,194 $348,411
Net change in cash $2,380,824 ($732,915)Cash - beginning of year $9,291,738 $10,024,653Cash - end of year $11,672,562 $9,291,738
RECONCILIATION OF OPERATING LOSS TO NET CASH USED FOR OPERATING ACTIVITIES:
Operating loss ($85,086,364) ($84,017,817)Adjustments to reconcile operating loss to net cash used for operating activities depreciation $14,103,969 $13,652,774
Net pension activity $438,495 ($243,916)Other postemployment benefits $5,399,351 $4,989,815Changes in assets and liabilities:Other receivables and prepaid expenses $296,724 $1,548,800 Materials, parts, and supplies ($479,737) $67,752
Accounts payable and accrued expenses $532,027 $540,422Unearned passenger revenue $248,519 $80,157Estimated provision for claims and settlements ($612,800) ($530,500)
Net cash used for operating activities ($65,159,816) ($63,915,513)
26
1. Financial Reporting Entity:
The Capital District Transportation Authority (the Authority) is a public benefit corporation created by New York State (the State), effective August 1, 1970, under Chapters 460 and 461 of the Laws of 1970 (the Law). The purposes of the Authority, as defined by legislation, are “the continuance, further development and improvement of transportation and other services related thereto, within the Capital District, by railroad, omnibus, marine and air, in accordance with the provisions of the Law.” The Law conveys broad powers to the Authority to fulfill its purposes in Albany, Schenectady, Rensselaer and Saratoga Counties in the State, with a provision for other counties to elect to participate. The properties and income of the Authority are exempt from all Federal and State income and franchise taxes under the provisions of the enabling legislation.
The Authority is included in the basic financial statements of the State as an enterprise fund. In evaluating how to define the Authority for financial reporting purposes, management has considered all potential component units. The decision to include a potential component unit in the Authority’s reporting entity is based on several criteria set forth in accounting standards, including legal standing, fiscal dependency, and financial accountability. The Authority’s financial statements include, as blended component units, three public benefit corporations which have been created as operating subsidiaries of the Authority to provide mass transit omnibus operations in the counties of Albany, Schenectady, Rensselaer and Saratoga:
• Capital District Transit System, which acquired the assets and liabilities of the former Schenectady Transit System in 1971
• Capital District Transportation System Number One, which purchased certain assets of the United Traction Company from Albany County in August 1972
• Capital District Transportation System Number Two, which provides rural bus service in the counties of Rensselaer and Saratoga and certain demand response (handicapped) services in the cities of Albany, Troy and Schenectady. In April 2003, this entity also commenced operating a Northway commuter bus service that was previously operated by Saratoga County
The Authority’s financial statements also include as blended component units the accounts of the following two public benefit corporations which were created as subsidiaries of the Authority to provide other transportation related services:
• Access Transit Services, Inc. (Access Transit), incorporated in November 1997, which provides Medicaid transportation services to qualifying individuals in Schenectady and Rensselaer Counties
• CDTA Facilities, Inc., Incorporated in September 2002, which owns and operates the Rensselaer Rail Station and Saratoga Rail Station
Notes to Financial Statements
27

BASIS OF PRESENTATION
The financial statements of the Authority have been prepared in conformity with accounting principles generally accepted in the United States of America (GAAP) as applied to governmental units. The Governmental Accounting Standards Board (GASB) is the accepted standard-setting body for establishing governmental accounting and financial reporting principles.
MEASUREMENT FOCUS
The Authority reports as a special-purpose government engaged in business-type activities. Business-type activities are those that are financed in whole or in part by fees charged to external parties for goods or services. The Authority’s financial statements are reported using the economic resources measurement focus and the accrual basis of accounting. Revenues are recorded when earned and expenses are recorded when a liability is incurred. Grants and similar items are recognized as revenue as soon as all eligibility requirements imposed by the provider have been satisfied.
The Authority’s policy for defining operating activities in the statements of revenues, expenses, and change in net position are those that generally result from exchange transactions such as payments received for services and payments made to purchase those goods or services. Certain other transactions are reported as non-operating activities and include government funding and investment income.
USE OF ESTIMATES
The preparation of financial statements in conformity with accounting principles generally accepted in the United States of America requires management to
make estimates and assumptions that affect the amounts reported in the financial statements and accompanying notes. Actual results could differ from those estimates.
CASH
Cash management is governed by State laws and as established in the Authority’s written policies. Cash resources must be deposited in FDIC-insured commercial banks located within the State. Collateral is required for demand and time deposits and certificates of deposit not covered by Federal Deposit Insurance. Custodial credit risk is the risk that, in the event of a bank failure, the Authority’s deposits may not be recovered. At March 31, 2017 and 2016, the Authority’s bank deposits were fully collateralized by FDIC coverage and securities held by the pledging institution’s agent in the Authority’s name.
INVESTMENTS
The Authority’s investment policies comply with the State Comptroller’s guidelines for Public Authorities. Investments consist primarily of government obligations valued at quoted prices that are readily available in active markets or exchanges for identical assets. Securities are held by pledging institutions’ agents in the Authority’s name.
MATERIALS, PARTS, AND SUPPLIES
Materials, parts, and supplies are stated at average cost, net of an allowance for obsolescence of $350,000 at March 31, 2017 and 2016. To reduce its exposure to rising fuel costs, the Authority has entered into contracts that fix the prices of certain vehicle fuels purchased from May 2016 through May 2019. The Authority expects to take delivery of the fuel as specified and, therefore, the contract is considered a normal purchase contract.
CAPITAL ASSETS
Capital assets are reported at historical cost. For assets placed in service, depreciation is calculated over estimated useful lives using the straight-line method. Maintenance and repairs are expensed as incurred; significant improvements are capitalized.
2. Summary of Significant Accounting Policies:
28
COMPENSATED ABSENCES
The Authority provides for vacation, sick, and compensatory time attributable to services already rendered. The liabilities are recorded based on employees’ rates of pay as of the end of the fiscal year, and include all payroll related liabilities. In the event of a voluntary termination, an employee is reimbursed for accumulated vacation days up to a stated maximum. Upon retirement, union represented employees are reimbursed for sixty percent of all accumulated sick days, up to a stated maximum, as specified in contractual agreements. PENSIONS
The Authority has elected to participate in the New York State and Local Employees’ Retirement System (ERS). The Authority recognizes its proportionate share of the net pension liability, deferred outflows and deferred inflows of resources, pension expense, and information about and changes in the fiduciary net position on the same basis as reported by ERS (Note 9). ERS recognizes benefit payments when due and payable in accordance with benefit terms; investment assets are reported at fair value. NET POSITION
• Net investment in capital assets – consists of net capital assets reduced by outstanding balances of any related debt obligations attributable to the acquisition, construction, or improvement of the assets
• Unrestricted – net amount of assets, deferred outflows of resources, liabilities, and deferred inflows of resources that do not meet the definition of the above restrictions and are available for general use of the Authority
OPERATING REVENUES
The Authority derives passenger revenues from farebox rider payments and the advance sale of transit passes. Amounts received from these advance sales are recorded as unearned revenue at the time of sale and recognized as revenue as passes are redeemed. Unearned passenger revenue represents the face value of unexpired transit passes at year end. Access Transit revenues are earned from facilitating transportation services for Medicaid qualified individuals. Rail station parking and rental revenues are primarily earned at the Authority’s Rensselaer and Saratoga Rail Stations.
NON-OPERATING REVENUES
The Authority receives operating assistance and capital contributions pursuant to various federal, state, and local government contracts and grant agreements. Operating assistance and capital contributions are recorded as revenue based on annual appropriations or when expenditures have been incurred in compliance with grant agreements. Operating assistance and capital contributions represent 66% and 68% of total revenue for the years ended March 31, 2017 and 2016, respectively. A significant decrease in this funding may negatively impact future operations.The Authority receives a portion of mortgage recording taxes assessed by the respective County on the recording of new or refinanced mortgages. Revenue is recorded as earned during the year. Amounts earned but not collected at year end are recorded as other receivables on the balance sheets.
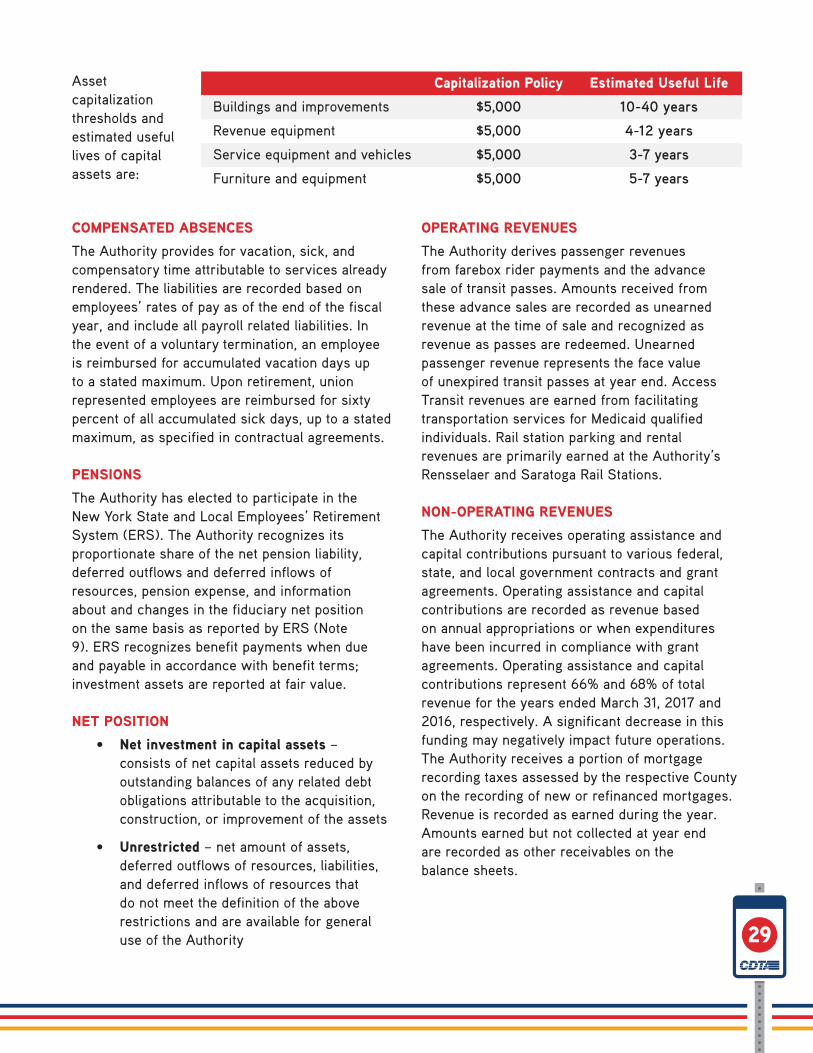
Capitalization Policy Estimated Useful Life
Buildings and improvements $5,000 10-40 years
Revenue equipment $5,000 4-12 years
Service equipment and vehicles $5,000 3-7 years
Furniture and equipment $5,000 5-7 years
Asset capitalization thresholds and estimated useful lives of capital assets are:
29

3. Cash and Investments:
The Authority limits its investments to those investment banks, firms and brokers who have been in business for over five years and have invested over $500 million in assets for their clients at the time of any investment made by the Authority.
The Authority’s written investment policy allows for the following investments:
• Certificates of Deposit in banks doing business in the State which are also members of the Federal Deposit Insurance Corporation (FDIC)
• Deposits in money market accounts in banks specified above
• Money market funds that invest exclusively in obligations of the United States Government or one of its agencies
• Obligations of the State, the United States Government or Agencies of the United States Government, or obligations guaranteed as to principal and interest by one of these entities
The Authority’s investments at March 31, 2017 and 2016 are presented below:
2017 2016
Certificates of Deposit $4,377,744 $6,498,714
U.S. Treasury notes $8,102,179 $6,567,647
Federal Home Loan Mortgage Corporation $4,822,132 $5,001,917
Federal Home Loan Bank $1,523,610 $1,688,554
Federal Farm Credit Bank $1,577,405 $280,043
Federal National Mortgage Association $115,990 $1,236,960
Money Market Funds $4,403 $227,225
$20,523,463 $21,501,090
MATURITIES (IN YEARS)
Less than 1 $14,404,051 $11,337,658
1-5 $6,119,412 $10,163,432
$20,523,463 $21,501,090
30

Investments are designated for the following purposes:
• Operating funds are designated for future operating contingencies
• Vehicle replacement funds are designated for the future replacement of vehicles
• Capital projects and local match funds are designated to pay for future capital projects and provide the local share to match anticipated funding from federal and state grant funds
• Risk retention funds are designated to cover potential future self-insurance liability claims
• Workers’ compensation self-insurance funds are designated to pay for future workers’ compensation self-insurance claims and any retroactive premiums that come due on previous workers’ compensation plans maintained with an insurance carrier
2017 2016
Operating $2,098,273 $2,801,716
Vehicle replacement $3,669,376 $3,875,475
Capital projects and local match $2,943,526 $2,753,143
Risk retention $3,944,509 $3,924,334
Worker's compensation self-insurance $7,867,779 $8,146,422
$20,523,463 $21,501,090
31

4. Capital Assets:
APRIL 1, 2016 ADDITIONS RECLASSIFICATIONS
AND DISPOSALSMARCH 31.
2017
NON DEPRECIABLE CAPITAL ASSETSLand and improvements $1,529,981 --- --- $1,529,981
Construction in progress --- $715,403 --- $715,403
Total non depreciable capital assets
$1,529,981 $715,403 --- $2,245,384
DEPRECIABLE CAPITAL ASSETSBuildings and improvements $94,492,272 $720,233 --- $95,212,505
Revenue equipment $137,934,104 $6,708,253 ($561,280) $144,081,077Service equipment and vehicles $4,718,599 $1,530,398 ($19,124) $6,229,873
Furniture and equipment $17,464,380 $41,740 --- $17,506,120
Total depreciable capital assets $254,609,355 $9,000,624 ($580,404) $263,029,575
LESS ACCUMULATED DEPRECIATIONBuildings and improvements ($44,167,586) ($3,055,123) --- ($47,222,709)
Revenue equipment ($79,163,784) ($9,490,271) $545,808 ($88,108,247)Service equipment and vehicles ($3,600,447) ($233,537) $19,124 ($3,814,860)
Furniture and equipment ($14,909,357) ($1,325,038) --- ($16,234,395)
Total accumulated depreciation ($141,841,174) ($14,103,969) $564,932 ($155,380,211)
Total depreciable capital assets, net $112,768,181 ($5,103,345) ($15,472) $107,649,364
Total capital assets, net $114,298,162 ($4,387,942) ($15,472) $109,894,748
32

APRIL 1, 2015 ADDITIONS RECLASSIFICATIONS
AND DISPOSALSMARCH 31.
2016
NON DEPRECIABLE CAPITAL ASSETSLand and improvements $1,529,981 --- --- $1,529,981
Construction in progress $1,159,294 --- ($1,159,294) ---
Total non depreciable capital assets
$2,689,275 --- ($1,159,294) $1,529,981
DEPRECIABLE CAPITAL ASSETSBuildings and improvements $94,186,252 $306,020 --- $94,492,272
Revenue equipment $133,336,182 $10,177,365 ($5,579,443) $137,934,104
Service equipment and vehicles $4,477,277 $241,322 --- $4,718,599
Furniture and equipment $17,270,122 $194,258 --- $17,464,380
Total depreciable capital assets $249,269,833 $10,918,965 ($5,579,443) $254,609,355
LESS ACCUMULATED DEPRECIATIONBuildings and improvements ($41,106,935) ($3,060,651) --- ($44,167,586)
Revenue equipment ($75,797,329) ($8,932,377) $5,565,922 ($79,163,784)
Service equipment and vehicles ($3,468,294) ($132,153) --- ($3,600,447)
Furniture and equipment ($13,381,764) ($1,527,593) --- ($14,909,357)
Total accumulated depreciation ($133,754,322) ($13,652,774) $5,565,922 ($141,841,174)
Total depreciable capital assets, net $115,515,511 ($2,733,809) ($13,521) $112,768,181
Total capital assets, net $118,204,786 ($2,733,809) ($1,172,815) $114,298,162
33
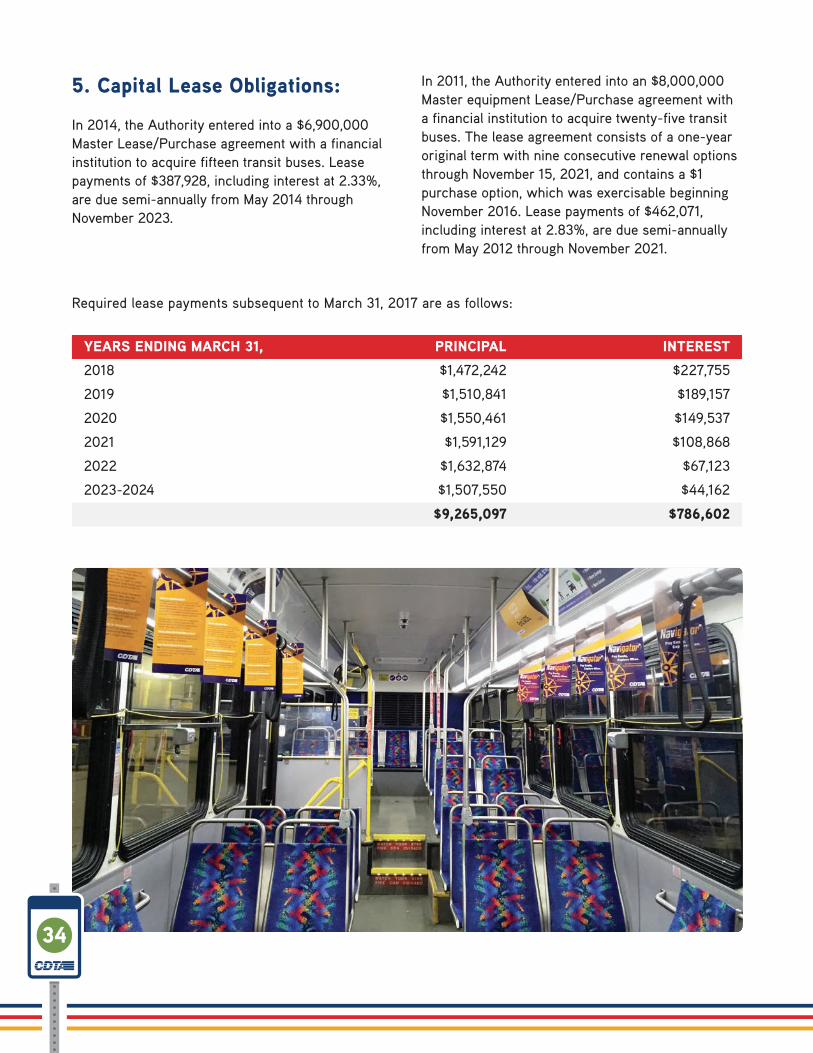
5. Capital Lease Obligations:
In 2014, the Authority entered into a $6,900,000 Master Lease/Purchase agreement with a financial institution to acquire fifteen transit buses. Lease payments of $387,928, including interest at 2.33%, are due semi-annually from May 2014 through November 2023.
In 2011, the Authority entered into an $8,000,000 Master equipment Lease/Purchase agreement with a financial institution to acquire twenty-five transit buses. The lease agreement consists of a one-year original term with nine consecutive renewal options through November 15, 2021, and contains a $1 purchase option, which was exercisable beginning November 2016. Lease payments of $462,071, including interest at 2.83%, are due semi-annually from May 2012 through November 2021.
YEARS ENDING MARCH 31, PRINCIPAL INTEREST
2018 $1,472,242 $227,755
2019 $1,510,841 $189,157
2020 $1,550,461 $149,537
2021 $1,591,129 $108,868
2022 $1,632,874 $67,123
2023-2024 $1,507,550 $44,162
$9,265,097 $786,602
Required lease payments subsequent to March 31, 2017 are as follows:
34

Public support and operating assistance recognized for the years ended March 31, 2017 and 2016 were:
The Authority’s activities are funded primarily by farebox revenues from passengers and operating subsidy payments from the Federal Transit Administration (FTA) under §5307 and §5309 of the Urban Mass Transportation Administration (UMA) Act; the U.S. Department of Transportation; the State; and Albany, Rensselaer, Schenectady and Saratoga Counties.
Other non-operating revenues also include the gross receipts tax, which is imposed by the State on gas and oil companies and allocated to public transportation operators, and the mortgage recording tax, which is a tax imposed on substantially all mortgages granted within the Authority’s Transportation District and collected by the various counties.
2017 2016
Federal operating assistance (FTA) $17,609,934 $17,949,081
STATE AND LOCAL GOVERNMENT FUNDING
New York State $39,174,924 $38,304,143
Albany County $1,075,437 $1,075,437
Rensselaer County $446,661 $446,661
Schenectady County $316,305 $316,305
Saratoga County $78,598 $78,597
Total State and local government funding $41,091,925 $40,221,143
MORTGAGE RECORDING TAX
Albany County $3,555,385 $3,574,450
Rensselaer County $1,602,519 $1,332,486
Schenectady County $1,987,759 $1,219,742
Saratoga County $3,932,924 $4,060,713
Total mortgage recording tax $11,078,587 $10,187,391
$69,780,446 $68,357,615
6. Public Support and Operating Assistance:
35

7. Capital District Transportation Committee:
In accordance with an agreement between the Authority and the New York State Department of Transportation, the Authority functions as the “host agency” for the Capital District Transportation Committee (CDTC). As designated by this agreement, CDTC is the Capital District Regional Transportation Metropolitan Planning Organization and, as such, is the recipient of various Federal and State funded grants related to regional transportation planning. The Committee's board is composed of elected and appointed officials from each of the four counties, each of the eight cities in the four counties, the New York State Department of Transportation, the Authority, the Capital District Regional Planning Commission and a member representing the area’s towns and villages. The Authority has no budgetary oversight and no responsibility for CDTC's deficits or debts. The Authority's financial statements do not include the assets, liabilities, revenues or expenses of CDTC.
In accordance with the agreement, CDTC paid the Authority $75,000 ($60,000 in 2016) to provide certain grant management and accounting functions. Additionally, the Authority advances CDTC periodic working capital funds. Such advances, which do not bear interest, totaled $541,790 and $971,273 at March 31, 2017 and 2016.
8. Postemployment Healthcare Benefits:
The Authority provides postemployment healthcare benefits for retirees meeting eligibility requirements based on date of hire, attainment of retirement age, and years of service. Benefits are provided in the form of insurance premium payments for coverage of eligible retirees and spouses. Employees retiring on or after January 1, 2007 contribute 10-25% of premiums dependent on hire, while employees retiring prior to January 1, 2007 are provided full coverage. Surviving spouses are entitled to continue coverage by paying 100% of the premiums. Benefit provisions and retiree contribution rates are determined through negotiations between the Authority and its employees or the collective bargaining units that represent its employees. The plan does not issue a publicly available financial report.
GASB Statement No. 45 requires that the Authority recognize the cost of other postemployment benefits (OPEB) during the periods when employees render the services that will ultimately entitle them to the benefits. This cost is referred to as the annual required contribution (ARC) and includes:
• Amortization of the unfunded actuarial accrued liability (UAAL) for the current year, which is the actuarially-determined, unfunded present value of all future OPEB costs associated with current employees and retirees as of the beginning of the year
• Normal cost, which is the actuarially-determined cost of future OPEB earned in the current year
36

The ARC represents an amount that, if funded each year, would ultimately satisfy the UAAL at the end of the amortization period (the Authority is using the maximum period of 30 years) as well as each year’s normal cost during that timeframe. A liability is recognized to the extent that actual funding of the plan is less than the ARC. This liability is reflected on the balance sheets as other postemployment benefits. The Authority’s Board of Directors has the authority to establish a funding policy for the plan. The current policy is to fund the plan to the extent of premium payments and reimbursements on a pay-as-you-go basis.
The following table summarizes the Authority s ARC, the amount actually contributed, and changes in the Authority s net OPEB obligation for the years ended March 31, 2017 and 2016:
The Authority s annual OPEB cost, the percentage of annual OPEB cost contributed to the plan, and the net OPEB obligation for the previous three years were as follows:
2017 2016
ANNUAL REQUIRED CONTRIBUTION
Normal cost $3,764,744 $3,473,108
Amortization of UAAL $4,479,496 $4,080,555
Annual required contribution $8,244,240 $7,553,663
Interest on OPEB obligation $1,660,251 $1,460,779
ARC adjustment ($2,400,312) ($2,111,924)
Annual OPEB cost $7,504,179 $6,902,518
Contributions made ($2,104,828) ($1,915,703)
Increase in OPEB obligation $5,399,351 $4,986,815
Net OPEB obligation - beginning of year $41,506,279 $36,519,464
Net OPEB obligation - end of year $46,905,630 $41,506,279
Year Ended March 31, OPEB Cost OPEB Cost Contributed OPEB Obligation
2017 $7,504,179 28.00% $46,905,630
2016 $6,902,518 27.80% $41,506,279
2015 $5,671,146 29.60% $36,519,464
37
• Healthcare cost trend: 5.8% - 7.75% next year; prescriptions: 10.5% next year; Medicare Advantage and Medicare Part B: 5.8% next year; ultimately declining to 3.886% in 2076
• Actuarial cost method: Protected unit credit
• Amortization method: 30 years, open, single amortization level
• Discount rate: 4.0%
• Mortality: The sex-distinct RP-2014 Blue Collar Mortality Tables, scaling using MP-2016
• Turnover: Rates of turnover are based on the experience under the New York State Employees’ Retirement System (ERS)
• Retirement incidence: Rates of retirement are based on the experience under ERS
• Election percentage: It was assumed that 100% of future retirees eligible for coverage will elect postemployment healthcare benefits. Future retirees were assumed to elect coverage in medical plans at the following rates: CDPHP plan – 60%; MVP plan – 15%; Empire Plan – 25%
• Spousal coverage: 40% of future retirees are assumed to elect spousal coverage upon retirement, 30% of surviving spouses are assumed to continue coverage
• Per capita costs: All retiree plans are offered through the New York State Health Insurance Program (NYSHIP) Empire Plan
As of April 1, 2016, the actuarial accrued liability for benefits was $82,175,804, all of which is unfunded. The annual payroll of employees covered by the Plan was $41,562,885, and the ratio of the unfunded actuarial accrued liability to the covered payroll was 198%.
The actuarial valuation involves estimates of costs and the impact of events far into the future. Examples include employee turnover and retirement rates, employee and retiree mortality, and changes in healthcare costs and interest rates. The benefits are subject to routine actuarial valuations and these analyses will reflect revised estimates and assumptions as actual results are compared to past protections and expectations of the future. A schedule of funding progress is presented as required supplementary information and displays trend data on plan assets (if any) and the actuarial accrued liability for benefits.
The actuarial calculations reflect a long-term perspective and utilize techniques designed to reduce short-term volatility in actuarial accrued liabilities. A summary of the methods and assumptions is provided below:
38
9. Pensions:
The Authority participates in ERS, a cost-sharing, multiple employer, public employee retirement system. ERS provides retirement benefits as well as death and disability benefits. New York State Retirement and Social Security Law governs obligations of employers and employees to contribute and provide benefits to employees. ERS issues a publicly available financial report that includes financial statements and requiredsupplementary information. This report may be obtained from the New York State and Local Retirement System at www.osc.state.ny.us/retire.
Benefits: ERS provides retirement, disability, and death benefits for eligible members, including an automatic cost of living adjustment. In general, retirement benefits are determined based on an employee’s individual circumstances using a pension factor, an age factor, and final average salary. The benefits vary depending on theindividual’s employment tier. Pension factors are determined based on tier and an employee’s years of service, among other factors.
Contribution requirements: No employee contribution is required for those hired prior to July 27, 1976. ERS requires employee contributions of 3% of salary for the first 10 years of service for those employees who joined on or after July 27, 1976 through December 31, 2009. Participants hired on or after January 1, 2010 through March 31, 2012 contribute 3% of their gross salary during the length of employment. Participants hired on or after April 1, 2012 are required to contribute a percentage ranging from 3% to 6% each year, based on their level of compensation. The Comptroller annually certifies the rates used, expressed as a percentage of the wages of participants, to compute the contributions required to be made by the Authority to the pension accumulation fund. For payments made in fiscal 2017, rates ranged from 9.3% to 16.0% (10.5% to 18.8% in 2016).
39
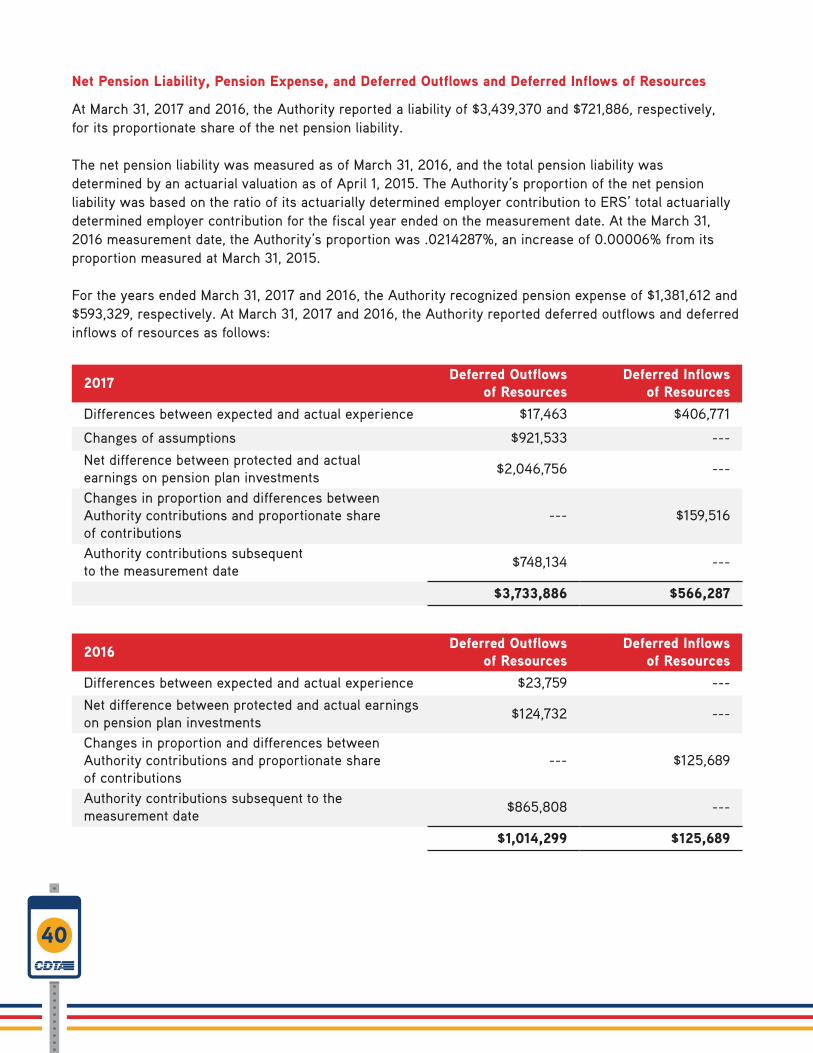
Net Pension Liability, Pension Expense, and Deferred Outflows and Deferred Inflows of Resources
At March 31, 2017 and 2016, the Authority reported a liability of $3,439,370 and $721,886, respectively, for its proportionate share of the net pension liability.
The net pension liability was measured as of March 31, 2016, and the total pension liability was determined by an actuarial valuation as of April 1, 2015. The Authority’s proportion of the net pension liability was based on the ratio of its actuarially determined employer contribution to ERS’ total actuarially determined employer contribution for the fiscal year ended on the measurement date. At the March 31, 2016 measurement date, the Authority’s proportion was .0214287%, an increase of 0.00006% from its proportion measured at March 31, 2015.
For the years ended March 31, 2017 and 2016, the Authority recognized pension expense of $1,381,612 and$593,329, respectively. At March 31, 2017 and 2016, the Authority reported deferred outflows and deferredinflows of resources as follows:
2017 Deferred Outflows of Resources
Deferred Inflows of Resources
Differences between expected and actual experience $17,463 $406,771
Changes of assumptions $921,533 ---
Net difference between protected and actual earnings on pension plan investments $2,046,756 ---
Changes in proportion and differences between Authority contributions and proportionate share of contributions
--- $159,516
Authority contributions subsequent to the measurement date $748,134 ---
$3,733,886 $566,287
2016 Deferred Outflows of Resources
Deferred Inflows of Resources
Differences between expected and actual experience $23,759 ---
Net difference between protected and actual earnings on pension plan investments $124,732 ---
Changes in proportion and differences between Authority contributions and proportionate share of contributions
--- $125,689
Authority contributions subsequent to the measurement date $865,808 ---
$1,014,299 $125,689
40

Authority contributions subsequent to the measurement date will be recognized as a reduction of the net pension liability in the subsequent fiscal year. Other amounts reported as deferred outflows and deferred inflows of resources related to pensions will be recognized in pension expense as follows:
Years Ending March 31,
2018 $606,313
2019 $606,313
2020 $606,313
2021 $600,526
$2,419,465
Actuarial Assumptions
The actuarial assumptions used in the April 1, 2015 valuation, with update procedures used to roll forwardthe total pension liability to March 31, 2016, were based on the results of an actuarial experience study for the period April 1, 2010 to March 31, 2015. These assumptions are:
• INFLATION — 2.5%
• SALARY INCREASES — 3.8%
• COST OF LIVING ADJUSTMENT — 1.3% annually
• INVESTMENT RATE OF RETURN — 7.0% compounded annually, net of investment expense, including inflation
• MORTALITY — Based on ERS experience from April 1, 2010 - March 31, 2015 with adjustments for mortality improvements based on the Society of Actuaries’ Scale MP-2014
• DISCOUNT RATE — 7.0%
The long-term expected rate of return on pension plan investments was determined using a building- block method in which best-estimate ranges of expected future real rates of return (expected return, net of investment expenses and inflation) are developed for each major asset class. These ranges are combined to produce the long-term expected rate of return by weighting the expected future real rates of return by the target asset allocation percentage and by adding expected inflation.
Best estimates of arithmetic real rates of return for each major asset class and ERS’s target asset allocations as of the applicable valuation dates are summarized as follows:
Years Ending March 31, Target Allocation Long-term Expected Real Rate of ReturnDomestic equities 38% 7.30%International equities 13% 8.50%
Private equities 10% 11.00%Real estate 8% 8.30%
Domestic fixed income securities 2% 4.00%Bonds and mortgages 18% 4.00%Short-term 2% 2.30%Other 9% 6.8%-8.7%
100%
41

Discount Rate
The discount rate protection of cash flows assumed that contributions from plan members will be made at the current member contribution rates and that contributions from employers will be made at statutorily required rates, actuarially determined. Based on those assumptions, ERS’s fiduciary net position was protected to be available to make all protected future benefit payments of current plan members. Therefore, the long-term expected rate of return on pension plan investments was applied to all periods of protected benefit payments to determine the total pension liability.
The Authority’s proportionate share of its net pension liability is calculated using a discount rate of 7.0%. The impact of using a discount rate that is 1% lower (6.0%) than the current rate would result in a net pension liability of $7,792,375 and a 1% higher (8.0%) rate would result in a net pension asset of $208,587.
Deferred Compensation
The Authority offers its employees participation in the Deferred Compensation Plan for Employees of the State (the Plan). The Plan, which is available to all Authority employees, permits participants to defer a portion of their salaries until future years. Amounts deferred under the Plan are not available
to employees until termination, retirement, death or unforeseeable emergency. Plan assets and liabilities are not included in these financial statements.
Employees of Operating Subsidiaries
Union employees of the Authority’s operating subsidiaries (blended component units) are covered by various pension plans (the Plans) that are sponsored by unions that represent those operating subsidiary employees. The Authority contributes to the Plans based on negotiated benefits determined under various unionagreements. Under these negotiated benefits, all employees with 60 days of service are eligible to participate in the Plans. Both the Authority and its employees contribute on a weekly basis. The Authority’s contributions to the Plans are included in amounts recorded for pension expense and totaled $1,615,558 and $2,112,899 for the years ended March 31, 2017 and 2016. Management has obtained a legal opinion which concludes thatthe Authority is not obligated to make any other payments to fund the benefits or to meet any expenses of administration, and in the event of termination, the Authority will have no obligation for further contributions to the Plans. Therefore, net pension assets and liabilities of the Plans are not recorded by the Authority.
42

Risk Management
The Authority is subject to certain business risks that could have a material impact on future operations and financial performance. These risks include economic conditions; collective bargaining disputes; federal, state and local government regulations; and changes in law.
The Authority is also exposed to various risks of loss related to torts; damage to, theft of and destruction of property; errors and omissions; and natural disasters. To limit its exposure, the Authority purchases a variety of insurance policies, subject to specific deductibles and coverage limits. Settled claims resulting from these risks have not exceeded commercial coverage in any of the past three years.
Self-Insured Claims
The Authority assumes liability for personal injury and property damage claims up to $2 million peroccurrence and workers’ compensation claims up to $700,000 per occurrence. The Authority has excess insurance from commercial insurers to cover claims made in excess of these amounts, subject to a general liability coverage limit of $13 million per occurrence. Estimated liabilities for claims that are not covered by insurance have been reflected in the financial statements. Personal injury and property damage liabilities are reported when it is probable that a loss has occurred and the amount of that loss can be reasonably estimated by the Authority based on available information. Workers’ compensation liabilities, including an estimate of claims that have been incurred but not reported, are estimated based on an actuarial valuation as of March 31, 2017.
The Authority has designated risk reserves of $11,812,288 and $12,070,756 at March 31, 2017 and 2016 (Note 3). The changes in the reported liabilities are as follows:
10. Commitments and Contingencies:
Beginning of Year
Current Year Claims and Changes in Estimates
Claim Payments End of Year
WORKERS’ COMPENSATION
2017 $7,800,000 $2,092,600 $2,356,400 $7,536,2002016 $8,254,500 $1,796,500 $2,251,000 $7,800,000
GENERAL LIABILITY
2017 $1,037,800 ($138,000) $211,000 $688,8002016 $1,113,800 $192,000 $268,000 $1,037,800
Grants
The Authority receives financial assistance from federal and state agencies in the form of grants. The expenditure of funds received under these programs generally requires compliance with the terms and conditions specified in the grant agreements and are subject to audit by the grantor agencies. Any disallowed claims resulting from such audits could become a liability of the Authority. Based on prior experience, Authority management expects any such amounts to be immaterial.
Commitments
During 2017, the Authority exercised its option to purchase two commuter buses, six articulated buses, and thirty-four transit buses totaling $22.1 million with delivery in 2018.
43
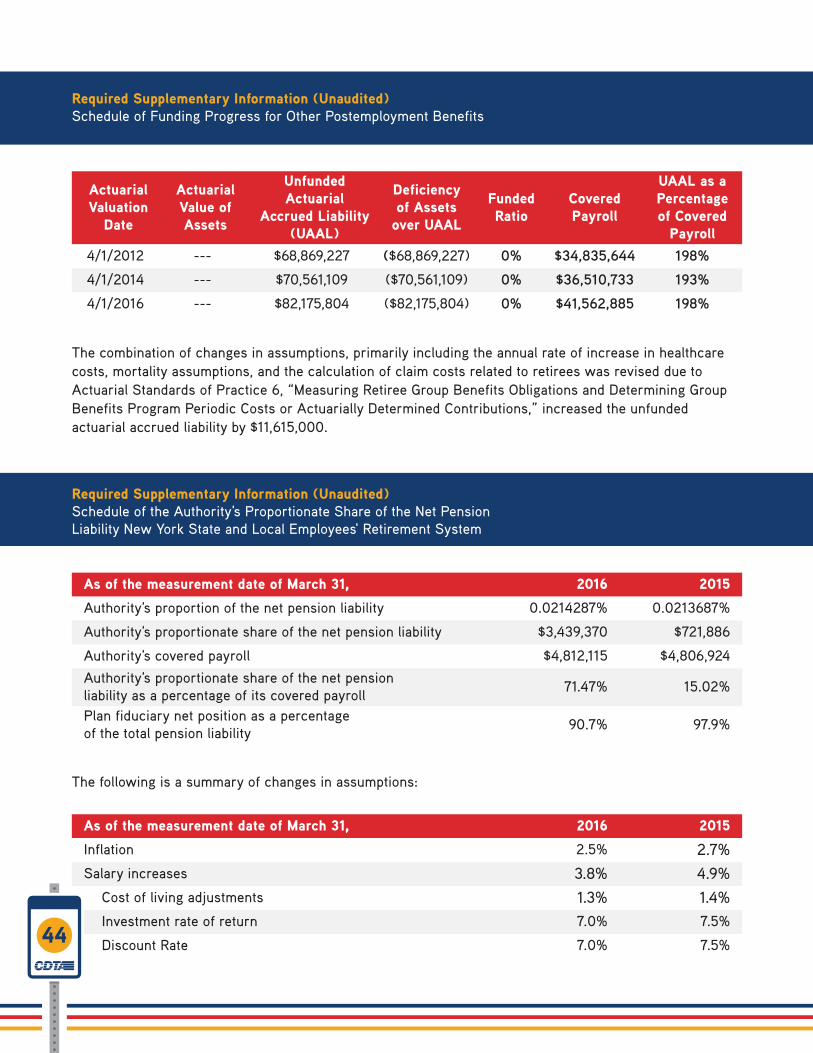
The combination of changes in assumptions, primarily including the annual rate of increase in healthcare costs, mortality assumptions, and the calculation of claim costs related to retirees was revised due to Actuarial Standards of Practice 6, “Measuring Retiree Group Benefits Obligations and Determining Group Benefits Program Periodic Costs or Actuarially Determined Contributions,” increased the unfunded actuarial accrued liability by $11,615,000.
The following is a summary of changes in assumptions:
Actuarial Valuation
Date
Actuarial Value of Assets
Unfunded Actuarial
Accrued Liability (UAAL)
Deficiency of Assets
over UAAL
Funded Ratio
Covered Payroll
UAAL as a Percentage of Covered
Payroll4/1/2012 --- $68,869,227 ($68,869,227) 0% $34,835,644 198%
4/1/2014 --- $70,561,109 ($70,561,109) 0% $36,510,733 193%
4/1/2016 --- $82,175,804 ($82,175,804) 0% $41,562,885 198%
Required Supplementary Information (Unaudited)Schedule of Funding Progress for Other Postemployment Benefits
Required Supplementary Information (Unaudited)Schedule of the Authority's Proportionate Share of the Net Pension Liability New York State and Local Employees' Retirement System
As of the measurement date of March 31, 2016 2015
Authority's proportion of the net pension liability 0.0214287% 0.0213687%
Authority's proportionate share of the net pension liability $3,439,370 $721,886
Authority's covered payroll $4,812,115 $4,806,924
Authority's proportionate share of the net pension liability as a percentage of its covered payroll 71.47% 15.02%
Plan fiduciary net position as a percentage of the total pension liability 90.7% 97.9%
As of the measurement date of March 31, 2016 2015
Inflation 2.5% 2.7%Salary increases 3.8% 4.9%
Cost of living adjustments 1.3% 1.4%Investment rate of return 7.0% 7.5%
Discount Rate 7.0% 7.5%44

Required Supplementary Information (Unaudited)Schedule of Authority ContributionsNew York State and Local Employees' Retirement System
March 31, 2017 2016 2015 2014
Contractually required contribution $748,134 $865,808 $888,428 $960,659Contribution in relation to thecontractually required contribution ($748,134) ($865,808) ($888,428) ($960,659)
Contribution deficiency (excess) --- --- --- ---
Authority's covered payroll $5,042,890 $4,812,115 $4,806,924 $4,777,221Contributions as a percentage of covered payroll 14.84% 17.99% 18.48% 20.11%
45

Cyclorama Building | 369 Franklin Street | Buffalo, NY 14202
p:716.856.3300 | f:716.856.2524 | www.LumsdenCPA.com
COMMUNICATION WITH THOSE CHARGED WITH GOVERNANCE
May 24, 2017
The Performance and Oversight Committee and Board of DirectorsCapital District Transportation Authority We have audited the financial statements of Capital District Transportation Authority (the Authority), a business-type activity, for the year ended March 31, 2017. Professional standards require that we provide you with information about our responsibilities under generally accepted auditing standards and Government Auditing Standards, and the Uniform Guidance, where applicable, as well as certain information related to the planned scope and timing of our audit. We have communicated such information to you in our engagement letter to you dated April 11, 2017. Professional standards also require that we communicate to you the following information related to our audit. Significant Audit Findings Qualitative Aspects of Accounting PracticesManagement is responsible for the selection and use of appropriate accounting policies. The significant accounting policies used by the Authority are described in Note 2 to the financial statements. No new accounting policies were adopted and the application of existing policies was not changed during 2017. We noted no transactions entered into by the Authority during the year for which there is a lack of authoritative guidance or consensus. Accounting estimates are an integral part of the financial statements prepared by management and are based on management’s knowledge and experience about past and current events and assumptions about future events. Certain accounting estimates are particularly sensitive because of their significance to the financial statements and because of the possibility that future events affecting them may differ significantly from those expected. The most sensitive estimates affecting the Authority’s financial statements were: • Accounts and grants receivable • Useful lives assigned to capital assets and related depreciation methods • Accrual of compensated absences (vacation and sick pay liabilities) • Provision for claims and settlements • Accrued other postemployment benefits expense and liability • Accrued pension liability Management’s estimates are based on firm concepts and reasonable assumptions of future events. We evaluated the key factors and assumptions used to develop the estimates in determining that they are reasonable in relation to the financial statements taken as a whole. Certain financial statement disclosures are particularly sensitive because of their significance to financial statement users. The most important disclosures affecting the financial statements are reflected in Note 4 – Capital Assets, Note 8 – Postemployment Healthcare Benefits, Note 9 – Pensions, and Note 10 – Commitments and Contingencies. These disclosures reflect detail on the Authority’s capital assets and certain liabilities.
46
The financial statement disclosures are neutral, consistent, and clear. Difficulties Encountered in Performing the Audit We encountered no difficulties in dealing with management in performing and completing our audit. Corrected and Uncorrected Misstatements Professional standards require us to accumulate all known and likely misstatements identified during the audit, other than those that are trivial, and communicate them to the appropriate level of management. We discovered no such misstatements during our audit. Disagreements with Management For purposes of this letter, a disagreement with management as a financial accounting, reporting, or auditing matter, whether or not resolved to our satisfaction, that could be significant to the financial statements or the auditors' report. We are pleased to report that no such disagreements arose during the course of our audit. Management Representations We have requested certain representations from management that are included in the management representation letter dated May 24, 2017. Management Consultations with Other Independent Accountants In some cases, management may decide to consult with other accountants about auditing and accounting matters, similar to obtaining a “second opinion” on certain situations. If a consultation involves application of an accounting principle to the Authority’s financial statements or a determination of the type of auditors’ opinion that may be expressed on those statements, our professional standards require the consulting accountant to check with us to determine that the consultant has all the relevant facts. To our knowledge, there were no such consultations with other accountants. Other Audit Findings or Issues We generally discuss a variety of matters, including the application of accounting principles and auditing standards, with management each year prior to retention as the Authority’s auditors. However, these discussions occurred in the normal course of our professional relationship and our responses were not a condition to our retention. Other Matters We applied certain limited procedures to Management’s Discussion and Analysis and other required supplementary information (RSI) regarding OPEB and pension, which is required supplementary information (RSI) that supplements the basic financial statements. Our procedures consisted of inquiries of management regarding the methods of preparing the information and comparing the information for consistency with management’s responses to our inquiries, the basic financial statements, and other knowledge we obtained during our audit of the basic financial statements. We did not audit the RSI and do not express an opinion or provide any assurance on the RSI. Restriction on Use This information is intended solely for the information and use of the Performance and Oversight Committee, Board of Directors and management of the Authority and is not intended to be, and should not be, used by anyone other than these specified parties.
47

Cyclorama Building | 369 Franklin Street | Buffalo, NY 14202
p:716.856.3300 | f:716.856.2524 | www.LumsdenCPA.com
COMMUNICATION OF NO MATERIAL WEAKNESSES
May 24, 2017
The Performance and Oversight Committee, Board of Directors, and ManagementCapital District Transportation Authority In planning and performing our audit of the financial statements of Capital District Transportation Authority (the Authority), a business-type activity, as of and for the year ended March 31, 2017, in accordance with auditing standards generally accepted in the United States of America, we considered the Authority’s internal control over financial reporting (internal control) as a basis for designing audit procedures that are appropriate in the circumstances for the purpose of expressing our opinion on the financial statements, but not for the purpose of expressing an opinion on the effectiveness of the Authority’s internal control. Accordingly, we do not express an opinion on the effectiveness of the Authority’s internal control. A deficiency in internal control exists when the design or operation of a control does not allow management or employees, in the normal course of performing their assigned functions, to prevent, or detect and correct, misstatements on a timely basis. A material weakness is a deficiency, or a combination of deficiencies, in internal control, such that there is a reasonable possibility that a material misstatement of the entity’s financial statements will not be prevented, or detected and corrected, on a timely basis. Our consideration of internal control was for the limited purpose described in the first paragraph and was not designed to identify all deficiencies in internal control that might be material weaknesses. In addition, because of inherent limitations in internal control, including the possibility of management override of controls, misstatements due to error or fraud may occur and not be detected by such controls. Given these limitations during our audit, we did not identify any deficiencies in internal control that we consider to be material weaknesses. However, material weaknesses may exist that have not been identified. This communication is intended solely for the information and use of the Performance and Oversight Committee, Board of Directors, management, others within the Authority, and is not intended to be, and should not be, used by anyone other than these specified parties.
48


2016-2017 Annual Report