2015 update to the board: advanced clean cars program
TRANSCRIPT
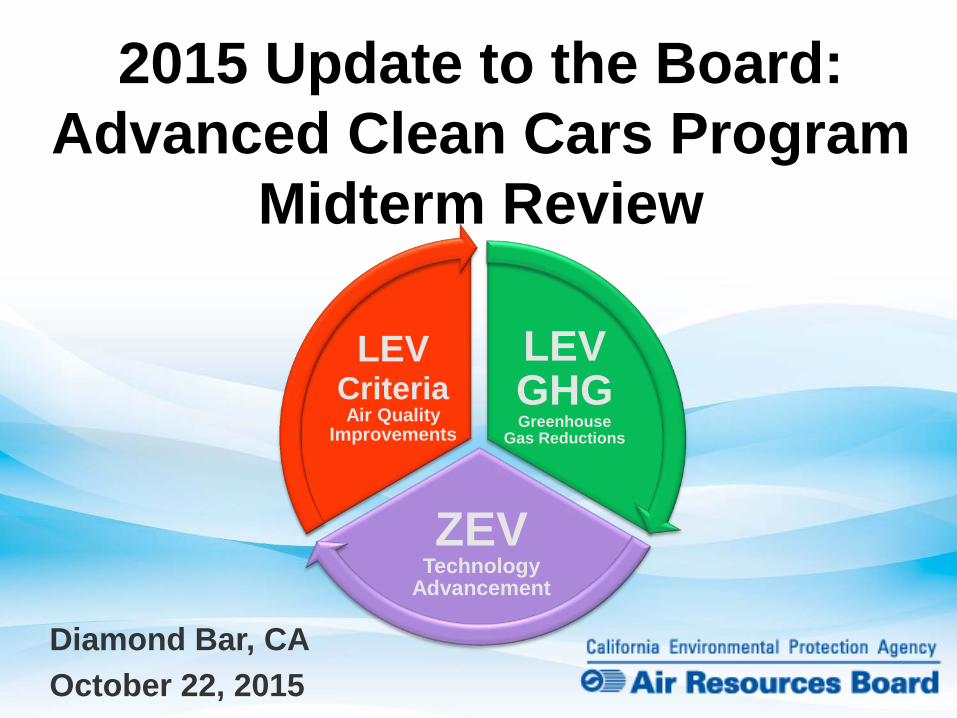
LEV GHG Greenhouse
Gas Reductions
ZEV Technology
Advancement
LEV Criteria Air Quality
Improvements
2015 Update to the Board: Advanced Clean Cars Program
Midterm Review
Diamond Bar, CA October 22, 2015
Advanced Clean Cars
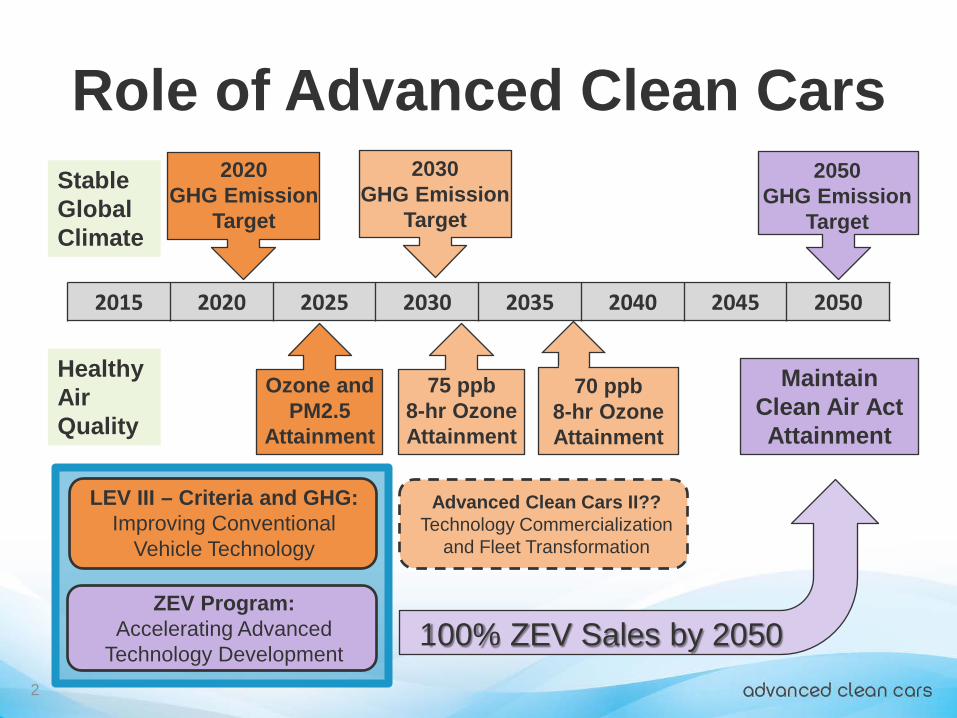
Role of Advanced Clean Cars
2
2020 GHG Emission
Target
2050 GHG Emission
Target
Ozone and PM2.5
Attainment
Stable Global Climate
Healthy Air Quality
2015 2020 2025 2030 2035 2040 2045 2050
LEV III – Criteria and GHG: Improving Conventional
Vehicle Technology
ZEV Program: Accelerating Advanced
Technology Development
Advanced Clean Cars II?? Technology Commercialization
and Fleet Transformation
100% ZEV Sales by 2050
2030 GHG Emission
Target
70 ppb 8-hr Ozone Attainment
Maintain Clean Air Act Attainment
75 ppb 8-hr Ozone Attainment
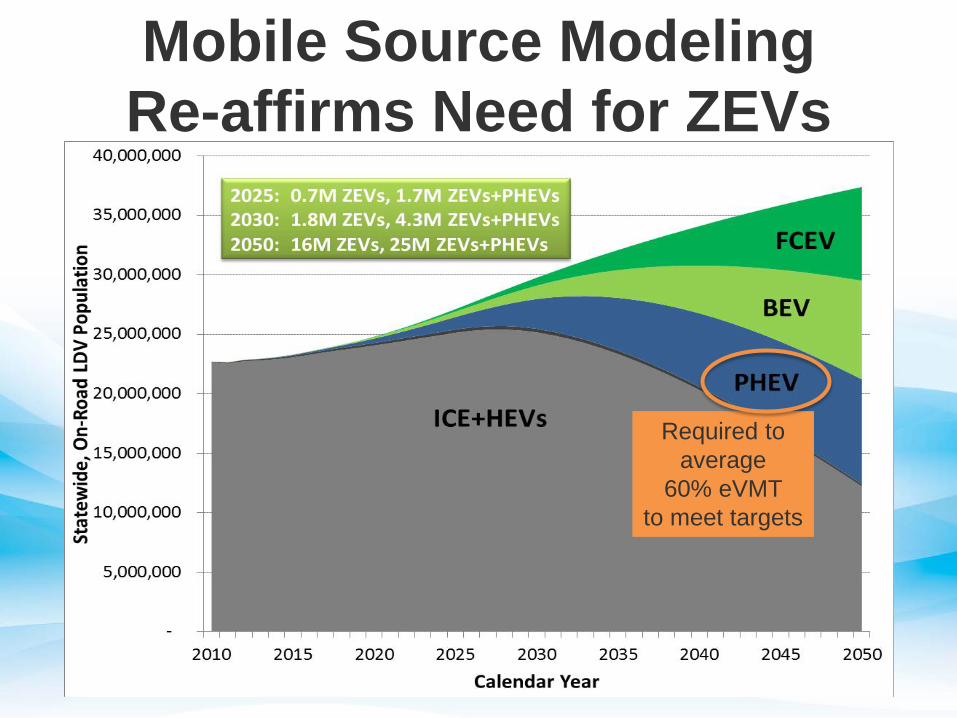
Mobile Source Modeling Re-affirms Need for ZEVs
Required to average
60% eVMT to meet targets
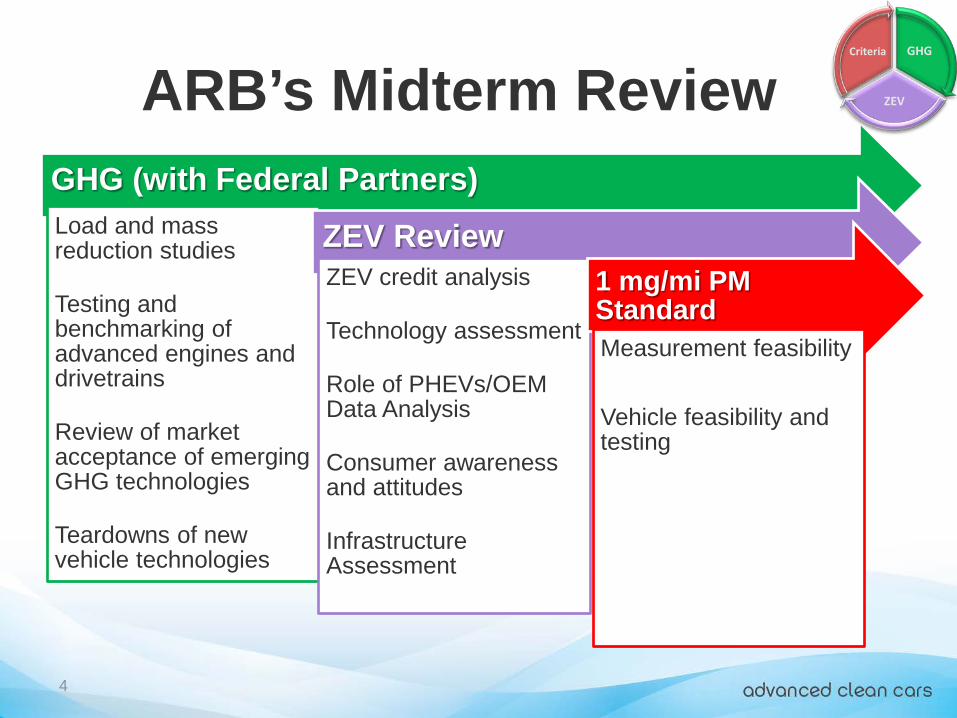
GHG (with Federal Partners) Load and mass reduction studies
Testing and benchmarking of advanced engines and drivetrains
Review of market acceptance of emerging GHG technologies
Teardowns of new vehicle technologies
ZEV Review ZEV credit analysis
Technology assessment
Role of PHEVs/OEM Data Analysis
Consumer awareness and attitudes
Infrastructure Assessment
1 mg/mi PM Standard Measurement feasibility Vehicle feasibility and testing
ARB’s Midterm Review
4
GHG
ZEV
Criteria
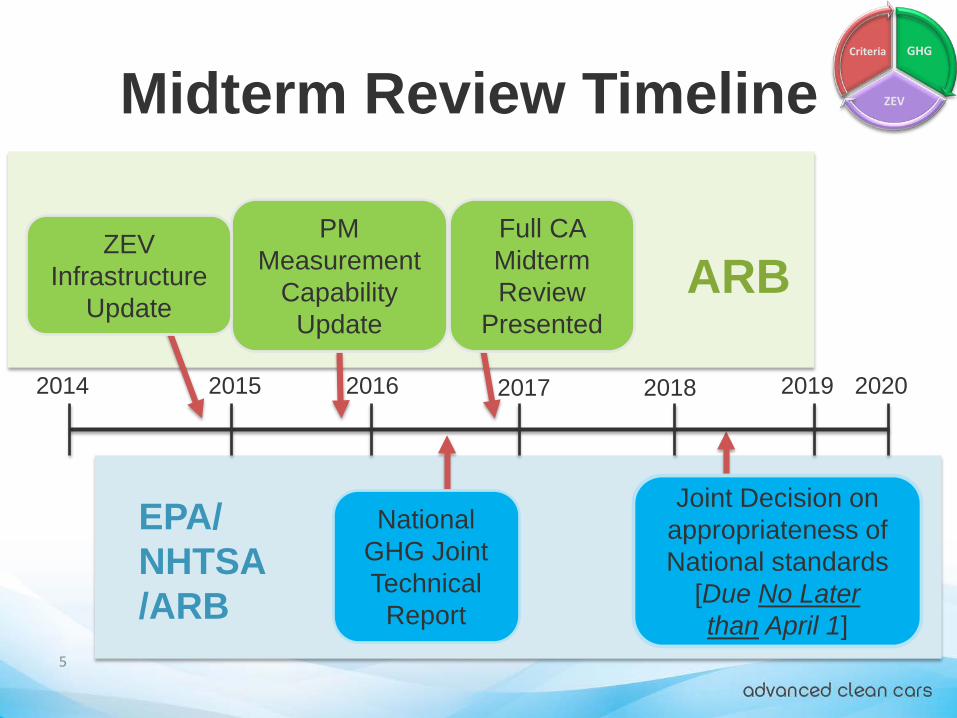
Midterm Review Timeline
2014 2015 2016 2020 2017 2018 2019
National GHG Joint Technical
Report
Joint Decision on appropriateness of National standards
[Due No Later than April 1]
PM Measurement
Capability Update
ZEV Infrastructure
Update
5
Full CA Midterm Review
Presented
GHG
ZEV
Criteria
ARB
EPA/ NHTSA/ARB
LEV-GHG Review Status
• Manufacturers are over-complying with current GHG standards
• Initial findings show manufacturers on track to comply with future standards – NAS Committee Report concluded
compliance with future standards is feasible – ARB research shows road load reduction can
contribute substantially (powertrain/engine improvements contribute remainder)
6
GHG
ZEV
Criteria
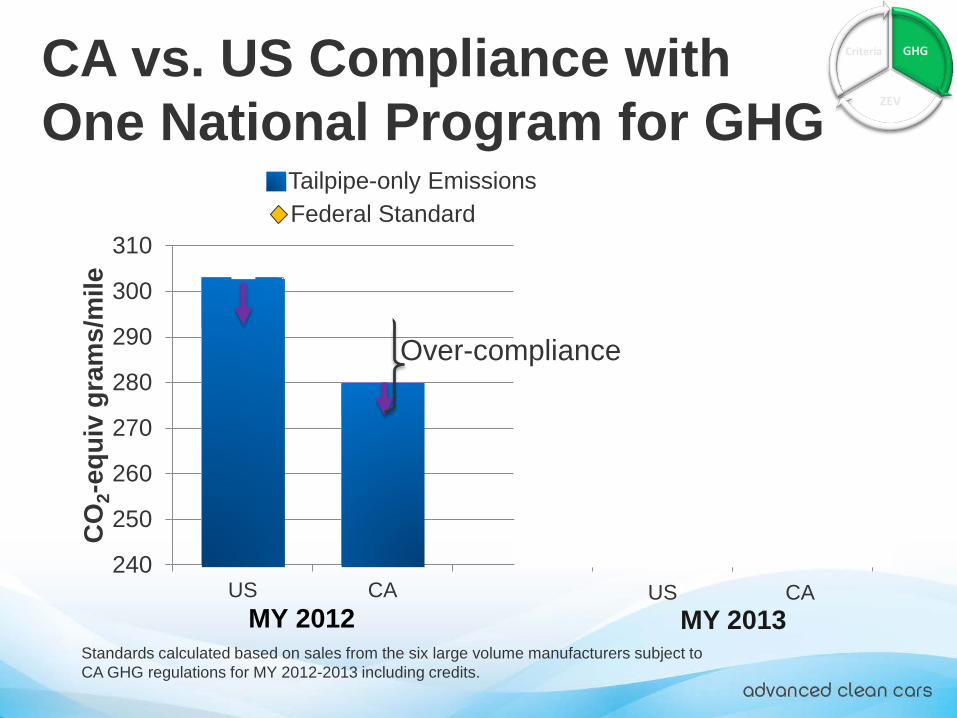
CA vs. US Compliance with One National Program for GHG
240
250
260
270
280
290
300
310
US CA
CO
2-eq
uiv
gram
s/m
ile
Final Compliance Off-Cycle CreditsFederal Standard
MY 2012 MY 2013 Standards calculated based on sales from the six large volume manufacturers subject to CA GHG regulations for MY 2012-2013 including credits.
US CA
GHG
ZEV
Criteria
Tailpipe-only Emissions
Over-compliance
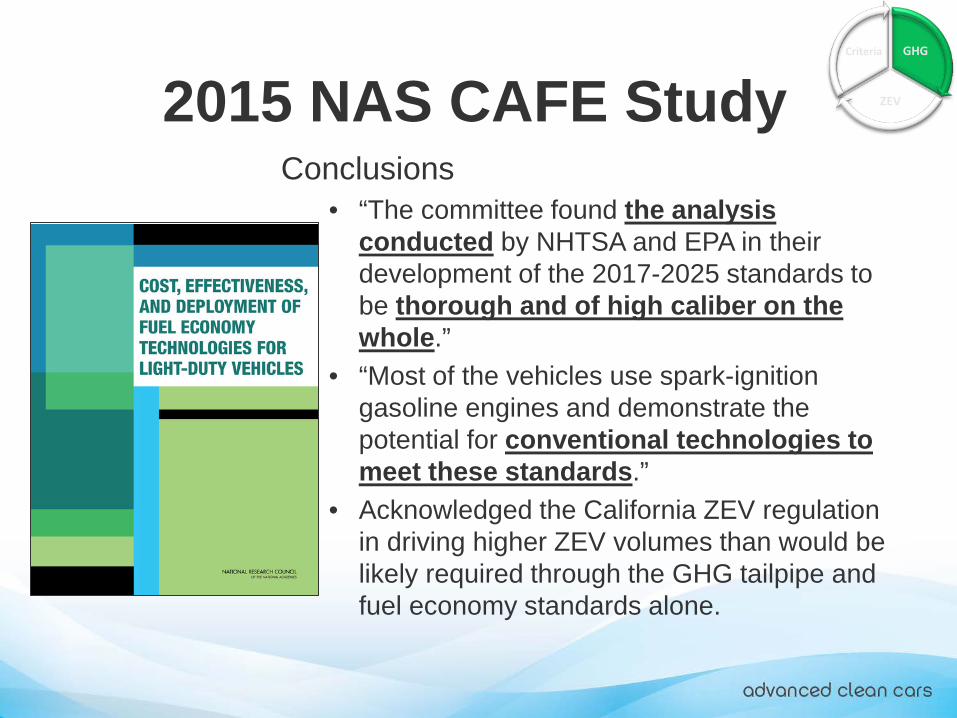
2015 NAS CAFE Study Conclusions
• “The committee found the analysis conducted by NHTSA and EPA in their development of the 2017-2025 standards to be thorough and of high caliber on the whole.”
• “Most of the vehicles use spark-ignition gasoline engines and demonstrate the potential for conventional technologies to meet these standards.”
• Acknowledged the California ZEV regulation in driving higher ZEV volumes than would be likely required through the GHG tailpipe and fuel economy standards alone.
GHG
ZEV
Criteria
GHG
ZEV
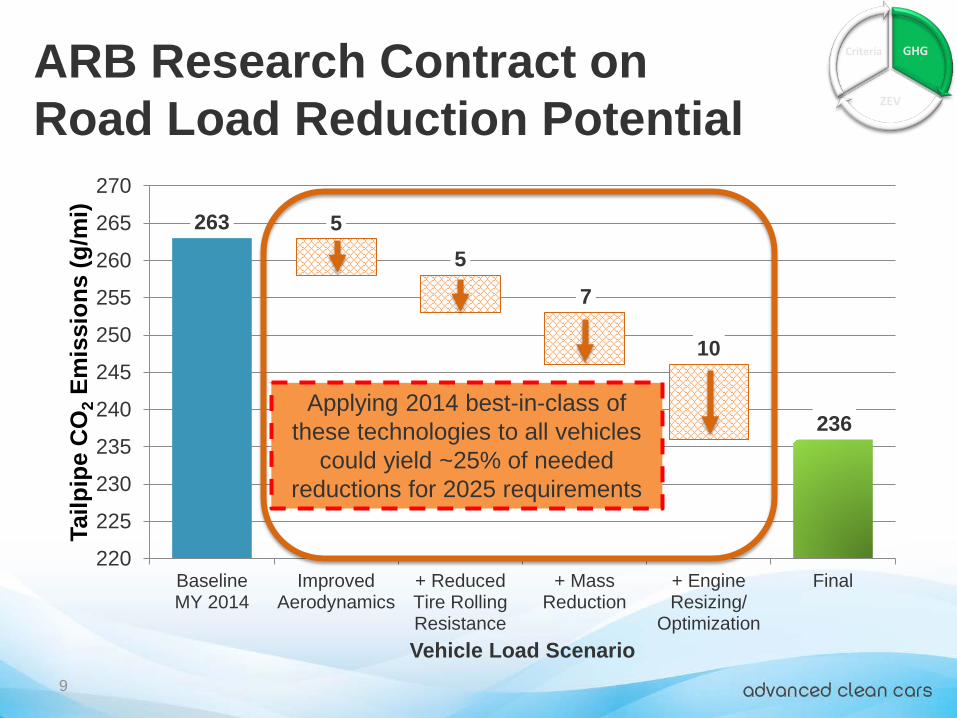
Criteria ARB Research Contract on Road Load Reduction Potential
9
263
236
5 5
7
10
220
225
230
235
240
245
250
255
260
265
270
BaselineMY 2014
ImprovedAerodynamics
+ ReducedTire RollingResistance
+ MassReduction
+ EngineResizing/
Optimization
Final
Tailp
ipe
CO
2 Em
issi
ons
(g/m
i)
Vehicle Load Scenario
Applying 2014 best-in-class of these technologies to all vehicles
could yield ~25% of needed reductions for 2025 requirements
ZEV Review Status
• Credits will continue to provide flexibility for manufacturers’ compliance, but requirements continue to push ZEV commercialization
• Pure ZEV sales are increasing • Consumers pleased with PEV decision but
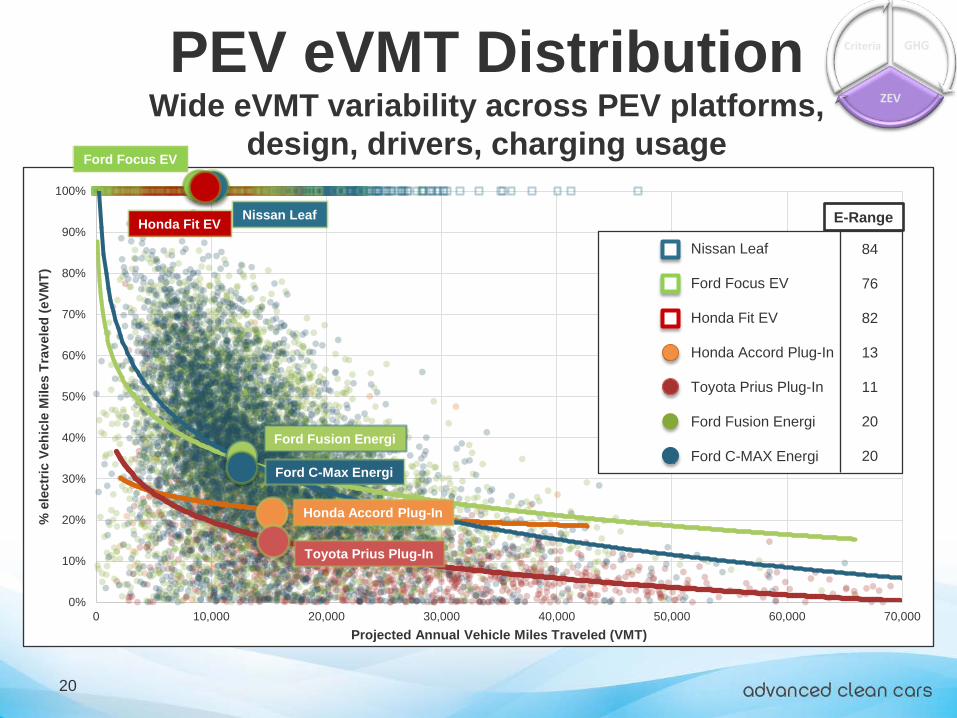
many willing to pay for more electric range • Vehicle usage data show eVMT to be
highly variable, even for same vehicle type 10
GHG
ZEV
Criteria

0
100000
200000
300000
400000
500000
600000
700000
2012 2013 2014 2015 2016 2017 2018 2019 2020 2021 2022 2023 2024 2025
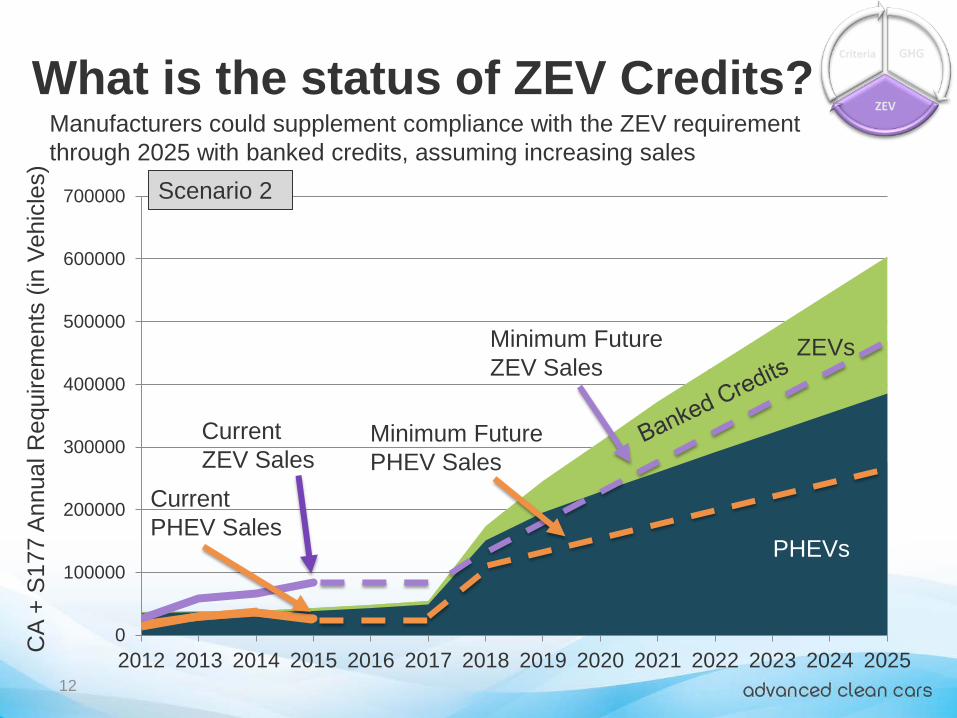
What is the status of ZEV Credits?
11
Assuming current sales levels, and using all credits as quickly as possible, manufacturers would deplete credit banks after 2021 MY compliance
CA
+ S
177
Ann
ual R
equi
rem
ents
(in
Vehi
cles
) GHG
ZEV
Criteria
Minimum Future ZEV Sales
Minimum Future PHEV Sales ZEVs
PHEVs
Current ZEV Sales
Current PHEV Sales
Scenario 1
0
100000
200000
300000
400000
500000
600000
700000
2012 2013 2014 2015 2016 2017 2018 2019 2020 2021 2022 2023 2024 202512
Minimum Future PHEV Sales
Minimum Future ZEV Sales
ZEVs
PHEVs
Manufacturers could supplement compliance with the ZEV requirement through 2025 with banked credits, assuming increasing sales
GHG
ZEV
Criteria C
A +
S17
7 A
nnua
l Req
uire
men
ts (i
n Ve
hicl
es)
Current ZEV Sales
Current PHEV Sales
What is the status of ZEV Credits?
Scenario 2
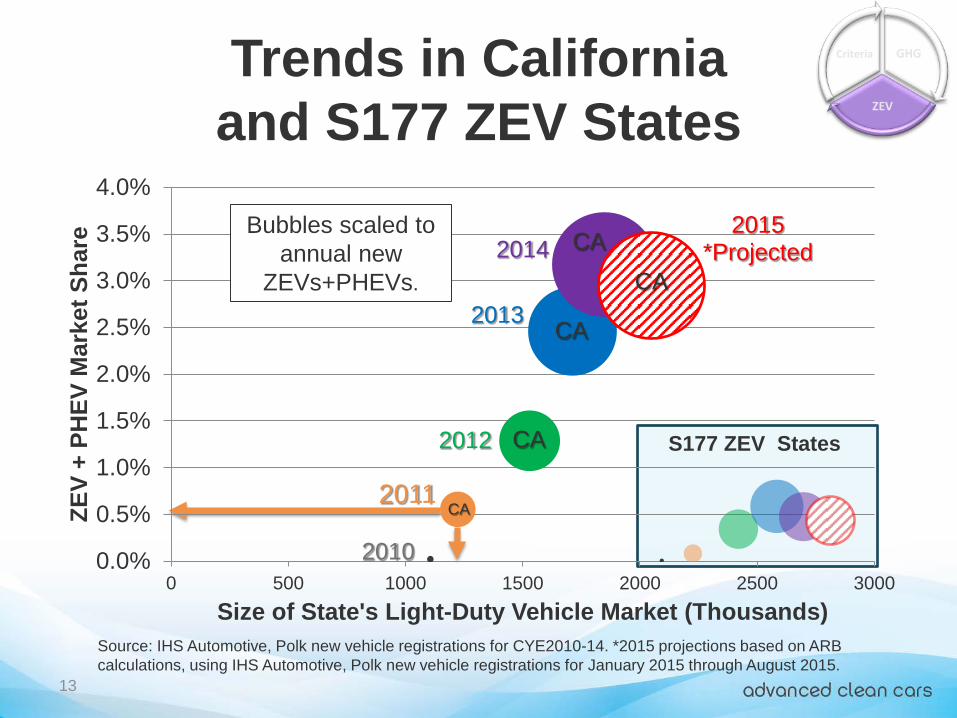
2010
2011
2012
2013
2014 2015
*Projected
0.0%
0.5%
1.0%
1.5%
2.0%
2.5%
3.0%
3.5%
4.0%
0 500 1000 1500 2000 2500 3000
ZEV
+ PH
EV M
arke
t Sha
re
Size of State's Light-Duty Vehicle Market (Thousands)
Bubbles scaled to annual new
ZEVs+PHEVs.
Trends in California and S177 ZEV States
13
Source: IHS Automotive, Polk new vehicle registrations for CYE2010-14. *2015 projections based on ARB calculations, using IHS Automotive, Polk new vehicle registrations for January 2015 through August 2015.
S177 ZEV States
GHG
ZEV
Criteria
CA
CA
CA
CA
CA
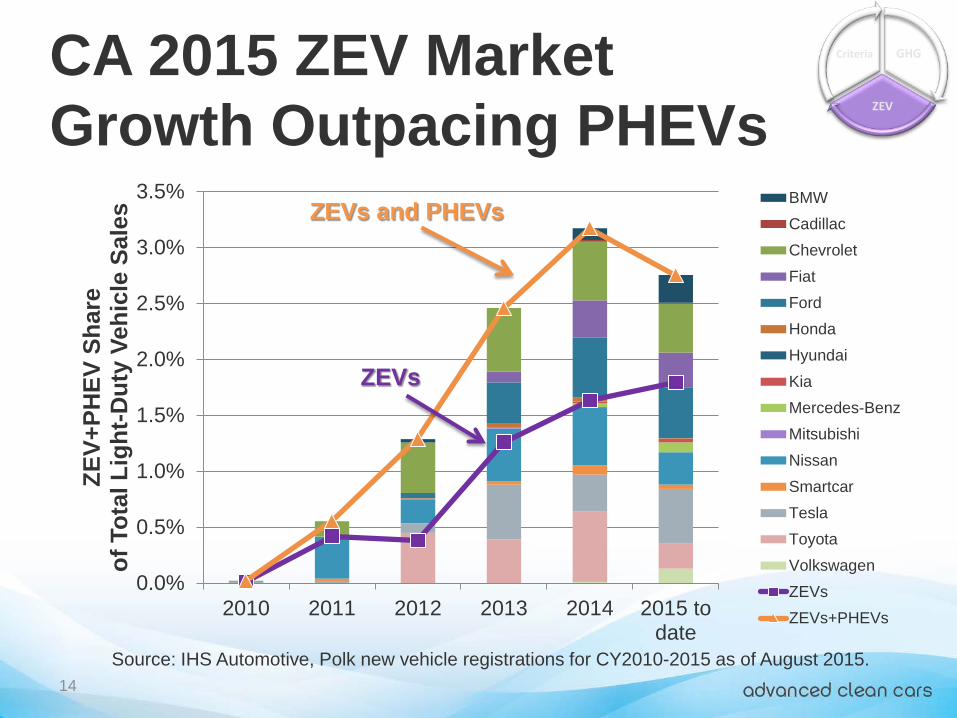
0.0%
0.5%
1.0%
1.5%
2.0%
2.5%
3.0%
3.5%
2010 2011 2012 2013 2014 2015 todate
ZEV+
PHEV
Sha
re
of T
otal
Lig
ht-D
uty
Vehi
cle
Sale
s BMWCadillacChevroletFiatFordHondaHyundaiKiaMercedes-BenzMitsubishiNissanSmartcarTeslaToyotaVolkswagenZEVsZEVs+PHEVs
CA 2015 ZEV Market Growth Outpacing PHEVs
14 Source: IHS Automotive, Polk new vehicle registrations for CY2010-2015 as of August 2015.
GHG
ZEV
Criteria
ZEVs and PHEVs
ZEVs
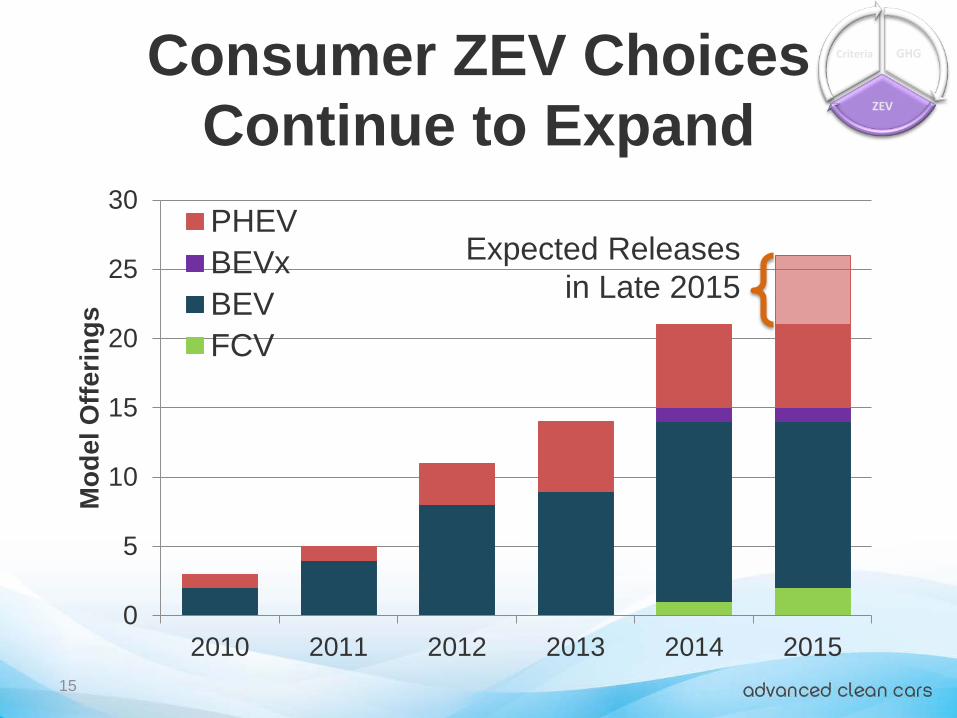
0
5
10
15
20
25
30
2010 2011 2012 2013 2014 2015
Mod
el O
fferin
gs
New PHEVPHEVBEVxBEVFCV
Consumer ZEV Choices Continue to Expand
15
GHG
ZEV
Criteria
Expected Releases in Late 2015
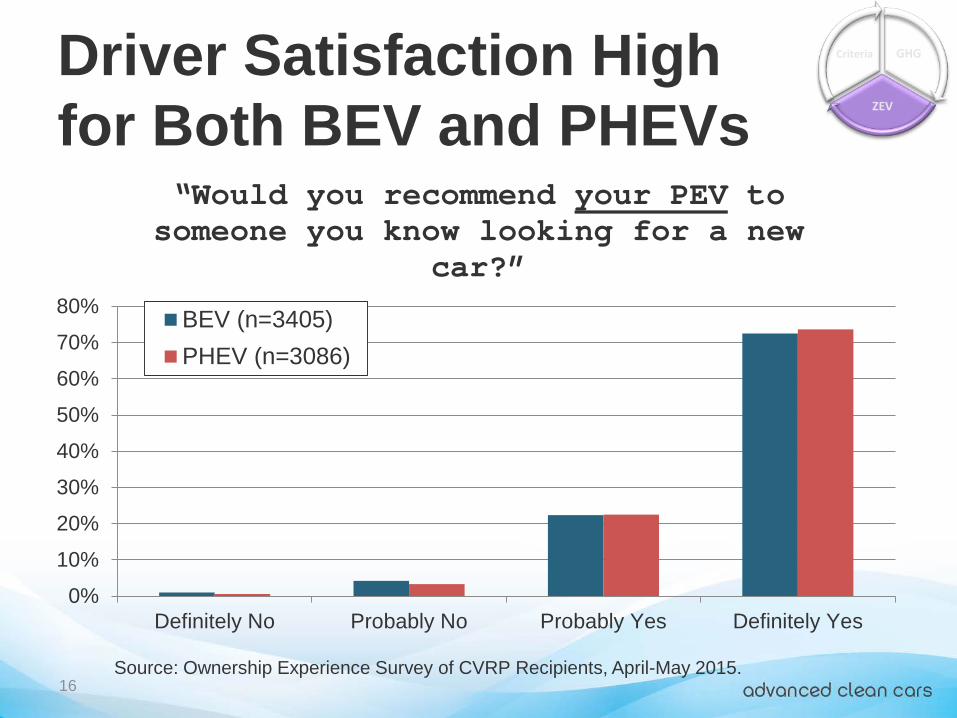
Driver Satisfaction High for Both BEV and PHEVs
0%
10%
20%
30%
40%
50%
60%
70%
80%
Definitely No Probably No Probably Yes Definitely Yes
“Would you recommend your PEV to someone you know looking for a new
car?”
BEV (n=3405)PHEV (n=3086)
16
GHG
ZEV
Criteria
Source: Ownership Experience Survey of CVRP Recipients, April-May 2015.
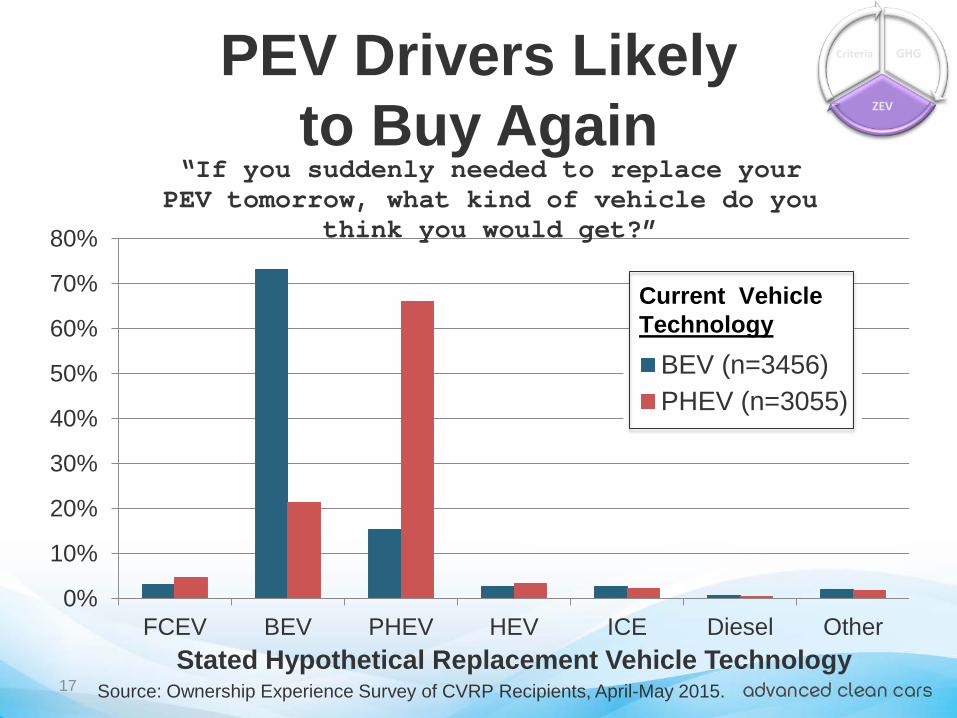
PEV Drivers Likely to Buy Again
0%
10%
20%
30%
40%
50%
60%
70%
80%
FCEV BEV PHEV HEV ICE Diesel OtherStated Hypothetical Replacement Vehicle Technology
“If you suddenly needed to replace your PEV tomorrow, what kind of vehicle do you
think you would get?”
BEV (n=3456)PHEV (n=3055)
Current Vehicle Technology
17
GHG
ZEV
Criteria
Source: Ownership Experience Survey of CVRP Recipients, April-May 2015.
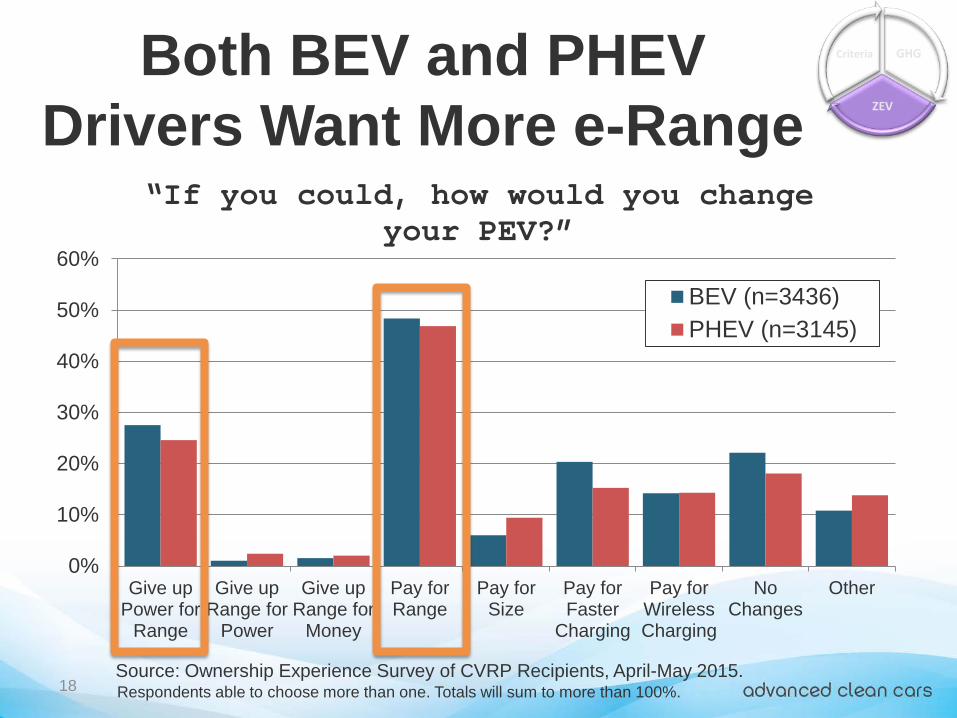
Both BEV and PHEV Drivers Want More e-Range
0%
10%
20%
30%
40%
50%
60%
Give upPower for
Range
Give upRange for
Power
Give upRange for
Money
Pay forRange
Pay forSize
Pay forFaster
Charging
Pay forWirelessCharging
NoChanges
Other
“If you could, how would you change your PEV?”
BEV (n=3436)PHEV (n=3145)
18
GHG
ZEV
Criteria
Respondents able to choose more than one. Totals will sum to more than 100%. Source: Ownership Experience Survey of CVRP Recipients, April-May 2015.
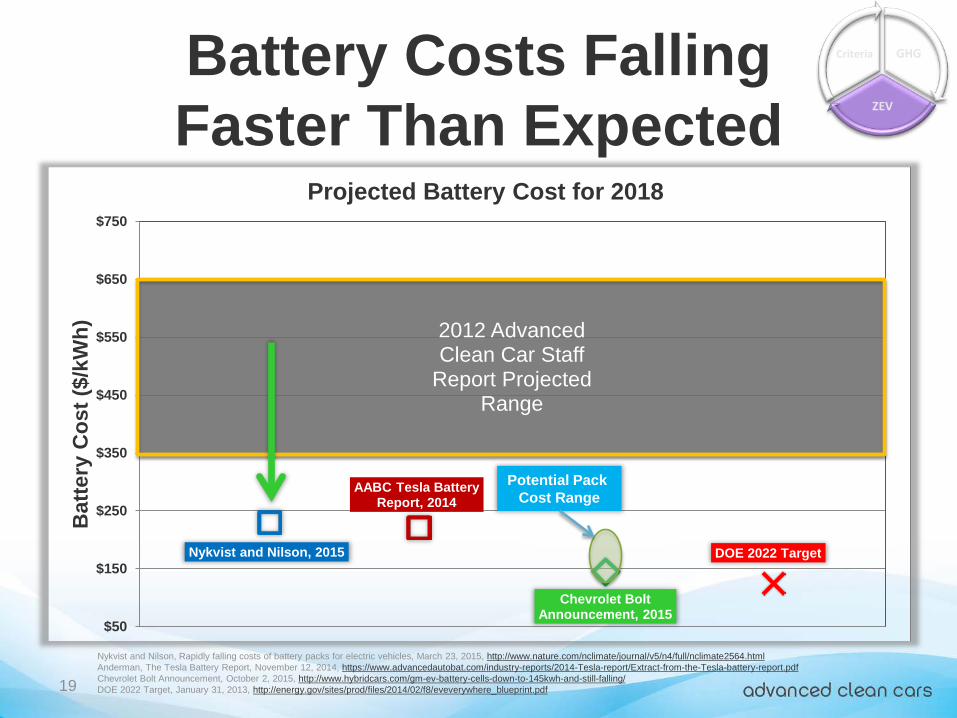
2012 Advanced Clean Car Staff
Report Projected Range
Nykvist and Nilson, 2015
AABC Tesla Battery Report, 2014
Chevrolet Bolt Announcement, 2015
DOE 2022 Target
$50
$150
$250
$350
$450
$550
$650
$750
Bat
tery
Cos
t ($/
kWh)
Projected Battery Cost for 2018
Battery Costs Falling Faster Than Expected
19
GHG
ZEV
Criteria
Potential Pack Cost Range
Nykvist and Nilson, Rapidly falling costs of battery packs for electric vehicles, March 23, 2015, http://www.nature.com/nclimate/journal/v5/n4/full/nclimate2564.html Anderman, The Tesla Battery Report, November 12, 2014, https://www.advancedautobat.com/industry-reports/2014-Tesla-report/Extract-from-the-Tesla-battery-report.pdf Chevrolet Bolt Announcement, October 2, 2015, http://www.hybridcars.com/gm-ev-battery-cells-down-to-145kwh-and-still-falling/ DOE 2022 Target, January 31, 2013, http://energy.gov/sites/prod/files/2014/02/f8/eveverywhere_blueprint.pdf
0%
10%
20%
30%
40%
50%
60%
70%
80%
90%
100%
0 10,000 20,000 30,000 40,000 50,000 60,000 70,000
% e
lect
ric V
ehic
le M
iles
Trav
eled
(eVM
T)
Projected Annual Vehicle Miles Traveled (VMT)
Nissan Leaf
Ford Focus EV
Honda Fit EV
Honda Accord Plug-In
Toyota Prius Plug-In
Ford Fusion Energi
Ford C-MAX Energi
PEV eVMT Distribution Wide eVMT variability across PEV platforms,
design, drivers, charging usage
20
GHG
ZEV
Criteria
Ford Fusion Energi
Ford C-Max Energi
Honda Accord Plug-In
Toyota Prius Plug-In
84
76
82
13
11
20
20
E-Range
Ford Focus EV
Nissan Leaf Honda Fit EV
0%
10%
20%
30%
40%
50%
60%
70%
80%
90%
100%
0 10,000 20,000 30,000 40,000 50,000 60,000 70,000
% e
lect
ric V
ehic
le M
iles
Trav
eled
(eVM
T)
Projected Annual Vehicle Miles Traveled (VMT)
E-Range
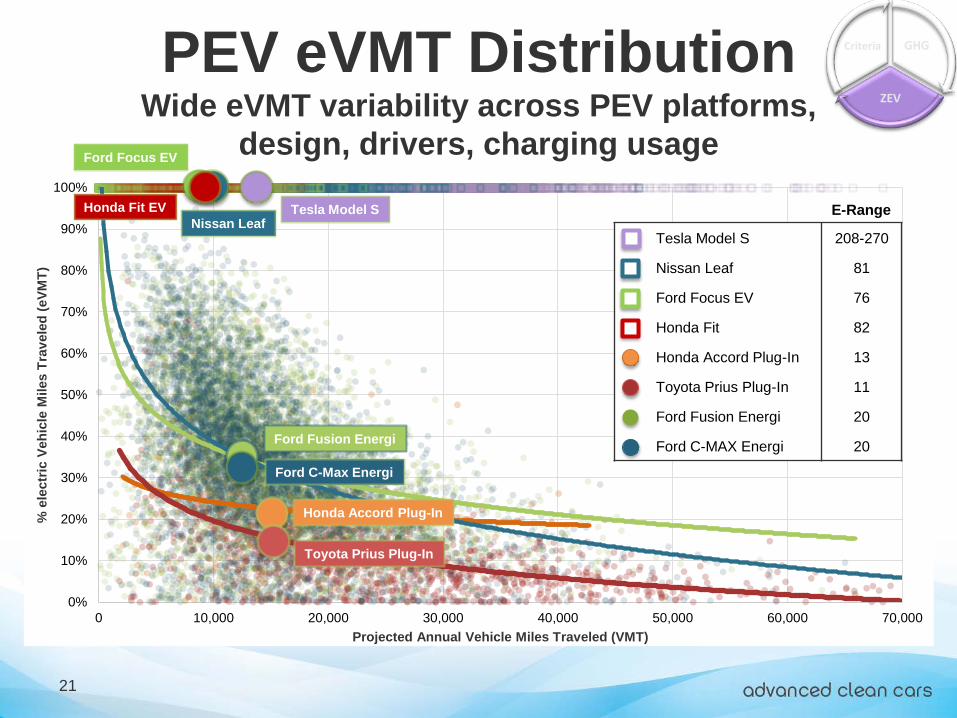
Tesla Model S 208-270
Nissan Leaf 81
Ford Focus EV 76
Honda Fit 82
Honda Accord Plug-In 13
Toyota Prius Plug-In 11
Ford Fusion Energi 20
Ford C-MAX Energi 20
PEV eVMT Distribution Wide eVMT variability across PEV platforms,
design, drivers, charging usage
21
GHG
ZEV
Criteria
Ford Fusion Energi
Ford C-Max Energi
Honda Accord Plug-In
Toyota Prius Plug-In
Ford Focus EV
Nissan Leaf Tesla Model S Honda Fit EV
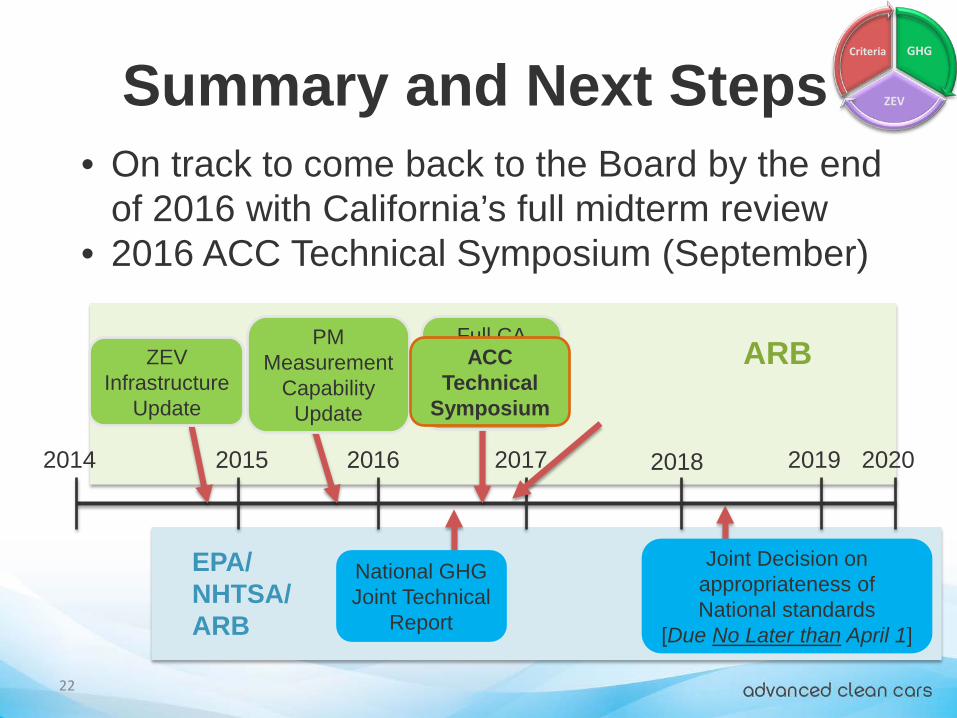
Summary and Next Steps
2014 2015 2016 2020 2018 2019 2017
National GHG Joint Technical
Report
Joint Decision on appropriateness of National standards
[Due No Later than April 1]
PM Measurement
Capability Update
ZEV Infrastructure
Update
22
Full CA Midterm Review
Presented
ACC Technical
Symposium
• On track to come back to the Board by the end of 2016 with California’s full midterm review
• 2016 ACC Technical Symposium (September)
GHG
ZEV
Criteria
ARB
EPA/ NHTSA/ARB