2015 - acdis · to nearly 800 respondents to acdis’ 2015 cdi salary ... tional comments suggest...
TRANSCRIPT

an Association of Clinical Documentation Improvement Specialists publication www.acdis.org
2015CDI SALARY SURVEY
2 Salary Survey | 2015 © 2015 HCPro, a division of BLR.®
Across the board increases seen in 2015 salariesCDI salaries increased dramatically this year, according
to nearly 800 respondents to ACDIS’ 2015 CDI Salary Survey.
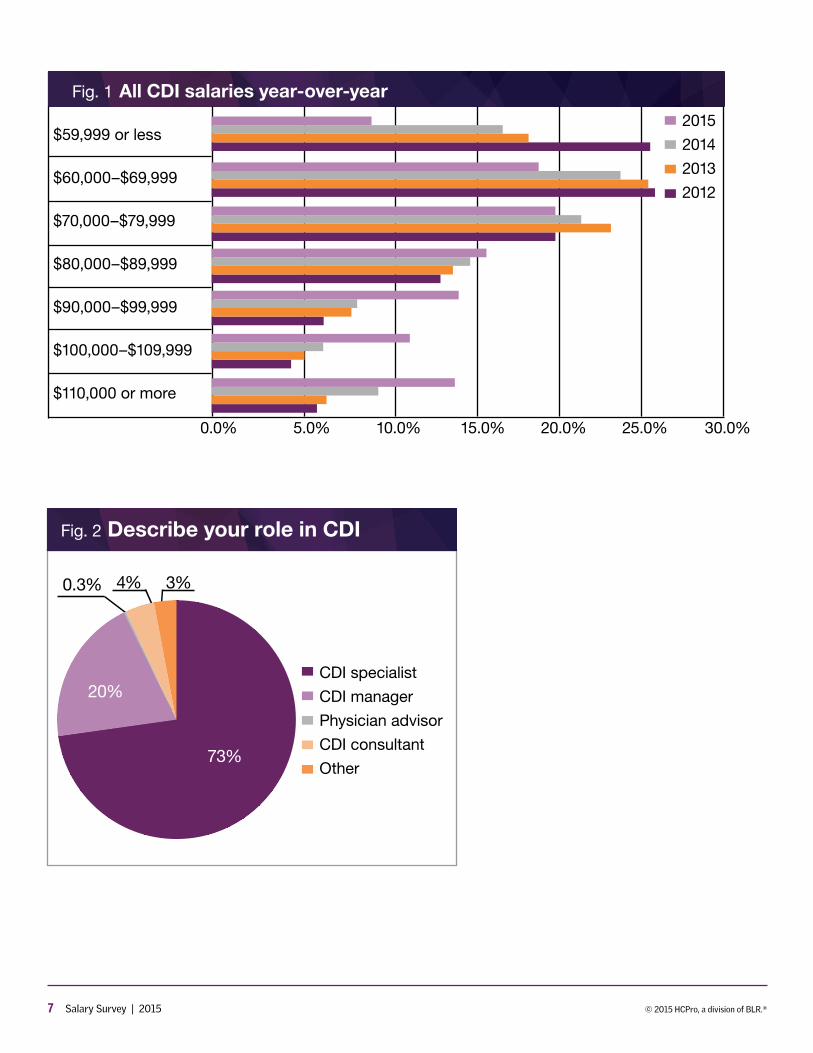
For the past three years, most CDI professionals—about 25% of the total number of respondents—earned $60,000–$69,999 annually, regardless of their role. This year, the most common salary was $70,000–$79,999, but only by 1.5%.
However, those earning $59,999 or less dropped dras-tically—from a high of nearly 26% in 2012 to under 9% this year. Top earners, those making $110,000 or more, doubled from just 6% in 2013 to 13.2% this year. (See Figure 1.)
Take away the lowest and the highest salary ranges, and a narrowing gap in salary ranges becomes evident, says ACDIS Advisory Board member Karen New-houser, RN, CCDS, CDIP, CCS, CCM, director of education for MedPartners in Tampa, Florida. In 2012, the gap between the lowest of the five mid-range sal-aries and the highest was 21.9%. In 2015, the gap was 7%, with a defining shift from the $60,000–69,999 range to the $100,000–$109,999 range.
“This basic salary breakdown is amazing,” says Newhouser.
The overall increase in salaries does not appear to be due to a change in CDI professionals’ role or responsi-bilities, since the majority of respondents (73%) indicate they are CDI specialists whose principal responsibility is the concurrent review of inpatient medical records. Only 20% identify themselves as managers, and only 4% label themselves as consultants. (See Figure 2.)
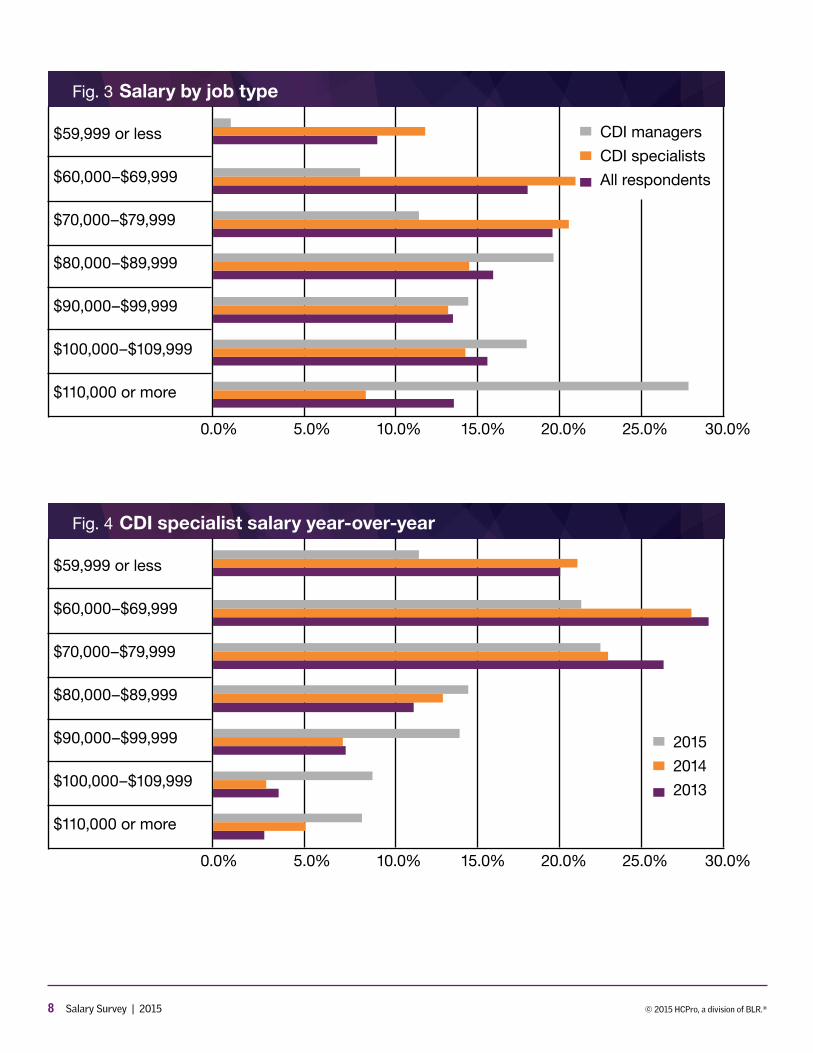
Perhaps not surprisingly, those in management roles make markedly more than CDI staff, with 27.5% earning $110,000 or more. (See Figure 3.)
Nevertheless, the percentage of CDI specialists earning $110,000 or more increased from 2.6% in 2013 to 8.1% this year, while the number of those making $59,999 or less fell from 20% to 11.6%, and those earning $60,000–$69,999 fell, too, from 28.9% to 21.6%. All other salary
ranges grew—with the greatest jump year-over-year at 6.2% for those earning $90,000–$99,999. (See Figure 4.)
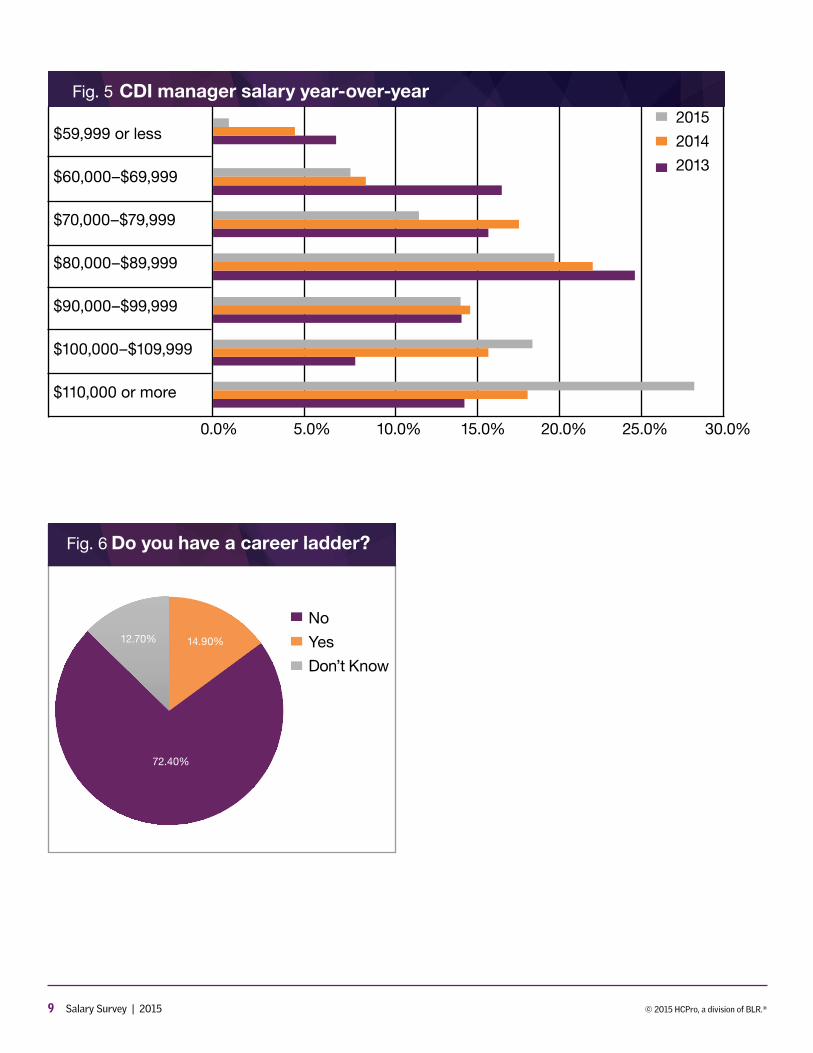
Those working in a management role had their salaries shift upwards significantly, too. In 2014 and in 2013, most managers reportedly earned $80,000–$89,999. This year’s results show a jump of more than 9% from last year for those in the top salary bracket. (See Figure 5.)
The shift for specialists
Stratification of CDI specialists’ roles and responsi-bilities related to new internal career opportunities for CDI staff does not appear to play a factor in this year’s salary jumps.
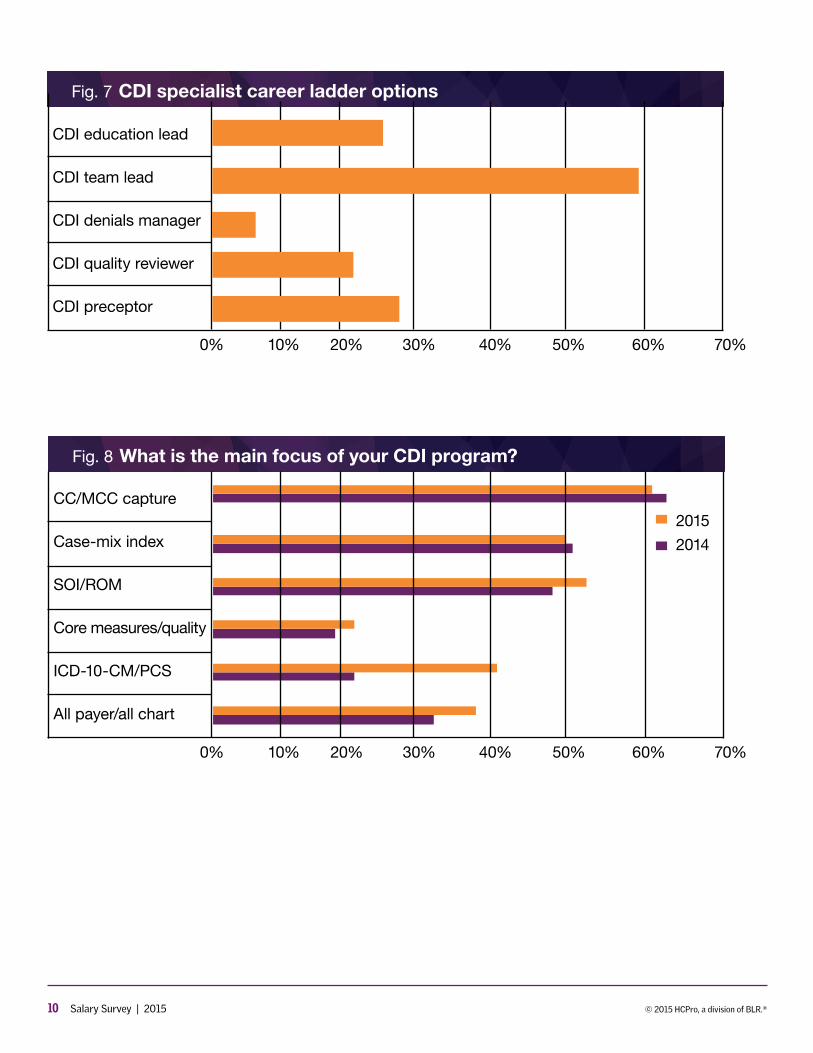
Only 15% of respondents indicate their facility has a career ladder in place. (See Figure 6.) Those with such a ladder indicate they could move into a team lead position (60%), education lead (26%), or preceptor role (27%). Addi-tional comments suggest that roles of CDI auditor and CDI reviewer could be additional growth options. (See Figure 7.)
This year’s salary shift does not seem to be due to diversification of CDI specialists’ responsibilities into qual-ity-related reviews or other expanded clinical documen-tation improvement opportunities either. Most respon-dents indicate their programs’ principal focus remains financial—CC/MCC capture (61%) and case-mix index (CMI) improvement (50%).
“That’s the perfect alignment of priorities,” says Martin Conroy, CDI program director at Temple University Health System in Philadelphia. His team looks to capture MS-DRGs and then focuses on severity of illness (SOI) and risk of mortality (ROM) measures.
Conroy’s crew is in good company—53% of respon-dents indicate they review records for SOI/ROM mea-sures. Only 22% indicate they review records for core measures/quality improvement, however. (See Figure 8.)
And yet, there does seem to be a slight shift in program priorities year over year. The percent of those focused on CC/MCC capture dropped slightly by 2.4%, and those focused on CMI dropped 1.7%.
3 Salary Survey | 2015 © 2015 HCPro, a division of BLR.®
Meanwhile, the percentage of those focused on SOI/ROM increased 4.8%; those focused on core measure/quality reviews increased 2.4%; and those focused on all payer/all chart reviews increased 4.4%. Perhaps not surprisingly, those focused on ICD-10-CM/PCS reviews increased significantly—by 18.7%—likely due to this fall’s implementation date of the new code set.
The impending start date of ICD-10-CM/PCS may have diluted responses to this question, Newhouser says. “Beginning next year, we will begin to see a truer picture of CDI program focus,” she says.
Furthermore, other answer options represent off-shoots of the bigger umbrella of code set accuracy-fo-cused record reviews, Newhouser says. So although respondents answered that they focused on ICD-10, they also still look at CC/MCC capture (for example) since respondents were not limited to a single answer.
Nevertheless, SOI/ROM reviews should start to take over those reviewing simply for the CC/MCC capture rates at this point, says Deanne Wilk, RN, CCDS, CCS, CDI manager at Wellspan Good Samaritan Hospi-tal in Lebanon, Pennsylvania. “That is the direction every-one is pushing toward,” she says.
Most CDI programs start with CC/MCC capture rates, Wilk acknowledges, and many keep that focus as a component of their CDI efforts—a first step, so to speak, of CDI training and a basic programmatic tenet.
Determining a program’s overall focus is a matter of prioritization, says Lori J. Sackela, RN, CCM, CCDS, regional director of CDI at Mount Carmel Health System in Columbus, Ohio.
“Sure, the expectation is to review all payers, and we all want our CDI staff to focus on the complete record,” she says, but all the concerns listed (she adds patient safety indicators, hospital-acquired conditions, condi-tions present on admission, and reduction of hospital readmissions to the list) need to be part of a robust CDI program’s efforts.
These additional areas may well represent opportuni-ties for career growth, Sackela says, “offering new roles by specialty focus area since [it] takes so much more time to review the medical record. [In such situations,]
productivity simply cannot be as high as it is for those CDI specialists who are just reviewing the record for CC/MCC capture. Those more seasoned CDI specialists can capture other focus areas easier.”
Sackela, Wilk, and Martin do not have career ladders at their facilities. Many CDI professionals come to the role from other healthcare avenues, making CDI a career move in itself, they all agree.
“Let’s be honest, who works in a nursing career and doesn’t get beat up? CDI can be a great career path for those who can no longer work at the bedside,” says Martin, who brought a number of workers’ compensa-tion staff into the CDI fold as they sought a job oppor-tunity inside the organization where they’d spent much of their careers.
Those who do make such a move need to be aware of the intellectual rigor of the role, however, Wilk cautions.
“A lot of nurses see CDI as a place to sit down and retire,” says Wilk, “but it’s not just sitting and reviewing charts all day.”
All the nurses on Sackela’s team have a minimum of five years’ experience. “Some nurses might look at the CDI job and think that it’s easy—Monday through Friday, regular hours, all the perks—but a couple of nurses have told me this is the hardest job they’ve ever had. CDI isn’t a place where you can simply coast to the end of your career.”
As the industry grows, those working in facilities with-out ladders in place still have tremendous opportunities to advance professionally, either into other administra-tive roles or outside a given institution into consulting or remote CDI work.
“Even if your facility doesn’t have a career ladder, there is plenty of room within the field to grow,” says Sackela.
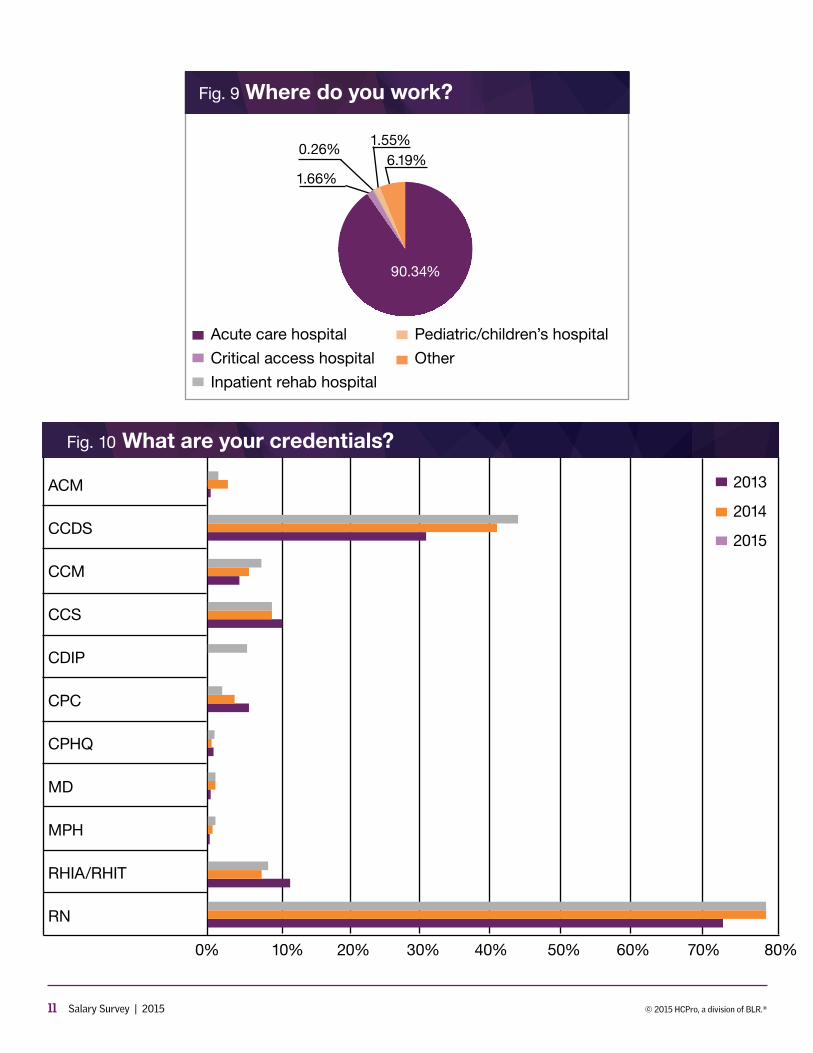
Despite much discussion throughout the industry regarding expansion of CDI efforts beyond the short-term acute care setting, nearly all of the respondents to this year’s survey (90%) work in the traditional hospital setting. Only 2% work in critical access hospitals and only 2% work in pediatric settings. (See Figure 9.) None work in ambulatory.
4 Salary Survey | 2015 © 2015 HCPro, a division of BLR.®
“We know that the most logical place to begin to bring CDI into the outpatient environment is in the acute care hospital in regards to the emergency department, and outpatient intervention areas such as radiology, cardiac catheterization lab, and also the preoperative testing department because they are housed within that building and those patients are occasionally inte-grated into the mainstream inpatient population,” says Newhouser. “It is also logical to draw on existing CDI resources within the acute care hospital from inpatient care and use those resources in the outpatient depart-ments. Therefore, it didn’t surprise me when 90% of the respondents stated they worked in acute care hos-pitals—that is where they work.”
Instead, Newhouser equates the term “outpatient” almost to a service line—where one CDI specialist works in emergency, another in intensive care, and a third in orthopedic, but all work in an acute care hospital.
“I believe that the shift towards outpatient CDI remains very healthy and will continue to spread across the entire patient experience continuum,” she says.
Advancement by education and credentials
Once again this year, most CDI specialists hold the reg-istered nurse credential (76.7%), followed in second place by 44.1% who hold the certified clinical documentation specialist (CCDS) credential. The percentage of those holding coding-related certifications fell slightly, with the certified coding specialist (CCS) falling from 10.3% in 2013 to 9.5%, the certified professional coder (CPC) falling from 5.2% in 2013 to 2.7%, and those holding either the registered health information administrator or registered health information technologist (RHIA/RHIT) falling from 11.4% in 2013 to 7.9%. Only 5.5% hold the certified doc-umentation improvement professional (CDIP) certification. (See Figure 10.)
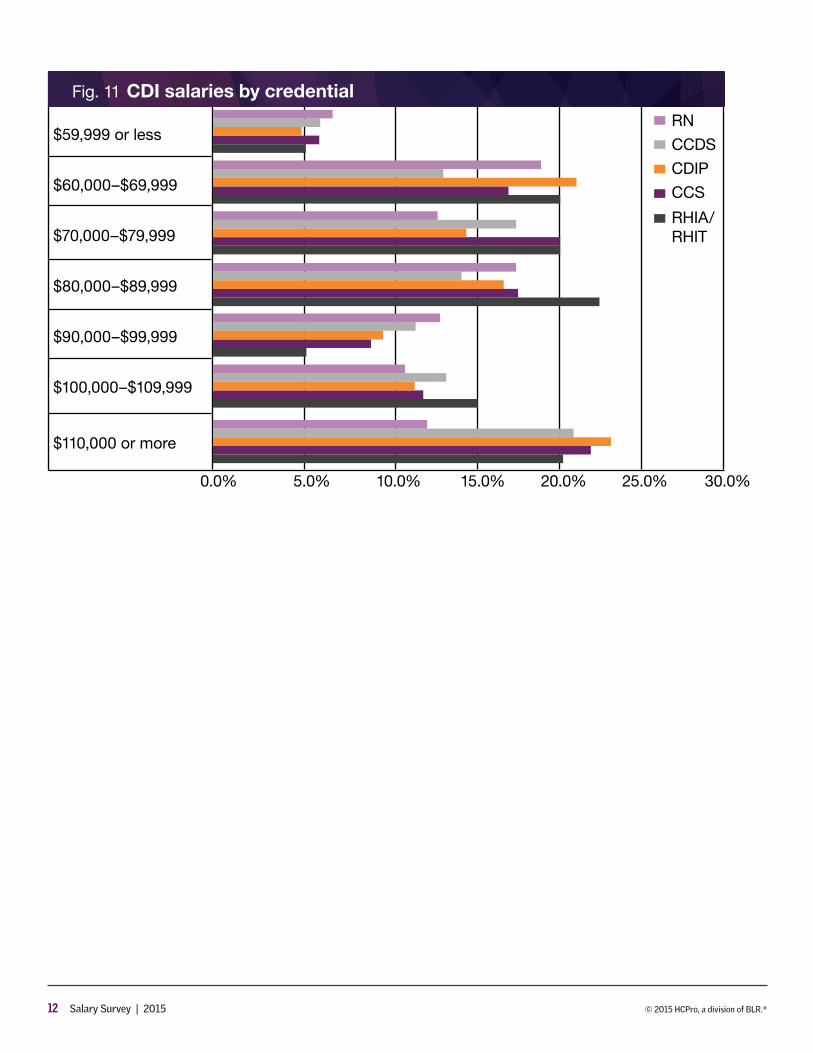
Those who hold additional credentials appear to earn more, with 23.2% of CDIP credential holders earning the top salary range, followed by 22% of those with the CCS and 20.6% of those with the CCDS. (See Figure 11.)
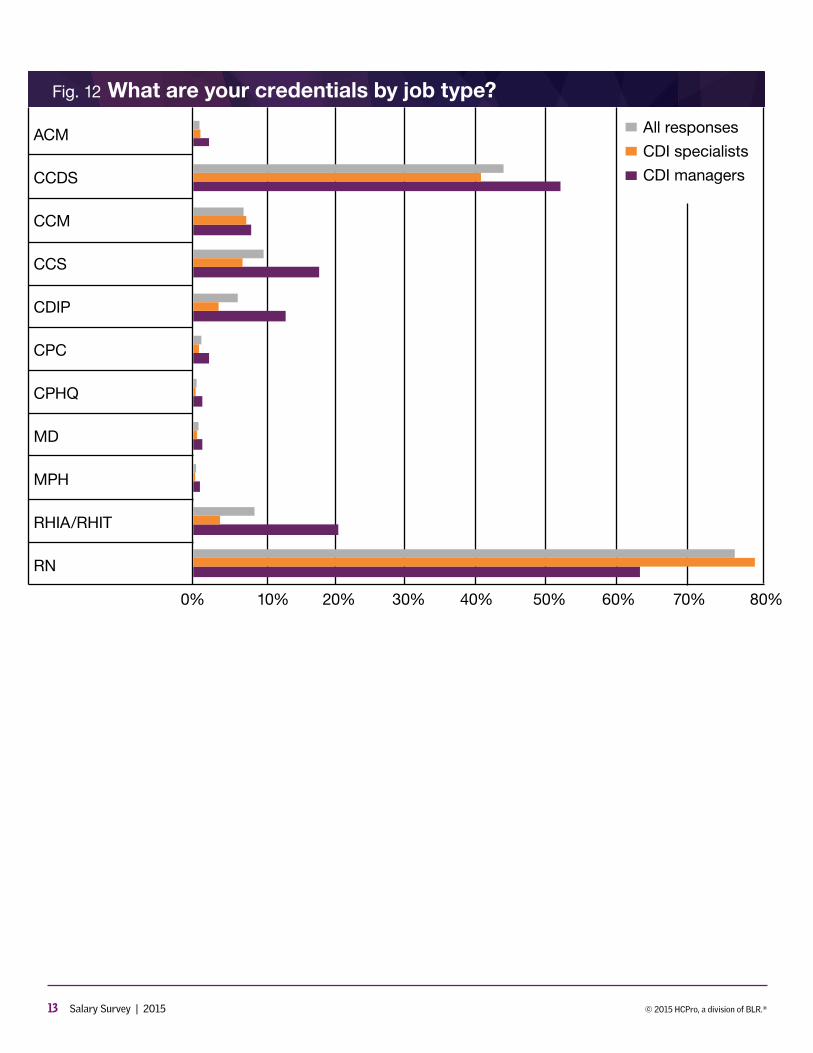
Those in management roles are RNs (63%), CCDS holders (52.9%), and RHIAs/RHITs (20.2%). For CDI spe-cialists, the ranges are similar, although far more (79%)
are RNs, and about 10% less hold the CCDS, while only 3.2% hold the CDIP. (See Figure 12.)
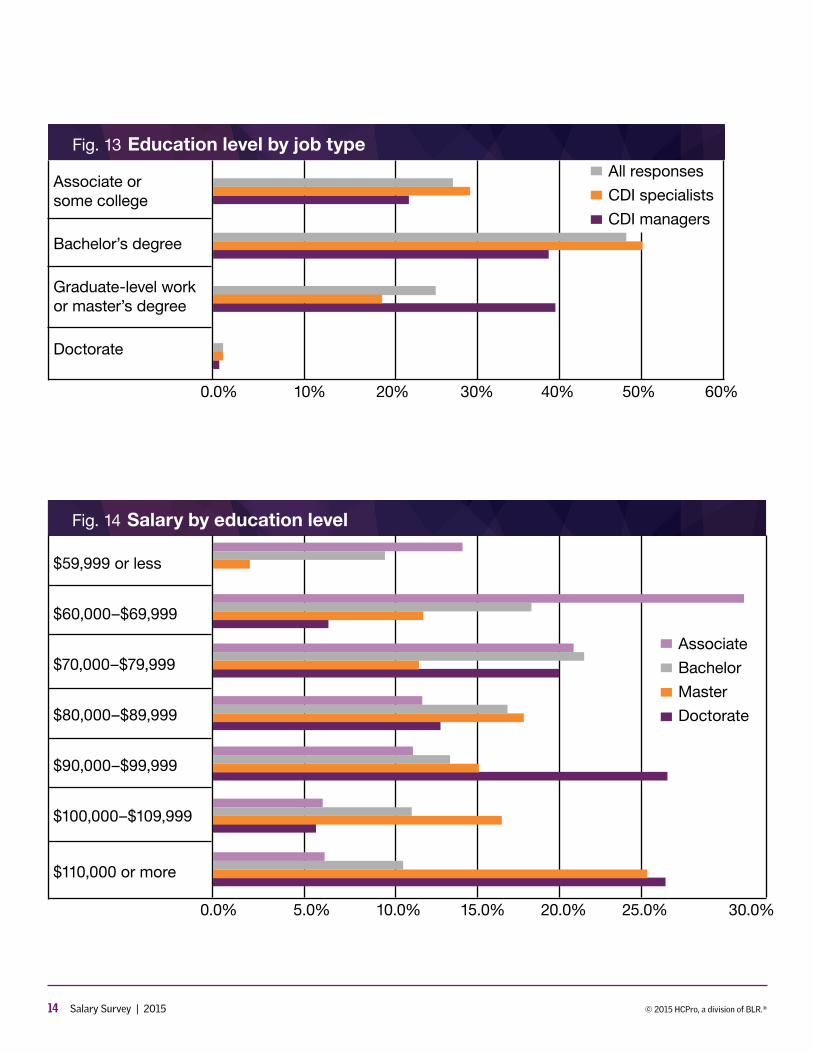
Almost all CDI professionals hold some college experi-ence. Most hold their bachelor’s degree (47%). Most CDI managers (39.2%) hold some level of graduate school experience, but few respondents have achieved doctor-ate-level education. (See Figure 13.)
Those who do have advanced education, though, earn the most, with 25.3% of those with master’s-level educa-tion earning the top salary spot and 26.7% of those with their doctorate earning that amount. (See Figure 14.)
The weight of experience
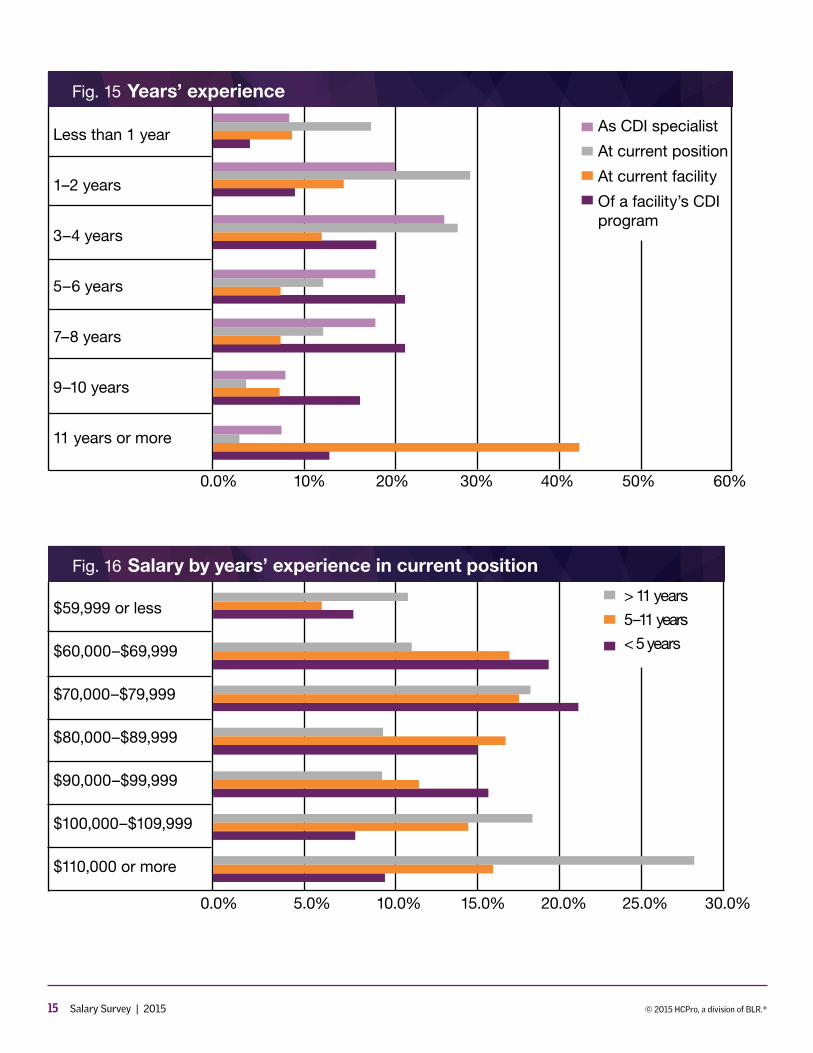
Most CDI programs have been around for seven or eight years, according to 20.7% of survey respondents. Taken cumulatively, however, CDI programs are nearly evenly split, with 49% having seven years of experience or more and 51% having less than seven years. Most CDI profes-sionals have four years or less of experience (53.3%), and 71.4% have four years’ experience or less in their current position. Also, CDI professionals do not seem to move out-side their facility—42.5% of respondents say they’ve been at their current facility for 11 years or longer. (See Figure 15.)
Those with midlevel experience (one to five years) seem to have an opportunity to differentiate themselves by other means, such as certification or education, as the salary level seems evenly split at roughly 17% for each bracket from $60,000 to nearly $90,000. Of course, those with the greatest number of years in their current position earn the top salary spot at 28%, but the responses to this year’s survey seem to show that even those with five years’ experience or less have an opportunity to earn an impressive salary: 16% reportedly earn $90,000–$99,999 as compared to just 11% of those with five to 11 years of experience earning that amount. (See Figure 16.)
Program structure changes
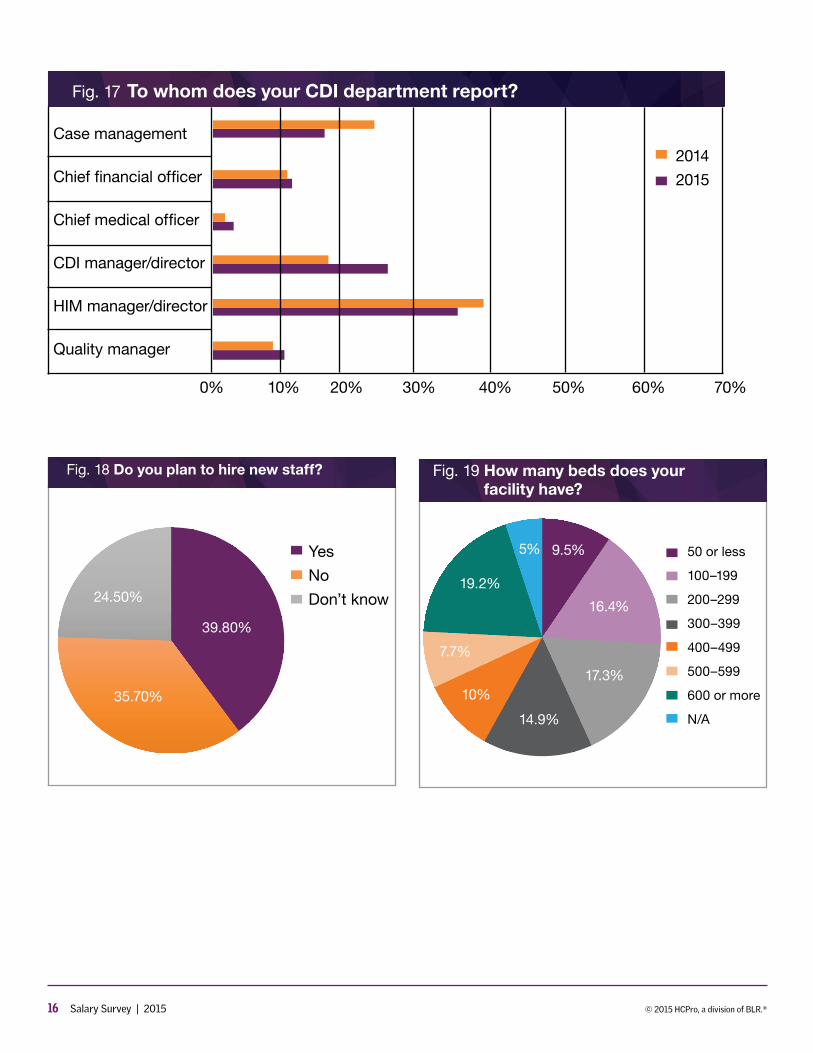
CDI program reporting structure seems to be shift-ing slightly. While most respondents still say they report to HIM (34%), that’s down from last year’s nearly 40%. More respondents (25%) indicated they report to a CDI manager/director than last year, too, up from nearly 18%. (See Figure 17.) Nearly 40% indicate they plan to hire new staff. (See Figure 18.)
5 Salary Survey | 2015 © 2015 HCPro, a division of BLR.®
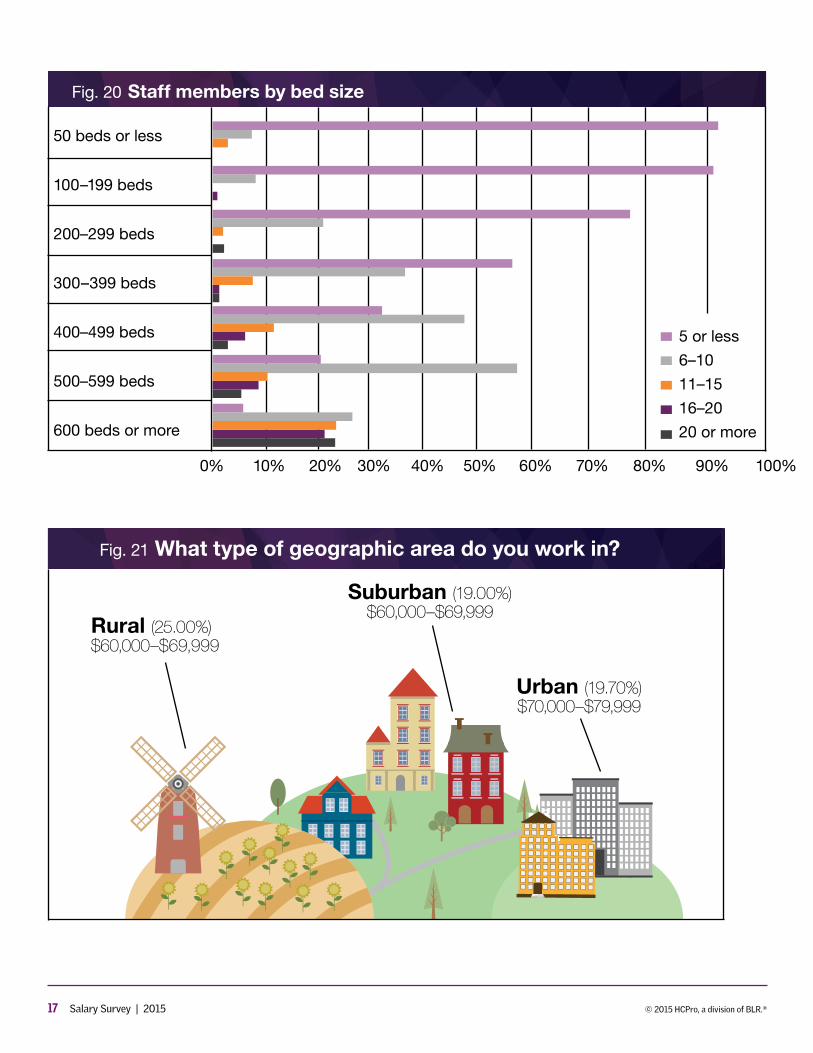
As indicated earlier, most CDI programs are found in short-term acute care hospitals. Bed sizes spanned the spectrum—the plurality of respondents, however, work in large, 600-plus bed facilities. (See Figure 19.) Most facil-ities employ 10 staff members or less, but facilities with more beds seem to have much wider ranges of staffing. (See Figure 20.)
Sackela has 25 staff members across her four-hos-pital system. Each roughly 200-bed facility has six staff members and a team leader. She reports to the finance department and thinks that is a good fit. “They under-stand the implications of the program,” she says.
The increase in respondents reporting to a CDI man-ager/director caught Wilk’s attention. “More and more CDI departments are moving out in their own rights, into their own departments,” she says.
“These results tell me that CDI is increasingly being identified as an independent profession, and equally important to the facility as case management, HIM, and quality, and as such, is deserving of its own department,” agrees Newhouser.
Case management and quality departments reported to other departments once upon a time, Wilk explains, but as staff took on more duties, they branched out. For those programs that haven’t been around long enough to stand on their own, so to speak, “working under HIM is the best way to go.”
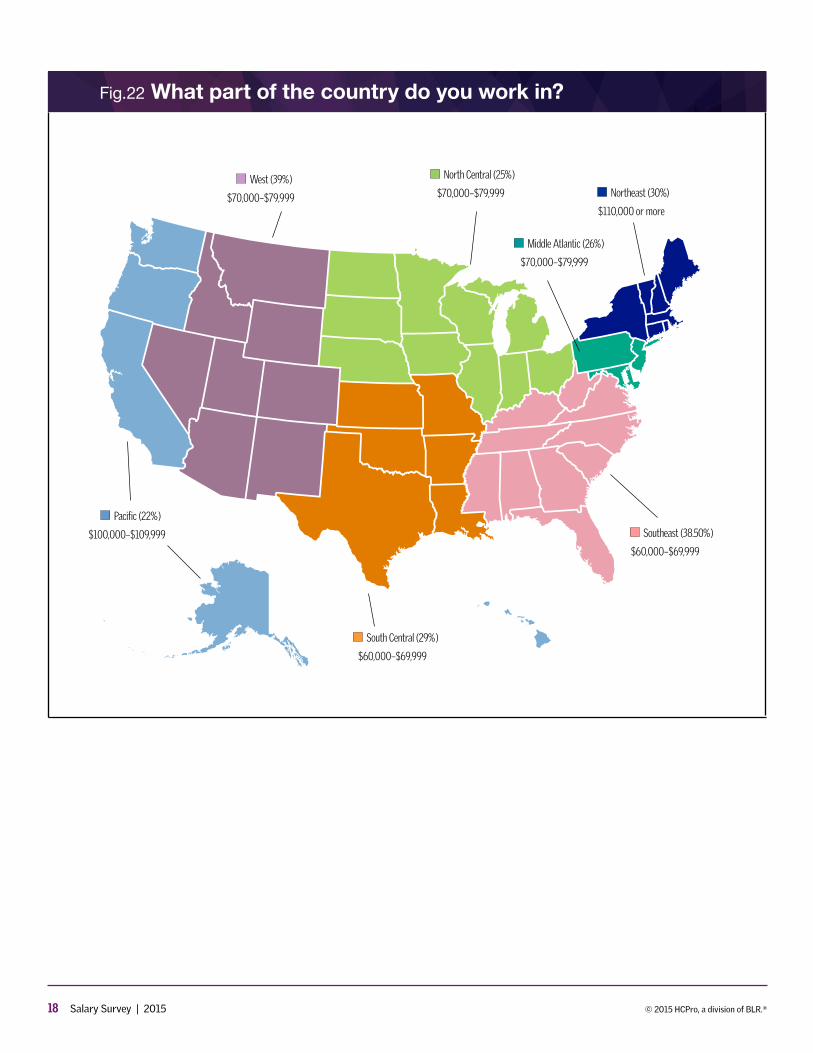
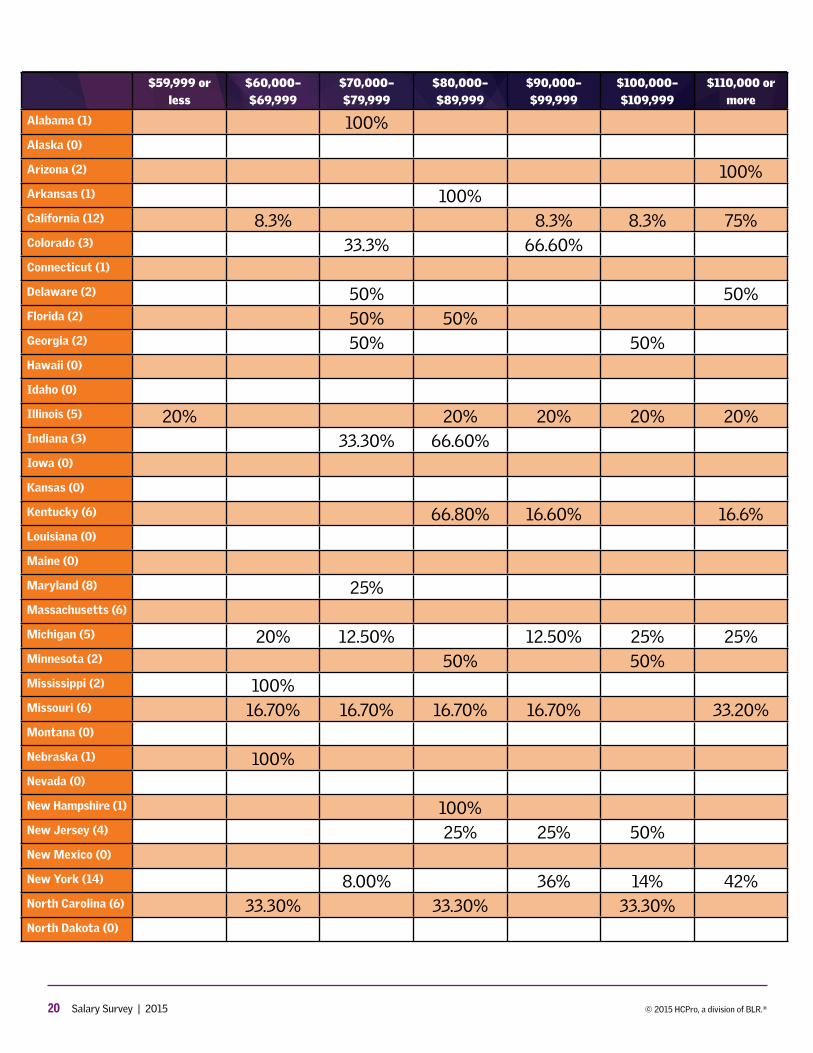
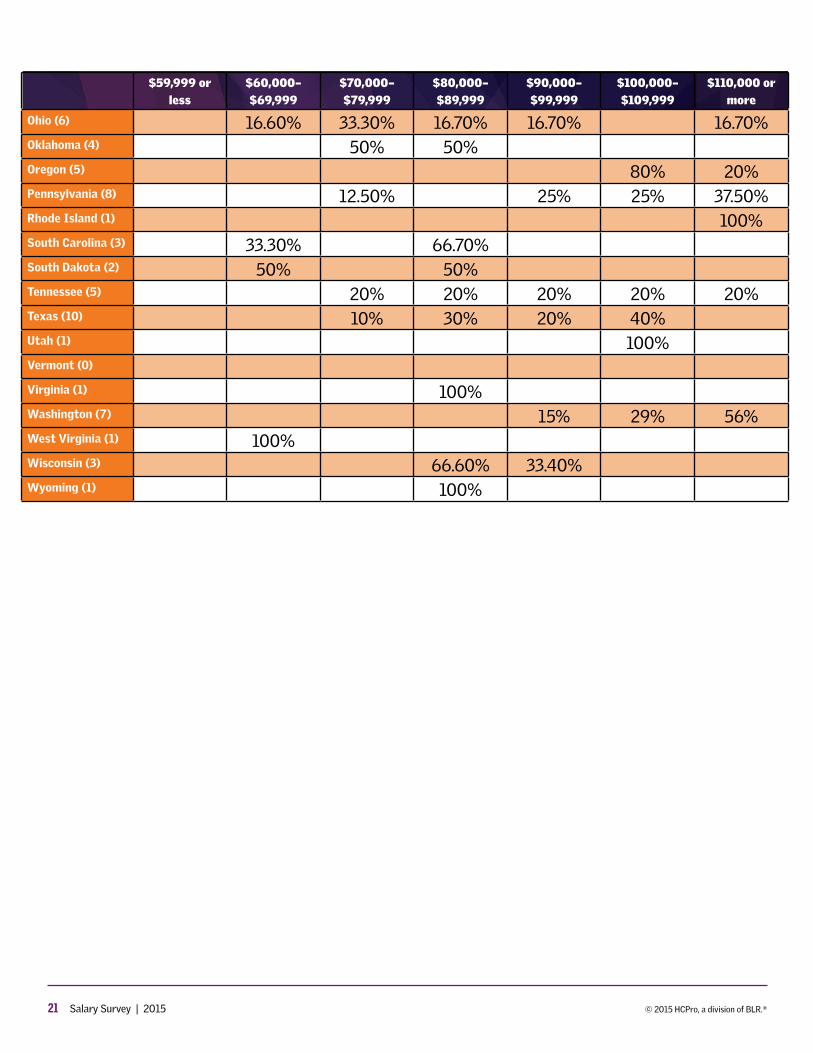
Geographic influence
Compensation by region fell generally within the $60,000–79,999 range. More rural workers earn lower salaries, with 15% earning $59,999 or less and 25% earning $60,000–69,999.
Suburban workers earn slightly more and had more variation within the ranges. Most suburban workers (19%) earned $60,000–$69,999, but 13% reported earning $110,000 or more, compared to just 3% of rural workers who earned that amount.
Those in urban areas earn the most, with the greatest percentage (18.5%) earning $110,000. More than 60% of urban respondents earned $80,000 or more, compared with 56% of those from suburban areas earning that
amount and just 36% of respondents from rural areas. (See Figure 21.)
Those living in the Northeast earned the largest sala-ries with 30% in the top salary bracket—78% of respon-dents from the region earn $80,000 or more. Only those in the Pacific region earn arguably more, with 21% in the top salary bracket and 86% earning $80,000 or more.
The lowest salaries seem to fall to the Southeast and South Central part of the United States, with 38.5% and 29% respectively falling into the $60,000–$69,999 pay scale. The Southeast earns the least, with 76% earn-ing less than $80,000 against South Central’s 58% and North Central’s 65%.
Expectations for staff salary increasesDespite increased financial compensation, CDI profes-
sionals saw other reductions across the board, with the largest number of responses (39%) having seen cuts to their health coverage in the last year. Cuts to continuing education (37%), meals and entertainment (30%), and travel compensation (29%) also topped this year’s list of compensation reductions.
Nearly all respondents (93%) work 32–50 hours per week, and most (60%) don’t get paid for overtime. Oth-ers (17%) indicated they don’t work overtime or that they receive time off or pay incentives for overtime efforts.
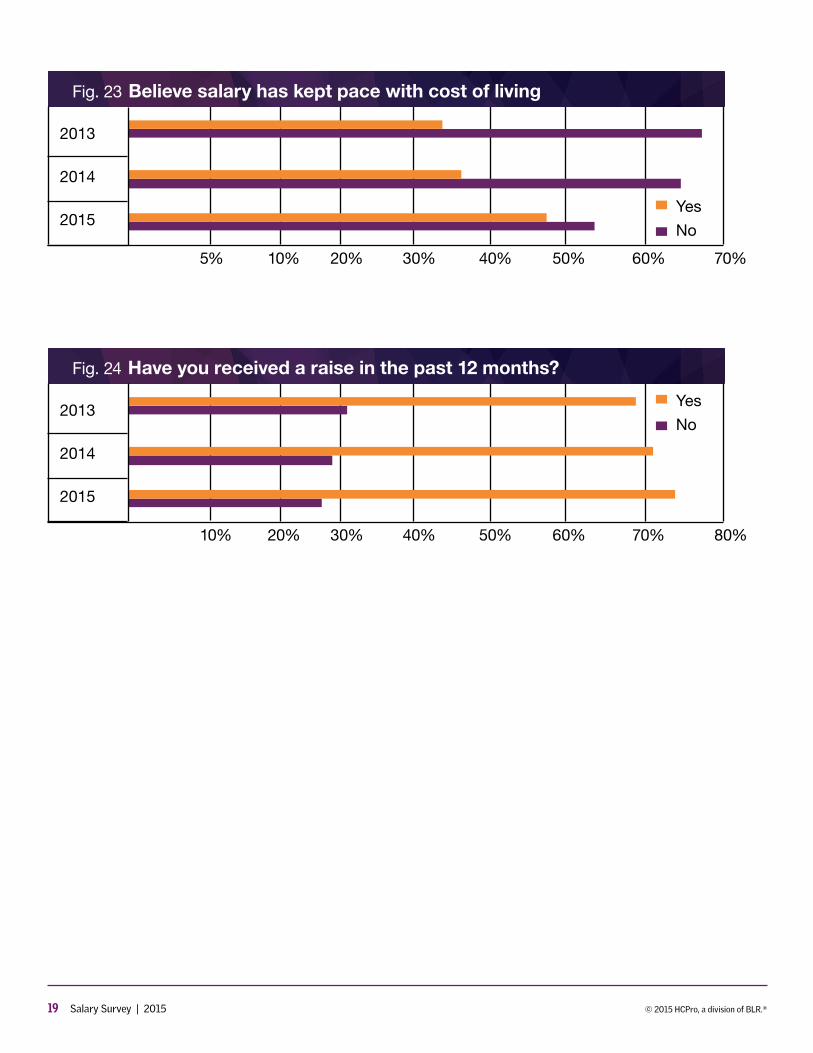
Although the responses for how CDI professionals feel about their current pay scale still seem fairly grim—more than 50% indicate that their compensation hasn’t kept pace with the cost of living—it’s an improvement over the past two years. In 2013, nearly 70% of respondents felt their salary didn’t keep up with expenses, and in 2014, nearly 65% felt that way. (See Figure 23.) Also on the positive side, 73% of respondents reportedly received a raise (typically between 1%–3%) in the past 12 months, which is up from 69% who received one in 2013. (See Figure 24.)
Respondents’ feelings about their compensation remain less than positive, however. (See additional com-ments on p. 6.)
Those struggling with cost-of-living increases or reduc-tions in other compensation may take heart in a close examination of this year’s benchmarking results—overall salaries are indeed on the rise.
6 Salary Survey | 2015 © 2015 HCPro, a division of BLR.®
COMMENTS FROM THE FIELD
CDI professionals seek more equitable compensationThose completing the 2015 CDI Salary Survey were
asked to provide additional feedback regarding their compensation. As in previous years, respondents sought additional bonus incentives based on their productivity or return on investment and wished for better balance in pay across career disciplines—from nursing to CDI and from coding to CDI. The following examples are from these open-ended responses.
Compensation by career experience
■■ CDI nurses should be paid at level of clinical nurse educators (CNEs) in hospitals, as they are charged with educating physicians, which is a more difficult job. Therefore, besides being on same step with CNEs, they should be paid at 75% level, for additional difficulty of work, additional ongoing education required, and high skill level needed.
■■ CDI is not receiving the market demand based raises that other nursing departments receive. This makes me concerned that we are being left behind.
■■ Unfortunately CDI nurses who are not in direct patient care roles seem to be less important in contract negotiations.
■■ My grade/position on the ladder scale was not included in the contract to get any more raises. Staff nurses will get a 2% raise every 6 months for the next year and a half. My group of CDI nurses will not.
■■ Given that I have 20 plus years’ experience as an RN I would like to see CDI wages higher than reg-ular RNs.
■■ I would like to see less disparity in the wages between CDI staff with RN and those with RHIT/RHIA. Doing the same job should mean getting the same pay.
■■ If RNs get paid for years of experience, so should HIM professionals. That wasn’t the case in my
current company and I have both credentials. I actually ended up getting paid much less than the other CDI nurses.
Bonus based on return on investment
■■ I feel that we ought to have incentives given the amount of money we generate as CDIs.
■■ I would like to see bonuses for productivity and the high dollars captured by CDI specialists.
■■ I would love a bonus to be tied to my productivity. About 10 years ago we got raises based on our performance but that is no longer available. Peo-ple who don’t go “the extra mile” get rewarded the same as those who do go above and beyond.
■■ CDI salary is still not where it needs to be consid-ering how we impact financial aspects of the hos-pital. CDI helps improve doctors’ profiles through concise documentation. CDI helps prevent hos-pitals from paying fines for possible preventable complications.
On the positive side
■■ As a CDI specialist, I get to pick my hours and have a very flexible schedule. When the census is down I can take off and run my errands.
■■ For my CCDS I received a one-time bonus of 2% of my base salary.
■■ We received an ICD-10 retention bonus of 10% of our annual salary paid in increments over the last year.
■■ CDI staff at my facility earn 5% over the base RN salary relative to length of service.
■■ We have a two-year retention bonus of $5,000 for each year beginning January 2016. And com-pensation for certification/dues related to CDI and time off to attend our local ACDIS chapter meet-ings as education.
7 Salary Survey | 2015 © 2015 HCPro, a division of BLR.®
Fig. 1 All CDI salaries year-over-year
$59,999 or less
$60,000–$69,999
$70,000–$79,999
$80,000–$89,999
$90,000–$99,999
$100,000–$109,999
$110,000 or more
0.0% 5.0% 10.0% 15.0% 20.0% 25.0% 30.0%
2015
2014
2013
2012
Fig. 2 Describe your role in CDI
CDI specialist
CDI manager
Physician advisor
CDI consultant
Other73%
20%
0.3% 4% 3%
8 Salary Survey | 2015 © 2015 HCPro, a division of BLR.®
Fig. 3 Salary by job type
Fig. 4 CDI specialist salary year-over-year
$59,999 or less
$60,000–$69,999
$70,000–$79,999
$80,000–$89,999
$90,000–$99,999
$100,000–$109,999
$110,000 or more
$59,999 or less
$60,000–$69,999
$70,000–$79,999
$80,000–$89,999
$90,000–$99,999
$100,000–$109,999
$110,000 or more
0.0%
0.0%
5.0%
5.0%
10.0%
10.0%
15.0%
15.0%
20.0%
20.0%
25.0%
25.0%
30.0%
30.0%
CDI managers
CDI specialists
All respondents
2015
2014
2013
9 Salary Survey | 2015 © 2015 HCPro, a division of BLR.®
Fig. 5 CDI manager salary year-over-year
$59,999 or less
$60,000–$69,999
$70,000–$79,999
$80,000–$89,999
$90,000–$99,999
$100,000–$109,999
$110,000 or more
0.0% 5.0% 10.0% 15.0% 20.0% 25.0% 30.0%
2015
2014
2013
Fig. 6 Do you have a career ladder?
No
Yes
Don’t Know
72.40%
14.90%12.70%
10 Salary Survey | 2015 © 2015 HCPro, a division of BLR.®
Fig. 7 CDI specialist career ladder options
CDI education lead
CDI team lead
CDI denials manager
CDI quality reviewer
CDI preceptor
0% 10% 20% 30% 40% 50% 60% 70%
Fig. 8 What is the main focus of your CDI program?
CC/MCC capture
Case-mix index
SOI/ROM
Core measures/quality
ICD-10-CM/PCS
All payer/all chart
2015
2014
0% 10% 20% 30% 40% 50% 60% 70%
11 Salary Survey | 2015 © 2015 HCPro, a division of BLR.®
Fig. 10 What are your credentials?
ACM
CCDS
CCM
CCS
CDIP
CPC
CPHQ
MD
MPH
RHIA/RHIT
RN
0% 10% 20% 30% 40% 50% 60% 70% 80%
2013
2014
2015
Fig. 9 Where do you work?
Acute care hospital
Critical access hospital
Inpatient rehab hospital
90.34%
1.66%
0.26%1.55%
6.19%
Pediatric/children’s hospital
Other
12 Salary Survey | 2015 © 2015 HCPro, a division of BLR.®
Fig. 11 CDI salaries by credential
$59,999 or less
$60,000–$69,999
$70,000–$79,999
$80,000–$89,999
$90,000–$99,999
$100,000–$109,999
$110,000 or more
0.0% 5.0% 10.0% 15.0% 20.0% 25.0% 30.0%
RN
CCDS
CDIP
CCS
RHIA/ RHIT
13 Salary Survey | 2015 © 2015 HCPro, a division of BLR.®
All responses
CDI specialists
CDI managers
Fig. 12 What are your credentials by job type?
ACM
CCDS
CCM
CCS
CDIP
CPC
CPHQ
MD
MPH
RHIA/RHIT
RN
0% 10% 20% 30% 40% 50% 60% 70% 80%
14 Salary Survey | 2015 © 2015 HCPro, a division of BLR.®
Fig. 13 Education level by job type
Associate or some college
Bachelor’s degree
Graduate-level work or master’s degree
Doctorate
0.0% 10% 20% 30% 40% 50% 60%
All responses
CDI specialists
CDI managers
Fig. 14 Salary by education level
$59,999 or less
$60,000–$69,999
$70,000–$79,999
$80,000–$89,999
$90,000–$99,999
$100,000–$109,999
$110,000 or more
0.0% 5.0% 10.0% 15.0% 20.0% 25.0% 30.0%
Associate
Bachelor
Master
Doctorate
15 Salary Survey | 2015 © 2015 HCPro, a division of BLR.®
As CDI specialist
At current position
At current facility
Of a facility’s CDI program
Fig. 15 Years’ experience
Less than 1 year
1–2 years
3–4 years
5–6 years
7–8 years
9–10 years
11 years or more
0.0% 10% 20% 30% 40% 50% 60%
Fig. 16 Salary by years’ experience in current position
$59,999 or less
$60,000–$69,999
$70,000–$79,999
$80,000–$89,999
$90,000–$99,999
$100,000–$109,999
$110,000 or more
0.0% 5.0% 10.0% 15.0% 20.0% 25.0% 30.0%
> 11 years
5–11 years
< 5 years
16 Salary Survey | 2015 © 2015 HCPro, a division of BLR.®
Fig. 17 To whom does your CDI department report?
Case management
Chief financial officer
Chief medical officer
CDI manager/director
HIM manager/director
Quality manager
2014
2015
0% 10% 20% 30% 40% 50% 60% 70%
Fig. 18 Do you plan to hire new staff?
Yes
No
Don’t know
39.80%
35.70%
24.50%
Fig. 19 How many beds does your facility have?
50 or less
100–199
200–299
300–399
400–499
500–599
600 or more
N/A
9.5%
16.4%
17.3%
14.9%
10%
7.7%
19.2%
5%
17 Salary Survey | 2015 © 2015 HCPro, a division of BLR.®
Fig. 20 Staff members by bed size
50 beds or less
100–199 beds
200–299 beds
300–399 beds
400–499 beds
500–599 beds
600 beds or more
5 or less
6–10
11–15
16–20
20 or more
0% 10% 20% 30% 40% 50% 60% 70% 80% 90% 100%
Fig. 21 What type of geographic area do you work in?
Rural (25.00%) $60,000–$69,999
Suburban (19.00%) $60,000–$69,999
Urban (19.70%) $70,000–$79,999
18 Salary Survey | 2015 © 2015 HCPro, a division of BLR.®
Fig.22 What part of the country do you work in?
Northeast (30%)
$110,000 or more
Middle Atlantic (26%)
$70,000–$79,999
Southeast (38.50%)
$60,000–$69,999
South Central (29%)
$60,000–$69,999
Pacific (22%)
$100,000–$109,999
North Central (25%)
$70,000–$79,999 West (39% )
$70,000–$79,999
19 Salary Survey | 2015 © 2015 HCPro, a division of BLR.®
Fig. 23 Believe salary has kept pace with cost of living
Fig. 24 Have you received a raise in the past 12 months?
2013
2014
2015
2013
2014
2015
Yes
No
Yes
No
5%
10%
10%
20%
20%
30%
30%
40%
40%
50%
50%
60%
60%
70%
70%
80%
20 Salary Survey | 2015 © 2015 HCPro, a division of BLR.®
$59,999 or less
$60,000– $69,999
$70,000– $79,999
$80,000– $89,999
$90,000– $99,999
$100,000– $109,999
$110,000 or more
Alabama (1) 100%Alaska (0)
Arizona (2) 100%Arkansas (1) 100%California (12) 8.3% 8.3% 8.3% 75%Colorado (3) 33.3% 66.60%Connecticut (1)
Delaware (2) 50% 50%Florida (2) 50% 50%Georgia (2) 50% 50%Hawaii (0)
Idaho (0)
Illinois (5) 20% 20% 20% 20% 20%Indiana (3) 33.30% 66.60%Iowa (0)
Kansas (0)
Kentucky (6) 66.80% 16.60% 16.6%Louisiana (0)
Maine (0)
Maryland (8) 25%Massachusetts (6)
Michigan (5) 20% 12.50% 12.50% 25% 25%Minnesota (2) 50% 50%Mississippi (2) 100%Missouri (6) 16.70% 16.70% 16.70% 16.70% 33.20%Montana (0)
Nebraska (1) 100%Nevada (0)
New Hampshire (1) 100%New Jersey (4) 25% 25% 50%New Mexico (0)
New York (14) 8.00% 36% 14% 42%North Carolina (6) 33.30% 33.30% 33.30%North Dakota (0)
21 Salary Survey | 2015 © 2015 HCPro, a division of BLR.®
$59,999 or less
$60,000– $69,999
$70,000– $79,999
$80,000– $89,999
$90,000– $99,999
$100,000– $109,999
$110,000 or more
Ohio (6) 16.60% 33.30% 16.70% 16.70% 16.70%Oklahoma (4) 50% 50%Oregon (5) 80% 20%Pennsylvania (8) 12.50% 25% 25% 37.50%Rhode Island (1) 100%South Carolina (3) 33.30% 66.70%South Dakota (2) 50% 50%Tennessee (5) 20% 20% 20% 20% 20%Texas (10) 10% 30% 20% 40%Utah (1) 100%Vermont (0)
Virginia (1) 100%Washington (7) 15% 29% 56%West Virginia (1) 100%Wisconsin (3) 66.60% 33.40%Wyoming (1) 100%