2014 jrc ocean energy status report jrc ocean energy...2014 jrc ocean energy status report...
TRANSCRIPT

2014 JRC Ocean Energy Status Report
Technology, market and economic aspects of ocean energy in Europe
Davide Magagna
Andreas Uihlein
2015
Report EUR 26983 EN

EUROpEaN COmmiSSiONJoint Research Centre
Institute for Energy and Transport
Contact informationAndreas Uihlein
Address: Joint Research Centre, P.O. Box 2, 1755 ZG Petten, The Netherlands
E-mail: [email protected]
Tel.: +31 224 56 5123
https://ec.europa.eu/jrc
LEgaL NOtiCEThis publication is a Science and Policy Report by the Joint Research Centre, the European Commission’s in-house
science service. It aims to provide evidence-based scientific support to the European policy-making process. The
scientific output expressed does not imply a policy position of the European Commission. Neither the European
Commission nor any person acting on behalf of the Commission is responsible for the use which might be made of
this publication.
All images © European Union 2015, except cover picture: Fotolia
JRC93521
EUR 26983 EN
ISBN 978-92-79-44611-5
ISSN 1831-9424
doi:10.2790/866387
Luxembourg: Publications Office of the European Union, 2015
© European Union, 2015
Reproduction is authorised provided the source is acknowledged.
abstract
Oceans and seas have the potential to play a significant role in providing clean energy. Different technologies
are currently being developed to ensure a long-term contribution of ocean energy to the future energy system.
Among the different ocean energy technologies, tidal and wave conversion systems are expected to contribute the
most to the European energy system in the short to medium term, due to both local availability of the resources
and advanced technological status. Current projections foresee about 40 MW of tidal and 26 MW of wave energy
capacity being installed by 2018.
The sector has witnessed encouraging signals both on the policy side and on projected markets; however, the
commercialisation of key technologies and their technical maturity have not progressed as expected. In 2014,
the European Commission reinforced its support and commitment to the development of ocean energy through a
dedicated policy framework, and its inclusion in both the blue growth agenda and the 2050 energy agenda.
This report stems from the need to monitor the evolution of ocean energy technology, industry and market in Europe,
with an eye on their global development. It aims to portray the state of play of the sector, key achievements and
mechanisms in place to overcome documented gaps and barriers in the sector towards commercialisation.

2014 JRC Ocean Energy Status Report
Joint Research Centre institute for Energy and transport
Davide Magagna and Andreas Uihlein
2015

3
tabLE Of CONtENtS
ACkNOWLEDGEMENTS 11
ExECUTIvE SUMMARy 12
1 INTRODUCTION 14
2 TIDAL ENERGy 152.1 Technology Status 152.2 Technology Developments 17
2.2.1 Floating TECs and multi-turbine platforms 172.2.2 Small-scale technology 182.2.3 Radical designs 182.2.4 Components and subcomponents 18
2.3 Market and European Leadership 232.3.1 Global developments 232.3.2 Aiding development and deployment 262.3.3 Future developments 27
2.4 Economic Aspects and Cost Components 282.4.1 CAPEx and cost components 292.4.2 Future power ratings 292.4.3 LCOE predictions 29
3 WAvE ENERGy 313.1 Technology Status 313.2 Technology Developments 33
3.2.1 Small-scale devices 333.2.2 Increased collaboration 333.2.3 Components and subcomponents 33
3.3 Market and European Leadership 363.3.1 Global development 363.3.2 Aiding development and deployment 383.3.3 Future development 41
3.4 Economic Aspects and Cost Components 423.4.1 CAPEx and cost components 423.4.2 Future power ratings 433.4.3 LCOE predictions 43
4 OvERvIEW OF EMERGING TEChNOLOGIES 444.1 Ocean Thermal Energy Conversion 44
4.1.1 Technology development and status 454.1.2 Technical challenges and current research 454.1.3 Economic and market aspects 47
4.2 Salinity Gradient 484.2.1 Technology development and status 494.2.2 Technical challenges and current research 504.2.3 Economic and market aspects 50

4
5 ACTIONS AND ChALLENGES 535.1 Identifying Priorities and Actions 535.2 Technology and Resources 545.3 Finance 575.4 Environmental and Administrative Issues 605.5 Grid Availability and Integration: A Joint Approach 61
6 kEy FINDINGS AND CONCLUSIONS 63
7 REFERENCES 64

5
LiSt Of figURES
Fig. 1 Distribution of R&D efforts in tidal technology types 16
Fig. 2 Structural layout of a typical section of a composite laminate tidal blade 19
Fig. 3 Drivetrain options for tidal energy converters 20
Fig. 4 Control systems currently employed in TEC 21
Fig. 5 Ocean energy supply chain breakdown in France 23
Fig. 6 Distribution of tidal companies in the world 23
Fig. 7 Tidal energy network 25
Fig. 8 Electricity generation from tidal energy converters in the Uk 25
Fig. 9 European tidal deployment 2012–2014 26
Fig. 10 Expected tidal developments until 2018 27
Fig. 11 CAPEx breakdown for tidal power 29
Fig. 12 LCOE predictions for tidal arrays 30
Fig. 13 Distribution of R&D efforts according to wave energy technology type 32
Fig. 14 Main material employed for WEC prime mover 34
Fig. 15 Wave energy applications 34
Fig. 16 Installation of WECs 34
Fig. 17 Wave energy conversion methods in electricity 35
Fig. 18 PTO employed in wave energy conversion 35
Fig. 19 Distribution of wave companies in the world 36
Fig. 20 Wave energy network 38
Fig. 21 Wave infrastructure in Europe 39
Fig. 22 Expected wave developments until 2018 41
Fig. 23 CAPEx breakdown for wave power 42
Fig. 24 LCOE predictions for wave arrays 43
Fig. 25 OTEC resources: Temperature difference between 30 m and 1000 m depth 44
Fig. 26 Simplified open-cycle OTEC process flow diagram 44
Fig. 27 Simplified closed-cycle OTEC process flow diagram 45
Fig. 28 heat exchanger test facility at NELhA 45
Fig. 29 Disaggregated CAPEx for a 10 MW OTEC plant 47
Fig. 30 Salinity gradient resources: Salinity at surface level 49
Fig. 31 Simplified RED process flow diagram 49
Fig. 32 Simplified PRO process flow diagram 49
Fig. 33 Statkraft’s PRO pilot plant in Tofte, Norway 50
Fig. 34 RED pilot plant at Afsluitdijk, Netherlands 50
Fig. 35 TRL of ocean energy technologies 54
Fig. 36 key recommendations from the SI Ocean Wave and Tidal Strategic Technology Agenda 55

6
Fig. 37 LCOE for alternative and conventional energy technologies 57
Fig. 38 Total RD&D investment in wave and tidal energy projects in 2011 in m EUR 57
Fig. 39 Support mechanisms according to market maturity and deployment level 59
Fig. 40 Synergies between wave and tidal and offshore wind cost components 62

7
LiSt Of tabLES
Table 1 Tidal energy device classification 16
Table 2 Examples of upscaling of hATs by leading tidal energy developers 17
Table 3 Overview of developer–manufacturer collaboration for composite tidal blade design 20
Table 4 Descriptions of most common generators for tidal energy applications 21
Table 5 Components comparison for the MeyGen project 22
Table 6 Identified suppliers for TECs 22
Table 7 Shortlist of tidal developers identified by JRC 24
Table 8 EU and national schemes to facilitate deployment of tidal energy arrays 27
Table 9 Leased tidal energy projects in Europe 28
Table 10 Techno-economic data for tidal energy 29
Table 11 Wave energy converters classification 32
Table 12 Wave energy systems and related PTO 35
Table 13 Identified suppliers for WECs according to component and service 36
Table 14 Shortlist of wave developers identified by JRC 37
Table 15 Wave energy development and deployment projects receiving EU or national support. Australian and US flagship projects are also included
40
Table 16 Upcoming wave energy demonstration projects 41
Table 17 Techno-economic data for wave energy 43
Table 18 Planned and proposed OTEC projects worldwide 46
Table 19 Cost estimates for OTEC plants: CAPEx and LCOE 47
Table 20 Overview of main players in the OTEC sector 48
Table 21 Cost estimates for salinity gradient plants: CAPEx and LCOE 51
Table 22 Overview of some players in the salinity gradient sector 52
Table 23 Concerted activities and actions to overcome ocean energy technical challenges 56
Table 24 Ocean energy technology challenges and research focus areas 56
Table 25 Current market push and pull mechanisms for ocean energy from EU Member States 58
Table 26 Current market push and pull mechanisms for ocean energy from the EU 58
Table 27 Current market push and pull mechanisms for ocean energy from non-EU countries 59
Table 28 Review of consenting processes across EU Member States located in the Atlantic Arc 60

8
aCRONymS aNd abbREviatiONS
aEL Aviation Enterprise Limited
aEp Annual Energy Production
amEtS Atlantic Marine Energy Test Site
aRENa Australian Renewable Energy Agency
bimEp Biscay Marine Energy Platform
bNEf Bloomberg New Energy Finance
CapEX Capital Expenditure
Cf Capacity Factor
CRi Commercial Readiness Index
ddg Direct-Drive Generator
dECC Department of Energy and Climate Change (Uk)
dfig Double-Fed Induction Generator
EC European Commission
Eii European Industrial Initiative
EmEC European Marine Energy Centre
ENR Syndicat des Énergies Renouvelables
ENtSO-E European Network of Transmission System Operators for Electricity
EtRi Energy Technology Reference Indicator
EvE Ente vasco de la Energía
EWEa European Wind Energy Association
fRp Fibre-Reinforced Plastic
Hat horizontal-Axis Turbine
iEC International Electrotechnical Commission
iEE Intelligent Energy Europe
ip Intellectual Property
iRENa International Renewable Energy Agency
JRC Joint Research Centre
Kpi key Performance Indicator
LCOE Levelised Cost Of Energy
mCt Marine Current Turbine
mEad Marine Energy Array Demonstrator
mRCf Marine Renewables Commercialisation Fund
mSfd Marine Strategy Framework Directive
NER 300 Funding programme, financed from the New Entrants' Reserve of the EU emissions trading scheme
NREap National Renewable Energy Action Plan
OEm Original Equipment Manufacturer
OpEX Operating Expenditure
Opt Ocean Power Technologies

9
OtEC Ocean Thermal Energy Conversion
OWC Oscillating Water Column
OWSC Oscillating Wave Surge Converter
pLOCaN Oceanic Platform of the Canary Islands
pmSg Permanent Magnet Synchronous Generator
pRO Pressure-Retarded Osmosis
ptO Power Take-Off
R&d Research and Development
Rd&d Research, Development and Demonstration
REd Reverse Electrodialysis
REN Redes Energéticas Nacionais
RES Renewable Energy Source
SCig Squirrel-Cage Induction Generator
SEia Sustainable Energy Authority of Ireland
SEtiS Strategic Energy Technologies Information System
tEC Tidal Energy Converter
tRL Technology Readiness Level
tSb Technology Strategy Board
tSL Tidal Stream Ltd
tSO Transmission System Operator
US dOE US Department Of Energy
WEC Wave Energy Converter
WRig Wound-Rotor Induction Generator
WRSg Wound-Rotor Synchronous Generator

10

11
The authors would like to thank the following internal and external experts, who reviewed the draft report and contributed their ideas to its improvement: Anne Marie O'hagan from University College Cork, Jose Luis villate from Tecnalia and Oliver Wragg from EMEC. We also thank our colleagues Matthijs Soede from DG RTD, and Thomas Barbas and Evangelos Tzimas from DG JRC for their valuable input.
aCKNOWLEdgEmENtS

12
The ocean energy sector comprises different energy technologies that could exploit the power contained in our seas, and convert it into renewable low-carbon electricity. The various types of ocean energy tech-nologies, such as tidal energy, wave energy, ocean thermal energy conversion and salinity gradient energy, have reached different stages of technical and commercial development, in Europe and globally.
Given their geographical distribution and the wealth of resources available in Europe, tidal and wave energy are those poised to provide the most signif-icant contribution to the European energy system. Ocean thermal energy conversion and salinity gradient technologies are emerging technologies, which have gained attention and support from orig-inal equipment manufacturers and policy makers, despite being at an early stage of development.
Globally, the ocean energy sector is continuously growing. Increased interest in developing and commercialising ocean energy technologies is seen in different areas: from the EU, who launched the Ocean Energy Forum in April 2014 to ensure a coherent inte-grated approach to overcoming existing barriers, to Chile and Australia, who are supporting the sector with ad-hoc grants and incentives, to increased interest and ongoing deployments in Eastern Asia, and to intense hubs of research in Canada and the USA. Ocean energy has reached the stage at which technology developers must prove that they can reduce the costs of their technology whilst increasing the reliability and performances of the devices in order to tap into a potentially large market.
The picture is very different and disparate among the various technologies and policy contexts. The ocean energy market is developing at different paces, with a number of tidal technologies closing towards the development and deployment of early arrays, wave energy projects continuing to pre-com-mercial demonstration, and ocean thermal energy conversion and salinity gradient technologies devel-oping first-of-a-kind installations.
Overall, ocean energy deployments are taking place at a slower pace than expected. According to the targets set in 2009 in the different EU National Renewable Energy Action Plans, a combined tidal and wave energy capacity of 2250 MW was expected by 2020. however, taking into account ongoing proj-ects, by 2018 only about 40 MW of tidal and 26 MW of wave energy capacity will be deployed. An encouraging sign in this context is the deployment of the first tidal array project, expected in 2016 in the United kingdom. Wave energy technologies
EXECUtivE SUmmaRy
are lagging behind tidal energy, but a number of deployment projects are progressing in Europe, the US and Australia at present. Ocean thermal energy conversion and salinity gradient technologies are developing demonstration plants: a 10 MW ocean thermal energy conversion plant will be built in Martinique, whilst a 50 kW salinity gradient pilot plant began operation in the Netherlands. The EU is at the forefront of technology development, with more than 50 % of tidal energy and about 45 % of wave energy developers being located in the EU. The majority of ocean energy infrastructure, such as ocean energy test centres, is also hosted in the EU.
Ocean energy technologies face four main bottle-necks: technology development, finance and markets, environmental and administrative issues, and grid issues.
Technological barriers represent the most important challenge that the ocean energy sector needs to address in the short–medium term. Technology development is paramount for the growth of the sector and for the establishment of an ocean energy market in Europe and globally. Developing reliable technology is therefore fundamental to ensure the establishment and growth of the ocean energy market. Fundamental, in this context, would be the establishment of standards and parame-ters for assessing the success and progress of the technologies, such as performance targets and key performance indicators for each ocean energy technology type. Overcoming technology issues is key to provoking solutions to the additional barriers hindering the sector’s development, in particular financial hurdles.
Due to high capital demands for first arrays, securing investment is one of the main barriers the sector currently faces. Ocean energy technology is yet to become commercially viable, thus public finan-cial support is crucial for its development. Support mechanisms need to be implemented in view of the market maturity of the technology. It is therefore key to ensure that support mechanisms are matched to the actual status of the technology and with specific technology needs, as seen in other sectors. Leading tidal energy technologies have reached the stage where market push mechanisms could help their uptake and the establishment of a market; whilst for other ocean technologies, development needs to be supported with technology push mechanisms.
The potential environmental impacts of ocean energy projects continue to be documented but are not yet definitive due to the early stage of devel-

13
opment of the technology. Scrutiny by regulatory authorities and licensing issues are some of the main bottlenecks for ocean energy deployments. Recommendations for overcoming these issues include the optimisation of consenting procedures, their harmonisation across the different Member States and common monitoring requirements for ocean energy. Test centres and EU-wide research programmes can play an important role in studying and assessing the potential environmental impacts of ocean energy.
Ocean energy projects often require grid upgrades or new installations due to the fact that areas in Europe with high ocean energy resource potential are remote and not connected to the existing elec-tricity grid. Integration of renewable electricity will depend to a large extent on the development of the European grid and the implementation of the 2030 framework for climate and energy policies, since development or upgrading of grid infrastructure will be needed in order to reach the new climate targets.
Renewable energy sources stakeholders and devel-opers should ensure that renewable electricity in remote locations is taken into account and that the needed grid upgrades are implemented in a timely manner.
Public interventions thus far proposed appear to be adequate to sustain the growth of the sector; though it is essential they can accommodate the differences among the various technologies, and their statuses. Continued concerted efforts and the harmonisation of policy at EU level are expected to help the sector to overcome administrative and envi-ronmental issues; whilst the shift towards a more integrated European energy system may help alle-viate infrastructural issues such as grid availability. A number of initiatives funded through the EU, IEA and research councils seek to identify solutions, to overcome recognised barriers to commercialisation of ocean energy. This will help stimulate research, development and demonstration, and policy initia-tives further, for the overall benefit of the sector.

14
Oceans and seas have the potential to play a signif-icant role in providing clean energy, containing vast amounts of energy that can be harvested in many forms: by exploiting the power contained in waves, the streams of tides and ocean currents, or the temperature and salinity gradients in the water.
Different technologies are currently being developed to ensure the long-term contribution of ocean energy to the future energy system and to decarbonisation targets. Whilst ocean energy could provide a consid-erable share of the European and global low-carbon energy mix, the short-term forecast for the sector is very modest, due to the nascent status of the tech-nologies and to a series of technical, environmental and financial barriers that hinder both development and market uptake.
In Europe, the highest deployment potential can be found along the Atlantic coast, with further localised exploitable potential in the Baltic and Mediterranean seas and in the outermost regions (e.g. Reunion, Curacao). Eight EU countries have included ocean energy in their National Renewable Energy Action Plans (NREAPs) – the Uk, Ireland, France, Portugal, Spain, Finland, Italy and the Netherlands (SWD(2014)13 2014a). Developing and delivering ocean energy could therefore play a threefold role for Europe: contributing to the decar-bonisation of energy supply; increasing energy secu-rity by exploiting indigenous resources; and fuelling economic growth in the coastal regions.
Among the different ocean energy technologies, tidal and wave conversion systems are expected to contribute the most to the European energy system in the short to medium term (2025–2030), due to both local availability of the resources and advanced technological status. Salinity gradient and ocean thermal energy conversion (OTEC) have not reached the same level of maturity, and small-scale prototypes are currently being deployed in different locations.
1 iNtROdUCtiON
The sector has witnessed encouraging signals both on the policy side and on projected markets; however, the commercialisation of key technologies and their technical maturity have not progressed as expected, prompting an increased need for tech-nology developers to deliver reliable, survivable and affordable technologies in the short term to ensure the growth of the sector. In 2014, the European Commission (EC) reinforced its support and commit-ment to the development of ocean energy through a dedicated policy framework and its inclusion in both the blue growth agenda and the 2050 energy agenda (COM(2012) 494 final 2012; COM(2014) 8 final 2014).
This report stems from the need to monitor the evolution of ocean energy technology, industry and markets in Europe, with a view to their global devel-opment. The report is based on the research and policy-support work that the Joint Research Centre (JRC) has undertaken over the last few years, and aims to portray the state of play of the sector, key achievements, and mechanisms that have been put in place to overcome documented gaps and barriers to commercialisation of the sector.
The scope of this report is thus to provide, within the framework of present and future European policy scenarios, an overview of the activities and prog-ress made by the ocean energy sector. The report comprises sections addressing specific technologies: an overview of tidal energy technology is provided in Chapter 2, investigating the technology status, how the tidal market is shaping up, cost prediction and possible bottlenecks. Similarly, Chapter 3 addresses the development and deployment of wave energy converters (WECs). Chapter 4 presents an over-view of emerging ocean energy technologies, such as OTEC and salinity gradient, highlighting recent progress on the technological side and the poten-tial developments for European industries and the energy sector. Chapter 5 presents an overview of barriers and challenges hindering the progress of the sector, highlighting particular activities and initiatives aimed at overcoming them.

15
2 tECHNOLOgy StatUS aNd dEvELOpmENt
Tidal energy technology comprises a cluster of different technologies that exploit tidal cycles to generate renewable electricity, including tidal barrages, tidal lagoons, tidal stream devices and dynamic tidal power. More specifically, tidal barrages consist of dam-like structures that use the differences in potential energy between a land-based reservoir and sea level, generated by the tidal flow, to generate electricity. Tidal lagoons are based on the same concept; however, in this instance the reservoir is an independent enclosure in a highly tidal environment. Tidal stream devices use the water currents generated by tidal motions, thus using turbines to exploit the kinetic energy contained in the water flow. Dynamic tidal power exploits the difference in water level created by an open-dam structure built perpendicular to the coast to drive bidirectional turbines.
Tidal energy technologies have the advantage of being highly predictable and could therefore provide a stable output to the grid, compared to other ocean energy technologies and renewable energy sources.
In terms of technological maturity, tidal barrages represent the most advanced type of tidal tech-nology and currently comprise most of the ocean energy capacity installed worldwide. The 240 MW La Rance tidal barrage, located in the north-west of France, has been operational since 1966; whilst in 2011, the 254 MW Sihwa tidal plant started oper-ating in South korea, with a further 2680 MW in the pipeline up to 2017 (Ernst & young 2013). In the Uk, a proposed tidal barrage project (the Severn barrage) has been rejected on multiple occasions, due to the potential environmental effects that such a structure could have on the nearby ecosystem and the unclear economic benefits that the project could provide (house of Commons 2013). As such, despite the technology being ready and bankable, it is unlikely that further tidal barrages will be created in Europe in the near future.
Tidal lagoons offer minimised environmental impact, since the reservoirs are built directly in the sea, and could thus find wider applications. The estimated global potential for tidal lagoons is 80 GW. Projects to develop six tidal pools off the south coast of Wales (Uk) have received positive feedback in economic, energy and life-cycle terms (Cebr 2014).
The biggest untapped potential for tidal energy is represented by tidal stream devices, with the poten-tial for a significant market share in future energy systems. however, compared to lagoon and barrage technologies, tidal energy converters (TECs) have yet
to reach the same level of technical and commercial maturity, a required condition for becoming a reli-able and affordable energy option. Market signals are encouraging enough to expect tidal stream technologies to move towards pre-commercial and commercial arrays within the next ten years, despite a series of setbacks that may slow the progress in the short term.
In Europe, the most powerful tidal stream resources are located in France, Ireland, Norway and the Uk, with localised tidal zones in Belgium, Italy and the Netherlands. Since tidal stream represents the group of tidal devices that can grow the most in the near future, as well as providing the highest contribution in terms of energy to the European energy system, only tidal stream technologies will be considered further in the report.
2.1 technology Status
A variety of designs have been developed in order to harness the kinetic energy available in tidal streams. Turbine designs based on those developed by the wind industry represent the most common type of tidal technologies; however, as the industry evolves, new types of technologies are being devel-oped. Several classification systems of tidal energy converters have been developed. Following recent reviews of the sector by the EU co-funded SI Ocean project and the International Renewable Energy Agency (IRENA) (SI Ocean 2013a, IRENA 2014a), the classification developed by the European Marine Energy Centre (EMEC) is used in this report (Table 1). Further classifications of TEC could be defined according to the type of foundations or mooring employed and on operational conditions of the device. Whilst the conversion systems affect the primary energy conversion and efficiency of the device in ideal conditions, assessing the type of foundation and operational conditions provides further information on the potential installation and operational costs of the technology.
At present, horizontal-axis turbines represent the most common type of tidal device. A JRC report (Corsatea & Magagna 2013), which looked at inno-vation activity within the ocean energy sector, esti-mated that currently horizontal-axis turbine devices account for 76 % of research and development (R&D) efforts in the development of tidal devices worldwide (Figure 1).

16
The evolution of tidal devices shows that first-gen-eration tidal devices were designed for bottom-mounted installations (Carbon Trust 2011; SI Ocean 2013a). Second-generation devices, floating TECs, are designed to exploit the most powerful resources in the mid/high water column, whilst third-genera-tion devices are looking to exploit additional tidal resources within the water column (e.g. tidal kite, Archimedes’ screw). As previously mentioned, the operational conditions and the type of foundations play a significant role with respect to performance and cost of the technologies.
Tidal devices can be installed on fixed structure, such as monopiles, pods and gravity foundations, or floating and moored to the seabed by tethers. Whilst a convergence can be seen in the type of tidal tech-nology, the same cannot be said with regards to foun-dations: about 40 % of tidal devices require floating connections, and 60 % require fixed foundations (IRENA 2014b). Foundations have been identified as an area where industrial collaboration could minimise costs and reduce installation and maintenance time.
horizontal-axis turbines (hATs) not only represent the most common type of TEC, but they form the class of device that has sustained intensive open-water testing and shows high technology readiness levels (TRLs). In the Uk alone, one of the key players in ocean energy development, more than 11000 MWh of electricity generated by ocean energy were fed to the grid since 2008, with 10500 MWh of them being generated by horizontal-axis tidal devices (Ofgem 2014).
The Seagen tidal converter, developed by Marine Current Turbines/Siemens (MCT), has been opera-tional in Northern Ireland since 2008 and accounts for over 9200 MWh fed to the grid. Other examples are the Alstom/TGL Deep Gen and the Andritz hydro/hammerfest hS1000, which have generated over 1300 MWh in the last two years. All three compa-nies have a track record in upscaling their devices to full commercial scale, and they have attracted investment from key original equipment manu-facturers (OEMs), such as Siemens, who acquired MCT in 2011. Similarly, Alstom has acquired TGL from RollsRoyce, whilst Andritz hydro has acquired hammerfest (Table 2). A similar progression was seen when French OEM DCNS acquired about 60 % of Irish developers Openhydro (DCNS 2014a). Siemens has recently announced divesting its ownership of MCT; implications on the tidal sector and market are addressed in Section 2.3.3.
The technology progression seen by tidal energy converters has brought other key industrial players to the sector, notably voith hydro, kawasaki heavy Industries, hyundai heavy Industries, Tocardo and Schottel, to mention a few, which are involved in either technology development or adaptation of existing conversion technologies to second- and third-generation tidal structures.
device type Class description
horizontal-Axis Turbine A Similarly to wind energy converters, this technology exploits the lift from the tidal flow to force the rotation of the turbine mounted on a horizontal axis. This operates a rotor, converting mechanical energy to electrical energy through use of a generator.
vertical-Axis Turbine B The principle of operation of vertical axis turbines is similar to the horizontal devices, except the turbines are mounted on a vertical axis.
Oscillating hydrofoil (Reciprocating Device)
C Oscillating hydrofoils comprise a hydrofoil located at the end of a swing arm, which is allowed to oscillate in pitching mode by a control system. The motion is then used to pump hydraulic fluid through a motor. The rotational motion that results can be converted to electricity through a generator.
Ducted Turbine or Enclosed Tips
D Enclosed tips (ducted) turbines are essentially horizontal-axis turbines contained within a venturi duct. This is designed to accelerate and concentrate the fluid flow. Ducted structures could also reduce turbulence around the turbines and facilitate the alignment of water flow towards the turbines.
Archimedes’ Screw E These devices are a variation of the on vertical-axis turbines, drawing power from the tidal stream as the water flows up through the helix.
Tidal kite F Tidal kite devices comprise a tethered kite with a small turbine. The kite effectively flies through the flow, increasing the relative flow velocity entering the turbine.
Other G Novel tidal concepts currently under development that do not fit any of the above categories.
Table 1: Tidal energy device classification
Source: Corsatea & Magagna 2013
76%2%2%4%
16%
100%
76 %
2 %2 %
4 %
16 %
Horizontal-Axis turbine Vertical-Axis turbine Oscillating hydrofoil Ducted turbine Other
Fig. 1: Distribution of R&D efforts in tidal technology types. Source: Corsatea & Magagna 2013

17
2.2 technology developments
The tidal sector is continuously developing, with industry leaders focussed on deploying pre-com-mercial arrays, whilst novel designs and innova-tive solutions are being examined to ensure that the full potential available is exploited and costs reduced. Different trends can be seen in the sector (SI Ocean 2013a):
• FloatingTECsandmulti-turbineplatforms• Small-scaletechnology• Radicaldesigns• Componentsandsubcomponents
2.2.1 floating tECs and multi-turbine platforms
The evolution from first- to second-generation tidal devices is seen mainly in the development of floating TECs (SI Ocean 2013a). First-generation turbines, based on the successful design of conven-tional wind turbines, were designed to be mounted on the seabed by a monopole, a pinned structure or gravity structure. First-generation tidal devices have sustained a wealth of testing in operational condi-tions and achieved significant energy production in the Uk. One of the disadvantages of first-generation turbines is the high cost associated with their foun-dations, coupled with the potential environmental impacts that their installation may have on marine life. Second-generation TECs consist of floating structures, such as the Scotrenewable SRTT device, Ocean Flow Energy Evopod and Nautricity Cormat turbine. The advantages of these technologies can be multiple:
• Exploiting more powerful resources: since tidalstream velocity is higher at the water surface, floating TECs can make use of more favour-able resources, obtaining higher efficiencies and conversion rates.
• Devicescanbefloatedinposition;thusthecostsfor installation, retrieval and maintenance can be further reduced, resulting ultimately in a lower levelised cost of energy (LCOE).
• Buoyancy allows for multiple devices to besupported on the same platform, reducing the torque on foundations/moorings that the platform has to bear.
At the current stage, floating TECs have not reached similar levels of reliability and production as first-generation devices, and will soon be required to prove their technologies at full scale.
The development of floating TECs has also opened the way to the development of multi-rotor plat-forms. Initial devices were designed to be technology neutral, allowing integration of both horizontal- and vertical-axis turbines. however, as technology design is progressing towards prototype testing in real water, it can be seen that most advanced designs make use of horizontal-axis turbines. The Scotrenewable SRTT 250 kW device is designed to support two contrarotating two-bladed horizontal rotors. Bluewater announced the deployment in the Netherlands, in collaboration with Tocardo, of a 200 kW device, and is also developing a two-rotor 2 MW tidal floating turbine (called BlueTEC) jointly with MCT/Siemens (Bluewater 2014). BlueTEC will consist of two three-bladed hATs from MCT, whilst Bluewater is in charge of the design of the floating platform. Both companies have announced plans for a commercial development in Canada, and have obtained a lease for a site in the Bay of Fundy (MCT 2014). The Nautricity’s Cormat turbine employs two contrarotating three-bladed rotors on the same axis. Tidal Stream Ltd (TSL) and Sustainable Marine Energy are both developing multi-rotor platforms and have announced partnerships with Schottel to use its SG50 50 kW three-bladed turbine.
TSL is developing different versions of the Triton submerged platform. The Triton S is designed to accommodate between 20 and 60 SG 50 kW rotors for an overall nominal power of 1–3 MW and can operate in water depths of 25–40 m. The Triton 3 and Triton 6 platforms are expected to accommodate three and six 2 MW third-party turbines, respectively; however, at the current stage, no announcement has been made on the turbine developer.
Sustainable Marine Energy has been developing the PLAT-O flexible platform for a number of years, and whilst the initial design comprised five ducted turbines, they have recently announced the devel-opment of a PLAT-O 100 device comprising two SG 50 kW rotors (Schottel 2014). The company has recently received further funds to deploy its device
developer 1st prototype year 2nd prototype year
MCT/Siemens 300 kW 2003 2x 600 kWa 2008
Alstom/TGL 500 kW 2011 1200 kW 2013
hammerfest/Andritz hydro 300 kW 2009 1100 kW 2013
Open hydro/DCNS 200 kW 2008 2200 kW 2012
voith hydro 110 kW 2012 1000 kW 2013
a The MCT Seagen device was first deployed with only 1 rotor and then with 2 rotors.
Table 2: Examples of upscaling of HATs by leading tidal energy developers

18
in Uk waters following further testing of their plat-form (ReNews 2014a).
The development of floating TECs and of multi-rotor platforms is showing promising signs in terms of international and industrial collaboration, which may accelerate the uptake of floating technologies.
2.2.2 Small-scale technology
A number of tidal developers are developing small-scale technologies in order to reduce both costs and risks that are associated with testing and deploy-ment of the devices. This represents a strong shift in a sector that has long focussed on developing devices with a nominal capacity of > 1–2 MW. As pointed out in the SI Ocean Gaps and Barriers Report (MacGillivray et al. 2013), large devices are essen-tial to ensure that ocean energy targets are met and potentially in creating a market for ocean energy; however, developing and deploying small-scale devices could aid the learning curve of the sector.
Different companies are currently developing and deploying small-sized tidal turbines. Tocardo B.v., a Dutch company, has been developing its rotor blade design for about ten years, and deployed the T1 device in Den Over in 2008. The T1 is a 100 kW two-bladed rotor, designed to operate at tidal speeds of about 2 m/s. The small size of the device allows for installation in shallow tidal sites and in rivers. The company is already commercialising its T1 and T2 devices, and is now looking into devel-oping a 500kW turbine for installation in Scottish waters, and is collaborating with Airborne Group for the development and mass manufacturing of its composite blades.
Nova Innovation has recently deployed its Nova 30 in Shetland, a 30 kW three-bladed rotor, employing a Siemens generator and gearbox. The device has been labelled as the first micro-scale tidal generator, as well as being the first community-owned tidal device to become operational. The company is currently looking at the development of a 100 kW model and has received further funds to develop a 500 kW array in the Shetland Isles (Business Green 2014).
Schottel Gmbh, a German company specialising in developing marine propellers, has developed a 50 kW three-bladed rotor. The company previously provided shaft, hub and pitch mechanisms employed in the development of the Andritz/hammerfest Strøm AS1000 device (Maritime Executive 2014). The STG50, like the T100, presents no-pitch mecha-nisms and is designed for application on multi-tidal platforms. Schottel focussed on minimising the weight of the rotor: a whole STG50 weighs about 800 kg (Schottel 2013). The weight of a 1 MW array composed of 20 STG50 devices is therefore 16 t, whilst the average weight of a nacelle of a conventional 1 MW turbine is 130 t (Andritz 2014);
such a reduction may prove essential in reducing the capital expenditure (CAPEx) associated with the manufacture of tidal devices. The next step for small-scale developers is to demonstrate that their technologies are cost-efficient and ensure reliable operation in waters.
2.2.3 Radical designs
In the past few years, developers have looked into novel and alternative ways to harness tidal flow, especially looking at exploiting deep-water flows and/or slower tidal flows. Of the many concepts developed, two devices are showing substantial development and deployment activities: Flumill and Minesto’s Deep Green.
Flumill, a Norwegian company, has developed a double-helix tidal device based on excess-flow valves from the gas industry. The two screws rotate in opposite directions, providing further hydrody-namic stability to the device, and activate a gear-less permanent magnet generator. The company has tested a quarter-scale device at EMEC. The development of a 2 MW tidal plant is currently underway in Rystraumen in Norway. The company has already managed to secure permits for installa-tion and 73 % of the funds to finance the 20 m EUR project, with 40 % of the funds coming from ENOvA (Trayner 2014).
The Swedish company Minesto is developing the Deep Green tidal kite, designed to operate in water depths of 60–120 m and at tidal velocities > 1.5 m/s (Minesto 2014a). The device consists of an 8–14 m-wide kite and 3–5.5 m-long nacelle, equipped with an enclosed turbine and a gearless generator. The water current generates a lift on the kite, forcing the turbine to move. The company is currently oper-ating a quarter-scale device in Strangford Lough in Northern Ireland. It has received further funds from the Department of Energy and Climate Change (DECC) in the Uk to continue the development of its turbine, and has been awarded a seabed lease for the development of a 10 MW plant in Wales (Minesto 2014b; Minesto 2014c).
2.2.4 Components and subcomponents
The general structure of tidal energy converters comprises a prime mover (blades, sails, helixes or foils), a foundation/mooring system and a generator, which may be coupled with a gearbox. In the case of a tidal kite, the nacelle is attached beneath the kite. In the most common horizontal-axis turbines, blades are connected to the hub, and the nacelle incorpo-rates the generator, the gearbox, the control mech-anisms and the converter to ensure that the energy generated can be fed to the grid. Whilst the tidal sector exhibits a certain level of design consensus, the picture looks slightly different when components and subcomponents of TECs are taken into account.

19
2.2.4.1 BladesBlades are a critical component of tidal energy converters, and their structural stability is of primary importance in ensuring the overall reliability of a device. As pointed out in Davies et al. 2013, at the current stage of development of tidal turbines, much information concerning tidal turbine blades is highly confidential, especially with regards to shape and detailed information on the materials used.
Fifty percent of horizontal-axis turbine designs currently being developed use three-bladed turbines, while 25 % use a two-bladed rotor. Other designs may use four, six or more blades. As witnessed in the wind energy sector, it is likely that the three-blade rotor offers a higher stability to the device. Recent reports and press releases indicate that MCT/Siemens are also developing a three-bladed turbine, marking a significant step change from the long-tested two-blade system, tested in Northern Ireland.
Different materials have been employed so far in the manufacturing of blades/prime movers for tidal energy converters, from pinewood to glass-rein-forced resins, carbon fibres and composite mate-rials. The development and design of composite hAT blades follows closely those of wind turbine blades, with steel and fibreglass initially employed by developers, but now moving towards the use of infused quasi-unidirectional glass/epoxy mixes or carbon fibres/prepreg resins (Bir & Migliore 2004; Akram 2010; Davies et al. 2013). As highlighted in Bir et al. 2011, different materials can be employed in different parts of the blade, with a composite box spar running through the mid-section of the blade to provide strength and increased resistance for load-bearing (Figure 2).
Funds have been directed towards R&D on blades and composite materials, which can help both increase the reliability of the devices and reduce the manufacturing costs of the blades. For example, The Carbon Trust and the Technology Strategy Board (TSB) have signed a Memorandum of Understanding with Aviation Enterprise Limited (AEL) to optimise the development of lightweight carbon fibre blades, resulting in the development of third-generation prepreg materials ensuring higher resistance and reduced manufacturing time (AEL 2014). As high-lighted both in Bir et al. 2011 and Davies et al. 2013, the use of composite materials allows tidal developers to collaborate directly with blade manu-factures to optimise design and import important knowledge from aviation and wind energy engi-neering. Examples of these collaborations can be found in Table 3.
2.2.4.2 Foundations and moorings Along with the development of tidal converters, developers have looked at different ways to install devices on the seabed. Foundations and moorings need to provide support to loads during opera-tion and allow easy access to the devices in case of maintenance. The type of foundations adopted for a particular tidal device depends on structural stability, the type of seabed and the water depth at the location. Monopile foundations, as used for offshore wind turbines, are a simple, robust and proven technology; however, they are limited in terms of water depth and show high installation costs.
The high cost associated with pile-type founda-tions led to the development of gravity-based and pinned structures. Gravity foundations are normally favoured in low-sediment seabed, whilst pinned
Fig. 2: Structural layout of a
typical section of a composite
laminate tidal blade.
Source: Bir et al. 2011

20
systems employ piles to maintain the position of the support structure. In both cases the device is connected to a tripod or tetrapod structure. Developers such as Atlantis, Andritz/hammerfest, Openhydro, Nova Innovations, Alstom/TGL and TidalStream have all developed tripod structures for the installation of their turbines. voith hydro and verdant employ a single-pod gravity structure, whilst Siemens/MCT is moving towards a tetrapod structure to host its new turbines. About 60 % of tidal developers are currently investigating different types of foundations, whilst the remaining ones are developing floating converters that will be moored. Tethered systems employ anchors and plates to ensure seakeeping of devices (IRENA 2014b).
2.2.4.3 Generators, control, gearboxes, power converters
The drivetrain is composed of a series of compo-nents that are needed to assure the conversion into electricity and its feasibility in the grid: genera-tors, control systems, gearboxes, transformers and converters. Depending on the type and size of the TEC and on the chosen configuration, few or all of these components may be employed (Figure 3).
One of the most important features of tidal energy converters is ultimately the generator, allowing the mechanical energy to be converted into electrical energy. In this area, tidal energy has closely followed
tidal developer blade manufacturer Website
Marine Current Turbines/Siemens AEL www.aviationenterprises.co.uk
Alstom/TGL AEL www.aviationenterprises.co.uk
Tocardo Airborne Marine airborne-marine.com/
Andritz hydro/hammerfest Gurit www.gurit.com/
Atlantis Norco Ltd www.norco.co.uk
Openhydro/DCNS Norco Ltd www.norco.co.uk
Schottel Avantgarde Technologie www.avantgardetechnologie.de/
Pulse Tidal Designcraft www.designcraft.co.uk/
Tidal Energy Ltd Designcraft www.designcraft.co.uk/
Ocean Flow Designcraft www.designcraft.co.uk/
Scotrenewables Designcraft www.designcraft.co.uk/
TidalStream Designcraft www.designcraft.co.uk/
Table 1: Overview of selected drilling methods
Fig. 3: Drivetrain options for tidal energy converters. Source: Bower 2013

21
the steps of wind energy, whose evolution may offer an account of future progression for the tidal sector. Different generator configurations are available to ensure the TEC can feed into the electrical grid.
Generators employ electromagnetic induction, from the relative motion of a magnet against a stator, which varies with the type of excitation system used, the type of magnet and the phase of the system. Synchronous generators include the wound-rotor synchronous generator (WRSG) and the more common permanent magnet synchronous gener-ator (PMSG). Direct-drive generators (DDG) (or linear generators) are a type of PMSG that may not require the use of a gearbox. In recent years, the wind industry has seen an increase in the introduction of asynchronous or induction generators that could offer a more attractive solution for marine energy applications, since they are able to absorb power fluctuations (Lynn 2013; Lacal Arántegui 2014). The most important asynchronous generators are the squirrel-cage induction generator (SCIG), wound-rotor induction generator (WRIG) and double-fed induction generator (DFIG). Lynn (2013) and Elghali et al. (2007) have reviewed the most common types of generators for ocean energy applications, as summarised in Table 4.
A review of existing leading and innovative tidal devices shows that 45 % employ gearless PMSGs whilst 50 % use a combination of gearbox and generator (IRENA 2014b). Different control systems are, however, employed; many turbines (30 %) employ pitch regulation, an active system that adjusts the inclination of blades in the flow to reduce torque, whilst others use stall regulation (10 %), a passive system in which the speed of the turbine is reduced in high flows. Whilst reducing the need of active control, stall systems require the blades to be designed so that the turbine slows downs at very
high velocity. Other designs use overspeed regu-lation (15 %), by which the turbine adopts passive adaptive blades and keeps its rotational speed constant. Other control systems force the turbines to be moved away from the current (yaw and tilt control); in other cases no control system is imple-mented on the turbines. Many developers have not yet disclosed the type of control system employed on their devices. An overview of the control systems used in TECs is provided in Figure 4.
Gearboxes, power converters and brake systems are mechanisms that have been well developed for other applications, such as hydropower, wind power and conventional power systems, and are being adapted to tidal conditions. Developers are continuously engaging with different companies to develop and/or adapt subcomponents to suit their devices and to increase reliability. The MeyGen project, which may become the first commercial tidal array, provides an overview of the main differences in terms of compo-
type advantages disadvantages
Squirrel-Cage Induction Generator •Widespeedrange•Reactiveandactivepowercontrolsystem•Widelyproventechnology
•Requiresgearbox•Full-scalepowerconverter
Wound-Rotor Synchronous Generator •Widespeedrange•Reactiveandactivepowercontrolsystem•Maynotrequiregears
•Multipolegenerator•Full-scalepowerconverter•Small-sizedconverterforfield
Permanent Magnet Synchronous Generator
•Widespeedrange•Maynotrequiregears•Reactiveandactivepowercontrolsystem•Lowmaintenance•Doesnotrequirepowerconverterforfield
•Requirespermanentmagnets•Multipolegenerator•Full-scalepowerconverter
Direct-Drive Generator •Additionalmechanicalsimplicity •Needofsophisticatedpowercontrol system (uneven generator)
Double-Fed Induction Generator •Limitedspeedrange (±30 % of synchronous speed)
• Inexpensiveinverter•Fullcontrolofreactiveandactivepower
•Requiresgears•Requiressliprings
Source: Elghali et al. 2007; Lynn 2013
Table 4: Descriptions of most common generators for tidal energy applications
Source: Corsatea & Magagna 2013
30%12%15%18%25%
100%
30 %
12 %
15 %
18 %
25 %
Pitch Stall Overspeed No control n/a
Fig. 4: Control systems currently employed in TEC. Source: JRC 2014

22
nents between the two types of turbine that will be installed in the first stage of the project: the Atlantis AR1500 and the hammerfest/Andritz hS1000 Mk1 (Table 5).
The continuous progression of tidal energy towards commercialisation requires that components and subcomponents be fully tested to ensure the reli-ability of components. MacGillivray et al. report that many of the failures experienced so far by ocean energy devices relate to small components, which would require one person to fix (MacGillivray et al. 2013), whilst wind energy experience shows that frequent failures are attributed to power elec-tronics and gearboxes, with gearbox failure causing greatest downtime (Sheng 2013).
The development of a supply chain is essential for the delivery of a commercially viable tidal energy
sector. The tidal industry is engaging widely with subcomponent manufacturers, either to design ad-hoc components to fit on their devices or to use off-the-shelf components (Table 6). Pullen et al. (2009) have found that wind energy manufacturers seek a balance of outsourcing of components and in-house development. These trends have devel-oped unique market structures for each subcompo-nent development.
Table 6 provides information on how the tidal energy supply chain is shaping up in terms of specific compo-nents and subcomponents. It is possible to notice, as in the case of blade components, that many developers share common suppliers. A correct esti-mate of the number of companies involved at any stage of the tidal energy supply chain is currently not possible, as many companies have announced developments in a particular area of the sector
Component atlantis aR1500 andritz HS1000
Rated power 1.5 MW 1.5 MW
Rotor diameter 18 m 18 m
Inspection period 6.25 years 5 years
Blade material Glass-reinforced plastic Carbon steel
Generator PMSG Induction
Pitch system Collective hydraulic Independent electrical
Gearbox 2-stage 3-stage
Cable connection Wet-mate Dry-mate
Source: MeyGen 2014a; Tethys 2014a
developer bearings brakes Shaft gearbox Control generator Electrical
Alstom/TGL Invo-tech Orbital2 Wikov In-house
Andritz hydro/hammerfest
Schottel In-house Converteam
Atlantis R.C. Altra Industrial Motions
Schottel David Brown Schottel ATB Morley ABB
Nova Innovation Siemens Siemens
Ocean Flow James Fisher Defence
James Fisher Defence
James Fisher Defence
Openhydro In-house
Pulse Tidal Bosch Rexroth Bosch Rexroth Bosch Rexroth Fraunhofer IWES
In-house Senergy Econnect
Schottel Wolfgang Preinfalk
In-house
Scotrenewables MacArtney In-house ABB
MCT/Siemens NkE Invo-tech Orbital2 Wikov In-house
Tidal Energy Limited
Siemens In-house General Electrics
Source: Information retrieved from company sites. Tenders may have changed following testing of components/R&D advancements.
Table 5: Components comparison for the MeyGen project
Table 6: Identified suppliers for TECs
23
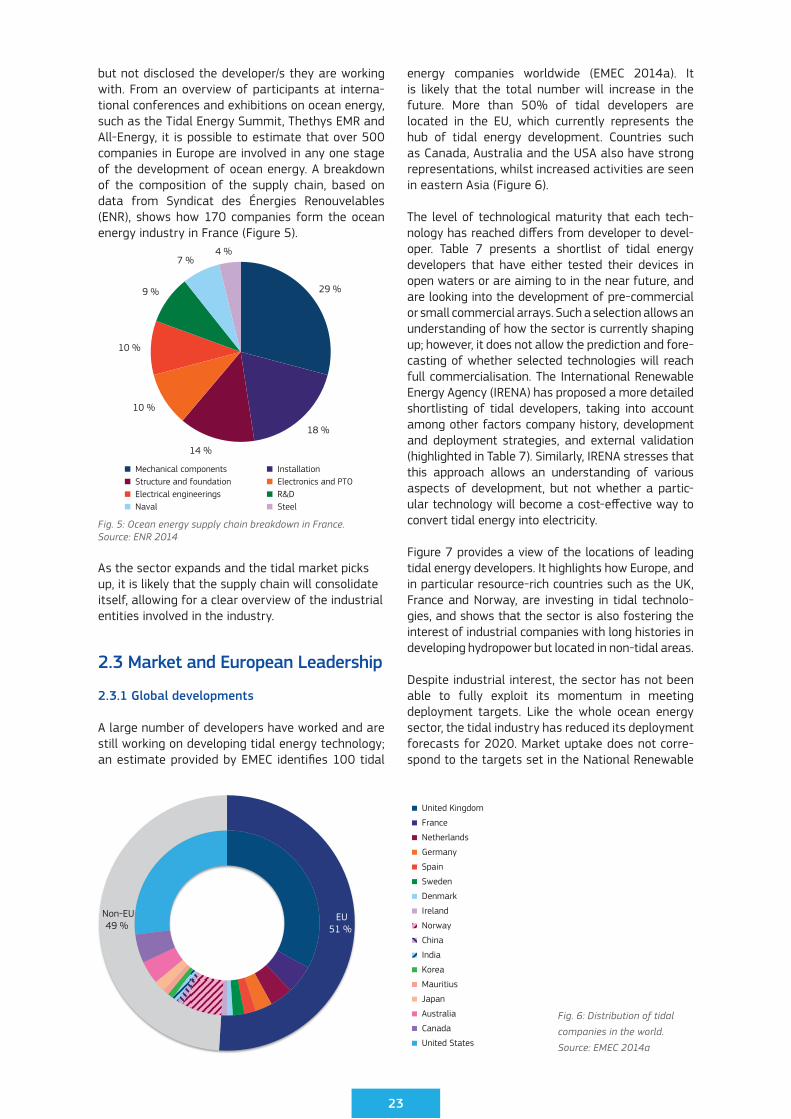
but not disclosed the developer/s they are working with. From an overview of participants at interna-tional conferences and exhibitions on ocean energy, such as the Tidal Energy Summit, Thethys EMR and All-Energy, it is possible to estimate that over 500 companies in Europe are involved in any one stage of the development of ocean energy. A breakdown of the composition of the supply chain, based on data from Syndicat des Énergies Renouvelables (ENR), shows how 170 companies form the ocean energy industry in France (Figure 5).
As the sector expands and the tidal market picks up, it is likely that the supply chain will consolidate itself, allowing for a clear overview of the industrial entities involved in the industry.
2.3 market and European Leadership
2.3.1 global developments
A large number of developers have worked and are still working on developing tidal energy technology; an estimate provided by EMEC identifies 100 tidal
energy companies worldwide (EMEC 2014a). It is likely that the total number will increase in the future. More than 50% of tidal developers are located in the EU, which currently represents the hub of tidal energy development. Countries such as Canada, Australia and the USA also have strong representations, whilst increased activities are seen in eastern Asia (Figure 6).
The level of technological maturity that each tech-nology has reached differs from developer to devel-oper. Table 7 presents a shortlist of tidal energy developers that have either tested their devices in open waters or are aiming to in the near future, and are looking into the development of pre-commercial or small commercial arrays. Such a selection allows an understanding of how the sector is currently shaping up; however, it does not allow the prediction and fore-casting of whether selected technologies will reach full commercialisation. The International Renewable Energy Agency (IRENA) has proposed a more detailed shortlisting of tidal developers, taking into account among other factors company history, development and deployment strategies, and external validation (highlighted in Table 7). Similarly, IRENA stresses that this approach allows an understanding of various aspects of development, but not whether a partic-ular technology will become a cost-effective way to convert tidal energy into electricity.
Figure 7 provides a view of the locations of leading tidal energy developers. It highlights how Europe, and in particular resource-rich countries such as the Uk, France and Norway, are investing in tidal technolo-gies, and shows that the sector is also fostering the interest of industrial companies with long histories in developing hydropower but located in non-tidal areas.
Despite industrial interest, the sector has not been able to fully exploit its momentum in meeting deployment targets. Like the whole ocean energy sector, the tidal industry has reduced its deployment forecasts for 2020. Market uptake does not corre-spond to the targets set in the National Renewable
29%18%14%10%10%
9%7%4%
100%
29 %
18 %
14 %
10 %
10 %
9 %
7 %4 %
Mechanical components Installation Structure and foundation Electronics and PTO Electrical engineerings R&D Naval Steel
France
Germany Spain Sweden Denmark Ireland Norway China India Korea Mauritius Japan Australia Canada
Total
EU51 %
Non-EU49 %
United Kingdom
France
Netherlands
Germany
Spain
Sweden
Denmark
Ireland
Norway
China
India
Korea
Mauritius
Japan
Australia
Canada
United States
Fig. 5: Ocean energy supply chain breakdown in France. Source: ENR 2014
Fig. 6: Distribution of tidal
companies in the world.
Source: EMEC 2014a

24
Company Name model Operational testing
Country Website
Alstom hydro/Tidal Generation Limited
TGL series Full-scale France/Uk www.alstom.com/power/renewables/ocean-energy/tidal-energy
Andritz hydro hammerfest hS series Full-scale Norway/Austria www.hammerfeststrom.com
Aqua Energy Solutions AES tidal devices Part-scale Norway www.aquaenergy.no
Atlantis Resources Corporation AN series, AR series, AS series
Full-scale Singapore/Uk www.atlantisresourcesltd.com
BioPower System Pty Ltd bioStream Full-scale Australia www.biopowersystems.com
Bluewater BlueTEC Part-scale Netherlands www.bluewater.com/new-energy/tidal-energy/
Clean Current Power Systems Clean Current Turbine Full-scale Canada www.cleancurrent.com
Deepwater Energy Bv Oryon Watermill Part-scale Netherlands www.deepwater-energy.com
EEL Energy EEL Tidal Energy Converter
Small-scale France www.eel-energy.fr/en
Elemental Energy Technologies SeaUrchin Small-scale Australia www.eetmarine.com
Flumill Flumill Part-scale Norway www.flumill.com
hydra Tidal Straum AS hydra tidal Part-scale Norway www.hydratidal.info
hyundai heavy Industries Part-scale South korea www.hyundaiheavy.com/news/view?idx=332
IhC Tidal Energy/ Tocardoa OceanMill Part-scale Netherlands www.ihctidalenergy.com
kawasaki heavy Industries Ltd Full-scale South korea www.khi.co.jp/english/news/detail/20111019_1
Marine Current Turbines SeaFlow, SeaGen Full-scale Uk/Germany www.marineturbines.com
Magallanes Renovables Atir Part-scale Spain www.magallanesrenovables.com
Minesto Deep Green Part-scale Sweden www.minesto.com
Nautricity CoRMaT Full-scale Uk www.nautricity.com
New Energy Corporation EnCurrent Turbine Canada www.newenergycorp.ca
Nova Innovation Nova-I Part-scale Uk www.novainnovation.co.uk
Ocean Flow Energy Evopod Small-scale Uk www.oceanflowenergy.com
Ocean Renewable Power Company
TidGen Small-scale USA www.orpc.co
Oceana Energy Company Oceana Small-scale USA www.oceanaenergy.com
Openhydro (DCNS) Open Centre Turbine Full-scale Ireland/France www.openhydro.com
Sabella SAS Sabella D03 Part-scale France www.sabella.fr
Schottel Group STG series Full-scale Germany www.schottel.de
Scotrenewables SR series Part-scale Uk www.scotrenewables.com
Tidal Energy Ltd DeltaStream Part-scale Uk www.tidalenergyltd.com
TidalStream Limited Plat-O Part-scale Uk www.tidalstream.co.uk
Tidalys Electrimar1800, 4200 Part-scale France www.tidalys.com
Tocardo Tidal Turbines T series Full-scale Netherlands www.tocardo.com
Uppsala University: The Ångström Laboratory
Small-scale Sweden
verdant Power Free Flow System Full-scale USA www.verdantpower.com
voith hydro hyTide Full-scale Germany www.voith.com/en/products-services/hydro-power-377.html
vortex hydro Energy vIvACE Small-scale USA www.vortexhydroenergy.com
a Tocardo acquired IhC Tidal in November 2014 Companies shortlisted by IRENA
Table 7: Shortlist of tidal developers identified by JRC

25
Energy Action Plans (NREAPs), which foresaw the combined tidal and wave energy capacity reaching 2253 MW in 2020 (SWD(2014)13 2014b).
In the last two years, Bloomberg New Energy Finance (BNEF) has revised the projected tidal deployment targets for 2020 to 167 MW (2013) and 148 MW (2014) (BNEF 2014). It shall be noted that BNEF forecasts are based on the assessment of announced projects, their financials and the techno-logical status of the selected technology. Forecasts could therefore be boosted in the near future if the sector proves it can deliver affordable electricity to the grid.
A number of tidal technologies have reached advanced TRLs (> TRL 6)1 and a number of tech-nologies are in open-water test phase. The majority of deployments have so far taken place at EMEC. It was the first ad-hoc wave and tidal test centre opened in 2003, and other centres and locations have followed recently. Leading technologies have already fed significant amounts of electricity to the grid, and thus commenced the development of pre-commercial and first-of-a–kind commer-cial arrays. In total, up to February 2014, 10 500 MWh were generated by certified tidal developers in the Uk (Figure 8), which represents a significant achievement for the industry.
From the data publicly available, it can be seen that existing technologies have achieved high capacity factors of up to 56 %, with average values greater than 25 %: in the range of reference values for R&D projects and close to those experienced by offshore wind. It has to be noted that capacity factors have been calculated on a monthly basis and do not take into account any eventual or planned shut-off of the device during testing phase.2
Electricity production and capacity factors achieved by the sector have offered encouraging signs for a relatively young industry, and have facilitated investments in the sector. One of the key strengths of the tidal energy industry, in comparison with other ocean energy technologies, has been its capacity to attract a number of large OEMs. The presence in the market of OEMs has certainly allowed the sector to gain a certain momentum towards the formation of a market, with a first array project currently under construction (Offshore Wind 2014).
however, concerns with regards to the cost of the technology, its rate of development and reaching
Fig. 7: Tidal energy network. Purple markers: developers' headquarters; red markers: test sites and demonstration sites under development
Fig. 8: Electricity generation from tidal energy converters in the UK. Source: Ofgem 2014
0
2000
4000
6000
8000
10000
120000
4-0
90
6-0
90
8-0
91
0-0
91
2-0
90
2-1
00
4-1
00
6-1
00
8-1
01
0-1
01
2-1
00
2-1
10
4-1
10
6-1
10
8-1
11
0-1
11
2-1
10
2-1
20
4-1
20
6-1
20
8-1
21
0-1
21
2-1
20
2-1
30
4-1
30
6-1
30
8-1
31
0-1
31
2-1
30
2-1
4
Cum
ulat
ive
elec
trci
ty g
ener
atio
n [M
Wh]
TGL/Alstom MCT/Siemens Hammefest/Andritz
1 The reference descriptions for TRLs adopted in this document correspond to the definitions in the horizon 2020 framework (Section 5.2).
2 The SeaGen device deployed in Strangford Lough was subject to an adaptive management system to reduce potential impacts on marine mammals, which initially required complete shut-off of the device when a mammal approached the turbine at a 100 m distance, but was progressively reduced.

26
financial close have already forced OEMs to divest their interests in tidal energy, as witnessed in the case of MCT/Siemens (Business Green 2014). Siemens pointed to delays in the formation of the market and of the supply chain as the main cause of its exit from the sector.
In short, the tidal market has yet to take off. Tidal energy is still an emerging and niche sector, which has still to overcome one major barrier: finalising its technology for commercial roll-out, and reaching financial close for the deployment of pre-commer-cial and first-of-a-kind arrays.
At the current stage, as a matter of fact, most deployment activities are looking at single device and small pre-commercial arrays. An overview of expected tidal deployments in Europe for the period 2012–2014 is presented in Figure 9, highlighting the status of each announced deployment, mostly in the area of 0.5–2 MW.
2.3.2 aiding development and deployment
Local agencies, national governments and the European Union are acting on different levels to facil-itate the creation and the establishment of a tidal energy and broader ocean energy market, including the creation of ad-hoc infrastructures such as test centres, facilitating leases for seabed, establishing funds for first-of-a-kind array demonstrations and implementing capital support systems.
In the last few years a number of initiatives have been launched to help drive the ocean energy sector towards arrays deployment and meet the NREAP targets. Tidal projects were awarded funds through both EU and national schemes, such as the EU
NER 300 (New Entrants’ Reserve) programme, the Uk Marine Energy Array Demonstrator (MEAD) and France’s ADEME’s funds for the development of tidal parks (Table 8). It is important to notice that access to these funds is subject to stricter conditions compared to R&D funds, with funding subject to the operating start date and to the amount of electricity produced, and often they require the developer to find further financing. Both the tidal projects that were awarded NER 300 funding from the EU are still in the development phase and are expected to commence operation in the last quarter of 2016. The kyle Rhea project, an 8 MW array put forward by MCT/Siemens, was granted EUR 10 million of upfront funding (Commission Decision C(2014) 383 2014).
Of the two projects awarded funds under DECC flagship Marine Energy Demonstrator Array (MEAD) funds, only the MeyGen project has reached finan-cial close, having raised over 50 m GBP to allow the project to take off. The array is currently under construction (Offshore Wind 2014). On the other hand, the postponement of the operating date past the 2016 deadline has forced DECC to withdraw its grant for the Skerries array, which was later aban-doned by Siemens (Tidal Today 2014a). The exit of Siemens from the sector may also affect the kyle Rhea project; however, no announcements have been made with regard to this yet. In December 2014 ADEME announced winners for the construc-tion of two pilot tidal projects in France: a 5.6 MW array expected to be operational by 2017, employing four Alstom Oceade turbines, and a 14 MW array composed of seven Openhydro 2 MW turbines. The total support provided by ADEME is EUR 103 million, whilst the total project costs are expected to be in the area of EUR 210 million for the 20 years of life of the arrays (ADEME 2014).
Alstom Voith Hydro Nautricity Nova Innovation Oceanflow Energy Flumill Magallanes Tidal Energy Ltd Bluewater OpenHydro, EDF Sabella, GDF Scotrenewables Meygen Kyle Rea Sound of IslayGrand Total
OpenHydro, EDF
0
1000
2000
3000
4000
5000
6000
2012 2013 2014 2015
Capa
city
[kW
]
Scotrenewables Sabella, GDF OpenHydro, EDF Bluewater Tidal Energy Ltd Magallanes Flumill Oceanflow Energy Nova Innovation Nautricity Voith Hydro Alstom Andritz Hydro Hammerfest, SPR
Fig. 9: European tidal deployment 2012–2014

27
2.3.3 future developments
The tidal sector is continuously looking to increase installed capacity. A wide number of projects have been announced in the last few years, accounting for over 1500 MW of projected capacity in Europe (Corsatea & Magagna 2013). Only a small fraction of them has actually been commissioned or reached financial close. It has to be noted that the expected capacity of a project does not necessarily relate to its initial development. For example, projects such as MeyGen could reach up to 398 MW in size; however, its initial development phase has been approved for up to 86 MW and received a grid licence for up to 15 MW (MeyGen 2014b). Similarly, DP Energy have announced plans for the Fair head and Islay arrays, with an aspirational combined capacity of 400 MW, currently planned for a 130 MW capacity (DEME 2014).
In the Uk alone, The Crown Estate has already leased 26 zones for tidal energy development, accounting for over 1200MW. In addition, in July 2014 the lease of 11 new wave and tidal zones, including sites identified to become demonstrations zones, was announced (The Crown Estate 2014).
Three of the four demonstration zones selected for Scotland are dedicated to tidal projects and were chosen to be developed in collaboration with local communities (The Crown Estate 2014). Five more sites are currently under construction in France, with the expectation of devices being operational by 2016. Small-sized arrays have been announced for construction on dikes in the Netherlands in 2016. By 2018, Europe could see its tidal installed capacity increasing to about 40 MW, a significant step forward for the development of a tidal energy market (Figure 10).
Table 8: Descriptions of most common generators for tidal energy applications
project Name Location Capacity funding awarded
funding body
Expected Operation date
Status and Updates
Sound of Islay Islay, Scotland, Uk
10 MW 20.65 m EUR NER 300/EU 31/10/2016 Project put forward by ScottishPower Renewables and to employ Andritz hydro and Alstom turbines.
kyle Rhea Isle of Skye, Scotland, Uk
8 MW 16.77 m EUR NER 300/EU 31/12/2016 The EU has approved up-front funding for this project of 10 m EUR.
MeyGen Pentland Firth Inner Sound, Scotland
6 MW 10 m GBP MEAD/Uk Jan–Jun 2016 The project has reached financial close for the development of phase 1A (6 of 86MW). Construction was expected to begin in the fourth quarter of 2014. DECC and The Crown Estate are among the financing sources.
Skerries Array Anglesey, Wales, Uk
10 MW 10 m GBP MEAD/Uk Jan–Jun 2016 Project halted following delays to expected operation date.
Nepthyd France 5.6 MW Undisclosed ALSTOM /GDF SUEZ /ADEME
31/12/2017 ADEME has awarded Alstom/GDF Suez and Openhydro/DCNS/EDF funds for the creation of pilot tidal projects in France. The total sum provided by ADEME is 103 m EUR, and the total costs over 20 years are expected to be 210 m EUR.
Normandie hydro
France 14 MW Undisclosed Openhydro /DCNS/ EDF/ADEME
31/12/2018 ADEME has awarded Alstom/GDF Suez and Openhydro/DCNS/EDF funds for the creation of pilot tidal projects in France. The total sum provided by ADEME is 103 m EUR, and the total costs over 20 years are expected to be 210 m EUR.
Sources: Commission Decision C(2014) 383 2014; France Energies Marines 2014; ADEME 2014; Tethys 2014b; Tethys 2014c
Fig. 10: Expected tidal developments until 2018
0
5000
10000
15000
20000
25000
30000
35000
40000
45000
50000
2012 2013 2014 2015 2016 2017 2018
Inst
alle
d ca
paci
ty [k
W]
Annual installation Cumulative capacity

28
It is undeniable that tidal energy is making slow but steady progress towards the deployment of pre-commercial arrays, with first-of-a-kind proj-ects receiving both national and European support. however, on the other hand, it is clear that the sector needs to identify better strategies to attract investment and secure financing for the first arrays to be deployed. In this context, the success of the MeyGen consortium in raising the necessary capital to start Phase 1A of the array should be considered as a milestone, providing an encouraging sign for the whole sector. The issues related to the financing of ocean energy projects have been highlighted in a recent EU communication on ocean energy, with a dedicated ‘stream’ in the newly set-up Ocean Energy Forum (COM(2014) 8 final 2014).
Table 9 gives an overview of upcoming tidal energy projects in Europe. Nine of the 31 projects are expected to become operational by the end of 2016, whilst the majority are still in planning or development.
2.4 Economic aspects and Cost Components
A key aspect in the evaluation of the performance of tidal energy technologies is how they compare against other renewable energy sources (RESs) and conventional energy sources. The long-term aim for tidal energy is to provide a significant share of the future European energy supply by becoming cost competitive.
The JRC energy technology reference indicators (ETRIs) are parameters used to identify up-to-date cost and performance characteristics of the present and future European energy technology portfolio. With regards to tidal energy, they provide both techno-economic data projections for the modelling community and policy makers (including capital and operating costs), and a useful tool for policy makers to help identify future priorities for research, devel-
Name Capacity (mW) Status project developer
Bluemull Sound 0.5 In planning Nova Innovation Ltd
Brough Ness 100 In planning Sea Generation (Brough Ness) Ltd
Cantick head 200 In planning Cantick head Tidal Development Ltd
Esk Estuary 0.6 In planning GlaxoSmithkline Montrose plc
Inner Sound (MeyGen) 392 In planning MeyGen Ltd
Isle of Islay 30 In planning DP Marine Energy Ltd
kyle Rhea 8 In planning Sea Generation (kyle Rhea) Limited
Mull of kintyre 3 In planning Argyll Tidal Ltd
Ness of Duncansby 100 In planning ScottishPower Renewables Uk Ltd
Sanda Sound 0.035 In planning Oceanflow Development Ltd
Sound of Islay 10 In planning ScottishPower Renewables Uk Ltd
St David’s head 10 In planning Tidal Energy Developments South Ltd
Westray South 200 In planning Westray South Tidal Development Ltd
Afsluitdijk 3 In development Tocardo, Tidal Test Centre
Fair head 100 In development DP Marine Energy & DEME Blue Energy
Lashy Sound 30 In development Scotrenewables Tidal Power
Nepthyd 5.6 In development Alstom/GDF Suez
Normandie hydro 14 In development Openhydro/DCNS/EDF/ADEME
Perpetuus Tidal Energy Centre 20 In development Isle of Wight Council
Ramsey Sound 1.2 In development Tidal Energy Limited
Fromveur 1 In development Sabella/IFREMER/veolia Environnement/Bureau véritas
Norway 2 In development Flumill
Raz Blanchard 12 In development GDF Suez/voith hydro/CMN/Cofely Endel/ACE
Inner Sound (Meygen) 6 In construction MeyGen Ltd
Strangford Lough (Minesto 2) 0.003 In construction Minesto AB
EMEC Shapinsay Sound n.a. Nursery facilities European Marine Energy Centre Ltd
Lynmouth 1.6 Interrupted Pulse Tidal Ltd
Skerries, Anglesey 10 Interrupted Sea Generation Ltd
EMEC Fall of Warness 10 Operational European Marine Energy Centre Ltd
Ness of Cullivoe 0.03 Operational Nova Innovation Ltd
Strangford Lough (Minesto 1) 0.003 Operational Minesto AB
Strangford Lough (SeaGen) 1.2 Operational Sea Generation Ltd
Sources: The Crown Estate 2014; France Energies Marines 2014
Projects expected to become operational by the end of 2016 Projects of uncertain status Interrupted projects
Table 9: Leased tidal energy projects in Europe

29
opment and demonstration (RD&D). In the context of leading the Strategic Energy Technologies Information System (SETIS), the JRC has identified ETRIs for different current and future energy tech-nologies (ETRI 2014). It shall be noted that, given the pre-commercial stage of tidal energy, the ETRIs are projections based on existing literature containing considerable uncertainties.
In the following subsections, an overview of the tidal energy cost components, future costs predic-tions and estimates of the levelised cost of energy (LCOE) are given.
2.4.1 CapEX and cost components
Through a review of the existing data available, the different cost components to be included in the capital expenditure (CAPEx) estimate for tidal energy have been identified as follows:
• Civilandstructuralcosts• Majorequipmentcosts• Balanceofplantcosts• ElectricalandI&Csupplyandinstallation• Projectindirectcosts• Developmentcosts.
An overview of the CAPEx breakdown is presented in Figure 11. The identification of cost components is essential to help identify strategies for cost reduc-tions through concerted effort, increased supply chain pooling, and increased efficiency and reli-ability at subcomponent level. Main CAPEx compo-nents are mechanical equipment costs, followed by civil and structural costs.
2.4.2 future power ratings
The future power ratings of tidal energy plants are very uncertain; hence, ranges are given. It should be noted that most of the current literature provides cost information for 10 MW arrays once 10 MW of existing capacity is already in place. Thus, it is likely that initial costs may be higher. For this reason, the upper limits of current CAPEx estimates are used in the near term, whilst long-term estimates align with future predictions. An overview of techno-economic data of current and future projections is presented in Table 10.
2.4.3 LCOE predictions
The LCOE provides a further parameter for compar-
31 %
46 %
7 %
16 %
Civil and structural Mechanical equipment Electrical and I&C Project indirect
Fig. 11: CAPEX breakdown for tidal power. Source: ETRI 2014
Unit 2010 2020 2030 2040 2050
technical Net electrical power a MWe 10 10–20 20–30 30–40 50–400
Max. capacity factor % 36 45 47 47 50
Avg. capacity factor % 34 37 40 42 45
Technical lifetime years 20 20 20 20 20
Costs CAPEx ref. EUR2013/kWe 10700 4400 3400 2100 1900
CAPEx low EUR2013/kWe 9300 3600 3000 1800 1700
CAPEx high EUR2013/kWe 12300 5500 3100 2800 2500
Quality of CAPEx estimate Low
CAPEx learning rate % 12 12 12 12 12
FOM % of CAPEx ref. 3.4 3.6 3.8 4.3 4.9
Evolution Max. potential GWe 0.04 0.4 2.9 3.1 10
a Current estimates for tidal energy plants focus on the development of 10 MW arrays; however, projects of up to 400MW have been announced, but no clear timescale is currently available. Source: ETRI 2014
Table 10: Techno-economic data for tidal energy

30
ison of renewable energy sources against conven-tional energy sources. The LCOE gives a projection of the cost of electricity from a tidal energy farm over its lifespan, against the expected annual energy production (AEP). LCOE is therefore influ-enced by the performance of the technology and by all the expenditures necessary to develop, construct and maintain a project.
Figure 12 presents LCOE predictions for tidal energy technology. LCOE was calculated using the ETRI parameters data, as reported in Table 10 (ETRI 2014), taking into account a 12 % CAPEx learning rate, as experienced by other offshore energy technologies. The reference LCOE associated with tidal energy currently ranges between 50 c EUR/kWh and 65 c EUR/kWh. Taking a value of 10–15 c EUR/kWh as the LCOE benchmark for mature RESs, it is possible to see that reference tidal technologies could achieve commercial competitiveness once approximately 1.5–5 GW of cumulative capacity have been installed, in line with the findings of SI Ocean (SI Ocean 2013b). Lower LCOE could be achieved in the best-case scenario, in which the technology is installed in high resource areas with high operational capacity factors and low capital expenditure.
The convergence of tidal LCOE estimates towards competitive values depends on the operational conditions, since a good resource will allow for low LCOE. In addition, a concerted effort by the sector is needed to overcome existing barriers that are currently hindering its development, such as:
• Technology demonstration and performance:the industry should drive towards enhancing the performance of single and array installations, aiming to provide reliable, cost-competitive tech-nologies.
• Increased design consensus and upscaling:unlocking the possibility of cost reduction through economies of scale and broader engagement with supply chains.
The sector is showing that initiatives are being undertaken to further its development and estab-lish tidal energy as a reliable and economic energy technology in the European energy mix. Actions and activities that are currently being undertaken to facilitate the commercialisation of tidal and ocean energy technologies will be discussed in Chapter 5.
Capacity1248
163264
125250500
100025005000
10000
0,00,10,20,30,40,50,60,70,80,91,01,11,21,31,4
LCO
E [E
UR/
kWh]
Cumulative deployment [MW]
Poor resource Average resource Good resource Reference
Fig. 12: LCOE predictions for tidal arrays. Source: JRC, based on ETRI 2014

31
3 WavE ENERgy
Wave energy presents the form of ocean energy with the highest deployment potential in European waters, associated with a global potential 30 times higher than that of tidal energy. The potential market for wave energy has attracted the interest of researchers since the early nineteenth century; however, it is only since the 1970s that consider-able R&D efforts have been dedicated to developing viable and reliable wave energy converters (WECs).
In many instances wave and tidal energy have been taken into consideration jointly; however, their development paths and operating principles have little in common. Whilst TECs present many simi-larities to wind turbines, different types of WEC have been proposed over the years, differentiated mainly by the way the devices would react to the force exerted by waves. The majority of proposed devices have been designed to generate electricity; however, a limited numbers of concepts have been developed for desalination purposes. Within the scope of this report, focus will be primarily given to electricity-generating technologies.
The abundance of wave energy resources world-wide, which is significant at latitudes greater than 30°, has prompted a widespread interest in the development of wave energy technologies. In Europe, the most resourceful areas can be found across the Atlantic Arc, the stretch of coastline facing the Atlantic Ocean. Other areas, such as the North and Mediterranean seas, offer limited resources compared to the Atlantic Ocean, but with a potential for future developments. The JRC has identified ten countries in Europe with an active interest in developing wave energy technologies (Corsatea & Magagna 2013): the United kingdom, Ireland, France, Spain, Portugal, Sweden, Denmark, Italy, Finland and Norway.
Similarly to tidal technologies, wave energy has not yet reached the level of technical maturity to ensure penetration in the energy market. Current develop-ment appears to be slower in comparison to TECs; however, some technologies are already progressing towards the installation of multiple-device arrays. Wave energy technologies are primed to reach commercial breakout within the next decade, to deliver a further option in the creation of a sustain-able energy system and to provide increased energy security for Europe.
3.1 technology Status
Many different concepts of WEC have been devel-oped since the 1970s, offering a wide variety of designs, energy extraction systems and applications. Accordingly, classification of wave technologies has evolved to encompass new developments and prog-ress in the sector. For clarity and consistence, the EMEC classification is used in this report, in which devices are classified by their operating principle. however, it is important to note that the location at which a device is meant to operate (offshore, near-shore and onshore environments) places a strong emphasis on how a WEC is classified, as well as on the type of structure and foundation that may be required.
In terms of research effort, there is currently no leading category of wave energy device. A review of R&D efforts according to device type is presented in Figure 13, indicating that the bulk of research revolves around point absorbers, attenuators and oscillating wave surge converters (OWSCs). The lack of convergence in terms of design of wave energy converters has already been highlighted as one of the main barriers currently hindering the devel-opment of the sector (MacGillivray et al. 2013). The development of wave energy conversion has followed a different pattern compared to that of tidal energy, and has not benefited from technology and knowledge transfer from wind energy.
Wave energy developers have focussed on designing WECs that could harness directly the most powerful resources offshore, adding further complexity to the design challenges of a reliable wave energy conver-sion device. IRENA has shown that 64 % of WECs have been designed for offshore operation and 36 % for near-shore and onshore operation (IRENA 2014b). however, despite a number of wave energy facilities being developed to facilitate demonstration testing of WECs, no installation has currently taken place further than 5 km from shore and in water depths of more than 75 m (Corsatea & Magagna 2013).
Of the various types of wave energy converters, the OWC device is the oldest and also the one that has received most attention in the past. In Europe there are three onshore installations of OWC devices, accounting, however, for only 840 kW of installed capacity. Despite having being operational for over a decade, some of the sites were actually intended as test sites for the improvement of turbine designs and control strategies. Offshore or floating OWC devices have not achieved the same level of tech-nical maturity.

32
device type Class description
Attenuator A Attenuators exploit the incoming wave power to generate an oscillatory motion between adjacent structural components. The resulting motion activates the power take-off (PTO), either by pumping high-pressure fluids through a hydraulic motor or by operating a direct-drive generator. Attenuators are designed to operate offshore, and are commonly surface floating, although fully submerged devices have been proposed.
Point Absorber B Point absorbers are normally heaving/pitching devices that exploit the relative motion between an oscillating body and a fixed structure or component, which can be either moored to the seabed or installed on the seabed through a large foundation mass. Point absorbers are normally smaller in dimension compared to other WECs. They are non-directional devices, as their performances are not affected by wave directionality.
Oscillating Wave Surge Converter (OWSC)
C Oscillating wave surge converters exploit the surging motion of near-shore waves to induce the oscillatory motion of a flap in a horizontal direction. OWSCs are bottom-mounted devices, although prototypes of floating OWSC are already under development.
Oscillating Water Column (OWC)
D Oscillating water columns (OWC) use the oscillatory motion of a mass of water induced by a wave in a chamber to compress air to drive an air turbine. The water column thus acts as a piston on the air volume, pushing it through the turbine as the waves increase the water level in the chamber, and drawing it as the water level decreases. OWCs are one of the first types of wave energy converters developed, and different operational ones are installed onshore in self-contained structures. Floating OWCs have been tested and are currently under development for offshore deployment.
Overtopping E Overtopping devices or terminator WECs convert wave energy into potential energy. This is stored in a reservoir and used to drive low-head turbines. The design of overtopping devices facilitates waves breaking on a ramp to be collected in a reservoir above the free water surface. Water contained in the reservoir can produce energy by flowing through a low-head hydraulic turbine. Overtopping devices have been proposed to be built for integration in breakwaters, for self-contained onshore operation and for offshore installation.
Submerged Pressure Differential
F Submerged Pressure Differential devices are fully submerged devices, exploiting the hydro-dynamic pressure induced by waves to force an upward motion of the device, which then returns to its starting position once the pressure differential is reduced.
Bulge Wave G Bulge wave devices use wave-induced pressure to generate a bulge wave within a flexible tube. As the bulge wave travels within the device it increases in size and speed. The kinetic energy of the bulge is used to drive a turbine at the end of the tube.
Rotating Mass h Rotating mass converters exploit the relative motion of waves to induce pitching and rolling in a floating body, thus forcing the rotation of an eccentric mass contained within the device. As the mass rotates it drives an electrical generator.
Other I Novel wave energy devices currently under development that do not fit any of the above categories.
Sources: SI Ocean 2013a; EMEC 2014b
Table 11: Wave energy converters classification, according to EMEC 2014b
Other devices have reached and are currently in full-scale operational testing, such as the OWSC devices
Oyster, from Aquamarine Power, and Wave Roller, from AW-Energy; point absorbers Sea-tricity and Seabased; and Pelamis P2, an attenuator developed by Pelamis Wave Power. Some developers have been able to demonstrate the survivability of their tech-nologies by sustaining long operational hours, and current tests are focussing on identifying reliable components and improving performances. Pelamis recently announced it had exported 250 MWh to the grid (Pelamis 2014), whilst Oyster 800 has been installed at EMEC for over two years. Whilst devices have been tested in operational environments, they have not reached and shown the same level of tech-nological maturity as tidal devices. In contrast with the tidal energy sector, the wave energy industry has seen a number of OEMs pulling out of the sector, given mainly to the slow technical progress of the technologies. Despite a slowing trajectory, caused by the economic/financial crisis and technical chal-lenges, wave energy developers have, however, been able to deploy their devices in test conditions and to feed electricity to the grid.
40 %
23 %
19 %
7 %
1 %7 %
3 %
Point absorber Attenuator Oscillating wave surge Oscillating water column
Bulge wave Rotating mass
Fig. 13: Distribution of R&D efforts according to wave energy technology type. Source: JRC 2014
33
3.2 technology developments
The main hurdle for the wave energy industry is to prove the full reliability and operability of its devices in open waters. Bloomberg New Energy Finance has reduced the expected global installed capacity of wave energy to 21 MW by 2020, a drop of 72 % compared to 2013 forecasts (BNEF 2014). An increase of deployment rate is therefore expected in the period 2014 to 2020, in order to strengthen the position of wave energy as a secure source of renewable energy in a changing European energy market. There is the need for a paradigm shift in the sector, to ensure that the full potential of wave energy is harnessed. The wide variety in proposed technologies does not allow the same knowledge sharing and engagement with the supply chain that is currently being experienced by the tidal sector. Two different trends can, however, be witnessed in the sector: small-scale devices and increased collab-oration (SI Ocean 2013a), which will be discussed in the following sections.
3.2.1 Small-scale devices
Many current and first-generation WECs have been designed to operate in most resource-rich sites to exploit the higher energy density contained in waves. Many concepts developed have nominal power > 750kW, with some proposed designed, such as the Wave Dragon, rated at 7 MW (Cruz 2008). Operating in high-energy environments poses many questions with regards to the survivability of devices, since increased wave power corresponds to increased loads and extreme waves that need to be sustained by the machines. A number of wave energy developers have proposed the development of small-scale devices, offering a wide range of potentials benefits:
• Increasedsurvivability: low-rateddevicesdonotneed to operate in the most powerful resources to generate electricity. As a consequence, WECs sustain lower loads on the structures, which should increase their survivability during opera-tions.
• Smoother learning process: building small-scaledevices allows developers to reduce their risk in deployment at sea, and offers them the possibility to try and to test their devices before upscaling to higher power ratings. The risk and costs associ-ated with the deployment of demonstration WECs are high and could hinder the financial stability of wave energy developers (Renew Economy 2014).
• Maintenance: small-scale devices are associatedwith reduced maintenance, since they are designed to operate in farms and a defect to one unit may not affect the overall array performance, hence reducing the time necessary for maintenance.
Seabased A. B. and new entrants in the market, such as 40SouthEnergy and Albatern, have all started developing and testing small-scale devices. Seabased is currently developing the 10 MW Sotenas project and has already installed the first ten direct-drive generating units out of the 340 expected (Fortum 2014a).
The development of small-scale WECs could help the sector in reducing the risk associated with the demonstration phase of the technology; however, it is of paramount importance that the energy production and associated costs are viable. It has to be noted that often renewable energy developers aim to deploy first in locations with best resource conditions and lower costs (held et al. 2006), explaining the need for developing MW-scale devices. This approach, however, does not take into account technology learning and the corresponding reduction of investment costs that are essential for emerging renewable energy tech-nologies, and wave energy in particular.
3.2.2 increased collaboration
The wave energy sector currently presents a wide variety in the type of concepts developed, on how they operate and convert energy into electricity. As discussed earlier, the lack of design consensus has already been highlighted as one of the barriers that are currently hindering the sector’s develop-ment and engagement with the supply chain to find reliable and economic solutions. The sector is already employing and testing readily available components (Aquamarine Power 2014); however, a further step towards standardisation was recently announced when three different wave energy developers (Aquamarine Power, Albatern and Carnegie) joined forces with Bosch Rexroth for the development of a standardised wave energy power take-off (PTO), the WavePod (Bosch Rexroth 2014). The collaboration also includes academic institutes and energy utilities. The aim of the consortium is to solve collectively issues that are beyond the capability of single developers. A one-tenth- scale PTO is already under testing at Aachen University, and full-scale installation in water is expected for 2016.
3.2.3 Components and subcomponents
The variance of WEC designs does not allow for the identification of the structure of a general wave energy device, as for tidal energy technologies. There are great differences between device types in terms of materials employed, PTO systems and types of foundation. A more detailed look at existing wave energy prototypes provides further insight into how the wave energy sector is developing its tech-nologies. Regardless of type, each WEC comprises the following three elements:

34
• Aprimemover:astructural component reactingto the incoming wave power, activating a PTO or inducing the movement of other structural components.
• Mooringsorfoundations,accordingtothelocationand application of the device.
• Power take-off:singleormultiplePTOs thatcanbe embedded within the device or located on the seabed/shore.
In addition, power delivery components play a signif-icant role in the final structure of the device. These consist of either electrical components (cable and connectors) or hydraulic components (high-pressure pipes, valves and accumulators), depending on the WEC and PTO type.
3.2.3.1 prime mover, structure and application
The prime mover is the main component of a WEC, which interacts with waves for the conversion of wave energy into mechanical energy first, and then into electricity. Designs and shapes of prime mover vary substantially according to the type of WEC, as they are intended to maximise its hydro-dynamic efficiency and therefore power conversion, and according to the application of the device. For example, heaving point absorbers tend to be a small size in comparison to attenuators, overtopping or OWSC devices. A review of existing prototypes suggests that steel is the most employed material for wave energy device fabrication (Figure 14).
An important issue, in terms of survivability of the device, concerns the application of the device: offshore, near-shore and onshore, with offshore locations associated with more powerful sea states compared to near- and onshore installations. Requirements in terms survivability of device tend to increase as installations move further offshore, both in order to withstand rougher sea climates and to reduce maintenance operations. Most of the WECs currently under development are designed for offshore installation (Figure 15).
3.2.3.2 moorings and foundations
As a direct consequence of the offshore ambitions of the wave energy industry, the majority of the concepts developed will be anchored to the seabed by using mooring lines for floating WECs and foundation systems for bottom-standing devices (Figure 16).
Moorings play a key role in assuring the station-keeping of devices and in minimising the combined effects of wave and wind loads on devices, whilst allowing for movement in one or more direction for wave energy extraction (Weller et al. 2013). This latter requirement comprises the main difference between moorings for WECs and those for other conven-tional offshore applications (Weller et al. 2014), with existing guidelines, such as the DNv-OS-E301 ‘Position Mooring’, developed for the oil and gas sector, which are applied to ocean energy installation. Moorings and foundations constitute about 10 % of CAPEx for wave energy projects; thus identifying and optimising their structures would provide an avenue for cost reduction for the technology.
3.2.3.3 power take-off
A large variety of PTO has been developed for WECs. One of the key aspects of PTO and wave energy conversion is presented by the necessity of converting the irregular high-power, low-speed energy contained in waves to the requirements of the grid. A review
61 %17 %
13 %
9 %
Steel Concrete Composite Rubber
64 %
19 %
11 %
6 %
Offshore Nearshore Nearshore & Offshore Onshore
67 %
19 %
14 %
Floating Bottom standing Fully submerged
Fig. 14: Main material employed for WEC prime mover. Source: JRC 2014
Fig. 15: Wave energy applications. Source: IRENA 2014b
Fig. 16: Installation of WECs. Source: IRENA 2014b

35
of PTO systems has been presented by Cruz (2008), Drew et al. (2009), Lynn (2013) and by the MaRINET project (Grimwade et al. 2012). It is generally recognised that the development of a wave energy PTO is more challenging compared to TECs (Lynn 2013), given the wide variety of systems developed. It shall be noted that, in a few cases, wave energy converters have not been employed for the gener-ation of electricity but for desalination purposes, as proposed by Aquamarine Power and Carnegie. These cases will not be taken into account further within this report.
Five different classes of PTO have been employed for wave energy conversion (Figure 17):
• Turbines,includingairturbinesandhydraulicturbines
• Hydraulicsystems,includingaccumulators, piston motors and vane motors
• Lineargenerators:direct-drivegeneratorsthatexploit the generation of a magnetic field
• MechanicalPTOs• PneumaticPTOs.
The choice of the particular PTO is dependent on the type of WEC, and so are its dimensions. The relation between WEC and PTO is given in Table 12.
hydraulic systems represent the most common wave energy PTOs; a breakdown of the different types of PTO employed in wave energy is presented in Figure 18. Even within a single class of PTO the variation of systems and components employed is vast, and it is difficult to provide a more in-depth assessment of wave energy PTOs. A step towards the standardisation of PTOs has been made by the creation of the WavePod consortium, involving Bosch Rexroth and different wave energy devel-opers (Section 3.2.2).
Fig. 17: Wave energy conversion methods in electricity. Source: Grimwade et al. 2012, adapted
device type Class type of ptO
Attenuator A hydraulic circuit
Point Absorber B hydro turbine, hydraulic circuit, linear generator
OWSC C hydro turbine, hydraulic circuit
OWC D Air turbine
Overtopping E Low-head hydraulic turbine
Submerged Pressure Differential F hydraulic circuit, linear generator
Bulge Wave G hydro turbine, hydraulic circuit
Rotating Mass h Mechanical
Source: Grimwade et al. 2012
Table 12: Wave energy systems and related PTO
42 %
30 %
11 %
11 %
6 %
Hydraulic Direct drive Hydro Pneumatic Not specified
Fig. 18: PTO employed in wave energy conversion. Source: IRENA 2014b

36
3.2.3.4 Supply chain engagement
The large variety of WECs developed has often been identified as one of the main bottlenecks of the sector, limiting engagement with the supply chain and thus minimising cost reduction through econo-mies of scale or mass manufacturing. An overview of how wave energy developers have engaged with the supply chain is presented in
Table 13. The availability of suppliers’ information is limited compared to the tidal case. however, it is possible to see that key OEMs are still engaging with the wave energy industry to develop and adapt engineering solutions for wave energy.
Company fabrication ptO & generator
Electrical & automation
bearings marine Operations
Hydraulic Components
Certification Coating diagnostic
40South Energy ABB
Albatern Zeus Engineering, Purepipe
Bosch Rexroth Mallaig Marine
Mallaig Marine
Aquamarine Power
Burntisland Fabrications
Bosch Rexroth ABB hutchinson Fugro Seacore
hunger hydraulics
DNv GL BAE Systems
AW Energy Metso DNv GL, Lloyds Register
hempel
Carnegie Bosch Rexroth hutchinson
Fred Olsen Ltd A&P Falmouth, Supacat
Siemens SeaRoc DNv GL
Langlee Wave Power
Repnaval DNv GL
Pelamis Wave Power
Barnshaws kTR Couplings Schaeffler
Seatricity A&P Falmouth
Wave Star Energy
Wello Oy Riga Shipyard The Switch veo Schaeffler hydac, Seaproof Systems
Table 13: Identified suppliers for WECs according to component and service
3.3 market and European Leadership
3.3.1 global development
A large number of developers have invested in wave energy R&D. In 2011, over 100 wave energy devel-opers were identified (Magagna 2011), and currently EMEC lists 170 wave energy developers worldwide (EMEC 2014b). About 45% of wave energy devel-opers are based or are currently developing projects in the EU, which is at the forefront of wave energy development and also hosts the majority of wave energy infrastructure. The numbers give an idea both of the global effort in developing reliable wave energy technologies as well as the variety of designs proposed, although it shall be noted that only a few of them have reached scale or prototype testing.
EU45 %
Non-EU55 %
United Kingdom Denmark Spain Ireland Sweden France Germany Finland Portugal Belgium Greece Italy Slovenia Norway Brazil Chile Hong Kong Korea Lebanon Mauritius New Zealand Singapore Turkey Japan India China Iceland Canada Russia Australia United States Fig. 19: Distribution of wave
companies in the world. Source: EMEC 2014b

37
Company Name model Operational testing
Country Website
40South Energy R115, y series, D series Full-scale Italy/Uk www.40southenergy.com
Albatern SQUID Part-scale Uk http://albatern.co.uk/
AquaGen Technologies SurgeDrive Small-scale Australia www.aquagen.com.au
Aquamarine Power Oyster Full-scale Uk www.aquamarinepower.com
Atargis Energy Small-scale USA www.atargis.com
AW Energy WaveRoller Full-scale Finland www.aw-energy.com
AWS Ocean Energy AWS-III, Archimedes Wave Swing
Full-scale Uk www.awsocean.com
BioPower Systems Pty Ltd bioWave Small-scale Australia www.biopowersystems.com
Bombora WavePower Bombora WEC Small-scale Australia http://www.bomborawavepower.com.au/
Carnegie Wave Energy Ltd CETO Full-scale Australia www.carnegiewave.com
Columbia Power Technologies Manta, SeaRay Part-scale USA www.columbiapwr.com
COPPE Subsea Technology Laboratory
Part-scale Brazil www.coppenario20.coppe.ufrj.br/ ?p=805
DexaWave A/S DexaWave Small-scale Denmark www.dexawave.com
Eco Wave Power Wave Clapper, Power Wing
Part-scale Israel www.ecowavepower.com
Floating Power Plant AS Part-scale Denmark www.floatingpowerplant.com
Fred Olsen Ltd FO3, Bolt, Bolt 2 Lifesaver
Full-scale Norway www.fredolsen-renewables.com
Intentium AS ISWEC, IOWEC Full-scale Norway http://www.intentium.com/
kymaner kymanos Part-scale Portugal http://www.kymaner.com/
Langlee Wave Power Rubusto Full-scale Norway www.langlee.no
LEANCON Wave Energy MAWEC Small-scale Denmark http://www.leancon.com/
Neptune Wave Power Neptune WECD Part-scale USA http://www.neptunewavepower.com/
Ocean Energy Ltd OEBuoy Part-scale Ireland www.oceanenergy.ie
Ocean harvesting Technologies Full-scale Sweden http://www.oceanharvesting.com/
Ocean Power Technologies PowerBuoy Full-scale USA www.oceanpowertechnologies.com
Oceantec Oceantec WEC Small-scale Spain www.oceantecenergy.com
Offshore Wave Energy Ltd (OWEL)
OWEL WEC Small-scale Uk www.owel.co.uk
Oscilla Power Wave Energy harvester
Small-scale USA www.oscillapower.com
Pelamis Wave Power a Pelamis Full-scale Uk www.pelamiswave.com
Perpetuwave Wave harvester Part-scale Australia http://www.perpetuwavepower.com/
Pico Plant EU Consortium Pico Plant OWC Full-scale
RESEN Waves LOPF Buoy Small-scale Denmark http://www.resen.dk/resen_standard.asp?pageid=120
Resolute Marine Energy Inc. SurgeWEC Full-scale USA www.resolute-marine-energy.com
SDE Energy Sea Wave Power Plants
Full-scale Israel http://www.sdeglobal.com/
Seabased AB Seabased Full-scale Sweden www.seabased.com
Seatricity Oceanus Full-scale Uk www.seatricity.net
Spindrift Energy Spindrift Small-scale USA http://www.spindriftenergy.com/
Trident Energy Ltd PowerPod Full-scale Uk www.tridentenergy.co.uk
voith hydro Wavegen Limpet OWC, Mutriku OWC
Full-scale
Wave Dragon Wave Dragon Part-scale Denmark http://www.wavedragon.net/
Wave Energy Technology New Zealand (WET-NZ) b
WET-NZ Part-scale New Zealand
www.waveenergy.co.nz
WaveRider Energy WaveRider Platform Part-scale Australia www.waveriderenergy.com.au
WaveStar Energy WaveStar Part-scale Denmark www.wavestarenergy.com
Wedge Global Part-scale Spain www.wedgeglobal.com
Wello Oy Penguin Full-scale Finland www.wello.fi
WePTO WePTO WEC Part-scale Denmark www.weptos.coma Pelamis filed for administration in November 2014 b WET-NZ sold its technology to a US-based company in 2014
Companies shortlisted by IRENA
Table 14: Shortlist of wave developers identified by JRC

38
The JRC has identified 45 wave energy companies that have reached or are about to reach open-sea deployment of their technologies (Table 14).
Most R&D dedicated to wave energy takes place in Europe, with the US and Australia also proving fertile grounds for the development of wave energy tech-nologies. As the sector moves towards commerciali-sation, there is a growing interest in developing wave energy technologies in countries that do not show a strong R&D component, such as Chile, which is investing in the development of ocean energy infra-structure (Whitlock 2014). An overview of the current global development is presented in Figure 20.
The global installed capacity of wave energy remains low, even compared to tidal energy. Most leading wave technologies are still at an advanced R&D stage, and only a few machines have sustained long operational hours, such as the Aquamarine Oyster (> 20000 h) and Pelamis (cumulative > 10 000 h) (Scottish Renewables 2014), or sustained operation in rough wave conditions, such as Wello Oy with waves greater than 12 m. Most of the developers are currently looking at improving the design and performances of their devices before progressing to array deployment. Even Carnegie, currently deliv-ering the first commercial array off the coast of Western Australia, is upgrading its CETO5 240 kW device to the 1 MW-rated CETO6 (herbert 2014).
The wave energy industry has seen some OEMs and utilities pull out of the sector, whilst others have rein-forced their stakes. IRENA has highlighted the role of OEMs, which will be necessary for the develop-ment of utility-scale projects (IRENA 2014b). Bosch Rexroth has entered a collaborative agreement with different developers (Section 3.2.2); ABB is a
major stakeholder in Aquamarine Power (Corsatea & Magagna 2013); and DNCS in AW-Energy. Fortum currently holds a 13.6 % stake in Wello Oy, 8.6 % in AW-Energy, and has invested in the Seabased Sotenas Project, which is currently under construc-tion (Fortum 2014a; Fortum 2014b; Fortum 2014c).
On the other hand, however, voith hydro stopped Wavegen to focus on tidal development, although its installations in Limpet and Mutriku are still in operation. Alstom has halted its wave energy R&D activities, while E.On abandoned its partnership with Pelamis. Pelamis has since struggled to attract major investment and filed for administration in November 2014 (Renewable Energy Focus 2014). In December, Aquamarine Power announced plans to downsize the company, whilst trying to keep its devices in operation at EMEC (BBC 2014a).
Recent announcements may affect the confidence of investors in the sector, whose growth is slower than expected. Wave energy technologies and markets still have much to prove on their path to commercial viability. Success in attracting future OEM investments will be dependent on the success of developers in improving performances, reducing costs and validating wave energy technologies.
3.3.2 aiding development and deployment
The potential of wave energy has catalysed the interest of many countries that could exploit wave energy as a secure source of electricity in the future. In many instances, to facilitate the development of wave energy technologies, a number of dedi-cated test centres have been developed with the purpose of testing and demonstrating wave energy converters operating either stand-alone or in array
Fig. 20: Wave energy network. Purple markers: developers' headquarters; red markers: test sites and demonstration sites under development

39
configuration, with the addition of demonstration sites such as the Pico Power Plant in the Azores and Limpet in Scotland.
Europe alone accounts for 13 dedicated test sites developed or partially funded by local governments (SOWFIA 2011). however, many of these sites have not seen the installation of any devices, with most of wave energy deployments that have taken place thus far limited to a few locations. The majority of the installation so far has taken place within 10 km from the shore, contrasting with industry’s hopes to develop WECs for offshore application (Section 3.2.3.1). For example, the Wave hub, a wave energy test centre in the Southwest of the Uk, was devel-oped for wave energy array demonstration and to be the natural landing spot for developers who success-fully conclude single WEC testing at EMEC. Despite being ready for device deployment since 2010, the Wave hub has seen only the first installation of a WEC device, the Oceanus from Seatricity, in the summer of 2014 (BBC 2014b), after a number of announce-ments that have not materialised. It is important to highlight that the installation of the two Oceanus devices, which will be connected to the grid in 2015 after a year of monitoring, represents the most distant installation of a WEC from shore, and will provide developers and the wider industry an over-view with regards to maintenance and survivability of the devices. Further installations are expected at the Wave hub, as both Wello Oy and Carnegie have announced plans for deployment there (herbert 2014). An overview of the infrastructure currently available in Europe is presented in Figure 21.
Funding mechanisms have also been developed in order to facilitate the deployment of single devices and of first-of-a kind array demonstrations. In some cases the funding mechanisms are the same as those developed for tidal energy, such as NER 300 or MEAD, with other specific funds made available for wave energy.
For example, in the Uk, to facilitate wave energy development, the Scottish Government has devel-
oped the Marine Renewables Commercialisation Fund (MRCF) – Wave First Array Support Programme. The fund was made available when it was clear the leading wave energy technologies would not have been able to meet the requirements for MEAD funding. The aim of the Wave First Array Support Programme is to fund projects that will help wave energy technology to progress towards commer-cialisation, thus to ensure that wave demonstration arrays can be delivered in the 2016 to 2018 time period (Carbon Trust 2014). The necessity of specific funds to aid the uptake of wave energy technologies highlights how, currently, wave energy lags behind tidal in terms of maturity.
The West Wave project, a 5MW wave energy project off the west coast of Ireland, was awarded NER 300 funding in 2013. however, the project was with-drawn in early 2014 when it became clear that it could have not been completed with existing tech-nologies by 2016. ESB International resubmitted an enhanced version of the West Wave project for a second NER 300 call, which was then awarded 23 m EUR. Similarly, the Swell project, a 5.6 MW wave energy array project off the coast of Portugal, was not awarded funds through the first NER 300 call but received 9.1 m EUR funding in the second call. The timely delivery of demonstration projects and the completion of the NER 300 projects will be funda-mental to shaping the future market and inward investment for the wave energy industry in Europe.
Australia and the United States have both put in place mechanism to facilitate research, develop-ment and demonstration (RD&D) for wave energy projects. In 2013, the US Department of Energy (DOE) put in place the Marine hydrokinetic System Performance Advancement, aimed at addressing PTO, control and structural design issues for wave energy converters (US DOE 2014). In Australia, the Australian Renewable Energy Agency (ARENA) has awarded over 110 m AUD in RD&D funds for wave energy. ARENA has also developed a series of guide-lines to identify the risk for renewable technologies moving towards commercialisation (ARENA 2014a).
-2
0
2
4
6
8
10
12
14
16
18
0 25 50 75 100 125
Dis
tanc
e fr
om s
hore
[km
]
Water depth [m]
Denmark Norway Spain Ireland Portugal France UK Sweden NER300
Fig. 21: Wave infrastructure in Europe. The size of the bubble refers to the capacity of installed project (filled circle) or the maximum site capacity (hollow circle)

40
project Name Location Capacity funding awarded
funding body Expected Operation date
Status and Updates
Development projects
Pelamis & Aquamarine Power
Scotland N/A 13 m GBP MCRF Wave First Array Support Programme
N/A Support for Device Development and Proving and Site Development Fast Track, aimed at accelerating the development and proving of the core device technology alongside the site development work necessary to progress towards first wave demonstration arrays in Scottish waters.
EMEC, Green Theme, Tension Technology International
Scotland N/A 4.8 m GBP MRCF N/A EMEC to implement a seabed monitoring pod. Green Theme to develop a cable-mounted device, aiding cable installation in fast flowing conditions.Tension Technology International to design a novel mooring system.
Mhk System Performance Advancement
USA (Federal) N/A 13 m USD US DOE In progress Advanced R&D fund for PTO and structure optimisation and advanced WEC control
Deployment projects
West Wave Co. Clare, Ireland 5 MW 23.3 m EUR NER 300/EU 30/06/2018 West Wave shortlisted Pelamis Wave Power and AW-Energy as potential technologies for installation.
Swell Peniche, Portugal 5.6 MW 9.1 m EUR NER 300/EU 01/01/2018 The project will receive upfront funding of 5.5m EUR on 01/01/2016.
Perth Wave Energy Project (Carnegie)
Perth, Australia 1 MW (up to 2 MW)
22.4 m AUD ARENA, Western Australia Government
Construction completed
The Perth wave energy project may become the first wave energy array to become commercial, comprising four CETO5 devices and expected by the end of 2014. Offshore construction is completed and device assembly has begun.
Carnegie CETO6 Garden Island, Australia
3 MW 13 m AUD ARENA Announced Arena awarded funds to Carnegie in June 2014. The total project value is of 46 m AUD.
BioPower Wave Port Fairy, Australia
0.25 MW 5.6 m AUD ARENA Under development
Demonstration funds aim at installation of the pilot bioWave in 2015.
Oceanlinx victoria, Australia 1 MW 3.9 m AUD ARENA Closed 20/06/2014
Structural failures to the Ocealinx device whilst it was towed to location.
victorian Wave Power Station
Ocean Power Technologies (OPT)
19 MW 66.5 m AUD ARENA Closed 08/08/2014
OPT closed the project announcing that it was economically unviable.
Test Centres
Atlantic Marine Energy Test Site (AMETS)
Belmullet, Ireland 20 MW 24 m EUR Sustainable Energy Authority of Ireland (SEAI)
T.B.A. A decision for foreshore lease application submitted in December 2011 was expected during early 2014.
Biscay Marine Energy Platform (BIMEP)
Armintza, Spain 20MW 20 m EUR (infrastructure)
Ente vasco de la Energía (EvE), Spanish Energy Agency
Operational The site was grid connected in 2014, and is currently operational.
EMEC Orkney, Uk Six grid-connected berths
36 m GBP Scottish Government, highlands and Islands Enterprise, The Carbon Trust, Uk Government, Scottish Enterprise, Orkney Islands Council.
Operational Aquamarine Power, Pelamis, Wello and Seatricity are among the wave energy developers that have tested at EMEC.
Ocean Plug Leira, Portugal 80 MW (up to 250 MW)
N/A Redes Energéticas Nacionais (REN)
In progress Development of the Pilot Zone to receive, in pre-commercial and proof of concept stages, generators of electricity (based on wave energy devices).
Oceanic Platform of the Canary Islands (PLOCAN)
Canary Islands, Spain
10 MW (up to 100 MW)
N/A Spanish Government, Regional Government of the Canary Islands.
Operational
Site d’Expérimentation en Mer pour la Récupération de l'Energie des vagues (SEM-REv)
Le Croisic, France 8 MW 13.26 m EUR Ecole Centrale de Nante, Pays de la Loire, Loire-Atlantique
Operational
Wave hub hayle, Uk 20MW 42 m GBP DECC, Southwest Regional Development Agency
Operational Seatricity installed the first two Oceanus2 devices in summer 2014.
Interrupted projects Sources: SOWFIA 2011; Carbon Trust 2014; US DOE 2014; ARENA 2014b
Table 15: Wave energy development and deployment projects receiving EU or national support. Australian and US flagship projects are also included

41
By introducing the Commercial Readiness Index (CRI), a series of indicators to define the maturity of tech-nology at higher TRLs and entering the demonstra-tion phase, ARENA has tried to identify a system that would allow the reduction of risk for developers and funders in investing in emerging energy technologies, whilst developing specific funding mechanisms for the various stages of the technology development chain. The use of such instruments may prove useful in identifying the correct support scheme for wave and tidal energy. An overview of support schemes for wave energy is presented inTable 15.
In November 2014, The Scottish Government launched the Wave Energy Scotland Agency to coordinate and facilitate the development of wave energy in Scotland, which had significantly slowed down, and to ensure that wave energy intellectual property (IP) is maintained and further fostered. The aim would be to ensure that a least one wave energy technology reaches commercialisation by 2020–2025 (The Scottish Government 2014).
3.3.3 future development
The wave energy industry is dedicating increased effort to improving current technologies, to identify and ensure long-term reliability and survivability of
project Name device Capacity type Expected Completion date
Updates
Western Australia Carnegie CETO5 0.72 MW Demo array 2014 The project is currently under construction, with the first device having started operations (ReNews 2014b).
EMEC – Oyster Oyster 801 0.8 MW (up to 1.6 MW)
Single device/ Demo array
2015 Oyster 801 represents an improvement on the existing Oyster 800, deployed currently at EMEC. The two devices will be installed closely and connected to the same power station. Oyster 802 will be also installed, with the total array capacity expected to be 2.4 MW once completed. Oyster 800 underwent significant upgrades in summer 2014.
Sotenas Seabased 10 MW Array 2016 The construction of the array is currently underway with the first 10 devices out of a total of 340 already installed.
Wave hub Seatricity Oceanus
10 MW Demo array 2016 The first Oceanus device was installed at Wave hub in June 2014. Electricity generation will begin in 2015. Seatricity aims to deploy 60 devices at Wave hub to a total of 10 MW. Oceanus devices are being fabricated in Falmouth.
Garden Island Carnegie CETO6 3 MW Demo array 2016 Carnegie is currently upgrading its CETO5 technology from 204kW to 1MW, and is expected to install in Garden Island in 2016.
Swell Wave Roller 5.6 MW Demo array 01/01/2018 16 Wave Roller devices should be installed off the coast of Peniche. The project has received NER 300 funds.
Wave hub Carnegie CETO6 3 MW Demo array N/A Carnegie was awarded a berth at Wave hub in June 2014. They plan a 3 MW installation of its CETO6 devices, with an option to expand up to 10 MW. The development of the project is to be carried out in parallel with the Garden Island 3MW demo array.
Wave hub Wello Oy Penguin 5 MW Single device N/A In February 2014 Fortum signed a lease with Wave hub for a berth. It later announced that it would be used for testing the upscaled version of the Penguin device, developed by Wello.
West Wave Wave Roller Pelamis Oyster
5MW Demo array 30/06/2018 In September 2014 it was announced that Wave Roller and Pelamis were shortlisted as the wave energy technologies to be deployed at the site.
Canary Islands Langlee Robusto 0.5 MW Demo array N/A Langlee has announced plans for the construction of devices in the Canary Islands and is also pushing forward testing and potential development in the Canary Islands, including a 500kW array.
Table 16: Upcoming wave energy demonstration projects
devices, and to close the gap with other renewable energy technologies. Technology development and deployment will be of paramount importance to define the role of wave energy in the EU and global future energy markets. Since 2009 more than 100 projects have been announced in Europe alone, for a total installed capacity of 1200 MW; however, projects with a total of 770 MW have already been shelved, mainly due to economic uncertainties and the early stage of technology development (Figure 22).
Nevertheless technology and project developers are planning to develop arrays and commercial proj-ects, although the bulk of expected deployments in the near future will consist mainly of single units and array demonstration projects. An overview of demonstration projects is presented Table 16.
0
5000
10000
15000
20000
25000
30000
35000
2012 2013 2014 2015 2016 2017 2018
Inst
alle
d ca
paci
ty [k
W] Annual installation Cumulative capacity
Fig. 22: Expected wave developments until 2018

42
A total of 45 MW of wave energy demonstration proj-ects could be in the pipeline between now and 2020; however, the above target may reflect the ambitions of wave energy developers and is strongly depen-dent on technology performance and on securing the financial support to develop the projects.
The current situation, however, indicates that a more cautionary approach is needed, both in terms of deployment targets and technology readiness, placing strong emphasis on deployment goals that may help attract further investments. however, it is only through the demonstration of a reliable tech-nology that the sector will be able to take off.
A more conservative estimate of the projects presented in Table 16 would see an expected capacity of 25.9 MW by the end of the decade, if projects that have already received funds go ahead, comparable to the forecast announced by BNEF (2014). In this case, deployments such as the Seatricity installations at Wave hub are seen more as advance testing phases, and will be only connected to the grid in 2015. It is reasonable to expect that their expansion up to 10 MW of installed capacity will be dependent on the success of the current deployment phase.
The market for wave energy is poised to grow and mature in the near future, as project developers are acquiring leases for the deployment of wave energy farms, often jointly with technology developers and utilities. In the Uk, The Crown Estate has already agreed to the lease of six wave energy demonstra-tion zones and to 12 commercial project leases for a maximum potential of 650 MW.3 Support activities aimed at preparing the future market and removing non-technological barriers for wave energy are taking place, addressing legislative, environmental and licensing barriers. These issues are cross-sec-toral and can offer opportunities for knowledge transfer, with concerted efforts to identify optimal solutions. In response, EU funds have been directed to address wave energy-specific non-technological barriers such as the WavePlam and SOWFIA proj-ects. Both projects were funded by the Intelligent Energy Europe (IEE) programme, which was not aimed at R&D but at building capacity for energy technologies.
Preparatory work is currently underway to ensure that policy, licensing and financial tools will be ready to support the growth of the wave energy market, once the technology is ready to play a significant role in the integrated European energy system. however, if Europe is to take advantage of the potential benefits associated with wave energy, policy mechanisms should focus on facilitating technology research, development and demonstra-tion at full scale, to unlock the development of early pre-commercial arrays and the establishment of a wave energy market (Magagna et al. 2014).
3.4 Economic aspects and Cost Components
The long-term goal for wave energy is to become cost competitive and to provide an alternative to other RESs and conventional energy sources as a reliable energy technology feeding to the European Energy system. The following paragraphs present the ETRI parameters that the JRC has identified for different current and future wave energy technologies (ETRI 2014). It shall be highlighted that given the nascent stage of wave energy technology, the reported values for ETRIs are estimates retrieved from existing litera-ture and expert judgement. As such, these estimates contain considerable uncertainties. Many factors affect these values as the technologies mature, in terms of both economic and technical performance.
In the following subsections, an overview of the wave energy cost components, future costs predic-tions and estimates of the levelised cost of energy (LCOE) are given.
3.4.1 CapEX and cost components
Through a review of the existing data available, the different cost components to be included in the CAPEx estimate for wave energy have been identi-fied as follows:
• Civilandstructuralcosts• Majorequipmentcosts• Balanceofplantcosts• ElectricalandI&Csupplyandinstallation• Projectindirectcosts• Developmentcosts.
An overview of the CAPEx breakdown is presented in Figure 23. The identification of cost components is essential to help identify strategies for cost reduc-
3 This excludes leases awarded to E.On, since it has discontinued its wave energy activities
38 %
42 %
8 %
7 %5 %
Civil and structural Mechanical equipment Electrical and I&C Project indirect Owner's cost
Fig. 23: CAPEX breakdown for wave power. Source: ETRI 2014

43
tions through concerted effort, increased supply chain pooling, and increased efficiency and reliability at the subcomponent level. Similar to tidal energy, the main components of CAPEx are mechanical equipment costs, followed by civil and structural costs.
3.4.2 future power ratings
The future power ratings of wave energy are highly uncertain; hence, a range is given up to 2050. It should be noted that most of the current literature provides cost information for 10 MW arrays once 10 MW of existing capacity is already in place. Thus, it is likely that the current CAPEx and cost may be higher than that publicly available. For this reason, the upper limit for current CAPEx estimates are used in the near term, while long-term estimates align with future predictions. An overview of techno-economic data of current and future projections is presented in Table 17.
3.4.3 LCOE predictions
Figure 24 presents LCOE predictions for wave
energy technology. LCOE was calculated using the ETRI parameters data as reported in Table 17 (ETRI 2014), taking into account a 12% CAPEx learning rate. The reference LCOE associated with wave energy currently ranges between 70 c EUR/kWh and 105c EUR/kWh. It can be expected that wave energy technologies could become competi-tive once approximately 2.5–10 GW of cumulative capacity has been installed, using 10 c EUR/kWh as the reference LCOE for mature RESs, in line with the findings of SI Ocean (SI Ocean 2013b). The conver-gence of wave energy to given LCOE depends not only on resource availability but also on the ability of the sector to identify common solutions and broader design consensus, which will unlock econo-mies of scale. The worst-case scenario for the wave energy sector would see the technologies becoming competitive only after more than 20 GW of capacity has been installed.
Actions and activities that are currently being undertaken to facilitate the commercialisation of wave energy technologies will be discussed in Chapter 5.
Unit 2010 2020 2030 2040 2050
technical Net electrical power a MWe 1–5 5–20 30–40 40–50 50–400
Max. capacity factor % 36 45 47 47 50
Avg. capacity factor % 20 23 28 32 36
Technical lifetime years 20 20 20 20 20
Costs CAPEx ref. EUR2013/kWe 9080 5790 4480 2700 2300
CAPEx low EUR2013/kWe 7590 5060 3890 2560 2050
CAPEx high EUR2013/kWe 10700 6390 5490 2650 2560
Quality of CAPEx estimate Low
CAPEx learning rate % 12 12 12 12 12
FOM % of CAPEx ref. 3.6 4.1 4.7 5.8 5.8
Evolution Max. potential GWe 0.03 0.19 1.9 2.0 3.2
a Current estimates for wave energy plants focus on the development of 10 MW arrays; projects for up to 140 MW have been announced but no clear timescale is currently available. Source: ETRI 2014
Table 17: Techno-economic data for wave energy
Capacity1248
163264
125250500
100025005000
10000
0,00,10,20,30,40,50,60,70,80,91,01,11,21,31,4
LCO
E [E
UR/
kWh]
Cumulative deployment [MW]
Poor resource Average resource Good resource Reference
Fig. 24: LCOE predictions for wave arrays. Source: JRC, based on ETRI 2014

44
4 OvERviEW Of EmERgiNg tECHNOLOgiES
Several other types of ocean energy technology are currently being developed. An overview of the most promising technologies, ocean thermal energy conversion and salinity gradient, will be given in the following sections.
4.1 Ocean thermal Energy ConversionOcean thermal energy conversion captures the temperature difference between cooler deep and warmer shallow ocean water to produce electricity. OTEC needs a temperature difference of about 20°C or more (Fujita et al. 2012; Semmari et al. 2012). Since water temperatures of 4°C can be found in the bathyal zone at about 1 km depth, ocean surface water temperatures should reach 25°C, conditions that can mainly be found in tropical latitudes (Lewis et al. 2011; CSIRO 2012). Compared to other ocean energy technologies, OTEC has some advantages. It can provide continuous base-load power, and it can also provide fresh water for irrigation or drinking water and cold water for refrigeration (IRENA 2014c).
Resources for ocean thermal energy conversion are larger than for any other type of ocean energy. It is estimated that between 30000 and 90000 TWh/year of power are extractable without having nega-tive impacts on the thermal characteristics of the oceans (Charlier & Justus 1993; Pelc & Fujita 2002; Lewis et al. 2011; Semmari et al. 2012; Rajagopalan & Nihous 2013). Main resources can be found in the area between 30° S and 30° N, which means in tropical seas (Nihous 2007; Nihous 2010). Figure 25 shows the temperature difference between water depths of 20 m and 1000 m, and the potential of areas showing a temperature gradient of more than 20° C. hence, the technology offers little potential in European continental waters.
Three main types of OTEC can be differentiated: open-cycle, closed-cycle and hybrid systems. In an open-cycle plant, warm surface water is flash evap-orated and drives a turbine (Figure 26). Cool water is used to condense the vapour again. The condensed desalinated water can be used for various purposes (e.g. drinking water, irrigation). The cold water that has been pumped from the sea can feed air-con-ditioning systems after it has been used in the condenser. In addition, the cold seawater can also be used in aquaculture, since it is rich in nutrients.
Closed-cycle OTEC plants use a working fluid with a low boiling point. The vapour drives a turbine and is condensed using cold seawater (Figure 27). In general, refrigerants or ammonia can be used as the working fluid, but water–ammonia mixtures are also used (kalina cycle). Closed-cycle plants are more efficient compared to open-cycle plants (Charlier & Justus 1993).
hybrid OTEC systems consist of a combination of open and closed cycles. Several concepts have been discussed; one in which the steam from the flash evaporation is the heat source to drive the closed cycle, and one in which the discharge from the closed cycle is used to produce desalinated water (vega 2002; IRENA 2014c).
Fig. 25: OTEC resources: Temperature difference between 30 m and 1000 m depth. Source: World Ocean Atlas 2013a, graph produced with Ocean Data Viewer
Warm seawater
Warm seawater
Cold seawater
Cold seawater
Turbine
CondenserEv
apor
ator
Desalinated water
Desalinated water vapour
Fig. 26: Simplified open-cycle OTEC process flow diagram
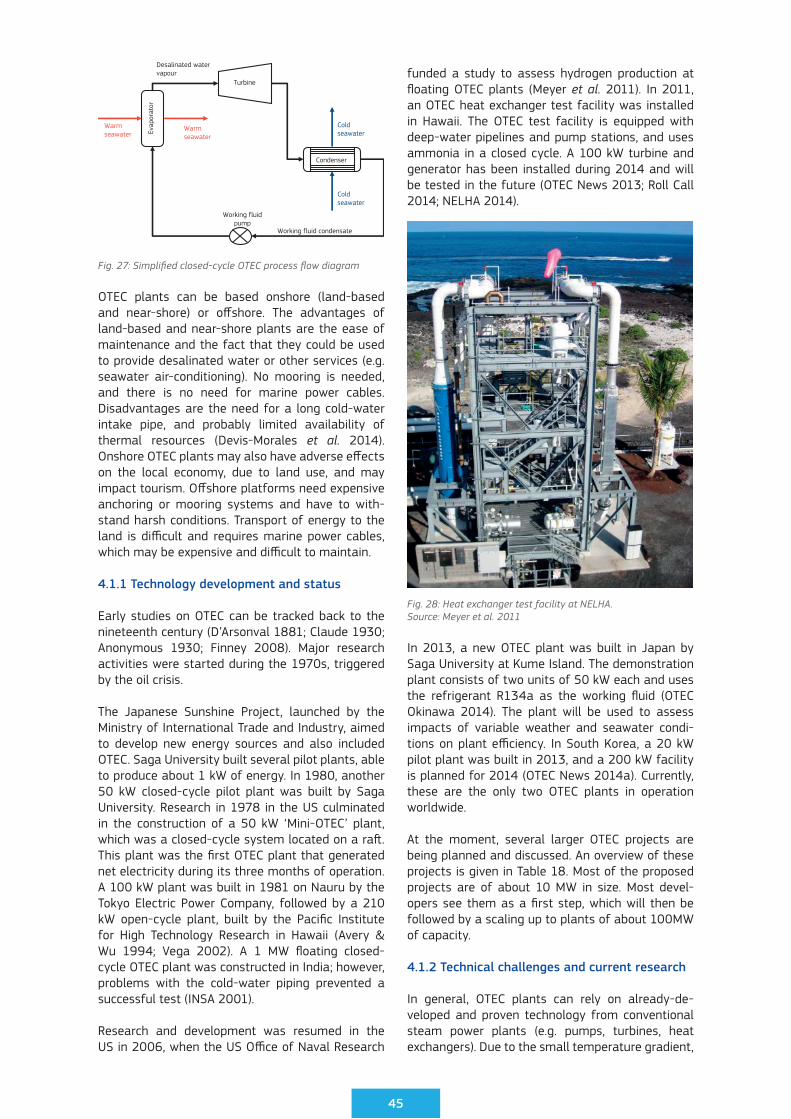
45
Warm seawater
Warm seawater
Cold seawater
Cold seawater
Working fluid condensate
Desalinated water vapour
Working fluid pump
Turbine
Condenser
Evap
orat
or
Fig. 27: Simplified closed-cycle OTEC process flow diagram
OTEC plants can be based onshore (land-based and near-shore) or offshore. The advantages of land-based and near-shore plants are the ease of maintenance and the fact that they could be used to provide desalinated water or other services (e.g. seawater air-conditioning). No mooring is needed, and there is no need for marine power cables. Disadvantages are the need for a long cold-water intake pipe, and probably limited availability of thermal resources (Devis-Morales et al. 2014). Onshore OTEC plants may also have adverse effects on the local economy, due to land use, and may impact tourism. Offshore platforms need expensive anchoring or mooring systems and have to with-stand harsh conditions. Transport of energy to the land is difficult and requires marine power cables, which may be expensive and difficult to maintain.
4.1.1 technology development and status
Early studies on OTEC can be tracked back to the nineteenth century (D’Arsonval 1881; Claude 1930; Anonymous 1930; Finney 2008). Major research activities were started during the 1970s, triggered by the oil crisis.
The Japanese Sunshine Project, launched by the Ministry of International Trade and Industry, aimed to develop new energy sources and also included OTEC. Saga University built several pilot plants, able to produce about 1 kW of energy. In 1980, another 50 kW closed-cycle pilot plant was built by Saga University. Research in 1978 in the US culminated in the construction of a 50 kW ‘Mini-OTEC’ plant, which was a closed-cycle system located on a raft. This plant was the first OTEC plant that generated net electricity during its three months of operation. A 100 kW plant was built in 1981 on Nauru by the Tokyo Electric Power Company, followed by a 210 kW open-cycle plant, built by the Pacific Institute for high Technology Research in hawaii (Avery & Wu 1994; vega 2002). A 1 MW floating closed-cycle OTEC plant was constructed in India; however, problems with the cold-water piping prevented a successful test (INSA 2001).
Research and development was resumed in the US in 2006, when the US Office of Naval Research
funded a study to assess hydrogen production at floating OTEC plants (Meyer et al. 2011). In 2011, an OTEC heat exchanger test facility was installed in hawaii. The OTEC test facility is equipped with deep-water pipelines and pump stations, and uses ammonia in a closed cycle. A 100 kW turbine and generator has been installed during 2014 and will be tested in the future (OTEC News 2013; Roll Call 2014; NELhA 2014).
In 2013, a new OTEC plant was built in Japan by Saga University at kume Island. The demonstration plant consists of two units of 50 kW each and uses the refrigerant R134a as the working fluid (OTEC Okinawa 2014). The plant will be used to assess impacts of variable weather and seawater condi-tions on plant efficiency. In South korea, a 20 kW pilot plant was built in 2013, and a 200 kW facility is planned for 2014 (OTEC News 2014a). Currently, these are the only two OTEC plants in operation worldwide.
At the moment, several larger OTEC projects are being planned and discussed. An overview of these projects is given in Table 18. Most of the proposed projects are of about 10 MW in size. Most devel-opers see them as a first step, which will then be followed by a scaling up to plants of about 100MW of capacity.
4.1.2 technical challenges and current research
In general, OTEC plants can rely on already-de-veloped and proven technology from conventional steam power plants (e.g. pumps, turbines, heat exchangers). Due to the small temperature gradient,
Fig. 28: Heat exchanger test facility at NELHA. Source: Meyer et al. 2011

46
an ideal OTEC cycle might reach a theoretical efficiency of about 8 %. In practice, only 3–4 % seems realistic, due to heat losses and system inef-ficiencies. Large quantities of seawater have to be pumped for the heat transfer. It is estimated that 4 m3 of warm and 2 m3 of cold seawater per second are required for 1 MW net electricity (vega 2002).
While many marine components such as floating platforms or mooring needed are available from other offshore industries (e.g. oil & gas), some engi-neering challenges still exist. Pipes with large diam-eters (4 m and greater) are needed to transport the cold seawater to the OTEC plant. In addition, the hostile environment leads to quick corrosion of pipe-work. Other technological problems that have to be overcome are biofouling, the sealing of components, and marine power cabling (vega 2002, Coastal Response Research Center 2010, CSIRO 2012).
Since heat exchangers constitute a major part of the investment costs of an OTEC plant and their performance have a great influence on overall system efficiency, R&D efforts have been and still are focussing on heat exchangers. Accumulation of microorganisms on surfaces can occur in heat exchangers which leads to a decrease of heat exchanger efficiency, especially when a thin layer of biofilm is formed and heat conductivity is reduced (Murthy et al. 2004). Already in the 1980s it has
been shown that chlorination might inhibit microbial growth in heat exchangers (Fava & Thomas 1978, ; Berger & Berger 1986). Different materials for heat exchangers have been tested in light of preventing biofouling (Nickels et al. 1981).
Another key part of OTEC plants is the cold-water pipe. It has been proven that cold-water pipes for 10 MW plants can be constructed and operated (vega 2002). The main material used and tested so far is fibre-reinforced plastic (FRP) in pipes for floating farms. For onshore plants, segmented pipes from steel, concrete and FRP can be used.
New working fluids also offer the possibility to improve the thermal efficiency of OTEC plants (yoon et al. 2014). yang and yeh (2014) optimised the operational conditions with respect to maximising net efficiency and minimising the heat transfer area (which allows cost reductions). yuan et al. (2013) tested different operating conditions in order to opti-mise working-fluid flow rate. A new thermo-dynamic cycle was proposed by Semmari et al. (2012) using a work-transfer liquid (which can be water or oil) as a liquid piston, driving a hydraulic turbine such as a Francis turbine. Since a hydraulic turbine can be smaller compared to a steam turbine, the concept allows for cost savings. Another novel concept was presented by Gilmore et al. (2014): a floating plant far from the coast that produces energy, which is
Location power Output
Characteristics developer/Owner References
hawaii 1 MW The plant will be located onshore at NELhA. Closed cycle with ammonia. Environmental assessment completed. Lease negotiations are ongoing.
OTEC International LCC
(Big Island video News 2012; OTI 2013; OTI 2014)
Diego Garcia 13 MW Project planned for the US Navy on the Diego Garcia island in the Indian Ocean. Plant should also provide drinking water. Currently put on hold.
Ocean Thermal Energy Corporation
(OTE 2014a)
Bahamas 5–10 MW MoU signed with Bahamas Electricity Corporation (BEC), and Power Purchasing Agreement (PPA) has been signed with a utility company.
Ocean Thermal Energy Corporation
(OTE 2014b)
hawaii 10 MW Closed-cycle OTEC pilot system, to be expanded to a commercial project of 100 MW. Project was stopped.
Lockheed Martin & Makai Ocean Engineering
(IRENA 2014c)
hainan 10 MW Onshore plant planned for a big resort on the hainan island. Contracted by Reignwood Group. Construction is expected to start in 2014, with completion in 2017.
Lockheed Martin (Patel 2013; IEEE Spectrum 2014; IRENA 2014c)
virgin Islands MoU signed for performing feasibility studies for onshore OTEC/SWAC/desalinated water plants.
Ocean Thermal Energy Corporation & DCNS
(OTE 2014b)
Reunion 1.5 MW R&D agreement signed to perform a feasibility study on a 1.5MW pilot plant. A land-based prototype was built in 2012, and testing is ongoing.
DCNS (WEC 2013; DCNS 2014b; OTEC News 2014b)
Martinique 10.7 MW Floating demonstration plant with a closed-loop Rankine cycle. Nominal capacity 16 MW. Funding of 72 m EUR granted under NER 300 programme. Entry into operation foreseen in 2016.
DCNS & Akuo Energy
(WEC 2013; Commission Decision C(2014) 4493 2014; OTEC News 2014b; OTEC News 2014c)
Tahiti An agreement to perform a feasibility study was signed, and the study was finalised in 2014.
DCNS (WEC 2013; DCNS 2014b)
Table 18: Planned and proposed OTEC projects worldwide

47
then transported to the coast in the form of energy carriers such as ammonia, liquid hydrogen or meth-anol.
4.1.3 Economic and market aspects
The greatest challenge the OTEC sector faces today is high capital costs, and the associated problems with getting access to finance. So far, cost esti-mates stem from feasibility studies and desk-based research (Table 19).
The LCOE for OTEC found in the literature is higher than the LCOE for conventional power plants and is comparable to other renewables. The same holds true for CAPEx, where OTEC plants show consid-erably higher values compared to conventional fuels (e.g. 875 EUR/kWh for a combined-cycle gas turbine (ETRI 2014)). CAPEx for other renewables, in general, is also lower than for OTEC (e.g. 1,400 EUR/kW for onshore wind, 3,470 EUR/kW for offshore wind, 1150 EUR/kW for solar panels and 2200 EUR/kW for hydropower (ETRI 2014)).
CAPEx can be split into different cost items, such as offshore equipment (e.g. platforms, moorings, seawater pipes), process equipment (e.g. heat exchangers, working-fluid pumps) and electrical equipment (turbines, generators, power cables) (Bluerise 2014). The most expensive components of an OTEC plant are the platforms, heat exchangers and pipework. The respective share of each of the compo-nents depends on the specific plant layout and type, but can reach up to 50 % for heat exchangers, in the
Table 19: Cost estimates for OTEC plants: CAPEX and LCOE
case of large-scale plants, and 50 % for pipework, in the case of small land-based plants (IRENA 2014c). An example for disaggregated CAPEx is shown in Figure 29, for a 10 MW floating closed-cycle plant.
Annual operation and maintenance costs (OPEx) are estimated to be small compared to CAPEx. Annual OPEx is estimated to be about 1–3 % of capital costs (vega 2002; IRENA 2014c).
Economic performance of an OTEC plant will depend very much on its specific configuration and location. Promising markets are island countries and remote islands in tropical regions, due to provision of addi-tional services such as air-conditioning or fresh water production.
CapEX [EUR/kW]a
LCOE[EUR/kWh]a
plant description assumptions Reference
3100–9200 0.05–0.16 100 MW closed-cycle, floating, only electricity production
1 % maintenance, interest rate 10 %, cost depending on distance (10 km to 400 km)
(vega 2002)
9100 - 40 MW closed-cycle plant with four units, near-shore (hawaii)
430 m USD total investment costs (16 % heat exchangers, 36 % pipes, 24 % platform)
(SERI 1989)
5400 - Open-cycle onshore plant No details given, size unknown (SERI 1989)
6000–7500 0.12–0.15 100 MW closed-cycle No details available (Cohen 2009)
3360–4480 68708200–17100
0.05 (best case)
40 MW closed-cycle 40MW hybrid1–10 MW open-cycle
Different concepts, including floating and onshore. Revenue from desalination by open-cycle and hybrid included
(Cavrot 1993)
7500–11200 0.09–0.13 100–400 MW closed-cycle plants
30-year lifetime, capacity factor (CF) of 95–97 %, 4 % discount rate
(Martel et al. 2012)
10000 0.08 50 MW plant CF of 90 %, no details given (Straatman & van Sark 2008)
4800–18400 0.10–0.75 20 MW closed-cycle floating plant
Based on low–medium–high estimates. Details for cost breakdown available
(Upshaw 2012)
6000 0.11 75 MW closed-cycle, floating, 6 miles off shore (Puerto Rico)
No details given (Plocek et al. 2009)
a For references in USD, conversion to EUR was performed assuming an exchange rate of 1 EUR = 1.34 USD
35 %
36 %
7 %
2 %
20 %
Process equipment Offshore equipment Electrical equipment Project development Transport & installation
Fig. 29: Disaggregated CAPEX for a 10 MW OTEC plant. Source: Bluerise 2014

48
The main companies involved in OTEC projects are shown in Table 20. The main actors are developers, ranging from big corporations such as Lockheed Martin and DCNS, coming from the marine and defence sectors, to companies specialising in OTEC such as the Ocean Thermal Energy Corporation or OTEC International. Some actors from other offshore industries are now also active in the market, for example SBM Offshore, which supplies offshore floating and mooring solutions. Most companies involved in OTEC are based in the US and the European Union.
4.2 Salinity gradient
Salinity gradient power or osmotic power uses the difference in salt concentration between seawater and fresh water to produce electricity. In principle, salinity gradient energy converters could produce base-load electricity. Resources can be found every-where in the world where fresh water is discharged into seawater (Figure 30). River mouths are the most promising locations for salinity gradient plants
(Lewis et al. 2011). Salinity gradient resources are great: it is estimated that about 1300 to 2000 TWh of electricity could be produced annually (van den Ende & Groemann 2007; Skilhagen et al. 2008; Skråmestø et al. 2009; Achilli & Childress 2010).
Currently, two main types of technology to exploit this energy potential are considered: reverse elec-trodialysis (RED) and pressure-retarded osmosis (PRO), with both types being based on ion-specific membranes (Lewis et al. 2011).
RED is the reverse of the electrodialysis process used to produce fresh water from brackish water. It needs two different membranes: anion and cation exchange membranes that are selectively permeable for specific ions (Post et al. 2007). Salt water and fresh water are separated by alternating membranes (Figure 31). In consequence, sodium ions from the salt water will permeate through the cation exchange membrane, and chloride ions will pass through the anion exchange membrane. A potential difference is created that can be used as electrical energy (van den Ende & Groemann 2007.
Name Country type description/Current activities Website
Bell Pirie Power Uk/Philippines Technology developer/Owner
Developing a 10 MW pilot plant in Zambales, The Philippines
www.bellpirie.com
Bluerise NL Developer/ Consultant
Specialises in OTEC and SWAC. Currently running a small demonstration plant
www.bluerise.nl
DCNS FR Developer Naval defence company. Operates a land-based prototype in Ré-union. Technology supplier for the 16 MW NEMO plant project
www.dcnsgroup.com
Energy Island Uk Consultant Feasibility studies, develops project proposals, engineering designs
www.energyisland.com
Lockheed Martin US Developer Involved in OTEC since the 1970s. Developed the miniOTEC plant. Recently signed a contract with Reignwood Group to design a 10MW plant
www.lockheedmartin.com
Makai Ocean Engineering
US Developer Ocean engineering company focussing on OTEC, SWAC, pipelines and submarine cables. Currently installing a turbine on the heat exchanger test facility in hawaii.
www.makai.com
Ocean Thermal Energy Corporation
US Developer Active in OTEC and SWAC. Will build a SWAC facility in the Bahamas and signed MoUs to design, build and operate OTEC/SWAC plants in the future
www.otecorporation.com
OTEC International US Developer Worked in OTEC for more than 40 years, holds many patents. Several projects in pipeline
www.oteci.com
SBM Offshore NL System and service provider
Specialises in floating platforms and mooring systems. Performs R&D in the area of wave energy and OTEC
www.sbmoffshore.com
xenesys JP Developer Focussing on OTEC, waste heat and desalination. Runs an R&D centre and heat exchanger production facility in Imari, and operates the kinawa pilot plant
www.xenesys.com
Table 20: Overview of main players in the OTEC sector

49
Fig. 30: Salinity gradient resources: Salinity at surface level. Source: World Ocean Atlas 2013b, graph produced with Ocean Data Viewer
-
Catio
n ex
chan
ge m
embr
ane
Anio
n ex
chan
ge m
embr
ane
Catio
n ex
chan
ge m
embr
ane
Anio
n ex
chan
ge m
embr
ane
Na+
Cl- Cl-
Na+
Catio
n ex
chan
ge m
embr
ane
Anio
n ex
chan
ge m
embr
ane
Na+
Cl-
Catio
n ex
chan
ge m
embr
ane
Na+
Sea water
Anod
e
Cath
ode
+
Fresh water
Sem
i-pe
rmea
ble
mem
bran
e
Anio
n ex
chan
ge m
embr
ane
Catio
n ex
chan
ge m
embr
ane
Anio
n ex
chan
ge m
embr
ane
Catio
n ex
chan
ge m
embr
ane
Anio
n ex
chan
ge m
embr
ane
Catio
n ex
chan
ge m
embr
ane
H2O
H2O H2O
H2O H2O
H2O
Fresh water
Brackish water
Brackishwater
Turbine
Seawater
Pressureexchanger
Brackishwater
Fig. 31: Simplified RED process flow diagram. Sources: van den Ende & Groemann 2007; Post et al. 2007
Fig. 32: Simplified PRO process flow diagram. Source: Post et al. 2007
Pressure-retarded osmosis also brings salt water and fresh water in contact by a membrane. The membrane is permeable for water but not for salts. An example of a PRO process is shown in Figure 32. Salt water is pressurised to 1.2–1.3 MPa. Fresh water migrates through the membrane and increases the volumetric flow of high-pressure water. One third of the resulting brackish water can be used in a hydro-turbine to generate electricity, whilst the remainder is used in a pressure exchanger to increase the pres-sure of the incoming salt water (Lewis et al. 2011).
Besides RED and PRO, other technologies are currently being investigated. vapour compression exploits the difference in vapour pressure between salt water and fresh water to produce electricity. In principle, fresh water is evaporated in a vacuum and condensed in salt water (Olsson et al. 1979; Olsson 1982). Advantages of this method are that it does not need membranes and that it is a very reliable technology (Charlier & Justus 1993; Jones & Finley 2003).

50
Another idea, developed recently by Brogioli, is to charge up electrodes in contact with saline water and then discharge them in fresh water, and to repeat the cycle continuously (Brogioli 2009). When in contact with saline water, some ions will diffuse out of the capacitor, which reduces capacitance. To keep the ratio of charge to capacitance constant, voltage increases. It is expected that this capacitive method is competitive with membrane methods. Currently, the FP7 project Capmix further develops the method, aiming at a power density of 100 W/m3 and an energy recovery of 70 % (Capmix 2014).
4.2.1 technology development and status
The concept of using salinity gradients to produce energy was proposed in the 1950s by Pattle (Pattle 1954). Later, in the 1970s, PRO was developed further by Loeb (Achilli & Childress 2010), who published first results from experimental studies. In the 2000s, resource assessments were performed by Statkraft and the Foundation for Scientific and Industrial Research, at the Norwegian Institute of Technology (SINTEF), and Seppälä published papers on modelling and possible PRO system configura-tions (Achilli & Childress 2010). Statkraft also exam-ined membrane properties and behaviours for PRO membranes (Skilhagen et al. 2008; Gerstandt et al. 2008; Thorsen & holt 2009). In 2009, the first PRO pilot plant, with a designed capacity of 10 kW, was opened by Statkraft in Norway (Power Technology 2014). In December 2013, Statkraft announced it was to stop the pilot plant and all development activities related to salinity gradient energy (Statkraft 2014).
More recently, a RED pilot plant that will generate 50 kW was built in the Netherlands (The Daily Fusion 2014). It was accounced that infrastructure and building have been completed, and first trials begun (Redstack 2014). The plant can process 220 m3 of water per hour, and it is planned to increase throughput to 100000 m3 in the following years (Figure 34).
Currently, we are not aware of any other ongoing salinity gradient projects. Activities have been
proposed in, among others, Canada, Singapore and South korea (IRENA 2014d).
4.2.2 technical challenges and current research
Current research in salinity gradient energy focusses mainly on membranes, since they are key components for both PRO and RED applica-tions. Large membranes are required, for example, Gerstandt et al. (2008) state that 200000 m2 of membrane surface are needed for a 1 MW plant. The main goals in R&D are to improve membrane performance and to reduce maintenance and replacement needs. PRO membranes should allow for high water permeability and low permeability for salts. In addition, the membrane skin should exhibit an osmotic transport mechanism. The structure of the membrane should prevent build-up of salt concentrations inside the membrane (Gerstandt et al. 2008). Ion exchange membranes used in RED should feature a high ion exchange capacity and selectivity (hong & Chen 2014).
Current studies investigate which membrane prop-erties are crucial for performance (Güler et al. 2013), and membrane material selection (Fu et al. 2014). Research aims at improving membrane structure and chemistry (Buonomenna 2013; Cheng et al. 2013; Patel et al. 2014; Zhou et al. 2014), sometime using membranes already commercially available. Other researchers develop new types of membranes, such as hollow-fibre or high-per-formance thin-film composite (TFC) or high-per-formance ion-exchange membranes (Chou et al. 2012; han et al. 2013; hong & Chen 2014). Other work relates to the design and production of the modules that contain the membranes (She et al. 2013; Güler et al. 2014). R&D synergies exist, since membranes are also used in other applications, including water treatment, fuel cells, electrodial-ysis, desalination and gas separation (Güler et al. 2013; hong & Chen 2014).
Another area of research is biofouling, which leads to performance losses (yu et al. 2013). For example, Emadzadeh et al. (2014) developed a thin-film
Fig. 33: Statkraft’s PRO pilot plant in Tofte, Norway. Source: Skråmestø et al. 2009
Fig. 34: RED pilot plant at Afsluitdijk, Netherlands. Source: The Daily Fusion 2014

51
nanocomposite (TFN) substrate that allows reduc-tion of fouling. Zhou et al. (2014) modified commer-cially available membranes to improve performance and reduce biofouling. Other technical challenges that have to be overcome include the pre-treat-ment of water and the large-scale manufacturing of membranes (IRENA 2014d).
4.2.3 Economic and market aspects
Salinity gradient has only been used on a small scale, up to a capacity of 50 kW. Cost figures for commercial installations are thus not avail-able and have to be estimated (Lewis et al. 2011; vermaas 2013). Membranes constitute a major fraction of CAPEx for RED and PRO systems (80 % of costs (IRENA 2014d)), since currently there are no membranes commercially available for salinity gradient energy production. Besides membranes, other components such as vessels and turbines, and other equipment are available off the shelf (IRENA 2014d).
Table 21 shows some cost estimates for CAPEx and LCOE for salinity gradient power plants. Investment costs of salinity gradient power is higher than for other renewable energy systems, but the capacity factor will be significantly higher, since 8000 hours of operation per year does not seem unrealistic (Skråmestø et al. 2009; Lewis et al. 2011). vermaas (2013) mentions that LCOE for salinity gradient in the Netherlands will be lower compared to solar power and slightly more expensive than wind power, but also stresses that salinity gradient will produce base-load power, in contrast to solar and wind, which rely on fluctuating resources.
Since the key component of salinity gradient power plants is the membrane, the most active companies in the field are membrane developers (Table 22). Other players are small start-up companies special-ised in certain areas such as PRO or RED. Also, industrial companies from the desalination and water treatment sectors are becoming more active in salinity gradient power.
CapEX [EUR/kW]a
LCOE[EUR/kWh]a
plant description assumptions Reference
11300 0.12–0.27 5.4–10 MW PRO plant
Different infrastructure costs and salt concentrations assumed depending on location
(Molenbroek 2007)
9630 0.08 10 MW RED plant, 5.6x10⁶m2 membrane
Based on information from Red Stack (Molenbroek 2007)
n.a. 0.16–0.18 No details available Membrane price reduced to 4.3 EUR/m2 and below
(vermaas 2013)
n.a. 0.05–0.09 No details available Estimates from Statkraft (Ravilious 2009)
n.a. 0.05–0.10 Forecast for 2030 Estimates from Statkraft (Lienard & Neumann 2011)
n.a. 0.09–0.28 hybrid plant and standalone plant (4 MW)
Lowest costs for hybrid (brine from desalination), highest for standalone
(Stenzel 2012)
n.a. 0.08–0.15 5 MW RED plant in 2020
Upscale forecast: 50 kW in 2017, 5 MW in 2020
(IRENA 2014d)
n.a. 0.11–0.22 5 MW PRO plant in 2020
Upscale forecast: 2 MW in 2017, 5 MW in 2020
(IRENA 2014d)
5000 0.08 200 MW RED plant Cost estimate based on a small 200 kW pilot unit
(Post et al. 2010)
4200-5500 0.09–0.13 20 MW RED plant 4 N brine solution, costs in USD1978, 20-year lifetime, costs depend on membrane resistance
(Lacey 1980)
a For references in USD, conversion to EUR was performed assuming an exchange rate of 1 EUR = 1.34 USD
Table 21: Cost estimates for salinity gradient plants: CAPEX and LCOE

52
Name Country type description/Current activities Website
Fujifilm JP Membrane producer
Photography and imaging company. Membranes section focusses on desalination and ion-exchange membranes for RED. Supplies the membranes for the 50 kW pilot plant at Afsluitdijk, Netherlands
www.fujifilmmembranes.com
Nitto Denko JP Membrane producer
Chemical company. Membrane products for a range of applications including desalination. Collaborating with Statkraft for 2 MW pilot plants
www.nitto.com
Oasys Water US Desalination company
Spin-off from yale University. holds several patents in the area of desalination and Salinity gradient. Also active in the fracking market
www.oasyswater.com
OsmoBlue Ch Start-Up Focusing on waste heat recovery. Conversion of low-temperature waste heat recovery by using PRO.
www.osmoblue.com
Pentair x Flow
NL Membrane producer
Water Process Technology. Active in water purification, wastewater treatment, seawater pre-treatment, food and beverage industry
www.x-flow.com
Porifera US Start-Up Membrane developer in the area of forward osmosis www.porifera.com
Red Stack NL Start-Up Developing RED. Builds the 50 kW pilot plant at Afsluitdijk, The Netherlands.
www.redstack.nl
Statkraft NO Electricity company
Big electricity company, mainly using hydropower. Built the 10 kW PRO pilot plant in Tofte. No longer active in the field.
www.statkraft.com
Toray Industries
JP Membrane producer
Corporation active in polymer chemistry and biochemistry. Water treatment section active in water treatment membranes and modules.
www.toray.com
Wetsus NL Research and Consultancy
Focussing on capacitive power production, RED membrane development and fouling management.
www.wetsus.nl
Table 22: Overview of some players in the salinity gradient sector

53
5 aCtiONS aNd CHaLLENgES
The increased interest in developing ocean energy technologies witnessed at policy level over the past few years has led to the identification of the barriers that are currently hindering the commer-cialisation of ocean energy technologies: technology development, finance, consenting and environ-mental issues, and the availability of grid infra-structure (MacGillivray et al. 2013; IRENA 2014b). Strategic actions and policy implementation have been presented by the SI Ocean project specifically for wave and tidal technologies (Badcock-Broe et al. 2014; Magagna et al. 2014), and by IRENA (IRENA 2014b) in a broader context. All reports highlighted how the main challenges that ocean energy is facing are interdependent of one another and require concerted and collaborative efforts among devel-opers, academia and policy makers.
The ‘Blue Energy Communication’ presented by the European Commission in January 2014 highlighted the current gaps and proposed an action plan to aid the development and uptake of ocean energy (COM(2014) 8 final 2014), setting a framework for implementation.
The process was initiated by the creation of the Ocean Energy Forum, a platform to bring together ocean energy actors and stakeholders to discuss common issues and identify viable solutions for the sector. The main output expected from the Ocean Energy Forum is a strategic roadmap defining targets for the industrial development of the sector and a clear timeframe for its implementation.
The Ocean Energy Forum has been asked to focus on three primary areas to overcome specific gaps:
• technology and resources: looking at ensuring the development of reliable, viable, efficient and survivable ocean energy technologies. An important part of the work is dedicated to detailed resource mapping, both in terms of phys-ical resources and the availability of ports, vessels and other ancillary services.
• finance: aiming at identifying methods for the optimal financing of RD&D for ocean energy tech-nologies and how to trigger inward investment in the sector.
• Environmental and administrative issues: the novelty of the sector and of its technologies raises a series of concerns with regards to the potential impacts of ocean energy on the environ-ment, requiring extensive monitoring from devel-opers. Further uncertainties arise in relation to the existing EU policy frameworks, which regulate the deployment of energy systems, and the need of
developing guidelines and best practices to eval-uate ocean energy technologies. Focus will also be given to solving current administrative issues and reducing the lead times for consenting and licensing of sites.
The second phase (2017–2020) of the action plan foresees the creation of a European Industrial Initiative (EII) for Ocean Energy, as already put in place by other renewable sectors (e.g. wind), within the SET Plan framework (COM(2014) 8 final 2014). Such a solution could help foster technology inno-vation, enhance risk sharing among stakeholders, formalise cooperation activities and implement the Ocean Energy Roadmap put forward by the Ocean Energy Forum.
5.1 identifying priorities and actions In addition to the Blue Energy Communication, the European Commission has recently released the document ‘Towards an Integrated Roadmap and an Action Plan’ (EC 2014a), the initial outputs of the European Commission’s Communication on Energy Technologies and Innovation (COM(2013) 253 2013). The aim of the Integrated Roadmap is to consolidate the updated technology roadmaps of the SET Plan and propose research and innovation actions designed to facilitate integration of energy technologies across the EU level.
The document, based on inputs received by stake-holder groups (EC 2014b), presents key research, development and market priorities for energy technol-ogies. Ocean energy priorities were defined as follows:
• advanced research (tRL 1–3): Develop method-ologies for site characterisation; develop devices, components and materials, grid services and inter-array interaction, and array design and modelling tools.
• industrial research and demonstration (tRL 4–6): Test and demonstrate ocean energy components, technologies, systems and arrays; demonstrate marine technology access and logistics.
• innovation and market uptake (tRL 7–9): Deploy early commercial arrays and grid integration, including standards; develop manufacturing and mass-production techniques, taking into account the whole supply chain; develop a framework for consenting procedures, and environmental and socio-economic assessment; assess impacts on marine ecosystems and methodologies for power take-off systems; support training and education.
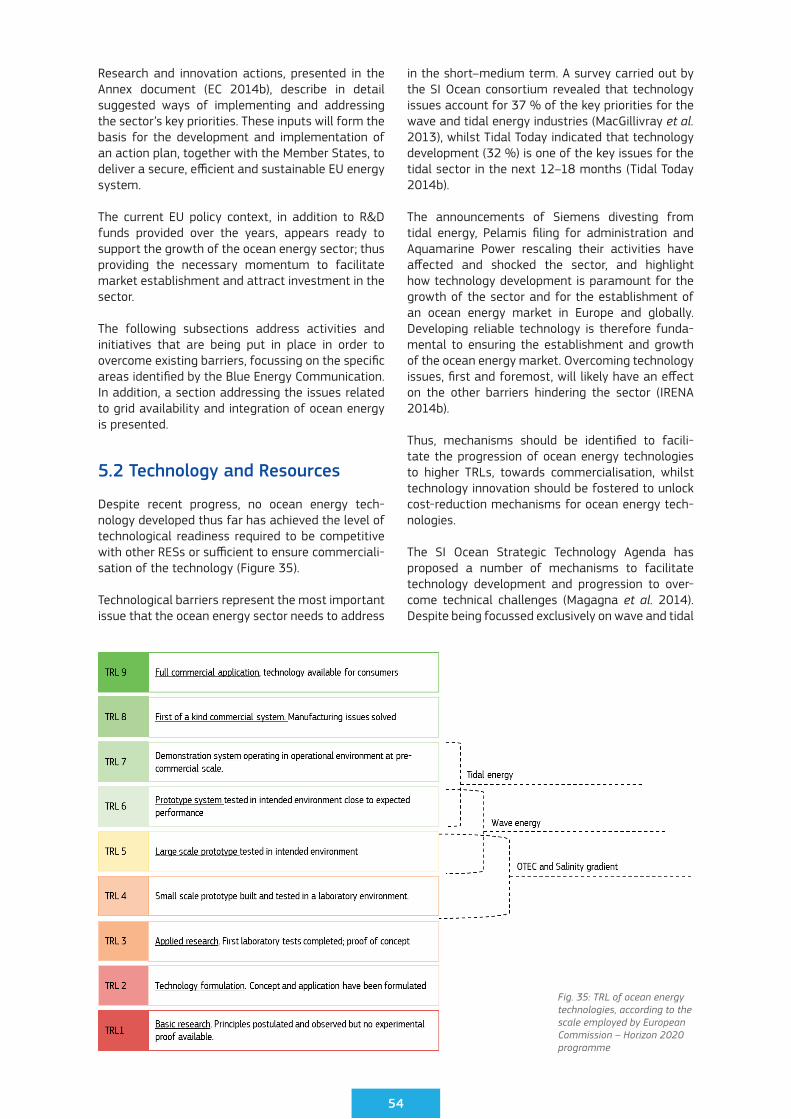
54
Research and innovation actions, presented in the Annex document (EC 2014b), describe in detail suggested ways of implementing and addressing the sector’s key priorities. These inputs will form the basis for the development and implementation of an action plan, together with the Member States, to deliver a secure, efficient and sustainable EU energy system.
The current EU policy context, in addition to R&D funds provided over the years, appears ready to support the growth of the ocean energy sector; thus providing the necessary momentum to facilitate market establishment and attract investment in the sector.
The following subsections address activities and initiatives that are being put in place in order to overcome existing barriers, focussing on the specific areas identified by the Blue Energy Communication. In addition, a section addressing the issues related to grid availability and integration of ocean energy is presented.
5.2 technology and Resources
Despite recent progress, no ocean energy tech-nology developed thus far has achieved the level of technological readiness required to be competitive with other RESs or sufficient to ensure commerciali-sation of the technology (Figure 35).
Technological barriers represent the most important issue that the ocean energy sector needs to address
in the short–medium term. A survey carried out by the SI Ocean consortium revealed that technology issues account for 37 % of the key priorities for the wave and tidal energy industries (MacGillivray et al. 2013), whilst Tidal Today indicated that technology development (32 %) is one of the key issues for the tidal sector in the next 12–18 months (Tidal Today 2014b).
The announcements of Siemens divesting from tidal energy, Pelamis filing for administration and Aquamarine Power rescaling their activities have affected and shocked the sector, and highlight how technology development is paramount for the growth of the sector and for the establishment of an ocean energy market in Europe and globally. Developing reliable technology is therefore funda-mental to ensuring the establishment and growth of the ocean energy market. Overcoming technology issues, first and foremost, will likely have an effect on the other barriers hindering the sector (IRENA 2014b).
Thus, mechanisms should be identified to facili-tate the progression of ocean energy technologies to higher TRLs, towards commercialisation, whilst technology innovation should be fostered to unlock cost-reduction mechanisms for ocean energy tech-nologies.
The SI Ocean Strategic Technology Agenda has proposed a number of mechanisms to facilitate technology development and progression to over-come technical challenges (Magagna et al. 2014). Despite being focussed exclusively on wave and tidal
Fig. 35: TRL of ocean energy technologies, according to the scale employed by European Commission – Horizon 2020 programme

55
technology, the document identified a two-stream approach, focussing on ‘technology development’ and ‘deployment and risk reduction’ to drive the sector towards commercialisation (Figure 36).
At a high level, the proposed actions could be adapted to ocean energy technologies as a whole. A concerted effort should be made to put in place policy mechanisms to facilitate the development of reliable, survivable and cost-effective ocean energy technology, in accordance with EC 2014a. In the first instance, actions are aimed at increasing perfor-mance improvement of single and array devices, whilst the latter focus should be given to increasing the deployment rate of technologies and facilitating learning-by-doing.
The EU framework programme for research and inno-vation, horizon 2020, could play a significant role in the implementation of actions aimed at solving tech-nology issues. The programme has identified areas for research, innovation, development and demon-stration for low-carbon energies, with dedicated funding programmes based on current TRLs.
With regards to ocean energy technologies, the implementation mechanism should focus on:
• Demonstration of advance technologies: valida-tion of technology at full scale through exten-sive testing and aiding of pilot and first-of-a-kind commercial array deployment
• Progressing early stage technology to higherTRLs, and through the development of innova-tive technologies, new materials and enhanced components.
Such a distinction allows matching the ideal funding structure with specific technology needs, as seen
in other sectors. Fundamental parameters for assessing the success and progress of the tech-nologies will be the definition and achievement of performance targets and key performance indica-tors (kPIs) for each ocean energy technology type. Both the wind energy and the photovoltaic EII have defined different targets, expected LCOE and kPIs for each different technology type. Developing and implementing technology-specific funds and kPIs ensure that technology development can happen without placing excessive expectations or unre-alistic targets on a particular technology, thus reducing risk for both developers and investors. The process started by the European Commission with the Integrated Energy Roadmap (EC 2014a) has already seen kPIs defined for the whole sector.
The development of standards, such as the one being developed by the International Electrotechnical Commission (IEC), which clearly define required levels of survivability and reliability for each TRL, would provide a clearer indication of the develop-ment of the technologies, as they improve towards commercialisation.
Nevertheless, in order to facilitate the progression of ocean energy technology to higher TRLs, it is also necessary to ensure that increased innova-tion and research efforts can take place, that best practice sharing is encouraged to spread the risk among stakeholders and that the development of test centres is supported. Activities and actions are currently being undertaken at global, regional and national levels. key activities are summarised in Table 23.
In Europe, in addition to the schemes presented in Table 23, a number of projects have been funded through the FP7 framework or national schemes,
Fig. 36: Key recommendations from the SI Ocean Wave and Tidal Strategic Technology Agenda
Technologydevelopment
Priority topics
• Technologyadvancement• Reliabilitydemonstration• Performancedatacollection• Designformaintenance• Sub-systemdevelopmentand
optimisation• Arraydesign&modellingtools• Novelsystemconcepts• Knowledgetransfer&dissemination
• Pre-commercialarrayseatrialanddemonstration
• PredictiveMaintenanceSystems• Resourceanalysistools• Offshoregriddesign&optimisation:
- Array electrical system- Sub-sea electrical system- Array interaction analysis- Offshore umbilical / wet mate
Mv connectors• Techno-economictools
• EstablishmentandreinforcementofRDI&D programmes for development of novel technology and towards TRL progression, with strong emphasis on sub-systems
• Validationofperformancesandreliability of WECs and TECs reaching capacity factors of >25% and an availability >75%
• Standardsandguidelinesforevaluation and testing of devices
• Co-operationatEuropeanscaleforaddressing overarching issues
• DemonstratingWECsandTECsthrough facilitated access to test and demo facilities in Europe
• Standardisedproceduresforinstallation, maintenance and retrieval of devices
• Co-operationwithsupplychain for standardised manufacturing
• Collaborationwithotherenergysectors for grid integration and connection issues
Recommended mechanisms
Deployment and risk reduction

56
Entity action type description
Ocean Energy System
Annex II Global This annex aims to develop recommended practices for testing and evaluation of ocean energy systems, to enhance the comparability of experimental results. The work is separated into three main tasks, addressing site data, device development and guidelines for open-sea testing of devices.
Annex v Global Annex v looks at facilitating the exchange and assessment of project information and experience from test centres. This work plays an important part in information sharing, to accelerate the technical understanding of ocean energy conversion technologies.
Ocean Energy Forum Ocean Energy Europe
TP Ocean European The Technology and Innovation Platform for Ocean Energy is coordinating the technology stream of the Ocean Energy Forum. The stream has been divided in four main technological working groups, addressing: measurement and data, logistics and operations, prime movers, and components/subcomponents. Each working group is working to prioritise a series of topics that require R&D actions.
IRENA Policy Global IRENA comprises 135 states, and has recently produced a series of policy and innovation recommendations for ocean energy development.
OceaneraNET RD&D European OceaneraNET is an FP7 project comprising the research councils of different EU Member States. The project launched its first call for applications specific to technology development of ocean energy converters in October 2014.
MaRINET RD&D European MaRINET is an FP7 project comprising 42 partners, providing access to experimental facilities across Europe at different scales for testing, research and optimisation of wind, wave and tidal energy technologies.
Sources: OceaneraNET 2014; IEA-OES 2014a; IEA-OES 2014b
Table 23: Concerted activities and actions to overcome ocean energy technical challenges
Table 24: Ocean energy technology challenges and research focus areas
area topics
Resource measurement and assessment
- Resource assessment methodologies, measurement systems, understanding of details, adequate forecasting
- Design for extreme conditions (including maintenance, control and operation, installation)- Resource quantification and characterisation for long-term climate impact- Forecasting of incoming wave power
Technology design, performance and integrity
- Reliability and performances of devices for 20-year lifetime expectancy (devices and subcomponents)
- Robustness of devices: design for extreme conditions, robustness and efficiency- Field testing of prototypes and demonstration units (TRL based)- Reduction of O&M costs- Modelling of devices and arrays- Materials: effects of ageing, fouling and corrosion, and development of novel materials
Components and sub-components for balance of plant and system
- Grid and cabling integration- Array cabling positioning and cable protection- Collaboration with wind on grid issues - Fatigue dynamics of systems and sub-systems (e.g. umbilical and power connectors)- Moorings and foundations: common structures, designs and survivability- PTO optimisation
Logistics, installation and operations
- Operations and maintenance: best procedures, installation methods, maintenance access and scheduling, and vessles
- Atomisation of inspection techniques - Monitoring health of assets- health and Safety requirements- vessels and offshore supply chain - Optimisation of operation, weather windows and capacity factors
such as Supergen, to address specific technology topics. however, a general consensus has been reached on the type of technology challenges and topics that need to be addressed (Table 24).
Technology development is essential to ensure that ocean energy technologies become cost competi-tive with both alternative and conventional energy
sources in the long term. Currently, the LCOE of ocean energy technologies indicates that they are lagging behind established technologies (Figure 37).
Over the past two years increased efforts have been witnessed at the global and European levels to help the ocean energy sector overcome the technology-specific issues that are hindering its

57
development. Whilst the level of success of given mechanisms may be dependent on the implementa-tion of policy and funding/financing instruments put in place, the sector now has a clearer view of what may be required, from a technology standpoint, to ensure growth and development of the market.
5.3 finance
In the past, developments in ocean energy were funded by private companies and public sources. Whilst initially, governmental support was the main source of funding, private finance has slowly increased (Badcock-Broe et al. 2014). In 2011, 50 % of RD&D investment in the EU was coming from private sources, 32 % from Member States and 18 % from European funds (Figure 38).
Figure 37: LCOE for alternative and conventional energy technologies. Calculation based on ETRI 2014
Market leaders in Europe are currently reaching finan-cial close for the deployment of pre-commercial and first-of-a-kind arrays (Section 2.3.1). Still, securing investment for pilot arrays is one of the greatest challenges the ocean energy sector currently faces, mainly due to high CAPEx for the first arrays (IEA-OES 2013; Badcock-Broe et al. 2014).
Besides continued private investments, public finan-cial support for ocean energy technologies will be needed. Such support could consist of both market push and pull mechanisms (Badcock-Broe et al. 2014). An overview of current public support mechanisms in EU Member States is given in Table 25, whilst Table 26 and Table 27 show support mechanisms from the EU and from non-EU countries, respectively.
Support mechanisms for emerging technologies need to be implemented with adequate timing in view of the market maturity of the technology concerned (Magagna et al. 2014). Whilst more tech-nology-oriented mechanisms are needed during the first stages of technology development, market push and pull instruments have to come into play at a later stage. Taking into account the current technological status of ocean energy, only leading tidal energy technologies have shown to be at the stage where market push mechanisms can help the uptake of the technology (Figure 39).
When comparing the current state of technology development and maturity, it seems that public support mechanisms are adequate, provide specific mechanisms to accommodate the current differ-ences in technology advancement in wave and emerging ocean energy technologies, and facilitate the creation of the tidal energy market.
62,5
40,0
22,5
Corporate Member States European funding
Fig. 38: Total RD&D investment in wave and tidal energy projects in 2011 in m EUR. Source: Corsatea & Magagna 2013

58
Country type description
United kingdom
Pull Renewable Obligation (RO) Scheme. Renewable Obligation Certificates (ROCs) buyout price set to 30 GBP in 2002/3 rising to 43 GBP in 2014/15. RO scheme will be replaced by a Contract for Difference (CfD) scheme in 2017.
Push Renewable Energy Investment Fund (REIF) Scotland, 103 m GBP.
Marine Energy Array Demonstrator (MEAD), 20 m GBP. MEAD aimed at supporting two pre-commercial projects to demonstrate the operation of wave and/or tidal devices in array formation for an extended period of time, MeyGen project (Table 8).
Energy Technologies Institute (ETI), about 12 m GBP for wave and tidal projects.
The Crown Estate, 3 m GBP spent for enabling activities in the area of project development processes, committed to invest and manage an additional 5.7 m GBP in enabling actions for Pentland and Orkneys. Plans to invest up to 20 m GBP in first array projects.
Marine Renewables Commercialisation Fund (MRCF) Scotland, 18 m GBP. Aquamarine Power and Pelamis Wave Power have been awarded 13 m GBP. 5 m GBP for enabling technologies.
Marine Renewables Proving Fund (MRPF), 22.5 m GBP. Managed by Carbon Trust. Funds awarded to six projects.
Saltire Prize, Scotland, 10 m GBP. For first device delivering > 100 GWh for two years.
France Pull Feed-in Tariff for renewable electricity. Currently 15 c EUR/kWh for ocean energy.
Push ADEME, 1125 m EUR (renewable energy and green chemistry). Specific call for ocean energy funds projects with 4–6 machines at min. generation of 2500 MWh per machine for 2 years. Eight projects have submitted proposals, selection finalised by end of 2014. Each project might receive 30 m EUR and benefits from a Feed-in Tariff of 17.3 c EUR/kWh.
Ireland Pull Feed-in Tariff for ocean energy of 0.26 c EUR/kWh (up to 30 MW) from 2016.
Push SEAI Prototype Development Fund, 26 m EUR.
Ocean Energy Development Budget will be increased by 16.8 m EUR to 26.3 m EUR by 2016, mainly for test centres.
SEAI Sustainable RD&D programme, 3.5 m EUR.
Portugal Push Fundo de Apoio à Inovação (FAI) for renewable energies, 76 m EUR total.
Spain Pull Feed-in Tariff suspended for all renewables, replaced in 2014 by a scheme of a fixed annual investment bonus for existing installations.
Push EvE, 3 m EUR scientific programme for ocean energy demonstration.
Denmark Pull Maximum tariff of 8 c EUR/kWh (sum of market price and bonus) for ocean energy.
Push Energinet.dk, 2.4 m EUR for minor renewable energy technologies (e.g. Pv, wave, biogasification) by ForskvE. In 2015 round, the programme for development and demonstration projects will provide about 13.4 m EUR of funds.
Germany Pull Feed-in Tariff, 3.5–12.5 c EUR/kWh for ocean energy, depending on installed capacity.
Sources: IEA-OES 2012; IEA-OES 2013; ADEME 2013; SEIA 2013; The Crown Estate 2013; Badcock-Broe et al. 2014; EvE 2014; Sabella 2014; The Crown Estate 2014; knowledge Transfer Network 2014; Real Decreto 413/2014 2014; Orden IET/1045/2014 2014; Energinet.dk 2014; EEG 2014
fund type description
NER 300 Push Demonstration programme for renewable energy and CCS projects, 2.1 bn EUR. Funds five ocean energy projects (two wave, two tidal, one OTEC) in the EU (about 140 m EUR).
h 2020 Push EU Research and Innovation programme, 80 bn EUR from 2014 to 2020. Ocean energy is one of the priorities of the programme. Until now, four calls in the area of low-carbon energy (approx. 85–110 m EUR each) have been launched, funding the development of innovative designs and components, and research to ensure efficiency and long-term reliability, but also the demonstration of advanced full-scale devices in real-world conditions.About 200 m EUR have been earmarked for marine research and innovation in 2014 and 2015.
Structural and cohesion funds
Push The two structural funds, the European Regional Development Fund (ERDF) and the European Social Fund (ESF), provide support for the creation of infrastructure and productive job-creating investment, and for the integration into working life of the unemployed and disadvantaged sections of the population.The cohesion funds (total 63.4 bn EUR) also support projects related to the use of renewable energy.
Sources: Commission Decision C(2012) 9432 2012; Commission Decision C(2014) 4493 2014; Commission Decision C(2014) 383 2014; Marine Institute 2014; EC 2014c; EC 2014d; EC 2014e
Table 25: Current market push and pull mechanisms for ocean energy from EU Member States
Table 26: Current market push and pull mechanisms for ocean energy from the EU

59
Table 27: Current market push and pull mechanisms for ocean energy from non-EU countries
Country type description
China Push Special funding programme for MRE (SFPMRE) of about 40 m USD. Twelve R&D and demonstration projects (wave and tidal) are being funded.
Pull Renewable energy electricity price tariff (about 1.5 c EUR/kWh).
US Push Water Power Program (WPP) of Department of Energy (DOE) focussing on wave energy mainly. Portfolio in 2013: 87 projects, 33.8 m USD
Small Business Innovation Research (SBIR)/Small Business Technology Transfer (STTR) program of DEO, awards up to 150 k USD per company working on technology development.
korea Pull Renewable Portfolio Standard (RPS) requires utility companies to supply a certain amount of electricity produced by renewable energy.
Push Ministry of Oceans and Fisheries (MOF) and Ministry of Trade, Industry and Energy (MOTIE) operate RD&D programmes for ocean energy (fundamental R&D and demonstration projects).
Norway Pull Feed-in Tariff of about 7–8 c EUR/kWh (total compensation).
Push Norwegian Energy Agency (Enova), Innovation Norway, Research Council of Norway, total funds approximately 110 m EUR.
Canada Pull Feed-in Tariff for tidal energy for projects at development or testing stage, initial tariff of 37.5 c USD/kWh to 57.5 c USD/kWh declines with increasing output.
Feed-in Tariff in Nova Scotia for small-scale in-stream devices from local communities (COMFIT), 65.2 c USD/kWh.
Push Clean Energy Fund (CEF), Program for Energy Research and Development (PERD), ecoENERGy Innovation Initiative (ecoEII), total funds of 37 m USD since 2010.
Sustainable Development Technology Canada (SDTC), 13 m USD for development and demonstration of ocean energy technologies.
Australia Push Australian Renewable Energy Agency (ARENA) with funds of about 2.5 bn AUD until 2022, also responsible for ocean energy where capacity building, knowledge generation and pilot-scale projects will be funded.
Sources: Wang et al. 2011; IEA-OES 2013
Market push
Market pullTechnology development
Dep
loym
ent
Market maturity
Tidal
Wave
Salinity gradient
OTEC
Figure 39: Support mechanisms according to market maturity and deployment level. Filled circles represent technology front-runners. Source: Magagna et al. 2014
5.4 Environmental and administrative issuesThe interaction of ocean energy converters with the surrounding marine environment is one of the barriers that the ocean sector is currently facing. Worldwide policy measures are in place in order to ensure that the potential impacts of any anthropic actions on the marine environment are mitigated and minimised.
Given the nascent status of ocean energy, deploy-ments are often associated with unknown envi-
ronmental impacts, leading to increased scrutiny by regulating and licensing authorities and stake-holders of the potential effects that they could have on the marine habitat.
The uncertainties in identifying and mitigating envi-ronmental and socio-economic impacts, coupled with current licensing measures not implemented to assess ocean energy technologies, constitute one of the major barriers to ocean energy devel-opment. Recognised bottlenecks with regards to environmental and administrative issues that the ocean energy industry faces include:

60
• Environmental: Stringent and costly monitoring requirements, in particular in relation to the size of the project. An additional burden faced by developers in Europe and US relates to moni-toring required prior and after consent. A conser-vative approach is often taken by regulatory authorities, which, unsure of the environmental impacts of ocean energy technologies, enforce extensive monitoring requirements on develop-ments.
• administrative: Lengthy procedures to obtain full consent. There are a lack of uniform proce-dures with regards to licensing and consenting, both globally and at the EU level; often different consents are required, increasing the time and burden on project developers.
• Social acceptance: Ocean energy deployments can experience significant delays and opposition from local communities if they are not correctly engaged.
Whilst it is likely that the above issues will fade with improvements to the technologies, with increased knowledge, and with more familiarity of the regu-lating authorities with project developments, addressing the above issues in the short term will remove the inherent sense of risk perceived by developers and allow the design of mitigation measures to minimise or eliminate significant envi-ronmental impacts.
In the past few years a number of initiatives have been undertaken to address administrative bottle-necks, environmental uncertainties and social impacts of ocean energy converters. IEA Ocean Energy Systems has implemented Annex Iv to increase the understanding of the environmental effects of ocean wave, tidal, OTEC and salinity gradient technologies on the marine environment
(IEA-OES 2014c). Also, ongoing standardisation activities on ocean energy, under IEC Technical Committee 114, include the evaluation and mitiga-tion of environmental impacts (IEC 2015).
At the European level, different projects such as ORECCA, WavePlam, SOWFIA and SI Ocean aim at addressing administrative and environmental barriers. They focus on identifying scope for stream-lining consenting processes across Europe, and for the development of environmental best practices and joint monitoring programmes. A fundamental step undertaken in the process of drawing up recom-mendations consisted in an extensive review of:
• The implementation of environmental legis-lation and energy policy across the different Member States, including the EIA Directive, the SEA Directive, the Birds and habitat Directive, the Energy Directive and the Marine Strategy Framework Directive (MSFD).
• Monitoring methodologies, environmental stan-dards and state-of-the-art environmental impact assessments for wave and tidal energy projects.
• The policy scenarios across Europe, and theimplementation of consenting procedures in each Member State of the European Union.
It is important to note that the sets of recommen-dations provided by the various projects are conver-gent and have found wide support among European stakeholders, including developers, academics and scientists, as presented in the Annex document of the Integrated Roadmap (EC 2014b). Specific recom-mendations include:
• Ensuring that existing consenting proceduresfor ocean energy are fit for purpose, possibly by
Country Strategic Environmental assessment for Ocean Energy
maritime Spatial plan in place
‘One-Stop-Shop’ for Consenting
Wave tidal
Denmark No No resource Under development yes
France No No Under development No
Ireland yes Near completion No No
Portugal Partially No resource yes Under development a
Spain No No resource yes b No
Uk – Scotland yes yes Near completion c yes
Uk – England yes yes Under development yes
Uk – Wales yes yes Under development No
Uk – Northern Ireland yes yes Under development Under development
a dedicated consent not yet completely streamlined, encompassing 4 different authorities; b adopted under the MSFD; c Draft National Marine Plan for Scotland not yet publishedSources: ORECCA 2011; holcombe-henley 2013; SOWFIA 2013a; SOWFIA 2013b; Badcock-Broe et al. 2014
Table 28: Review of consenting processes across EU Member States located in the Atlantic Arc

61
implementing a ‘one-stop-shop’ for consenting across the EU or ensuring interdependency of permits.
• Designingmonitoringrequirementsthatarefitforthe project size, with regards to data collection, to ensure developers’ costs are minimised.
• Acceleratinglearningratewithregardstopoten-tial impacts due to ocean energy developments, by facilitating adaptive management (survey–deploy–monitor), importing the experience of test centres and developing an EU-wide research programme on environmental impacts.
5.5 grid availability and integration: a Joint approachThe availability of grid near in the proximity of proposed ocean energy projects is one of the rising issues for the ocean energy sector, which is looking to move towards the deployment of early arrays. Areas in Europe that offer good ocean energy resources are remote and often not connected with existing grid installation, thus requiring either grid upgrades or new-built capacity. Grid availability, however, is not expected to be critical in all markets, providing an advantage to countries where resources are located more closely to distribution centres, such as France, Portugal and The Netherlands (IRENA 2014b).
Depending on the location, device/project devel-opers may have to cover part of the costs associ-ated with any updates (O’Sullivan & Dalton 2009), according to the charging regime in place in a deter-mined area. Two common charging systems are in place in Europe: deep charging, where the developer pays for the equipment and the reinforcement of the grid infrastructure, and shallow charging, where developers cover the cost of equipment (e.g. cables, substations) and the grid or transmission operator covers the cost of grid reinforcement.
Despite the introduction of the RES Directive and EU policies pushing for the implementation of shallow-charging regimes, in many instance deep-charging regimes are found to be prev-alent in the EU (Scott 2007). To a certain extent, the ocean energy sector is in a similar position to where the wind industry was previously, in devel-oping a resource-based technology with most of the current infrastructure developed on availability and usage. Grid-availability issues are starting to be experienced now with the announcement and the development of the first array projects, with tech-nologies moving away from ad-hoc test centres. The European Wind Energy Association (EWEA) has already proposed guiding principles for the integra-tion of wind energy within the existing grid infra-structure, focussing on the framework set by the
RES Directive to guarantee transmission and distri-bution of the electricity generated by renewable sources (EWEA 2012).
The development of a more integrated European grid, presented by the European Network of Transmission System Operators for Electricity (ENTSO-E), and the implementation of the 2030 Climate and Energy Policy Framework will play an important role in defining renewables integration in the European energy system (ENTSO-E 2014a; European Council 2014). In this context, ENTSO-E has already stated that meeting the new targets will require the devel-opment of new infrastructure (ENTSO-E 2014a). There is therefore scope for RES stakeholders and energy developers to ensure that renewable elec-tricity in remote locations is taken into account, and upgrades timely implemented.
Additionally to grid-availability issues, there are a number of technical issues that technology devel-opers need to solve concerning the integration of ocean energy power within the existing grid infra-structure, in order to ensure grid stability and power smoothing, and matching the requirements of traditional transmission and distribution systems. As seen in previous sections, frequency converters are often employed along PTO to optimise elec-tricity generation and match the renewable source to grid requirement (O’Sullivan & Dalton 2009). In Europe, Transmission System Operators (TSOs) have defined grid and distribution codes, which regulate the connection of electricity generators to the distri-bution network (Preda et al. 2012; ENTSO-E 2014b).
A review of grid integration and power quality has been developed within the MaRINET project, high-lighting that employing state-of-the-art technology from wind, such as frequency converters, will likely allow for grid-compliant installations of ocean energy farms (Giebhardt et al. 2014). Similarly, with regards to power quality of wave and tidal energy, the reports highlights the strong connection of the IEC62600 Standard ‘Marine Energy – Wave, tidal and other water current converters’ with its wind correspondent, IEC61400-21 ‘Wind turbine gener-ator systems’.
The correspondence and rooting of ocean energy grid codes and power quality of ocean energy systems within wind energy industry technology offer areas for concerted RD&D efforts between the two sectors. Electrical and infrastructural costs account for about 10–15 % of wind and ocean energy farms’ expenditure, and the identification of mutual solutions to both availability and integration issues will provide a common avenue for the reduc-tion of LCOE, and a pathway for R&D synergies in both sectors (Figure 40).

62
20%
28%
11%
13%
10%
5%1% 11%
A
18%
22%
14%10%
24%
5%
2%5%
B C
Operation & Maintenance PTO Electrical Structure Logistic/Installation Project development Other Capex Other variable costs
Shared Non shared
Fig. 40: Synergies between wave and tidal and offshore wind cost components. A: Wind, B: Wave and Tidal, C: Overall. Source: JRC 2014

63
6 KEy fiNdiNgS aNd CONCLUSiONS
This report aimed at presenting the overall state of play of ocean energy in Europe and globally in 2014. The report analysed in depth the four main types of ocean energy conversion technologies and the key activities undertaken to ensure and facil-itate their commercialisation. Emphasis was given to wave and tidal energy technologies, which at the moment represent the most advanced types and those expected to contribute in the near future to the European integrated energy system. OTEC and salinity gradient technologies are currently behind in terms of development, with the first models ready for trial deployments.
The year 2014 represented a significant milestone for the sector from a policy standpoint, with the publication of the Blue Energy Communication, the establishment of the Ocean Energy Forum and the European Technology and Innovation Platform for Ocean Energy (TIP). The announcement of the awards for the second NER 300 call has seen the number of ocean energy arrays expected to be deployed in European waters by 2018 or earlier rising to five. On the other hand, forecasts of expected ocean energy capacity by 2020 have been further reduced, due to the slow technological progress of the sector and difficulties in attracting funds and financing. The slow growth of the sector and delays in the forma-tion of the market have forced key developers and OEMs to either downsize or withdraw their interest in developing ocean energy technology.
The ocean energy market is still in its infancy, and whilst foundations for its growth have been put in place, the sector seeks to further prove the reli-ability of its technology moving towards demon-stration of pre-commercial arrays. A number of key developments have been seen in 2014 to ensure the establishment of ocean energy markets in Europe and worldwide, including:
• About 30 tidal and 45 wave energy companiesare currently at an advanced stage of technolog-ical development, with a number of technologies nearing pre-commercial array demonstration and others deploying full-scale prototypes in real-sea environments.
• Europecouldseeupto40MWoftidal installedcapacity by 2018, and 26 MW of wave energy
capacity, if proposed and awarded projects go ahead and reach financial close.
• The deployment of the first tidal energy arrayis expected for 2016 in the Uk, with MeyGen becoming the first ocean energy project to reach financial close. The tidal sector has seen an increased participation of OEMs in the develop-ment of technology and in promoting tidal farms across Europe; however, the costs and reliability of technologies will be paramount in assuring further developments. The development of second- and third-generation tidal technologies is opening up possibilities for cost reduction as well as deploy-ments in low-energy-density water.
• The development of wave energy technologiesis lagging behind that of tidal energy. however, deployment projects are currently taking place in Europe, the US and Australia. The sector is, however, seeing intensified collaboration to iden-tify common PTO solutions.
• OTECandsalinitygradienttechnologiesaredevel-oping demonstration plants. A 10 MW OTEC plant has been awarded funds through NER 300, whilst a 50 kW salinity gradient pilot-plant began opera-tion in the Netherlands.
Ocean energy technologies face four main bottle-necks: technology development, finance and markets, environmental and administrative issues and grid. Overcoming these issues requires concerted efforts by industry, academia and the support of policy makers. Fundamental in over-coming technology barriers will be the implemen-tation of technology-specific support mechanisms and kPI. Public mechanisms so far proposed appear to be adequate to sustain the growth of the sector, though it is essential they can be tailored to the needs of the various technologies and their status. Continued concerted efforts and the harmonisa-tion of policy at MS levels are expected to help the sector overcoming administrative and environ-mental issues, whilst the shift towards a more inte-grated European Energy system may help alleviate the infrastructural issues such as grid availability.
A number of initiatives funded through the EU, IEA and research councils are looking to identify solu-tions to overcoming recognised barriers to commer-cialisation of ocean energy.

64
7 REfERENCES
Achilli & Childress (2010). Achilli, A. & Childress, A. E.: Pressure-Retarded Osmosis: From the vision of Sidney Loeb to the First Prototype Installation – Review. Desalination 261 (205–211). DOI: 10.1016/j.desal.2010.06.017.
ADEME (2013). Programme démonstrateurs et plate-formes technologiques en énergies renouvelables et décarbonées et chimie verte Appel à Manifestations d’Intérêt (AMI) Thématique Energies Marines. Fermes pilote hydroliennes.
ADEME (2014). Investissements d’avenir: 2 projets sélectionnés dans le cadre de l’AMI fermes pilotes hydroliennes. URL: http://www.presse.ademe.fr/wp-content/uploads/2014/12/20141203-CP-AMI-fermespiloteshydro.pdf. Accessed: 9 December 2014.
AEL (2014). Aviation Enterprises: New Third-Generation Spar Materials Set to Cut the Cost of Tidal Blades in 2014. Aviation Enterprises, Lambourn.
Akram (2010). Akram, M. W.: Fatigue Modelling of Composite Ocean Current Turbine Blades. Masters Thesis, College of Engineering and Computer Science, Florida Atlantic University.
Andritz (2014). Renewable Energy from Tidal Currents. Andritz hydro hammerfest, hammerfest.
Anonymous (1930). Power from the Sea. Popular Mechanics Magazine 54 (881–883).
Aquamarine Power (2014). Aquamarine Power Releases Performance Data and Details of Planned Improvements to Oyster 800. URL: http://www.aquamarinepower.com/news/aquamarine-power-releases-performance-data-and-details-of-planned-improvements-to-oyster-800.aspx. Accessed: 28 January 2015.
ARENA (2014a). Commercial Readiness Index for Renewable Energy Sectors. Australian Renewable Energy Agency (ARENA), Canberra.
ARENA (2014b). Projects. URL: http://arena.gov.au/projects/. Accessed: 28 January 2015.
Avery & Wu (1994). Avery, W. h. & Wu, C.: Renewable Energy from the Ocean. A Guide to OTEC. Oxford University Press, Oxford.
Badcock-Broe et al. (2014). Badcock-Broe, A., Flynn, R., George, S. et al: Wave and Tidal Energy Market Deployment Strategy for Europe. Strategic Initiative for Ocean Energy (SI Ocean).
BBC (2014a). BBC News – Jobs Threat as Aquamarine Power ‘Downsizes’. URL: http://www.bbc.co.uk/news/uk-scotland-scotland-business-30313111. Accessed: 10 December 2014.
BBC (2014b). BBC News – hayle Wave hub to Get First Energy Device. URL: http://www.bbc.com/news/uk-england-cornwall-27929464. Accessed: 28 January 2015.
Berger & Berger (1986). Berger, L. R. & Berger, J. A.: Countermeasures to Microbiofouling in Simulated Ocean Thermal Energy Conversion heat Exchangers with Surface and Deep Ocean Waters in hawaii. Applied and Environmental Microbiology 51 (1186–1198).
Big Island video News (2012). OTEC Plans for NELhA Test Platform Detailed. URL: http://www.bigislandvideonews.com/2012/07/26/otec-plans-for-nelha-test-platform-detailed-in-draft-ea/.
Bir & Migliore (2004). Bir, G. & Migliore, P.: Preliminary Structural Design of Composite Blades for Two- and Three-Blade Rotors. National Renewable Energy Laboratory (NREL), Golden, Colorado.
Bir et al. (2011). Bir, G., Lawson, M. J. & Li, y.: Structural Design of a horizontal-Axis Tidal Current Turbine Composite Blade. ASME 30th International Conference on Ocean, Offshore and Arctic Engineering.
Bluerise (2014). Offshore Ocean Thermal Energy Conversion. Feasibility Study of a 10MW Installation. Delft, The Netherlands.
Bluewater (2014). Partners Sign Agreement to Install a Floating Tidal Energy Platform near Texel. URL: http://www.bluewater.com/news-events/news.
BNEF (2014). Tidal Stream and Wave Power – A Lot Still to Prove. URL: http://about.bnef.com/press-releases/ tidal-stream-wave-power-lot-still-prove/.
Bosch Rexroth (2014). Wave Industry Leaders and Bosch Rexroth Join Forces to Develop a Standardised Offshore Power System. URL: http://www.boschrexroth.com/en/gb/company/press/press-detail-2-77632.
Bower (2013). Bower, S.: Drivetrain Options for Tidal Stream. All-Energy Conference 2013.
Brogioli (2009). Brogioli, D.: Extracting Renewable Energy from a Salinity Difference Using a Capacitor. Physical Review Letters 103 (058501). DOI: 10.1103/PhysRevLett.103.058501.
Buonomenna (2013). Buonomenna, M. G.: Nano-Enhanced Reverse Osmosis Membranes. Desalination 314 (73–88). DOI: 10.1016/j.desal.2013.01.006.
Business Green (2014). Siemens to Offload Marine Current Turbines’ Tidal Power Business. URL: http://www.businessgreen.com/bg/news/2383214/siemens-to-offload-marine-current-turbines-tidal-power-business. Accessed: 27 November 2014.
Capmix (2014). Objectives. URL: http://www.capmix.eu/objectives.
Carbon Trust (2011). Accelerating Marine Energy: The Potential for Cost Reduction – Insights from the Carbon Trust Marine Energy Accelerator. Carbon Trust, London, Uk.
Carbon Trust (2014). Marine Renewables Commercialisation Fund – Carbon Trust. URL: http://www.carbontrust.com/client-services/technology/innovation/marine-renewables-commercialisation-fund.
Cavrot (1993). Cavrot, D. E.: Economics of Ocean Thermal Energy Conversion (OTEC). Renewable Energy 3 (891–896). DOI: 10.1016/0960-1481(93)90047-k.
Cebr (2014). hogan, O., Sheehy, C., Ismail, O. et al: The Economic Case for a Tidal Lagoon Industry in the Uk. Centre for Economics and Business Research (Cebr).
Charlier & Justus (1993). Charlier, R. h. & Justus, J. R. (eds): Ocean Energies: Environmental, Economic and Technological Aspects of Alternative Power Sources.
Cheng et al. (2013). Cheng, Q., Zheng, y., yu, S. et al: Surface Modification of a Commercial Thin-Film Composite Polyamide Reverse Osmosis Membrane through Graft Polymerization of N-isopropylacrylamide Followed by Acrylic Acid. Journal of Membrane Science 447 (236–245). DOI: 10.1016/j.memsci.2013.07.025.

65
Chou et al. (2012). Chou, S., Wang, R., Shi, L. et al: Thin-Film Composite hollow-Fiber Membranes for Pressure-Retarded Osmosis (PRO) Process with high Power Density. Journal of Membrane Science 389 (25–33). DOI: 10.1016/j.memsci.2011.10.002.
Claude (1930). Claude, G.: Power from the Tropical Seas. Mechanical Engineering 52 (1039–1044).
Coastal Response Research Center (2010). Cunningham, J. J., Magdol, Z. E. & kinner, N. E.: Technical Readiness of Ocean Thermal Energy Conversion (OTEC). University of New hampshire, Durham.
Cohen (2009). Cohen, R.: An Overview of Ocean Thermal Energy Technology, Potential Market Applications and Technical Challenges. 2009 Offshore Technology Conference.
COM(2012) 494 final (2012). Blue Growth Opportunities for Marine and Maritime Sustainable Growth.
COM(2013) 253 (2013). Energy Technologies and Innovation.
COM(2014) 8 final (2014). Blue Energy: Action Needed to Deliver on the Potential of Ocean Energy in European Seas and Oceans by 2020 and Beyond.
Commission Decision C(2012) 9432 (2012). Commission Implementing Decision of 18.12.2012. Award Decision under the first call for proposals of the NER 300 funding programme.
Commission Decision C(2014) 383 (2014). Commission Implementing Decision of 31.1.2014 amending Commission Implementing Decision C(2012) 9432 so as to modify the Award Decision under the first call for proposals of the NER 300 funding programme.
Commission Decision C(2014) 4493 (2014). Commission Implementing Decision of 8.7.2014. Award Decision under the second call for proposals of the NER 300 funding programme.
Corsatea & Magagna (2013). Corsatea, T. D. & Magagna, D.: Overview of European Innovation Activities in Marine Energy Technology. Publications Office of the European Union, Luxembourg.
Crown Estate, The (2013). The Crown Estate Wave and Tidal Programme. Investment in First Array Projects – Guidance Document, January 2013. The Crown Estate.
Crown Estate, The (2014). Crown Estate Unlocks Further Uk Wave and Tidal Current Opportunities. URL: http://www.thecrownestate.co.uk/news-and-media/news/2014/further-uk-wave-and-tidal-opportunities-unlocked/.
Crown Estate, The (2014). The Crown Estate – Project Investments. URL: http://www.thecrownestate.co.uk/energy-and-infrastructure/wave-and-tidal/wave-and-tidal-current/working-with-us/project-investments/. Accessed: 8 October 2014.
Cruz (2008). Cruz, J.: Ocean Wave Energy. Current Status and Future Prespectives. Springer.
CSIRO (2012). Behrens, S., Griffin, D., hayward, J. et al: Ocean Renewable Energy: 2015–2050. An Analysis of Ocean Energy in Australia. Commonwealth Scientific and Industrial Research Organisation (CSIRO), Collingwood.
Daily Fusion, The (2014). First Salinity Gradient Power Station to Open Next Month. URL: http://dailyfusion.net/2014/01/first-salinity-gradient-power-station-to-open-next-month-26025/.
D’Arsonval (1881). D’Arsonval, J.-A.: Utilisation des forces naturelles. Avenir de l’électricité. La Revue scientifique de la France et de l’étranger 17 (370–372).
Davies et al. (2013). Davies, P., Germain, G., Gaurier, B. et al: Evaluation of the Durability of Composite Tidal Turbine Blades. Proceedings of The Royal Society of London (A) 371 (1–15).
DCNS (2014a). DCNS Takes Control of Openhydro. URL: http://en.dcnsgroup.com/news/dcns-prend-le-controle-dopenhydro.
DCNS (2014b). Ocean Thermal Energy Conversion. URL: http://en.dcnsgroup.com/energy/marine-renewable-energy/ocean-thermal-energy.
DEME (2014). DP Marine Energy and DEME Blue Energy Consortium Successful in Tender. URL: http://www.deme-group.com/news/dp-marine-energy-and-deme-blue-energy-consortium-successful-tender. Accessed: 16 September 2014.
Devis-Morales et al. (2014). Devis-Morales, A., Montoya-Sánchez, R. A., Osorio, A. F. & Otero-Díaz, L. J.: Ocean Thermal Energy Resources in Colombia. Renewable Energy 66 (759–769). DOI: 10.1016/j.renene.2014.01.010.
Drew et al. (2009). Drew, B., Plummer, A. R. & Sahinkaya, M. N.: A Review of Wave Energy Converter Technology. Proceedings of the Institution of Mechanical Engineers, Part A: Journal of Power and Energy 223 (887–902). DOI: 10.1243/09576509JPE782.
EC (2014a). European Commission: Towards an Integrated Roadmap: Research and Innovation Challenges and Needs of the EU Energy System. Brussels.
EC (2014b). European Commission: Strategic Energy Technology (SET) Plan. Towards an Integrated Roadmap: Research and Innovation Challenges and Needs of the EU Energy System. ANNEx I: Research and Innovation Actions.
EC (2014c). EU Support for Ocean Energy. URL: http://ec.europa.eu/research/energy/eu/index_en.cfm? pg=research-ocean-support. Accessed: 10 October 2014.
EC (2014d). Structural Funds and Cohesion Fund. URL: http://europa.eu/legislation_summaries/glossary/structural_cohesion_fund_en.htm. Accessed: 10 October 2014.
EC (2014e). Cohesion Fund. URL: http://ec.europa.eu/regional_policy/thefunds/cohesion/index_en.cfm. Accessed: 10 October 2014.
EEG (2014). Gesetz für den Ausbau erneuerbarer Energien – EEG 2014. BGBl. 2014 I Nr. 33 S.1066.
Elghali et al. (2007). Elghali, S. E. Ben, Benbouzid, M. E. h. and Charpentier, J. F.: Marine Tidal Current Electric Power Generation Technology: State of the Art and Current Status. 2007 IEEE International Electric Machines and Drives Conference. IEEE.
Emadzadeh et al. (2014). Emadzadeh, D., Lau, W. J., Matsuura, T. et al: The Potential of Thin-Film Nanocomposite Membrane in Reducing Organic Fouling in Forward Osmosis Process. Desalination 348 (82–88). DOI: 10.1016/j.desal.2014.06.008.
EMEC (2014a). Tidal Developers. URL: http://www.emec.org.uk/marine-energy/tidal-developers/. Accessed: 19 November 2014.
EMEC (2014b). Wave Developers. URL: http://www.emec.org.uk/marine-energy/wave-developers/. Accessed: 19 November 2014.
Energinet.dk (2014). ForskEL and ForskvE Call 2015. Energinet.dk.
ENR (2014). Syndicat des Énergies Renouvelables: Annuaire de la filière française des énergies marines renouvelables. URL: http://www.enr.fr/recherche-adherents.php.
ENTSO-E (2014a). Ten-year Network Development Plan 2014. URL: https://www.entsoe.eu/major-projects/ten-year-network-development-plan/tyndp-2014/Pages/default.aspx.
ENTSO-E (2014b). ENTSO-E Network Code for Requirements for Grid Connection Applicable to All

66
Generators. URL: https://www.entsoe.eu/major-projects/network-code-development/requirements-for-generators/Pages/default.aspx.
Ernst & young (2013). Rising Tide. Global Trends in the Emerging Ocean Energy Market. Ernst & young.
ETRI (2014). Carlsson, J.: Energy Technology Reference Indicator (ETRI) Projections for 2010–2050. Publications Office of the European Union, Luxembourg.
European Council (2014). European Council (23 and 24 October 2014). Conclusions on 2030 Climate and Energy Policy Framework. Brussels.
EvE (2014). Programa de ayudas a inversiones en energías renovables bases. Ente vasco de la Energía (EvE), Bilbao.
EWEA (2012). Pineda, I.: Good Practices for Grid Connection – European Wind Industry Perspective. Sofia.
Fava & Thomas (1978). Fava, J. A. & Thomas, D. L.: Use of Chlorine to Control OTEC Biofouling. Ocean Engineering 5 (269–288). DOI: 10.1016/0029-8018(78)90004-5.
Finney (2008). Finney, k. A.: Ocean Thermal Energy Conversion. Guelph Engineering Journal 1 (17–23).
Fortum (2014a). Fortum och Seabased: Installationen av världens största vågkraftspark påbörjades idag utanför Sotenäs. URL: http://media.fortum.se/2014/07/01/fortum-och-seabased-installationen-av-varldens-storsta-vagkraftspark-paborjades-idag-utanfor-sotenas/.
Fortum (2014b). Fortum to Continue Its Research Investments in Wave Power Technology Development by Acquiring a Stake in Wello Oy. URL: http://www.fortum.com/en/mediaroom/pages/fortum-to-continue-its-research-investments-in-wave-power-technology-development-by-acquiring-a-stake-in-wello-oy.aspx.
Fortum (2014c). Fortum and Sitra Increased Their Contribution to Wave Energy Technology. URL: http://www.google.nl/url?sa=t&rct=-j&q=&esrc=s&source=web&cd=1&ved=0C-CMQFjAA&url=http%3A%2F%2Fwww.fortum.com%2Fen%2Fmediaroom%2Fpag-es%2Ffortum-and-sitra-increased-their-con-tribution-to-wave-energy-technology.aspx&ei=2dxlvJrnDIa4OM-agOgB&usg=AFQjCN-h6FUmex1I29nnG38Tw1kue5JkzSQ&sig2=GEh-dr_2zDrbb5t0ebsW9vg&bvm=bv.79142246,d.ZWU.
France Energies Marines (2014). Parcs pilotes d’hydroli-ennes en France – France Energies Marines. URL: http://www.france-energies-marines.org/Actualites/Quoi-de-neuf/Parcs-pilotes-d-hydroliennes-en-France.
Fu et al. (2014). Fu, F.-J., Sun, S.-P., Zhang, S. & Chung, T.-S.: Pressure-Retarded Osmosis Dual-Layer hollow-Fiber Membranes Developed by Co-casting Method and Ammonium Persulfate (APS) Treatment. Journal of Membrane Science 469 (488–498). DOI: 10.1016/j.memsci.2014.05.063.
Fujita et al. (2012). Fujita, R., Markham, A. C., Diaz, J. E. et al: Revisiting Ocean Thermal Energy Conversion. Marine Policy 36 (463–465). DOI: 10.1016/j.marpol.2011.05.008.
Gerstandt et al. (2008). Gerstandt, k., Peinemann, k.-v., Skilhagen, S. E. et al: Membrane Processes in Energy Supply for an Osmotic Power Plant. Desalination 224 (64–70). DOI: 10.1016/j.desal.2007.02.080.
Giebhardt et al. (2014). Giebhardt, J., kracht, P., Dick, C. & Salcedo, F.: Report on Grid Integration and Power Quality Testing. Deliverable 4.3 final. MaRINET.
Gilmore et al. (2014). Gilmore, E. A., Blohm, A. & Sinsabaugh, S.: An Economic and Environmental Assessment of Transporting Bulk Energy from a Grazing Ocean Thermal Energy Conversion Facility. Renewable Energy 71 (361–367). DOI: 10.1016/j.renene.2014.05.021.
Grimwade et al. (2012). Grimwade, J., hails, D., Robles, E. et al: Review of Relevant PTO Systems. D2.03. MaRINET, Cork.
Güler et al. (2013). Güler, E., Elizen, R., vermaas, D. A. et al: Performance-Determining Membrane Properties in Reverse Electrodialysis. Journal of Membrane Science 446 (266–276). DOI: 10.1016/j.memsci.2013.06.045.
Güler et al. (2014). Güler, E., Elizen, R., Saakes, M. & Nijmeijer, k.: Micro-Structured Membranes for Electricity Generation by Reverse Electrodialysis. Journal of Membrane Science 458 (136–148). DOI: 10.1016/j.memsci.2014.01.060.
han et al. (2013). han, G., Zhang, S., Li, x. & Chung, T.-S.: high-Performance Thin-Film Composite Pressure-Retarded Osmosis (PRO) Membranes for Renewable Salinity-Gradient Energy Generation. Journal of Membrane Science 440 (108–121). DOI: 10.1016/j.memsci.2013.04.001.
held et al. (2006). held, A., Ragwitz, M. & haas, R.: On the Success of Policy Strategies for the Promotion of Electricity from Renewable Energy Sources in the EU. Energy & Environment 17 (849–868). DOI: 10.1260/095830506779398849.
herbert (2014). herbert, S.: Wave hub Update. All-Energy Uk.
holcombe-henley (2013). holcombe-henley, S.: Ocean Energy in Europe’s Atlantic Arc: An Overview of Policy and Market Conditions in Denmark, France, Ireland, Portugal, Spain and the United kingdom. Strategic Initiative for Ocean Energy (SI Ocean).
hong & Chen (2014). hong, J. G. & Chen, y.: Nanocomposite Reverse Electrodialysis (RED) Ion-Exchange Membranes for Salinity Gradient Power Generation. Journal of Membrane Science 460 (139–147). DOI: 10.1016/j.memsci.2014.02.027.
house of Commons (2013). A Severn Barrage? Government Response to the Committee’s Second Report of Session 2013–14. house of Commons Energy and Climate Change Committee.
IEA-OES (2012). Anonymous: Annual Report 2012. Implementing Agreement on Ocean Energy Systems. IEA-OES, Lisboa.
IEA-OES (2013). Anonymous: Annual Report 2013. Implementing Agreement on Ocean Energy Systems. IEA-OES, Lisboa.
IEA-OES (2014a). Annex v: The Exchange and Assessment of Ocean Energy Device Project Information and Experience. URL: http://www.ocean-energy-systems.org/about-oes/work-programme/annex-v-project-information/.
IEA-OES (2014b). Annex II: Development of Recommended Practices for Testing and Evaluating Ocean Energy Systems. URL: http://www.ocean-energy-systems.org/annex-ii-guidelines/.
IEA-OES (2014c). Annex Iv: Assessment of Environmental Effects and Monitoring Efforts for Ocean Wave, Tidal, and Current Energy Systems. URL: http://www.ocean-energy-systems.org/about-oes/work-programme/annex-iv-environmental-issues/.
IEC (2015). IEC-TC 114 Scope. URL: http://www.iec.ch/dyn/www/f?p=103:7:0::::FSP_ORG_ID,FSP_LANG_ID:1316,25.
IEEE Spectrum (2014). Strickland, E.: Lockheed Martin Pioneers Ocean Energy in China. URL: http://spectrum.ieee.org/green-tech/geothermal-and-tidal/lockheed-martin-pioneers-ocean-energy-in-china.
INSA (2001). Department of Ocean Development: Pursuit and Promotion of Science: The Indian Experience. Indian National Science Academy, New Delhi.

67
IRENA (2014a). kempener, R. & Neumann, F.: Tidal Energy. International Renewable Energy Agency (IRENA), Abu Dhabi/Bonn.
IRENA (2014b). Mofor, L., Goldsmith, J. & Jones, F.: Ocean Energy. Technology Readiness, Patents, Deployment Status and Outlook. International Renewable Energy Agency (IRENA), Abu Dhabi.
IRENA (2014c). kempener, R. & Neumann, F.: Ocean Thermal Energy Conversion. International Renewable Energy Agency (IRENA), Abu Dhabi/Bonn.
IRENA (2014d). kempener, R. & Neumann, F.: Salinity Gradient Energy. International Renewable Energy Agency (IRENA), Abu Dhabi/Bonn.
Jones & Finley (2003). Jones, A. T. & Finley, W.: Recent Developments in Salinity Gradient Power. Marine Technology Society OCEANS 2003.
JRC (2014). JRC Ocean Energy Database.
knowledge Transfer Network (2014). DECC Marine Energy Array Demonstrator (MEAD) Capital Grant Scheme. URL: http://www.lowcarbonfunding.org.uk/opportunity/decc-marine-energy-array-demonstrator-mead-capital-grant-scheme-15.htm. Accessed: 8 October 2014.
Lacal Arántegui (2014). Lacal Arántegui, R.: 2013 JRC Wind Status Report. Publications Office of the European Union, Luxembourg.
Lacey (1980). Lacey, R. E.: Energy by Reverse Electrodialysis. Ocean Engineering 7 (1–47). DOI: 10.1016/0029-8018(80)90030-x.
Lewis et al. (2011). Lewis, A., Estefen, S., huckerby, J. et al: Ocean Energy. Cambridge University Press, Cambridge/New york.
Lienard & Neumann (2011). Neumann, F., Stenzel, P., hack, P. et al: Salinity Gradient Power in Europe: State of the Art. Institute for Infrastructure, Environment and Innovation, Brussels.
Lynn (2013). Lynn, P. A.: Electricity from Wave and Tide: An Introduction to Marine Energy. John Wiley & Sons.
MacGillivray et al. (2013). MacGillivray, A., Jeffrey, h., hanmer, C. et al: Ocean Energy Technology: Gaps and Barriers. Strategic Initiative for Ocean Energy (SI Ocean).
Magagna (2011). Magagna, D.: Oscillating Water Column Wave Pump: A Wave Energy Converter for Water Delivery.
Magagna et al. (2014). Magagna, D., MacGillivray, A., Jeffrey, h. et al: Wave and Tidal Energy Strategic Technology Agenda. Strategic Initiative for Ocean Energy (SI Ocean).
Marine Institute (2014). €200 Million Earmarked for Marine Research in the EU’s horizon 2020 Programme in 2014–2015. URL: https://www.marine.ie/home/aboutus/newsroom/news/€200millionearmarkedformarinere-searchintheEUshorizon2020programmein2014-2015.htm. Accessed: 10 October 2014.
Maritime Executive (2014). Schottel hydro Focusing on hydrokinetic Energy. URL: http://www.maritime-executive.com/pressrelease/SChOTTEL-hyDRO-Focusing-on-hydrokinetic-Energy--2014-11-07.
Martel et al. (2012). Martel, L., Smith, P., Rizea, S. et al: Ocean Thermal Energy Conversion Life Cycle Cost Assessment. Final Technical Report. Manassas.
MCT (2014). Siemens, Bluewater and Minas to Install Floating Tidal Current Turbines in Canada’s Bay of Fundy. URL: http://www.marineturbines.com/News/2014/04/04/siemens-bluewater-and-minas-install-floating-tidal-current-turbines-canadas-bay.
Meyer et al. (2011). Meyer, L., Cooper, D. & varley, R.: Are We There yet? A Developer’s Roadmap to OTEC Commercialization. OCEANS’ 11 MTS/IEEE kONA. hawaii National Marine Renewable Energy Center, kona.
MeyGen (2014a). Technology. URL: http://www.meygen.com/technology/.
MeyGen (2014b). Development Phases. URL: http://www.meygen.com/the-project/development-phases/. Accessed: 16 September 2014.
Minesto (2014a). Minesto: Deep Green – Technical Data. Minesto, västra Frölunda.
Minesto (2014b). DECC Awards over £500,000 for the Continued Development of the Deep Green Tidal Power Plant. URL: http://minesto.com/decc-awards-over-500000-for-the-continued-development-of-the-deep-green-tidal-power-plant/. Accessed: 19 November 2014.
Minesto (2014c). Wales Takes the Lead in Marine Energy. URL: http://minesto.com/wales-takes-the-lead-in-marine-energy/. Accessed: 19 November 2014.
Molenbroek (2007). Molenbroek, E. C.: Energie uit zout en zoet water met osmose. Rijkswaterstaat, Utrecht.
Murthy et al. (2004). Murthy, P. Sriyutha, venkatesan, R., Nair, k. v. k. & Ravindran, M.: Biofilm Control for Plate heat Exchangers Using Surface Seawater from the Open Ocean for the OTEC Power Plant. International Biodeterioration & Biodegradation 53 (133–140).
NELhA (2014). NELhA Energy Portfolio. URL: http://nelha.hawaii.gov/energy-portfolio/.
Nickels et al. (1981). Nickels, J. S., Bobbie, R. J., Lott, D. F. et al: Effect of Manual Brush Cleaning on Biomass and Community Structure of Microfouling Film Formed on Aluminum and Titanium Surfaces Exposed to Rapidly Flowing Seawater. Applied and Environmental Microbiology 41 (1442–1453).
Nihous (2007). Nihous, G. C.: A Preliminary Assessment of Ocean Thermal Energy Conversion Resources. Journal of Energy Resources Technology 129 (10). DOI: 10.1115/1.2424965.
Nihous (2010). Nihous, G. C.: Mapping Available Ocean Thermal Energy Conversion Resources around the Main hawaiian Islands with State-of-the-Art Tools. Journal of Renewable and Sustainable Energy 2 (043104). DOI: 10.1063/1.3463051.
OceaneraNET (2014). OceaneraNET – Joint Calls (1.0.0). URL: http://www.oceaneranet.eu/pages/joint-calls-8.html. Accessed: 14 November 2014.
Offshore Wind (2014). MeyGen Enters Construction Phase. URL: http://www.offshorewind.biz/2014/11/25/meygen-enters-construction-phase/?utm_source=emark&utm_medium=email&utm_campaign=Daily update Offshore Wind, 2014-11-26&uid=3513. Accessed: 27 November 2014.
Ofgem (2014). Ofgem Renewables and ChP Register. URL: https://www.renewablesandchp.ofgem.gov.uk/. Accessed: 19 November 2014.
Olsson (1982). Olsson, M. S.: Salinity-Gradient vapor-Pressure Power Conversion. Energy 7 (237–246). DOI: 10.1016/0360-5442(82)90072-x.
Olsson et al. (1979). Olsson, M., Wick, G. L. & Isaacs, J. D.: Salinity Gradient Power: Utilizing vapor Pressure Differences. Science (New york, Ny) 206 (452–4). DOI: 10.1126/science.206.4417.452.
Orden IET/1045/2014 (2014). Orden IET/1045/2014, de 16 de junio, por la que se aprueban los parámetros retributivos de las instalaciones tipo aplicables a determinadas instalaciones de producción de energía eléctrica a partir de fuentes de energía renovables, cogeneración y residuos.

68
ORECCA (2011). Jeffrey, h. & Sedgwick, J.: ORECCA – European Offshore Renewable Energy Roadmap.
O’Sullivan & Dalton (2009). O’Sullivan, D. & Dalton, G.: Challenges in the Grid Connection of Wave Energy Devices. Proceedings of the 8th European Wave and Tidal Energy Conference (EWTEC 2009).
OTE (2014a). Past Successes. URL: http://www.otecorporation.com/past_strategic_initiatives.html.
OTE (2014b). Current Projects. URL: http://www.otecorporation.com/present_strategic_initiatives.html.
OTEC News (2013). 100-kilowatt Turbine-Generator for kona Test Facility. URL: http://www.otecnews.org/2013/03/100-kilowatt-turbine-generator-for-kona-test-facility/.
OTEC News (2014a). 20kW OTEC Pilot Plant Public Demonstration in South korea. URL: http://www.otecnews.org/2014/01/20kw-otec-pilot-plant-public-demonstration-south-korea/.
OTEC News (2014b). OTEC Testing in the Indian Ocean. URL: http://www.otecnews.org/2013/04/otec-testing-in-the-indian-ocean/.
OTEC News (2014c). Funding NEMO: Offshore OTEC Project Awarded in NER 300 Program. URL: http://www.otecnews.org/2014/07/offshore-otec-project-nemo-awarded-ner-300-funding-program/.
OTEC Okinawa (2014). The Okinawa Prefecture Ocean Thermal Energy Conversion Power Generation Demonstration Project. URL: http://otecokinawa.com/en/.
OTI (2013). O’Rourke, E.: A Developer’s Perspective. Asia Pacific Clean Energy Summit International OTEC Symposium.
OTI (2014). OTEC International LLC Moves Forward on NELhA Planning. URL: http://www.oteci.com/press-releases/otec-international-llc-moves-forward-on- nelha-planning.
Patel (2013). Patel, S.: OTEC Gets Boost with Possibility of 10MW Plant in China. Power 157.
Patel et al. (2014). Patel, R., Chi, W. S., Ahn, S.h. et al: Synthesis of Poly(vinyl chloride)-g-poly(3-sulfopropyl methacrylate) Graft Copolymers and Their Use in Pressure-Retarded Osmosis (PRO) Membranes. Chemical Engineering Journal 247 (1–8). DOI: 10.1016/j.cej.2014.02.106.
Pattle (1954). Pattle, R. E.: Production of Electric Power by Mixing Fresh and Salt Water in the hydroelectric Pile. Nature 174 (660). DOI: 10.1038/174660a0.
Pelamis (2014). A Decade of Wave Power. URL: http://www.pelamiswave.com/news/news/167/A-decade-of-wave-power. Accessed: 14 November 2014.
Pelc & Fujita (2002). Pelc, R. & Fujita, R. M.: Renewable Energy from the Ocean. Marine Policy 26 (471–479). DOI: 10.1016/S0308-597x(02)00045-3.
Plocek et al. (2009). Plocek, T. J., Laboy, M. & Martí, J. A.: Ocean Thermal Energy Conversion (OTEC): Technical viability, Cost Projections and Development Strategies. 2009 Offshore Technology Conference.
Post et al. (2007). Post, J. W., veerman, J., hamelers, h. v. M. et al: Salinity-Gradient Power: Evaluation of Pressure-Retarded Osmosis and Reverse Electrodialysis. Journal of Membrane Science 288 (218–230). DOI: 10.1016/j.memsci.2006.11.018.
Post et al. (2010). Post, J. W., Goeting, C. h., valk, J. et al: Towards Implementation of Reverse Electrodialysis for Power Generation from Salinity Gradients. Desalination and Water Treatment 16 (182–193). DOI: 10.5004/dwt.2010.1093.
Power Technology (2014). Statkraft Osmotic Power Plant, Norway. URL: http://www.power-technology.com/projects/statkraft-osmotic/.
Preda et al. (2012). Preda, T.-N., Uhlen, k. & Nordgård, D. E.: An Overview of the Present Grid Codes for Integration of Distributed Generation. CIRED 2012 Workshop: Integration of Renewables into the Distribution Grid. IET.
Pullen et al. (2009). Pullen, A., hays, k. & knolle, G.: Wind Energy – The Facts. Part Iv – Industry and Markets.
Rajagopalan & Nihous (2013). Rajagopalan, k. & Nihous, G. C.: An Assessment of Global Ocean Thermal Energy Conversion Resources under Broad Geographical Constraints. Journal of Renewable and Sustainable Energy 5. DOI: 10.1063/1.4850521.
Ravilious (2009). Ravilious, k.: Salt Solution: Cheap Power from the River’s Mouth. New Scientist (40–43).
Real Decreto 413/2014 (2014). Real Decreto 413/2014, de 6 de junio, por el que se regula la actividad de producción de energía eléctrica a partir de fuentes de energía renovables, cogeneración y residuos.
Redstack (2014). Pilot Plant of Salinity Gradient Power Generation by Reverse Electro Dialysis is Making Good Progress. URL: http://www.redstack.nl/index.php@option=com_content&view=article&id=30_3aprogress-blue-energy-generation-by-red&catid=2_3aalerts&itemid=6.htm.
Renew Economy (2014). vorrath, S.: Wave Energy Company Oceanlinx Goes into Receivership. URL: http://reneweconomy.com.au/2014/wave-energy-company-oceanlinx-goes-into-receivership-89508.
Renewable Energy Focus (2014). Pelamis Wave Power Limited to be Put into Administration. URL: http://www.renewableenergyfocus.com/view/40731/pelamis-wave-power-limited-to-be-put-into-administration/. Accessed: 28 November 2014.
ReNews (2014a). Cash Awards Buoy PLAT-O Tidal. URL: http://renews.biz/72478/cash-awards-buoy-plat-o-tidal/.
ReNews (2014b). Ceto 5 Comes Alive for Carnegie. URL: http://renews.biz/79763/ceto-5-comes-alive-for-carnegie/. Accessed: 28 November 2014.
Roll Call (2014). Leonard, R.: Ocean Thermal Gets a Second Chance. URL: http://blogs.rollcall.com/energy-xtra/ocean-thermal-gets-a-second-chance/?dcz=.
Sabella (2014). L’entreprise. URL: http://www.sabella.fr/fiche.php?id=1.
Schottel (2013). Schottel Tidal Generator: Cost-Effective Power from Currents. Schottel, Spay.
Schottel (2014). Sustainable Marine Energy Deploys Schottel Turbines on Tidal Platform. URL: http://www.schottel.de/news-events/news/news-detail/?tx_ttnews[tt_news]=121&chash=6a64a47af95dc742f-d50a1a605a43f8f.
Scott (2007). Scott, N. C.: European Practices with Grid Connection, Reinforcement, Constraint and Charging of Renewable Energy Projects.
Scottish Government, The (2014). The Scottish Government: Wave Energy Scotland. URL: http://www.scotland.gov.uk/Resource/0046/00464410.pdf. Accessed: 28 November 2014.
Scottish Renewables (2014). Marine Milestones Report 2012/13. Scottish Renewables, Glasgow.
SEIA (2013). Ocean Energy Development Unit Prototype Development Fund – Call for Expressions of Interest. Sustainable Energy Authority of Ireland (SEIA).

69
Semmari et al. (2012). Semmari, h., Stitou, D. & Mauran, S.: A Novel Carnot-Based Cycle for Ocean Thermal Energy Conversion. Energy 43 (361–375). DOI: 10.1016/j.energy.2012.04.017.
SERI (1989). Ocean Thermal Energy Conversion: An Overview. Golden.
She et al. (2013). She, Q., hou, D., Liu, J. et al: Effect of Feed-Spacer-Induced Membrane Deformation on the Performance of Pressure-Retarded Osmosis (PRO): Implications for PRO Process Operation. Journal of Membrane Science 445 (170–182). DOI: 10.1016/j.memsci.2013.05.061.
Sheng (2013). Sheng, S.: Report on Wind Turbine Subsystem Reliability ─ A Survey of various Databases. National Renewable Energy Laboratory (NREL).
SI Ocean (2013a). Anonymous: Ocean Energy: State of the Art. Strategic Initiative for Ocean Energy (SI Ocean).
SI Ocean (2013b). Anonymous: Ocean Energy: Cost of Energy and Cost Reduction Opportunities. Strategic Initiative for Ocean Energy (SI Ocean).
Skilhagen et al. (2008). Skilhagen, S. E., Dugstad, J. E. & Aaberg, R. J.: Osmotic Power – Power Production Based on the Osmotic Pressure Difference between Waters with varying Salt Gradients. Desalination 220 (476–482). DOI: 10.1016/j.desal.2007.02.045.
Skråmestø et al. (2009). Skråmestø, Ø. S., Skilhagen, S. E. & Nielsen, W. k.: Power Production Based on Osmotic Pressure. Waterpower xvI.
SOWFIA (2011). Osta Mora-Figueria, v., huerta Olivares, C., holmes, B. et al: Catalogue of Wave Energy Test Centres. Plymouth.
SOWFIA (2013a). Simas, T., O’hagan, A. M., O’Callaghan, J. et al: Review of Consenting Processes for Ocean Energy in Different EU Member States.
SOWFIA (2013b). Simas, T., O’hagan, A. M., Bailey, I. et al: Consenting Procedures Review with Guidelines for Expansion to Larger Projects and Approval Process Streamlining, Incorporating the Findings of Interim Report and Feedback from Workshop D.
Statkraft (2014). Statkraft halts Osmotic Power Investments. URL: http://www.statkraft.com/media/news/News-archive/2013/Statkraft-halts-osmotic-power-investments/.
Stenzel (2012). Stenzel, P.: Potentiale der Osmose zur Erzeugung und Speicherung von Elektrizität. Lit verlag, Münster.
Straatman & van Sark (2008). Straatman, P. J. T. & van Sark, W. G. J. h. M.: A New hybrid Ocean Thermal Energy Conversion – Offshore Solar Pond (OTEC – OSP) Design: A Cost-Optimization Approach. Solar Energy 82 (520–527). DOI: 10.1016/j.solener.2007.12.002.
SWD(2014)13 (2014a). European Commission: Commission Staff Working Document Impact Assessment accompanying the document: Communication from the Commission to the European Parliament, the Council, the European Economic and Social Committee and the Committee of the Regions: Ocean Energy Action Needed. Brussels.
SWD(2014)13 (2014b). European Commission: Impact Assessment accompanying the document: Blue Energy: Action Needed to Deliver on the Potential of Ocean Energy in European Seas and Oceans by 2020 and Beyond. Brussels.
Tethys (2014a). MeyGen Tidal Energy Project – Phase I. URL: http://tethys.pnnl.gov/annex-iv-sites/meygen-tidal-energy-project-phase-i.
Tethys (2014b). Environmental Effects Metadata Survey Form – kyle Rhea Tidal Stream Array Project. Sea Generation Ltd.
Tethys (2014c). Environmental Effects Metadata Survey Form – Sound of Islay Demonstration Tidal Array. ScottishPower Renewables.
Thorsen & holt (2009). Thorsen, T. & holt, T.: The Potential for Power Production from Salinity Gradients by Pressure-Retarded Osmosis. Journal of Membrane Science 335 (103–110). DOI: 10.1016/j.memsci.2009.03.003.
Tidal Today (2014a). Siemens-MCT Skerries Project Suspended over Finance. URL: http://social.tidaltoday.com/finance/siemens-mct-skerries-project-suspended-over-finance. Accessed: 19 November 2014.
Tidal Today (2014b). Tidal Today: Global Tidal Marine Development Market Overview 2014.
Trayner (2014). Trayner, P.: Flumill and RES Update. All-Energy Conference 2014.
Upshaw (2012). Upshaw, C. R.: Thermodynamic and Economic Feasibility Analysis of a 20MW Ocean Thermal Energy Conversion (OTEC) Power. Masters Thesis, Graduate School, University of Texas at Austin.
US DOE (2014). Water Power Program: Marine and hydrokinetic (Mhk) System Performance Advancement. URL: http://www1.eere.energy.gov/water/m/financial_opps_detail.html?sol_id=599.
van den Ende & Groemann (2007). van den Ende, k. & Groemann, F.: Briefing Paper – Blue Energy. Leonardo Energy.
vega (2002). vega, L. A.: Ocean Thermal Energy Conversion Primer. Marine Technology Society Journal 6 (25–35).
vermaas (2013). vermaas, D. A.: Energy Generation from Mixing Salt Water and Fresh Water. University of Twente.
Wang et al. (2011). Wang, S., yuan, P., Li, D. & Jiao, y.: An Overview of Ocean Renewable Energy in China. Renewable and Sustainable Energy Reviews 15 (91–111). DOI: 10.1016/j.rser.2010.09.040.
WEC (2013). World Energy Resources 2013 Survey. World Energy Council (WEC), London.
Weller et al. (2013). Weller, S., Johanning, L. & Davies, P.: Best Practice Report – Moorings of Floating Marine Renewable Energy Devices.
Weller et al. (2014). Weller, S., hardwick, J., Johanning, L. et al: A Comprehensive Assessment of the Applicability of Available and Proposed Offshore Mooring and Foundation Technologies and Design Tools for Array Applications. Edinburgh, Uk.
Whitlock (2014). Whitlock, R.: EGP and DCNS to Develop Marine Energy R&D Facility in Chile. URL: http://www.renewableenergymagazine.com/article/egp-and-dcns-to-develop-marine-energy-20141030.
World Ocean Atlas (2013a). Locarnini, R. A., Mishonov, A. v., Antonov, J. I. et al: World Ocean Atlas 2013. volume 1: Temperature. National Oceanic and Atmospheric Administration (NOAA), Silver Spring.
World Ocean Atlas (2013b). Zweng, M., Reagan, J. R., Antonov, J. I. et al: World Ocean Atlas 2013. volume 2: Salinity. National Oceanic and Atmospheric Administration (NOAA), Silver Spring.
yang & yeh (2014). yang, M.-h. & yeh, R.-h.: Analysis of Optimization in an OTEC Plant Using Organic Rankine Cycle. Renewable Energy 68 (25–34). DOI: 10.1016/j.renene.2014.01.029.

70
yoon et al. (2014). yoon, J.-I., Son, C.-h., Baek, S.-M. et al: Efficiency Comparison of Subcritical OTEC Power Cycle Using various Working Fluids. heat and Mass Transfer 50 (985–996). DOI: 10.1007/s00231-014-1310-8.
yu et al. (2013). yu, S., yao, G., Dong, B. et al: Improving Fouling Resistance of Thin-Film Composite Polyamide Reverse Osmosis Membrane by Coating Natural hydrophilic Polymer Sericin. Separation and Purification Technology 118 (285–293). DOI: 10.1016/j.seppur.2013.07.018.
yuan et al. (2013). yuan, h., Mei, N., hu, S. et al: Experimental Investigation on an Ammonia–Water- Based Ocean Thermal Energy Conversion System. Applied Thermal Engineering 61 (327–333). DOI: 10.1016/j.applthermaleng.2013.07.050.
Zhou et al. (2014). Zhou, C., ye, D., Jia, h. et al: Surface Mineralization of Commercial Thin-Film Composite Polyamide Membrane by Depositing Barium Sulfate for Improved Reverse Osmosis Performance and Antifouling Property. Desalination 351 (228–235). DOI: 10.1016/j.desal.2014.07.040.

European Commission
EUR 26983 EN – Joint Research Centre – institute for Energy and transport
Title: 2014 JRC Ocean Energy Status Report
Authors: Davide Magagna, Andreas Uihlein
Luxembourg: Publications Office of the European Union
2015 – 70 pp. – 21.0 x 29.7 cm
EUR – Scientific and Technical Research series – ISSN 1831-9424
ISBN 978-92-79-44611-5
doi: 10.2790/866387
Europe Direct is a service to help you find answers to your questions about the European Union
Freephone number (*): 00 800 6 7 8 9 10 11
(*) Certain mobile telephone operators do not allow access to 00 800 numbers or these calls may be billed.
A great deal of additional information on the European Union is available on the Internet.
It can be accessed through the Europa server http://europa.eu.
How to obtain EU publications
Our publications are available from EU Bookshop (http://bookshop.europa.eu),
where you can place an order with the sales agent of your choice.
The Publications Office has a worldwide network of sales agents.
you can obtain their contact details by sending a fax to (352) 29 29-42758.

72
JRC mission
As the Commission’sin-house science service, the Joint Research Centre’s mission is to provide EU policies with independent, evidence-based scientific and technical support throughout the whole policy cycle.
Working in close cooperation with policy Directorates-General, the JRC addresses key societal challenges while stimulating innovation through developing new methods, tools and standards, and sharing its know-how with the Member States, the scientific community and international partners.
Serving societyStimulating innovation Supporting legislation
doi: 10.2790/866387ISBN 978-92-79-44611-5
LD-N
A-26983-EN-N