2014 january grayreports - student demand trends
TRANSCRIPT
GRAYREPORTS Inquiry Intelligence
www.GrayAssociates.com
January 2014

617.401.7662 www.GrayAssociates.com 2
GRAY For more information please contact Bob Atkins. Email: [email protected]
Contents
1. Education Industry Inquiry Growth 2. Fastest-Growing Cities in January 3. Fastest Growing Programs in January 4. Online Inquiry Share 5. Conversion Rates 6. Average Price per Inquiry
617.401.7662 www.GrayAssociates.com 3
GRAY For more information please contact Bob Atkins. Email: [email protected]
1. Education Industry Inquiry Growth: 2012 vs. 2013
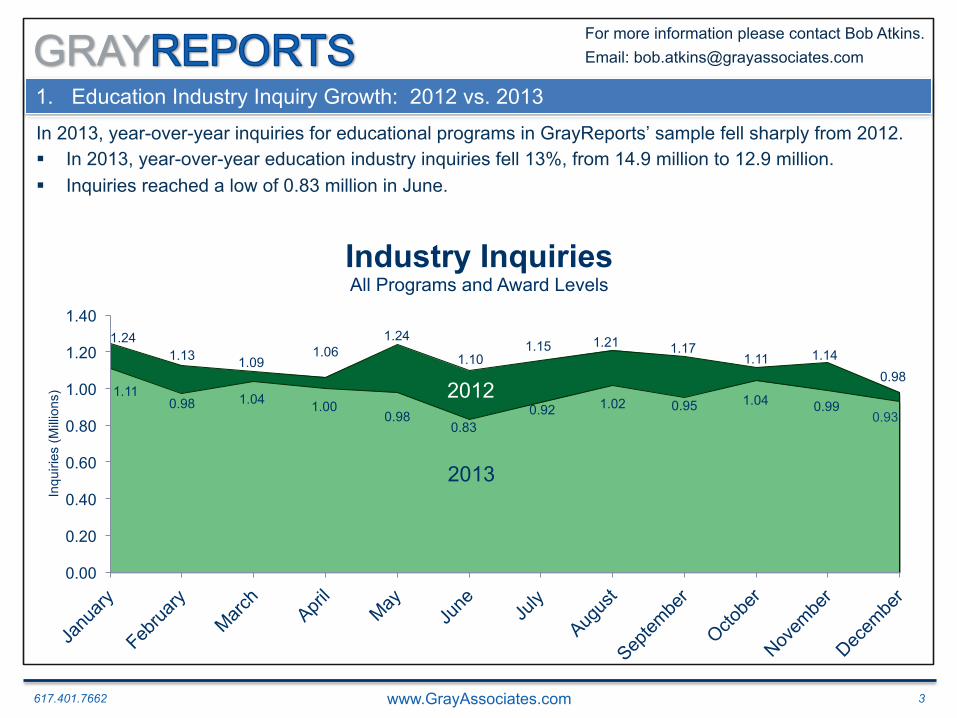
In 2013, year-over-year inquiries for educational programs in GrayReports’ sample fell sharply from 2012. § In 2013, year-over-year education industry inquiries fell 13%, from 14.9 million to 12.9 million. § Inquiries reached a low of 0.83 million in June.
1.24 1.13 1.09
1.06 1.24
1.10 1.15 1.21 1.17
1.11 1.14 0.98
1.11 0.98 1.04 1.00
0.98 0.83
0.92 1.02 0.95 1.04 0.99 0.93
0.00
0.20
0.40
0.60
0.80
1.00
1.20
1.40
Inqu
iries
(Mill
ions
)
Industry Inquiries All Programs and Award Levels
2012
2013
617.401.7662 www.GrayAssociates.com 4
GRAY For more information please contact Bob Atkins. Email: [email protected]
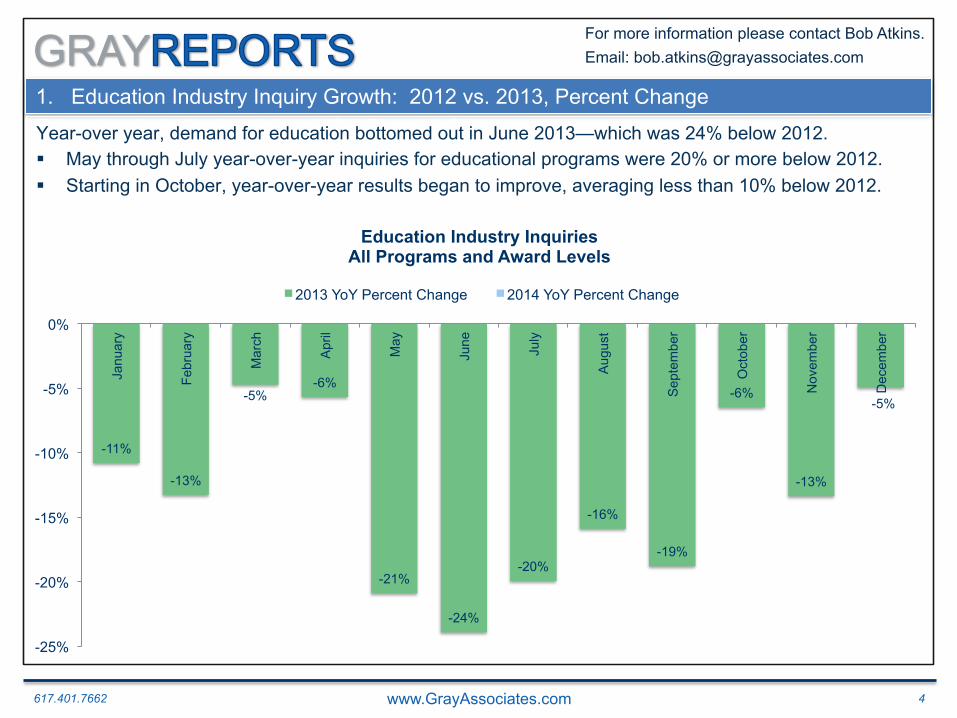
1. Education Industry Inquiry Growth: 2012 vs. 2013, Percent Change Education Industry Inquiries: YOY Percent Change Year-over year, demand for education bottomed out in June 2013—which was 24% below 2012. § May through July year-over-year inquiries for educational programs were 20% or more below 2012. § Starting in October, year-over-year results began to improve, averaging less than 10% below 2012.
-11%
-13%
-5% -6%
-21%
-24%
-20%
-16%
-19%
-6%
-13%
-5%
-25%
-20%
-15%
-10%
-5%
0%
Janu
ary
Febr
uary
Mar
ch
Apr
il
May
June
July
Aug
ust
Sep
tem
ber
Oct
ober
Nov
embe
r
Dec
embe
r
Education Industry Inquiries All Programs and Award Levels
2013 YoY Percent Change 2014 YoY Percent Change

617.401.7662 www.GrayAssociates.com 5
GRAY For more information please contact Bob Atkins. Email: [email protected]
1. Education Industry Inquiry Growth: January 2014 Results
The education industry is off to a relatively good start this year. January 2014 inquiries for educational programs were flat year-over-year—a large improvement from the previous January, which was down nearly 11% year-over-year.
1.244 1.109 1.102
-
0.200
0.400
0.600
0.800
1.000
1.200
1.400
Jan-12 Jan-13 Jan-14
Inqu
iries
(Mill
ions
)
Education Industry Inquiries All Programs and Award Levels
-0.7% -10.8%

617.401.7662 www.GrayAssociates.com 6
GRAY For more information please contact Bob Atkins. Email: [email protected]
2. Fastest-Growing Cities in January
All of the fastest-growing cities1 met or exceeded last year’s inquiry volumes. § Phoenix, AZ was the fastest-growing market, up 37% from January 2013. § Only three of the top five cities managed to grow. § Atlanta and Miami were roughly flat year-over-year.
-17% -11%
-14%
-12% -14%
37%
9% 5% 0%
-1%
-30%
-20%
-10%
0%
10%
20%
30%
40%
50%
Phoenix-Mesa-Scottsdale, AZ
Houston-The Woodlands-Sugar Land, TX
Los Angeles CA Atlanta-Sandy Springs-Roswell, GA
Miami-Fort Lauderdale-West Palm Beach, FL
Industry Inquiries Top 5 Markets – January 2014
2013 YoY % Change 2014 YoY % Change
1. Includes only cities with over 25,000 inquiries for all programs from January 2012-2014, 15-mile radius.
617.401.7662 www.GrayAssociates.com 7
GRAY For more information please contact Bob Atkins. Email: [email protected]
3. Fastest Growing Programs in January
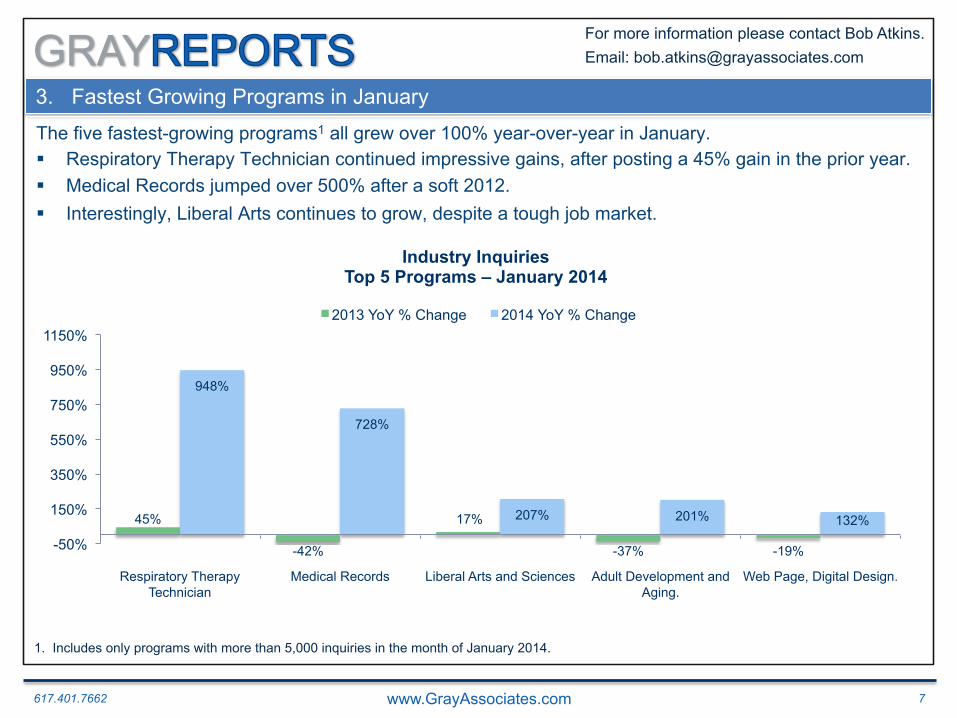
The five fastest-growing programs1 all grew over 100% year-over-year in January. § Respiratory Therapy Technician continued impressive gains, after posting a 45% gain in the prior year. § Medical Records jumped over 500% after a soft 2012. § Interestingly, Liberal Arts continues to grow, despite a tough job market.
45%
-42%
17%
-37% -19%
948%
728%
207% 201% 132%
-50%
150%
350%
550%
750%
950%
1150%
Respiratory Therapy Technician
Medical Records Liberal Arts and Sciences Adult Development and Aging.
Web Page, Digital Design.
Industry Inquiries Top 5 Programs – January 2014
2013 YoY % Change 2014 YoY % Change
1. Includes only programs with more than 5,000 inquiries in the month of January 2014.
-42%

617.401.7662 www.GrayAssociates.com 8
GRAY For more information please contact Bob Atkins. Email: [email protected]
4. Online Inquiry Share
Online programs lost share in 2013. § Online share peaked at 51% of education industry inquiries in 2012. § It fell to a low of 36% of inquiries for educational programs in October 2013. § In January 2014, online won only 37% of total inquiries, down from 43% in January 2013.
37%
0
0.1
0.2
0.3
0.4
0.5
0.6
Per
cent
See
king
Onl
ine
Edu
catio
n
Online Share of Education Industry Inquiries All Programs and Award Levels
2014 2012 2013
617.401.7662 www.GrayAssociates.com 9
GRAY For more information please contact Bob Atkins. Email: [email protected]
2.5%
2.6%
2.7%
2.5%
2.6%
2.6%
3.0%
2.6%
2.5%
2.1%
2.3%
3.0%
2.6%
2.9%
2.7%
2.8%
3.3%
3.0%
2.8%
2.5%
2.5%
2.3%
2.2%
2.9%
1.
6%
0.0%
0.5%
1.0%
1.5%
2.0%
2.5%
3.0%
3.5%
Febr
uary
Mar
ch
Apr
il
May
June
July
Aug
ust
Sep
tem
ber
Oct
ober
Nov
embe
r
Dec
embe
r
Janu
ary
Con
vers
ion
Rat
e
Education Industry Inquiry Conversion Rates All Programs and Award Levels
2012 2013 2014
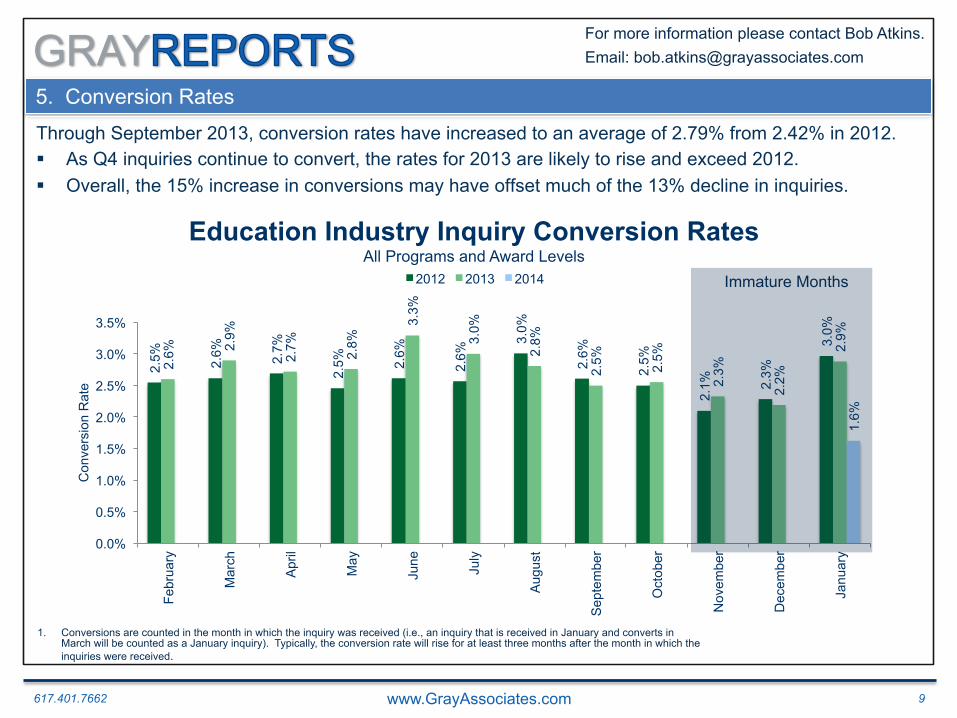
5. Conversion Rates
Immature Months
Through September 2013, conversion rates have increased to an average of 2.79% from 2.42% in 2012. § As Q4 inquiries continue to convert, the rates for 2013 are likely to rise and exceed 2012. § Overall, the 15% increase in conversions may have offset much of the 13% decline in inquiries.
1. Conversions are counted in the month in which the inquiry was received (i.e., an inquiry that is received in January and converts in March will be counted as a January inquiry). Typically, the conversion rate will rise for at least three months after the month in which the inquiries were received.

617.401.7662 www.GrayAssociates.com 10
GRAY For more information please contact Bob Atkins. Email: [email protected]
6. Average Price Per Inquiry
In 2013, the average price per inquiry rose an average of $1.09. The average price-per-lead in January reached $42.42, the highest level in two years.
$42.42
$39.69 $39.76 $40.22 $40.06 $39.71 $40.07 $40.16 $40.08 $40.34 $40.34
$41.05 $39.94
$40.79 $41.61 $41.22
$42.20
$40.18
$41.45 $42.11
$41.67 $41.55
$40.27 $41.13 $42.03
38 39 40 41 42 43
Febr
uary
Mar
ch
Apr
il
May
June
July
Aug
ust
Sep
tem
ber
Oct
ober
Nov
embe
r
Dec
embe
r
Janu
ary
Avg.
PP
I
Average Price Per Inquiry and YoY Change All Programs and Award Levels
2014 2012 2013
$1.10
$1.86
$1.01
$2.14
$0.47
$1.38 $1.95
$1.59 $1.21
-$0.07 $0.08
$0.40
-$0.50
$0.00
$0.50
$1.00
$1.50
$2.00
$2.50
Febr
uary
Mar
ch
Apr
il
May
June
July
Aug
ust
Sep
tem
ber
Oct
ober
Nov
embe
r
Dec
embe
r
Janu
ary C
hang
e in
Avg
. PP
I
Average YoY Change