2012 biennial report - university of new hampshire
TRANSCRIPT

University of New Hampshire Stormwater Center2012 Biennial Report

Contents
Directors’ Message 3
Highlights 4
Field Research Site 8
Focus Area 10
Stormwater Treatment System Data Porous Asphalt 12Pervious Concrete 14Permeable Interlocking Concrete Pavement 16Subsurface Gravel Wetland 18Bioretention Systems 20Tree Box Filter 22Detention Ponds 24 Offline Hydrodynamic Separators 26
Maintenance 28
Targeted Research 30
Administration 34
2
About the Center
The University of New Hampshire Stormwater Center (UNHSC) is dedicated to the protection of water resources through effective stormwater management. The Center has four main focus areas: 1) BMP Performance Testing, 2) Targeted Research, 3) Outreach and Education, and 4) Design and Implementation. Center researchers examine and refine the performance of stormwater treatment systems to treat the pollution in stormwater runoff and reduce the flooding that it can cause. Targeted research examines cold climate performance, cost, design, maintenance, and other information needed to advance the practice and understanding of stormwater science. This research provides information which is then integrated into an outreach program for stormwater managers and professionals who seek to build programs that protect water quality, preserve environmental values, and reduce the impact of stormwater runoff. The Center receives funding and program support from the Cooperative Institute for Coastal and Estuarine Environmental Technology (CICEET), a partnership of UNH and the National Oceanic and Atmospheric Administration (NOAA), and other federal, state, and private sources. It is housed within the University’s Environmental Research Group, a division of the College of Engineering and Physical Sciences.
Resources for Stormwater Managers
The Center’s research has served as the foundation for a range of outreach products—from best management practice (BMP) workshops geared to support municipal decision makers and stormwater engineers to peer-reviewed publications that explore the frontiers of stormwater science. Learn more about these resources at www.unh.edu/unhsc/.
n Data Reportsn Design Specificationsn Fact Sheetsn Case Studiesn Journal Articlesn Web Resources

3
This is a bittersweet report to issue. The roots of the UNHSC were in our stormwater studies in the early 1990’s that were trying to follow-up on the conclusions of the original studies included in the National Urban Runoff Program (NURP). In fact, one of the field sites we studied in the 1990’s was one of the original NURP sites in Durham, NH. Those studies made it clear that a more holistic approach to evaluating the performance of stormwater management strategies was warranted. In 2002, we formally founded the Stormwater Center, located a large field site on the University of New Hampshire campus, designed and then constructed a full field facility. Afterwards, I brought onboard a full time Director, Rob Roseen. Rob masterfully oversaw our original site construction and as Director, fostered UNHSC initiatives in outreach and research. Rob has taken on a new opportunity in the private sector, we will miss him and we wish him all the best.
Some of the fundamental reasons for creating a field research facility that could do parallel testing of stormwater management technologies were to: develop field protocols; obtain performance metrics for LID systems; and to assist manufacturers in bringing technologies to market. These objectives are still timely and salient. Many regulatory agencies still struggle with protocols for field-based acceptance and verification of stormwater treatment device performance. One only needs to look at the very few systems that have been certified under national protocols to see there is still much work to do. In addition, because of the need to remove more than just sediment, proprietary systems are rapidly being proposed to meet the permit needs of communities (for example nutrient reduction),
yet very little performance information exists for the new technologies. Even when considering some basic changes to bioretention systems (soil amendments, internal water storage volumes, etc.), little has found its way into design guidance. Nationwide, thousands of these systems will be constructed each year with very few monitored to verify that they are meeting performance expectations. As such, we rely on the long term performance results of actual field installations to guide the design and selection of stormwater management.
In this our tenth year of operation, the UNHSC renews its commitment to advancing the field and science of stormwater management. We will also continue to offer and improve on our outreach and training. For example, because of the documented performance of the UNHSC subsurface gravel wetland system, states like New Jersey are recommending this practice in water-sheds with nutrient impairments. In the past year we offered three subsurface gravel wetland and permeable pavement workshops throughout the state of New Jersey to strengthen the design capacity as well as to provide regulators, designers, and contractors with the most recent and updated information on these systems. Over the next two years we expect to continue to expand our outreach offerings.
This present, 2012 biennial report has some fantastic findings to present to you on stormwater system performance, cost, maintenance, and education. We hope the information is useful to you, and as always, we enjoy hearing back from you.
Thomas Ballestero
Director
Sincerely,
Directors’ Message
4
Water Quality and Economic Benefits for a Commercial LID Application at Greenland Meadows
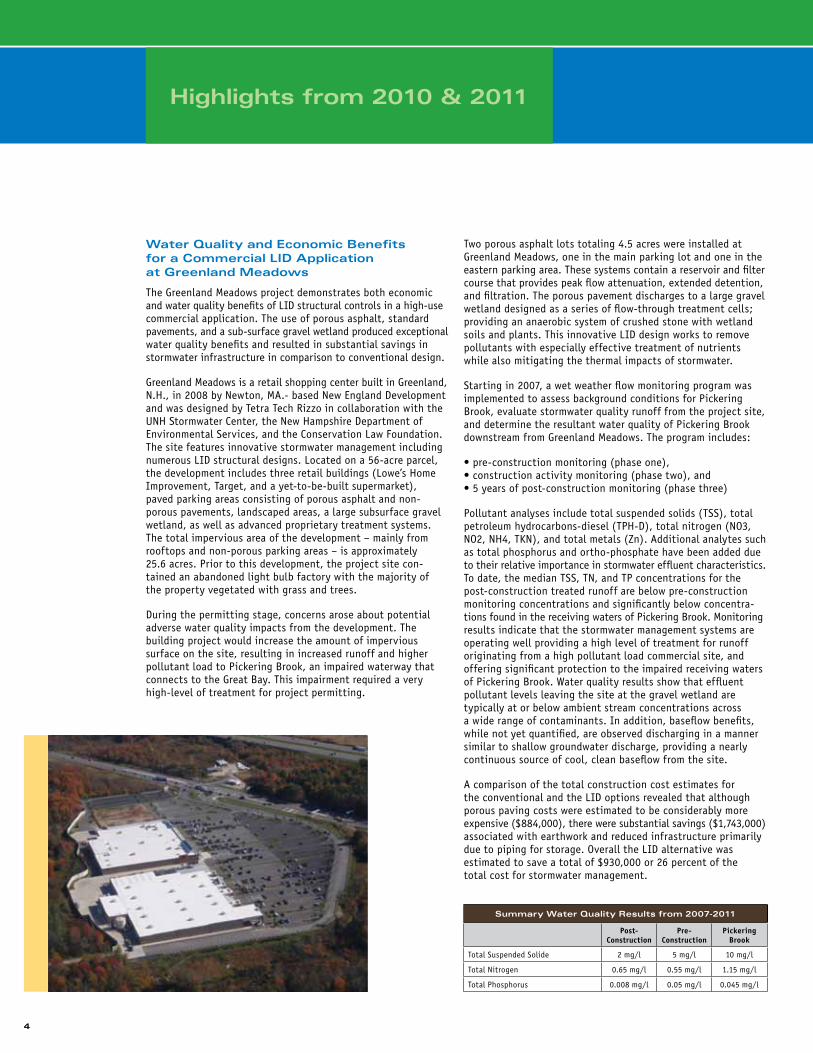
The Greenland Meadows project demonstrates both economic and water quality benefits of LID structural controls in a high-use commercial application. The use of porous asphalt, standard pavements, and a sub-surface gravel wetland produced exceptional water quality benefits and resulted in substantial savings in stormwater infrastructure in comparison to conventional design.
Greenland Meadows is a retail shopping center built in Greenland, N.H., in 2008 by Newton, MA.- based New England Development and was designed by Tetra Tech Rizzo in collaboration with the UNH Stormwater Center, the New Hampshire Department of Environmental Services, and the Conservation Law Foundation. The site features innovative stormwater management including numerous LID structural designs. Located on a 56-acre parcel, the development includes three retail buildings (Lowe’s Home Improvement, Target, and a yet-to-be-built supermarket), paved parking areas consisting of porous asphalt and non-porous pavements, landscaped areas, a large subsurface gravel wetland, as well as advanced proprietary treatment systems. The total impervious area of the development – mainly from rooftops and non-porous parking areas – is approximately 25.6 acres. Prior to this development, the project site con-tained an abandoned light bulb factory with the majority of the property vegetated with grass and trees.
During the permitting stage, concerns arose about potential adverse water quality impacts from the development. The building project would increase the amount of impervious surface on the site, resulting in increased runoff and higher pollutant load to Pickering Brook, an impaired waterway that connects to the Great Bay. This impairment required a very high-level of treatment for project permitting.
Two porous asphalt lots totaling 4.5 acres were installed at Greenland Meadows, one in the main parking lot and one in the eastern parking area. These systems contain a reservoir and filter course that provides peak flow attenuation, extended detention, and filtration. The porous pavement discharges to a large gravel wetland designed as a series of flow-through treatment cells; providing an anaerobic system of crushed stone with wetland soils and plants. This innovative LID design works to remove pollutants with especially effective treatment of nutrients while also mitigating the thermal impacts of stormwater.
Starting in 2007, a wet weather flow monitoring program was implemented to assess background conditions for Pickering Brook, evaluate stormwater quality runoff from the project site, and determine the resultant water quality of Pickering Brook downstream from Greenland Meadows. The program includes:
• pre-construction monitoring (phase one),• construction activity monitoring (phase two), and• 5 years of post-construction monitoring (phase three)
Pollutant analyses include total suspended solids (TSS), total petroleum hydrocarbons-diesel (TPH-D), total nitrogen (NO3, NO2, NH4, TKN), and total metals (Zn). Additional analytes such as total phosphorus and ortho-phosphate have been added due to their relative importance in stormwater effluent characteristics. To date, the median TSS, TN, and TP concentrations for the post-construction treated runoff are below pre-construction monitoring concentrations and significantly below concentra-tions found in the receiving waters of Pickering Brook. Monitoring results indicate that the stormwater management systems are operating well providing a high level of treatment for runoff originating from a high pollutant load commercial site, and offering significant protection to the impaired receiving waters of Pickering Brook. Water quality results show that effluent pollutant levels leaving the site at the gravel wetland are typically at or below ambient stream concentrations across a wide range of contaminants. In addition, baseflow benefits, while not yet quantified, are observed discharging in a manner similar to shallow groundwater discharge, providing a nearly continuous source of cool, clean baseflow from the site.
A comparison of the total construction cost estimates for the conventional and the LID options revealed that although porous paving costs were estimated to be considerably more expensive ($884,000), there were substantial savings ($1,743,000) associated with earthwork and reduced infrastructure primarily due to piping for storage. Overall the LID alternative was estimated to save a total of $930,000 or 26 percent of the total cost for stormwater management.
Highlights from 2010 & 2011
Summary Water Quality Results from 2007-2011
Post- Construction
Pre- Construction
Pickering Brook
Total Suspended Solide 2 mg/l 5 mg/l 10 mg/l
Total Nitrogen 0.65 mg/l 0.55 mg/l 1.15 mg/l
Total Phosphorus 0.008 mg/l 0.05 mg/l 0.045 mg/l

Forging the Link: Linking the Economic Benefits of Low Impact Development and Community Decisions
Through a series of case studies, this project documents the advantages of LID in the economic terms of how municipal land use decisions are commonly made. In addition to the environ-mental and water quality benefits for which LID is so commonly known, considerable economic, infrastructure, and adaptation planning benefits are also being realized through the incorpora-tion of LID-based strategies. Forging the Link (FTL) demon-strates the substantive economic benefits for both construction budgets and project life-cycle costs that are increasingly being observed by municipalities, commercial developers, and others when using Green Infrastructure for stormwater management. In addition, the FTL curriculum demonstrates the use of LID as a means for building community resiliency to changing climates in a water resources management context.
The FTL curriculum demonstrates:
1. The ecological benefits of LID with respect to water quality, aquatic habitat, and watershed health protection
2. The economic benefits of using both traditional and innovative infrastructure to manage stormwater
3. The capability of LID to be used as a climate change adaptation planning tool which can minimize stress to urban stormwater infrastructure.
One example study is Boulder Hills, located in Pelham, NH. This project led to simplified permitting and a 6% reduction in project costs using widespread use of LID designs. A comparison of project costs is listed below.
Restoring Water Quality in the Willow Brook Watershed Through LID Retrofits
Willow Brook is a small stream that is a tributary to the Cocheco River in the urban center of Rochester, NH. This small urban stream is impaired for Primary and Secondary Contact Recre-ation (e. coli). Its direct receiving waters, the Cocheco River, are impaired for Aquatic Life Use (benthic macroinvertebrates and habitat) as well as Primary Contact Recreation (e.coli). Sources are nonpoint source pollutants from urban stormwater runoff. The Cocheco River Watershed Coalition (CRWC) in cooperation with the City of Rochester Public Works Dept.(DPW), and the UNH Stormwater Center (UNHSC) developed a plan for installation of LID practices, including outreach and educational activities. The project implemented two retrofit demonstra-tion projects for reducing effective impervious cover. The project was funded through NHDES 319 Watershed Assistance Grants to address nonpoint source pollution from urban runoff.
The first demonstration location was a small K-4 neighborhood school lacking any stormwater management, which directly impacted the usability of the surrounding playground. The project included the implementa-tion of eight different LID retrofit strategies, eliminating 96% of direct runoff from the site’s impervious areas. These strategies included raingardens (3), a dry well, rainbarrels, pervious concrete sidewalks, and a porous asphalt basketball court made possible by a donation from Pike Industries. The second demonstration location was a residential subdivision with conventional curb, catch basins, and gutters. Retrofits included a rain garden and two tree filters to effectively disconnect roughly 65% of the site’s impervious cover. In order to document the positive impact of these retrofit demonstrations the amount of pollution removed by the treatment strategies was modeled and the results presented in the table below. In this case impervious cover (IC) is considered disconnected when runoff is treated through an adequately sized stormwater control measure.
5
Comparison of Material Unit Cost
Item Conventional LID Difference
Site Preparation $23,200 $18,000 -$5,200
Temp. Erosion Control $5,800 $3,800 -$2,000
Drainage $92,400 $20,100 -$72,300
Roadway $82,000 $128,000 $46,000
Driveways $19,700 $30,100 $10,400
Curbing $6,500 $0 -$6,500
Perm. Erosion Control $70,000 $50,600 -$19,400
Additional Items $489,700 $489,700 $0
Buildings $3,600,000 $3,600,000 $0
Project Total $4,389,300 $4,340,300 -$49,000
Willow Brook Watershed Pollutant Load Summary
Drainage Area (AC) 2515
2011 BMP Retrofit Reductions in Lbs Per Year
TSS #/year 593
TP #/year 2
TN #/year 18
2011 IC Reductions
0.8 acres
0.2%

6
Urban Watershed Renewal in Berry Brook
During 2011, water quality and stream restoration improvements began in the Berry Brook Watershed located in Dover, NH. A tributary to the Cocheco River, Berry Brook is a 0.9 mile long stream in an approximately 180 acre watershed in downtown Dover that is almost completely built-out with 30.1% impervi-ous cover. The Project Team includes the City of Dover, the UNHSC, the Cocheco River Watershed Coalition, New Hampshire Fish and Game, NH Department of Environmental Services, and American Rivers. The Brook is impaired for aquatic life use (i.e. habitat) and primary contact recreation. Watershed improvements included a combination of LID stormwater management and stream restoration initiatives.
In the first year of this two year project, the UNHSC restored and enhanced the headwaters of Berry Brook, an existing 2 acre wetland, by creating approximately 3.2 additional acres of wetland/floodplain. This now 5+ acre wetland is located at the Dover Water Works site on Lowell Avenue and discharges to a newly-created 1,000-foot stream channel. This stream channel was piped underground as the site was developed for the City of Dover municipal water supply dating back to 1908. The project restored a winding channel from the wetland to reestablish the upper channel. The enhanced wetland and stream channel will improve water quality and habitat functions as well as create a vibrant green space in the heart of the watershed.
In addition, over 11 BMP installations were implemented throughout the watershed from subsurface gravel wetlands to rain gardens. Combined, these installations provide treatment for approximately 24 acres of impervious area and reduced suspended sediment, phosphorous and nitrogen pollution by 16,800, 58, and 387 pounds per year respectively. A Community outreach program was also initiated which included watershed and stormwater education activities at the Horne Street School, a Community Meeting, homeowner workshops, stormwater audits, a residential rain garden installation, a homeowner rain barrel implementation project, and a watershed clean-up.
Future activities in the Berry Brook watershed include additional outreach activities, improvements to the lower Berry Brook stream where it connects to the Cocheco River, and additional planting and invasives maintenance. Future efforts also include monitoring of ecosystem response for a range of parameters which include nutirents, bacteria, metals, flow, temperature, fish and macroinvertebrates.
2011 Road Management Plan for Brackett and Pond Roads, Wakefield, NH
In June of 2011, the Acton Wakefield Watershed Alliance and the UNHSC completed a road management plan for the north shore of Lovell Lake in Wake-field, NH. The purpose of the Road Management Plan (RMP) was to address declining water quality of Lovell Lake caused by runoff from gravel roads
which carry sediment and phosphorus. Unimproved roads are commonplace in the Lakes Region of New Hampshire in an area with a substantial seasonal population. Unimproved roads and associated maintenance are well documented as major sources of sediment and phosphorus in surface water and may account for as much as 80% of the sediment load and 40% of the phosphorus load within a watershed. Studies have shown that during high intensity storm events, sediment concentrations may be observed to exceed 100,000 mg/L with averages for gravel roads greater than 3,000 mg/l due to erosion and unstable drainage. When compared to sediment concentrations from a typical low-use paved road of 100 mg/L it is clear that erosion can be a dramatic source of pollution. Impacts from sediment laden waters can be substantial, directly affecting the value, aesthetics, and usability of the lakes. As seasonal populations grow and become permanent, the number of roads and driveways will increase maintenance demands for these
unimproved surfaces.
Another issue of concern is that road maintenance practices, while intended to improve road drainage, often contribute signifi-cantly to erosion and sedimentation. An example is the process of improving roadside conveyance through ditching, which is a routine and a necessary element
of road maintenance. Implementing erosion and sedimentation control practices to this routine maintenance will reduce the threat to surface waters. A range of strategies exist to reduce impacts including practical road maintenance techniques, road and drainage improvements, and non-structural approaches (i.e. catch basin cleaning, vegetative stabilization) targeted to minimize erosion and sedimentation. Structural approaches in this report include the use of dry wells, sedimentation and infiltration basins, hooded deep sump catch basins, and stabilized channels.

Portsmouth Tree Filter Project
An emerging body of research supports the use of tree box filters to treat stormwater pollution in urban areas. Tree box filters are high-flow filters that require smaller footprints than bioretention systems yet level treatment. Tree filters are a combination of stormwater drainage and urban forestry. In many ultra-urban environments trees have very short lives, particularly due to stress from lack of nutrients and water. Tree filters are available as proprietary and non-proprietary versions, both of which have advantages for either cost or level of effort required for design.
This project was part of the State Street Redesign in Portsmouth, NH, a combined sewer separation, which included the use of numerous tree filters and other forms of advanced stormwater management. The project was led by CMA Engineers partnering with the UNHSC for the LID design and the project received the Outstanding Civil Engineering Achievement Award for 2010 by the New Hampshire Section of the American Society of Civil Engineers.
Performance monitoring will be used to assess the effective-ness of tree filters in a high-use municipal setting for removing common stormwater pollutants. Water quality results are similar to the tree box filter studied at the UNHSC with good sediment, hydrocarbons, metals and phosphorus removal. Anticipated cost benefits will be examined for both the value of urban forestry and pollutant load reductions. Targeted outreach activities are expected to improve confidence and knowledge in communities in regards to the benefits of incorporating trees for stormwater management in urban areas. These assessments and other project information will be shared through outreach and education activities, products such as a guidance manual for communities, a training workshop, case-study fact sheets, and presentations.
Nutrient Management in Barnegat Bay and Subsurface Gravel Wetlands
In support of the New Jersey Environmental Infrastructure Financing Program’s (NJEIFP) Barnegat Bay Initiative, the New Jersey Department of Environmental Protection (NJDEP) in cooperation with UNHSC developed a gravel wetland specification targeting nitrogen removal from existing and new developments. The specification can be found at: http://www.njstormwater.org/pdf/gravel_wetlands_barnegat_bay.pdf
In the Spring of 2012, the UNHSC, NJDEP, Rutgers Cooperative Extension, Barnegat Bay Partnership, Coastal Training Program at Jacques Cousteau National Estuarine Research Reserve, and the New Jersey Water Resources Research Institute offered regional workshops to train local engineers and water resource management professionals in regards to gravel wetland design.
The subsurface gravel wetland is a recent innovation in LID stormwater design. It approximates the look and function of a natural wetland, effectively removing sediments and other pollutants commonly found in runoff while enhancing the visual appeal of the landscape by adding buffers, or greenscape, to urban areas. The subsurface gravel wetland evaluated and recommended by the UNHSC is a horizontal-flow filtration system, and should not be confused with stormwater wetlands that function more like ponds. Instead, the subsurface gravel wetland includes a dense root mat, crushed stone reservoir, and an anaerobic, microbe-rich environment to improve water quality. Like other filtration systems, it demonstrates a tremendous capacity to reduce peak flow and improve water quality. The subsurface gravel wetland is unique in its ability to remove up to 82% of nitrogen during summer months and is recommended in some states for nutrient impaired waterbodies.
7
TREE FILTER PERFORMANCE
% R
emov
al E
ffic
ienc
y
0%10%20%30%40%50%60%70%80%90%
100%
TSS (mg/l) TPH-D (ug/l) TZn (mg/l) DIN (mg/l) TP (mg/l)

Text
Field Research Site
The UNHSC’s primary field research facility sits adjacent to a nine-acre commuter parking lot in Durham, N.H. The contributing drainage area—curbed and almost completely impervious— generates runoff typical of a commercial development. For nine months of the year, this lot is used near capacity by a combination of passenger vehicle and bus traffic. The pavement is frequently plowed, salted, and sanded during the winter.
The facility is designed to provide an “apples-to-apples” comparison of water quality treatment and water quantity management performance. A range of stormwater systems is installed in a parallel yet separate configuration that normalizes the variability inherent in stormwater contami-nant loading and rainfall. Each system is uniformly sized to address a Water Quality Volume (WQV) of runoff generated by one inch of rainfall off one acre of impervious surface.
The facility contains three classes of stormwater treatment systems: conventional, structural systems such as swales and ponds; LID designs such as bioretention cells and subsurface gravel wetlands; and manufactured systems such as hydrodynamic separators and subsurface infil- tration and filtration systems.
The lot’s contaminant concen-trations are above, or equal to, national norms for com-mercial parking lot runoff. The local climate is coastal, cool temperate forest, with an average annual precipitation of 44 inches and monthly averages of 3.7 inches. The mean annual temperature is 48°F, with averages of 15.8°F in January and 82°F in July. The design depth for frost penetration is 48 inches.
Distribution Box
Detention Pond
Surface Sand Filter
Storm Treat System
Sampling Gallery
Bio III
8
Vegetated Swale
Deep Sump Catch Basin

Text
Mini Distribution Box
Hydrodynamic Separators
Aqua-Filter Stormwater Filtration System
Subsurface Gravel Wetland
9
Deep Sump Catch Basin
Satellite Testing Sites
In addition to its main field facility UNHSC also conducts monitoring on numerous satellite systems including porous asphalt, pervious concrete, permeable interlocking concrete pavement, bioretention, tree filters, and gravel wetlands.
1. Stormwater runoff from the parking lot is channeled into a 36-inch pipe where it is moni- tored in real time for flow, pH, conductivity, dissolved oxygen, temperature, and turbidity. Concurrently, automated devices collect flow-weighted samples of runoff throughout the runoff hydrograph. These samples are processed and evaluated for a range of contaminants, or frozen for future evaluation.
2. Runoff then flows into a distribution box with a floor that rests slightly higher than the invert of the outlets that direct runoff to the various stormwater treatment systems. This configuration insures that runoff will scour the floor of the box, thereby preventing sediment accumulation. Baffles and flow splitters help to distribute the runoff evenly among systems.
3. From the distribution box, runoff flows through a network of pipes and into each system.
4. Runoff moves through the stormwater treatment systems.
5. Runoff leaves the systems through perforated subdrains and is conveyed into a sampling gallery.
6. In the gallery, runoff is monitored in real time for the same characteristics monitored in step one. Concurrently, automated devices collect flow-weighted samples of runoff throughout the runoff hydrograph. These samples are evaluated for the same range of contaminants as step one, thereby serving as the basis for system performance evaluation.
A detailed quality assurance project protocol governs all UNHSC’s
methods, procedures, maintenance tasks, and analyses related
to the evaluation of stormwater treatment systems. All systems
are installed with an impermeable liner so that researchers can
provide a strict accounting of the runoff flowing through the
systems, as well as the contaminants it contains.
Here’s How Our Performance Evaluation Process Works
12
3
4
5
6
How We Evaluate Performance

10
By its nature, stormwater quality and BMP performance information can be confusing. Point source discharges are often predictable in contrast to non-point sources of pollution which can be highly variable. BMP performance is influenced by both system variables (size, design, installation, and main- tenance) and site variables (land use, soil type, local climate, and vegetation). System variables such as filter media type, vegetation, hydraulic loading rate, and residence time, too name a few, will affect performance efficiency (removal of pollutants) and the resulting effluent concentration. Site variables, particularly soil type and local climate, will deter- mine the amount of groundwater recharge and the reduction of runoff volume moving overland to surface waters.
Choosing appropriate BMPs can be a challenge to meet local regulations and address pollutants of concern.
Pollutant load reductions associated with individual BMP removal efficiencies coupled with load reductions from infiltration both lead to removal of pollutant mass. In system designs that incorporate LID treatment and infiltration, pollutant mass removal should be calculated by viewing the design as a system-in-series, or a treatment train approach, according to the following equation:
Mass Removed = Vt x RE x Cin + (Vr) x (1-RE) x Cin
Where:
Vt = the total volume of runoff from the watershed to the stormwater management system
Vr = the volume of runoff reduced (infiltrated)
RE = the Removal Efficiency associated with the BMP
Cin= the concentration of the pollutant entering into the BMP
The first of these two products is the mass of pollutant removed in the stormwater management system and the second of the product terms is the mass removed in the infiltrated water. It should be recognized that ultimately this infiltrated mass could show up in receiving waters depending on the pollutant of concern.
In terms of the percent removal efficiency based on mass, the combined removal efficiency for a stormwater management and then infiltration practice is: REt = RE + (1- RE) %I
Where RE is defined as before, and:
REt = the total (or combined) removal efficiency
%I = the percent of runoff infiltrated.
Removal efficiency is a common way to represent BMP performance. It is also a misapplied concept. The graphic below illustrates mass load removals for nitrogen over a range of BMPs with varying removal efficiencies and volume reduction potentials. The following example illustrates common misunderstandings
Focus Area: Concentration, Volume, and Pollutant Load Reduction
Accurate data on stormwater best management practice (BMP) performance is critical for
estimating pollutant removal efficiency, determining compliance with regulations and planning for
effective strategies that sustain precious water resources. Engineers, municipal officials, scientists,
and regulators routinely use BMP performance data. To this end, it is important to understand how
performance efficiency, volume reduction by recharge, and load reduction interrelate.

11
UN
HS
C M
easure
d M
edia
n P
olluta
nt
Rem
oval Effi
cie
ncie
s
TSS
Tota
l Sus
pend
ed S
olid
s (m
g/l)
TPH
-D
Tota
l Pet
role
um H
ydro
carb
ons
in
the
Die
sel R
ange
(ug
/l)
NO3
-N (
DIN
) D
isso
lved
Ino
rgan
ic N
itro
gen
(mg/
l)
TZn
Tota
l Zin
c (m
g/l)
TP
Tota
l Pho
spho
rus
(mg/
l)
Aver
age
Annu
al
Peak
Flo
w
Redu
ctio
n
Aver
age
Annu
al
Lag
Tim
e
Trea
tmen
t U
nit
Des
crip
tion
Infl
uent
Effl
uent
%
Rem
oval
Infl
uent
Effl
uent
%
Rem
oval
Infl
uent
Effl
uent
%
Rem
oval
Infl
uent
Effl
uent
%
Rem
oval
Infl
uent
Effl
uent
%
Rem
oval
% R
educ
tion
Min
utes
Conv
enti
onal
Tre
atm
ent
Tech
nolo
gies
Rete
ntio
n Po
nd55
3068
%71
010
082
%0.
30.
233
%0.
050.
0168
%0.
090.
11NT
8645
5
Dete
ntio
n Po
nd77
1679
%49
016
574
%0.
30.
225
%0.
030.
0250
%0.
050.
05NT
9363
9
Ston
e (r
ip-r
ap)
Swal
e30
1550
%58
038
033
%0.
40.
7NT
0.07
0.02
64%
- -
-6
7
Vege
tate
d Sw
ale
4816
56%
710
207
82%
0.3
0.3
NT
0.04
0.02
40%
0.08
0.10
NT52
38
Berm
Sw
ale
5123
50%
637
6181
%0.
20.
3NT
0.03
0.02
50%
0.07
0.09
NT16
58
Deep
Sum
p Ca
tch
Basi
n48
349%
510
440
14%
0.2
0.3
NT
0.04
0.04
NT0.
080.
07NT
NTNT
Man
ufac
ture
d Tr
eatm
ent
Devi
cese
vice
s (M
TDs)
ADS
Infil
trat
ion
Uni
t 49
BDL
99%
766
BDL
99%
0.3
0.9
NT
0.05
BDL
99%
0.12
0.02
81%
8722
8
Stor
mTe
ch87
1383
%75
045
91%
0.3
0.5
NT
0.03
0.01
67%
0.07
0.03
52%
7823
5
Aqui
filte
r 28
1162
%57
315
666
%0.
30.
3NT
0.04
0.02
43%
0.07
0.05
24%
NTNT
Onlin
e H
ydro
dyna
mic
Sep
arat
ors
4129
29%
774
442
42%
0.4
0.4
NT
0.05
0.04
26%
0.09
0.11
NTNT
NT
Offli
ne H
ydro
dyna
mic
Sep
arat
ors
(HDS
)12
021
75%
570
180
64%
0.2
0.3
NT
0.03
0.02
21%
0.05
0.05
NTNT
NT
Low
Im
pact
Dev
elop
men
t (L
ID)
Surf
ace
Sand
Filt
er45
1951
%78
817
98%
0.3
0.4
NT
0.06
0.01
77%
0.12
0.06
33%
6918
7
Bio
I -
48"
dept
h (4
2” fi
lter
dep
th)
371
97%
798
BDL
99%
0.4
0.1
44%
0.07
BDL
99%
- -
-75
266
Bio
II -
30"
dep
th (
24”
filte
r de
pth)
486
87%
750
BDL
99%
0.2
0.2
NT
0.04
0.02
73%
0.08
0.05
34%
7930
9
Bio
III
- 30
" de
pth
(24”
filter
dep
th)
120
891
%45
016
364
%0.
40.
344
%0.
030.
0175
%0.
030.
05NT
8421
6
Bio
IV - 3
7" d
epth
(24
” fil
ter d
epth
)80
1183
%49
516
565
%0.
30.
242
%0.
030.
0167
%0.
070.
06NT
9561
Subs
urfa
ce G
rave
l Wet
land
s61
496
%64
4BD
L99
%0.
30.
175
%0.
040.
0184
%0.
060.
0258
%92
391
Poro
us A
spha
lt32
BDL
99%
631
BDL
99%
0.2
0.5
NT
0.04
0.01
75%
0.08
0.04
57%
821,
275
Perv
ious
Con
cret
e10
111
85%
310
BDL
99%
0.3
0.5
NT
0.03
0.01
75%
0.06
0.65
NT93
1,01
1
Perm
eabl
e In
terloc
king
Con
cret
e Pa
vem
ent
51BD
L99
%61
0BD
L99
%0.
4BD
L99
%0.
05BD
L99
%0.
13BD
L99
%99
see
pg 1
6
Tree
Filt
er31
291
%63
1BD
L99
%0.
20.
21%
0.04
0.01
75%
0.07
0.06
NT31
204
*BDL
indi
cate
s a
valu
e th
at is
Bel
ow D
etec
tion
Lim
it o
f th
e te
st m
etho
d.
NT
indi
cate
s no
tre
atm
ent.

FA
ST
F
AC
TS
CATEGORy / BMP TyPE
Porous Pavement, Low Impact Development Design
UNIT OPERATIONS & PROCESSES
Hydrologic (Flow Alteration and Volume Reduction/Infiltration)
Water Quality: Physical (Filtration) & Chemical (Sorption)
DESIGN SOURCE
UNHSC
BASIC DIMENSIONS
Surface Area: 5,200 sf
SPECIFICATIONS
Catchment Area: 5,500 sfWater Quality Volume: 435 cf
INSTALLATION COST
2008 Costs: $2.80/sf for porous asphalt compared with $2.25/sf for standard asphalt
MAINTENANCE
Maintenance Sensitivity: LowInspections: 1-4 times per yearSediment Removal: High
After ensuring proper design and installa-tion of PA, clogging is likely to be a major issue of concern with respect to the long term maintenance and system performance. Infiltration rates (IR) of porous asphalts are generally orders of magnitude higher than design rainfall intensities and surrounding soils. Even for a worst case “no maintenance” scenario, infiltration rates will remain high enough such that there should be no significant runoff from common storm events. Clogging can be defined as the loss of the initial infiltration capacity to such an extent that runoff or ponding occurs on portions of the surface that did not originally exhibit such conditions.
About Porous Asphalt
Porous asphalt (PA) is a very effective approach to stormwater management in terms of both quality and quantity. Unlike retention ponds, PA systems do not require large amounts of additional space. The marginal cost between standard and porous asphalt is typically less than the associated drainage infrastructure (curb, catch basins, piping, and ponds) for standard impervious pavements. With PA, rainfall filters through the system and infil-trates back into the ground, which significantly reduces runoff volume, lowers peak flows, decreases temperatures, and improves water quality. PA also speeds snow and ice melt and virtually eliminates black ice development, reducing salt requirements for winter maintenance.
Porous asphalt, like most LID stormwater practices, is suitable for a wide range of locations. Its usage typically includes parking lots, driveways, sidewalks, low-use roadways, and developments with large areas of impervious surface. As with any infiltration system, care must be taken when locating these systems near pollution hotspots, or in areas of seasonal high groundwater. The effectiveness of porous asphalt has been demonstrated over a wide range of climates, including those with winter freezing and thawing. Studies at UNH have shown PA to be especially effective in cold
climates given its durability and capacity to reduce the salt needed for deicing in winter conditions. Improvements in PA mix design and installation practices are continually advancing. This combined with added requirements for infiltration, and higher stormwater quality treatment standards make PA a reasonable stormwater management alternative. Clogging, poor mix specifications, structural failure, and other historical barriers to implementation have by and large been overcome. Successful implementation of porous asphalt systems relies on proper design, siting, mix production, construction, installation, and maintenance—all of which can be achieved with qualified suppliers, experienced installers, and engineer-ing oversight. While porous asphalt has been proven to manage stormwater effectively, it is weaker than conventional asphalt pavements. However with the proper admixtures and design, PA durability can be greatly improved and has been shown to be effective for both commercial and roadway applications.
System Performance
Cost
The 2004 materials and installation cost associated with UNHSC’s porous asphalt lot were approximately $2,300 per space, compared to $2,000 per space for the adjacent impervious
12
Porous asphalt use is on the rise and innovations in designs, materials, and mixes advance every year. This improved market means that more asphalt manufacturers are making porous asphalt in response to more designers specifying the product.
Porous Asphalt
Surface Infiltration Rates for Porous Pavements Over Time
0
500
1000
1500
2000
2500
3000
Infi
ltra
tion
Rat
e (i
n/hr
)
Average Infiltration Rate West Edge PA and Eliot Alumni Center PA
West Edge EAC Cleaning

asphalt lot. The net costs for both pavements would have been comparable had the impervi-ous pavement’s stormwater infrastructure been taken into consideration. Between 2008 and 2009, costs for porous asphalt materials and installation ranged from $2.80 and $3.17 per square foot compared to $2.30 to $3.32 per square foot for standard asphalt. Cost varia-tions are primarily due to the use of admix-tures. Cost does not include preparatory site work and subbase construction which may range from $2-4 per square foot.
Maintenance
Longterm PA operation and performance requires two distinct maintenance elements: 1) inspections, at least once a year to examine surface infiltration rates, and 2) street vacuuming 2-4 times per year to remove solids and debris and keep void spaces open. Vacuuming costs are commonly $350-500 per acre. PA carries one of the lowest maintenance burden’s observed among the systems studied at UNHSC and has remained consistent and predictable over the years as depicted in the graph at the bottom right.
Winter plowing for PA should be routine and requires no special blade or adjustments. PA was observed to require only 25% of the salt routinely applied to impervious asphalt to achieve equivalent, or better, deicing and traction in winter. Black ice from melting and refreezing is essentially eliminated on porous asphalt. However, the need for winter mainte-nance on porous asphalt may increase in some cases, in particular for compacted snow and ice. That said over a two year period at the UNHSC PA yielded a net reduction of road salt when compared to applications necessary on conventional pavements. A winter maintenance fact sheet is available online: www.unh.edu/unhsc.
Cold Climate
With winter surface infiltration rates of more than 1,000 inches an hour cold climate performance of PA systems remain excellent during winter despite observed frost penetration to depths of 27 inches. The pavement froze sooner, deeper, and thawed more rapidly than adjacent ground conditions. A well-drained frozen pavement retains porosity and infiltration capacity. When designed with a deep subbase, the lifespan of these pavements are expected to exceed conventional impervious asphalt pavements, which tend to lose structural integrity in northern climates due to frost heaving.
Water Quality Treatment
Porous pavements can be expected to have substantial pollutant load reduction. The amount of load reduction is dependent on the degree of volume reduction and treatment efficiency relative to the pollutant of concern. The water quality treatment performance of the PA lot generally has been excellent. It consis-tently exceeds EPA’s recommended level of removal of total suspended solids and meets regional ambient water quality criteria for petroleum hydrocarbons and zinc. The exceptionally high level of treatment is due in part to the use of a filter course in the subbase design. Systems that specify only coarse ag-gregate layers have more of an infiltration and sedimentation function. The finer gradation of the filter course layer is designed for improved pollutant removal and delayed discharge. For nutrient treatment capacity some phosphorus reductions were observed however, there was no treatment for nitrogen consistent with results from other non-vegetated infiltration systems. The system, like all other systems tested, did not remove chloride. However, since it drastically reduced the amount of salt needed for winter maintenance, it may prove effective at reducing chloride pollution. The chart at the top right reflects the system’s performance in removing total suspended solids, total petroleum hydrocarbons, total zinc, dissolved inorganic nitrogen, total nitrogen, and total phosphorus. Values represent results recorded over four years, with the data further divided into summer and winter components.
Water Quantity Control
The porous asphalt system’s ability to manage runoff has been exceptional. It has generally outperformed all systems tested at UNHSC in its capacity to reduce runoff volume. No surface runoff has been observed from this lot since its installation in 2004; this includes the 100-year storm events that New Hampshire experienced in 2006 and 2007. Groundwater recharge was observed to be 25% of annual rainfall despite the system’s location over clay soils. The graph in the middle right illustrates effective peak flow reduction and long lag times for the range of seasons monitored.
13
32 631 ug/L 0.2 1.30.04 0.08
POLLUTANT REMOVAL: 2005–2009
% R
emov
al E
ffic
ienc
y
sediments totalpetroleum
hydrocarbons
dissolvedinorganicnitrogen
totalnitrogen
metals
Median Annual Influent Event Mean Concentrations (EMC) in mg/L
totalphosphorus
WinterSummer Annual
0102030405060708090
100
TPZn TNDINTPH-DTSS
Average Peak Flow Reduction Average Lag Time (minutes)
Winter Summer Annual Average 82%1,275
––– Influent ––– Effluent
Flow
(GP
M)
Minutes
HYDRAULIC PERFORMANCE
76% 86%1,163 1,375
30 25 20 15 10 50
0 2000 500 1000 1500
$3,500
$3,000
$2,500
$2,000
$1,500
$1,000
0
10
20
30
40
50
$500
Cost
$
Hou
rs
POROUS ASPHALT MAINTENANCE
Cost Hours
yr1 yr2 yr3 yr4
The graph shows two different porous asphalt systems and tracks infiltration rates (IR) over time. Maintenance events, in this case with a regenerative air vacuum, are tracked over time alongside IR. The prevention of clogging through routine cleaning and vacuuming should be standard and is the best way to ensure longevity and performance.
In the two examples, initial decline in IR is rapid, but over time the rate of decline diminishes. In the case of the West Edge parking lot, the average IR of the PA is approximately 500 in/hr, 8 years post installation. For the Elliot Alumni Center parking lot, a much more recent installation, the IR is approximately 1000 in/hr after 2 years of operation.

About Pervious Concrete
Pervious concrete (PC) is an effective approach to stormwater management in terms of both quantity and quality. Unlike retention ponds, PC systems do not require large amounts of additional space. The marginal cost between standard pavements and PC can be less than the associated drainage infrastructure (curb, catch basins, piping, and ponds) for standard impervi-ous pavements. With PC systems, rainfall filters through the system and infiltrates back into the ground, which significantly reduces runoff volume, lowers peak flows, decreases tempera-tures, and improves water quality. In areas with sufficient sun exposure, PC can also speed snow and ice melt, reducing the salt required for winter maintenance. The PC design tested at UNHSC is distinctive in its use of coarse sand as a filter course - a refinement that enhances its filtration capacity improving water quality. With proper design, production, and installa-tion, PC can be an excellent transportation structure and reasonable stormwater treatment system. As with most LID stormwater practices, PC is suitable for many sites. Typical usage includes parking lots, low-use roadways, sidewalks, and commercial developments with large areas of impervious surface. Care must be taken when locating PC or any infiltration system near pollution hotspots, or in areas of seasonal high groundwater. In such cases, the system can be
lined and outfitted with a subdrain that discharges to the surface or to storm sewers. The effectiveness of porous pavements has been demonstrated over a wide range of climates; however, impervious and pervious concrete can be damaged by the freeze thaw cycle and the use of deicing chemicals. To address this, it is essential that PC designs have an 16–20 % void space and a well-drained subbase. Proper curing of PC is needed to ensure a quality installation. Cure is required for structural load (7 days), to protect against freeze-thaw (28 days), and is needed prior to chloride deicing applications (12 months). Because of its perme-ability and high degree of reflectivity, PC can be challenging to maintain in the winter especially in areas that do not have good sun exposure. Where there is shading, snow and ice will accumulate increasing the need for salt application and plowing. As such, designs involving PC in cold climate regions should take shade cover into account. Clogging, poor installation practices, and complications from freezing temperatures will need to be consid-ered when using PC in cold climate regions. Successful implementation of these systems relies on design, siting, proper mix production (including appropriate admixtures), construction oversight, maintenance, and proper cure times— all of which can be achieved with qualified suppliers and engineering oversight. As with other innovative technologies,
14
Pervious concrete is a top performer with respect to water quality treatment and volume reduction, however care must be taken in areas where deicing chemicals will be used.
How the System Works
Pervious Concrete
Sand/gravel (filter course)
6” Perforated subdrain
Native soils
18”
4”
Please note: This design includes subbase design for cold climates and drainage for low permeability soils.
6”
4”
Pervious concrete
3/4” Stone choker course
3/8” Stone infiltration reservoir
Pervious concrete because of it’s deep subbase has been shown to be very resistant to freeze-thaw. Proper curing of PC is necessary to ensure quality installations and cold climate durability. There are 3 main curing requirments for PC: a 7 day cure for structural load, a 28 day cure to protect against freeze-thaw damage, and a 12 month cure prior to aggressive chloride deicing applications. The picture on the far right depicts delamination from chloride applications prior to the 12 month no-salt curing requirements. PC in adjacent parking areas where deicing salts were not applied appear structurally sound, open and intact.
Pervious Concrete Pavement in Cold Climates
FA
ST
F
AC
TS
CATEGORy / BMP TyPE
Pervious Pavement, Low Impact Development Design
UNIT OPERATIONS & PROCESSES
Hydrologic (Flow Alteration, Volume Reduction/Infiltration)
Water Quality: Physical (Filtration) & Chemical (Sorption)
DESIGN SOURCE
UNHSC & Northern New England Concrete Promotion Association (NNECPA)
BASIC DIMENSIONS
Surface Area: 21,000 sf
SPECIFICATIONS
Catchment Area: 21,000 sfWater Quality Volume: 1,750 cf
INSTALLATION COST
$4–5sf for materials and installation (does not include subbase)
MAINTENANCE
Maintenance Sensitivity: LowInspections: 1-4 times per yearSediment Removal: High

101 310 ug/L 0.3 1.000.03 0.06
POLLUTANT REMOVAL: 2008–2010
% R
emov
al E
ffic
ienc
ysediments total
petroleumhydrocarbons
dissolvedinorganicnitrogen
totalnitrogen
metals
Median Annual Influent Event Mean Concentrations (EMC) in mg/Lr
totalphosphorus
WinterSummer Annual
0102030405060708090
100
TPZn TNDINTPH-DTSS
Average Peak Flow Reduction Average Lag Time (minutes)
Winter Summer Annual Average 93%1,011
––– Influent ––– Effluent
Flow
(GP
M)
Minutes
HYDRAULIC PERFORMANCE
92% 96% 1,068 926
Average Volume Reduction 95%91% 98%
0 20 40 60 80
100 120
0 500 1000 1500 2000 2500 3000 3500 4000 4500
0
500
1,000
1,500
2,000
2,500
3,000
3,500
4,000
4,500
5,000
Infi
ltra
tion
Rat
e (i
n/hr
)
Pervious Concrete Test Lot
Site Average Cleaning
Average Infiltration Rate improvements in mix design coupled with added require-ments for infiltration, and higher stormwater quality treatment standards make PC a reasonable stormwater management alternative in southern climates and in northern climates with additional consideration of proper curing requirements.
System Performance
Cost & Maintenance
Current estimates for pervious concrete materials and installation range from $4 to $5 per square foot. This does not include site work and subbase construction estimated at $2 to $4 per square foot, depend-ing on depth of pavement. Routine maintenance has been performed since the PC lot was installed in 2007 as a matter of experimental design. Maintenance involves routine inspection and street vacuuming at least two times per year (spring and fall). Vacuum cleaning typically costs $350-$500 per acre per trip. Increased vacuuming frequency is expected for sites where runoff from adjacent areas flow onto the PC, where there are high traffic counts, and in areas where leaf fall and organic debris are excessive. The PC lot studied at UNH has undergone repairs for pavement degradation due to chloride application and insufficient cure time. Substan-tial raveling and pavement decay was observed in the drive lanes where chloride application was greatest. Areas protected from chloride observed no degradation.
Cold Climate
Winter performance of the PC system was observed to be exceptional for water quality, hydraulics, and infiltration capacity. Winter maintenance performance for deicing was mixed. Shaded areas of the PC lot had substan-tial challenges for deicing and required 20% additional chloride for deicing. Areas with good sun exposure required equal amounts of chloride as standard pavement. Throughout the winter, surface infiltration capacity averaged approximately 4,000 inches per hour with minimal seasonal change. Frost penetration was observed for depths of 15 inches in the pavement system. While the pavement froze sooner, deeper, and for longer periods than the reference condition, the pores remained open and well-drained year round, thus limiting freeze-thaw damage. When designed with a deep subbase and with proper installation and curing, the lifespan of these lots is expected to exceed standard pavements, which in northern climates tend to lose structural integrity after 12 to 15 years due to frost heaving. Sunnier parts of the UNHSC lot performed better than the nearby reference impervious asphalt pavement for traction and reduced snow and ice cover. In these areas, the formation of black ice resulting from melting and refreezing was essentially eliminated. However, in other parts of the lot, shading from adjacent tree cover increased winter maintenance load,
leading to reduced traction and a need for excess chloride for successful deicing. As with other porous pavements, PC deicing is more difficult during ice storms, or any time there is significant compacted snow and ice. The brine solution that collects on impervious surfaces instead infiltrates the porous pavement before it has a chance to melt ice effectively. The best approach in these circumstances is to apply excess deicing agents and to increase mechani-cal means of snow removal. A winter maintenance fact sheet is available online: www.unh.edu/unhsc.
Water Quality Treatment
Porous pavements can be expected to have substantial pollutant load reduction. The amount of load reduction is dependent on the degree of volume reduction and treatment efficiency. The water quality treatment performance of the PC system is similar to that of the PA system, which has been excellent and is consistently exceeding EPA’s recommended treatment for most contaminants with the exception of nitrogen. The exceptionally high level of treatment is due in part to the use of a filter course in the subbase design. Systems with solely course aggregate layers have more of an infiltration and sedimentation function. The fine gradation of the filter course is for enhanced filtration and delayed discharge. Due to the high infiltration capacity of the underlying native soils, coupled with the system’s capacity to store large volumes of water, a 95% runoff volume reduction has been observed since construction in 2007. The exceptional volume reduction limited the water quality assessment with only six storms that could be monitored throughout the monitoring period. The performance observed was similar to installations such as the porous asphalt lot. An interesting aspect of PC is its pH buffering of infiltrated water. Four years after its installation, the UNHSC PC lot infiltrated water demonstrates pH typically above 11. This could be an advantage in pH-challenged watersheds in need of buffering.
15
Water Quantity Control
The pervious concrete system’s ability to manage runoff was exceptional, with 95 % volume reduction on an HSG-B soil. An infiltration reservoir and elevated underdrains were designed to infiltrate the water quality volume. No surface runoff has been observed from this lot since its installation in 2007. This replaced a preexisting asphalt lot that created a local problem of severe surface erosion and gullying. Significant groundwater recharge has been achieved— far in excess of predevelopment conditions.

How the System Works WAT E R Q U A L I T y T R E AT M E N T P R O C E S S tHow the System Works
1. Rainfall infiltrates into the paver joints that are filled with clean aggregate (ASTM No. 8 stone) into the bedding course (ASTM No. 8).
2. Stormwater drains through the bedding course, through the open-graded base (ASTM No. 57 stone), and into the stone subbase reservoir (ASTM No.2 stone). Through these layers the physical process of filtration provides treatment of the stormwater runoff.
3. Installed in the stone subbase are perforated underdrains placed 4 inches above the native soils which provides retention and infiltration. Internal check dams constructed of an impermeable liner are installed for every 12” drop of elevation to provide storage on a sloped grade.
4. Excess water flows through the elevated underdrains to the municipal storm sewers or receiving water.
About Permeable Interlocking Concrete Pavement
Permeable Interlocking Concrete Pavements (PICP) are a pervious pavement system comprised of precast paving units. Similar to other permeable pavements, storm water storage and treatment occur in the constructed subsurface. The UNH installation retrofitted Hood House drive located on the main campus in the summer of 2010. A standard Interlocking Concrete Pavement Institute (ICPI) profile was used for the drive lane and a modified section with an internal storage reservoir was used in the parking area. Applications of this technol-ogy often include parking areas, driveways, sidewalks, and other low speed driving areas. Permeable pavements have been shown to be active over a wide range of climates. Proper design for cold climate prevents damage from freeze-thaw cycle. PICP can be visually stunning and add a strong architectural flair to pavement while at the same time providing tremendous water quality and hydrologic benefits.
System Performance
Cost & Maintenance
The 2010 installation cost of the PICP lot which includes pavers, jointing and bedding materials and mechanical installation was approximately
$4 per square foot. Paving units would have an added expense associated with hand installation if necessary. Individual units typically must be cut and placed along the edge of any nonuniform shape.
The permeability of PICP exists between the paving units themselves. The units have a small gap that is filled with chip stone. Maintenance is performed by cleaning with a regenerative air vacuum. One of the most important elements of maintenance of PICP is a design to minimize run-on. A low maintenance design is the best way to minimize clogging. Other clogging mechanisms include sediment tracking from vehicles, and organic litter buildup between the paving units. Attempts to clean the PICP surface have yielded variable results. Regenera-tive air vacuums work well to pick up bulk surface debris, but their effectiveness at removing deeper debris from between the pavers is still being researched. A strong vacuum can also result in the removal of the joint stone between the units. Preventative maintenance is essential in preserving high permeability for heavily used areas. This includes routine removal of surface debris through vacuuming or with the use of leaf blowers at a minimum of twice per year. One substantive benefit of PICP over other porous pavements is that they can be completely regenerated. If a system is clogged, a high-
16
PICP is a high durability and logical choice for effective stormwater management. PICP provides remarkable runoff volume reductions while providing an enhanced aesthetic appeal.
Permeable Interlocking
Concrete Pavement
Native subgrade
Please note: This design includes subbase design for cold climates and drainage for low permeability soils.
3.125”
4”
4”
20”
2”ASTM No 57 Stone
2” ASTM No. 8 Stone Aggregate
Stone Subbase: Minimum 20” ASTM No 2 Stone ( With elevated underdrain: 16” covering underdrain and 4” of stone below the underdrain)
There is an internal check dam which consists of non-woven geo textile covering the upstream side of the 4” diameter perforated underdrain as shown in the detail in the top right.
Pavers
Detail:
2’ (TYP.)
Internal check dam
4”
2’ (TYP.)
HDPE Perforated underdrain downstream internal checkdams
FA
ST
F
AC
TS
CATEGORy / BMP TyPE
Porous Pavement
UNIT OPERATIONS & PROCESSES
Hydrologic (Flow Alteration)Water Quality: Physical (Sedimentation, Filtration),
Biological (Vegetative & Chemical (Sorption)
BASIC DIMENSIONS
6,500 sf
DESIGN SOURCE: UNHSC AND ICPI
Catchment Area: 0.15 acre
Water Quality Flow: 1 cfsWater Quality Volume: 542 cf
INSTALLATION COST
$4.00 per sf mechani-cally installed
MAINTENANCE
Maintenance Sensitivity: LowInspections: LowSediment Removal: High
1
2
3
4
Site Average Cleaning
UNH PICP Test Lot
Average Infiltration Rate
0
500
1,000
1,500
2,000
2,500
3,000
3,500
4,000
4,500
5,000
Infi
ltra
tion
Rat
e (i
n/hr
)
Re-stone
S y S T E M D E S I G N t
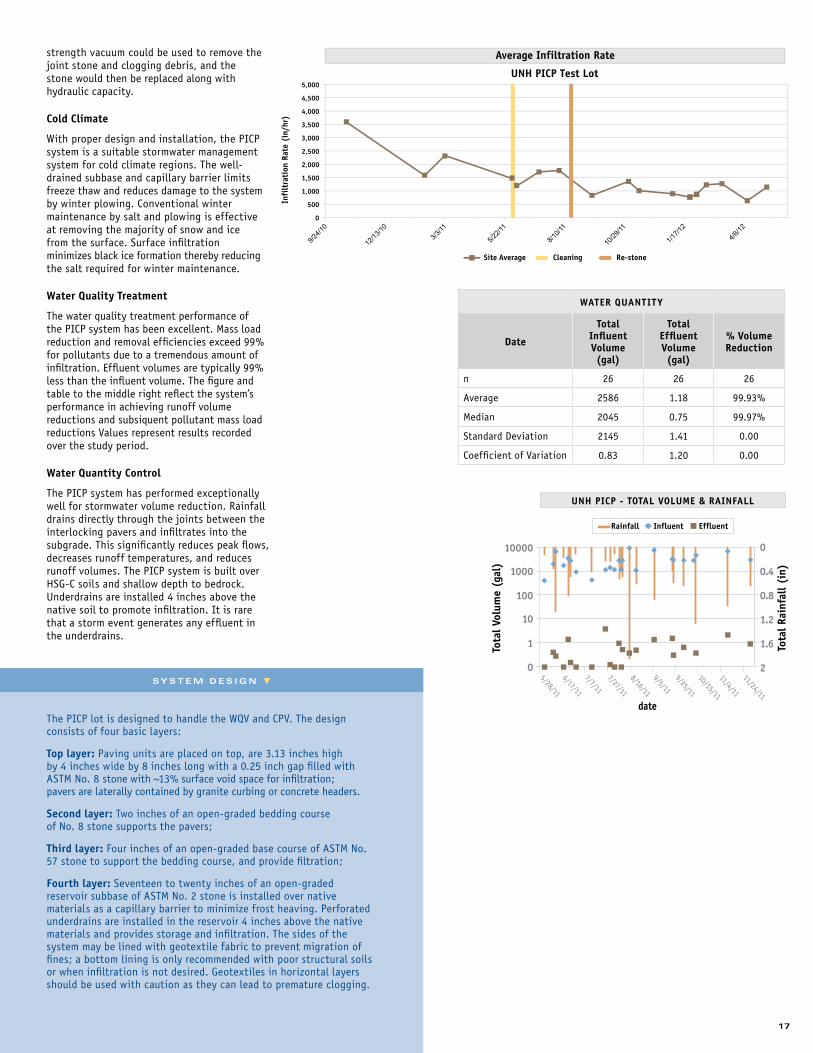
The PICP lot is designed to handle the WQV and CPV. The design consists of four basic layers:
Top layer: Paving units are placed on top, are 3.13 inches high by 4 inches wide by 8 inches long with a 0.25 inch gap filled with ASTM No. 8 stone with ~13% surface void space for infiltration; pavers are laterally contained by granite curbing or concrete headers.
Second layer: Two inches of an open-graded bedding course of No. 8 stone supports the pavers;
Third layer: Four inches of an open-graded base course of ASTM No. 57 stone to support the bedding course, and provide filtration;
Fourth layer: Seventeen to twenty inches of an open-graded reservoir subbase of ASTM No. 2 stone is installed over native materials as a capillary barrier to minimize frost heaving. Perforated underdrains are installed in the reservoir 4 inches above the native materials and provides storage and infiltration. The sides of the system may be lined with geotextile fabric to prevent migration of fines; a bottom lining is only recommended with poor structural soils or when infiltration is not desired. Geotextiles in horizontal layers should be used with caution as they can lead to premature clogging.
strength vacuum could be used to remove the joint stone and clogging debris, and the stone would then be replaced along with hydraulic capacity.
Cold Climate
With proper design and installation, the PICP system is a suitable stormwater management system for cold climate regions. The well- drained subbase and capillary barrier limits freeze thaw and reduces damage to the system by winter plowing. Conventional winter maintenance by salt and plowing is effective at removing the majority of snow and ice from the surface. Surface infiltration minimizes black ice formation thereby reducing the salt required for winter maintenance.
Water Quality Treatment
The water quality treatment performance of the PICP system has been excellent. Mass load reduction and removal efficiencies exceed 99% for pollutants due to a tremendous amount of infiltration. Effluent volumes are typically 99% less than the influent volume. The figure and table to the middle right reflect the system’s performance in achieving runoff volume reductions and subsiquent pollutant mass load reductions Values represent results recorded over the study period.
Water Quantity Control
The PICP system has performed exceptionally well for stormwater volume reduction. Rainfall drains directly through the joints between the interlocking pavers and infiltrates into the subgrade. This significantly reduces peak flows, decreases runoff temperatures, and reduces runoff volumes. The PICP system is built over HSG-C soils and shallow depth to bedrock. Underdrains are installed 4 inches above the native soil to promote infiltration. It is rare that a storm event generates any effluent in the underdrains.
17
WATER QUANTITY
Date
Total Influent Volume (gal)
Total Effluent Volume (gal)
% Volume Reduction
n 26 26 26
Average 2586 1.18 99.93%
Median 2045 0.75 99.97%
Standard Deviation 2145 1.41 0.00
Coefficient of Variation 0.83 1.20 0.00
10000
1000
100
10
1
0
Tota
l Vol
ume
(gal
)
Tota
l Rai
nfal
l (in
)
date
UNH PICP - TOTAL VOLUME & RAINFALL
5/28/11
6/17/11
7/7/11
7/27/11
8/16/11
9/25/11
10/15/11
9/5/11
11/4/11
11/24/11
Rainfall Influent Effluent
2
1.6
1.2
0.8
0.4
0

How the System Works WAT E R Q U A L I T y T R E AT M E N T P R O C E S S t S y S T E M D E S I G N tHow the System Works
12” Q v Bypass
6” Subdrain 24” of 3/4” Crushed stone
Not drawn to scale, vertical exaggeration
8” Wetland soil
Native soils
12” Pipe inlet from sedimentation forebay
6” Perforated riser pipe
CP v Overflow
6” Outlet pipe with elevated invert
2
34
3
1
1. Runoff flows into a pretreatment forebay to remove settleables and gross solids.
2. Runoff exits the forebay through two stacked horizontal pipes (primary and secondary spillways). The lower pipe is a 6 inch pipe with a 1 inch orifice and the top pipe is a 12 inch pipe and into the treatment cells.
3. Hydraulic riser inlets conduct water to the subsurface gravel layer. There, biological treat- ment occurs through the uptake of pollutants by vegetation and anaerobic microbial activity within the gravel and soil. Physical and chemical treatment—the trapping of contaminants— occurs on and within the gravel filter media and root mat. Other UOPs
include sedimentation, transformation through reduction/oxidation, and sorption with organic matter and mineral complexes.
4. Treated runoff exits to the surface via an outlet pipe that includes an orifice control elevated four inches below the wetland surface. This insures that the soil is nearly continuously saturated—a condition that promotes vegetation growth and denitrification.
About the Subsurface Gravel Wetland
The subsurface gravel wetland has been around for almost 15 years but enjoyed little imple-mentation until the UNHSC pioneering studies. It approximates the look and function of a natural wetland, effectively removing sedi-ments and other pollutants commonly found in runoff while enhancing the visual appeal of the landscape by adding buffers or greenscape to urban areas. The subsurface gravel wetland evaluated at UNHSC for 8 years is a horizontal-flow filtration system and should not be confused with stormwater wetlands that function more like ponds. Instead, the subsurface gravel wetland includes a dense root mat, crushed stone, and an anaerobic microbe rich environment for improving water quality. Like other filtration systems, it demonstrates a tremendous capacity to reduce peak flow and improve water quality. By design, the subsurface gravel wetland by itself is not intended for infiltration of stormwater.
Implementation
Subsurface gravel wetlands can be used in many regions, with the exception of those that are too arid to support a wetland system. These systems have demonstrated exceptional water
quality treatment, in particular for nutrients, for a range of land uses including commuter parking, high density commercial use, and major transportation corridors. Subsurface gravel wetland systems can be space intensive but can be easily retro-fitted into dry ponds. Like any system that relies on infiltration or filtration, subsurface gravel wetland systems should be lined and outfitted with subdrains that discharge to the surface if they are to be used in pollution hotspots. Dissolved oxygen levels may fluctuate within biologically active subsurface systems like the subsurface gravel wetland, yet if this is a problem for local receiving waters, then it can easily be dealt with by introducing turbulence and aeration into the outlet design. While subsurface gravel wetlands are more expensive than other LID systems, they represent a dramatic performance improvement over ponds. Subsurface gravel wetlands are especially effective at removing nitrogen and have been used for some time in wastewater treatment.
Application
Subsurface gavel wetlands use is increasing, especially in areas where impaired waters exist or where higher standards are necessary. The State of New Jersey has provided loans and grants for subsurface gravel wetland
18
Subsurface Gravel Wetland systems continue to offer superior treatment for common stormwater pollutants and unparalleled treatment of nutrients.
Subsurface Gravel Wetland
FA
ST
F
AC
TS
CATEGORy / BMP TyPE
Stormwater Wetland, Low Impact Development Design
UNIT OPERATIONS & PROCESSES
Hydrologic (Flow Alteration)
Water Quality: Physical (Sedimenta-tion, Filtration), Biological (Vegetative Uptake, Microbial Mediation), & Chemical (Sorption)
BASIC DIMENSIONS
Filter Basin Footprint: 15 ft long X 32 ft wide
Forebay Footprint: 10 ft long X 32 ft wide Total Area: 5,450 sf
SPECIFICATIONS
Catchment Area: 1 acreWater Quality Flow: 1 cfsWater Quality Volume: 3,300 cf
INSTALLATION COST
$22,500 per acre treated
MAINTENANCE
Maintenance Sensitivity: MediumInspections: 1-4 times per yearSediment Removal: High

S y S T E M D E S I G N t
12” Q v Bypass
6” Subdrain 24” of 3/4” Crushed stone
Not drawn to scale, vertical exaggeration
8” Wetland soil
Native soils
12” Pipe inlet from sedimentation forebay
6” Perforated riser pipe
CP v Overflow
6” Outlet pipe with elevated invert
This subsurface gravel wetland was designed by UNHSC. Its rectangular footprint occupies 5,450 square feet and can accommodate runoff from up to one acre of impervious surface. It includes a pretreatment forebay, followed by two flow-through treatment basins. (Other pretreatment approaches may be used.) Each treatment basin is lined and topped with two feet of gravel and 8 inches of wetland soil. The system is designed to retain and filter the water quality volume (WQv) 10 percent in the forebay and 45 percent above each treatment cell. It can detain a channel protection volume (CPv), and release it over 24 to 48 hours. The conveyance protection volume (Q10) is bypassed. For small, frequent storms, each treatment basin filters 100 percent of the influent it receives. For larger storms that do not exceed the design volume, some stormwater bypasses the first treatment basin and is only processed by the second. When storms exceed the design volume, the first inch of rain (first flush) is treated, while the excess is routed to conveyance structures or receiving waters. The treatment cells host a diverse mix of native wetland grasses, reeds, herbaceous plants, and shrubs.
installations. In addition the New Hampshire Department of Transportation employs them at park and rides. These systems work well in retrofit applications such as the Berry Brook project in Dover, NH.
System Performance
Cost & Maintenance
Subsurface gravel wetland installation cost was $22,500 per impervious acre. Removal of system biomass (vegetation) should occur at least once every three growing seasons. The dense vegetation has been observed to have little problems with invasive plants. Mainte-nance activities include the removal of accumulated sediment biomass in the forebay and treatment cells. Research has demonstrated the value of biomass removal for long-term nutrient uptake. Without this practice, nitrogen rerelease will begin to occur. Maintenance is critical to ensure that influent (runoff) can remain well-aerated before it enters the denitrifying environment of the subsurface. Forebay maintenance of vegetation prevents the reintroduction of pollutants, particularly nitrogen and phosphorus and reduces mainte-nance on the treatment cells.
Cold Climate
The subsurface gravel wetland’s water quality treatment and water quantity control capacity remained strong in all seasons. The gravel wetland’s primary flow path is subsurface and enters the system through perferated riser pipes such that freezing of the wetland surface does not impact routing. Nitrate removal declines during the winter season while removal of other pollutants remained high in cold climates.
Water Quality Treatment
The subsurface gravel wetland does an exceptional job of removing nearly all of the pollutants commonly associated with stormwater treatment performance assessments. Subsurface gravel wetlands consistently exceed EPA’s recommended level of removal for total suspended solids and meets regional ambient water quality criteria for nutrients, heavy metals, and petroleum hydrocarbons. The chart at the middle right reflects the subsurface gravel wetland’s performance in removing total suspended solids, total petroleum hydrocarbons, zinc, dissolved inorganic nitrogen, total nitrogen, and total phosphorus. Values represent results recorded over 8 years, with the data further divided into summer and winter components. Additional sites are being monitored for long-term perfor-mance including high-use commercial uses. Of particular importance for coldwater fisheries, the mean July temperature of runoff leaving the system was 66.0 degrees F—12 degrees lower than the retention pond.
Water Quantity Control
Like other filtration systems, the subsurface gravel wetland exhibits tremendous capacity to reduce peak flows ~87%. The figure above illustrates effective peak flow reduction and long lag times for the range of seasons monitored.
19
61 644 ug/L 0.3 1.10.04 0.06
POLLUTANT REMOVAL: 2004–2010
% R
emov
al E
ffic
ienc
y
sediments totalpetroleum
hydrocarbons
dissolvedinorganicnitrogen
totalnitrogen
metals
Median Annual Influent Event Mean Concentrations (EMC) in mg/Lr
totalphosphorus
WinterSummer Annual
0102030405060708090
100
TPZn TNDINTPH-DTSS
Average Peak Flow Reduction Average Lag Time (minutes)
Winter Summer Annual Average 92%391
––– Influent ––– Effluent
Flow
(GP
M)
Minutes
HYDRAULIC PERFORMANCE
91% 93% 419 367
350 300 250 200 150 100 50 0
0 50 100 150 200
4,000
3,000
2,000
0
10
20
30
40
50
1,000
0
Cost
$
Hou
rs
GRAVEL WETLAND
Cost Hours
yr1 yr2 yr3

How the System Works B I O R E T E N T I O N S O I L M I x C O M P O S I T I O N tIssues in Focus
About Bioretention Systems
Bioretention systems, also known as “rain gardens,” are among the most common Low Impact Development (LID) stormwater approaches in use today. These systems consist of land- scaped depressions which collect runoff that subsequently ponds, filters through a soil mix, and infiltrates into the ground, or discharges to the surface. The UNHSC has evaluated many different bioretention systems; this report specifically examines four bioretention designs (Bio 1, Bio 2, Bio 3, and Bio 4), two of which are new, and two of which have been studied and reported on previously. While structural variations exist, the main differences between these systems relate to the composition of bioretention soil mix (BSM) – namely sand, compost, wood chips, and loam.
Implementation
Bioretention systems are used throughout all areas of the U.S., but their acceptance and implementation varies regionally. An increasing number of states are requiring higher levels of water quality treatment and volume reduction that only can be achieved through the incorporation of filtration and infiltration designs like bioretention systems. In some regions, local acceptance is hindered by lack of performance data, unfamiliarity with the design, concerns over maintenance, and suspicions in regards to seasonal functionality. To maximize volume reduction of stormwater runoff with bioretention systems, they should be located in soils that accommodate infiltra-tion, such as those classified as hydrologic soils group “A” (sand, loamy sand, or sandy loam with high infiltration rates) and group “B” (silt loam or loam with moderate infiltration rates).
System Performance
Cost
The installation costs associated with the bioretention systems implemented by UNHSC ranged from $14,000 to $25,000 per acre of impervious cover “IC” treated. These costs will moderate as installers and designers gain familiarity with the systems. In 2007, UNHSC installed Bio 4 in a vegetated parking lot median strip as a retrofit at a total cost of $14,000 per acre, including $8,500 per acre for labor and installation, and $5,500 per acre for materials and plantings. These findings indicate that for municipalities with equipment and personnel, the retrofit costs are nearly $5,500 per acre of drainage. These costs do not include design, permitting, or construction supervision costs.
Maintenance
Bioretention systems are designed for minimal maintenance. As indicated by the graph in the bottom right, the highest maintenance burden occurs during the first two years of operation as the vegetation grows and the system begins to stabilize. Once vegetation is established, maintenance decreases and becomes very predictable, similar to what is required for standard landscaping. Common maintenance tasks include seasonal mowing, raking, and pruning of vegetation. Beyond two years, long-term maintenance tends to level off and involve more routine and schedulable mainte-nance activities. The average of all mainte-nance costs and personnel hours required for the bioretention systems studied at UNHSC were $1,820 and 21 hours of labor per year per acre of IC treated, respectively.
Infiltration rates (IR) are easily measured in bioretention systems using standard methods (ASTM D3385 – 09) or even more simply with instruments like the Turf-Tec Infiltrometer. At the UNHSC, IR was measured for all bioreten-
20
Bioretention systems are the workhorse of LID approaches and offer flexible, adaptive and reliable treatment of stormwater runoff.
Bioretention Systems
Soil Mix Hydraulic Loading Ration PSD
System Date Installed
Sand Compost Soil Woodchips Vegetation Cover Drainage Area : Filter Area Date Organic Content % passing 200 um sieve
Bio-1 2004 45% 10% 45% 0% Trees and Wetland Plants 18:1 2004 4.2 2%
Bio-2 2005 60% 10% 10% 20% Wooded Vegetation 160:1 2005 2.9 7%
Bio-3 2009 60% 10% 10% 20% Eco-Lawn 160:1 2009 6.6 10%
Bio-4 2008 70% 30% 0% 0% Prairie Meadow Perennial 32:1 2008 9.9 8%
The soil mix used in the bioretention systems is central for determining flow control and water quality treatment performance. Hydraulic conductivity of bioreten-tion soil mixes is variable and usually trends toward higher infiltration rates than originally designed for. Infiltration rates of BSM mixes are strongly correlated to the percent that passes the 200 sieve and guidance largely suggests that the fines should ideally be between 2-5%. Current research shows variable nitrogen and phosphorus removals and that additional research is needed to optimize bioretention systems for nutrient treatment.

WATER QUANTITY CONTROL
Systems Winter Summer Average
Bioretention 1
Average Peak Flow Reduction 77% 74% 75%
Average Lag Time (minutes) 408 108 266
Bioretention 2
Average Peak Flow Reduction 74% 85% 79%
Average Lag Time (minutes) 346 265 309
Bioretention 3
Average Peak Flow Reduction 84% 85% 84%
Average Lag Time (minutes) 215 217 216
Bioretention 4
Average Peak Flow Reduction 94% 95% 95%
Average Lag Time (minutes) 52 67 61
tion systems studied. The figure below compares IR over the range of bioretention systems. Of particular interest is the decline of IR over time for 3 out of the 4 bioretention systems. This can be predicted and is likely due to the accumulation of fine materials on the surface of the filter. The IR reduction rate can be used to schedule cleanings and maintenance of the filter.
In contrast to the other systems vegetated with native perennial plants, the Bio 3 system was different in that the basin was vegetated with a conservation mix often used for detention basins), and contained a continuous dense vegetative cover. Previous studies have indicated that plant roots generally experience a 30% die back each year which aids in the development of macropores that keep soil surface IC high over time. The data from this study seems to suggest that dense vegetative cover is more important than plant type for maintaining IR in vegetative systems. If aesthetics are not a concern, then it is conceivable that grassed bioretention systems could reduce overall maintenance burdens in bioretetnion systems.
Cold Climate
The ability for bioretention systems to treat water quality and control water quantity remained relatively consistent in all seasons over the range of systems monitored. UNHSC researchers have observed that most LID stormwater systems, when properly designed and installed, are not negatively impacted by cold climate.
Water Quality Treatment
All bioretention systems have proven effective at removing sediment-bound pollutants commonly associated with stormwater treat- ment performance assessments. Additionally, the systems consistently exceed EPA’s recom-
mended level of removal for total suspended solids and achieved requisite removal for petroleum hydrocarbons and metals (TZn). However, the performance for nutrients is more variable. With the exception of Bio 2, the range of systems consistently removed dissolved inorganic nitrogen (DIN). A consistent trend with respect to percent removals was apparent in that a definite seasonality and a virtual ceiling at 40 – 45% removal were observed. Exceptions include Bio 2 which had no real DIN removal. This may be due to a less dense root mat and a reduced filter area caused by shading and pedestalling from woody vegetation. Over time woody vegetation can crowd and shade out bioretention areas and may not be suitable for this application. Total Phosphorus (TP) treatment performance was variable but trended toward efficiencies of roughly 20-30%, and may be maximized by limiting phosphorus levels in the design BSM. The chart at the right reflects bioretention performance in removing total suspended solids, total petroleum hydrocarbons, total zinc, dissolved inorganic nitrogen, total nitrogen, and total phosphorus.
B S M I N F I LT R AT I O N R AT E S t
21
100%
80%
60%
40%
20%
0%
BIORETENTION PERFORMANCE
TSS TPH-D Zn DIN TN TP
Bio 1 Bio 2 Bio 3 Bio 4
NA NA
3,500
2,500
1,500
0
10
20
30
40
50
500
0
Cost
$
Hou
rs
BIORETENTION
Cost Hours
yr1 yr2 yr3 yr4
70
60
50
40
30
20
10
0Infi
ltra
tion
Rat
e (i
n/hr
)
INFILTRATION RATES OVER TIME
yr1 yr2 yr3
Bio I Bio II Bio III Bio IV
The accepted optimum infiltration rate for bioretention soil mixes ranges between 0.5 to 12 inches per hour. Sandy bioretention soil mixes should provide excellent water quality performance with respect to most sediment associated pollutants. Designs with safety factors >3 should consider orifice control in bioretention underdrains in N and P sensitive watersheds. UNHSC research indicates that more robust vegetative cover is higher in importance as compared to plant selection or placement in maintaining long term surface infiltration rates.
NA = pollutant not monitored

How the System Works
About the Tree Box Filter
Tree filters are mini bioretention systems that combine urban landscaping and drainage. Tree filters are available both as proprietary and non-proprietary systems, the difference being the level of design and ease required for use. Proprietary systems are ready off the shelf. Non-proprietary systems are inexpensive and require design of all critical components and use commonly available parts. They are typically located behind a curb and sidewalk and used to replace catch basins to treat relatively small drainage areas (<10,000 sf). Urban foresters support their usage as one way to improve the longevity of urban trees which are commonly starved of nutrients and water. One advantage of street trees over typical bioretention in highly urbanized areas is the decreased need for routine aesthetic maintenance to remove trash and debris. Because they are often deep and covered with a grate, the accumulation of trash and debris on the filter surface is not visible as it is in a surface bioretention system. In urban environ-ments the need to clean systems can be frequent. Their water quality treatment performance is high, similar to other high-capacity bioretention systems. The first tree filter at UNH was installed in 2004. Results of monitoring both proprietary and non-proprietary system are presented here.
Implementation
Tree filters are highly adaptable and can be used in many development and LID retrofit scenarios. They are especially useful in settings where minimal space is available. In urban areas, tree filters can be used in the design of an integrated street landscape - a choice that transforms isolated street trees into stormwater filtration devices. Tree filters can be installed in open-bottomed chambers in locations where infiltration is desirable, or in closed-bottomed chambers where infiltration is either impossible (clay soils) or undesirable (high groundwater or highly contaminated areas). Lateral openings may be included in the treebox for areas where root growth is acceptable. In these instances, tree filters may be used in combination with structural cells to provide soil and space for tree root growth under sidewalks or pavements. In general, tree filters are sized and spaced much like catch basin inlets, and design variations are abundant. Common catch basin drainage areas may range from 3,000 to as large as 30,000 square feet of impervious area. The system evaluated at UNHSC was designed by researchers to treat 5,000 square feet. Other proprietary designs are also increasingly available and can provide additional pretreatment.
22
Tree box filters are ideal for stormwater management retrofits. Tree box filters are based on the same principles as bioretention systems but offer high flow-rate capacity and reliable treatment for most common stormwater pollutants.
Tree Box Filter
FA
ST
F
AC
TS
CATEGORy / BMP TyPE
Filtration, urban retrofit, LID, manufactured treatment device.
UNIT OPERATIONS & PROCESSES
Water Quality: Physical (Filtration)Biological (Vegeta-tive uptake)Chemical (Sorption)
DESIGN SOURCE
UNHSC, Filterra
BASIC DIMENSIONS
UNHSC DesignDiameter: 6 ftDepth: 4 ftFilterra Design: Varies
SPECIFICATIONS
Catchment Area: UNHSC Design: 0.1
acreFilterra Design: 0.3 acreWater Quality Volume: UNHSC Design: 425 cfFilterra Design:Not reported
INSTALLATION COST
UNHSC Design: $3,000 for materials, $3,000 installation
($30,000/acre treated)Filterra Design:Not reported
MAINTENANCE
Maintenance Sensitivity: Medium Inspections: 1-4 times per year Sediment Removal: High
Soil Mix Hydraulic Loading Ration
System Date Installed
Sand Compost Soil WoodchipsVegetation
CoverOrganic Content
% Passing 200% um
SieveStructural Drainage Area : Filter Area
UNHSC Tree Filter 2005 80% 20% - - Green Ash 2.1 5% None 156:1
Portmouth Tree Filter 2011 Not disclosed Red Maple 2.9 2% None 311:1
T R E E B Ox F I LT E R S O I L C O M P O S I T I O N tIssues in Focus

System Performance
Cost & Maintenance
The cost to install a tree filter to replace a single catch basin is about $6,000 per system. Labor and installation costs are approximately $3,000, and materials and plantings an additional $3,000. For municipalities with equipment and personnel, the cost for retrofits can be relatively low. Proprietary tree filters are becoming increasingly popular, can be as much as $20,000, and offer the advantage of a complete design package that is easily incorporated into a development or retrofit project. Treatment efficiencies for nutrients are low, as hydraulic loading rates and infiltration capacity are high. Since the installation of the UNHSC system in 2004 there has been minimal maintenance. Aside from routine trash and leaf removal, the highest maintenance burden is associated with periodic inspection to assure that the bypass and soils are adequately conveying water. Clogging typically occurs in the top two inches of surface soil making servicing of these systems simple. Long-term maintenance may involve periodic removal (vacuuming) or raking of surface fines similar to that of deep sump catch basins. The system at the UNHSC was maintained in 2008 by removal of the top two inches of surface accumulation. Maintenance was initiated after a noticeable reduction in infiltration and increased incidence of bypass following parking lot sealcoating. An accumulation of sealcoat fines caused a noticeable infiltration reduction. This raised the concern that the coincidence of filter systems and sealcoating may be problematic long-term.
Tree replacement depends upon the hardiness of the selected species and the aggressiveness of the root growth. Tree filter maintenance should be consistent with the marginal costs associated with bioretention systems.
Cold Climate
The tree filter’s ability to treat water quality remained relatively stable in all seasons. This is consistent with UNHSC observations of most LID stormwater systems—when they are properly designed and installed, they are not dramatically impacted by seasonal fluctuations. While some seasonal variation in infiltration capacity and nitrogen removal does occur, cold conditions do not seem to warrant significant design alterations.
Water Quality Treatment
The tree filter is effective for removing many pollutants and consistently exceeded EPA’s recommended level of removal for total suspended solids, and also meets regional ambient water quality criteria for petroleum products and total zinc. The treatment effectiveness appears to be reduced for nitrogen due to the high infiltration capacity of the tree filters which regularly exceed 120 in/hr. The chart at top right reflects system performance in removing total suspended solids, total petroleum hydrocar-bons, total zinc, dissolved inorganic nitrogen, total nitrogen, and total phosphorus. Values represent results recorded over six years for the UNHSC system and one year for a proprietary system installed in Portsmouth, NH.
Water Quantity Control
Tree filters do little to reduce peak flows unless they are installed in sandy soils with moderate to high infiltration rates. The tree filter displays no significant peak flow reduction or lag time for the range of seasons monitored.
23
31 631 0.2 1.30.04 0.07
TREE FILTER PERFORMANCE
% R
emov
al E
ffic
ienc
y
sediments totalpetroleum
hydrocarbons
dissolvedinorganicnitrogen
totalnitrogen
metals
39UNHSC
Ports TBF 520 0.2 1.50.10 0.21
Median Annual Influent Event Mean Concentrations (EMC) in mg/L
totalphosphorus
Ports TBFUNHSC
0102030405060708090
100
TPZn TNDINTPH-DTSS
100
120
140
80
60
40
20
0
INFILTRATION RATES OVER TIME
yr1 yr2 yr3 yr4 yr5
Infi
ltra
tion
Rat
e (i
n/hr
)
UNHSC Tree Filter Portsmouth Tree Filter
*denotes change in IR methodology
*
S O I L I N F I LT R AT I O N R AT E S t

How the System WorksDetention Pond vs. Retention Pond
The primary difference between detention ponds and retention ponds is a permanent pool of water. Detention ponds are designed to fully drain within 6 to 24 hours depending on total storm depth. UNHSC conducted and published performance evaluations of retention ponds in the 2007 and 2009 biennial reports. The two systems are similar in their capacity to manage peak flows and large storm volumes. The two systems also have modest capacity for removing nutrients. In regards to sediments (TSS), petroleum hydrocarbons (TPH-D), and metals (TZn), the systems begin to demonstrate unique treatment patterns. As shown in the figure to the right, the retention pond is consistent throughout the year in its ability to remove TSS and TPH-D while the detention pond has a higher efficiency for treatment during the summer months. This is likely due to the retention pond permanent pool of water providing consistent treatment for settling sediments throughout the year. The detention pond has shown to have higher removals for TSS but lower annual removals of TPH-D. The seasonal treatment pattern for TZn is the same for each system with higher removals during summer months. The retention pond developed a thick layer of floating vegetation that may have contributed to the removal of TZn. Removal of TZn in the detention basin is likely due to the association of metals to sediments.
About Detention Ponds (A.K.A. Dry Ponds / Dry Detention Basins)
Detention basins or dry ponds are common stormwater management systems widely used for water quantity control. Detention basins are designed to store large volumes of water and regulate effluent flow by providing flood control, peak flow reduction, and some stormwater treatment. Compared to retention ponds which maintain a permanent pool of water, detention basins are designed to fully drain within 24-48 hrs of a storm event. Unique to the UNHSC detention pond design was a covered gravel outlet to improve water quality. A key design feature includes the 24 to 48 hour retention time for the water quality volume regulated by an orifice control at the outlet control structure. This increased residence time for a smaller storm event promotes additional pollutant removal through sedimentation, vegetative uptake, and some pollutant transformation by microbial activity. Ponds were shown to excessively heat runoff in the summer and overly cool runoff in the winter, which can be of concern to cold water fisheries. A well maintained and mature detention basin can provide habitat and aesthetic benefits in urban settings.
Implementation
Dry detention ponds are one of the most widely implemented stormwater best management practices (BMP) used today. They can be designed for any region or climate, but may be difficult to locate in ultra-urban settings or adjacent to sensitive ecosystems. A dry pond tends to have a large footprint, making them difficult to fit into compact development designs. Areas that have highly polluted runoff may need a more extensive treatment system or treatment train to protect water quality. Dry ponds are ideal in locations where flood control and peak flow reductions are the primary objectives for runoff management. Dry ponds can be installed in most soil types and geology.
System Performance
Cost & Maintenance
The cost to install the UNHSC detention pond system for treating runoff from one acre of impervious surface was $13,700 (2004 dollars). Maintenance activities involve routine inspection, periodic mowing, and sediment removal. The perception that ponds require minimal maintenance contributes to their popularity. However, the detention pond studied required the third highest annual maintenance costs of the UNHSC studied
24
Detention ponds can be effective for many common stormwater pollutants but efforts to reduce operation and maintenance costs should be considered during system design.
Detention Ponds
FA
ST
F
AC
TS
CATEGORy / BMP TyPE
Dry Pond
UNIT OPERATIONS & PROCESSES
Hydrologic (Flow Alteration)Water Quality: Physical (Sedimenta-tion) & Biological (Vegetative Uptake)
DESIGN SOURCE
New York State Stormwater Management Design Manual
BASIC DIMENSIONS
46 ft X 70 ft
SPECIFICATIONS
Catchment Area: 1 acreWater Quality Flow: 1 cfs
INSTALLATION COST
$13,500 per acre treated
MAINTENANCE
Maintenance Sensitivity: HighInspections: 1-4 times per year Sediment Removal: Medium/High
TSS TPH-D Zn DIN TN TP
ANNUAL PERFORMANCE
Retention Pond Detention Pond
0% 10% 20% 30% 40% 50% 60% 70% 80% 90%
100%
NA

systems with $2,400 and 24 total hours per acre of treatment. While little maintenance may be required to support the ability for a detention pond to manage peak flow and large volumes, more frequent attention is critical to maintain effective water quality treatment performance. Allowing the plants to die back in the winter and decompose within the system has proven to re-release nutrients in the pond outflow. Annual removal by mowing of vegetation is critical to its long-term effectiveness for water quality treatment.
Cold Climate
Detention pond performance is not greatly affected during cold weather months. Water quality performance for sediments and metals does not vary substantially. Some reductions in nutrient removal have been observed seasonally. Water quantity management is unaffected during the winter months and no alterations to system design for cold weather have been made.
Water Quality Treatment
Median TSS removal efficiencies for the detention pond studied at UNHSC fall just below EPA’s recommended criteria of 80% removal of suspended sediments. With regular maintenance, the system can provide long-term removal of solids and trash, and moderate removal of petroleum hydrocarbons, metals, and nutrients. Pollutants associated with sediments (petroleum hydrocarbons, metals) are readily removed through sedimentation whereas soluble pollutants (nitrate) pass through the system with minimal reduction. This particular system was installed with a covered gravel outlet, a simple improvement that increased removal of suspended sediments through coarse filtration. Reduction in petroleum hydrocarbons are likely associated
with sediment removal. Removal of nutrients are moderate as the detention time is sufficient for some vegetative uptake and microbial degradation to occur.
Water Quantity Treatment
Detention basins are very effective for storing large volumes of water. The system tested is designed to store runoff from a one-inch storm (WQv) and release it slowly over a 24 - 48 hour period through a hydraulic control structure. Storm depths that exceed design capacity are bypassed to an adjacent vegetated swale. This design has proven an effective approach for flood control and peak flow reductions. During summer months temperatures of detained water can be significantly increased, second only to retention ponds. Detention ponds, or dry ponds, are excellent opportunities for WQ retrofit. Most ponds are designed for flood control or peak flow reductions for a 10 year desing storm or greater. For the water quality performance demonstrated here, the system would need to be retrofitted with an additional flow control for the 1 inch WQv. Dry ponds with sufficient space, can be easily retrofitted to include sub-sections of gravel wetlands or bioretention systems.
25
77 490 ug/L 0.3 1.10.03 0.05
POLLUTANT REMOVAL: 2009–2010
% R
emov
al E
ffic
ienc
y
sediments totalpetroleum
hydrocarbons
dissolvedinorganicnitrogen
totalnitrogen
metals
Median Annual Influent Event Mean Concentrations (EMC) in mg/L
totalphosphorus
WinterSummer Annual
0102030405060708090
100
TPZn TNDINTPH-DTSS
Average Peak Flow Reduction Average Lag Time (minutes)
Winter Summer Annual Average 93%639
––– Influent ––– Effluent
Flow
(GP
M)
Minutes
HYDRAULIC PERFORMANCE
92% 94%788 521
80 70 60 50 40 30 20 10 0
500 0 1000 1500
S y S T E M D E S I G N t
The performance of the detention basin is not greatly affected during cold weather months. Water quality performance for sediments and metals does not vary substantially. Some reductions in nutrient removal have been observed seasonally. Water quantity management is unaffected during the winter months and no alterations to system design for cold weather were necessary.
3,500
2,500
1,500
0
10
20
30
40
50
500
0
Cost
$
Hou
rs
DETENTION POND
Cost Hours
yr1 yr2 yr3 yr4

How the System Works WAT E R Q U A L I T y T R E AT M E N T P R O C E S S tHow the System Works
About Offline Hydrodynamic Separators
Hydrodynamic separators (HDS) are small, flow-through devices that can be easily designed or retrofitted into ultra-urban and space-constrained projects. Primary treatment is through enhanced particle sedimentation and removal of floating debris. A substantial concern of online HDS systems is the resuspen-sion of solids from high flows. The offline configuration tested includes a flow diversion structure upstream of the HDS unit designed to bypass flows exceeding the water quality flow. This configuration prevents high flows from entering the system and resuspending sediments captured in the HDS chamber. The offline configuration proved to be extremely effective at increasing the system performance for removing solids and petroleum hydrocar-bons. The offline configuration of the HDS was an inexpensive design improvement which more than doubled the overall system perfor-mance. An offline HDS could be used as a pretreatment measure in combination with a filtration system to create a more effective treatment train system.
Implementation
The approved use of HDS devices varies from state to state. This variability is due, in part, to concern of resuspension and low perfor-mance in field tests. Some states approve the use of HDS devices for primary stormwater treatment while others limit their use to pretreatment. Some states now require the offline usage of HDS. Many states require field performance certification before HDS systems can be used for primary treatment.
System Design
The selection of HDS devices is in accordance with local watershed conditions and target water quality treatment objectives. Often, these systems are designed to replace or retrofit existing catchbasins. The offline configuration consists of a typical HDS device with an upstream flow diversion structure. The HDS unit is configured for tangential flow, meaning that stormwater enters the device through an off-center inlet that creates a swirling hydrodyanmic action to enhance particle settling. The system outlet is typically located behind a baffle to remove floating debris, oil, and grease. The offline configuration bypasses high flows around the HDS chamber. Treated and bypass flows are comingled downstream of the HDS chamber.
26
1. Runoff flows into the flow diversion structure upstream of the HDS unit. Design flows pass directly through to the HDS while higher flows are conveyed around the structure through a bypass channel.
2. Design flows enter along the perimeter of the HDS unit such that the direction and velocity of the flow creates a hydrodynamic separation within the center of the system that causes sediments to fall out of suspension and settle to the bottom of the chamber.
3. Flow exits the system under a baffle which traps floatables within the HDS unit.
4. Treated effluent and untreated bypass flow combine downstream of the unit and are conveyed to receiving waters.
Offline configurations dramatically increase BMP performance with respect to sediment removal because the highest flows bypass the system and therefore do not flush-out sediment trapped in previous storms.
Offline Hydrodynamic
Separators
FA
ST
F
AC
TS
CATEGORy / BMP TyPE
Sedimentation, Conventional Design
UNIT OPERATIONS & PROCESSES
Water Quality: Physical (Sedimentation)
DESIGN SOURCE
Manufacturer
BASIC DIMENSIONS
Diameter: 6 ftDepth: 6 ftSump: 4 ft
SPECIFICATIONS
Catchment Area: 0.3 acreWater Quality Flow: 0.33 cfs
Water Quality Volume: 1,100 cf
UPSTREAM FLOW DIVERTER INSTAL-LATION COST
$1,500 per unit for materials, $1,500 for installation
MAINTENANCE
Maintenance Sensitivity: LowInspections: annually depending on loading Sediment Removal: Low
Online HDS
HDS
Outlet
Design flow conveyanceTotal runoff volume
Combined flow conveyance
Offline HDS
High Flow(non-design)BypassHDS
Outlet
Upstream Catch Basin
Upstream Catch Basin
Online HDS
HDS
Outlet
Design flow conveyanceTotal runoff volume
Combined flow conveyance
Offline HDS
High Flow(non-design)BypassHDS
Outlet
Upstream Catch Basin
Upstream Catch Basin
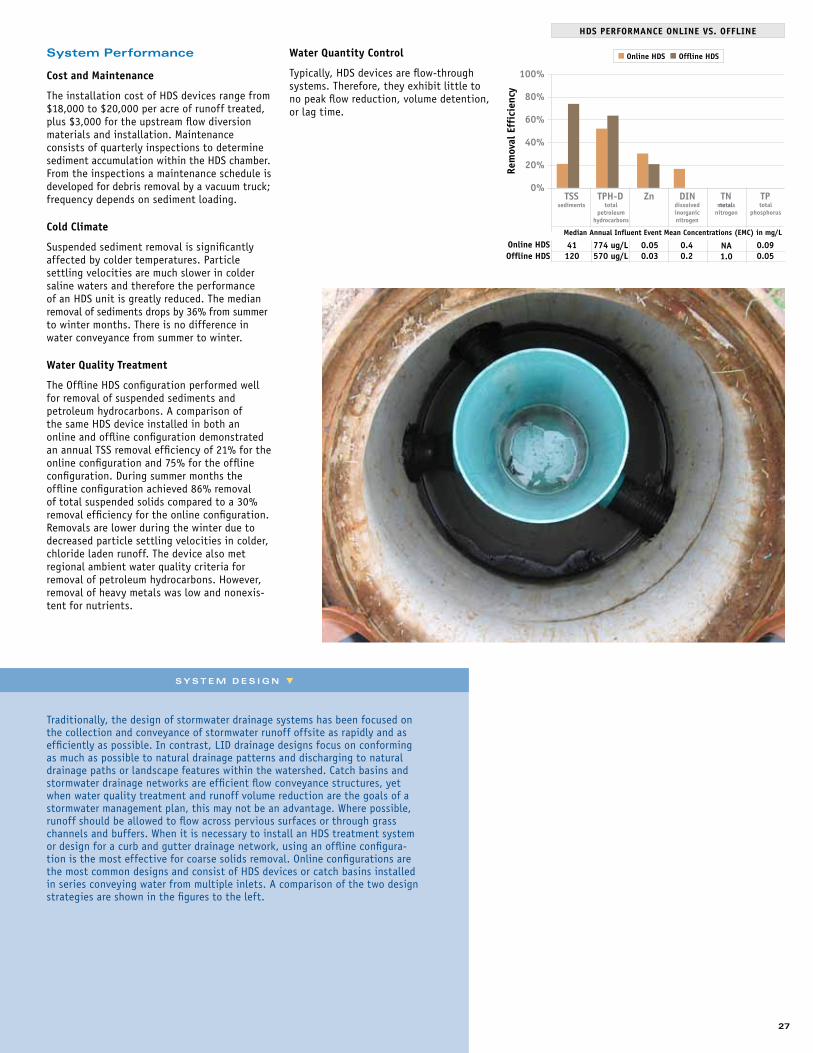
S y S T E M D E S I G N t
Traditionally, the design of stormwater drainage systems has been focused on the collection and conveyance of stormwater runoff offsite as rapidly and as efficiently as possible. In contrast, LID drainage designs focus on conforming as much as possible to natural drainage patterns and discharging to natural drainage paths or landscape features within the watershed. Catch basins and stormwater drainage networks are efficient flow conveyance structures, yet when water quality treatment and runoff volume reduction are the goals of a stormwater management plan, this may not be an advantage. Where possible, runoff should be allowed to flow across pervious surfaces or through grass channels and buffers. When it is necessary to install an HDS treatment system or design for a curb and gutter drainage network, using an offline configura-tion is the most effective for coarse solids removal. Online configurations are the most common designs and consist of HDS devices or catch basins installed in series conveying water from multiple inlets. A comparison of the two design strategies are shown in the figures to the left.
System Performance
Cost and Maintenance
The installation cost of HDS devices range from $18,000 to $20,000 per acre of runoff treated, plus $3,000 for the upstream flow diversion materials and installation. Maintenance consists of quarterly inspections to determine sediment accumulation within the HDS chamber. From the inspections a maintenance schedule is developed for debris removal by a vacuum truck; frequency depends on sediment loading.
Cold Climate
Suspended sediment removal is significantly affected by colder temperatures. Particle settling velocities are much slower in colder saline waters and therefore the performance of an HDS unit is greatly reduced. The median removal of sediments drops by 36% from summer to winter months. There is no difference in water conveyance from summer to winter.
Water Quality Treatment
The Offline HDS configuration performed well for removal of suspended sediments and petroleum hydrocarbons. A comparison of the same HDS device installed in both an online and offline configuration demonstrated an annual TSS removal efficiency of 21% for the online configuration and 75% for the offline configuration. During summer months the offline configuration achieved 86% removal of total suspended solids compared to a 30% removal efficiency for the online configuration. Removals are lower during the winter due to decreased particle settling velocities in colder, chloride laden runoff. The device also met regional ambient water quality criteria for removal of petroleum hydrocarbons. However, removal of heavy metals was low and nonexis-tent for nutrients.
Water Quantity Control
Typically, HDS devices are flow-through systems. Therefore, they exhibit little to no peak flow reduction, volume detention, or lag time.
27
sediments totalpetroleum
hydrocarbons
dissolvedinorganicnitrogen
totalnitrogenmetals
Median Annual Influent Event Mean Concentrations (EMC) in mg/L
totalphosphorus
TPZn TNDINTPH-DTSS
100%
80%
60%
40%
20%
0%
HDS PERFORMANCE ONLINE VS. OFFLINE
Online HDS Offline HDS
120Online HDSOffline HDS 570 ug/L 0.2 1.00.03 0.05
41 774 ug/L 0.4 NA0.05 0.09
Rem
oval
Eff
icie
ncy

Maintenance
28
Marginal Costs
Marginal costs for maintenance activities associated with total suspended solids (TSS), total phosphorus, and total nitrogen (TN) removal were converted to an annual cost per system, per watershed area treated, per mass of pollutant removed – $/acre/lb/yr. Because TN removal efficiencies were not available for every BMP tested, dissolved inorganic nitrogen (NO3, NO2, NH4) was instead used. Capital costs for BMPs are presented in terms of per acre of IC treated (2004 dollars), and maintenance expenditures are presented as an annualized percentage of capital costs, a measure routinely used for projected BMP cost estimates.
The figures included in each of the BMP sections illustrate costs associated with maintenance over the years of study per acre of IC treated. Some systems such as the retention pond and the subsurface gravel wetland displayed cycling maintenance costs over the course of the study, while others, such as the bioretention and porous pavement systems, reached equilibrium after the first few years of operation. Annualized data are summarized. In the majority of cases, costs and personnel hours for LID systems were lower in terms of per mass of pollutant removed as compared to conventional systems. While the vegetated swale is the least costly system in terms of maintenance, it is also the least effective in terms of annual pollutant load reductions. This data indicates that marginal costs and marginal pollutant load reductions for LID systems are easier and less costly to maintain but still achieve greater pollutant load reductions. Exceptions occur with respect to any LID or conventional BMP that does not incorporate unit operations and processes that effectively target nutrients.
Sand filter maintenance burdens can be regulated by reducing the watershed area to filter area ratio. However, in cases where costs per mass of pollutant trend toward unrealistic levels, alternative systems or treatment train approaches should be adopted as primary water quality management measures.
Maintenance as a Percent of Capital Cost
Maintenance costs are a substantial portion of the life-cycle costs of stormwater management practices. Estimates can vary and there may be economies of scale for larger systems. As illustrated in the table to the right, annual maintenance expenses as a percentage of capital costs ranged from 5% - 23%. Amortized maintenance costs for the retention pond equaled total capital construction costs after only 4.5 years of operation. LID systems, with the exception of the sand filter, had higher capital costs but lower annual maintenance costs as compared to the conventional retention pond and detention pond systems. As shown in Table 3, the lowest LID treatment system annualized maintenance costs expressed as a percent-age of capital costs were porous asphalt (5%) followed by bioretention (9%) and the subsurface gravel wetland (10%). At these costs, amortized annual LID system maintenance expenditures will equal total upfront capital costs after 11 years for bioretention and the subsurface gravel wetland system, and after 20 years for the porous asphalt system.
Conclusions
Many communities are struggling to define stormwater BMP maintenance needs in the absence of clear documentation. As a step towards providing this information, maintenance activities and costs for a range of stormwater management strategies were calculated. Marginal costs, maintenance frequency, level of effort required, complexity, and pollutant load reductions were all factors that were considered.
The results of this study indicate that generally, LID systems, as compared to conventional systems, have lower marginal maintenance burdens (as measured by cost and personnel hours) and higher water quality treatment capabilities as a function of pollutant removal performance. Although LID system maintenance will be different and may require additional training, it should not require unusual burdens for management.
A Comparison of Maintenance Cost, Labor Demands, and System Performance
The maintenance perceptions of Low Impact Development (LID) systems represents a significant
barrier to the acceptance of LID technologies. Despite the increasing use of LID, stormwater
managers still have minimal documentation in regards to the frequency, intensity, and costs
associated with LID operations and maintenance. Due to increasing requirements for more effective
treatment of runoff and the proliferation of total maximum daily load (TMDL) requirements, there is
greater need for more documented maintenance information for planning and implementation of
stormwater management strategies.
UNHSC researchers harvest vegetation in the forebay of the subsurface gravel wetland system. It is important that forebay treatment areas of wetland systems remain aerobic for reliable nitrogen reductions.

Summary of maintenance costs, capital costs and cost comparison per lb removed of TSS, TP and TN as DIN
RE Annual lbs Removed
Annual Ave Maintenance ($ per Acre)
Maintenance (Cost/yr/acre/lb)
Capital Cost (2012 dollars) O&M as a %CC
TSS
Vegetated Swale 58% 360 $820 $2 $14,600 6%
Retention Pond 68% 420 $3,060 $7 $16,500 19%
Detention Pond 79% 480 $2,380 $5 $16,500 17%
Sand Filter 51% 310 $2,810 $9 $15,200 19%
Gravel Wetland 96% 590 $2,140 $4 $27,400 8%
Bioretention (3) 92% 560 $1,900 $3 $25,600 8%
Porous Asphalt 99% 610 $1,080 $2 $26,600 5%
TP
Vegetated Swale 0% NT $820 NT $14,600 6%
Retention Pond 0% NT $3,060 NT $16,500 19%
Detention Pond 0% NT $2,380 NT $16,500 17%
Sand Filter 33% 0.9 $2,810 $3,240 $15,200 19%
Gravel Wetland 58% 1.5 $2,140 $1,400 $27,400 8%
Bioretention 27% 0.7 $1,900 $2,670 $25,600 8%
Porous Asphalt 60% 1.6 $1,080 $690 $26,600 5%
TN
Vegetated Swale 0% NT $820 NT $14,600 6%
Retention Pond 33% 7.8 $3,060 $390 $16,500 19%
Detention Pond 25% 5.9 $2,380 $400 $16,500 17%
Sand Filter 0% NT $2,810 NT $15,200 19%
Gravel Wetland 75% 18 $2,140 $120 $27,400 8%
Bioretention 29% 7.9 $1,890 $280 $25,600 8%
Porous Asphalt 0% NT $1,080 NT $26,600 5%
29
3,500
2,5003,000
1,5002,000
5001,000
0
BMP MAINTENANCE/ACRE/YR BY CATEGORY
VegetatedSwale
Reactive ProactivePeriodic/Predictive
RetentionPond
DryPond
SandFiller
GravelWetland
Bio-retention
(3)
PorousAsphalt
Cost
$
30
20
25
10
15
5
0
BMP MAINTENANCE PERSONNEL HOURS/ACRE TREATED/YEAR
VegetatedSwale
RetentionPond
DetentionPond
SandFilter
GravelWetland
Bio-retention
PorousAsphalt
Pers
onne
l Hou
rs
NT = No Treatment

Final rolling of a new porous asphalt roadway installation in a residential subdivision in NH.
30
Targeted Research
The University of New Hampshire Stormwater Center conducts targeted research into a range
of topics, including: how best to overcome the social and economic barriers that inhibit effective
stormwater management; how to help decision makers understand the implications of their choices
on the greater ecosystem; and how to advance the field of stormwater science so that it can
address these needs effectively. In this section, we’ll report on three such projects: the economic
benefits of LID practices, porous pavement system hydrology, and polycyclic aromatic hydrocarbon
(PAH) pollution from coal-tar-based sealants.
In 2011, UNHSC released Forging the link, a report which included case studies detailing the cost benefits of LID for commercial, residential, and municipal settings. The first two case studies show how utilizing an LID approach for site drainage engineering, specifically with porous asphalt and bioretention systems, can lead to more cost-effective site and stormwater management designs with better water quality treatment.
Residential Development (Boulder Hills)
In 2009, a residential development was constructed consisting of a 14-acre, 24-unit condominium community in Pelham, New Hampshire. The initial conventional design proposal had substantial wetland impacts, asphalt paving, and typical drainage (curbing, catch-basins, stormwater ponds, outlet structures). A second design was proposed that used widespread infiltration and filtration on the site’s extensive upland sandy soils, and included rooftop infiltration trenches, porous asphalt driveways, sidewalks, and New Hampshire’s first porous asphalt
road. The LID option had a 6 % reduction in site development expenses ($49,000 less) as compared to the conventional option. Although materials for the porous asphalt itself were more expensive, overall cost reductions were achieved due to reductions in drainage infrastructure, site clearing, and erosion control. In addition, the LID design provided more open space on the site.
Parking Lot Bioretention Retrofit
A bioretention retrofit was performed at the Univeristy of New Hampshire campus. In certain instances using existing resources, simple retrofits can be performed at minimal expense. This retrofit involved the installation of a bioretention system within the vegetated median in the parking lot and subse-quently connecting the system directly to adjacent drainage infrastructure. Facilities operations can often provide both labor and equipment for retrofitting existing infrastructure. In this instance, and many others with municipal staff, retrofit expenses were limited to design and materials costs only, while installation expenses for labor, equipment, and some infra-structure can be potentially avoided. Total project cost per acre of impervious cover was $14,000. With labor and install provided, costs were limited to materials and plantings at $5,500 per acre of impervious cover.
Conventional CSO Abatement
Conventional storage, pumping, and treatment are extremely effective, yet resource intensive for both construction and long-term operations. The Narragansett Bay Commission (NBC) in Providence, Rhode Island, under EPA direction, initiated a phased CSO Abatement Plan for mitigating CSOs and protecting the Narragansett Bay and the region’s urban rivers. Phase I of the project included a $365 million, three-mile, 30-foot diameter deep rock tunnel with an estimated 62 million gallons of capacity for reducing overflow volumes by approximately 40 percent. The associated operational and maintenance costs of Phase I are one million dollars per every one billion gallons of stormwater and sewage flow, or one dollar for every 1000 gallons (Brueckner, 2009). Phase II of the CSO abatement plan includes two near-surface interceptors for conveying flow at an estimated capital costs of $250 million.
The Economic Benefits of LID Practices

The commercial development at Greenland Meadows, NH employed porous asphalt, internal water storage, and a subsurface gravel wetland to manage stormwater that flowed into a 303D-listed stream. Not only does efflu-ent water exceed water quality targets, LID realized an almost one million dollar savings over conventional stormwater management.
31
6
2
4
+2
0
+4
+6
DESIGN STORM SCENARIOS
Water QualityEvent
Pre-Development Conventional LID
2yr
*Design storms updated from Northeast Regional Climate Center Extreme Precipitation, 2011.
25yr 100yrRuno
ff &
Rec
harg
e De
pth
(inc
hes)
Infi
ltra
tion
Dep
thRu
noff
Dep
th
Comparison of Unit Costs for Materials for Greenland Meadows Commercial Development
Item Conventional Option Low Impact Development Option Cost Difference
MOBILIZATION / DEMOLITION $555,500 $555,500 $0
SITE PREPARATION $167,000 $167,000 $0
SEDIMENT / EROSION CONTROL $378,000 $378,000 $0
EARTHWORK $2,174,500 $2,103,500 ($71,000)
PAVING $1,843,500 $2,727,500 $884,000
STORMWATER MANAGEMENT $2,751,800 $1,008,800 ($1,743,000)
ADDITIONAL WORK-RELATED ACTIVITY (utilities, lighting, water & sanitary sewer service, fencing, landscaping, etc.)
$2,720,000 $2,720,000 $0
PROJECT TOTAL $10,590,300 $9,660,300 ($930,000)
* Costs are engineering estimates and do not represent actual contractor bids
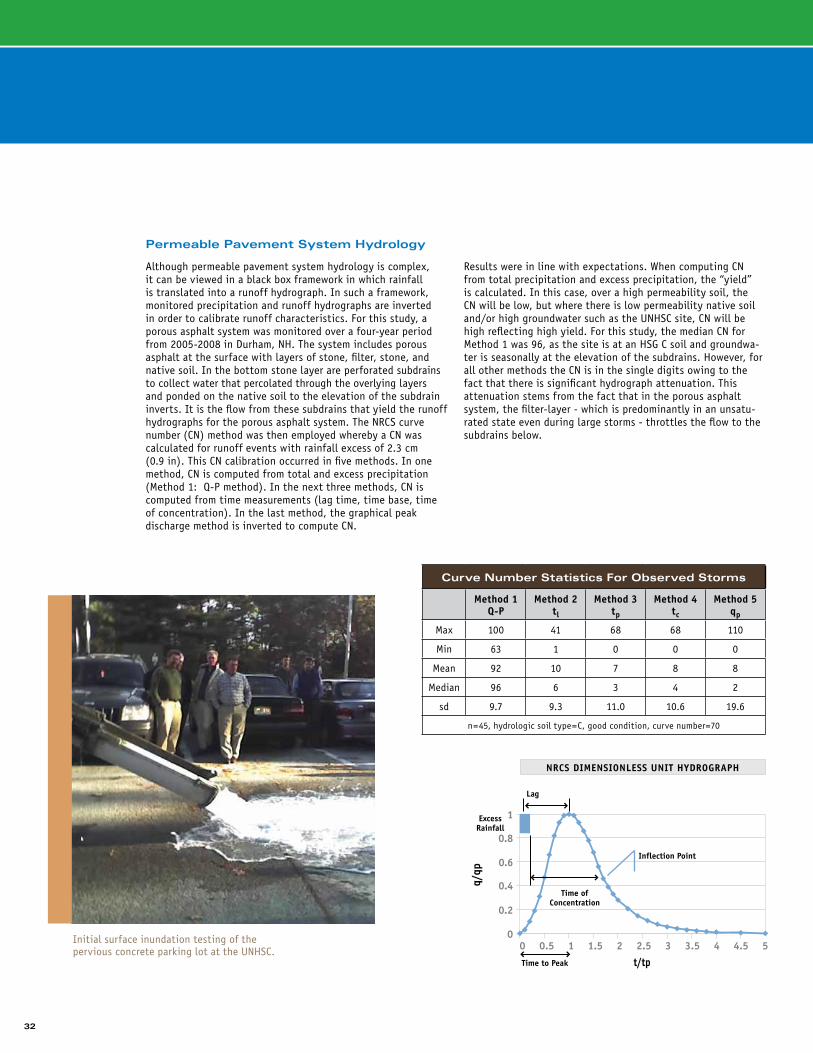
Although permeable pavement system hydrology is complex, it can be viewed in a black box framework in which rainfall is translated into a runoff hydrograph. In such a framework, monitored precipitation and runoff hydrographs are inverted in order to calibrate runoff characteristics. For this study, a porous asphalt system was monitored over a four-year period from 2005-2008 in Durham, NH. The system includes porous asphalt at the surface with layers of stone, filter, stone, and native soil. In the bottom stone layer are perforated subdrains to collect water that percolated through the overlying layers and ponded on the native soil to the elevation of the subdrain inverts. It is the flow from these subdrains that yield the runoff hydrographs for the porous asphalt system. The NRCS curve number (CN) method was then employed whereby a CN was calculated for runoff events with rainfall excess of 2.3 cm (0.9 in). This CN calibration occurred in five methods. In one method, CN is computed from total and excess precipitation (Method 1: Q-P method). In the next three methods, CN is computed from time measurements (lag time, time base, time of concentration). In the last method, the graphical peak discharge method is inverted to compute CN.
Results were in line with expectations. When computing CN from total precipitation and excess precipitation, the “yield” is calculated. In this case, over a high permeability soil, the CN will be low, but where there is low permeability native soil and/or high groundwater such as the UNHSC site, CN will be high reflecting high yield. For this study, the median CN for Method 1 was 96, as the site is at an HSG C soil and groundwa-ter is seasonally at the elevation of the subdrains. However, for all other methods the CN is in the single digits owing to the fact that there is significant hydrograph attenuation. This attenuation stems from the fact that in the porous asphalt system, the filter-layer - which is predominantly in an unsatu-rated state even during large storms - throttles the flow to the subdrains below.
Permeable Pavement System Hydrology
32
Initial surface inundation testing of the pervious concrete parking lot at the UNHSC.
1
0.8
0.6
0.4
0.2
0
q/qp
t/tp
NRCS DIMENSIONLESS UNIT HYDROGRAPH
Lag
ExcessRainfall
Time ofConcentration
Time to Peak
Inflection Point
0 0.5 1 1.5 2 2.5 3 3.5 4 4.5 5
Curve Number Statistics For Observed Storms
Method 1 Q-P
Method 2 tl
Method 3 tp
Method 4 tc
Method 5 qp
Max 100 41 68 68 110
Min 63 1 0 0 0
Mean 92 10 7 8 8
Median 96 6 3 4 2
sd 9.7 9.3 11.0 10.6 19.6
n=45, hydrologic soil type=C, good condition, curve number=70

33
Sealcoat, a thin, black coating applied over asphalt pavements that is marketed as improving appearance and enhancing pavement longevity, is made of either an asphalt emulsion or a refined coal-tar pitch emulsion. Although the two sealcoats are similar in appearance and cost, concentrations of polycyclic aromatic hydrocarbons (PAHs), a group of organic compounds known to be detrimental to human and ecosystem health, are about 1000 times higher in coal-tar-based sealcoats than those based in asphalt.
In 2007, UNHSC applied coal-tar-based sealcoat to two parking lot areas, then measured the PAH concentrations in stormwater runoff, stormwater treatment sediments, and surface soil adjacent to the parking lots.
This study found that PAH concentrations in runoff from the sealed surfaces were significantly higher than in runoff from an adjacent unsealed lot. Concentrations decreased over the two-year stormwater sampling period, but remained elevated relative to the unsealed lot. PAH concentrations in sediments collected in stormwater treatment devices receiving runoff from the sealed lots were two orders of magnitude higher than sediments from the unsealed lot, and remained high in 2011, four years after the sealant was applied. Surface soil adjacent to the sealed lots also contained high concentrations of PAHs. Benzo(a)pyrene, a carcinogenic PAH, was present at concentrations of up to 29 parts per million, which far exceeds the EPA industrial screening level for benzo(a)pyrene of 0.21 parts per million.
Coal-Tar-Based Sealcoat vs Asphalt
4% of surface sealed109-162 mg/kg
(Gravel Wetland, Bioretention, Detention Pond)
100% of surface sealed390 – 1,700 mg/kg
(Tree Filter)
Unsealed1.6 mg/kg
(Bioretention)
(Left) The UNHSC has an informational flyer about pavement sealcoat.
(Right) Measured PAH concentrations in UNHSC filter systems after the sealcoat experiment.
100150200250300350400450
500
∑16
PAH
(m
g/kg
)
Distance (m)
PAH CONCENTRATION IN SURFACE SOIL
0 20 40 60 80 100 120 140
Summer 2009Spring 2009 Fall 2009 Spring 2010
10
100
1000
10000
1
0.1
Tota
l PAH
(ug
/1)
TITLE
B Sealed LotA Sealed Lot C Unsealed Lot
09/0709/08
09/09

Administration
34
UNHSC Faculty & Staff
Thomas P. Ballestero, PE, Ph.D., PH, CGWP, PG Director 603.862.1405 [email protected]
James J. Houle, CPSWQ Program Manager and Outreach Coordinator 603.862.1445 [email protected]
Alison Watts, Ph.D. Research Professor of Civil Engineering 603.862.0585 [email protected]
Timothy A. Puls, EIT Research Project Engineer I Field Facility Manager 603.343.6672 [email protected]
Robert M. Roseen, PE, Ph.D. Former director 2004 - 2012
Graduate Students
UNHSC is indebted to the hard work of the following graduate students, past and present:
Present Students
Iulia Barbu Research Assistant & Doctoral Candidate, Civil Engineering [email protected]
Viktor Hlas Research Assistant in Civil Engineering, Masters Candidate 603.862.1172 [email protected]
Ann Scholz Research Assistant in Civil Engineering, Masters Candidate 603.862.1172 [email protected]
Robin M. Stone Research Assistant in Civil Engineering, Masters Candidate 603.862.1172 [email protected]
Former Students
Pedro M. Avellaneda Research Assistant, Doctoral Recipient, Civil Engineering
Joshua F. Briggs Research Assistant, Masters Recipient, Civil Engineering
Nicholas P. DiGennaro Research Assistant, Masters Recipient, Civil Engineering
George Fowler Research Assistant, Masters Recipient, Civil Engineering
Kristopher Houle Research Assistant, Masters Recipient, Civil Engineering
Julie Maimes Research Assistant, Masters Student, Natural Resources
Angie Miles, Research Assistant, Masters Recipient, Civil Engineering
Robert Wildey Research Assistant, Masters Recipient, Civil Engineering
Undergraduate Students
UNHSC supports the University’s commitment to undergraduate participationn research. The following UNH undergraduates have been involved in UNHSC research:
Jay Anastasiades Sarah Bajor Joel Ballestero Kyle Bastien Nate Bradley Trevor Branch Darlene Brown Heather Gilbert Ethan Giles Angela Gong Eric Hadley John Heaney Jack Jackson Eliot Jones Matt Shump Greg Sine Pat Sullivan Georgian Tutuianu Federico Uribe Kent Walker Allison Wasiewski Megan Wengrove
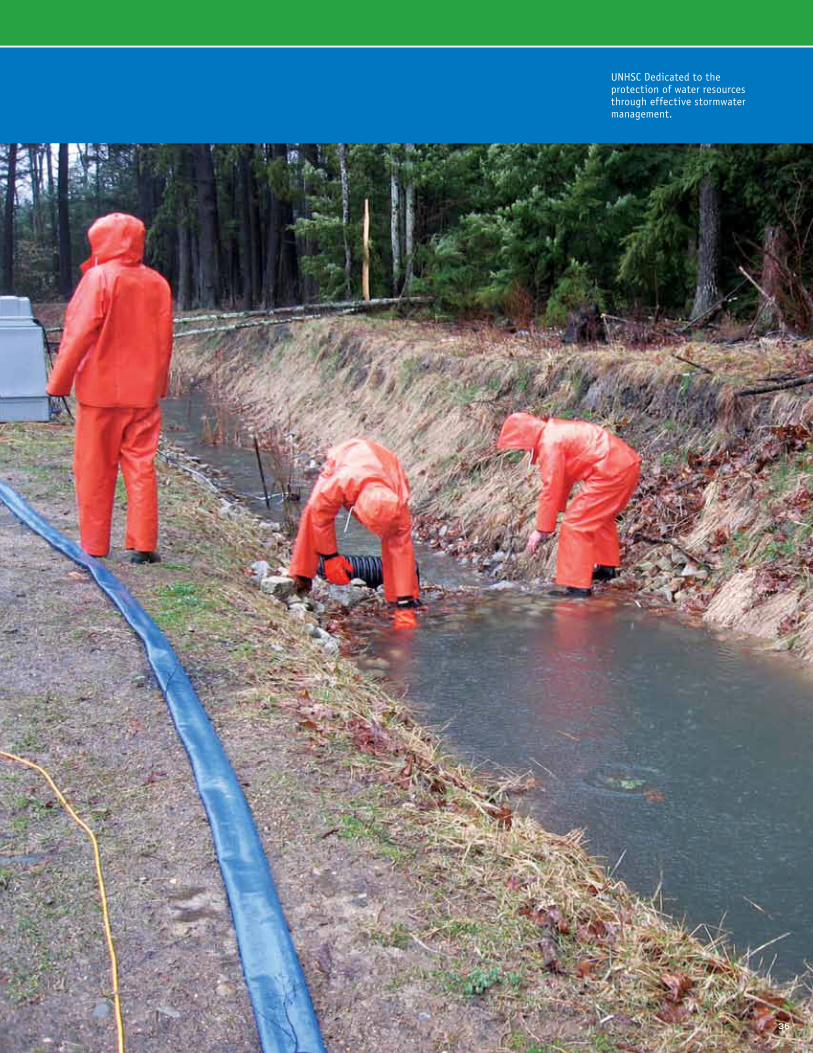
35
UNHSC Dedicated to the protection of water resources through effective stormwater management.

Gregg Hall, 35 Colovos Road University of New Hampshire Durham, NH 03824 www.unh.edu/unhsc
This publication was produced by the UNH Stormwater Center in partnership with the UNH/NOAA Cooperative Institute for Coastal and Estuarine Environmental Technology. It was printed on recycled paper.
University of New Hampshire Stormwater Center