2010 acics key operating statistics
DESCRIPTION
Annual review of performance and key measurements of ACICS-accredited schools.TRANSCRIPT

SUMMARY OF KEY OPERATING STATISTICSAccrediting Council for Independent Colleges and Schools
Data collected from the 2010 Annual Institutional Report


Welcome ...........................................................................................1
Annual Institutional Report Data Enrollment Data ............................................................................2
Retention Data ..............................................................................7
Placement Data .............................................................................9
Retention and Placement Analysis by Demographic Factors .............11
Retention and Placement Average by State ....................................12
Program Lengths and Tuition and Fees Top Programs by Number .............................................................14
Top Programs by Enrollment .........................................................15
Average Program Contact Hours by Degree Level and Program .........16
Average Tuition and Fees by Degree Level and Program ...................23
Annual Financial Report Data Income Statement .......................................................................31
Balance Sheets ...........................................................................34
Analysis of Balance Sheet ............................................................34


1
The Accrediting Council for Independent Colleges and
Schools (ACICS) provides the Summary of Key Operating
Statistics (KOS) as an annual review of the performance and key
measurements of the more than 850 private post-secondary institutions we accredit.
This edition of the KOS contains information based on the 2010 Annual Institutional
Reports (AIR) submitted by ACICS-accredited institutions. It reflects activity during a
reporting year that begins on July 1 and concludes on June 30. With each submission
of the AIR, accredited institutions provide comprehensive back-up information ACICS
uses during on-site evaluation visits to verify the accuracy of the data. This report also
includes summary information regarding financial conditions of ACICS institutions. The
information is derived from the Annual Financial Report (AFR) provided to ACICS after
each fiscal year.
ACICS looks forward to working with member institutions to strengthen educational
outcomes and to ensure that high-quality education is available to more than 800,000
students enrolled at ACICS-accredited institutions.
WELCOME

2
The following definitions are used by institutions when providing enrollment information:
Credential LevelIndicates the highest level of programs an institution offers under its grant of accreditation.
InstitutionEither a main or branch campus but not a learning site. Learning site data is aggregated with the information of the host campus.
Enrollment at the Beginning of the Reporting PeriodThe number of students enrolled on July 1.
New StartsThe number of students enrolled for the first time or who graduated from a program and enrolled for the first time in a different program between July 1 and June 30 of the subsequent year.
Re-entriesThe number of returning students who enrolled in the institution between July 1 and June 30, who had previously withdrawn from your institution.
ENROLLMENT DATA
Total Enrollment at ACICS-Accredited Institutions
0
200,000
400,000
600,000
800,000
1,000,000
20102009200820072006
560,418 556,542598,684
700,775
881,262
Reporting Year
Num
ber o
f Stu
dent
s

3
2010 ACICS-Accredited Institutions by Credential Level
0
50
100
150
200
250
300
Master'sDegree
Bachelor'sDegree
AcademicAssociate's
Degree
OccupationalAssociate's
Degree
Non-Degree
172
129
195
267
56
Credential Level
Num
ber o
f Ins
titut
ions
2010 Student Enrollment by Credential Level
Credential Level
Num
ber o
f Stu
dent
s
0
50,000
100,000
150,000
200,000
250,000
300,000
350,000
Master'sDegree
Bachelor'sDegree
AcademicAssociate's
Degree
OccupationalAssociate's
Degree
Non-Degree
143,862
99,503
196,221
313,696
127,980

4
N = Number of ACICS-Accredited Institutions
Note: Institutions are classified according to the highest credential awarded, but they also may offer lower credentials. For example, a bachelor’s degree institu-tion also may offer non-degree or associate’s degree programs. The enrollment descriptions above are for institutions as a whole and therefore may include students in lower level programs.
Enrollment Data (continued)
All Institutions
N = 819
Non-degree
N = 172
Occupational Associate’s
N = 129
Academic Associate’s
N = 195
Bachelor’s
N = 267
Master’s
N = 56
Enrollment at Beginning of Period 379,214 55,896 42,607 80,415 143,560 56,766
New Starts 470,971 84594 53,535 109,189 157,112 66,541
Reentries 31,047 3,372 3,361 6,617 13,024 4,673
Total Enrollment During Reporting Year 881,262 143,862 99,503 196,221 313,696 127,980
Number of Enrollees Without a High School Diploma or DEG Certificate While Enrolled
49,458 13,548 6,138 16,735 5,598 7,394
Number of Enrollees Who Obtained a GED Certificate While Enrolled
4,342 416 616 1,235 416 1,659
Number of Enrollees in One or More Courses through Distance Learning
148,191 1,049 5,949 11,359 49,729 80,105
Completed a Full Program 3,261 1,454 792 507 171 337
Graduated from a Program 167,906 45,856 21,876 42,563 42,830 14,781
Withdrew due to Military Service 1,081 31 67 104 740 139
Withdrew 251,414 32,217 26,142 55,910 92,245 44,900
Still Enrolled at the End of the Period 447,639 62,363 50,022 96,370 172,564 66,320
Students Who Withdrew to Accept Employment in Their Field of Training
800 263 173 63 273 28
5
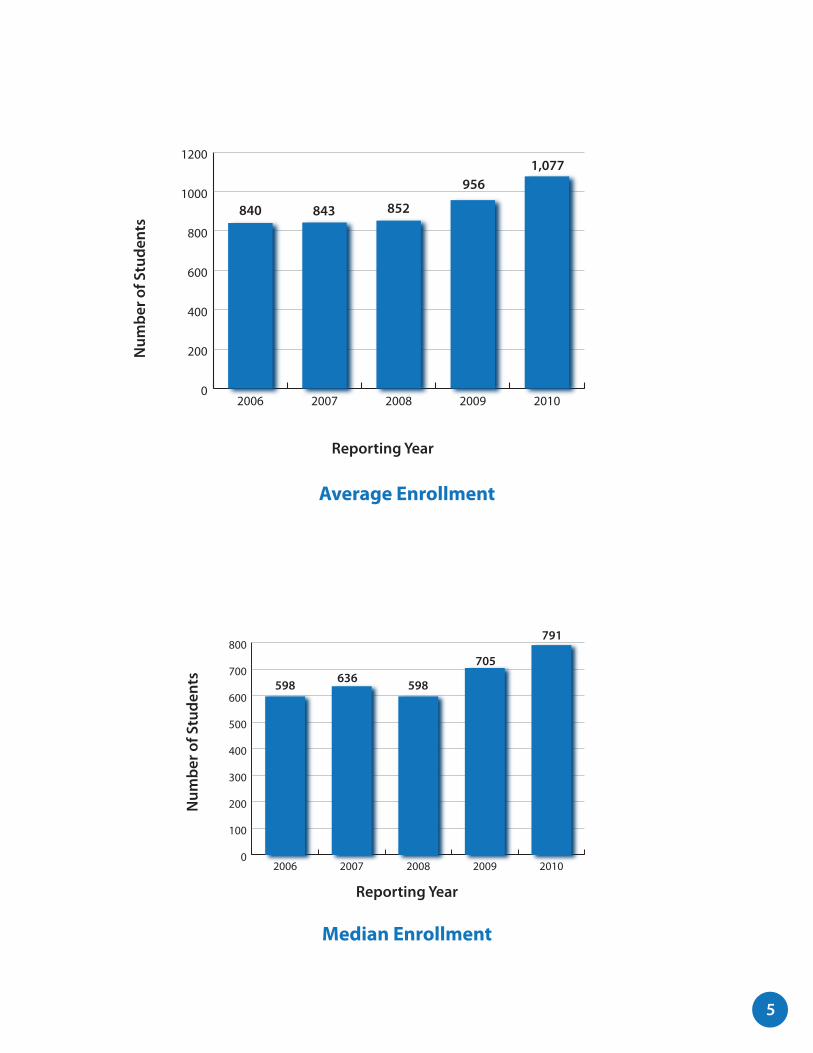
Average Enrollment
Reporting Year
Num
ber o
f Stu
dent
s
0
200
400
600
800
1000
1200
20102009200820072006
956
840 843 852
1,077
Median Enrollment
Reporting Year
Num
ber o
f Stu
dent
s
0
100
200
300
400
500
600
700
800
20102009200820072006
705
598 636 598
791

6Faculty Members
Repo
rtin
g Ye
ar
Number of Faculty Members
0 5,000 10,000 15,000 20,000 25,000 30,000 35,000
Part-Time
Full-Time
2010
2009
2008
2007
2006 7,522 15,879
7,151 16,786
7,654 18,568
8,483 20,941
9,356 21,866
0 5,000 10,000 15,000 20,000 25,000 30,000 35,000
Part-Time
Full-Time
2010
2009
2008
2007
2006 7,522 15,879
7,151 16,786
7,654 18,568
8,483 20,941
9,356 21,866
States with the Greatest Number of ACICS-Accredited Institutions
Florida 91California 75Ohio 52Pennsylvania 47Texas 43New York 35Indiana 32Puerto Rico 30Kentucky 26Virginia 25
Enrollment Data (continued)

7
Institutions report retention outcomes based on the total enrollment and withdrawals during the reporting period. The following definitions apply in determining the appropriate retention classification.
Retention Data
WithdrawalA student who is no longer enrolled at the institution and
(1) has failed to attend the full length of the program;
(2) has not maintained satisfactory academic progress;
(3) has failed courses or substitute courses permitted by the institution;
(4) has not attained speeds or competencies required;
(5) is not eligible for a credential; or
(6) failed to meet the institution’s attendance and/or graduation requirements.
Retention RatesRetention rates are calculated for each institution according to standard formulas adopted by the Council.
Retention Percentage Rate = (A – B) / A A = Beginning Enrollment and Reentries plus New Starts
B = Withdrawals
RETENTION AND PLACEMENT

8
2010 Retention Rates by Credential Level
Credential Level
Rete
ntio
n Ra
te (%
)
65
70
75
80
85
Master'sDegree
Bachelor'sDegree
AcademicAssociate's
Degree
OccupationalAssociate's
Degree
Non-Degree
77
74 74
71 71
Retention Data (continued)
Average Retention Rates by Reporting Year
Reporting Year (%)
Rete
ntio
n Ra
te (%
)
0
10
20
30
40
50
60
70
80Standard Deviation
Retention Rate
20102009200820072006
71
12 12
71 71
14
75
8
73
9
0
10
20
30
40
50
60
70
80Standard Deviation
Retention Rate
20102009200820072006
71
12 12
71 71
14
75
8
73
9

9
Institutions report placement outcomes for graduates and completers as of the submission date of the AIR. The follow-ing definitions apply in determining the appropriate placement classification.
Placement Data
CompleterA student who is no longer enrolled at the institution and who either has completed the time allowed or has at-tempted the maximum allowable num-ber of credits for the program of study, but who did not accomplish one of the following graduation requirements: (1) achieved a grade point average of at least 2.0; (2) attained required compe-tencies or speed skills; or (3) satisfied non-academic requirements.
GraduateA student who has (1) achieved a grade point average of 2.0 or greater at graduation; (2) successfully passed all courses in the program or substitute courses permitted by the institution;
(3) attained required competencies or speed levels in all courses; (4) met all clinical, internship, and externship requirements; (5) satisfied all non-aca-demic requirements such as payment of tuition and fees, return of books, etc.; (6) satisfied all other academic re-quirements for graduation; (7) received the appropriate credential; and (8) ceased enrollment at the institution.
In-FieldA graduate is employed in a position that requires direct use of the skills taught in the program.
Related FieldA graduate is employed in a position that requires indirect use of the skills
taught in the program.
Out-of-FieldA graduate is employed in a position that does not require use of the skills taught in the program.
Not AvailableA graduate is documented as un-available for placement because of pregnancy or other health-related situations; continuing education; active military service; ineligibility for place-ment in the United States due to visa status; or completion of a stand-alone English as a Second Language (ESL)program for which placement typically is not offered.
Placement rates are calculated for each institution according to standard formulas adopted by the Council.
Placement Percentage Rate = (PF + PR) / (G – U) PF = Placed in Field G = Graduates and Completers PR = Placed in Related Field U = Unavailable for Placement
Note: Data does not include institutions that did not have students eligible for placement.
All Institutions
N = 819
Non-degree
N = 172
Occupational Associate’s
N = 129
Academic Associate’s
N = 195
Bachelor’s Degree
N = 267
Master’s degree
N = 56
Total Number of Completers and Graduates Eligible for Placement
171,167 47,310 22,668 43,070 43,001 15,118
Placed in Field of Study 82,524 24,189 12,047 21,488 18,776 6,024
Placed in a Related Field of Study 17,443 4,822 2,099 3,464 5,599 1,459
Placed Out of Field of Study 3,627 570 573 678 1,521 285
Not Available Due to Pregnancy or Other Health Situation
5,055 1,601 738 1,416 947 353
Not Available Due to Continuing Education 16,331 3,015 1,866 3,269 6,692 1,489
Not Available Due toActive Military Service 651 104 66 115 239 73
International Student Possessing an I-20 Visa 3,158 875 90 88 187 1,918
ESL Completers or Graduates 1,374 411 533 214 0 216
Not Employed 41,004 11,723 4,656 12,338 8,986 3,301

10
Placement Data (Continued)
2010 Average Placement Rates by Credential Level
Credential Level
Plac
emen
t Rat
e (%
)
0
25
50
75
100
Master'sDegree
Bachelor'sDegree
AcademicAssociate's
Degree
OccupationalAssociate's
Degree
Non-Degree
71 7669
72 76
Note: Data does not include institutions that did not have students eligible for placement.
2010 Average Placement Rates by Reporting Year
Reporting Year
Plac
emen
t Rat
e (%
)
0
20
40
60
80
100Standard Deviation
Placement Rate
20102009200820072006
72
21
74
21
71
23
74
10
71
11
0
20
40
60
80
100Standard Deviation
Placement Rate
20102009200820072006
72
21
74
21
71
23
74
10
71
11

11
Note: For purposes of calculating retention, students who withdraw due to military service or to enroll in another institution under the same owner are not included.
Retention and Placement Analysis by Demographic Factors
Total 2010 Retention 2010 Placement
All institutions 819 73 71
Urban Population Greater than 500K 343 74 71
Urban Population Between 150K and 500K 207 73 72
Urban Population Less than 150K 93 73 73
Suburban 132 76 73
Rural 44 73 73
Nondegree 172 77 71
Occupational Associate’s Degree 129 74 76
Academic Associate’s Degree 195 74 69
Bachelor’s Degree 267 72 72
Master’s Degree 56 75 76

12
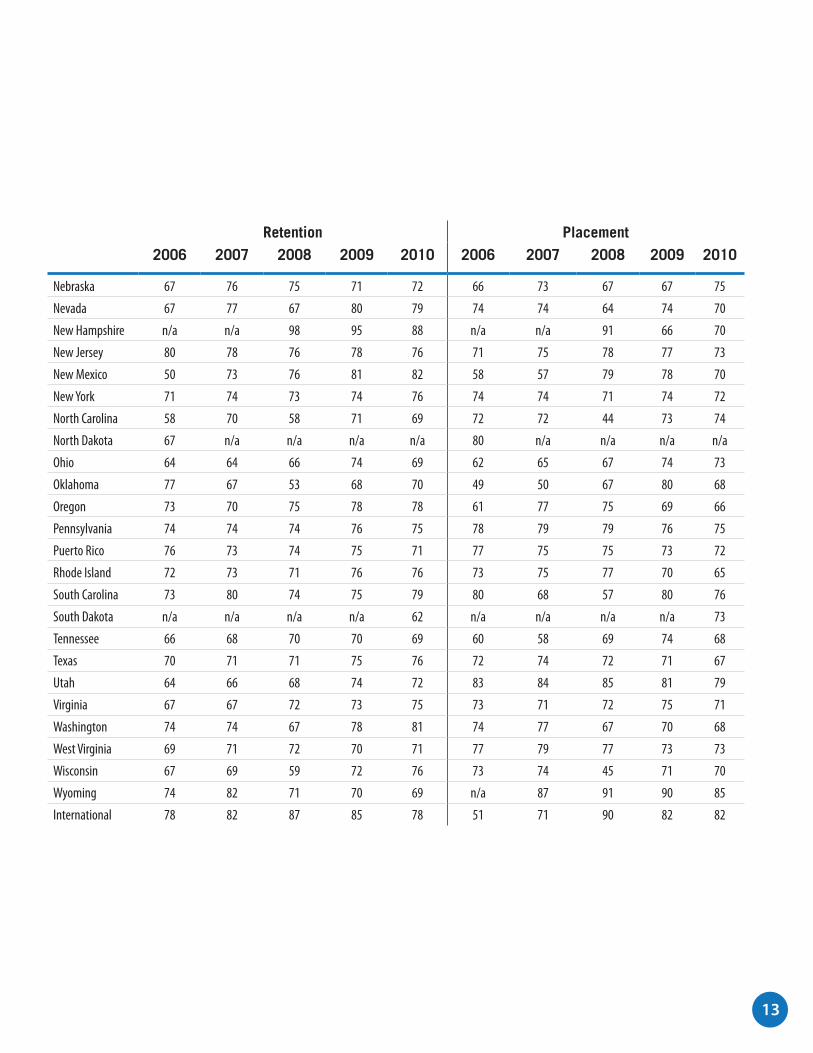
Retention and Placement Average by State
Retention Placement
2006 2007 2008 2009 2010 2006 2007 2008 2009 2010
Alabama 73 60 64 68 66 71 72 45 71 68
Alaska 72 68 81 76 72 72 66 82 82 88
Arizona 74 73 76 75 75 76 79 72 71 70
Arkansas 64 70 65 61 62 56 34 83 67 72
California 74 76 76 79 79 77 74 68 76 73
Colorado 62 67 69 72 74 62 81 69 74 69
Connecticut 73 74 73 76 78 70 69 79 76 72
Florida 71 73 72 74 72 77 77 71 74 68
Georgia 67 68 66 69 69 72 81 72 72 74
Hawaii 77 77 75 n/a n/a 69 75 70 n/a n/a
Idaho 62 72 53 79 81 84 93 54 69 73
Illinois 72 71 71 72 74 74 76 75 73 73
Indiana 68 65 69 71 72 75 77 69 75 76
Iowa n/a n/a 80 70 78 n/a n/a n/a n/a 100
Kansas 70 55 57 67 68 71 59 47 76 80
Kentucky 69 67 69 74 68 70 69 78 74 69
Louisiana 64 73 70 74 68 77 71 67 75 76
Maine 64 67 67 71 72 63 71 66 69 69
Maryland 70 71 74 74 77 62 81 59 68 65
Massachusetts 73 75 73 75 75 75 78 76 69 73
Michigan 72 70 70 74 74 69 70 71 73 71
Minnesota 70 71 67 74 73 82 84 76 75 80
Mississippi 59 64 76 78 69 33 76 73 83 72
Missouri 73 68 75 79 76 69 77 76 74 73
13
Retention Placement2006 2007 2008 2009 2010 2006 2007 2008 2009 2010
Nebraska 67 76 75 71 72 66 73 67 67 75
Nevada 67 77 67 80 79 74 74 64 74 70
New Hampshire n/a n/a 98 95 88 n/a n/a 91 66 70
New Jersey 80 78 76 78 76 71 75 78 77 73
New Mexico 50 73 76 81 82 58 57 79 78 70
New York 71 74 73 74 76 74 74 71 74 72
North Carolina 58 70 58 71 69 72 72 44 73 74
North Dakota 67 n/a n/a n/a n/a 80 n/a n/a n/a n/a
Ohio 64 64 66 74 69 62 65 67 74 73
Oklahoma 77 67 53 68 70 49 50 67 80 68
Oregon 73 70 75 78 78 61 77 75 69 66
Pennsylvania 74 74 74 76 75 78 79 79 76 75
Puerto Rico 76 73 74 75 71 77 75 75 73 72
Rhode Island 72 73 71 76 76 73 75 77 70 65
South Carolina 73 80 74 75 79 80 68 57 80 76
South Dakota n/a n/a n/a n/a 62 n/a n/a n/a n/a 73
Tennessee 66 68 70 70 69 60 58 69 74 68
Texas 70 71 71 75 76 72 74 72 71 67
Utah 64 66 68 74 72 83 84 85 81 79
Virginia 67 67 72 73 75 73 71 72 75 71
Washington 74 74 67 78 81 74 77 67 70 68
West Virginia 69 71 72 70 71 77 79 77 73 73
Wisconsin 67 69 59 72 76 73 74 45 71 70
Wyoming 74 82 71 70 69 n/a 87 91 90 85
International 78 82 87 85 78 51 71 90 82 82

14
ACICS is required to monitor the average program lengths and tuition and fees of similar programs of study of its accredited institutions in order to maintain compliance with the U.S. Department of Education accrediting agency recognition provisions. In keeping with this requirement, Section 2-1-807 of the Accreditation Criteria, Program Length and Tuition and Fees, states that the Council will collect and provide data relative to program length and tuition and fees to all ACICS-accredited institutions.
The charts on the following pages identify the average program length and tuition and fees charged by credential for selected programs. The data were derived from the statistical information reported on the 2010 Annual Institutional Reports (AIR) by all ACICS-accredited institutions. The program codes given correspond with those used to report program data on the AIR. To maintain confidentiality, ACICS does not publish information for programs that are offered by fewer than ten institutions (regardless of credential level).
PROGRAM CONTACT HOURS/TUITION & FEES
Top Programs by NumberNumber of Institutions Offering Programs
Business Administration and Management 1,012Medical/Clinical Assistant 661Criminal Justice/ Law Enforcement 572Accounting 521Legal Assistant/ Paralegal 409Computer Systems Networking/Telecommunications 304Massage Therapy 298Medical Office Assistant 294Administrative Assistant 285Medical Adminstrative Assistant 267

15
PROGRAM CONTACT HOURS/TUITION & FEES
Top Programs by EnrollmentNumber of Students Enrolled in Programs
Medical/Clinical Assistant 147,884Criminal Justice/Law Enforcement 75, 815Business Administration and Management 59,497Computer Systems Networking/Telecommunications 42,575Medical Insurance Specialist/ Medical Biller 34,715Computer and Electronics Engineering Technology 29,402Medical Office Assistant 24,678Cooking and Related Culinary Arts 23, 448Pharmacy Assistant 23,004Computer Drafting and Design 21,851

16
Program Program Code Number of Programs
DAY EVENING
Average Contact Hours
DAY EVENING
Standard Deviation
DAY EVENING
Accounting 52.0301 30 30 565 565 150 150
Administrative Assistant 52.0401 30 25 782 745 235 252
Business Administration and Management 52.0201 28 25 553 587 168 136
Business Office Technology 52.0407 27 25 710 722 266 269
Computer Systems Networking/ Telecommunications 11.0901 20 20 561 569 220 207
Cooking and Related Culinary Arts 12.0500 23 23 817 817 228 228
Cosmetology 12.0401 23 23 906 906 499 499
Criminal Justice/Law Enforcement 43.0103 12 10 622 642 186 199
Dental Assistant 51.0601 12 12 707 707 219 219
Diagnostic Medical Sonography 51.0910 12 11 1,870 1,862 179 186
English as a Second Language 13.1401 20 15 673 685 309 231
Health Services/Allied Health/ Health Sciences 51.0000 11 10 941 969 345 350
Legal Administrative Assistant 22.0301 14 12 725 646 233 163
Legal Assistant/Paralegal 22.0302 32 32 504 504 124 124
Massage Therapy 51.3501 26 24 798 799 125 130
Medical Administrative Assistant 51.0716 29 27 766 733 193 183
Medical Insurance Coding Specialist/Coder 51.0713 28 25 692 705 197 205
Medical Insurance Specialist/Medical Biller 51.0714 39 45 768 762 227 212
Medical Office Assistant 51.0710 41 39 800 778 220 208
Medical/Clinical Assistant 51.0801 81 79 807 809 173 155
Nursing/Patient Care Assistant 51.1614 13 11 606 637 429 455
Pharmacy Assistant 51.0805 37 34 697 718 216 213
Phlebotomy 51.1009 17 16 372 392 189 176
Web Page and Digital/Multimedia Design 11.0801 9 10 694 704 233 222
CERTIFICATE
AVERAGE PROGRAM CONTACT HOURS BY DEGREE LEVEL & PROGRAM

17
Program Program Code Number of Programs
DAY EVENING
Average Contact Hours
DAY EVENING
Standard Deviation
DAY EVENINGAccounting 52.0301 174 152 753 729 255 254
Administrative Assistant 52.0401 130 103 829 804 290 287
Aesthetician/Esthetician and Skin Care Specialist 12.0409 30 29 790 794 253 256
Automotive Mechanics Technology 47.0604 16 16 1,224 1,224 138 138
Baking and Pastry Arts 12.0501 23 17 963 978 200 219
Banking and Financial Support Services 52.0803 20 20 1,072 1,072 36 36
Barbering/Barber 12.0402 22 22 1,135 1,135 167 167
Business Administration and Management 52.0201 121 121 650 650 252 252
Business Office Technology 52.0407 43 33 719 646 274 224
Cardiovascular Technology 51.0901 16 16 1,307 1,307 538 538
Computer and Information Systems Security 11.1003 13 14 1,042 1,002 221 243
Computer Installation and Repair Technology 47.0104 39 37 734 675 279 210
Computer Software and Media Applications 11.0899 23 18 802 767 191 188
Computer Systems Networking/ Telecommunications 11.0901 38 37 909 890 203 183
Computer Systems Technology 15.1202 40 40 998 992 209 214
Cooking and Related Culinary Arts 12.0500 35 24 947 961 241 226
Cosmetology 12.0401 81 70 1,142 1,145 347 333
Court Reporting 22.0303 18 17 2,553 2,496 1,109 1,126
Criminal Justice/Law Enforcement 43.0103 36 35 926 928 403 409
Data Entry/Microcomputer Applications 11.0601 44 40 670 643 411 411
Data Processing Technology 11.0301 24 22 658 643 157 154
Dental Assistant 51.0601 72 67 878 884 175 178
Diagnostic Medical Sonography 51.0910 12 10 1,840 1,828 251 296
Drafting and Design Technology 15.1301 13 13 948 948 242 242
Electrical/Electronics Maintenance and Repair Technician
47.0199 45 45 932 932 226 226
Emergency Medical Technology 51.0904 15 15 1,082 1,082 346 346
Health and Physical Education/Fitness 31.0599 16 16 788 788 150 150
Heating, A/C and Refrigeration Technology 15.0501 37 38 919 913 279 272
Human Resources Management 52.1001 12 12 937 937 270 270
Information Technology 11.0103 27 26 629 626 230 232
Legal Administrative Assistant 22.0301 65 51 857 827 197 203
DIPLOMA

18
Program Program Code Number of Programs
DAY EVENING
Average Contact Hours
DAY EVENING
Standard Deviation
DAY EVENING
Legal Assistant/Paralegal 22.0302 43 42 830 814 332 319
Licensed Practical/Vocational Nurse 51.1613 45 35 1,274 1,249 266 256
Massage Therapy 51.3501 176 174 825 826 134 134
Medical Administrative Assistant 51.0716 107 105 808 791 184 184
Medical Insurance Coding Specialist/Coder 51.0713 124 123 766 768 175 174
Medical Insurance Specialist/Medical Biller 51.0714 126 124 765 754 142 161
Medical Office Assistant 51.0710 189 172 795 765 273 252
Medical Transcription 51.0708 30 29 866 865 342 346
Medical/Clinical Assistant 51.0801 300 292 879 876 190 190
Nail Technician/Specialist and Manicurist 12.0410 14 14 719 712 150 154
Nursing 51.1601 11 8 1,148 1,000 425 404
Nursing/Patient Care Assistant 51.1614 57 54 820 793 375 365
Pharmacy Assistant 51.0805 119 115 770 768 129 128
Phlebotomy 51.1009 21 21 646 646 317 317
Plumbing Technology 46.0503 11 11 775 775 124 124
Radiologic Technology 51.0911 12 11 1,078 944 488 160
Respiratory Therapy Assistant 51.0812 12 11 1,337 1,306 277 267
Security/Loss Prevention Services 43.0109 12 11 829 839 258 268
Surgical Technology 51.0909 38 34 1,206 1,204 155 156
Tourism and Travel Services Management 52.0903 21 12 1,015 1,022 166 159
Web Page and Digital/Multimedia Design 11.0801 14 14 818 818 169 169
Word Processing 11.0602 9 7 861 807 215 256
DIPLOMA (CONTINUED)
AVERAGE PROGRAM CONTACT HOURS BY DEGREE LEVEL & PROGRAM

19
Program Program Code Number of Programs
DAY EVENING
Average Contact Hours
DAY EVENING
Standard Deviation
DAY EVENING
Accounting 52.0301 69 55 1,413 1,347 791 871
Administrative Assistant 52.0401 61 45 1,441 1,337 269 181
Banking and Financial Support Services 52.0803 14 14 1,178 1,178 64 64
Business Administration and Management 52.0201 126 104 1,305 1,236 323 270
Computer Software and Media Applications 11.0899 10 6 1,390 1,266 197 147
Computer Systems Networking/ Telecommunications 11.0901 26 25 1,382 1,317 214 202
Computer Systems Technology 15.1202 21 19 1,812 1,282 2,314 179
Cooking and Related Culinary Arts 12.0500 11 11 1,576 1,576 221 221
Cosmetology 12.0401 15 12 1,717 1,652 420 429
Court Reporting 22.0303 29 27 2,765 2,797 1,270 1,308
Criminal Justice/Law Enforcement 43.0103 43 41 1,241 1,204 263 234
Dental Assistant 51.0601 11 10 1,363 1,376 347 363
Health Information Technology 51.0707 25 21 1,383 1,323 288 222
Human Resources Management 52.1001 14 14 1,186 1,186 113 113
Information Technology 11.0103 14 11 1,314 1,234 280 183
Legal Administrative Assistant 22.0301 26 14 1,519 1,236 298 405
Legal Assistant/Paralegal 22.0302 35 32 1,281 1,245 235 218
Marketing/Marketing Management 52.1401 27 26 1,222 1,205 195 177
Massage Therapy 51.3501 40 38 1,306 1,301 194 195
Medical Administrative Assistant 51.0716 52 40 1,438 1,359 331 317
Medical Insurance Coding Specialist/Coder 51.0713 26 23 1,288 1,268 242 248
Medical Insurance Specialist/Medical Biller 51.0714 20 20 1,243 1,243 100 100
Medical Office Assistant 51.0710 21 12 1,282 1,146 450 434
Medical/Clinical Assistant 51.0801 86 77 1,383 1,346 294 277
Pharmacy Assistant 51.0805 13 13 1,123 1,123 192 192
Surgical Technology 51.0909 18 16 1,459 1,459 150 155
OCCUPATIONAL ASSOCIATE’S DEGREE

20
ACADEMIC ASSOCIATE’S DEGREE
Program Program Code Number of Programs
DAY EVENING
Average Contact Hours
DAY EVENING
Standard Deviation
DAY EVENING
Accounting 52.0301 176 171 1,140 1,130 136 128
Administrative Assistant 52.0401 61 53 1,239 1,223 165 164
Advertising 09.0903 10 10 1,320 1,320 105 105
Baking and Pastry Arts 12.0501 16 11 1,520 1,447 254 275
Business Administration and Management 52.0201 291 288 1,100 1,095 215 219
Business Office Technology 52.0407 24 25 1,167 1,157 152 156
Cardiovascular Technology 51.0901 18 18 1,544 1,544 399 399
Cinematography and Film/Video Production 50.0602 11 7 1,262 1,128 275 164
Computer and Electronics Engineering Technology 15.0303 127 127 1,163 1,163 127 127
Computer and Information Systems Security 11.1003 11 11 1,234 1,234 119 119
Computer Drafting and Design 15.1302 137 137 1,180 1,180 102 102
Computer Engineering Technology 15.1201 13 13 1,344 1,344 113 113
Computer Programming 11.0201 109 103 1,183 1,156 139 91
Computer Science 11.0701 18 18 1,150 1,094 111 269
Computer Software and Media Applications 11.0899 70 70 1,154 1,154 102 102
Computer Systems Networking/ Telecommunications 11.0901 201 199 1,164 1,155 131 114
Computer Systems Technology 15.1202 29 29 1,175 1,175 57 57
Cooking and Related Culinary Arts 12.0500 36 24 1,482 1,500 385 318
Criminal Justice/Law Enforcement 43.0103 273 274 1,042 1,039 152 149
Dental Assistant 51.0601 21 19 1,383 1,350 232 216
Design and Visual Communications 50.0401 102 102 1,139 1,139 61 61
Diagnostic Medical Sonography 51.0910 10 9 1,765 1,856 439 352
Drafting and Design Technology 15.1301 24 24 1,269 1,269 206 206
Early Childhood Education 13.1210 15 16 1,236 1,215 96 125
Electrical/Electronics Maintenance and Repair Technician 47.0199 11 11 1,055 1,055 295 295
Fashion Merchandising 52.1902 25 20 1,192 1,107 271 180
Fashion/Apparel Design 50.0407 19 14 1,263 1,176 205 118
General Studies 24.0102 10 4 951 914 109 334
Graphic Design 50.0409 78 60 1,295 1,246 312 277
Health and Physical Education/Fitness 31.0599 11 11 1,347 1,347 43 43
Health Care Administration/Management 51.0701 40 39 1,173 1,168 141 134
AVERAGE PROGRAM CONTACT HOURS BY DEGREE LEVEL & PROGRAM
21
Program Program Code Number of Programs
DAY EVENING
Average Contact Hours
DAY EVENING
Standard Deviation
DAY EVENING
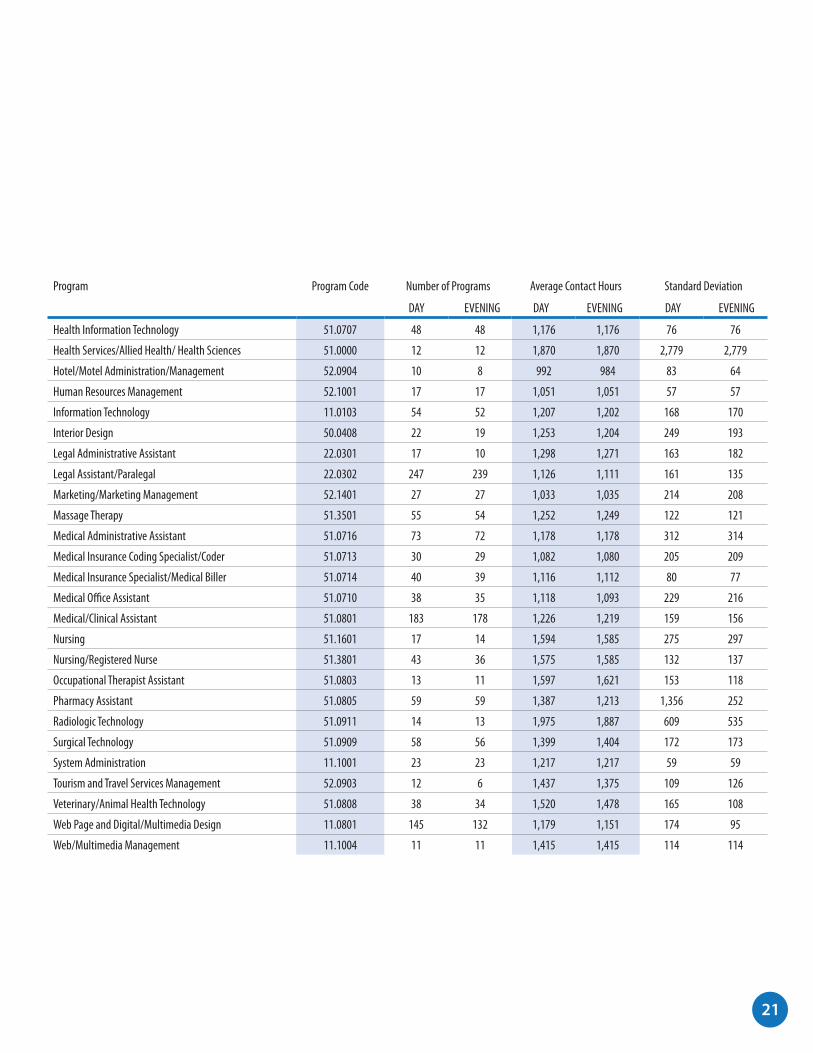
Health Information Technology 51.0707 48 48 1,176 1,176 76 76
Health Services/Allied Health/ Health Sciences 51.0000 12 12 1,870 1,870 2,779 2,779
Hotel/Motel Administration/Management 52.0904 10 8 992 984 83 64
Human Resources Management 52.1001 17 17 1,051 1,051 57 57
Information Technology 11.0103 54 52 1,207 1,202 168 170
Interior Design 50.0408 22 19 1,253 1,204 249 193
Legal Administrative Assistant 22.0301 17 10 1,298 1,271 163 182
Legal Assistant/Paralegal 22.0302 247 239 1,126 1,111 161 135
Marketing/Marketing Management 52.1401 27 27 1,033 1,035 214 208
Massage Therapy 51.3501 55 54 1,252 1,249 122 121
Medical Administrative Assistant 51.0716 73 72 1,178 1,178 312 314
Medical Insurance Coding Specialist/Coder 51.0713 30 29 1,082 1,080 205 209
Medical Insurance Specialist/Medical Biller 51.0714 40 39 1,116 1,112 80 77
Medical Office Assistant 51.0710 38 35 1,118 1,093 229 216
Medical/Clinical Assistant 51.0801 183 178 1,226 1,219 159 156
Nursing 51.1601 17 14 1,594 1,585 275 297
Nursing/Registered Nurse 51.3801 43 36 1,575 1,585 132 137
Occupational Therapist Assistant 51.0803 13 11 1,597 1,621 153 118
Pharmacy Assistant 51.0805 59 59 1,387 1,213 1,356 252
Radiologic Technology 51.0911 14 13 1,975 1,887 609 535
Surgical Technology 51.0909 58 56 1,399 1,404 172 173
System Administration 11.1001 23 23 1,217 1,217 59 59
Tourism and Travel Services Management 52.0903 12 6 1,437 1,375 109 126
Veterinary/Animal Health Technology 51.0808 38 34 1,520 1,478 165 108
Web Page and Digital/Multimedia Design 11.0801 145 132 1,179 1,151 174 95
Web/Multimedia Management 11.1004 11 11 1,415 1,415 114 114

22
Program Program Code Number of Programs
DAY EVENING
Average Contact Hours
DAY EVENING
Standard Deviation
DAY EVENING
Accounting 52.0301 62 62 2,033 2,030 140 143
Advertising 09.0903 15 10 2,336 2,251 236 203
Animation/Interactive Technology/Video Graphics 10.0304 116 99 2,260 2,238 297 204
Business Administration and Management 52.0201 351 339 1,970 1,977 237 230
Cinematography and Film/Video Production 50.0602 18 10 2,375 2,467 715 633
Computer and Electronics Engineering Technology 15.0303 109 109 2,137 2,137 112 112
Computer and Information Systems Security 11.1003 127 127 2,136 2,133 131 130
Computer Graphics 11.0803 17 10 2,441 2,486 572 202
Computer Programming 11.0201 80 81 2,157 2,143 150 140
Computer Science 11.0701 16 15 2,008 2,033 408 250
Computer Software and Media Applications 11.0899 20 19 2,178 2,167 153 149
Construction Management 52.2001 113 111 2,129 2,123 130 114
Cooking and Related Culinary Arts 12.0500 20 11 2,635 2,798 786 641
Criminal Justice/Law Enforcement 43.0103 200 200 1,932 1,933 164 164
Design and Visual Communications 50.0401 14 11 2,513 2,476 276 301
E-Commerce 52.0208 21 21 2,036 2,036 149 149
Fashion Merchandising 52.1902 29 20 2,182 2,184 483 298
Fashion/Apparel Design 50.0407 20 14 2,337 2,220 384 388
General Studies 24.0102 23 5 1,827 1,647 29 418
Graphic Design 50.0409 40 32 2,354 2,351 472 325
Health Care Administration/Management 51.0701 91 92 2,007 2,008 180 182
Information Technology 11.0103 52 52 2,194 2,194 155 154
Interior Design 50.0408 43 34 2,449 2,429 505 247
Legal Assistant/Paralegal 22.0302 50 51 2,114 2,117 191 190
Nursing/Registered Nurse 51.3801 12 11 2,142 2,055 987 985
Photography 50.0605 16 11 2,541 2,539 378 447
System Administration 11.1001 12 12 2,100 2,100 0 0
Teacher Education 13.1206 12 11 2,368 2,255 408 133
Web Page and Digital/Multimedia Design 11.0801 33 18 2,469 2,459 442 214
BACHELOR’S DEGREE
MASTER’S DEGREEProgram Program Code Number of Programs
DAY EVENINGAverage Contact Hours
DAY EVENINGStandard Deviation
DAY EVENING
Business Administration and Management 52.0201 65 51 618 608 101 123
AVERAGE PROGRAM CONTACT HOURS BY DEGREE LEVEL & PROGRAM

23
AVERAGE TUITION & FEES BY DEGREE LEVEL & PROGRAM
Program Program Code Number of Programs
DAY EVENING
Average Tuition & Fees (in $)
DAY EVENING
Standard Deviation (in $)
DAY EVENING
Accounting 52.0301 30 30 12,595 12,595 3,887 3,887
Administrative Assistant 52.0401 30 25 12,203 11,746 3,278 3,690
Business Administration and Management 52.0201 28 25 13,514 14,217 3,023 2,322
Business Office Technology 52.0407 27 25 14,302 15,095 4,871 4,106
Computer Systems Networking/ Telecommunications 11.0901 20 20 14,142 14,249 5,336 5,120
Cooking and Related Culinary Arts 12.0500 23 23 18,714 17,950 4,314 5,427
Cosmetology 12.0401 23 23 11,851 11,864 6,443 6,472
Criminal Justice/Law Enforcement 43.0103 12 10 12,623 12,148 3,030 3,117
Dental Assistant 51.0601 12 12 14,124 14,124 3,645 3,645
Diagnostic Medical Sonography 51.0910 12 11 32,957 32,476 7,494 7,663
English as a Second Language 13.1401 20 15 5,266 5,422 3,168 3,053
Health Services/Allied Health/ Health Sciences 51.0000 11 10 14,637 14,691 4,356 4,587
Legal Administrative Assistant 22.0301 14 12 14,597 14,039 2,628 2,958
Legal Assistant/Paralegal 22.0302 32 32 15,606 15,606 2,443 2,443
Massage Therapy 51.3501 26 24 14,196 14,537 4,231 4,228
Medical Administrative Assistant 51.0716 29 27 14,423 14,479 3,736 3,925
Medical Insurance Coding Specialist/Coder 51.0713 28 25 12,759 14,290 5,917 4,075
Medical Insurance Specialist/Medical Biller 51.0714 39 45 14,630 14,377 3,135 2,988
Medical Office Assistant 51.0710 41 39 16,524 16,514 5,004 5,413
Medical/Clinical Assistant 51.0801 81 79 13,965 14,618 4,175 2,994
Nursing/Patient Care Assistant 51.1614 13 11 10,574 11,386 7,741 8,032
Pharmacy Assistant 51.0805 37 34 11,821 12,864 4,916 3,541
Phlebotomy 51.1009 17 16 7,215 7,616 4,511 4,392
Web Page and Digital/Multimedia Design 11.0801 9 10 17,870 18,560 7,014 6,964
CERTIFICATE

24
DIPLOMA
Program Program Code Number of Programs
DAY EVENING
Average Tuition & Fees (in $)
DAY EVENING
Standard Deviation (in $)
DAY EVENING
Accounting 52.0301 174 152 14,877 15,206 5,569 5,958
Administrative Assistant 52.0401 130 103 14,140 14,577 4,692 4,999
Aesthetician/Esthetician and Skin Care Specialist 12.0409 30 29 10,281 10,197 2,050 2,034
Automotive Mechanics Technology 47.0604 16 16 16,096 16,096 7,115 7,115
Baking and Pastry Arts 12.0501 23 17 18,989 14,950 9,759 7,553
Banking and Financial Support Services 52.0803 20 20 9,295 9,295 671 671
Barbering/Barber 12.0402 22 22 9,991 9,625 3,324 3,916
Business Administration and Management 52.0201 121 121 15,945 15,945 7,565 7,565
Business Office Technology 52.0407 43 33 12,891 12,675 4,274 4,290
Cardiovascular Technology 51.0901 16 16 26,641 26,641 8,674 8,674
Computer and Information Systems Security 11.1003 13 14 21,948 21,252 3,107 3,743
Computer Installation and Repair Technology 47.0104 39 37 12,066 12,268 4,664 4,880
Computer Software and Media Applications 11.0899 23 18 12,843 12,089 2,928 2,694
Computer Systems Networking/ Telecommunications 11.0901 38 37 16,978 17,270 6,048 5,946
Computer Systems Technology 15.1202 40 40 12,444 12,419 4,764 4,742
Cooking and Related Culinary Arts 12.0500 35 24 21,538 18,511 9,574 8,465
Cosmetology 12.0401 81 70 12,674 12,610 5,835 5,907
Court Reporting 22.0303 18 17 31,512 34,937 16,117 19,597
Criminal Justice/Law Enforcement 43.0103 36 35 23,266 23,641 12,807 12,792
Data Entry/Microcomputer Applications 11.0601 44 40 9,138 8,986 3,339 3,373
Data Processing Technology 11.0301 24 22 11,731 11,729 1,900 1,986
Dental Assistant 51.0601 72 67 15,362 15,294 4,056 4,196
Diagnostic Medical Sonography 51.0910 12 10 32,311 33,044 6,487 6,992
Drafting and Design Technology 15.1301 13 13 12,890 12,890 5,798 5,798
Electrical/Electronics Maintenance and Repair Technician 47.0199 45 45 12,197 12,204 3,823 3,823
Emergency Medical Technology 51.0904 15 15 10,023 10,023 4,745 4,745
Health and Physical Education/Fitness 31.0599 16 16 16,246 16,246 5,770 5,770
Heating, A/C and Refrigeration Technology 15.0501 37 38 13,080 13,287 4,697 4,886
AVERAGE TUITION & FEES BY DEGREE LEVEL & PROGRAM

25
Program Program Code Number of Programs
DAY EVENING
Average Tuition & Fees (in $)
DAY EVENING
Standard Deviation (in $)
DAY EVENING
Human Resources Management 52.1001 12 12 23,320 23,320 1,075 1,075
Information Technology 11.0103 27 26 10,131 10,323 2,317 2,134
Legal Administrative Assistant 22.0301 65 51 19,862 20,802 8,953 7,962
Legal Assistant/Paralegal 22.0302 43 42 15,526 15,595 8,255 8,342
Licensed Practical/Vocational Nurse 51.1613 45 35 22,417 21,656 6,515 7,479
Massage Therapy 51.3501 176 174 16,358 16,416 4,232 4,227
Medical Administrative Assistant 51.0716 107 105 17,537 17,687 5,446 5,446
Medical Insurance Coding Specialist/Coder 51.0713 124 123 16,280 16,401 4,775 4,655
Medical Insurance Specialist/Medical Biller 51.0714 126 124 15,111 15,018 3,977 4,297
Medical Office Assistant 51.0710 189 172 15,306 15,327 5,171 5,179
Medical Transcription 51.0708 30 29 12,277 12,158 3,212 3,415
Medical/Clinical Assistant 51.0801 300 292 17,894 17,589 7,429 5,168
Nail Technician/Specialist and Manicurist 12.0410 14 14 7,239 7,390 2,823 2,791
Nursing 51.1601 11 8 24,020 25,308 11,298 12,799
Nursing/Patient Care Assistant 51.1614 57 54 12,706 12,345 6,619 6,414
Pharmacy Assistant 51.0805 119 115 16,646 15,619 11,440 3,731
Phlebotomy 51.1009 21 21 12,039 12,039 5,148 5,148
Plumbing Technology 46.0503 11 11 7,103 7,102 1,861 1,861
Radiologic Technology 51.0911 12 11 21,061 19,796 7,164 5,622
Respiratory Therapy Assistant 51.0812 12 11 13,198 11,438 8,722 6,543
Security/Loss Prevention Services 43.0109 12 11 13,549 14,127 7,262 7,322
Surgical Technology 51.0909 38 34 19,029 18,980 9,073 9,412
Tourism and Travel Services Management 52.0903 21 12 12,157 10,100 3,786 2,356
Web Page and Digital/Multimedia Design 11.0801 14 14 23,010 23,010 5,903 5,903
Word Processing 11.0602 9 7 9,967 9,393 1,943 1,123
26
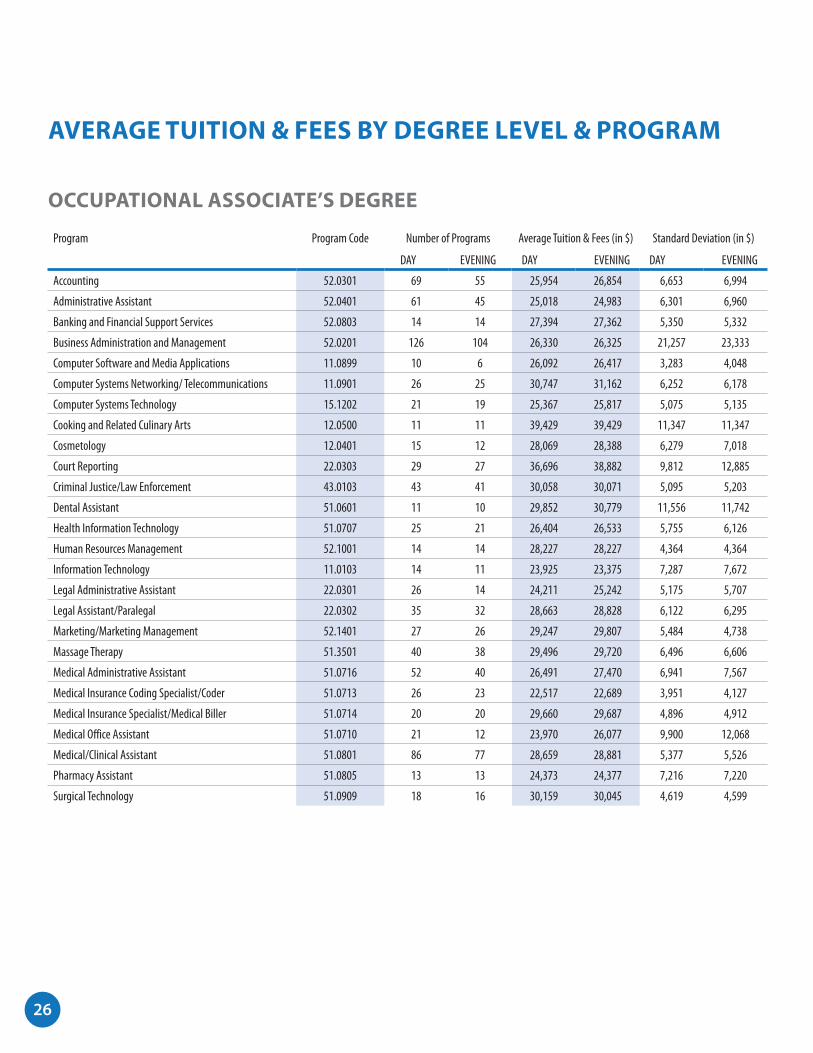
AVERAGE TUITION & FEES BY DEGREE LEVEL & PROGRAM
OCCUPATIONAL ASSOCIATE’S DEGREE
Program Program Code Number of Programs
DAY EVENING
Average Tuition & Fees (in $)
DAY EVENING
Standard Deviation (in $)
DAY EVENING
Accounting 52.0301 69 55 25,954 26,854 6,653 6,994
Administrative Assistant 52.0401 61 45 25,018 24,983 6,301 6,960
Banking and Financial Support Services 52.0803 14 14 27,394 27,362 5,350 5,332
Business Administration and Management 52.0201 126 104 26,330 26,325 21,257 23,333
Computer Software and Media Applications 11.0899 10 6 26,092 26,417 3,283 4,048
Computer Systems Networking/ Telecommunications 11.0901 26 25 30,747 31,162 6,252 6,178
Computer Systems Technology 15.1202 21 19 25,367 25,817 5,075 5,135
Cooking and Related Culinary Arts 12.0500 11 11 39,429 39,429 11,347 11,347
Cosmetology 12.0401 15 12 28,069 28,388 6,279 7,018
Court Reporting 22.0303 29 27 36,696 38,882 9,812 12,885
Criminal Justice/Law Enforcement 43.0103 43 41 30,058 30,071 5,095 5,203
Dental Assistant 51.0601 11 10 29,852 30,779 11,556 11,742
Health Information Technology 51.0707 25 21 26,404 26,533 5,755 6,126
Human Resources Management 52.1001 14 14 28,227 28,227 4,364 4,364
Information Technology 11.0103 14 11 23,925 23,375 7,287 7,672
Legal Administrative Assistant 22.0301 26 14 24,211 25,242 5,175 5,707
Legal Assistant/Paralegal 22.0302 35 32 28,663 28,828 6,122 6,295
Marketing/Marketing Management 52.1401 27 26 29,247 29,807 5,484 4,738
Massage Therapy 51.3501 40 38 29,496 29,720 6,496 6,606
Medical Administrative Assistant 51.0716 52 40 26,491 27,470 6,941 7,567
Medical Insurance Coding Specialist/Coder 51.0713 26 23 22,517 22,689 3,951 4,127
Medical Insurance Specialist/Medical Biller 51.0714 20 20 29,660 29,687 4,896 4,912
Medical Office Assistant 51.0710 21 12 23,970 26,077 9,900 12,068
Medical/Clinical Assistant 51.0801 86 77 28,659 28,881 5,377 5,526
Pharmacy Assistant 51.0805 13 13 24,373 24,377 7,216 7,220
Surgical Technology 51.0909 18 16 30,159 30,045 4,619 4,599

27
ACADEMIC ASSOCIATE’S DEGREE
Program Program Code Number of Programs
DAY EVENING
Average Tuition & Fees (in $)
DAY EVENING
Standard Deviation (in $)
DAY EVENING
Accounting 52.0301 176 171 31,625 31,781 8,832 9,041
Administrative Assistant 52.0401 61 53 25,051 25,327 6,035 6,386
Advertising 09.0903 10 10 41,353 41,353 1,655 1,655
Baking and Pastry Arts 12.0501 16 11 49,047 44,475 10,255 9,034
Business Administration and Management 52.0201 291 288 31,969 31,844 8,428 8,685
Business Office Technology 52.0407 24 25 28,307 28,053 4,580 4,661
Cardiovascular Technology 51.0901 18 18 32,032 32,032 6,740 6,740
Cinematography and Film/Video Production 50.0602 11 7 44,254 37,381 10,469 4,981
Computer and Electronics Engineering Technology 15.0303 127 127 47,719 47,730 776 891
Computer and Information Systems Security 11.1003 11 11 29,516 29,644 7,556 7,707
Computer Drafting and Design 15.1302 137 137 46,660 46,667 3,652 3,628
Computer Engineering Technology 15.1201 13 13 42,058 42,194 6,312 6,198
Computer Programming 11.0201 109 103 44,081 45,102 7,770 6,639
Computer Science 11.0701 18 18 36,030 34,993 6,837 7,776
Computer Software and Media Applications 11.0899 70 70 43,300 43,300 8,123 8,123
Computer Systems Networking/ Telecommunications 11.0901 201 199 42,300 42,514 7,831 7,622
Computer Systems Technology 15.1202 29 29 25,081 25,081 3,232 3,232
Cooking and Related Culinary Arts 12.0500 36 24 47,685 44,584 11,882 12,653
Criminal Justice/Law Enforcement 43.0103 273 274 37,497 37,494 9,754 9,701
Dental Assistant 51.0601 21 19 25,617 25,343 9,967 10,439
Design and Visual Communications 50.0401 102 102 47,574 47,574 5,382 5,382
Diagnostic Medical Sonography 51.0910 10 9 31,135 32,129 13,663 14,103
Drafting and Design Technology 15.1301 24 24 36,981 37,086 5,692 5,707
Early Childhood Education 13.1210 15 16 27,540 26,455 7,002 8,037
Electrical/Electronics Maintenance and Repair Technician 47.0199 11 11 27,327 27,395 7,495 7,575
Fashion Merchandising 52.1902 25 20 36,401 33,950 8,569 6,976
Fashion/Apparel Design 50.0407 19 14 42,898 38,932 9,174 6,033
General Studies 24.0102 10 4 25,121 10,995 9,880 1,962
Graphic Design 50.0409 78 60 39,105 37,361 10,647 8,828
Health and Physical Education/Fitness 31.0599 11 11 41,726 41,726 6,762 6,762
Health Care Administration/Management 51.0701 40 39 26,903 27,208 4,803 4,456
Health Information Technology 51.0707 48 48 34,570 34,570 10,503 10,503
Health Services/Allied Health/ Health Sciences 51.0000 12 12 32,521 32,424 8,732 8,735
28
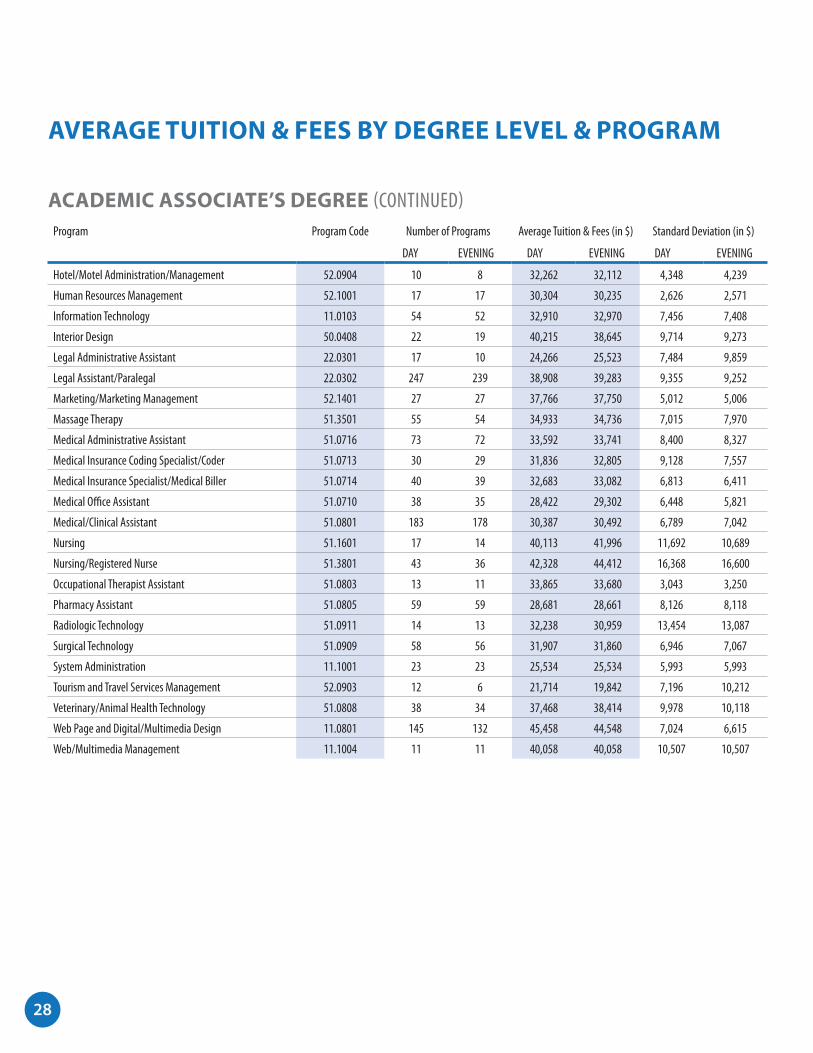
AVERAGE TUITION & FEES BY DEGREE LEVEL & PROGRAM
Program Program Code Number of Programs
DAY EVENING
Average Tuition & Fees (in $)
DAY EVENING
Standard Deviation (in $)
DAY EVENING
Hotel/Motel Administration/Management 52.0904 10 8 32,262 32,112 4,348 4,239
Human Resources Management 52.1001 17 17 30,304 30,235 2,626 2,571
Information Technology 11.0103 54 52 32,910 32,970 7,456 7,408
Interior Design 50.0408 22 19 40,215 38,645 9,714 9,273
Legal Administrative Assistant 22.0301 17 10 24,266 25,523 7,484 9,859
Legal Assistant/Paralegal 22.0302 247 239 38,908 39,283 9,355 9,252
Marketing/Marketing Management 52.1401 27 27 37,766 37,750 5,012 5,006
Massage Therapy 51.3501 55 54 34,933 34,736 7,015 7,970
Medical Administrative Assistant 51.0716 73 72 33,592 33,741 8,400 8,327
Medical Insurance Coding Specialist/Coder 51.0713 30 29 31,836 32,805 9,128 7,557
Medical Insurance Specialist/Medical Biller 51.0714 40 39 32,683 33,082 6,813 6,411
Medical Office Assistant 51.0710 38 35 28,422 29,302 6,448 5,821
Medical/Clinical Assistant 51.0801 183 178 30,387 30,492 6,789 7,042
Nursing 51.1601 17 14 40,113 41,996 11,692 10,689
Nursing/Registered Nurse 51.3801 43 36 42,328 44,412 16,368 16,600
Occupational Therapist Assistant 51.0803 13 11 33,865 33,680 3,043 3,250
Pharmacy Assistant 51.0805 59 59 28,681 28,661 8,126 8,118
Radiologic Technology 51.0911 14 13 32,238 30,959 13,454 13,087
Surgical Technology 51.0909 58 56 31,907 31,860 6,946 7,067
System Administration 11.1001 23 23 25,534 25,534 5,993 5,993
Tourism and Travel Services Management 52.0903 12 6 21,714 19,842 7,196 10,212
Veterinary/Animal Health Technology 51.0808 38 34 37,468 38,414 9,978 10,118
Web Page and Digital/Multimedia Design 11.0801 145 132 45,458 44,548 7,024 6,615
Web/Multimedia Management 11.1004 11 11 40,058 40,058 10,507 10,507
ACADEMIC ASSOCIATE’S DEGREE (CONTINUED)

29
Program Program Code Number of Programs
DAY EVENING
Average Tuition & Fees (in $)
DAY EVENING
Standard Deviation (in $)
DAY EVENING
Accounting 52.0301 62 62 65,189 64,767 16,299 16,617
Advertising 09.0903 15 10 79,964 74,170 12,533 10,515
Animation/Interactive Technology/Video Graphics 10.0304 116 99 84,405 82,547 9,346 11,782
Business Administration and Management 52.0201 351 339 69,969 70,227 18,286 18,750
Cinematography and Film/Video Production 50.0602 18 10 84,193 83,800 20,967 9,938
Computer and Electronics Engineering Technology 15.0303 109 109 89,100 89,100 628 628
Computer and Information Systems Security 11.1003 127 127 86,623 86,487 7,891 8,249
Computer Graphics 11.0803 17 10 77,393 62,818 28,657 31,715
Computer Programming 11.0201 80 81 86,390 85,308 11,540 12,761
Computer Science 11.0701 16 15 67,084 67,455 19,654 17,529
Computer Software and Media Applications 11.0899 20 19 85,618 86,207 6,104 5,655
Construction Management 52.2001 113 111 86,611 86,776 7,179 6,958
Cooking and Related Culinary Arts 12.0500 20 11 88,731 83,652 18,132 22,957
Criminal Justice/Law Enforcement 43.0103 200 200 75,476 75,382 16,345 16,434
Design and Visual Communications 50.0401 14 11 79,527 77,403 8,683 6,571
E-Commerce 52.0208 21 21 85,506 85,506 7,649 7,649
Fashion Merchandising 52.1902 29 20 79,575 75,756 12,820 12,205
Fashion/Apparel Design 50.0407 20 14 79,711 73,199 17,050 15,821
General Studies 24.0102 23 5 59,090 26,118 12,260 15,309
Graphic Design 50.0409 40 32 99,789 77,118 131,496 16,713
Health Care Administration/Management 51.0701 91 92 62,223 61,903 11,834 11,914
Information Technology 11.0103 52 52 67,518 67,518 17,884 17,884
Interior Design 50.0408 43 34 76,763 75,651 19,439 17,527
Legal Assistant/Paralegal 22.0302 50 51 66,929 66,609 14,761 14,791
Nursing/Registered Nurse 51.3801 12 11 55,452 59,135 44,285 44,476
Photography 50.0605 16 11 86,835 86,135 5,847 6,633
System Administration 11.1001 12 12 89,122 89,122 285 285
Teacher Education 13.1206 12 11 21,181 21,749 2,836 2,142
Web Page and Digital/Multimedia Design 11.0801 33 18 108,628 78,194 141,094 17,929
BACHELOR’S DEGREE
MASTER’S DEGREEProgram Program Code Number of Programs
DAY EVENINGAverage Contact Hours DAY EVENING
Standard Deviation DAY EVENING
Business Administration and Management 52.0201 65 51 26,414 23,649 8,721 8,703

30
The summary data were supplied by ACICS-accredited institutions through the Annual Financial Report (AFR). The AFR, which is an unaudited statement, is submitted each year 180 days after the conclusion of the institution’s fiscal year. This document includes statements collected for the fiscal year-end dates from July 31, 2009 through June 30, 2010.
The ratios are derived from total institutional revenues and expenses aggregated to illustrate operating figures and averages of all member institutions, both for-profit and not-for-profit institutions. They do not purport to be industry-wide statistics. The chart of accounts used is prescribed by ACICS. Nearly all of the reported results are veri-fied by audited financial statements. All results are reported using the accrual method of accounting.
Multiple institutions can be owned or controlled by one corporation. This results in fewer balance sheets to sum-marize than income statements.
ANNUAL FINANCIAL REPORT DATA

31
INCOME STATEMENTTOTAL EDUCATIONAL REVENUE < $999,999
Average (in $)
All Credential Levels
N = 90
Non-Degree
N = 32
Academic Associate’s Degree
N = 23
Bachelor’s DegreeN = 17
Master’s Degree N = 4
Gross Tuition 506,341 390,087 625,647 255,114 689,749
Gross Contract Revenue 2,206 123,738 8,027 0 0
(Less Tuition Refunds) 42,235 20,319 43,998 40,835 27,866
(Less Textbook Expense) 17,536 8,957 18,782 2,825 11,029
TOTAL EDUCATIONAL REVENUES 448,776 484,549 570,894 211,454 650,854
Instructional Salaries 124,905 147,731 160,768 72,293 161,579
Instructional Expenses 35,291 28,014 58,549 25,290 62,273
Student Recruitment 155,443 85,400 134,686 362,940 144,656
Depreciation of Equipment 22,757 12,033 28,647 40,661 19,375
Occupancy Expense 131,362 91,468 118,131 243,318 144,305
Administrative Salaries 78,979 70,645 111,495 80,010 109,582
Officer Salaries 24,804 29,839 39,186 16,956 26,709
Administrative Expense 115,324 100,349 187,123 101,382 92,439
Student Personnel Services 13,432 10,729 21,342 15,643 40,545
TOTAL EDUCATIONAL EXPENSES 702,298 576,209 859,926 958,495 801,463
Educational Income -253,522 -91,660 -289,032 -747,040 -150,610
Net Dormitory Income 0 0 0 0 0
Net Bookstore Operations 9,038 4,529 16,850 17,673 15,453
Net Interest Income Expense 389 -10,973 1,621 178 -140
Other Income Expense 8,299 26,885 24,674 6,057 50,315
Net Extraordinary & Unusual Income & Expense -782 -6,271 5,665 0 0
TOTAL OTHER INCOME AND EXPENSE 16,944 14,169 48,811 23,908 65,628
NET INCOME BEFORE INCOME TAXES -236,577 -77,491 -240,221 -723,132 -84,982
(Federal and State Income Taxes) -41,299 -13,489 -47,267 -107,915 -47,216
NET INCOME AFTER TAXES -195,279 -64,003 -192,954 -615,217 -37,766
N = total number of income statements

32
INCOME STATEMENTTotal Educational Revenue $1,000,000 - $ 9,999,999 Average (in $)
All Creden-tial Levels N = 479
Non-Degree N = 111
Occupational Associate’s Degree
N = 119
Academic Associate’s Degree
N = 128
Bachelor’s Degree N = 113
Gross Tuition 4,962,647 4,196,824 4,698,139 5,111,579 6,124,247
Gross Contract Revenue 14,669 12,027 9,734 1,012 246
(Less Tuition Refunds) 239,792 155,152 112,115 205,792 440,761
(Less Textbook Expense) 112,540 122,315 125,662 123,701 80,119
TOTAL EDUCATIONAL REVENUES 4,624,984 3,931,385 4,470,096 4,783,098 5,603,613
Instructional Salaries 855,644 795,021 828,490 876,153 944,751
Instructional Expenses 224,881 227,287 261,783 172,291 259,096
Student Recruitment 792,566 547,462 586,150 820,022 1,258,468
Depreciation of Equipment 108,055 75,951 99,752 111,566 146,094
Occupancy Expense 533,992 477,135 460,983 553,466 643,545
Administrative Salaries 463,617 430,531 464,467 449,879 480,719
Officer Salaries 85,915 63,519 74,024 80,498 103,273
Administrative Expense 815,832 756,949 742,944 953,385 806,647
Student Personnel Services 129,259 76,314 86,920 181,477 154,804
TOTAL EDUCATIONAL EXPENSES 4,009,761 3,450,169 3,605,513 4,198,738 4,797,396
Educational Income 615,223 481,216 864,583 584,360 806,217
Net Dormitory Income 2,809 0 822 6,300 1,306
Net Bookstore Operations 56,110 6,083 34,588 76,950 97,737
Net Interest Income Expense -11,859 -28,852 -12,167 -6,332 -13,475
Other Income Expense 3,160 -36,998 4,739 15,793 26,810
Net Extraordinary & Unusual Income & Expense -15,150 -171 -8,899 -4,670 -7,921
TOTAL OTHER INCOME AND EXPENSE 35,070 -59,939 19,082 88,042 104,457
NET INCOME BEFORE INCOME TAXES 650,293 421,277 883,665 672,402 910,673
(Federal and State Income Taxes) 9,034 35,185 37,925 -11,482 -2,992
NET INCOME AFTER TAXES 641,260 386,092 845,740 683,884 913,665
N = total number of income statements
33
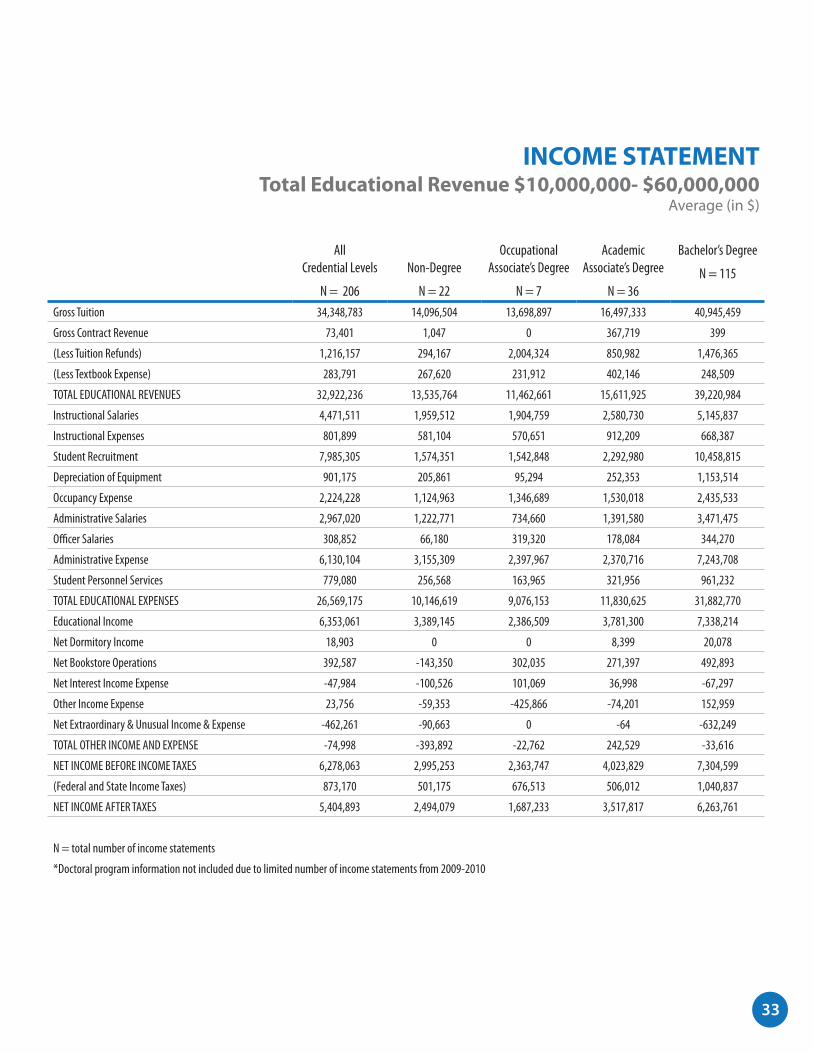
INCOME STATEMENTTotal Educational Revenue $10,000,000- $60,000,000
Average (in $)
All Credential Levels
N = 206
Non-Degree
N = 22
Occupational Associate’s Degree
N = 7
Academic Associate’s Degree
N = 36
Bachelor’s Degree
N = 115
Gross Tuition 34,348,783 14,096,504 13,698,897 16,497,333 40,945,459
Gross Contract Revenue 73,401 1,047 0 367,719 399
(Less Tuition Refunds) 1,216,157 294,167 2,004,324 850,982 1,476,365
(Less Textbook Expense) 283,791 267,620 231,912 402,146 248,509
TOTAL EDUCATIONAL REVENUES 32,922,236 13,535,764 11,462,661 15,611,925 39,220,984
Instructional Salaries 4,471,511 1,959,512 1,904,759 2,580,730 5,145,837
Instructional Expenses 801,899 581,104 570,651 912,209 668,387
Student Recruitment 7,985,305 1,574,351 1,542,848 2,292,980 10,458,815
Depreciation of Equipment 901,175 205,861 95,294 252,353 1,153,514
Occupancy Expense 2,224,228 1,124,963 1,346,689 1,530,018 2,435,533
Administrative Salaries 2,967,020 1,222,771 734,660 1,391,580 3,471,475
Officer Salaries 308,852 66,180 319,320 178,084 344,270
Administrative Expense 6,130,104 3,155,309 2,397,967 2,370,716 7,243,708
Student Personnel Services 779,080 256,568 163,965 321,956 961,232
TOTAL EDUCATIONAL EXPENSES 26,569,175 10,146,619 9,076,153 11,830,625 31,882,770
Educational Income 6,353,061 3,389,145 2,386,509 3,781,300 7,338,214
Net Dormitory Income 18,903 0 0 8,399 20,078
Net Bookstore Operations 392,587 -143,350 302,035 271,397 492,893
Net Interest Income Expense -47,984 -100,526 101,069 36,998 -67,297
Other Income Expense 23,756 -59,353 -425,866 -74,201 152,959
Net Extraordinary & Unusual Income & Expense -462,261 -90,663 0 -64 -632,249
TOTAL OTHER INCOME AND EXPENSE -74,998 -393,892 -22,762 242,529 -33,616
NET INCOME BEFORE INCOME TAXES 6,278,063 2,995,253 2,363,747 4,023,829 7,304,599
(Federal and State Income Taxes) 873,170 501,175 676,513 506,012 1,040,837
NET INCOME AFTER TAXES 5,404,893 2,494,079 1,687,233 3,517,817 6,263,761
N = total number of income statements
*Doctoral program information not included due to limited number of income statements from 2009-2010

34
BALANCE SHEETS - ASSETS
All Entities N = 11
Non- degree Granting Entities N = 6
Degree-Granting Entities N = 5
Cash on Hand - Unrestricted -1% -3% 0%
Cash - Restricted 0% 0% 0%
A/R Students - Net -11% -10% -12%
A/R - Related Parties 0% 0% 0%
A/R Other -0% -0% -1%
N/R Related Parties 0% 0% 0%
N/R Other 0% 0% 0%
Inventory Books and Supplies -2% -3% -0%
Temporary Investments 0% 0% 0%
Current Prepaid Expense -4% -2% -6%
Other Current Assets -4% -1% -8%
TOTAL CURRENT ASSETS -23% -19% -27%
Buildings 0% 0% 0%
(Accumulated Depreciation) 0% 0% 0%
Furniture and Equipment -36% -31% -42%
(Accumulated Depreciation) 20% 15% 26%
Leasehold Improvements -106% -146% -56%
(Amortization) 28% 34% 21%
Library -1% -0% -1%
(Accumulated Depreciation) 0% 0% 0%
Land 0% 0% 0%
Other Fixed Assets -2% -3% -1%
(Accumulated Depreciation) 0% 0% 0%
TOTAL FIXED ASSETS -97% -132% -53%
Deposits -0% -1% 0%
Other Prepaid Expenses -0% 0% -0%
Goodwill 0% 0% 0%
Revolving Book Account 0% 0% 0%
SFA Matching Funds 0% 0% 0%
Other Assets 220% 252% 181%
TOTAL OTHER ASSETS 220% 251% 181%
TOTAL ASSETS 100% 100% 100%
N= total number of balance sheets Note: Subtotals may vary due to rounding to the nearest tenth.
NEGATIVE TOTAL ASSETS

35
BALANCE SHEET - LIABILITIES AND EQUITYNEGATIVE TOTAL ASSETS
All Entities N = 11
Nondegree-Granting Entities N = 6
Degree-Granting Entities N = 5
Accounts Payable Trade -9% -5% -17%
Notes Payable Equipment 0% 0% 0%
Notes Payable Other 0% 0% 0%
Tuition Refunds Payable -0% -0% -1%
Current Portion of Long Term Debt 0% 0% 0%
Payroll Taxes Payable 0% 0% 0%
Accrued Salaries and Wages -0% -0% -0%
Unearned Tuition -35% -32% -41%
Unearned Dormitory Fees 0% 0% 0%
Other Current Liabilities -17% -9% -35%
TOTAL CURRENT LIABILITIES -61% -46% -94%
Notes or Bonds Payable 0% 0% 0%
Mortgage Payable 0% 0% 0%
Other Long-Term Liabilities -42% -36% -54%
TOTAL LONG-TERM LIABILITIES -42% -36% -54%
TOTAL LIABILITIES -103% -83% -148%
Preffered Stock 0% 0% 0%
Common Stock 0% 0% 0%
Other Equity 0% 0% 0%
Retained Earnings
Beginning Balance 178% 167% 203%
Earnings and Loss for Year 25% 16% 45%
(Dividends) 0% 0% 0%
Other R/E Changes 0% 0% 0%
Ending Balance 203% 183% 248%
TOTAL STOCKHOLDERS EQUITY 203% 183% 248%
TOTAL LIABILITIES AND EQUITY 100% 100% 100%
N= total number of balance sheets

36
BALANCE SHEETS - ASSETS
All Entities N = 237
Non- degree Granting Entities N = 116
Degree-Granting Entities N = 121
Cash on Hand - Unrestricted 19% 18% 20%
Cash - Restricted 1% 1% 0%
A/R Students - Net 19% 23% 15%
A/R - Related Parties 1% 2% 1%
A/R Other 1% 1% 1%
N/R Related Parties 1% 1% 1%
N/R Other 0% 0% 0%
Inventory Books and Supplies 2% 2% 2%
Temporary Investments 1% 3% 0%
Current Prepaid Expense 1% 1% 1%
Other Current Assets 3% 1% 4%
TOTAL CURRENT ASSETS 49% 53% 46%
Buildings 6% 4% 7%
(Accumulated Depreciation) -2% -1% -3%
Furniture and Equipment 25% 23% 27%
(Accumulated Depreciation) -16% -16% -16%
Leasehold Improvements 21% 13% 27%
(Amortization) -8% -6% -9%
Library 1% 0% 2%
(Accumulated Depreciation) -1% -0% -1%
Land 1% 1% 1%
Other Fixed Assets 5% 3% 7%
(Accumulated Depreciation) -3% -3% -4%
TOTAL FIXED ASSETS 29% 19% 38%
Deposits 1% 1% 1%
Other Prepaid Expenses 0% 0% 0%
Goodwill 4% 5% 4%
Revolving Book Account 0% 0% 0%
SFA Matching Funds 0% 0% 0%
Other Assets 16% 23% 11%
TOTAL OTHER ASSETS 21% 28% 16%
TOTAL ASSETS 100% 100% 100%
N= total number of balance sheets Note: Subtotals may vary due to rounding to the nearest tenth.
TOTAL ASSETS < 10,000,000

37
BALANCE SHEET - LIABILITIES AND EQUITYTOTAL ASSETS < 10,000,000
All Entities N = 237
Nondegree-Granting Entities N = 116
Degree-Granting Entities N = 121
Accounts Payable Trade 4% 5% 4%
Notes Payable Equipment 0% 0% 0%
Notes Payable Other 0% 0% 0%
Tuition Refunds Payable 1% 1% 0%
Current Portion of Long Term Debt 1% 1% 1%
Payroll Taxes Payable 0% 0% 0%
Accrued Salaries and Wages 1% 1% 2%
Unearned Tuition 20% 25% 16%
Unearned Dormitory Fees 0% 0% 0%
Other Current Liabilities 6% 3% 8%
TOTAL CURRENT LIABILITIES 34% 37% 31%
Notes or Bonds Payable 3% 2% 4%
Mortgage Payable 1% 1% 2%
Other Long-Term Liabilities 8% 5% 11%
TOTAL LONG-TERM LIABILITIES 13% 7% 17%
TOTAL LIABILITIES 46% 44% 48%
Preffered Stock -0% -1% 0%
Common Stock 1% 1% 1%
Other Equity 22% 13% 29%
Retained Earnings
Beginning Balance 18% 28% 11%
Earnings and Loss for Year 21% 22% 20%
(Dividends) 3% 3% 3%
Other R/E Changes -5% -4% -5%
Ending Balance 31% 43% 22%
TOTAL STOCKHOLDERS EQUITY 54% 56% 52%
TOTAL LIABILITIES AND EQUITY 100% 100% 100%
N= total number of balance sheets

38
BALANCE SHEETS - ASSETS
All Entities N = 133
Nondegree-Granting Entities N = 33
Degree-Granting Entities N = 100
Cash on Hand - Unrestricted 11% 10% 11%
Cash - Restricted 0% 0% 1%
A/R Students - Net 7% 6% 8%
A/R - Related Parties 2% 1% 3%
A/R Other 3% 5% 1%
N/R Related Parties 0% 0% 0%
N/R Other 0% 0% 0%
Inventory Books and Supplies 1% 1% 0%
Temporary Investments 3% 1% 4%
Current Prepaid Expense 1% 1% 1%
Other Current Assets 1% 1% 1%
TOTAL CURRENT ASSETS 28% 26% 31%
Buildings 12% 15% 8%
(Accumulated Depreciation) -1% -0% -1%
Furniture and Equipment 21% 25% 14%
(Accumulated Depreciation) -18% -24% -9%
Leasehold Improvements 7% 3% 11%
(Amortization) -3% -1% -5%
Library 0% 0% 0%
(Accumulated Depreciation) -0% -0% -0%
Land 2% 2% 2%
Other Fixed Assets 1% 1% 1%
(Accumulated Depreciation) -0% -0% -1%
TOTAL FIXED ASSETS 21% 21% 21%
Deposits 0% 0% 0%
Other Prepaid Expenses 0% 0% 0%
Goodwill 12% 10% 15%
Revolving Book Account 0% 0% 0%
SFA Matching Funds 0% 0% 0%
Other Assets 39% 43% 32%
TOTAL OTHER ASSETS 51% 53% 48%
TOTAL ASSETS 100% 100% 100%
N= total number of balance sheets Note: Subtotals may vary due to rounding to the nearest tenth.
TOTAL ASSETS ≥ 10,000,000
39
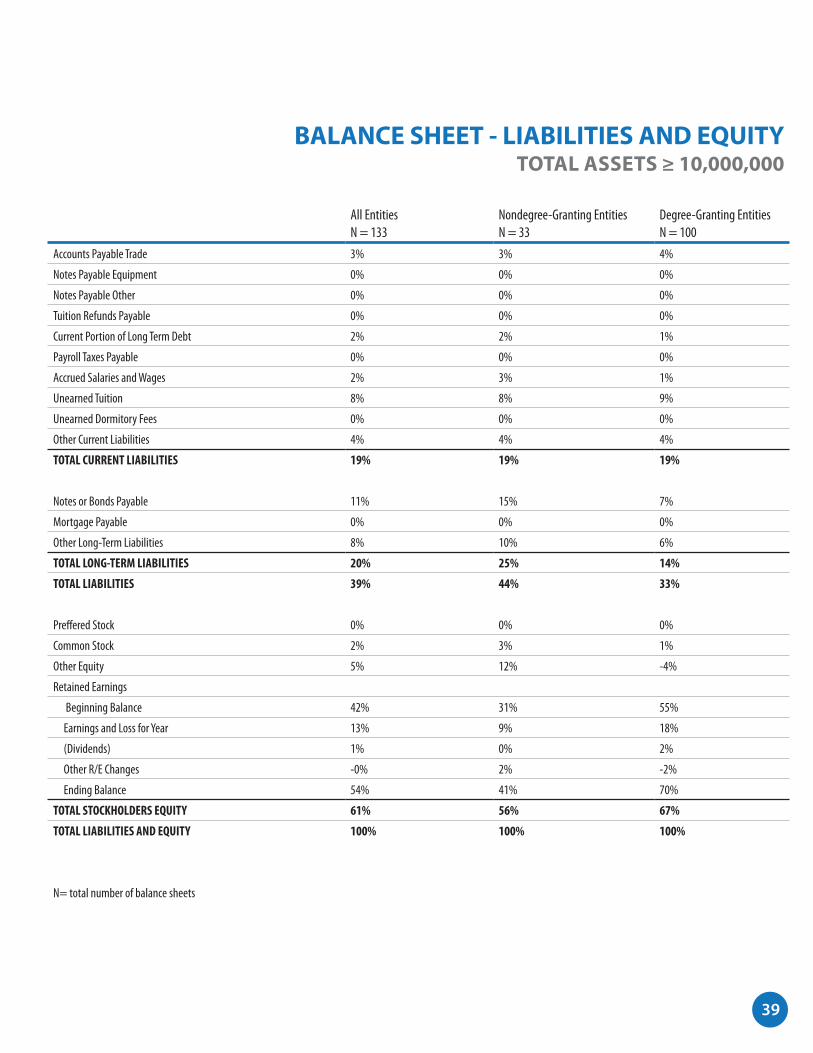
BALANCE SHEET - LIABILITIES AND EQUITYTOTAL ASSETS ≥ 10,000,000
All Entities N = 133
Nondegree-Granting Entities N = 33
Degree-Granting Entities N = 100
Accounts Payable Trade 3% 3% 4%
Notes Payable Equipment 0% 0% 0%
Notes Payable Other 0% 0% 0%
Tuition Refunds Payable 0% 0% 0%
Current Portion of Long Term Debt 2% 2% 1%
Payroll Taxes Payable 0% 0% 0%
Accrued Salaries and Wages 2% 3% 1%
Unearned Tuition 8% 8% 9%
Unearned Dormitory Fees 0% 0% 0%
Other Current Liabilities 4% 4% 4%
TOTAL CURRENT LIABILITIES 19% 19% 19%
Notes or Bonds Payable 11% 15% 7%
Mortgage Payable 0% 0% 0%
Other Long-Term Liabilities 8% 10% 6%
TOTAL LONG-TERM LIABILITIES 20% 25% 14%
TOTAL LIABILITIES 39% 44% 33%
Preffered Stock 0% 0% 0%
Common Stock 2% 3% 1%
Other Equity 5% 12% -4%
Retained Earnings
Beginning Balance 42% 31% 55%
Earnings and Loss for Year 13% 9% 18%
(Dividends) 1% 0% 2%
Other R/E Changes -0% 2% -2%
Ending Balance 54% 41% 70%
TOTAL STOCKHOLDERS EQUITY 61% 56% 67%
TOTAL LIABILITIES AND EQUITY 100% 100% 100%
N= total number of balance sheets

40
ANALYSIS OF BALANCE SHEET *NEGATIVE TOTAL ASSETS
All Entities N = 10
Nondegree-Granting Entities N = 6
Degree-Granting Entities N = 4
Current Ratio current assets/current liabilities
1.82 2.86 0.26
Acid Test Ratio current assets - (inventory + prepaid expenses)/current liabilities
1.76 2.76 0.17
Debt-to-Equity Ratio total liabilities/total stockholders equity
-0.51 -0.46 -0.58
TOTAL ASSETS < 10,000,000All Entities N = 236
Nondegree-Granting Entities N = 115
Degree-Granting Entities N = 121
Current Ratio current assets/current liabilities
2.36 2.18 2.56
Acid Test Ratio current assets - (inventory + prepaid expenses)/current liabilities
2.19 1.97 2.41
Debt-to-Equity Ratio total liabilities/total stockholders equity
0.94 1.13 0.76
TOTAL ASSETS ≥ 10,000,000All Entities N = 132
Nondegree-Granting Entities N = 33
Degree-Granting Entities N = 99
Current Ratio current assets/current liabilities
1.97 1.88 2.01
Acid Test Ratio current assets - (inventory + prepaid expenses)/current liabilities
1.85 1.77 1.87
Debt-to-Equity Ratio total liabilities/total stockholders equity
1.42 3.50 0.72
N = total number of balance sheets
* All results are averages based on total number of entities per category


Accrediting Council for Independent Colleges and Schools750 First Street, NE, Suite 980Washington, DC 20002-4223
202.336.6780 (phone)www.acics.org