2009 seattle-king county · david walsh, mithun scott woerman, ... this project also included a...
TRANSCRIPT


2009 Seattle-King CountyGreen Building Jobs
Employer and Education Survey
Published June 2009
Washington StateEmployment Security Department
Karen T. Lee, Commissioner
Labor Market and Economic AnalysisGreg Weeks, Ph.D., Director
Prepared by and in Partnership with
Desiree Phair, Seattle-King County Regional Labor EconomistLabor Market and Economic Analysis
Seattle-King County Green Design and Green Building Industry Skill Panel
This report and other labor market information are available at • www.workforceexplorer.comOr call our Labor Market Information Center at 1-800-215-1617•
Employment Security is an equal-opportunity employer and provider of programs and services. Auxiliary aids and services are available upon request to people with disabilities.

Acknowledgements
ii
Research and Data Analysts:
Desiree Phair, Regional EconomistRobert Haglund, Research Analyst Dave Wallace, Economist
Green Jobs Survey Staff:
Janet DenisonSandra McKibben
David Allen, McKinstry (Panel Chair)
Aaron Adelstein, Built Green, Master Builders Association
Rodger Benson, Mortenson Construction
Laurie Black, Workforce Development Council of Seattle-King County
Julia Cordero, Construction Center of Excellence, Renton Technical College
Ben Corning, Waste Management
Pinky Dale, Georgetown Campus, South Seattle Community College
Diane Kocer, Associated General Contractors of Washington
Nettie Dokes, Seattle City Light
Kinley Deller, King County Recycling and Environmental Services
Steve Gerritson, enterpriseSeattle
Dave Harrington, IDModeling
Matthew Houghton, CityofSeattleOfficeofEconomicDevelopment
John Littel, PacificNorthwestRegionalCouncilofCarpenters
Patrick Neville, Worker Center, AFL-CIO, and Apollo Alliance
Lee Newgent, Seattle-King County Building and Construction Trades Council, AFL-CIO
Margaret Montgomery, NBBJ
Tom Peterson, Hoffman Construction
Donna Shirey, Shirey Contracting
Shep Siegel, Seattle Public Schools Career and Technical Education
David Walsh, Mithun
Scott Woerman, Landau Associates
Seattle-King County Green Design and Green Building Industry Panel
Graphic Design Unit:
Bonnie Dalebout, Graphic Design Unit Supervisor and Report Editor
Sandra K. Jones, Communications Consultant and Report Graphic Designer/Editor
Washington State Employment Security Department

Contents
iii
Executive Summary ........................................................................................................................ 1
Businesses ...................................................................................................................................... 1 Educational Institutions ..................................................................................................................... 2 Vacancies Among Potential Green-Building Industries in King County ....................................... 2
Section 1 - Introduction and Background ........................................................................... 3
Section 2 - Employer Survey ...................................................................................................... 4
Employer Survey – Introduction .................................................................................................... 4 Baseline Company Information .......................................................................................................... 4 New Job Titles................................................................................................................................ 6 Existing Jobs .................................................................................................................................. 7 Entry-Level Responses .................................................................................................................. 8 Professional/Technical Positions ....................................................................................... 9 Skilled Trades Positions ..................................................................................................... 9 Positions Not Requiring an Apprenticeship ....................................................................... 9 Knowledge and Skills Applicants Lack ......................................................................................... 10 Employer Survey – Conclusions .................................................................................................... 11
Section 3 - Educational Institutions Survey ........................................................................ 12
Educational Institutions Survey Introduction ................................................................................ 12 Educational Institutions Survey Findings ...................................................................................... 12 Educational Institutions Survey Conclusions ................................................................................ 13
Section 4 - Job Vacancy Survey, Green Building Focus ............................................... 14
Vacancies Among Potential Green-Building Industries in King County ....................................... 14 Job Vacancy Survey and Projections Conclusions ......................................................................... 16
Overall Conclusions ........................................................................................................................ 17

Contents
iv
Appendices .......................................................................................................................................... 18
Appendix A – Response Rate and NAICS Included in the Sample ............................................... 18 Response Rate .................................................................................................................... 18 NAICS Codes ..................................................................................................................... 19
Appendix B – Respondent Comments ........................................................................................... 20 Training Needs ................................................................................................................... 20 Young Applicants’ Work Readiness .................................................................................... 22 Industry Changes ............................................................................................................... 23
Appendix C – Knowledge and Skills Lacking ............................................................................... 24 Knowledge Lacked ............................................................................................................. 24 Skills Lacked ...................................................................................................................... 25
Appendix D – Programs of Study .................................................................................................. 26 Two-Year Institutions ......................................................................................................... 26 Four-Year Institutions ........................................................................................................ 28
Appendix E – Jobs Filled by Graduates Post Completion ............................................................. 29
Appendix F – Occupational Projections ........................................................................................ 34
Appendix G – Survey Copies ........................................................................................................ 36Seattle-King County Green Building Jobs – Survey Questions for Employers ................. 36Seattle-King County Green Building – Education Survey ................................................. 39

1
Executive Summary
Executive Summary
Unanswered questions about local demand for jobs related to green building and information in the 2008 Washington State Green Economy Jobs report inspired the Work-force Development Council of Seattle-King County (WDC) and The Seattle-King County Green Design and Green Building Industry Skill Panel (Green Build-ing Panel) to conduct a surveyfocusedspecifi-cally on construction and related employ-ers within King County, Washington. The Labor Market and Economic Analysis (LMEA) branch of the Employment Security Department (ESD) offered to reconnect with certain King County companies from the original state sample. This project also included a second
phase asking King County higher education institutions what green training pro-grams they offer, what re-sults these programs have produced thus far, and what programs might be added in the future. Additionally, analysts prepared a summary of potentially green-
building-related job vacancies based on results
from the Washington State Spring 2009 Job Vacancy Survey, and compiled the most recently avail-able occupational projections for green-building-related occupations. This report consolidates these results and summarizes responses in narrative and tabular form.
Employersreportsufficientjobskillsamongthemajorityof job candidates, perhaps due to an abundance of experi-enced, out-of-work labor due to high industry unemploy-
ment. Employers are largely performing green tasks using workers with existing job titles, and even entry-level jobs typically require education. Although the study did not reveal many new entry or middle-skill jobs, jobs related to sustainability planning and advising are emerging at higher levels. Firms are very concerned with “soft skills” such as communication and work ethic.
Schools are providing a number of green-building-relatedcourses,manyofthemfilledtonearcapacity.Schools do not uniformly track graduate outcomes. Further research applying a consistent standard across multiple institutions is needed.
The Job Vacancy Survey (JVS) numbers showed more vacancies for high-paying work for highly-educated em-ployeesoflargerfirms.Occupationalprojectionspredictsluggish growth or even declines in the construction indus-try, particularly for low-skilled occupations.
Businesses
There were 1,019 companies in the initial sample for the survey of potenially green building businesses (Appendix A – Response Rates and NAICS). The survey opened by inquiring about basic characteristics of the business, such as anticipated retirement rate and number of staff members working part time. The survey then asked about new job titles and entry-level jobs and their corresponding promo-tion paths. Questions also covered which jobs are most in demand, asking both about the number currently employed inexistingjobtitlesandthenumberofpositionsfirmsan-ticipate adding. Employers had the opportunity to describe any skills or areas of knowledge that they have found lack-ing in candidates. Finally, survey staff recorded respondent comments; these are summarized in Appendix B.
Firms in the survey expected a low retirement rate over thenextfiveyears.Thismaybeduetoolderemployeesremainingintheworkforceafterthefinancialcrashorgreenfirmspossiblyhavingayoungerworkforcethanothertypesofconstructionfirms.Onlyabouthalfofthefirmsoffertraining;andmanyofthoseofferedonlyinformal sessions such as brown-bag lunches. Of the

Executive Summary
2
employers responding, 84.6 percent said they had no new job titles. Those who did list new job titles focused on higher-level jobs in areas such as sustainable design. Four-fifths(80.0percent)ofentry-leveljobsthatwerereported required preparation beyond a high school diploma/GED. There were very few instances of green-specifictitlessuchasweatherizationinstaller,solarpanel technician, or recycling/waste removal worker mentionedwhenfirmsansweredthequestionaboutentry-level positions. People performing these tasks are incorporated under existing titles.
A large majority (64.2 percent) of employers stated that candidates did not lack any job-related skills. The job-specificskillsmostcommonlyreportedabsentweregeneralgreenknowledgeandcertificationssuchas Leadership in Energy and Environmental Design (LEED). Employers were more likely to comment on an absence of “soft skills” in applicants, such as writing skillsandEnglishproficiency.
Based on key comments from the open-ended questions attheendofthesurvey,somefirmshavebeenstrug-gling with lost revenues; that in turn has affected their ability to hire, train, and keep staff. Businesses com-mented that the term “green” is used inconsistently by clients and competitors, and that the green label should clearly map to product features or measures of quality rather than merely serving as a trendy buzzword. Mul-tiplefirmsaskedformoreconsistentcodesandregula-tions across – and even within – jurisdictions. Lack of
work ethic emerged as a con-cern, particularly in younger
employees.
Educational Institutions
The survey of higher education institutions tabulated course of-
ferings related to green indus-tries and green
job skills. Seven universities/colleges and fourteen community colleges/technical schools were included in the sample. All schools responded to the survey, with some offering more complete information than others.
The education survey questions can be found in Ap-pendix G.Theyincludeddegree,certificate,andap-prenticeship programs related to green construction. Respondents were also asked about new programs that the schools intend to add within the next three years.
Schools offer a variety of courses geared toward develop-ing a more skilled green-building workforce, but enroll-ment space in existing sections is limited. Some new courses are under development, but budget concerns limit schools’ ability to expand. Schools do not consistently trackemploymentresultsforgraduates,soitisdifficultto compare the effectiveness of different trainings.
Vacancies Among Potential Green- Building Industries in King County
Based on the sample design for this report’s business survey, thirteen six-digit North American Industry Clas-sificationSystem(NAICS)industrieswereidentifiedtohavereportedhavinggreenjobs.Usingtheseidentifiedindustries, data were extracted from the Washington State Spring 2009 Job Vacancy Survey to examine characteristicsofpositionsthatfirmswereactivelytry-ingtofill.Asummaryofrecentlyreleasedoccupationalprojections was also prepared.
Overall there were an estimated 367 vacant positions, the large majority of which were full time, permanent, and requiring previous experience. These positions are clusteredatlargerfirms,perhapsthoselargeenoughtoattract work associated with existing or expected stimu-lus funding. Many positions offer high salaries and, correspondingly, require higher-level degrees. Occupa-tionalprojectionsshowsomeexpectedgrowthinfieldswith a potential tie to green building; but some losses are anticipated in the near term, especially for entry-level jobs such as laborers.

3
Section 1
Introduction and Background
The greening of industries has generated much enthusiasm in recent months, and for good reason. The prospect of creating jobs, saving money, and living in a cleaner world sounds like a dream come true. But what exactly is a green job or a green industry? Stakeholders within Washington statehavebeguntakingstepstodefineterms,accuratelyestimate job prospects, and distinguish new career oppor-tunities. This report contributes to that goal by providing specificinformationaboutprivate-sectorfirmswithoneor more employees engaging in building projects in King County, Washington.
Many pieces must come together to complete our understanding of what a green economy looks like and the importance of green industries in our current system. One key step took place in late 2008 with the Washing-ton State Green Economy Jobs Survey. A very important but often overlooked component of this effort involved developingaclear,concisedefinitionofthegreeneconomy and green jobs:
The green economy is rooted in the development and use of products and services that promote environmental protection and energy security. It is composed of industries and businesses engaged in:
• Energyefficiency• Preventingandreducingpollution• Renewableenergy• Mitigatingorcleaninguppollution
Green jobs promote environmental protection and energy security.
Armedwithasoliddefinitionandasoundmathematicalsample design, the Employment Security Department’s Labor Market and Economic Analysis (LMEA) branch surveyed over 13,000 businesses, asking whether the businesses engaged in green work and collecting a list of job titles connected with these tasks. The full expla-nation of these results can be viewed online at www.workforceexplorer.com in the 2008 Green Economy Jobs Survey report.
Quality research often sparks fresh questions. In this case, the statewide report inspired the Workforce Development Council of Seattle-King County (WDC) and The Seattle-King County Green Design and Green Building Industry Skill Panel (Green Building Panel) todigdeeperwithinonespecificindustryandgeogra-phy. While it is helpful to know which companies and job titles are most likely to be performing green work, it would be even more enlightening to know which of these jobs are entry level, what green career ladders might look like, and what are the gaps between what skills current green candidates offer versus what skills green employers need. The Green Building Panel also neededmoreclarificationregardingwhethernewposi-tions are emerging or if known positions are simply adding extra skill requirements; further, the Green Building Panel wanted to know what existing positions related to green building are most in demand.
Through multiple brainstorming sessions and drafting exercises with key stakeholders, a complete project evolved. LMEA offered to reconnect with King County companies from the original state sample and ask fol-low-up questions prepared by a collaboration between LMEA and the Green Building Panel. In the sample, firmsreportedtohave11.2percentofemploymentingreen jobs. The project also included a second phase in which LMEA asked King County higher education institutions what green training programs they offer, what results these programs have produced thus far, and what programs might be added in the future. Both the survey of businesses and the survey of educational institutions were conducted by telephone. A full copy of each set of survey questions can be found in Appen-dix G. Additionally, analysts produced a summary of potential green-related job vacancies based on results from the Job Vacancy Survey which included mail, phone, and internet-based data collection methods. The Job Vacancy Survey report can be found online at www.workforceexplorer.com. The 2009 King County Green Building Jobs Employer and Education Survey report consolidates these results and summarizes responses in narrative and tabular form, and also suggests possible conclusions and future areas of research.

4
Section 2
Employer Survey
Employer Survey – Introduction
In order to ascertain new and existing green-building job titles, entry-level job titles and associated career paths, and green-building candidate skill gaps in the local area, the Green Building Panel commissioned a survey of lo-calgreen-buildingindustryfirms.
The sample represents a population of 5,961. There were 1,019 businesses in the initial sample; staff then took steps to eliminate companies no longer in business or otherwise incapable of participating. Staff attempted to contact 920 companies and received 547 full responses and 11 partial responses from sample businesses. The overall survey response rate was 60.7 percent. Non-response codes includedfirmsthatrefusedtoparticipateaswellasfirmsthat were unreachable; removal codes included companies located out of state, listed more than once, or out of busi-ness (Appendix A – Response Rates and NAICS).
Responses will be discussed here in the same order as the survey questions. The survey opened by inquiring about basic characteristics of the business, such as number of staff members working part time and anticipated retire-ment rate. The survey then asked about new, existing, and entry-level job titles and promotion paths. In the next set of questions, employers could describe any skills or areasofknowledgethattheyfindlackingincandidates.Finally, survey staff recorded employer comments; these are summarized in Appendix B.
Baseline Company Information
The survey began by collecting some baseline data about each company.
LMEA publications such as Current Employment Statis-tics (CES) and the Quarterly Census of Employment and Wages (QCEW) typically break the construction industry into three different categories: construction of buildings, heavy and civil engineering construction, and specialty trade contractors. Firms from each of these three categories were included in the sample.
During the survey, companies categorized themselves by estimating what percentage of their workforce was involved in residential, commercial, or industrial/heavy projects. Survey staff did not give respondents detailed guidance about the distinction between the three areas. Most companies allocated their time to at least two of these categories.
Figure 1 Percentage of Companies with Workforce Allocated Among Construction CategoriesKing County, June 2009Source: Labor Market and Economic Analysis, ESD
Clearlysomefirmsarelargerthanothersandthusthespread of the workforce across the subsectors will not matchthespreadofthefirmsacrossthesubsectors.Figure 2 illustrates the number of staff members within the categories.
50.9%
8014.7%
15929.3%
458.3%
10819.9%
7213.3%
7413.6% Residential Only
Commercial Only
Industrial Only
Residential-Commercial
Commercial-Industrial
Residential-Industrial
Residential, Commercialand Industrial

5
Section 2
Figure 2 Percentage of Workforce Allocated Among Construction CategoriesKing County, June 2009Source: Labor Market and Economic Analysis, ESD
The percentage of staff working in “residential only” or in a combination of “residential and commercial” is smallerthanthepercentageoffirmsworkinginthosesame categories. The percentage of staff working in “commercial only” or in a combination of “commercial andindustrial”islargerthanthepercentageoffirmsworking in those categories. Other categories have similarpercentageallocationsforstaffandfirms.
In addition to allowing businesses to self-identify ac-cording to the three major construction industry subsec-tors,firmsalsoidentifiedtheirprimarybusinesstype.The green-building industry offers a diverse set of custom and specialized services. Of companies offering a standardized service type, the most common services wereengineeringandarchitecturefirms,followedbyvarioustypesofconstructionfirms.Alargenumberoffirmsidentifiedarelativelyrareprimarybusinesstype.Forexample,onlytwofirmslisted“moldremediation”astheirprimarybusinesstype;onefirmlisted“marineconstruction,” and another chose “installation of under-ground irrigation systems” as a primary business type. Thesefirmswerelumpedtogetherinacategorylabeled“other.”Approximately13.5percentoffirmsfellintothe “other” category.
4,47421.3%
4,06919.4%
1,8178.7%
6,02128.7%
1,6047.6%
2,91513.9%
970.5%
Residential Only
Commercial Only
Industrial Only
Residential-Commercial
Commercial-Industrial
Residential-Industrial
Residential, Commercialand Industrial
Figure 3 Respondent Primary Business TypeKing County, June 2009Source: Labor Market and Economic Analysis, ESD
Business Type Number of Firms
Engineering 83Architecture 51Commercial 37General Contractor 35Construction 28Residential 26Environmental Consulting 26Electrical 25Remodeling 23HVAC 21Roofing 16Drywall 16Plumbing 15Utility 13Glass 8Road and Highway 7Heavy Construction 6Fire Systems 6Asbestos 6Concrete 4New Home Construction 4Electrician 4Landscape 4Acoustics 4Excavation 4Siding Install 4
The majority of the workforce at responding companies work full time. In fact, only 4.0 percent of employees at the companies surveyed had a part-time schedule.
Figure 4 Workers Full Time Versus Part TimeKing County, June 2009Source: Labor Market and Economic Analysis, ESD
Full Time Part Time
Quantity 20,635 825Percentage 96% 4%
The vast majority of the companies surveyed reported veryfewexpectedretirementswithinthenextfiveyears. This result is quite surprising; a number of other

6
Section 2
sources have predicted a high level of construction retirement in the coming years. Because the timing of thissurveyfellsoneartothefinancialcrash,perhapsemployers believe that older employees will remain on the job much longer than previously expected. It is also possiblethatfirmsinthesamplehaveayoungerwork-force and thus a lower expected retirement rate.
Figure 5 Percentage of Workers Retiring - Number and Percentage of ResponsesKing County, June 2009Source: Labor Market and Economic Analysis, ESD
Less than half (48.5 percent) of responding companies offered in-house training options. Companies that typ-ically use the apprentice-journeyman career path often commented that they rely heavily on union preparation of candidates. Those hiring engineers, architects, and scientists commented that they require college degrees and then provide a combination of advising from se-nior staff, informal training sessions (e.g., brown-bag lunch presentations), and support for those who pursue formalcertificationssuchasLeadershipinEnergyand Environmental Design (LEED). Several compa-nies also commented either that they once trained but have cut back during the tight economy, or that they may add training opportunities in the future. For those businesses that do train, many commented that having employees with a solid work ethic and basic skills – ability to read and write, familiarity with power tools, etc. – is more important than having employees with a particularcertification.
Figure 6 Responding Companies Who Offer TrainingKing County, June 2009Source: Labor Market and Economic Analysis, ESD
Yes No
259 275
Anticipating a large percentage of employees retiring has some impact on the likelihood that the company offers training, but not as large as one might expect. Twenty re-sponding businesses expect 25.0 percent or more of their laborforcetoretirewithinfiveyears.Ofthese,11offeremployee training.
Figure 7 Responding Companies Expecting 25 Percent or More of Their Labor Force to Retire Who Offer TrainingKing County, June 2009Source: Labor Market and Economic Analysis, ESD
Yes No
11 9
New Job Titles
One major reason for conducting this survey was to collect additional data about whether there are truly new, green jobs in the labor market or whether traditional jobs have simply added green skill requirements. Others have at-tempted to compile such information, and thus far evi-dence of a large number of emerging green titles has been minimal.TheStandardOccupationalClassificationPolicyCommittee (SOCPC) recently reviewed requests to add over 80 new green-related job titles. The SOCPC added Wind Turbine Service Technicians (499081) and Solar PhotovoltaicInstallers(472231)asofficialnewtitles,andrecommendedthatanumberofothertitlesbeidentifiedas Occupational Information Network (O*NET) new and emerging occupations. For more information please see the “Notices” section of the Federal Register, Volume 74, Number 12, published Wednesday, January 21, 2009. It may be worthwhile to continue to watch this topic, as there may simply be a lag between asking workers to perform green work and actually developing a separate job title that isuniquelyidentifiableandtrackable.
7614%
204%
234%
173%
71%
9013%
31057%
40 to 56
21 to 39
16 to 20
11 to 15
6 to 10
1 to 5
0

7
Section 2
Most of the employers responding to this survey, 472 (84.6 percent) said they had no new job titles. The remain-ing employers tended to list job titles more focused on higher-level positions in sustainability and design rather thanpositionsmorecloselyidentifiedwiththetrades.Respondents considered the job titles in Figure 8 new to their business; the trade-related positions are bolded.
Figure 8 New Job TitlesKing County, June 2009Source: Labor Market and Economic Analysis, ESD
Job Titles
Associate Principal in Charge of Sustainable DevelopmentBuilding Commission TechnicianCommissioning DesignerDemolition AdvocateDirector Sustainable EnergyEnergy Conservation TechnicianGreenGridProjectCertificationSpecialistGreen Roof InstallerGreen Roof SalesLow Impact Design SpecialistNational LEED Board MemberSenior Sustainable Development StrategistSmart Energy Solutions ManagerSolar Photovoltaic TechnicianStrategic Initiative Leader for SustainabilitySustainability ConsultantSustainability Engineer ManagerSustainable and Renewable Energy DirectorSustainable Assessment ConsultantSustainable Building AdvisorSustainable Development ManagerWeatherization InspectorWind Development Civil EngineerWind Turbine Division ManagerWind Turbine Technician
One feature of some new job titles included in-serting “LEED” in front of otherwise existing titles. Fig-ure 9 lists LEED-related job titles.
Figure 9 LEED-Related Job TitlesKing County, June 2009Source: Labor Market and Economic Analysis, ESD
LEED Job Titles
LEEDSafetyManager LEEDCertifiedProjectManagerLEEDCertificationSpecialist LEEDEngineerLEEDCertifiedArchitect LEEDManagerLEEDCertifiedBuildingDesigner LEEDProjectEngineerLEEDCertifiedInteriorDesigner
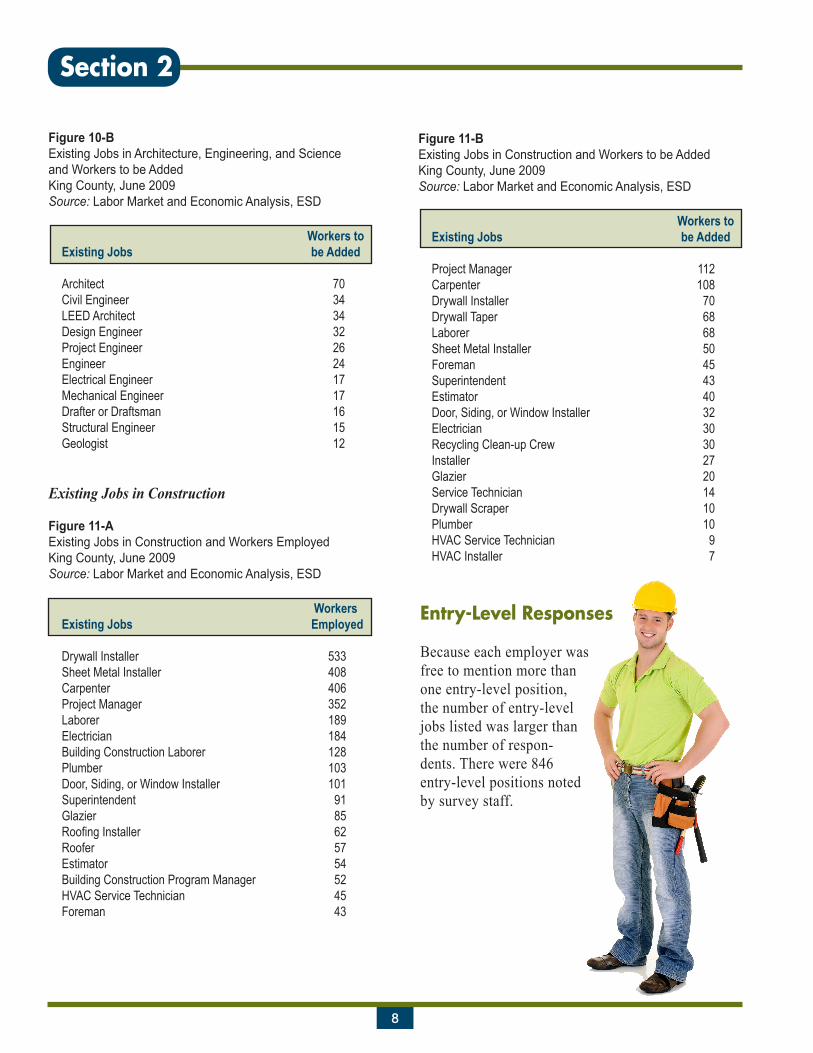
Existing Jobs
Employers were asked which of their existing jobs related to green-building work are most in demand. The list of reported existing jobs that are in demand dwarfs the list of job titles that employers considered new. Firmsgavethenumberofworkerscurrentlyfillingin-demandpositions,andfirmsalsoestimatedhowmanyadditional workers will be hired into these positions. For clarity, reported answers have been split into two groups: jobs related to architecture, engineering, and science; and jobs related to construction.
Figure 10-A Existing Jobs in Architecture, Engineering, and Scienceand Workers Employed King County, June 2009Source: Labor Market and Economic Analysis, ESD
WorkersExisting Jobs Employed
Civil Engineer 365Architect 349Mechanical Engineer 128Project Engineer 124Design Engineer 100Electrical Engineer 93Engineer 66Environmental Engineer 60AutoCAD Drafter 58Environmental Scientist 51LEED Architect 48Drafter or Draftsman 47
8
Section 2
Figure 11-B Existing Jobs in Construction and Workers to be Added King County, June 2009Source: Labor Market and Economic Analysis, ESD
Workers toExisting Jobs be Added
Project Manager 112Carpenter 108Drywall Installer 70Drywall Taper 68Laborer 68Sheet Metal Installer 50Foreman 45Superintendent 43Estimator 40Door, Siding, or Window Installer 32Electrician 30Recycling Clean-up Crew 30Installer 27Glazier 20Service Technician 14Drywall Scraper 10Plumber 10HVAC Service Technician 9HVAC Installer 7
Figure 10-B Existing Jobs in Architecture, Engineering, and Science and Workers to be Added King County, June 2009Source: Labor Market and Economic Analysis, ESD
Workers toExisting Jobs be Added
Architect 70Civil Engineer 34LEED Architect 34Design Engineer 32Project Engineer 26Engineer 24Electrical Engineer 17Mechanical Engineer 17Drafter or Draftsman 16Structural Engineer 15Geologist 12
Existing Jobs in Construction
Figure 11-A Existing Jobs in Construction and Workers EmployedKing County, June 2009Source: Labor Market and Economic Analysis, ESD
WorkersExisting Jobs Employed
Drywall Installer 533Sheet Metal Installer 408Carpenter 406Project Manager 352Laborer 189Electrician 184Building Construction Laborer 128Plumber 103Door, Siding, or Window Installer 101Superintendent 91Glazier 85RoofingInstaller 62Roofer 57Estimator 54Building Construction Program Manager 52HVAC Service Technician 45Foreman 43
Entry-Level Responses
Because each employer was free to mention more than one entry-level position, the number of entry-level jobs listed was larger than the number of respon-dents. There were 846 entry-level positions noted by survey staff.

9
Section 2
ingsomeonetoatrainingprogramspecificallyfocusedon AutoCAD, for example, has little to do with that worker’s later admission into an architecture program.
Skilled Trades Positions
The apprentice-journeyman path appeared repeatedly throughout the skilled trades (electrician, plumber, pipe fitter,etc.).Approximately100responses(11.8percentofentry-levellistings)citedapprenticeshipasthefirststep on the career ladder. Based on the nature of the responses, it is not possible to tag which employers hire only union workers for skilled trades positions. However, overwhelmingly these respondents referenced union membership – and presumably all training and screening that go along with union membership – as the only job requirement.
Positions Not Requiring an Apprenticeship
Therewereveryfewinstancesofagreen-specifictitlessuch as weatherization installer, solar panel techni-cian, or recycling/waste removal worker reported when firmsansweredthequestionaboutentry-levelpositions.People performing these tasks are incorporated under existing titles; for example, many installers may simply be working under the title “laborer.” Although titles havenotyetchangedtoreflectgreen-specifictasks,they may in the future and are worth continuing to watch. (See previous New Job Titles section discussing the SOC title decisions.)
Out of the 113 times (13.3 percent of entry-level listings) that an employer designated some type of laborer posi-tion as an entry-level job, 50 (5.9 percent of entry-level titles, 44.2 percent of laborer titles) indicated that labor-ers could expect to advance to a position as a carpenter or apprentice carpenter. Other employers considered the carpenter position an entry-level job. At these companies, carpenters could expect to advance into positions as head carpenters, superintendents, or foremen.
Approximately 130 entry-level job titles (15.4 percent of the responses) listed by employers had “driver’s license,” “experience,” “work ethic,” “no minimum,” “none,” or similar non-education-based responses as
Professional/Technical Positions
Careers in engineering, science, architecture, and relatedfieldsoftenbeginwithinternshipsduringthesummer or as part of clinic or capstone courses. College graduates then typically hold an entry-level professional position – sometimes with the word “junior,” “entry,” or “staff” in the job title – until passing an exam or gaining a minimum number of years experience. These posi-tions are likely to be labeled using numbers to designate rungs on the career ladder (e.g., “Environmental Scien-tist I,” “Environmental Scientist II,” and so on). Those with many years of experience hold jobs with “senior” in the title, or advance to positions as managers or as principalsofsmallfirms.
There were 41 responses (4.8 percent of entry-level listings) that considered scientists entry level, 100 responses (11.8 percent) that considered engineers entry level, and 37 responses (4.4 percent) that considered architects entry level. All of these positions required a four-year degree even for entry-level work.
Drafter, draftsman, CAD/AutoCAD workers, and ma-chinists perform skilled work that is related to architec-ture and engineering but does not require a four-year degree. The 27 responses (3.2 percent) that mentioned drafters or machinists typically required some college or an associate’s degree. Some workers become draft-ers or machinists during internships while enrolled in
a four-year degree program such as engineering or architecture, and in that sense, perform-
ing this work can be a step along the path toward
becoming a professional architect or engineer.
However, these draft-ing positions typi-cally do not function as a true entry level for architecture and engineering in the
way that workforce development professionals
view entry levels. Send-
10
Section 2
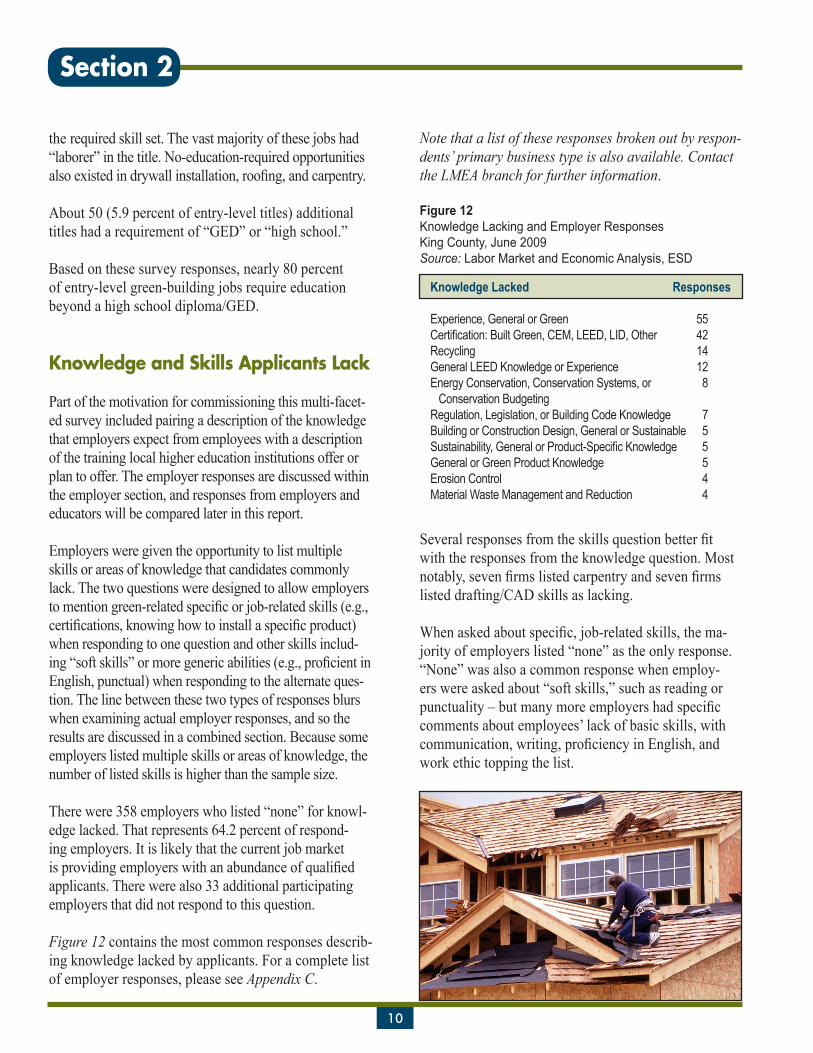
the required skill set. The vast majority of these jobs had “laborer” in the title. No-education-required opportunities alsoexistedindrywallinstallation,roofing,andcarpentry.
About 50 (5.9 percent of entry-level titles) additional titles had a requirement of “GED” or “high school.”
Based on these survey responses, nearly 80 percent of entry-level green-building jobs require education beyond a high school diploma/GED.
Knowledge and Skills Applicants Lack
Part of the motivation for commissioning this multi-facet-ed survey included pairing a description of the knowledge that employers expect from employees with a description of the training local higher education institutions offer or plan to offer. The employer responses are discussed within the employer section, and responses from employers and educators will be compared later in this report.
Employers were given the opportunity to list multiple skills or areas of knowledge that candidates commonly lack. The two questions were designed to allow employers tomentiongreen-relatedspecificorjob-relatedskills(e.g.,certifications,knowinghowtoinstallaspecificproduct)when responding to one question and other skills includ-ing“softskills”ormoregenericabilities(e.g.,proficientinEnglish, punctual) when responding to the alternate ques-tion. The line between these two types of responses blurs when examining actual employer responses, and so the results are discussed in a combined section. Because some employers listed multiple skills or areas of knowledge, the number of listed skills is higher than the sample size.
There were 358 employers who listed “none” for knowl-edge lacked. That represents 64.2 percent of respond-ing employers. It is likely that the current job market isprovidingemployerswithanabundanceofqualifiedapplicants. There were also 33 additional participating employers that did not respond to this question.
Figure 12 contains the most common responses describ-ing knowledge lacked by applicants. For a complete list of employer responses, please see Appendix C.
Note that a list of these responses broken out by respon-dents’ primary business type is also available. Contact theLMEAbranchforfurtherinformation. Figure 12 Knowledge Lacking and Employer ResponsesKing County, June 2009Source: Labor Market and Economic Analysis, ESD
Knowledge Lacked Responses
Experience, General or Green 55Certification:BuiltGreen,CEM,LEED,LID,Other 42Recycling 14General LEED Knowledge or Experience 12Energy Conservation, Conservation Systems, or 8 Conservation Budgeting Regulation, Legislation, or Building Code Knowledge 7Building or Construction Design, General or Sustainable 5Sustainability,GeneralorProduct-SpecificKnowledge 5General or Green Product Knowledge 5Erosion Control 4Material Waste Management and Reduction 4
Severalresponsesfromtheskillsquestionbetterfitwith the responses from the knowledge question. Most notably,sevenfirmslistedcarpentryandsevenfirmslisted drafting/CAD skills as lacking.
Whenaskedaboutspecific,job-relatedskills,thema-jority of employers listed “none” as the only response. “None” was also a common response when employ-ers were asked about “soft skills,” such as reading or punctuality–butmanymoreemployershadspecificcomments about employees’ lack of basic skills, with communication,writing,proficiencyinEnglish,andwork ethic topping the list.

11
Section 2
Itwasnotmerelyprofessional/technicalfirmsask-ing for these skills. Firms specializing in almost every subsector of construction consistently cited writing as a necessary skill that applicants lack.
Figure 13 shows the most frequent responses. For the complete table of responses, see Appendix C.
Figure 13 Job-Related Skills Lacking and Employer ResponsesKing County, June 2009Source: Labor Market and Economic Analysis, ESD
Skills Lacked Responses
None 169Communication 99Writing 88ProficientinEnglish 55Work Ethic / Habits, Attitude 49Software:GeneralUse 34Work Experience 21Math:Mental/PaperArithmetic 20Reliability/Punctuality 18Social Skills 13Safety 11Software:OfficeProductivity 10Reading Plans and Drawings 9Technical Writing 9
Employer Survey – Conclusions
Samplefirmsspecializeinawidevarietyofservicetypes.Overall,firmsexpectedalowretirementrateoverthenextfiveyears.Thismaybeduetoolderemployeesremainingintheworkforceafterthefinancialcrashorgreenfirmspossiblyhavingayoungerworkforcethanothertypesofconstructionfirms.Onlyabouthalfofthefirmssurveyedoffertraining;andmanyofthoseofferonly informal sessions such as brown-bag lunches.
Of the employers responding, 84.6 percent said they had no new job titles. Those who did list new job titles focused on higher-level jobs in areas such as sustain-able design. The survey also gathered information about existing job titles that employers consider most in demand as it relates to green building and how many positions of this type employers plan to add.
Four-fifths(80.0percent)ofentry-leveljobsdiscussedhere require preparation beyond a high school diploma/GED.Therewereveryfewinstancesofagreen-specifictitle such as weatherization installer, solar panel technician, orrecycling/wasteremovalworkerreportedwhenfirmsanswered the question about entry-level positions. People performing these tasks are incorporated under existing titles. The entry levels continue to be working as a laborer or carpenter receiving on-the-job training in residential construction, or working within a union apprenticeship.
A large majority (64.2 percent) of employers stated that candidates did not lack any job-related skills; the job-specificskillsmostcommonlyreportedabsentweregen-eralgreenknowledgeandcertificationssuchasLEED.Employers were more likely to comment on an absence of “soft skills” in applicants, such as communication and work ethic. Open-ended questions lead to responses that donotgroupneatly,butwhencollectingdataforthefirsttime, preselecting answers from which respondents must choose might unnaturally narrow the information in the responses. The list of skills collected here could be used to develop a set of predetermined responses from which employers could choose in future surveys.
Based on key comments from the open-ended question attheendofthesurvey,firmshavebeenstrugglingwithlost revenues, and that in turn has affected their ability to hire, train, and keep staff. Businesses commented that the term “green” is used inconsistently by clients and competitors, and that the green label should clearly map to product features or measures of quality rather than merelyservingasatrendybuzzword.Multiplefirmsasked for more consistent codes and regulations across – and even within – jurisdictions. Lack of work ethic emerged as a concern, particularly in younger employees.
12
Section 3
Educational Institutions Survey
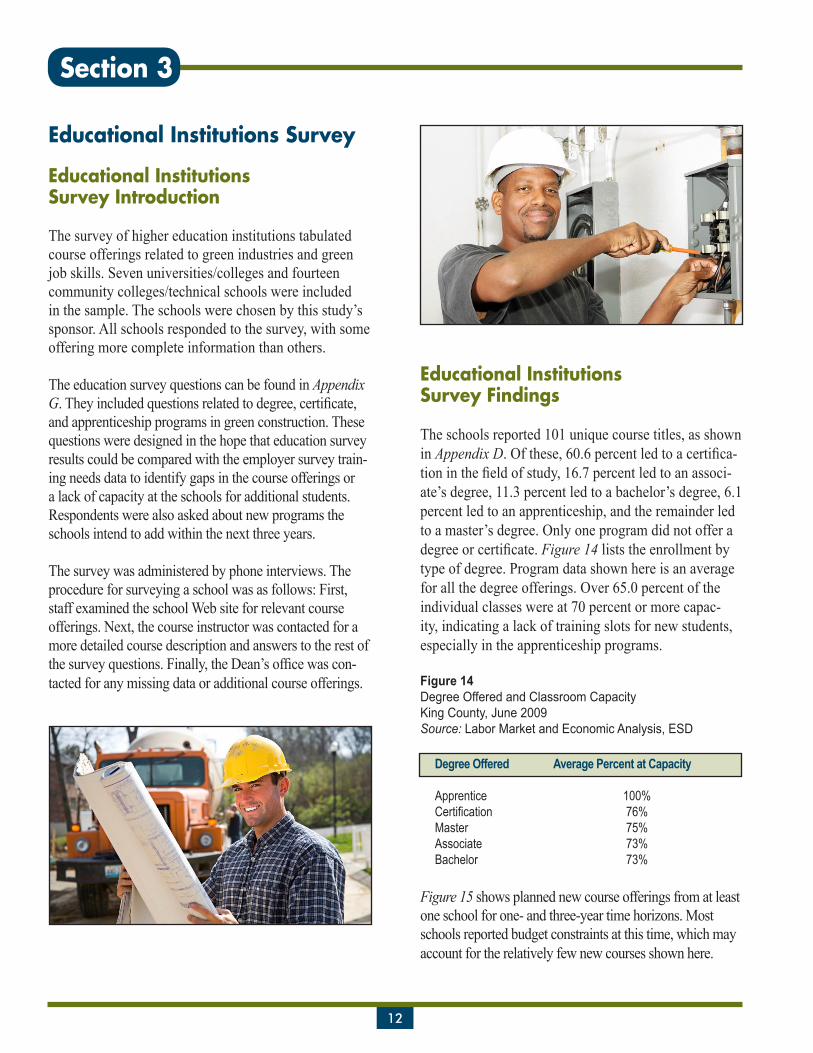
Educational Institutions Survey Introduction
The survey of higher education institutions tabulated course offerings related to green industries and green job skills. Seven universities/colleges and fourteen community colleges/technical schools were included in the sample. The schools were chosen by this study’s sponsor. All schools responded to the survey, with some offering more complete information than others.
The education survey questions can be found in Appendix G.Theyincludedquestionsrelatedtodegree,certificate,and apprenticeship programs in green construction. These questions were designed in the hope that education survey results could be compared with the employer survey train-ing needs data to identify gaps in the course offerings or a lack of capacity at the schools for additional students. Respondents were also asked about new programs the schools intend to add within the next three years.
The survey was administered by phone interviews. The procedure for surveying a school was as follows: First, staff examined the school Web site for relevant course offerings. Next, the course instructor was contacted for a more detailed course description and answers to the rest of thesurveyquestions.Finally,theDean’sofficewascon-tacted for any missing data or additional course offerings.
Educational Institutions Survey Findings
The schools reported 101 unique course titles, as shown in Appendix D.Ofthese,60.6percentledtoacertifica-tioninthefieldofstudy,16.7percentledtoanassoci-ate’s degree, 11.3 percent led to a bachelor’s degree, 6.1 percent led to an apprenticeship, and the remainder led to a master’s degree. Only one program did not offer a degreeorcertificate.Figure 14 lists the enrollment by type of degree. Program data shown here is an average for all the degree offerings. Over 65.0 percent of the individual classes were at 70 percent or more capac-ity, indicating a lack of training slots for new students, especially in the apprenticeship programs.
Figure 14 Degree Offered and Classroom CapacityKing County, June 2009Source: Labor Market and Economic Analysis, ESD
Degree Offered Average Percent at Capacity
Apprentice 100%Certification 76%Master 75%Associate 73%Bachelor 73%
Figure 15 shows planned new course offerings from at least one school for one- and three-year time horizons. Most schools reported budget constraints at this time, which may account for the relatively few new courses shown here.
13
Section 3
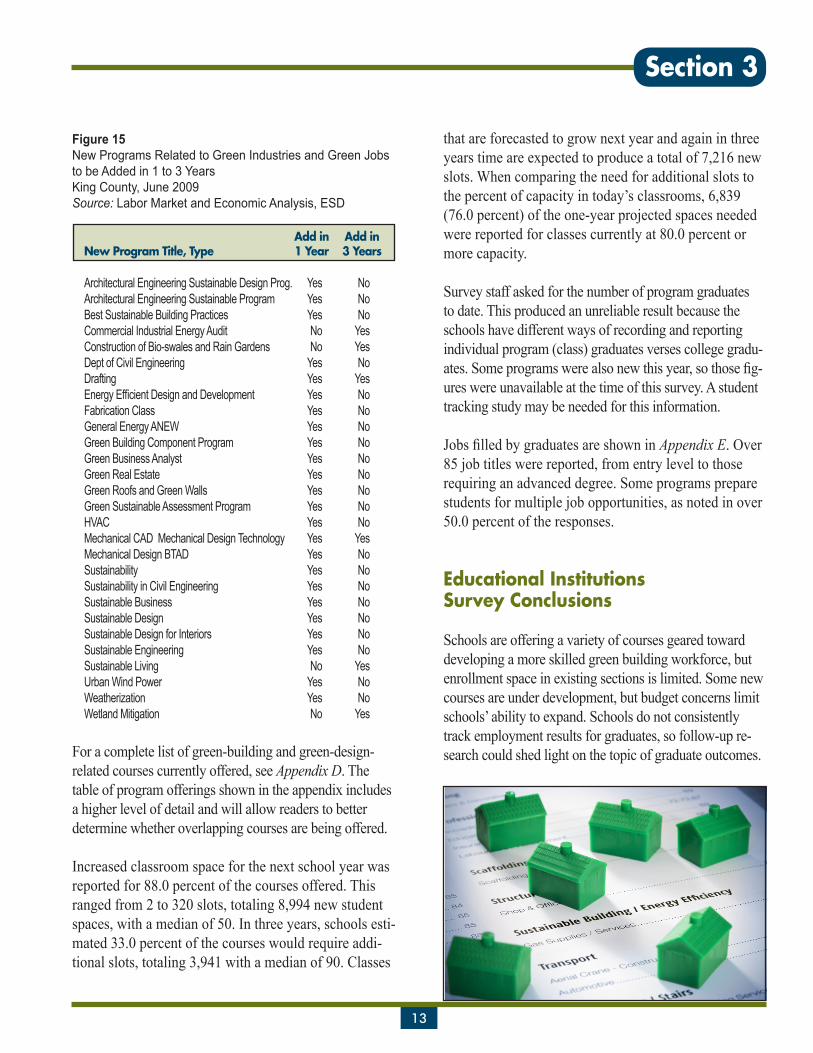
Figure 15 New Programs Related to Green Industries and Green Jobs to be Added in 1 to 3 YearsKing County, June 2009Source: Labor Market and Economic Analysis, ESD
Add in Add inNew Program Title, Type 1 Year 3 Years
Architectural Engineering Sustainable Design Prog. Yes NoArchitectural Engineering Sustainable Program Yes NoBest Sustainable Building Practices Yes NoCommercial Industrial Energy Audit No YesConstruction of Bio-swales and Rain Gardens No YesDept of Civil Engineering Yes NoDrafting Yes YesEnergyEfficientDesignandDevelopment Yes NoFabrication Class Yes NoGeneral Energy ANEW Yes NoGreen Building Component Program Yes NoGreen Business Analyst Yes NoGreen Real Estate Yes NoGreen Roofs and Green Walls Yes NoGreen Sustainable Assessment Program Yes NoHVAC Yes NoMechanical CAD Mechanical Design Technology Yes YesMechanical Design BTAD Yes NoSustainability Yes NoSustainability in Civil Engineering Yes NoSustainable Business Yes NoSustainable Design Yes NoSustainable Design for Interiors Yes NoSustainable Engineering Yes NoSustainable Living No YesUrban Wind Power Yes NoWeatherization Yes NoWetland Mitigation No Yes
For a complete list of green-building and green-design-related courses currently offered, see Appendix D. The table of program offerings shown in the appendix includes a higher level of detail and will allow readers to better determine whether overlapping courses are being offered.
Increased classroom space for the next school year was reported for 88.0 percent of the courses offered. This ranged from 2 to 320 slots, totaling 8,994 new student spaces, with a median of 50. In three years, schools esti-mated 33.0 percent of the courses would require addi-tional slots, totaling 3,941 with a median of 90. Classes
that are forecasted to grow next year and again in three years time are expected to produce a total of 7,216 new slots. When comparing the need for additional slots to the percent of capacity in today’s classrooms, 6,839 (76.0 percent) of the one-year projected spaces needed were reported for classes currently at 80.0 percent or more capacity.
Survey staff asked for the number of program graduates to date. This produced an unreliable result because the schools have different ways of recording and reporting individual program (class) graduates verses college gradu-ates.Someprogramswerealsonewthisyear,sothosefig-ures were unavailable at the time of this survey. A student tracking study may be needed for this information.
JobsfilledbygraduatesareshowninAppendix E. Over 85 job titles were reported, from entry level to those requiring an advanced degree. Some programs prepare students for multiple job opportunities, as noted in over 50.0 percent of the responses.
Educational Institutions Survey Conclusions
Schools are offering a variety of courses geared toward developing a more skilled green building workforce, but enrollment space in existing sections is limited. Some new courses are under development, but budget concerns limit schools’ ability to expand. Schools do not consistently track employment results for graduates, so follow-up re-search could shed light on the topic of graduate outcomes.

Job Vacancy Survey, Green Building Focus
Vacancies Among Potential Green- Building Industries in King County
The Green Building Panel was interested in job vacan-cies and growth projections for those jobs related to green-design and green-building sectors. Based on the sample design for this report’s business survey, thirteen six-digitNAICSindustrieswereidentifiedasrelatedto the green-design/green-building sector. Using these identifiedindustries,datawerepulledfromtheEm-ployment Security Department’s Washington State Job Vacancy Survey to examine characteristics of positions thatfirmswereactivelytryingtofill.
Figure 16 Industry Job Vacancies King County, June 2009Source: Labor Market and Economic Analysis, ESD
Estimated Newly Requiring Requiring Open6-Digit Job Full-Time Created Permanent Seasonal License or Previous BeyondNAICS IndustryTitle Vacancies Positions Positions Positions Positions Certificate Experience 60Days
236116 New Multi-Family Housing Construction 3 100% 0% 100% 0% 0% 100% 100% (exceptOperativeBuilders) 236117 NewHousingOperativeBuilders 3 100% 0% 100% 0% 0% 100% 0%236210 Industrial Building Construction 12 100% 0% 100% 0% 100% 100% 100%236220 Commercial and Institutional 34 100% 0% 100% 0% 55% 100% 0% Building Construction 237310 Highway, Street, and 25 75% 0% 60% 40% 25% 88% 0% Bridge Construction 238211 ElectricalContractorsandOther 12 100% 25% 100% 0% 25% 100% 0% Wiring Installation - Residential 238212 ElectricalContractorsandOther 47 87% 13% 100% 0% 33% 80% 20% Wiring Installation – Nonresidential 238221 Plumbing, Heating, and Air-Conditioning 3 100% 0% 100% 0% 100% 100% 0% Contractors – Residential 238222 Plumbing, Heating, and Air-Conditioning 28 100% 11% 100% 0% 44% 89% 0% Contractors – Nonresidential 541310 Architectural Services 8 100% 0% 100% 0% 0% 100% 33%541330 Engineering Services 130 100% 14% 98% 2% 33% 94% 27%541620 Environmental Consulting Services 58 100% 0% 100% 0% 68% 100% 27%562111 Solid Waste Collection 2 100% 0% 100% 0% 100% 0% 0%
Total 367 97% 8% 98% 2% 43% 93% 21%
The sample for the Job Vacancy Survey was not designed to represent vacancies at the very detailed level presented in this report. Therefore, the estimates presented herein may include sampling error and should be considered ap-proximations rather than very accurate point estimates.
Overall there were an estimated 367 vacant positions, the large majority of which were full time, permanent, and requiring previous experience. The openings were concentrated in three industries: engineering services, environmental consulting services, and residential electrical contractors. These three industries combined made up almost two-thirds of vacancies among poten-tially green builders.

Figure 17 Job Vacancy CharacteristicsKing County, June 2009Source: Labor Market and Economic Analysis, ESD
Theprevalenceofengineeringpositionsisreflectedintheeducational requirements of these potentially green jobs. Forty-one percent of openings asked for a bachelor’s degree, the education level requested far more often than any other.
Estimated Newly Requiring Requiring Open Job Full-Time Created Permanant Seasonal License or Previous BeyondEducationLevel Vacancies Positions Positions Positions Positions Certificate Experience 60Days
No Requirement 19 100% 0% 33% 67% 33% 100% 0%High School/GED 36 100% 17% 100% 0% 50% 67% 10%Some College 18 66% 15% 85% 15% 34% 85% 0%Assoc./Voc. Degree 12 100% 0% 100% 0% 0% 100% 0%Bachelor’s Degree 151 100% 11% 100% 0% 39% 96% 30%Graduate Degree 48 100% 6% 100% 0% 89% 100% 27%Other 19 100% 0% 100% 0% 50% 100% 50%No Response 66 91% 5% 100% 0% 24% 91% 0%
Total 367 97% 8% 98% 2% 43% 93% 21%
Againreflectingthelargenumberofengineeringpositions,theopeningstendedtobehighpaying,with53.0percentof-fering wages of $30 or more per hour.
Figure 18 Job Vacancy WagesKing County, June 2009Source: Labor Market and Economic Analysis, ESD
Estimated Newly Requiring Requiring Open Job Full-Time Created Permanant Seasonal License or Previous BeyondWageRange Vacancies Positions Positions Positions Positions Certificate Experience 60Days
$8.55 - $9.99/hr. - - - - - - - - $10 - $14.99/hr. 5 100% 0% 100% 0% 43% 57% 57%$15 - $19.99/hr. 9 100% 0% 100% 0% 70% 30% 0%$20 - $24.99/hr. 24 100% 13% 87% 13% 51% 100% 25%$25 - $29.99/hr. 8 100% 32% 100% 0% 100% 100% 63%$30.00/hr. and up 54 89% 6% 94% 6% 16% 100% 25%WageUnspecified 266 98% 8% 99% 1% 45% 93% 15%
Total 367 97% 8% 98% 2% 43% 93% 21%

When analyzing openings, it is important to distinguish between what constitutes “green-building industries” versus what constitutes “green-building occupations.” Manypeopleemployedinindustriesidentifiedaspoten-tially green provide support work, including computer software engineers, sales representatives, and econo-mists. The WDC prepared a list of occupations that it believes will have the highest likelihood of being linked with green design and green building. Occupational projections based on data from LMEA are provided in Appendix F. The top ten occupations based on num-ber of openings due to growth between 2007 and 2012 are shown in bold. Note that these projections are not specifically“green-buildingprojections.”Forexample,projections for the electrical engineering occupation covers all electrical engineers, not only those in the green-building industry – or even the building industry as a whole. The projections show far less growth than prior year projections. Even with anticipated green expansion, it will take time to recover from the cuts that followedthefinancialdownturn.Themajorityofoccu-pations with growth expected involve high-skill work. Laborer work, discussed in a prior section as one of the major no-education entry level, had a particularly poor showing in this round of near term projections.
Mostoftheopeningscamefromlargerfirms.Nearlytwo-thirdsofopeningswerewithcompaniesof100ormore.
Figure 19 Employer Size ClassKing County, June 2009Source: Labor Market and Economic Analysis, ESD
Estimated Newly Requiring Requiring OpenEmployer Job Full-Time Created Permanant Seasonal License or Previous BeyondSizeRange Vacancies Positions Positions Positions Positions Certificate Experience 60Days
<4 - - - - - - - - 4-9 3 100% 0% 100% 0% 100% 100% 0%10-19 3 100% 0% 100% 0% 0% 100% 0%20-49 55 100% 5% 100% 0% 69% 84% 54%50-99 81 92% 4% 100% 0% 50% 93% 11%100-249 113 100% 22% 98% 2% 46% 90% 12%250 & up 112 94% 0% 94% 6% 21% 100% 14%
Total 367 97% 8% 98% 2% 43% 93% 21%
Job Vacancy Survey and Projections Conclusions
The data from the JVS and the Occupational Projections show many potential green-building openings. These positionsareclusteredatlargerfirms,perhapsthoselarge enough to attract work associated with existing or expected stimulus funding. Many positions offer high salaries and, correspondingly, require higher-level degrees. Occupational projections show some expected growthinfieldswithapotentialtietogreenbuilding,butfew openings are anticipated in the near term, especially for entry-level jobs such as working as a laborer.

17
Section 4
Overall Conclusions
Employersreportsufficientjob-specificskillsamongthe majority of job candidates, perhaps due to an abun-dance of experienced, out-of-work labor due to high industry unemployment. The survey did reveal potential new job titles, but most respondents still accomplish greenworkusingemployeesclassifiedwithinexistingjobs. Even at the entry level, the majority of green-building positions require more than a high school di-ploma/GED. Employers seek overall green knowledge, ahandfulofin-demandcertifications,and“softskills”such as communication and strong work ethic.
Based on key comments from the open-ended questions attheendofthesurvey,firmshavebeenstrugglingwithlost revenues, and that in turn has affected their ability to hire, train, and keep staff. Businesses commented that the term “green” is used inconsistently by clients and competitors, and that the green label should clearly map to product features or measures of quality rather than merelyservingasatrendybuzzword.Multiplefirmsasked for more consistent codes and regulations across – and even within – jurisdictions. Lack of work ethic emerged as a concern, particularly in younger employees.
Schools are providing a number of green-building-relatedcourses,manyofthemfilledtonearcapac-ity. Apprenticeship programs are especially packed. Schools do not uniformly track graduate outcomes. Basedonavailabledata,itisdifficulttodeterminetheactual impact of training on graduates’ careers. Further research applying a consistent standard across multiple institutions could add much needed information.
Areviewofindustry-andregion-specificJobVacancySurvey (JVS) numbers showed a number of vacancies potentially associated with the green-building indus-try. Openings were most often for high-paying work forhighly-educatedemployeesworkingatlargefirms.Projectionsforselectedgreen-relatedfieldspredictsluggish growth or even declines in the construction industry, particularly for low-skilled occupations – but projectionsspecificallyforthegreen-buildingindustrydo not exist, and green growth may prove markedly dif-ferent from overall construction industry performance.

Appendices
18
Appendix A – Response Rate and NAICS Included in the Sample
Response Rate
Sample Summary Number of Establishments
Population of Establishments 5,961OriginalSampleDrawn 1,019Number of Firms in Sample (see Reasonbelow) 920
Reason Number of Establishments Percent In/Out of Sample
Survey Completed 477 46.8% InNo Response, Messages Left 329 32.3% InNo Green Products 70 6.9% InRefusal 33 3.2% InPartial Information 11 1.1% InUnreachable 49 4.8% OutOutofBusiness 30 2.9% OutOut-of-StateLocation 10 1.0% OutDuplicateLocation 6 0.6% OutInactive 4 0.4% Out
Total 1,019 100.0%
Results Response Rate
Number of Firms in Sample (see Reasonabove) 920Survey Completed 477No Green Products 70Partial Information 11
Total Response 558
ResponseRate 60.7%

Appendices
19
Appendix A – Response Rates and NAICS Included in the Sample (Continued)
NAICS Codes Included in the Sample
2007 NAICS Title NAICS Code Total Percent
NewSingle-FamilyHousingConstruction(exceptOperativeBuilders) 236115 107 10.5%NewMulti-FamilyHousingConstruction(exceptOperativeBuilders) 236116 8 0.8%NewHousingOperativeBuilders 236117 10 1.0%Residential Remodelers 236118 81 7.9%Industrial Building Construction 236210 4 0.4%Commercial and Institutional Building Construction 236220 96 9.4%Water and Sewer Line and Related Structures Construction 237110 44 4.3%Power and Communication Line and Related Structures Construction 237130 16 1.6%Highway, Street, and Bridge Construction 237310 32 3.1%Residential Glass and Glazing Contractors 238151 5 0.5%Nonresidential Glass and Glazing Contractors 238152 14 1.4%ResidentialRoofingContractors 238161 19 1.9%NonresidentialRoofingContractors 238162 8 0.8%Residential Siding Contractors 238171 7 0.7%Nonresidential Siding Contractors 238172 6 0.6%ResidentialElectricalContractorsandOtherWiringInstallationContractors 238211 27 2.6%NonresidentialElectricalContractorsandOtherWiringInstallationContractors 238212 50 4.9%Residential Plumbing, Heating, and Air-Conditioning Contractors 238221 35 3.4%Nonresidential Plumbing, Heating, and Air-Conditioning Contractors 238222 46 4.5%OtherNonresidentialBuildingEquipmentContractors 238292 7 0.7%Residential Drywall and Insulation Contractors 238311 18 1.8%Nonresidential Drywall and Insulation Contractors 238312 27 2.6%Residential Finish Carpentry Contractors 238351 20 2.0%Residential Site Preparation Contractors 238911 14 1.4%Architectural Services 541310 90 8.8%Engineering Services 541330 163 16.0%Drafting Services 541340 3 0.3%Industrial Design Services 541420 4 0.4%Environmental Consulting Services 541620 43 4.2%Solid Waste Collection 562111 2 0.2%OtherWasteCollection 562119 1 0.1%Remediation Services 562910 9 0.9%Materials Recovery Facilities 562920 3 0.3%
Total 1,019 100.0%

Appendices
20
Appendix B - Respondent Comments
Respondents were given an opportunity to make comments at the conclusion of each survey call in response to these questions:
n What types of training would you like to see local colleges or training programs include to better prepare job candidates for your company?
n Doyouhaveanyadditionalcommentsonyourworkforceneedsrelatedtogreenbuildingandenergyefficiency?
Comments of varying lengths were recorded in a free-form style. The most interesting quotes are collected here – pre-sented with minor edits for clarity or for the protection of privacy, and grouped by topic.
Training Needs
Design and Engineering u DifficultyfindingLEEDPrepclasses.Hasfoundonecompanythatprovidesclassesatareasonableprice.
u Feels that the high quality of architect candidates is very good in company’s geographical area and, with the Archi-tectIn-Trainingcertification,thereisupdatedtrainingyearly.
u FindingadeclineincandidatesinthefieldofElectricalEngineering.
u Green training is routinely provided. Would like job candidates to have formal business training to go along with theirfieldexperience,notjuston-the-jobexperience.
u Hardtofindengineerswhocanperformanalysisandproblemsolving.Shouldblendengineeringandanalyticalskills into the green world. Want to partner with unions for a better understanding of green.
u Has a Green Team that does training. Job candidates are highly educated, but there is an issue with language skills with applicants from outside the U.S.
u Hiresemployeesfromtechnicalschoolsbutfindsthattheyaregearedtowardamoreproductionmindsetinsteadofthe more creative, proactive mindset that the industry needs.
u Would like to see courses that focus on project management and engineering skills.
u Would like to see all architect degrees require computer drafting.
u Newgradshavesufficientskillsincomputers,CAD,3Drenderingsoftware,etc.,aswellasagoodconceptofgreentechnologies. Would like to see more innovative, forward thinking architectural designs added to college curriculum, i.e., straw bale construction.
u Wouldliketoseealicensingrequirementofallarchitectstohavesomeexperienceinthefield.Theyreceivegoodtraining in colleges but not the practical application necessary.

Appendices
21
Construction
u Would like to see colleges teach remodeling courses instead of just new construction.
u Has not had any success in hiring people from the community colleges’ carpentry classes.
u Would like to see more on-the-job intern training programs in the community colleges.
u Would like to see training of basic knowledge of electrical components. Some apprentices do not know this.
u ConcernedtherearenotenoughgoodHVAC-certifiedschoolsfortraining,especiallyintheNorthwest.Thereisagreat need for trained people in this specialty.
u The unions do a good job in their apprenticeship training programs.
u Has restructured business to become a subcontractor focusing on solar photovoltaic systems. Would like to see current trades people retrained in the skills required for solar photovoltaic installations and maintenance. Would like to encourage state and federal government to have more incentives to help get this industry started.
u HVAC-trained people are very much in demand in this highly competitive market. Would like to see more education-alfacilitiesofferthistraining.CurrentlyhavetohirefromYakimaor(distantschool).Difficulttofillneedfortrainedpeopleinthisfield.
u Would like to see an apprenticeship training program for non-union companies.
u Technical schools seem to do a good job, but not sure they are up to date on wiring techniques.
u Looking for classes to learn more on built-green techniques.
u Would like to teach high school students a course in applied basic construction math. That would make many of them more employable in the construction trades right out of high school.
u Would like more CEM prep programs for auditors.
u Does not feel carpentry is best offered at a college level but, if it is, it should include construction management with hands-on training. Also would like to see more vocational skills taught at the high school level instead of after graduation.
u Havein-housetrainingonjob-specificrecycleprograms.
u Difficulttogetpeopletocometoworkinthespecializedsheetmetalindustry.Thejobisnotconsideredglamorousenough to attract candidates easily.
u Thereisalotoftheoryaboutbuildinggreenbutnotspecificpracticalapplicationsavailable.
u Would like to see good education programs for minorities and women. They want to hire more women.
Appendix B - Respondent Comments (Continued)

Appendices
22
u Would like to see more job candidates with experience in Built Green home projects.
u Would like to see more training in solar and alternative energy.
u Would like to see the schooling and/or training for the trades incorporate spelling, reading, and writing into their courses.
u There should be more programs available to train electricians. The trade needs to be promoted more to attract and train much-needed skilled people.
u Definiteneedformorepeopleformallytrainedincarpentryskills.
u Would like to see the plumbing occupation/profession better promoted to attract more interested applicants.
u Need to train staff to recycle gypsum and steel on the worksite.
u Would like to see more energy modeling and simulation.
u Many job applicants are not up to date regarding proper job application procedures. What was accepted practice several years ago no longer is the format to follow.
u Thereisadefinitelackoftrainingforlabor,especiallysincehighschoolsnolongerofferthevocationalcoursesfrom which veteran employees received their training.
Young Applicants’ Work Readiness
u Schools give job candidates a good base, but on-the-job training and developing good work ethics are essential. Many of the younger generation do not have the work ethics that are expected of them.
u Difficulttofindyoungemployeeswhohavegoodworkethics,suchaspromptness,self-motivation,responsibility,andfollow-throughonjobtasks.Cantrainthetechnicalskillsbutfindingresponsibleemployeesismoredifficult.
u Concerned that there are not enough younger people interested in working in manual labor trades. Most younger people seem to want to work behind a desk using a computer.
u Younger generation needs to learn to communicate via phone or face to face, not just via email.
u Finds majority of young job candidates are not interested in labor-intensive positions such as plumbing and do not realize the importance of having a clean driving record.
u New college grads bring in new tools in energy modeling, helping veteran employees become aware of new cutting-edge technologies.
Appendix B – Respondent Comments (Continued)
Appendices
23
Industry Changes
u Current customers are more concerned with costs and less concerned with built green and LEED. In the current economy, clients are not as interested in incorporating green into their building costs as they were prior to the down-turn.
u There is a need to adopt green changes more expediently than is currently happening.
u Some of the green products in the industry are not really measurably more green.
u Design and sell transfer chutes to clean up air quality in the cement industry. u Hired a Project Manager to focus on green energy saving projects.
u Green is an expense upfront, but in the long-run it is a savings. Want to see more informational programs out there.
u Greentermisover-used.Lookingforgreentobemoredefined.
u LEEDpaperworkneedstobesimplified-tootime-consuming.
u Same type of job for same contractor will have quite different paperwork requirements. Needs to be standardized for all subcontractors.
u Customers are starting to be more aware and asking for us to provide suggestions about becoming more green. It is becoming an over-used term that doesn’t hold much value any more.
u Want to see green design and sustainable design move beyond the common notion of the point system. The point system has strengths but needs to be improved.
u Would like to see the LEED documentation break down resource management into further detail, such as docu-menting fuel costs to haul materials to work sites and then cost of fuel to haul to a recycling location.
u Wouldliketoknowwhatspecificallyquantifiesgreen.Forexample,aretherespecificguidelinesforsomethingbe-ing labeled energyefficient, and where would this information be located for reference?
u Theyarediscussinggreen(landscaped)roofs.
u Greenbuildingintheroofingindustryissuchanewtrendthatitisdifficulttofindgoodresourceinformation.
u The company used to have entry-level positions, but they have all been removed due to cutbacks.
u Companies cannot focus on green when they are just trying to survive.
u Would like to see it become more desirable for women to get into the electrical engineering industry.
Appendix B – Respondent Comments (Continued)

Appendices
24
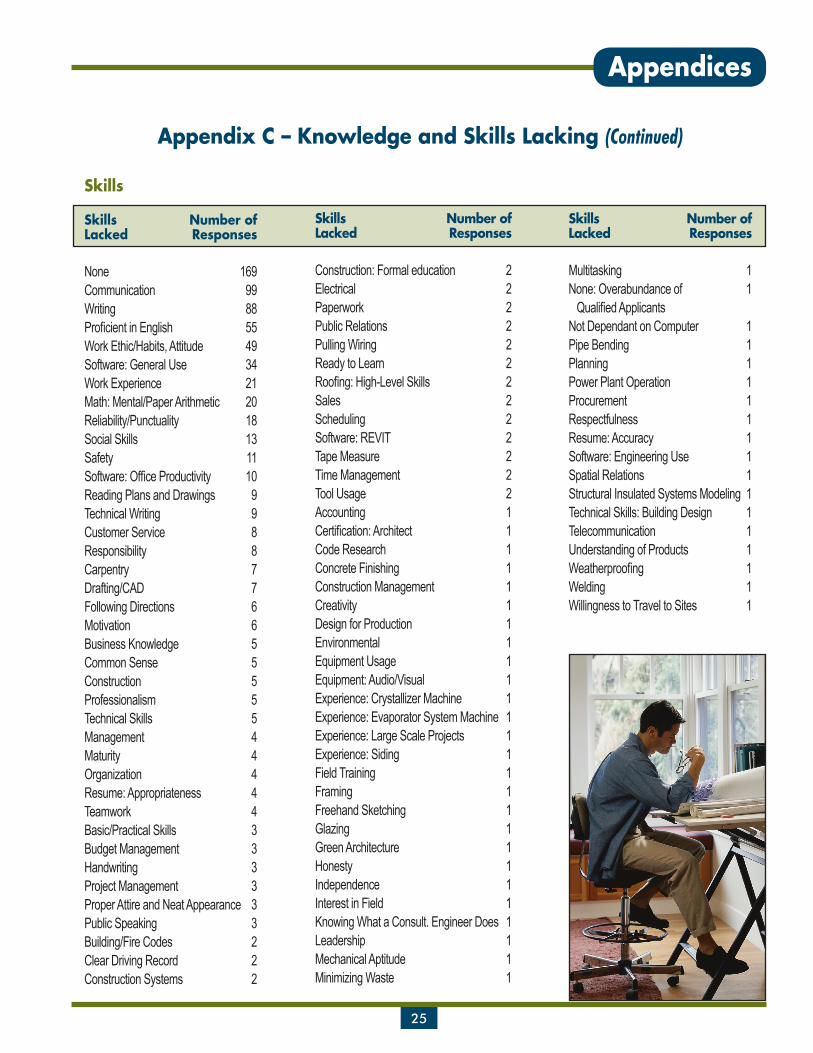
Appendix C – Knowledge and Skills Lacking
Knowledge Number ofLacked Responses
Experience, General or Green 55Certification:BuiltGreen,CEM,LEED,LID,Other 42Recycling 14General LEED Knowledge or Experience 12Energy Conservation, Conservation Systems, or 8 Conservation Budgeting Regulation, Legislation, or Legal Knowledge 7Building or Construction Design, General 5 or Sustainable Sustainability,GeneralorProduct-Specific 5 Knowledge General or Green Product Knowledge 5Erosion Control 4Material Waste Management and Reduction 4Engineering 3Environmental or Environmental Design 3Equipment 3Licensed 3Software 3Solar Systems 3Building Codes 2Business Experience 2Creative Thinking 2Emissions and Pollution Control or Emissions 2 Chemistry Energy Modeling and Simulation 2GlassEfficiencyandUV 2Water Quality 2Advanced or Specialized Green Knowledge 2Asbestos 1CAD 1Computers and Air Flow Control 1Construction Site Chemicals 1Renewable Energy 1
Knowledge Number ofLacked Responses
Mechanical Experience 1Fuel Costs 1Geothermal Heat Pumps 1GreenRoofing 1Green Plumbing 1Hazardous Waste Management 1Insulation 1Interdisciplinary 1Language and Practices 1LightingRetrofit 1Marketing 1MaterialsCertification 1More Well-Rounded 1OldTechniquesandPractices 1OptionAwareness 1Photovoltaic Installation 1Plumbing 1Quality Control 1Staying Current 1Storm Water Management Technology 1Technical Writing 1Technology 1Weatherization 1
The body of this report presented only a truncated list of responses to the knowledge skills lacked questions. The full list of responses can be found in the tables below. Note that a list of these responses broken out by respondents’ primary business type is also available. Contact the LMEA branch for further information.
Knowledge
Appendices
25
Appendix C – Knowledge and Skills Lacking (Continued)
Skills
Skills Number ofLacked Responses
None 169Communication 99Writing 88ProficientinEnglish 55Work Ethic/Habits, Attitude 49Software:GeneralUse 34Work Experience 21Math:Mental/PaperArithmetic 20Reliability/Punctuality 18Social Skills 13Safety 11Software:OfficeProductivity 10Reading Plans and Drawings 9Technical Writing 9Customer Service 8Responsibility 8Carpentry 7Drafting/CAD 7Following Directions 6Motivation 6Business Knowledge 5Common Sense 5Construction 5Professionalism 5Technical Skills 5Management 4Maturity 4Organization 4Resume:Appropriateness 4Teamwork 4Basic/Practical Skills 3Budget Management 3Handwriting 3Project Management 3Proper Attire and Neat Appearance 3Public Speaking 3Building/Fire Codes 2Clear Driving Record 2Construction Systems 2
Skills Number ofLacked Responses
Construction:Formaleducation 2Electrical 2Paperwork 2Public Relations 2Pulling Wiring 2Ready to Learn 2Roofing:High-LevelSkills 2Sales 2Scheduling 2Software:REVIT 2Tape Measure 2Time Management 2Tool Usage 2Accounting 1Certification:Architect 1Code Research 1Concrete Finishing 1Construction Management 1Creativity 1Design for Production 1Environmental 1Equipment Usage 1Equipment:Audio/Visual 1Experience:CrystallizerMachine 1Experience:EvaporatorSystemMachine 1Experience:LargeScaleProjects 1Experience:Siding 1Field Training 1Framing 1Freehand Sketching 1Glazing 1Green Architecture 1Honesty 1Independence 1Interest in Field 1Knowing What a Consult. Engineer Does 1Leadership 1Mechanical Aptitude 1Minimizing Waste 1
Skills Number ofLacked Responses
Multitasking 1None:Overabundanceof 1QualifiedApplicantsNot Dependant on Computer 1Pipe Bending 1Planning 1PowerPlantOperation 1Procurement 1Respectfulness 1Resume:Accuracy 1Software:EngineeringUse 1Spatial Relations 1Structural Insulated Systems Modeling 1TechnicalSkills:BuildingDesign 1Telecommunication 1Understanding of Products 1Weatherproofing 1Welding 1Willingness to Travel to Sites 1

Appendices
26
Two-Year Institutions
Program of Study Associate Apprentice Bachelor Certification
Advanced Arc Welding 1AHERA Building Inspector Refresher 1AHERA Management Planner Refresher 1AHERA Project Designer Refresher 1Architectural Engineering Drafting Program 1Asbestos Supervisor 1Asbestos Supervisor Refresher 2Asbestos Worker Refresher 2Basic Arc and Flame 1Bio-Energy Technology 1Building and Plant Maintenance 1 1Carpenter 1 Civil CADD 1Civil and Mechanical Engineer Degree 1 Clean Energy Technology 1Commercial Building Engineer 1Commercial Industrial Energy Audit 1Diesel and Heavy Equipment Technician 1 1Digital Electronics Technician 1Drafting Design 3 1Drafting Design 1Electrician 1Electronics Technician 1 1Energy and Science Technician 1 Energy Audit Residential 1Energy Management Specialist 1Energy Technology 1Engineering Design Technology 2Engineering Graphics Program 3 3Environmental Horticulture 1 EnvironmentalHorticultureCertificateofProficiency 1Environmental Issues and Problems 1 Environ.TechnologiesandSustainablePractices-Bus.Emphasis 1 Environ.TechnologiesandSustainablePractices-Tech.Emphasis 1 GIS 1 Glaziers 1 Green Business Analyst 1GreenRealEstateCertificate 1Green Sustainable Design 1
Appendix D – Programs of Study

Appendices
27
Appendix D – Programs of Study (Continued)
Two-Year Institutions
Program of Study Associate Apprentice Bachelor Certification
HAZWOPER 1HAZWOPERRefresher 1HeavyEquipmentOperator 1 HVAC 1 HVAC 2Industrial Laboratory 1Industrial Engineer 1Interior Design 1 Interior Design CAD 1Intermediate Arc and Flame 1Intermediate Construction Management Skills 1Introduction to Construction and Architecture 1Introduction to Professional Woodworking 1 1Landscape 1Lead Inspector 1Lead Inspector Refresher 1Lead Risk Assessor 1Lead Risk Assessor Refresher 1Lead Supervisor 1Lead Supervisor Refresher 1Lead Worker 1Lead Worker Refresher 1Life Sciences 1 1Mechanical Design 1 Painting 1 PhotovoltaicDesignerCertificate 1Photovoltaic Principals 1 Plumbing 1 Pre-Apprenticeship Construction Training 2Residential and Light Commercial Carpentry 1 1Residential Concrete Forming and Placement 1Residential Energy Audit Class 1Residential Exterior Finish Level 1 1Residential Interior Design 1Residential Interior Finish Level 1 1Residential Interior Finish Level 2 1Residential Light and Commercial Framing 1 1Residential Light and Commercial Framing 2 1Sheet Metal 1 Solar Photovoltaic System Specialist 1

Appendices
28
Two-Year Institutions
Program of Study Associate Apprentice Bachelor Certification
Sustainable Design 1Sustainable Design for Interiors 1Water Quality 1 Welding 1 Welding 1Wetland Mitigation 1
Total 22 8 1 73
Percent 21.0% 8.0% 1.0% 70.0%
Four-Year Institutions
Program of Study BA BS Certification MA/MS/MBA None
Civil and Environmental Engineer 2 Civil Engineer 6 Computer Science 1 Construction and the Environment 2 Ecointensive Agriculture 1 1Ecological Planning and Design 1 Electrical Engineering 1 Electrical Engineering Elective Course 1 Engineer 1 Environment and Community 1 Environmental Science 1 LEEDCertificationandExamPreparation 1 Project Management 1 3 1 ProjectManagementClass;LEEDCertificationProcess 1 Sustainable Business 1 1 Sustainable Construction 1
Total 1 13 7 7 1
Percent 3.0% 45.0% 24.0% 24.0% 3.0%
Appendix D – Programs of Study (Continued)

Appendices
29
Appendix E – Jobs Filled by Graduates Post Completion
Area Program(s) Jobs Filled by Graduates Post Completion
Environmental AHERA Building Inspector Refresher AHERA Building Inspector Environmental AHERA Management Planner Refresher AHERA Management Planner Environmental AHERA Project Designer Refresher AHERA Project DesignerWood Construction Introduction to Professional Woodworking All Areas of Construction, Estimators, and SuppliersWood Construction Introduction to Professional Woodworking All Areas of Construction, Estimators, and SuppliersArchitecture Drafting Design ArchitectBuilding Engineer Information Technology Engineering Design Technology Program Architect Drafters, Architect Designers, BIM Modeling, and Revit ModelingEnvironmental Asbestos Supervisor Asbestos SupervisorEnvironmental Asbestos Supervisor Refresher Asbestos Supervisor Environmental Asbestos Worker Refresher Asbestos WorkerBuilding Engineer Information Technology Architectural Engineering Drafting Program BIM Modeling, Revit Modelers, Civil Drafters, and Engineering DraftersHVAC Brownsfield BrownsfieldTechniciansConstructionandBldg.Technology CommercialBuildingEngineering BuildingMaintenanceOperations,ControlTechnician, RefrigerationTechnician,andBoilerOperators ComputerAidedDraftingandDesign CADDOperator,Draftsman,andCADDesigner Technology(CAD)(TDR) CADDOperator,Draftsman,andCADDesignerConstruction Carpenter CarpenterCarpentry Technology Residential and Light Commercial Carpentry Carpenter Carpentry Technology Intermediate Construction Management Skills Carpenter HelperCarpentry Technology Residential Concrete Forming and Placement Carpenter HelperCarpentry Technology Residential Exterior Finish Level 1 Carpenter HelperCarpentry Technology Residential Interior Finish Level 1 Carpenter HelperCarpentry Technology Residential Interior Finish Level 2 Carpenter HelperCarpentry Technology Residential Light and Commercial Framing 1 Carpenter HelperCarpentry Technology Residential Light and Commercial Framing 2 Carpenter HelperCivil Engineering Drafting Design Civil EngineerDepartment of Civil Engineering Construction and the Environment Civil Engineer, Project Manager, Environmental, Structural, and Transportation Engineers. The Undergraduate Advisor 1, 5, and 10-Year Follow-up Program.Department of Civil Engineering Civil and Environmental Engineering Civil Engineer, Project Manager, Environmental, Structural, and Transportation Engineers. The Undergraduate Advisor 1, 5, and 10-Year Follow-up Program.Structural Engineering and Mechanics Civil Engineering Civil Engineer, Project Manager, Environmental, Structural, and Transportation Engineers. The Undergraduate Advisor 1, 5, and 10-Year Follow-up Program.Engineering Civil and Mechanical Engineer Degree Civil Engineer, Mechanical Engineer

Appendices
30
Appendix E – Jobs Filled by Graduates Post Completion (Continued)
Area Program(s) Jobs Filled by Graduates Post Completion
GreenBuilding/Environmental Pre-ApprenticeshipConstructionTraining ConstructionTrades/GreenBuilding/EnergyEfficiency 90% of Graduates are Placed Into Apprenticeships. Graduates are Followed Through Their Apprenticeship Through Personal Follow-up and the Washington State Department of Labor and Industries Apprenticeship DatabaseSustainableTechnology SustainableBusiness CorporateSustainabilityOfficer,SustainableBusiness Manager, Sustainability Analyst, Sustainability Coordinator, and Sustainable Business ConsultantArchitectural Graphics Engineering Graphics Program Designer LevelCivil Engineering Graphics Engineering Graphics Program Designer LevelEngineering Graphics Engineering Graphics Program Designer LevelEnvironmental Diesel and Heavy Equipment Technician Diesel and Heavy Equipment TechnicianDrafting Drafting Design Drafting DesignerLife Science Ecointensive Agriculture Ecosystem Management, Forestry and Agriculture Management,and Resource ConservationConstruction Electrician ElectricianEnvironmental Environmental Horticulture Employment in Landscaping Firms, Garden Centers, Nurseries, Public and Private Gardens and GreenhousesEnvironmental EnvironmentalHorticultureCertificate EmploymentinLandscapingFirms,GardenCenters, ofProficiency Nurseries,PublicandPrivateGardensandGreenhousesApplied Science Commercial Industrial Energy Audit Energy AuditorEnergy Modeling, Auditing or Energy Management Specialist Energy Auditor, Energy Analyst, Building Technician, Management ResourceConservationManager,EfficiencyManager, MeasurementandVerificationTechnician,andSystems TechnicianApplied Science Environmental Technologies and Energy Auditor, Energy Analyst, Building Technician, SustainablePractices–BusinessEmphasis ResourceConservationManager,EfficiencyManager, MeasurementandVerificationTechnician,Systems TechnicianComputer Science Computer Science Engineering with Public Utility, and Green Engineering Electrical Engineering Electrical Engineering Engineering with Public Utility, and Green Engineering Engineering Engineering Engineering with Public Utility, and Green Engineering Architectural Graphics Engineering Graphics Program Entry-Level Positions in the Architecture, Civil Engineering or Engineering Graphics FieldCivil Engineering Graphics Engineering Graphics Program Entry-Level Positions in the Architecture, Civil Engineering or Engineering Graphics FieldEngineering Graphics Engineering Graphics Program Entry-Level Positions in the Architecture, Civil Engineering or Engineering Graphics FieldEngineering Graphics Mechanical Design Entry-Level Positions in the Architecture, Civil Engineering or Engineering Graphics Field

Appendices
31
Appendix E – Jobs Filled by Graduates Post Completion (Continued)
Area Program(s) Jobs Filled by Graduates Post Completion
Built Green Green Business Analyst Environmental ConsultantEnvironmental Environmental Science Environmental Consultant, Environmental Research, Wildlife Management, and Forestation RenewalBuilt Green Green Sustainable Design Environmental DesignerEnvironmental Science Life Sciences Environmental TechnicianNatural Resources Water Quality Environmental TechnicianApplied Science Wetland Mitigation Environmental TechnicianWeatherization Glaziers Glaziers and WelderEnvironmental HAZWOPER HAZWOPEREnvironmental HAZWOPERRefresher HAZWOPERConstruction HeavyEquipmentOperator HeavyEquipmentOperatorEnergy Management HVAC HVAC TechnicianEnvironment EnvironmentandCommunity InterdisciplinaryDegreesoAppliestoManyOccupationalAreasOtherSustainableBuilding InteriorDesign InteriorDesign,ResidentialorCommercialConstruction and RemodelingOtherSustainableBuilding InteriorDesignCAD InteriorDesign,ResidentialorCommercialConstruction and RemodelingOtherSustainableBuilding ResidentialInteriorDesign InteriorDesign,ResidentialorCommercialConstruction and RemodelingOtherSustainableBuilding SustainableDesign InteriorDesign,ResidentialorCommercialConstruction and RemodelingInterior Design Sustainable Design for Interiors Interior Designer and Sustainable Design ConsultantEnvironmental Lead Inspector Lead InspectorEnvironmental Lead Inspector Refresher Lead InspectorEnvironmental Lead Risk Assessor Lead Risk AssessorEnvironmental Lead Risk Assessor Refresher Lead Risk AssessorEnvironmental Lead Supervisor Lead SupervisorEnvironmental Lead Supervisor Refresher Lead SupervisorEnvironmental Lead Worker Lead WorkerEnvironmental Lead Worker Refresher Lead Worker BuildingandPlantMaintenance BuildingandPlantMaintenance MaintenanceTechnicianandFacilitiesEngineer(HVAC)BuildingandPlantMaintenance BuildingandPlantMaintenance MaintenanceTechnicianandFacilitiesEngineer(HVAC)Mechanical Engineering Drafting Design Mechanical EngineerEnergy Auditing Residential Energy Audit Class Mechanical Engineer Manuf. and Product Service Technology Industrial Engineering Millwrights, Maintenance Technician and Maintenance Mechanic BuildingEngineerInformationTechnology GreenRealEstateCertificate NoneYetEnvironmentalScience EnvironmentalIssuesandProblems OpenAnyAreaConstruction Painting PaintingNatural Resources GIS Planner, GIS Technician

Appendices
32
Appendix E – Jobs Filled by Graduates Post Completion (Continued)
Area Program(s) Jobs Filled by Graduates Post Completion
ConstructionManagement LEEDCertificationEXAMpreparation ProjectEngineerandConstructionManagerConstruction Management Sustainable Construction Project Engineer and Construction ManagerConstructionManagement ProjectMgmt.Class/LEEDCertificationProcess ProjectEngineerswithBSConstruction Project Management Project Manager in Construction, Consulting, and DesignConstruction and Building Technology Introduction to Construction and Architecture Project Manager, Assistant Project Manager, Project Engineer, Construction Inspector, and Superintendent Construction Management Project Management Project Manager and Building Contractor HVAC HVAC Residential HVAC Technology, Service Technician, Parts Technician, Sales, and InstallersLandscape Horticulture Landscape Self Employed Landscape Construction Designer and InstallersConstruction Sheet Metal Sheet Metal WorkerManufacturing and Product Service Technology Welding Ship Building, Fabrication, Iron Worker, and Pipe FittersSolar/Photovoltaic Design Solar Photovoltaic System Specialist Solar PV System SpecialistElectrical Photovoltaic Principals Solar TechniciansEnvironment Ecological Planning and Design Supplements Previous DegreeEnergyandScienceTechnicianProgram Bio-EnergyTechnology TechnicianforOilandGasCompanies,Environmental Positions in Public and Private Jobs, and Technical RepresentativesEnergyandScienceTechnicianProgram EnergyandScienceTechnician TechnicianforOilandGasCompanies,Environmental Positions in Public and Private Jobs, and Technical RepresentativesEnergyandScienceTechnicianProgram EnergyTechnology TechnicianforOilandGasCompanies,Environmental Positions in Public and Private Jobs, and Technical RepresentativesEnergyandScienceTechnicianProgram Industrial/Laboratory TechnicianforOilandGasCompanies,Environmental Positions in Public and Private Jobs, and Technical RepresentativesEnergyManagement DigitalElectronicsTechnician TechniciansinManyAreasSuchas:Biomedicaland PharmaceuticalLaboratories,ManufacturingOperations,Oil and Gas Companies, Environmental Positions in Public and Private Jobs, and Technical RepresentativesEnergyManagement ElectronicsTechnician TechniciansinManyAreasSuchas:Biomedicaland PharmaceuticalLaboratories,ManufacturingOperations,Oil and Gas Companies, Environmental Positions in Public and Private Jobs, and Technical Representatives
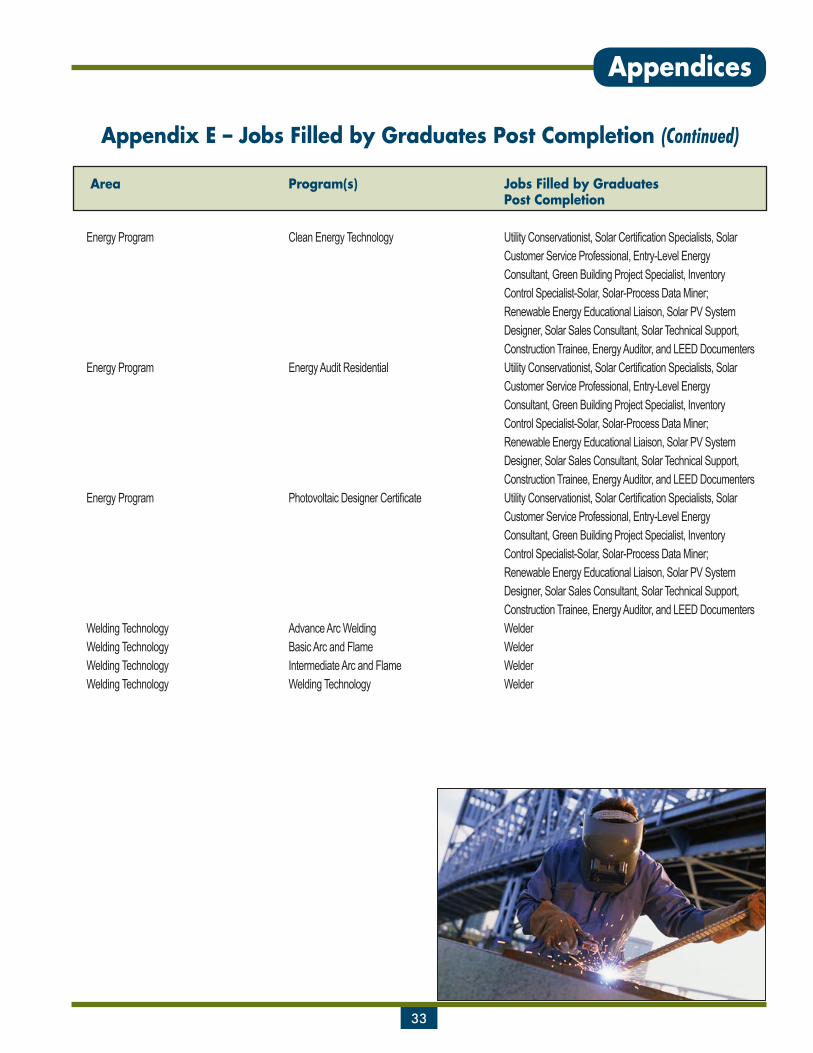
Appendices
33
Appendix E – Jobs Filled by Graduates Post Completion (Continued)
Area Program(s) Jobs Filled by Graduates Post Completion
EnergyProgram CleanEnergyTechnology UtilityConservationist,SolarCertificationSpecialists,Solar Customer Service Professional, Entry-Level Energy Consultant, Green Building Project Specialist, Inventory Control Specialist-Solar, Solar-Process Data Miner; Renewable Energy Educational Liaison, Solar PV System Designer, Solar Sales Consultant, Solar Technical Support, Construction Trainee, Energy Auditor, and LEED DocumentersEnergyProgram EnergyAuditResidential UtilityConservationist,SolarCertificationSpecialists,Solar Customer Service Professional, Entry-Level Energy Consultant, Green Building Project Specialist, Inventory Control Specialist-Solar, Solar-Process Data Miner; Renewable Energy Educational Liaison, Solar PV System Designer, Solar Sales Consultant, Solar Technical Support, Construction Trainee, Energy Auditor, and LEED DocumentersEnergyProgram PhotovoltaicDesignerCertificate UtilityConservationist,SolarCertificationSpecialists,Solar Customer Service Professional, Entry-Level Energy Consultant, Green Building Project Specialist, Inventory Control Specialist-Solar, Solar-Process Data Miner; Renewable Energy Educational Liaison, Solar PV System Designer, Solar Sales Consultant, Solar Technical Support, Construction Trainee, Energy Auditor, and LEED DocumentersWelding Technology Advance Arc Welding WelderWelding Technology Basic Arc and Flame WelderWelding Technology Intermediate Arc and Flame WelderWelding Technology Welding Technology Welder

Appendices
34
Appendix F – Occupational Projections
Avg. Avg. Avg. Ave. Annual Annual Avg. Avg. Annual Annual Open Open Annual Annual Growth Growth Due to Due to Total Total Est. Est. Est. Rate Rate Growth Growth Open Open Emp. Emp. Emp. 2007- 2012- 2007- 2012- 2007- 2012-SOC OccupationalTitle 2007 2012 2017 2012 2017 2012 2017 2012 2017
11-9021 Construction Managers 4,747 4,599 4,946 -0.6% 1.5% -30 69 30 15511-9041 Engineering Managers 2,445 2,409 2,515 -0.3% 0.9% -7 21 34 7913-1051 Cost Estimators 2,049 1,960 2,086 -0.9% 1.3% -18 25 21 6917-0000 ArchitectureandEngineeringOccupations 39,566 40,399 42,455 0.4% 1.0% 165 412 990 1,38617-1000 Architects,Surveyors,andCartographers 4,325 4,688 5,185 1.6% 2.0% 72 100 157 20817-1011 Architects,ExceptLandscapeandNaval 3,015 3,272 3,620 1.6% 2.0% 51 70 105 14017-1012 Landscape Architects 690 750 830 1.7% 2.0% 12 16 24 3217-1022 Surveyors 456 493 546 1.6% 2.1% 7 11 21 2717-2000 Engineers 25,811 26,174 27,335 0.3% 0.9% 73 232 611 86117-2051 CivilEngineers 5,722 6,025 6,572 1.0% 1.8% 61 109 212 27717-2071 Electrical Engineers 1,406 1,446 1,506 0.6% 0.8% 8 12 38 4917-2081 Environmental Engineers 721 771 839 1.4% 1.7% 10 14 31 3817-2141 Mechanical Engineers 2,735 2,775 2,892 0.3% 0.8% 8 23 64 8817-3000 Drafters, Engineering, and Mapping Technicians 9,430 9,537 9,935 0.2% 0.8% 20 80 222 31717-3011 ArchitecturalandCivilDrafters 1,849 1,975 2,189 1.3% 2.1% 25 43 80 10117-3013 Mechanical Drafters 773 765 763 -0.2% -0.1% -2 0 20 2217-3022 Civil Engineering Technicians 667 689 734 0.7% 1.3% 4 9 15 2517-3023 Electrical and Electronic Engineering Technicians 934 910 997 -0.5% 1.8% -5 17 10 3817-3025 Environmental Engineering Technicians 213 218 245 0.5% 2.4% 1 5 5 1017-3027 Mechanical Engineering Technicians 745 743 779 -0.1% 1.0% 0 7 12 2417-3031 Surveying and Mapping Technicians 848 935 1,041 2.0% 2.2% 17 21 33 4027-1025 Interior Designers 969 1,049 1,189 1.6% 2.5% 16 28 42 5841-9021 Real Estate Brokers 1,105 1,090 1,098 -0.3% 0.1% -3 2 12 2241-9022 RealEstateSalesAgents 3,444 3,544 3,613 0.6% 0.4% 20 14 66 8147-2000 Construction Trades Workers 62,293 58,795 63,946 -1.1% 1.7% -701 1,032 403 2,16347-2021 Brickmasons and Blockmasons 545 487 550 -2.2% 2.5% -12 13 0 2447-2022 Stonemasons 448 404 456 -2.0% 2.5% -9 10 0 1947-2031 Carpenters 18,288 16,902 18,513 -1.6% 1.8% -277 322 0 59147-2041 Carpet Installers 343 340 371 -0.2% 1.8% -1 6 3 1247-2042 Floor Layers, Except Carpet, Wood, and Hard Tiles 361 354 390 -0.4% 2.0% -1 7 3 1347-2043 Floor Sanders and Finishers 63 65 72 0.6% 2.1% 0 1 1 247-2044 Tile and Marble Setters 813 783 887 -0.7% 2.5% -6 21 4 3547-2051 Cement Masons and Concrete Finishers 1,028 952 1,075 -1.5% 2.5% -15 25 13 5447-2061 Construction Laborers 8,554 7,983 8,836 -1.4% 2.1% -114 171 0 24547-2071 Paving,Surfacing,TampingEquipmentOperators 151 148 169 -0.4% 2.7% -1 4 2 847-2073 OperatingEngineersandOtherEquipmentOperators 3,441 3,242 3,602 -1.2% 2.1% -40 72 19 14447-2081 Drywall and Ceiling Tile Installers 2,188 1,975 2,155 -2.0% 1.8% -43 36 0 6847-2082 Tapers 1,414 1,268 1,373 -2.2% 1.6% -29 21 0 4247-2111 Electricians 5,283 5,400 5,615 0.4% 0.8% 23 43 153 19247-2121 Glaziers 1,091 988 1,087 -2.0% 1.9% -21 20 0 3947-2131 Insulation Workers, Floor, Ceiling, and Wall 83 75 83 -2.0% 2.0% -2 2 0 447-2132 Insulation Workers, Mechanical 266 255 273 -0.8% 1.4% -2 4 4 1047-2141 Painters, Construction and Maintenance 6,012 5,531 5,962 -1.7% 1.5% -96 86 0 19547-2142 Paperhangers 83 81 85 -0.5% 1.0% 0 1 1 347-2151 Pipelayers 608 588 642 -0.7% 1.8% -4 11 7 25

Appendices
35
Appendix F – Occupational Projections (Continued)
Avg. Avg. Avg. Ave. Annual Annual Avg. Avg. Annual Annual Open Open Annual Annual Growth Growth Due to Due to Total Total Est. Est. Est. Rate Rate Growth Growth Open Open Emp. Emp. Emp. 2007- 2012- 2007- 2012- 2007- 2012-SOC OccupationalTitle 2007 2012 2017 2012 2017 2012 2017 2012 2017
47-2152 Plumbers,Pipefitters,andSteamfitters 4,905 5,045 5,244 0.6% 0.8% 28 40 123 15447-2161 Plasterers and Stucco Masons 817 758 799 -1.5% 1.1% -12 8 5 2847-2171 Reinforcing Iron and Rebar Workers 433 432 481 0.0% 2.2% 0 10 10 2247-2181 Roofers 1,800 1,616 1,837 -2.1% 2.6% -37 44 0 8647-2211 Sheet Metal Workers 1,927 1,907 2,027 -0.2% 1.2% -4 24 41 7447-2221 Structural Iron and Steel Workers 1,151 1,040 1,175 -2.0% 2.5% -22 27 12 6447-3000 Helpers, Construction Trades 2,414 2,179 2,416 -2.0% 2.1% -46 47 15 10347-3011 Helpers--Brickmasons, Stonemasons, Tile Setters 367 326 370 -2.3% 2.6% -8 9 1 1747-3012 Helpers--Carpenters 785 691 785 -2.5% 2.6% -19 19 1 3747-3013 Helpers--Electricians 75 73 80 -0.5% 1.8% 0 1 2 347-3014 Helpers--Painters, Plasterers, and Stucco Masons 388 343 368 -2.4% 1.4% -9 5 1 1447-3015 Helpers--Plumbers,Pipefitters,Steamfitters 305 309 326 0.3% 1.1% 1 3 9 1147-3016 Helpers--Roofers 322 281 315 -2.7% 2.3% -8 7 0 1447-3019 Helpers,ConstructionTrades,AllOther 172 156 172 -1.9% 2.0% -3 3 1 747-4000 OtherConstructionandRelatedWorkers 3,169 3,239 3,505 0.4% 1.6% 14 53 76 12547-4011 Construction and Building Inspectors 1,105 1,138 1,226 0.6% 1.5% 7 18 25 4247-4021 Elevator Installers and Repairers 50 52 54 0.8% 0.8% 0 0 1 247-4031 Fence Erectors 276 273 308 -0.2% 2.4% -1 7 4 1347-4041 Hazardous Materials Removal Workers 669 747 849 2.2% 2.6% 16 20 31 3747-4051 Highway Maintenance Workers 442 434 437 -0.4% 0.1% -2 1 5 1047-4071 Septic Tank Servicers and Sewer Pipe Cleaners 151 151 157 0.0% 0.8% 0 1 3 447-4099 ConstructionandRelatedWorkers,AllOther 438 406 436 -1.5% 1.4% -6 6 6 1647-5000 Extraction Workers 105 91 90 -2.8% -0.2% -3 0 0 253-7081 Refuse and Recyclable Material Collectors 616 644 684 0.9% 1.2% 6 8 23 2553-7199 MaterialMovingWorkers,AllOther 871 852 870 -0.4% 0.4% -4 4 10 2147-3000 Helpers, Construction Trades 2,414 2,179 2,416 -2.0% 2.1% -46 47 15 10347-3011 Helpers--Brickmasons, Stonemasons, Tile Setters 367 326 370 -2.3% 2.6% -8 9 1 1747-3012 Helpers--Carpenters 785 691 785 -2.5% 2.6% -19 19 1 3747-3013 Helpers--Electricians 75 73 80 -0.5% 1.8% 0 1 2 347-3014 Helpers--Painters, Plasterers, and Stucco Masons 388 343 368 -2.4% 1.4% -9 5 1 1447-3015 Helpers--Plumbers,Pipefitters,Steamfitters 305 309 326 0.3% 1.1% 1 3 9 1147-3016 Helpers--Roofers 322 281 315 -2.7% 2.3% -8 7 0 1447-3019 Helpers,ConstructionTrades,AllOther 172 156 172 -1.9% 2.0% -3 3 1 747-4000 OtherConstructionandRelatedWorkers 3,169 3,239 3,505 0.4% 1.6% 14 53 76 12547-4011 Construction and Building Inspectors 1,105 1,138 1,226 0.6% 1.5% 7 18 25 4247-4021 Elevator Installers and Repairers 50 52 54 0.8% 0.8% 0 0 1 247-4031 Fence Erectors 276 273 308 -0.2% 2.4% -1 7 4 1347-4041 Hazardous Materials Removal Workers 669 747 849 2.2% 2.6% 16 20 31 3747-4051 Highway Maintenance Workers 442 434 437 -0.4% 0.1% -2 1 5 1047-4071 Septic Tank Servicers and Sewer Pipe Cleaners 151 151 157 0.0% 0.8% 0 1 3 447-4099 ConstructionandRelatedWorkers,AllOther 438 406 436 -1.5% 1.4% -6 6 6 1647-5000 Extraction Workers 105 91 90 -2.8% -0.2% -3 0 0 253-7081 Refuse and Recyclable Material Collectors 616 644 684 0.9% 1.2% 6 8 23 2553-7199 MaterialMovingWorkers,AllOther 871 852 870 -0.4% 0.4% -4 4 10 21

Appendices
36
3. How many employees does your company have?
Full-time: Part-time:
Seattle-King County Green Building Jobs Survey Questions for Employers
About This Survey:
This survey is being conducted by the Labor Market and Economic Analysis branch of the Wash-ington State Employment Security Department in partnership with the Workforce Development Council of Seattle-King County and the Seattle-King County Green Building and Green Building Industry Skill Panel.
In Seattle-King County, there is an increasing trend to build new or retrofit existing buildings that meet greener standards for energy efficiency, site development, materials, water savings, and air quality. This trend may promise significant job growth for our region.
We want to learn from you and other employers in the industry if unique, new green jobs are emerging in response to the trend and if you are seeing more demand for particular existing jobs. Job demand and related job skill information will help policymakers and education leaders bet-ter prepare the local workforce to meet your needs. Individual responses will be kept completely confidential.
Person Completing this Survey:
Contact: Title:
Company: Phone: ( )
Email:
1. What is your primary business?
Construction-Residential/Commercial • Electrical Engineering/Contracting• Engineering-Mechanical/Civil/ • Architect•
Structural/Landscape • Electrical Engineering/ContractingPlumbing/Hydro Heating • Building Operations/Management•
2. What percent of your business is:
Residential %Commercial %Industrial/Public Works %
ID #
Appendix G – Survey Copies

Appendices
37
5. Have you created any new jobs/job titles (in the past year) specifically related to green building projects – for example, solar panel installer, weatherization specialist?
Job Title Current Number ofWorkers Doing the Job
Number of Workers You Will Add in the Next 5 Years
6. Which existing jobs, that incorporate green practices, are most in demand for building or operating green buildings?
Job Title Current Number ofWorkers Doing the Job
Number of Workers You Will Add in the Next 5 Years
7. Which jobs titles (new or existing) are entry level (new hire)? What are the minimum skills required (very detailed) for these openings? What are the job titles they would promote to?
Job Title Minimum Skills/Training Needed Jobs Could be Promoted to:
4. What percent of your employees do you estimate will retire in the next 5 years?
q 1 – 10% q 31 – 40% q 11 – 20% q 40 – 50% q 21 – 30% q 51% or more q 31 – 40% q Don’t know q None
Appendices
38
7. Continued
Job Title Minimum Skills/Training Needed Jobs Could be Promoted to:
8. What green-related skills or areas of knowledge do you find most often lacking in job candidates?
9. What other skills or areas of knowledge do you find lacking in your job candidates? Consider basic skills such as communication or computer skills as well as technical, job-specific skills.
(Do not duplicate information in #8 above – NOT Green.)
10. Do you provide any green training within your company?
11. What type of training would you like to see local colleges, technical schools, or apprentice-ship programs include to better prepare job candidates for your company?
12. Do you have any additional comments on your workforce needs related to green building and energy efficiency?

Appendices
39
Seattle-King County Green Building Education Survey
About This Survey:
This survey is being conducted by the Labor Market and Economic Analysis branch of the Wash-ington State Employment Security Department in partnership with the Workforce Development Council of Seattle-King County and the Seattle-King County Green Building and Green Building Industry Skill Panel.
In Seattle-King County, there is an increasing trend to build new or retrofit existing buildings that meet greener standards for energy efficiency, site development, materials, water savings, and air quality. This trend may promise significant job growth for our region.
We want to learn from the education community what types of green building-related training programs are available now and what additional capacity or programs are planned for the future. This information will help local policymakers and industry leaders identify training gaps and sup-port curriculum development. Individual responses will be kept completely confidential.
Person Completing this Survey:
Contact: Title:
Company: Phone: ( )
Email:
Survey Questions for Community/Technical and Four-Year/Private Colleges
1. Current Programs: What certificate, degree, or apprenticeship programs do you have in:
Area Program(s) Certificate,Degree, or
Apprentice?
Number of Quarters
Number of Credit Hours
Number of Course
Hours
ID #
Appendix G – Survey Copies (Continued)

Appendices
40
2. New Programs: Which new programs related to green building and energy efficiency are you planning to add? Please check whether you will add the program within the next year or 3 years.
New Program Title/Type Planning to Add in 1 Year?
Planning to Add in the Next 3 Years?
3. Program Capacity, Growth, and Outcomes:
• What percent of capacity has each program reached (number of filled slots divided by available slots)?
• What growth in capacity is needed? • What types of jobs do graduates fill? (Get details on how they track graduates.)• Does the program prepare graduates for recognized industry certifications? • Do 2 or 4-year colleges accept the program’s coursework as transfer credits to a higher-level program?
Program
Current Percent Capacity
Number of Slots Needed in 1 Year
Number of Slots
Needed in 3 Years
Number of Graduates
to-Date
What Jobs are Filled by
Graduates Post-Completion
Program Prepares for
Which Industry Certification
Which 2- or 4-Year Col-leges Accept Transfer Credits to High-Level
Programs
TrackingNumber of employed
after graduation, details on system.
Are your program credits accepted by other community colleges or 4-Yr.
schools? (i.e., Do you have an articula-tionagreementwithothercolleges?)


Washington State
Emp
loyment Security D
epartm
entLabor M
arket and Economic A
nalysis Branch
Mail Stop
46000P.O
. Box 9046
Olym
pia, W
A 98507-9046
OFFIC
IAL B
USIN
ESSPenalty For Private U
se $300