k.k.baruahand m. mondal r c mithun augmenting reproductive efficiencies in mithun through...
TRANSCRIPT

N R C Mithun AUGMENTING REPRODUCTIVE AUGMENTING REPRODUCTIVE AUGMENTING REPRODUCTIVE AUGMENTING REPRODUCTIVE
EFFICIENCIES IN MITHUN THROUGH EFFICIENCIES IN MITHUN THROUGH EFFICIENCIES IN MITHUN THROUGH EFFICIENCIES IN MITHUN THROUGH
BIOTECHNOLOGICAL INTERVENTIONBIOTECHNOLOGICAL INTERVENTIONBIOTECHNOLOGICAL INTERVENTIONBIOTECHNOLOGICAL INTERVENTION
K.K.Baruah and M. Mondal
National Research Centre on MithunJharnapani, Medziphema, Nagaland – 797 106, India

N R C Mithun Background
North-East India - rich in floral and faunalbiodiversity
Nagaland is endowed with rich germplasm ofdifferent endemic species including mithun (Bosfrontalis
Arunachal Pradesh, Mizoram and Manipur
It plays an important role in the socio-economic &cultural life of the tribal population of NEH region
Reared mainly for meat production

N R C Mithun There is an immense scope to increase meat
production to meet the demand of the fastgrowing population by exploiting the rate ofreproductive potential of mithun throughjudicious application of assisted reproductivetechnologies.
However, understanding of endocrinologyand reproductive physiology is of paramountimportance for application of assistedreproductive technologies
N R C Mithun
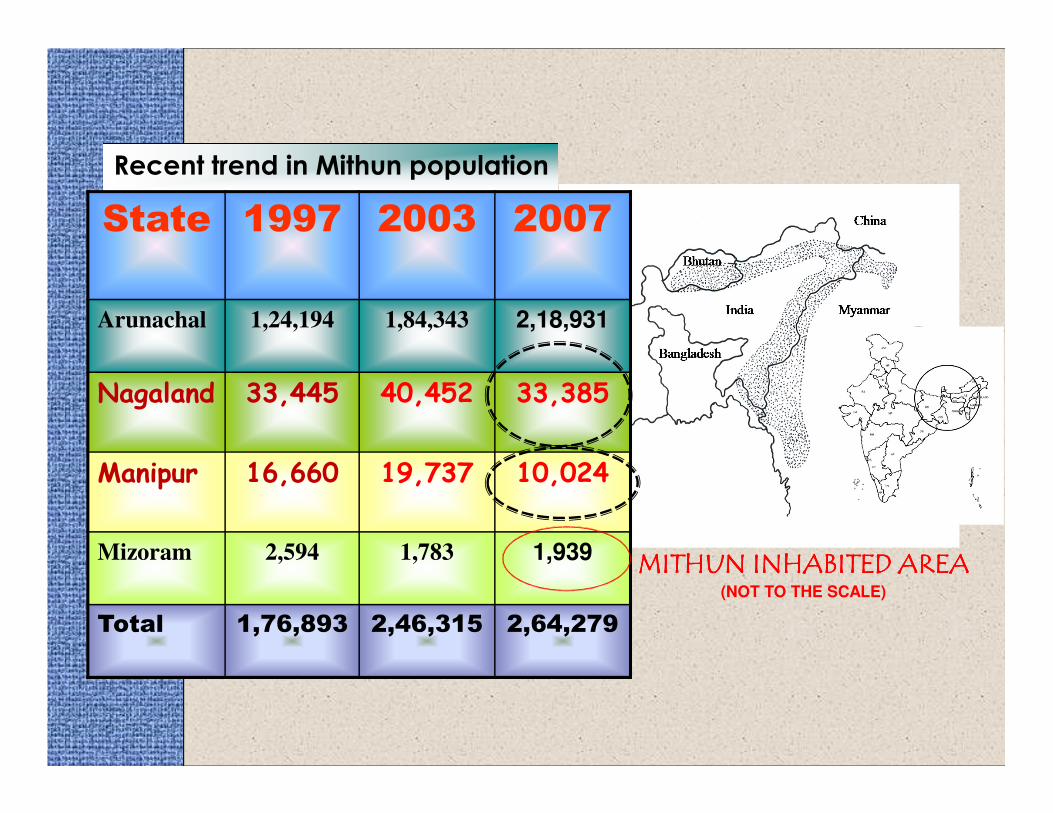
Recent trend in Mithun population
State 1997 2003 2007
Arunachal 1,24,194 1,84,343 2,18,931
Nagaland 33,445 40,452 33,385
Manipur 16,660 19,737 10,024
Mizoram 2,594 1,783 1,939
Total 1,76,893 2,46,315 2,64,279
MITHUN INHABITED AREAMITHUN INHABITED AREAMITHUN INHABITED AREAMITHUN INHABITED AREA(NOT TO THE SCALE)
N R C Mithun
Timing of Ovulation in Relation to Onset of Estrus and LH Peak in
Mithun Cows

N R C Mithun
0 2 4 6 8 10 12 14 16 18 20 22 24 26 28 30 32 34 36 38 40
0
2
4
6
8
10
LH
Progesterone
0.00
0.25
0.50
0.75
1.00
Ovulation
Hours after the onset of estrus
LH
(n
g/m
l)
Pro
ge
ste
ron
e (n
g/m
l)Fig. Changes in the plasma LH and progesterone profile (mean±SEM) in mithun cows(n=12) after onset of estrus. Blood samples were collected at 15 min intervals after theinitial expression of heat symptoms by the mithuns for 9 h period and thereafter at aninterval of 2 h till 4h post ovulation. Ovulation was confirmed by rectal palpation at 2 hintervals.

N R C Mithun
-6 -4 -2 0 2 4 6 8 10 12 14 16 18 20
0.0
0.5
1.0
1.5
2.0
2.5
3.0
3.5
4.0
4.5 P4 TE
0
10
20
30
40E2 Estrus
Days of estrous cycle
Pro
geste
ron
e (
ng
/ml)
Estra
dio
l-17
ββ ββ, T
ota
l estro
gen
(pg
/ml)
Mean (±SEM) plasma estradiol-17β (E2), total estrogen (TE) and progesterone
(P4) profiles during the different days of estrous cycle in mithun cows (n=12).
Blood samples were collected daily for the entire cycle.

N R C Mithun Estrus synchronization using
PGF2αααα
• Two injections of PGF2αααα were given at 11days apart
• Animals were observed for signs of estrusafter second injection of PGF2αααα
• Estrus was identified by observingbehavioural signs of estrus and throughrectal examination. It was further confirmedby progesterone profiles
• Time of ovulation was determined by perrecta examination of ovaries at every 2hintervals from the onset of estrus

N R C Mithun
Plasma LH characteristics and timing of ovulation in mithuns subjected to two injection of PGF2αααα at 11 days apart for estrus synchronization
*One animal did not ovulate
Parameters Animals Mean±SEM Range
Highest LH peak concentration (ng/ml) 24 12.54±1.37 7.34 to 22.65
Duration of LH surge (h) 24 14.76±1.47 10 to 19
Time from:
2nd
PGF2αααα injection to onset of estrus 24 43.52±5.93 36 to 58
Onset of estrus to onset of LH surge (h) 24 2.45±0.43 1.5 to 3.25
Onset of estrus to ovulation (h) 23* 33.95±1.41 27 to 39
2nd
PGF2αααα injection to ovulation 23* 74.5±5.93 66 to 78
After end of LH surge to ovulation (h) 23* 20.45±0.89 17 to 24
All the cows treated with the protocol were inseminated naturally twice at 60 and 72hafter second PGF2α. Out of 12 cows inseminated, 9 (75%) were conceived.

N R C Mithun
Mean (±SEM) plasma concentrations of LH and progesterone in Mithun cows (n=24) subjected to two injection of PGF2α at 11
days apart for oestrus synchronization.
0 12 24 36
0
2
4
6
8
10
12
14 LH
Progesterone
0
1
2
3
4
Ovulation
44 48 52 56 60 64 68 72 76 80
2nd PGF2αααα
Estrus
Hours after second PGF2αααα injection
LH
(n
g/m
l)
Pro
ge
ste
ron
e (n
g/m
l)

N R C Mithun Estrus synchronization using
Ovsynch protocol
• Day 0 : Injection of GnRH
• Day 7 : Injection of PGF2a
• Day 9 : Injection of GnRH
• Day10: Heat detection
• Ovulation time: 2h interval

N R C Mithun
Plasma LH characteristics and timing of ovulation in mithuns (n=23) subjected to Ovsynch protocol
Parameters Animals Mean±SEM Range
Highest LH peak concentration (ng/ml) 23 12.23±0.66 9.03 to 17.22
Duration of LH surge(h) 23 8.25±1.38 6 to 12
Time from:
a) Onset of LH surge after 2nd
GnRH 23 1.75±0.44 1.25 to 2.75
Injection (h)
b) Ovulation after 2nd
GnRH injection (h) 23 26.75±2.02 19 to 33
c) Ovulation after end of LH surge (h) 23 18.62±1.69 15 to 27
fixed time artificial insemination 12 to 16 h after the
second GnRH injection

N R C Mithun
-24 -12
0
1
2
3
4LH
Progesterone
0
2
4
6
8
10
12
14
0 6 11 17 23 29 35
2nd GnRH injection
Ovulations
Hours
Pro
geste
ron
e (
ng
/ml)
LH
(ng
/ml)
Mean (±SEM) plasma concentrations of LH and progesterone in
Mithun cows (n=23) treated with Ovsynch protocol. Receptal
(3.5ml; GnRH analogue) was injected and blood samples were
collected at 15 min interval one hour prior to and 9-h post GnRHadministration (0h) and thereafter at 2h interval till 2h post-
ovulation.

N R C Mithun Estrus synchronization using
CIDR
• CIDR insert: Day 0
• PGF2a injection -Day 6.
• CIDR removal - Day 7
• Observed for signs of estrus – day 8
• Ovulation time - every 2h interval
CIDR with applicator
CIDR is inserted in a mithun cow
Mithun cow with an inserted CIDR
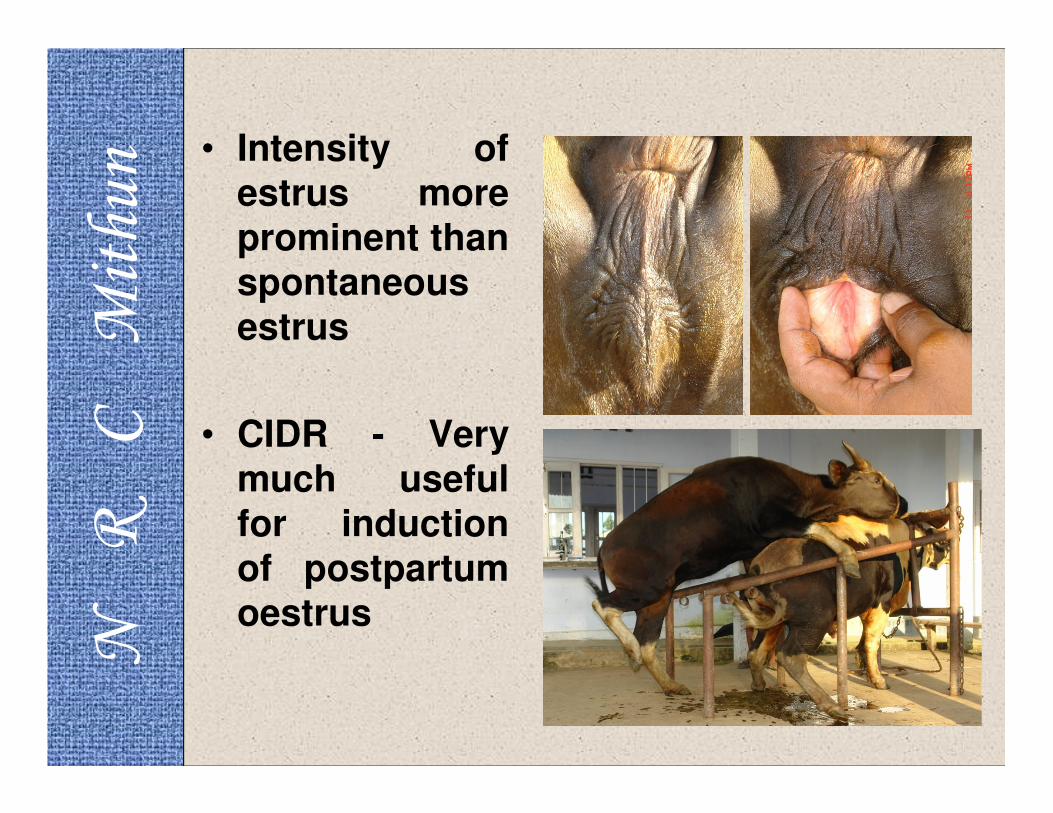
N R C Mithun • Intensity of
estrus more
prominent than
spontaneous
estrus
• CIDR - Very
much useful
for induction
of postpartum
oestrus

N R C Mithun
0 25 50 75
0.0
0.5
1.0
1.5
2.0
2.5
3.0
3.5
4.0
4.5
0.0
2.5
5.0
7.5
10.0
12.5
15.0
17.5
20.0
22.5
25.0Progesterone Estradiol-17ββββ LH
89 99 109 119 129 139 149
Days after parturition
Pro
geste
ron
e (
ng
/ml)
LH
(ng
/ml); E
stra
dio
l-17
ββ ββ (p
g/m
l)
Estrus
Mean (±SEM) plasma profiles of progesterone, LH and estradiol-17β in post-
partum mithun cows (n=37) from parturition (day 0) to onset of first post-partum
estrus. Blood samples were collected daily from each animal for plasma
progesterone, LH and estradiol-17β. Plasma hormone profiles suggested that themithun cows exhibited first estrus at day 97±19.6 postpartum (range: day 78 to
113 postpartum). Plasma progesterone and LH concentrations remained basal till
first postpartum estrus, which was silent in most of the cows. Plasma estradiol-
17β exhibited little fluctuation from the day of parturition till first postpartum estrus
where peak concentration was recorded.

N R C Mithun
Application of CIDR for early induction of estrus in postpartum mithun cows
Plasma LH characteristics and timing of estrus and ovulation in postpartum
mithuns (n=24) subjected to CIDR.
Parameters Animals Mean±SEM Range
Highest LH peak concentration (ng/ml) 24 12.11±1.65 8.54 to 15. 9
Duration of LH surge (h) 24 9.15±2.08 8.25 to 11.0
Time from (h):
Onset of LH peak after PGF2α injection 24 70.60±3.44 66 to 76
Onset of estrus after PGF2α injection 24 67.2±2.30 56 to 72
Onset of estrus after CIDR removal 24 44±3.44 36 to 54
Ovulation after PGF2α injection 24 86.5±4.12 76 to 92
Ovulation after CIDR removal 24 63.52±3.50 48 to 60
Ovulation after end of LH surge (h) 24 20.52±1.69 18 to 24

N R C Mithun
Mean (±SEM) profile of plasma progesterone, LH and estradiol-
17β in postpartum anoestrus mithun cows (n=24) treated withCIDR and PGF2α. Blood samples were collected 7 days prior toand 9 days after CIDR administration (day 0= day of CIDR
administration).
-7 -6 -5 -4 -3 -2 -1 0 1 2 3 4 5 6 7 8 9
0
1
2
3
4
5Progesterone
Estradiol
LH
0
5
10
15
20
CIDR inserted
PGF2αααα
CIDR removal
Estrus
Day around CIDR treatment
Pro
geste
ron
e (
ng
/ml)
LH
(ng
/ml); E
stra
dio
l-17
ββ ββ (p
g/m
l)

N R C Mithun
-9 -4
0.2
0.3
0.4
0.5
0.6
0.7
0.8
0.9
1.0
LH
Progesterone
0
3
6
9
12
15
18
21
E2
0 6 12 18 24 30 36
Estrus
Time around estrus in CIDR treated animal (h)
Pro
ges
tero
ne (
ng
/ml)
LH
(ng
/ml); E
stra
dio
l-17
ββ ββ (p
g/m
l)Mean (±SEM) profile of plasma progesterone, LH and estradiol-17β inpostpartum anoestrus mithun cows (n=24) treated with CIDR andPGF2α. Blood samples were collected 9 h prior to estrus at every 3hinterval and then at an interval of 15 min for 9h post-estrus and
thereafter at every 2 h interval till 4h post-ovulation
N R C Mithun
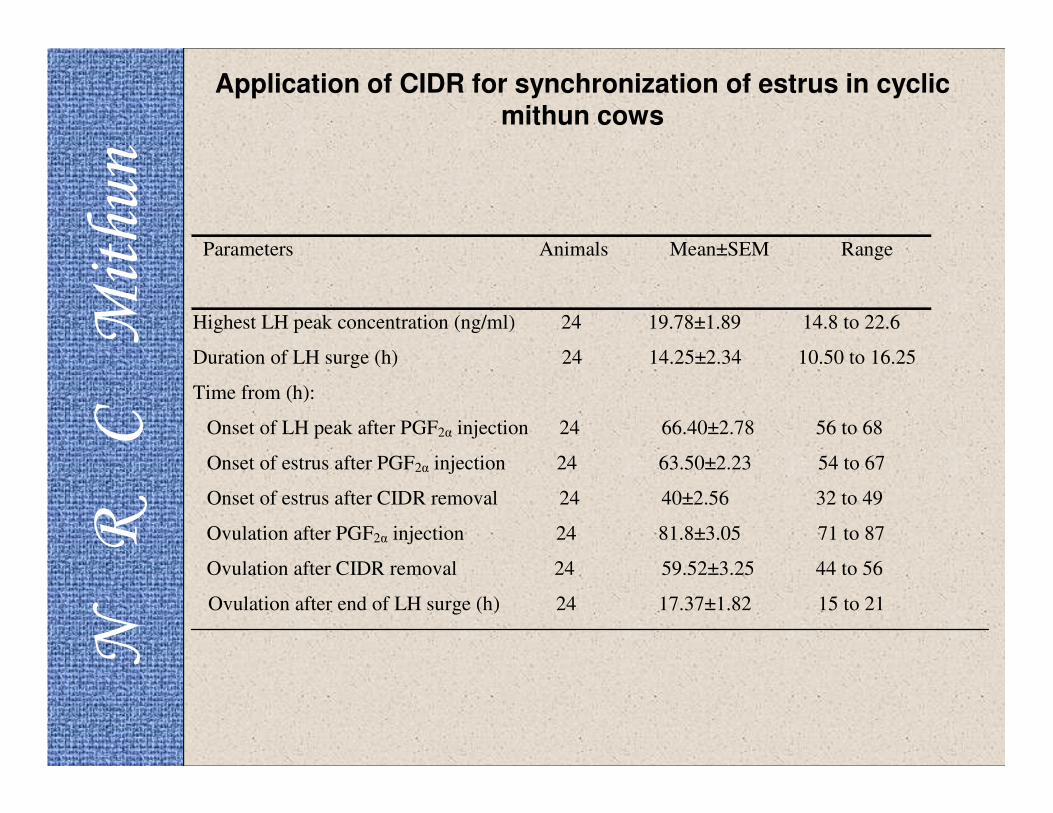
Application of CIDR for synchronization of estrus in cyclic mithun cows
Parameters Animals Mean±SEM Range
Highest LH peak concentration (ng/ml) 24 19.78±1.89 14.8 to 22.6
Duration of LH surge (h) 24 14.25±2.34 10.50 to 16.25
Time from (h):
Onset of LH peak after PGF2α injection 24 66.40±2.78 56 to 68
Onset of estrus after PGF2α injection 24 63.50±2.23 54 to 67
Onset of estrus after CIDR removal 24 40±2.56 32 to 49
Ovulation after PGF2α injection 24 81.8±3.05 71 to 87
Ovulation after CIDR removal 24 59.52±3.25 44 to 56
Ovulation after end of LH surge (h) 24 17.37±1.82 15 to 21
N R C Mithun Initially, 22 mithun cows were
synchronized for estrus with CIDRand inseminated at 48 and 60hfollowing withdrawal of CIDR insert.
A conception rate of 72.7% wasachieved.

N R C Mithun
Application of Heatsynch protocol in mithuns
Protocol:
Day 0: GnRH
Day 7: PGF2α injection
Day 8: ECP injection
Day 8 through 9: Estrus detection
Day 8 through 10: Insemination

N R C Mithun
Parameters Animals Mean±SEM Range
Highest LH peak concentration (ng/ml) 12 9.73±1.66 7.23 to
16.19
Duration of LH surge (h) 12 16.25±2.38 12.50 to
19.0
Time from (h):
Onset of LH peak after ECP injection 12 21.90±1.44 18 to 26
Onset of estrus after ECP injection 12 20.2±1.32 16 to 24
Ovulation after PGF2α injection 12 76.5±2.12 60 to 72
Ovulation after ECP injection 12 51.84±2.25 48 to 60
Ovulation after end of LH surge (h) 12 20.62±1.69 16 to 24
Plasma LH characteristics and timing of estrus andovulation in mithuns (n=12) subjected to Heatsynch protocol
The pregnancy rate of 75% was achieved with natural service on detected estrus

N R C Mithun
0 8 16 24 32 40 48 56 64
0
1
2
3
4
5
6
7
8
9
10
11
12
ECP
Progesterone
0
1
2
3
LH
Hours after ECP administration
LH
(n
g/m
l)
Pro
ge
ste
ron
e (n
g/m
l)
Ovulation
Changes in plasma LH and progesterone (mean±SEM) after theadministration of ECP in mithuns (n=12) according to the Heatsynchprotocol of estrus synchronization. Blood samples were collected at2h intervals beginning with the time of ECP administration until 2h
post-ovulation

N R C Mithun
It was difficult to teasethe mithun bull withoutestrus animal
Urine from estrus mithuncows were collected andstored at refrigeratedtemperature
This urine samples weresprinkled over theperineal region of mithuncow not in estrus
Bull reacted as an estruscow and semen wascollected successfully
Standardisation of Innovative method of semen collection in Mithun

N R C Mithun
Preservation of mithun semen
A) Protocols for semen preservation at
refrigeration temperature
After collection, semen was diluted in Tris-egg-yolk extender
Preserved at 4°C
Evaluated at 6 hour interval (progressive motility, live & dead count, acrosomal integrity and morphological
abnormalities)
Sperm were classified into four categories namely a) live, intact acrosome b) live, damaged acrosome c)
dead, intact acrosome and d) dead , damaged acrosome

N R C Mithun Different parameters of mithun semen
Particulars Mean ± SE
Volume (ml) 2.2 ± 0.3
Colour Creamy white
Mass activity(5+ scale)3.3 ± 0.2 (5 point scale)
Progressive motility (%) immediately after dilution
66. 7 ± 3.3
Spermatozoa concentration (106
ml -1)550 ± 46
N R C Mithun
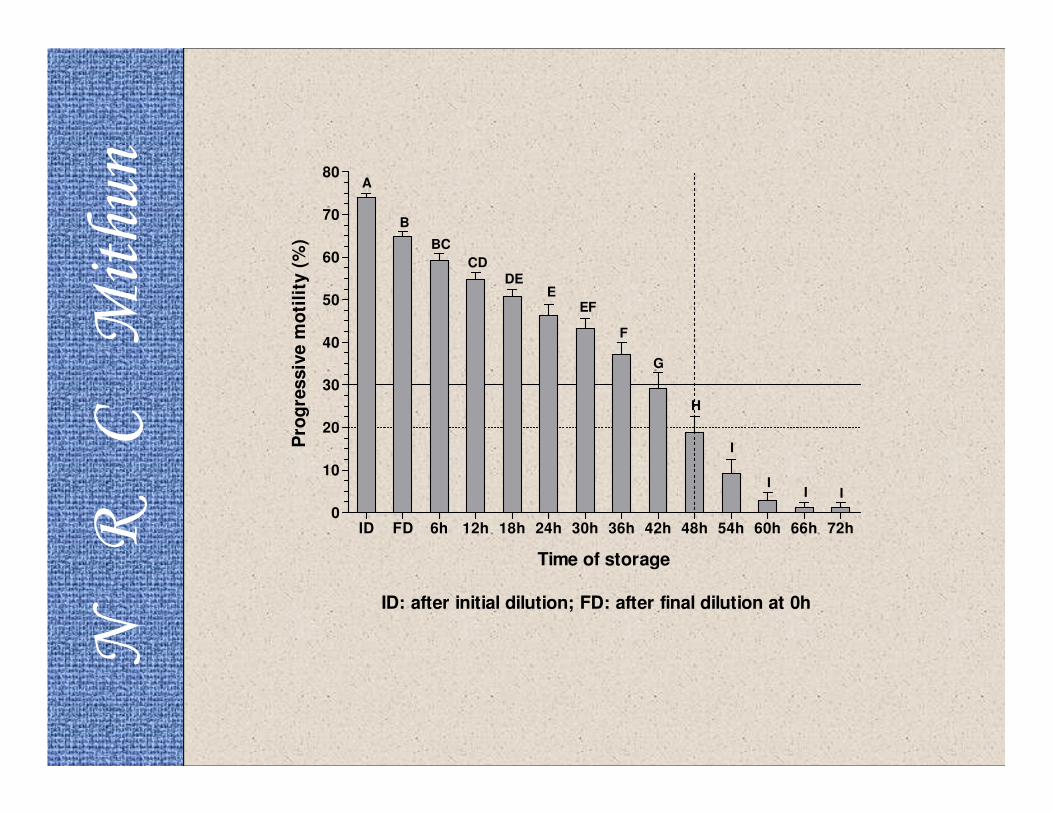
ID FD 6h 12h 18h 24h 30h 36h 42h 48h 54h 60h 66h 72h0
10
20
30
40
50
60
70
80A
B
BC
CD
DEE
EF
F
G
H
I
II I
ID: after initial dilution; FD: after final dilution at 0h
Time of storage
Pro
gre
ssiv
e m
oti
lity
(%
)

N R C Mithun
Variations (Mean ± SE) in the liveability and acrosomal integrity of mithun spermatozoa after final dilution and at the time of 30% progressive motility following storage at 4°C; ** indicates values within row differ significantly (P<0.01) and * indicates values within row differ significantly (P<0.05)
Particulars After final
dilution (0 h)
At 30% of
progressive
motility
Live spermatozoa with
intact acrosome (%)
63.8 ± 1.6** 31.3 ± 0.9**
Live spermatozoa with
damaged acrosome (%)
4.2 ± 0.8 3.4 ± 0.8
Dead spermatozoa with
intact acrosome (%)
3.9 ± 0.4* 5.7 ± 0.7*
Dead spermatozoa with
damaged acrosome (%)
29.1 ± 1.3** 59.6 ± 1.0**
N R C Mithun
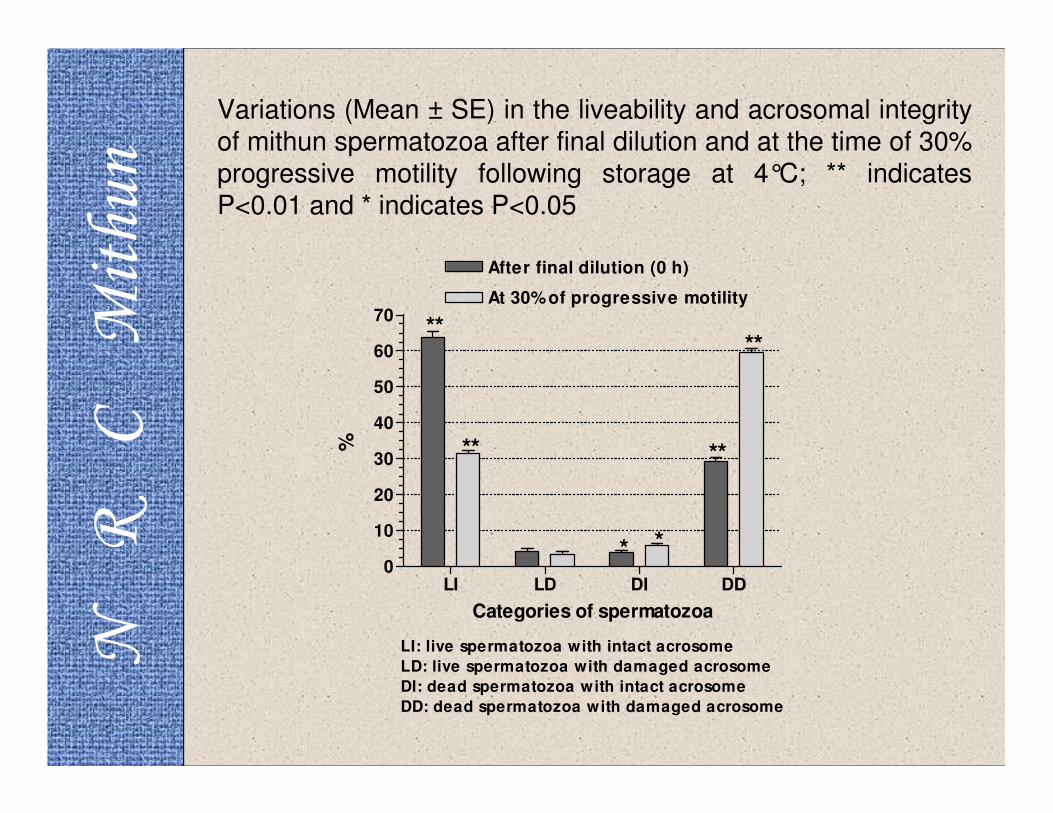
Variations (Mean ± SE) in the liveability and acrosomal integrityof mithun spermatozoa after final dilution and at the time of 30%progressive motility following storage at 4°C; ** indicatesP<0.01 and * indicates P<0.05
LI LD DI DD0
10
20
30
40
50
60
70
After final dilution (0 h)
At 30% of progressive motility
**
**
* *
**
**
LI: live spermatozoa with intact acrosome
LD: live spermatozoa with damaged acrosome
DI: dead spermatozoa with intact acrosome
DD: dead spermatozoa with damaged acrosome
Categories of spermatozoa
%

N R C Mithun
Morphological
abnormalities
After final dilution
(0 h)
At 30% of
progressive motility
Head (%) 0.5 ± 0.2** 3.7 ± 0.3**
Mid piece (%) 0.1 ± 0.1** 0.6 ± 0.1**
Tail (%) 4.8 ± 0.3** 10.2 ± 0.6**
Total (%) 5.4 ± 0.3** 14.5 ± 0.8**
Variations (Mean ± SE) in the morphological abnormalities of Mithun
spermatozoa after initial dilution and at the time of 30% progressive
motility following storage at 4°C; ** indicates values within row differ
significantly (P<0.01)

N R C Mithun Variations (Mean ± SE) in the morphological abnormalities of
mithun spermatozoa after final dilution and at the time of 30%progressive motility following storage at 4°C; ** indicates P<0.01
Head Midpiece Tail Total0
5
10
15
20
After final dilution (0 h)
At 30% of progressive motility
Morphological abnrmalities
%
**
**
** **
**
**
**
**

N R C Mithun
Seasonal variation in the quality of Mithun semen
Variations (Mean±SE) in seminal parameters during different seasons in Mithun
Parameters Winter (Nov-Feb) Pre-monsoon (Mar-Jun)
Semen Volume(ml) 1.90±0.15 1.80±0.10
Sperm concentration(X106 /ml) 497.50±25.69 469.41±17.62
Mass activity (0-5 point scale) 3.3±0.2 3.4±0.1
Variations (Mean±S.E.) in progressive mortality of Mithun sperm after different h of preservation at 40C; 0 h indicates immediately before cooling at 40C
Time of preservation Winter (Nov-Feb) Pre-monsoon (Mar-Jun)
0h 65.0±2.1 64.7±1.4
12h 52.5±2.9 55.9±1.9
24h 45.0±3.6 48.2±2.5
36h 37.5±3.7 38.8±2.5
Variations (Mean±S.E.) in total morphological abnormalities of Mithun sperm after different h of presentation at 40C; 0 h indicates immediately before cooling at 40C
Time of preservation Winter (Nov-Feb) Pre-monsoon (Mar-Jun)
0h 5.2±0.5 5.3±0.3
12h 7.4±0.8 7.5±0.6
24h 9.6±1.2 10.6±0.8
36h 12.1±1.4 13.5±0.9

N R C Mithun
B) Protocol for cryopreservation of semen
a) Tris-egg yolk diluent with glycerol (Singledose (3,4,5, 6 or 7% glycerol and split doses(5,6 or7% glycerol)
b) Citrate-egg yolk diluent with glycerol (Singledose (5, 6 or 7% glycerol)

N R C Mithun
After collection , semen was diluted in Tris-egg-yolk/Citrate-egg yolk extender
Following the determination of spermatozoa concentration, semen sample was diluted with Tris–egg yolk extender and
glycerol in single dose (3,4,5, 6 or 7% glycerol (v/v) ) and split doses (5,6 or 7% glycerol)/Citrate-egg yolk extender and glycerol
in single dose (5, 6 or 7% glycerol (v/v) ) .
Evaluation of progressive motility, live & dead count, acrosomal integrity and morphological abnormalities were done in fresh
samples, in diluted samples after cooling (at 5°C) and in cryopreserved (7 days of storage) samples
Sperm were classified into four categories namely a) live, intact acrosome b) live, damaged acrosome c) dead, intact acrosome and d)
dead , damage dacrosome.
The diluted semen sample was loaded into 0.5 ml straws, which were sealed with polyvinyl alcohol (PVA) powder. The straws
were then equilibrated at 5°C for 4 h .After equilibration, straws were frozen in liquid nitrogen vapour, 5 cm above the liquid
nitrogen level for 10 min and then plunged into liquid nitrogen for storage.

N R C Mithun
Cryopreservation of mithun semen
Glycerol added in a single dose

N R C Mithun Variations (Mean ± SE) in progressive motility during different
stages of freezing. Semen samples were cryopreserved with 3, 4,
5, 6 or 7% glycerol. A, B indicates values with different
superscript within column differ significantly (P<0.01)
Glycerol
concentration
(%)
Progressive motility (%)
After initial
dilution
After 4 h
equilibration
After freezing
and thawing
3 ‡67.8±2.8 †43.2±2.3 ᵹ23.9±2.0A
4 ‡67.2±2.3 †44.2±2.4 ᵹ26.5±2.7AB
5 ‡65.3±4.1 †49.8±2.2 ᵹ40.6±1.7C
6 ‡66.1±2.9 †45.2±2.5 ᵹ31.7±1.1B
7 ‡66.3±3.7 †45.1±3.0 ᵹ17.4±1.3D

N R C Mithun
Variations (Mean ± SE) in progressive motility during different
stages of freezing. Semen samples were cryopreserved with 3, 4, 5,
6 or 7% glycerol. A,B on error bar indicates a significant
difference (P<0.01)
3 4 5 6 7 3 4 5 6 7 3 4 5 6 70
10
20
30
40
50
60
70
80
After initial dilution
After 4 h equilibration
After freezing and thawing
ABB
C
B
A
Glycerol concentration (%)
Pro
gre
ssiv
e m
oti
lity
(%)
N R C Mithun
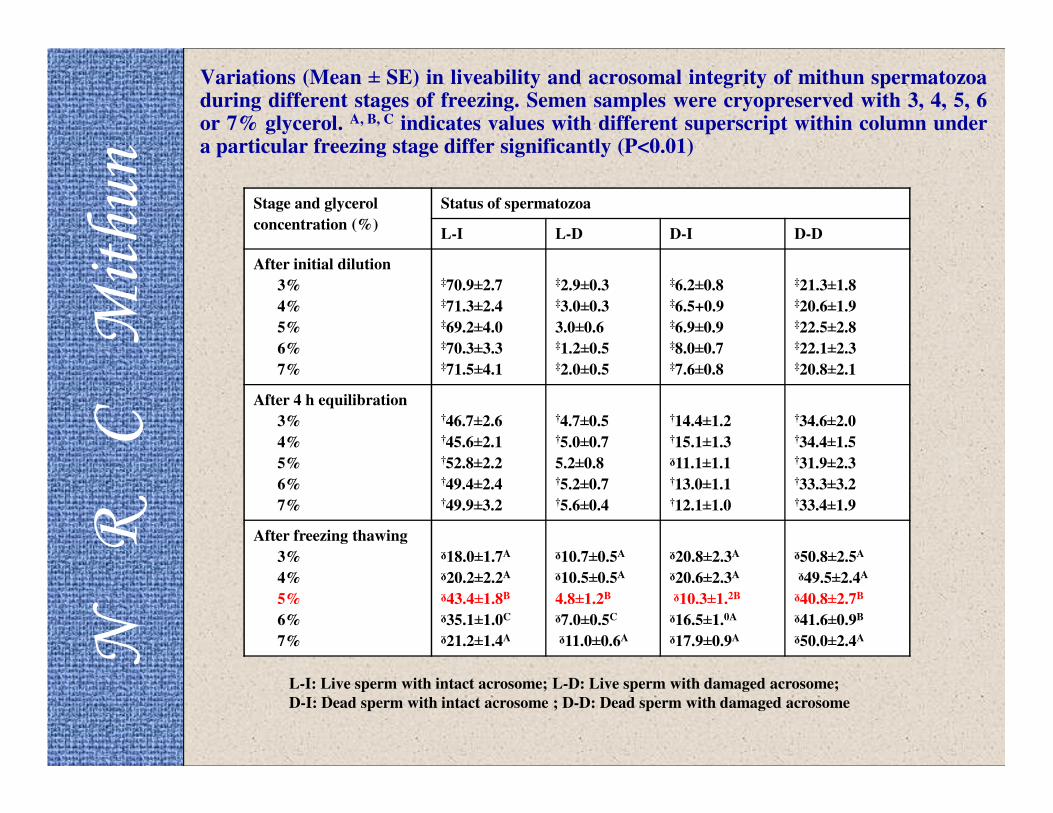
Variations (Mean ± SE) in liveability and acrosomal integrity of mithun spermatozoaduring different stages of freezing. Semen samples were cryopreserved with 3, 4, 5, 6or 7% glycerol. A, B, C indicates values with different superscript within column undera particular freezing stage differ significantly (P<0.01)
L-I: Live sperm with intact acrosome; L-D: Live sperm with damaged acrosome;
D-I: Dead sperm with intact acrosome ; D-D: Dead sperm with damaged acrosome
Stage and glycerol
concentration (%)
Status of spermatozoa
L-I L-D D-I D-D
After initial dilution
3%
4%
5%
6%
7%
‡70.9±2.7‡71.3±2.4‡69.2±4.0‡70.3±3.3‡71.5±4.1
‡2.9±0.3‡3.0±0.3
3.0±0.6‡1.2±0.5‡2.0±0.5
‡6.2±0.8‡6.5+0.9‡6.9±0.9‡8.0±0.7‡7.6±0.8
‡21.3±1.8‡20.6±1.9‡22.5±2.8‡22.1±2.3‡20.8±2.1
After 4 h equilibration
3%
4%
5%
6%
7%
†46.7±2.6†45.6±2.1†52.8±2.2†49.4±2.4†49.9±3.2
†4.7±0.5†5.0±0.7
5.2±0.8†5.2±0.7†5.6±0.4
†14.4±1.2†15.1±1.3ᵹ11.1±1.1†13.0±1.1†12.1±1.0
†34.6±2.0†34.4±1.5†31.9±2.3†33.3±3.2†33.4±1.9
After freezing thawing
3%
4%
5%
6%
7%
ᵹ18.0±1.7A
ᵹ20.2±2.2A
ᵹ43.4±1.8B
ᵹ35.1±1.0C
ᵹ21.2±1.4A
ᵹ10.7±0.5A
ᵹ10.5±0.5A
4.8±1.2B
ᵹ7.0±0.5C
ᵹ11.0±0.6A
ᵹ20.8±2.3A
ᵹ20.6±2.3A
ᵹ10.3±1.2B
ᵹ16.5±1.0A
ᵹ17.9±0.9A
ᵹ50.8±2.5A
ᵹ49.5±2.4A
ᵹ40.8±2.7B
ᵹ41.6±0.9B
ᵹ50.0±2.4A

N R C Mithun
3 4 5 6 7 3 4 5 6 7 3 4 5 6 70
10
20
30
40
50
60
70
80
After initial dilution
After 4-h equilibration
After freezing and thawing
A
C
A
A
B
A
Glycerol concentration (%)
Liv
e w
ith
in
tact
acro
so
me
(%)
3 4 5 6 7 3 4 5 6 7 3 4 5 6 70
10
20
30
40
50
60
70
80 After initial dilution
After 4-h equilibration
After freezing and thawing
B
A A
BC
A
Glycerol concentration (%)
Liv
e w
ith
dam
ag
ed
acro
so
me
(%)
Variations (Mean ± SE) in live spermatozoa with intact acrosome (Panel A), livespermatozoa with damaged acrosome (Panel B), dead spermatozoa with intactacrosome (Panel C) and dead spermatozoa with damaged acrosome (Panel D) duringdifferent stages of freezing. Semen samples were cryopreserved with 3, 4, 5, 6 or 7%glycerol. A, B, C on error bar indicates P<0.01

N R C Mithun
3 4 5 6 7 3 4 5 6 7 3 4 5 6 70
10
20
30
40
50
60
70
80 After initial dilution
After 4-h equilibration
After freezing and thawing
C
A A
B
CA
Glycerol concentration (%)
Dead
wit
h i
nta
ct
acro
so
me
(%)
3 4 5 6 7 3 4 5 6 7 3 4 5 6 70
10
20
30
40
50
60
70
80
After initial dilution
After 4-h equilibration
After freezing and thawingD
AA
B B
A
Glycerol concentration (%)
Dead
wit
h d
am
ag
ed
acro
so
me
(%)

N R C Mithun
Variations (Mean ± SE) in head, mid piece, tail and total abnormalities of
spermatozoa during different stages of freezing. Semen samples were
cryopreserved with 3, 4, 5, 6 or 7% glycerol. A, B indicates values with different
superscript within column under a particular freezing stage differ significantly
(P<0.01)
Stage and glycerol
concentration (%)
Spermatozoa abnormalities
Head Mid piece Tail Total
After initial dilution
3%
4%
5%
6%
7%
‡0.9 ± 0.3 ‡1.1 ± 0.3 ‡1.2 ± 0.4 ‡0.8 ± 0.3 ‡0.6 ± 0.2
‡0.2 ± 0.2 ‡0.4 ± 0.2‡0.5 ± 0.2 ‡0.2 ± 0.2 ‡0.4 ± 0.2
‡4.7 ± 0.3 ‡3.4 ± 0.5 ‡4.1 ± 0.3 ‡4.7 ± 0.5 ‡4.6 ± 0.3
‡5.8 ± 0.5 ‡4.9 ± 0.5 ‡5.8 ± 0.3 ‡5.7 ± 0.6 ‡5.6 ± 0.4
After 4 h equilibration
3%
4%
5%
6%
7%
†3.0 ± 0.3 †2.8 ± 0.3 ᵹ2.6 ± 0.4 †2.0 ± 0.5 †2.9 ± 0.3
†1.2 ± 0.3 †1.3 ± 0.3 ‡0.5 ± 0.2 ‡0.7 ± 0.2 †1.2 ± 0.3
†9.4 ± 0.5A
†8.6 ± 0.8AB
†6.5 ± 0.3C
†7.0 ± 0.7BC
†9.5 ± 0.4A
†13.6 ± 0.8A
†12.7 ± 1.1A
†9.6 ± 0.6B
†9.5 ± 0.9B
†13.6 ± 0.8A
After freezing thawing
3%
4%
5%
6%
7%
ᵹ6.1 ± 0.4A
ᵹ5.3 ± 0.6A
ᵹ2.8 ± 0.4B
ᵹ3.2 ± 0.4B
ᵹ6.2 ± 0.5A
ᵹ3.1 ± 0.3A
ᵹ2.9 ± 0.3A
ᵹ1.6 ± 0.2B
ᵹ1.5 ± 0.2B
ᵹ3.2 ± 0.3A
ᵹ16.3 ± 0.9A
ᵹ16.1 ± 0.8A
ᵹ9.7 ± 0.5B
ᵹ9.0 ± 0.6B
ᵹ16.6 ± 0.9A
ᵹ25.3 ± 1.0A
ᵹ24.2 ± 1.0A
ᵹ14.1 ± 0.8B
ᵹ13.7 ± 1.0B
ᵹ25.8 ± 1.2A

N R C Mithun
Variations (Mean ± SE) in head (Panel A), mid piece (Panel B), tail (Panel C) and
total abnormalities (Panel D) of spermatozoa during different stages of freezing. The
semen samples were cryopreserved with 3, 4, 5, 6 or 7% glycerol. A, B on error bar
indicates P<0.01
3 4 5 6 7 3 4 5 6 7 3 4 5 6 70
5
10
15
20
25
30After initial dilution
After 4-h equilibration
After freezing and thawing
A
A A
B B
A
Glycerol concentration (%)
Head
ab
no
rmali
ty
(%)
3 4 5 6 7 3 4 5 6 7 3 4 5 6 70
5
10
15
20
25
30 After initial dilution
After 4-h equilibration
After freezing and thawing
B
A AB B
A
Glycerol concentration (%)
Mid
pie
ce a
bn
orm
ali
ty(%
)

N R C Mithun
3 4 5 6 7 3 4 5 6 7 3 4 5 6 70
5
10
15
20
25
30
After initial dilution
After 4-h equilibration
After freezing and thawingC
A A
B B
A
Glycerol concentration (%)
Tail
ab
no
rmali
ty(%
)
3 4 5 6 7 3 4 5 6 7 3 4 5 6 70
5
10
15
20
25
30
After initial dilution
After 4-h equilibration
After freezing and thawingD
AA
B B
A
Glycerol concentration (% )
To
tal
ab
no
rmali
ty
(%)

N R C Mithun
Cryopreservation of mithun semen
Glycerol added in split doses

N R C Mithun
Variations (Mean ± SE) in progressive motility during different stages of
freezing. Semen samples were cryopreserved with 5, 6 or 7% glycerol. A, B
indicates values with different superscript within column differ significantly
(P<0.01)
Glycerol
concentratio
n (%)
Progressive motility (%)
After initial
dilution
After 4 h
equilibration
After freezing
and thawing
5 ‡79.8±2.3 †64.4±1.5A ᵹ50.2±1.9A
6 ‡74.1±2.9 †58.0±2.5B ᵹ42.1±1.5B
7 ‡74.5±2.7 †53.7±2.0B ᵹ33.9±1.4C
0
10
20
30
40
50
60
70
80
90
5 6 7
Pro
gre
ssiv
e m
ort
ilit
y (
%)
Glycerol concentration (%)
After initial dilution
After 4h equilibration
After freezing andthawing

N R C Mithun
Table 5. Variations (Mean ± SE) in liveability and acrosomal integrity of mithunspermatozoa during different stages of freezing. Semen samples were cryopreservedwith 5, 6 or 7% glycerol. A, B, C (P<0.01) or a, b (P<0.05) indicates values with differentsuperscript within column under a particular freezing stage differ significantly
L-I: Live sperm with intact acrosome; L-D: Live sperm with damaged acrosome;
D-I: Dead sperm with intact acrosome ; D-D: Dead sperm with damaged acrosome
Stage and glycerol
concentration (%)
Status of spermatozoa
L-I L-D D-I D-D
After initial dilution
5%
6%
7%
‡84.3±3.1‡78.3±3.4‡78.0±2.9
‡0.9±0.3‡2.2±0..6‡2.5±0.5
‡4.7±0.6‡5.5±0.5‡5.7±0.6
‡13.6±1.7‡16.4±1.6‡16.3±1.4
After 4 h
equilibration
5%
6%
7%
†67.5±1.2A
†61.9±2.2B
†57.7±2.2B
ᵹ3.6±0.5A
ᵹ5.9±0.3B
ᵹ5.4±0.3B
†9.3±0.5A
†12.0±0.8B
†11.7±0.9B
†20.5±0.9A
†20.9±2.0A
†25.6±1.3B
After freezing
thawing
5%
6%
7%
ᵹ53.3±1.8A
ᵹ45.8±1.6B
ᵹ37.6±1.2C
ᵹ3.8±0.5A
ᵹ5.5±0.3B
ᵹ6.1±0.4B
ᵹ13.3±0.6A
ᵹ16.2±0.7B
ᵹ19.3±0.6C
ᵹ30.0±1.9A
ᵹ32.7±1.3A
ᵹ37.2±1.1B

N R C Mithun
0
10
20
30
40
50
60
70
80
90
5 6 7
Liv
e s
perm
wit
h in
tac a
cro
so
me
Glycerol concentration (%)
A
After initial dilution
After 4h equilibration
After freezing thawing
0
1
2
3
4
5
6
7
5 6 7Liv
e s
perm
wit
h d
am
ag
ed
acro
so
me
Glycerol concentration (%)
B
After initial dilution
After 4h equilibration
After freezing thawing

N R C Mithun
0
5
10
15
20
25
5 6 7
Dead
sp
erm
wit
h in
tac a
cro
so
me
Glycerol concentration (%)
C
After initial dilution
After 4h equilibration
After freezing thawing
0
5
10
15
20
25
30
35
40
5 6 7
Dead
sp
erm
wit
h d
am
ag
ed
acro
so
me
Glycerol concentration (%)
D
After initial dilution
After 4h equlibration
After freezing thawing

N R C Mithun
Table 6. Variations (Mean ± SE) in head, mid piece, tail and total abnormalities
of spermatozoa during different stages of freezing. Semen samples were
cryopreserved with 5, 6 or 7% glycerol. A, B, C (P<0.01) or a, b (P<0.05) indicates
values with different superscript within column under a particular freezing stage
differ significantly
Stage and glycerol
concentration (%)
Spermatozoa abnormalities
Head Mid piece Tail Total
After initial
dilution
5%
6%
7%
‡0.7±0.3 ‡1.1±0.3 ‡1.0±0.3
‡0.7±0.2 ‡0.6±0.2 ‡0.4±0.2
‡4.1 ± 0.3 ‡4.5 ± 0.3 ‡5.0±0.3
‡5.5 ± 0.5 ‡6.2±0.4 ‡6.4±0.5
After 4 h
equilibration
5%
6%
7%
ᵹ2.6 ± 0.2 †2.9 ± 0.2 †3.4±0.4
‡1.2±0.2 ‡1.6±0.3†1.6 ± 0.2
†7.7±0.7†8.4±0.5†9.6±0.5
†11.5±0.8A
†12.9±0.8AB
†14.5±0.5B
After freezing
thawing
5%
6%
7%
ᵹ4.4 ± 0.3A
ᵹ4.2 ± 0.4A
ᵹ6.2 ± 0.6B
ᵹ2.9±0.3A
ᵹ1.6 ± 0.2B
ᵹ 2.7 ± 0.3A
ᵹ12.3±0.7ᵹ12.2 ± 0.8ᵹ11.8 ± 0.6
ᵹ19.5 ± 1.0ᵹ17.9 ± 1.1ᵹ20.6 ± 0.5

N R C Mithun
0
1
2
3
4
5
6
7
5 6 7
Head
Glycerol concentration (%)
A
After initialdilution
After 4hequilibration
After freezingthawing
0
1
2
3
4
5 6 7
Mid
pie
ce
Glycerol concentration (%)
B
After initialdilution
After 4hequilibration
After freezingthawing

N R C Mithun
0
2
4
6
8
10
12
14
5 6 7
Tail
Glycerol concentration
C
After dilution
After 4hequilibration
After freezingthawing
0
5
10
15
20
25
5 6 7
To
tal
Glycerol concentration
D
After dilution
After 4hequilibration
After freezingthawing

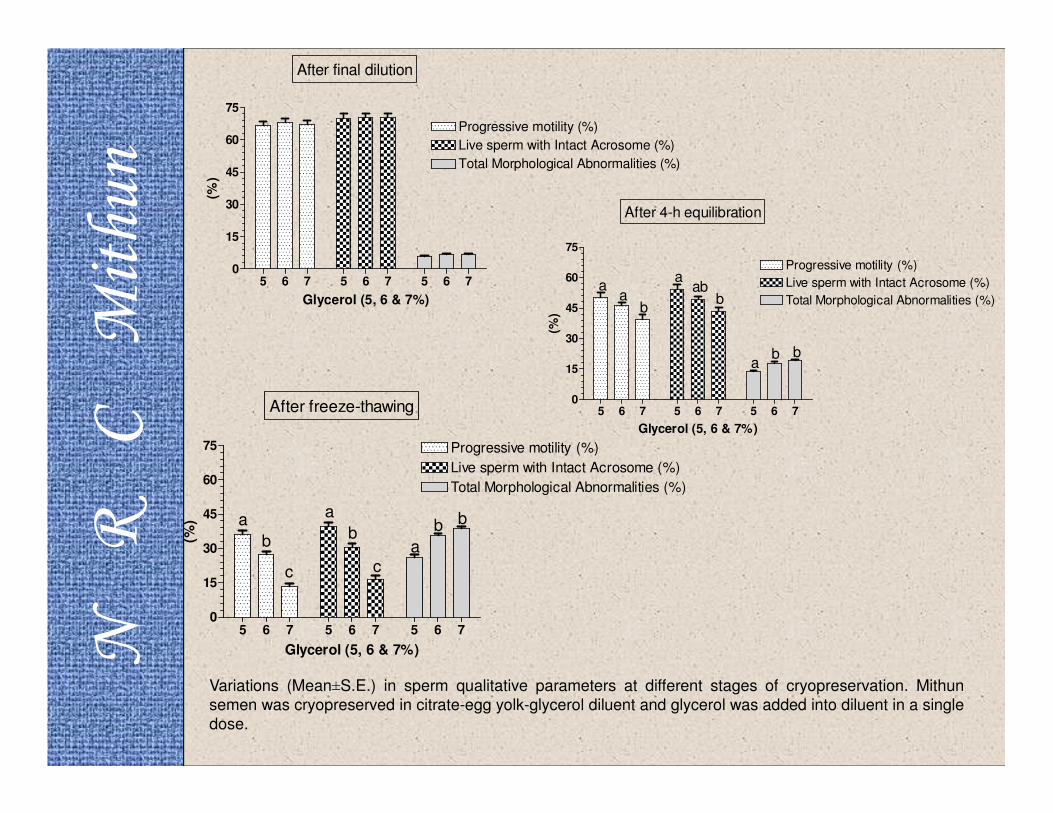
N R C Mithun Citrate-egg yolk diluent with glycerol
Particulars Glycerol concentration (%)
5 6 7
After final dilution
Progressive motility (%) 66.5±2.1 68.0±2.0 67.0±2.2
Live sperm with intact acrosome
(%)
69.8±2.3 70.3±1.8 70.2±2.1
Total morphological abnormalities
(%)
5.6±0.5 6.6.±0.4 6.6±0.5
After 4-h equilibration
Progressive motility (%) 50.0±2.7a 46.0±1.7a 39.5±2.2b
Live sperm with intact acrosome
(%)
54.0±2.6a 49.0±1.7ab 43.2±2.2b
Total morphological abnormalities
(%)
13.6±0.8a 17.8±1.1b 19.4±0.5b
After freeze-thawing
Progressive motility (%) 36.0±2.1a 27.5±1.1b 13.5±1.3c
Live sperm with intact acrosome
(%)
39.5±2.0a 30.5±1.7b 16.6±1.4c
Total morphological abnormalities
(%)
26.1±1.1a 35.6±0.9b 38.5±1.0b
Variations (Mean±S.E.) in sperm qualitative parameters at different stages of cryopreservation. Mithun semen was cryopreserved in citrate-egg yolk-glycerol diluent and glycerol was added into diluent in a single dose.
N R C Mithun
5 6 7 5 6 7 5 6 70
15
30
45
60
75
Progressive motility (%)
Live sperm with Intact Acrosome (%)
Total Morphological Abnormalities (%)
After final dilution
Glycerol (5, 6 & 7%)
(%)
5 6 7 5 6 7 5 6 70
15
30
45
60
75
Progressive motility (%)
Live sperm with Intact Acrosome (%)
Total Morphological Abnormalities (%)
After 4-h equilibration
aa
b
aab
b
ab b
Glycerol (5, 6 & 7%)
(%)
5 6 7 5 6 7 5 6 70
15
30
45
60
75 Progressive motility (%)
Live sperm with Intact Acrosome (%)
Total Morphological Abnormalities (%)
After freeze-thawing
a
b
c
a
b
ca
b b
Glycerol (5, 6 & 7%)
(%)
Variations (Mean±S.E.) in sperm qualitative parameters at different stages of cryopreservation. Mithun
semen was cryopreserved in citrate-egg yolk-glycerol diluent and glycerol was added into diluent in a single
dose.

N R C Mithun
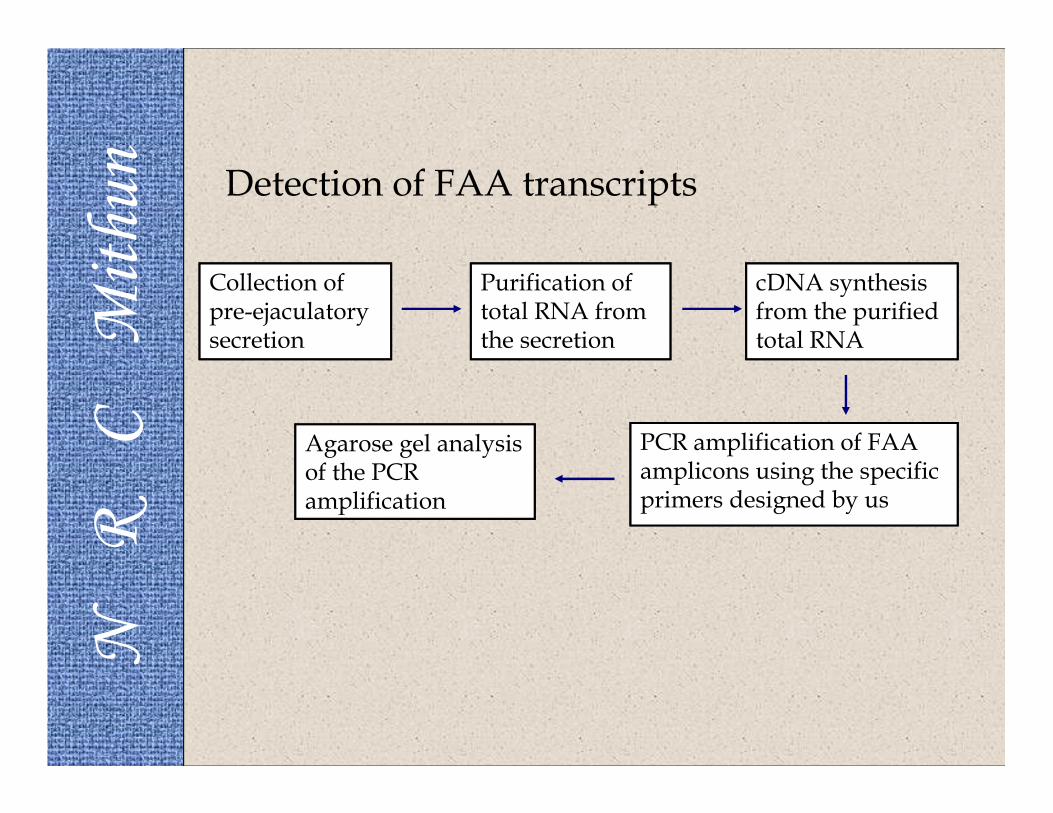
• Detecting transcripts of the fertility associatedantigen (FAA) in mithun semen through PCRtechnique.
• Osteopontin and Heparin binding proteintranscripts ( partial coding sequence) have beenamplified and sequenced (published in genebank - Osteopontin- 423 bp cds, Accession no-GU451284 GU451285 GU451286, Heparinbinding protein-156bp cds, Accession no-GU451281 GU451282 GU451283).
Molecular method for detecting fertility associated antigen in Mithun seminal plasma
N R C Mithun
Collection of pre-ejaculatory secretion
Purification of total RNA from the secretion
cDNA synthesis from the purified total RNA
PCR amplification of FAA amplicons using the specific primers designed by us
Agarose gel analysis of the PCR amplification
Detection of FAA transcripts

N R C Mithun
β-actin (M: 100 bp marker; 1: animal-1; 2: animal-2; 3: animal-3; 4: animal-4; 5: animal-5)
500 bp 441 bp
M 1 2 3 4 5

N R C Mithun
200 bp166 bp
1 2 3 4 5 M
500 bp425 bp
Heparin binding protein (M: 100 bp marker; 1: animal-1; 2: animal-2; 3: animal-3; 4: animal-4; 5: animal-5)
Osteopontin (M: 100 bp marker; 1-2: animal-1; 3-4: animal-2; 5-6: animal-3; 7-8: animal-4; 9-10: animal 5)

N R C Mithun
The First Mithun Calf Born Through AI at Farm

N R C Mithun AI at Khonoma village

N R C Mithun AI CALF BORN AT VILLAGE LEVEL

N R C Mithun Superovulation and Embryo Transfer (ETT)
Although AI permits partial improvement in geneticmakeup through superior germplasm.
For the rapid multiplication of superior germplasmETT may be adopted as one of the measures.
The technique provides unlimited scope of producinggenetically superior animals within a short period oftime.
MOET may be used for genetic enhancement ofmithun and ex situ conservation of this valuablespecies

N R C Mithun
CIDR to Donor &
recipient
Day 0 Day 7
PGF2α to Donor &
recipient
D 10/11
Heat
Day 0
D 10
D
11
D
12
D
13
Morning & Evening
FSH administration to
Donor cows
PGF2α to
Donor &
recipient
Heat
D 0
AI to Donor
cows +
Chorulon 3000
IU
D 6
Embryo collection,
evaluation & transfer
to recipient cows
Embryo cryo-
preservation/vitrific
ation for future use
Superovulation & ETT protocol
Day 8
CIDR Removal

N R C Mithun
Day of cycle Folltropin treatment (mg)
Morning Evening
Day 10 50 50
Day 11 50 50
Day 12 50+0.45mg Tiaprost 50+0.45mg Tiaprost
(PGF2α analogue) (PGF2α analogue)
Day 13 50 50
Table 1. Superovulatory regimen for the mithun
N R C Mithun
• Flushing on day 6 of the Oestrus cycle (Day 0- Day of estrus)
• Evaluation of Embryos.
• Transferred to recipients.

N R C Mithun
Standardization of superovulation and embryo transfer protocols in Mithun (Bos frontalis)
N R C Mithun
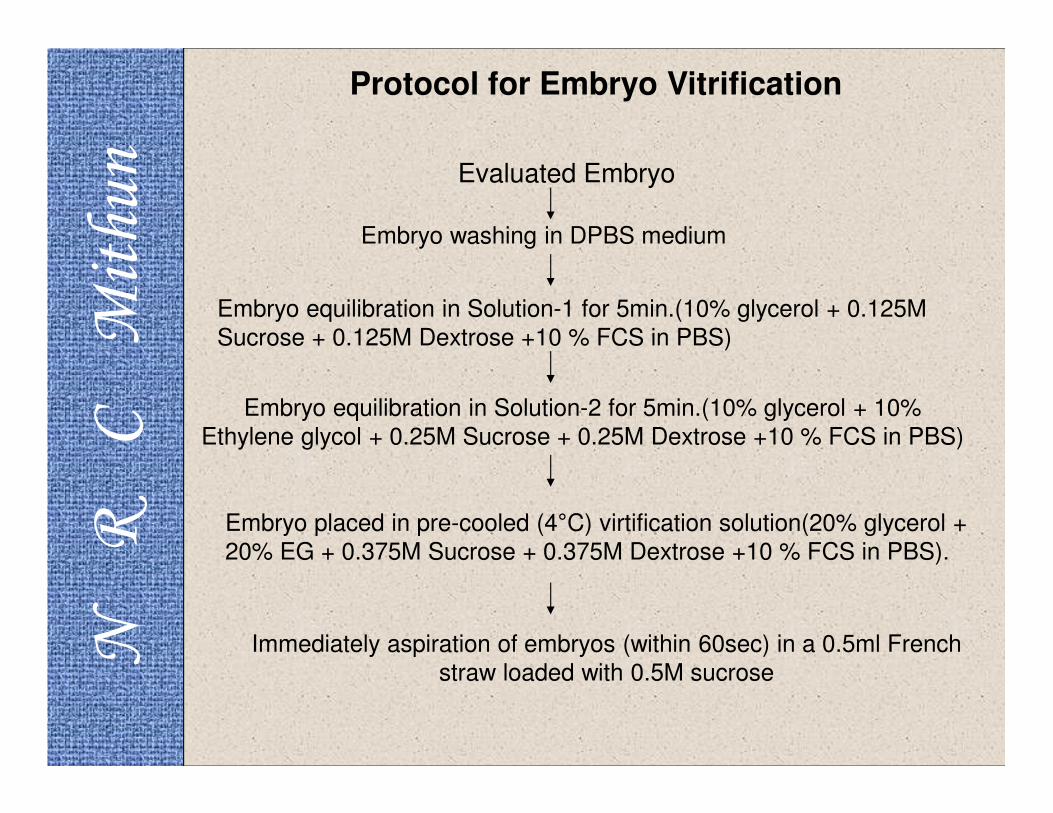
Evaluated Embryo
Protocol for Embryo Vitrification
Embryo washing in DPBS medium
Embryo equilibration in Solution-1 for 5min.(10% glycerol + 0.125M
Sucrose + 0.125M Dextrose +10 % FCS in PBS)
Embryo equilibration in Solution-2 for 5min.(10% glycerol + 10%
Ethylene glycol + 0.25M Sucrose + 0.25M Dextrose +10 % FCS in PBS)
Embryo placed in pre-cooled (4°C) virtification solution(20% glycerol +
20% EG + 0.375M Sucrose + 0.375M Dextrose +10 % FCS in PBS).
Immediately aspiration of embryos (within 60sec) in a 0.5ml French
straw loaded with 0.5M sucrose

N R C Mithun
OpenedAir Bubble
Embryo in Virtification solution
Sucrose(0.5M)
Sucrose(.05M)
Factory seal end
Air Bubble
Straw sealing with PVA powder
Kept on liquid nitrogen vapour for 1min
Plunged into LN2(-196°C)

N R C Mithun Onset of estrus and duration in mithun
cows following PGF2α treatment
No. of
animal
No. of animal in
oestrus
Interval between
PGF2 α treatment
and onset of
oestrus (h)
Duration of
oestrus(h)
9 9 55.0±3.0 22.5±.2.5

N R C Mithun
2nd Animal 1st Animal
3rd Animal 4th Animal
Morula recovered from mithun following superovulation and flushing

N R C Mithun
MOHAN, world’s first ETT born mithun calf from100-day cryopreserved embryo
BHARAT, first Mithun calf
born through ETT
Estrus synchronization/superovulation/ETT

N R C Mithun Ovum pick-up for in vitro embryo
production
A powerful technology for increasing productivity in animals
Instead of superovulation and embryo flushing, a non
surgical transvaginal ultrasound guided ovum pick-up (OPU)
has been developed followed by in vitro maturation (IVM) and
fertilisation (IVF) and embryo culture up to blastocyst stage
OPU can be applied to high- value female calves for breeding
even before they reach their normal breeding age.

N R C Mithun
Transgenesis
In transgenic individual, a foreign desirable gene is deliberately
inserted into its genome. This foreign gene is constructed using
recombinant DNA methodology. Research is underway to improve the
disease resistance, increase the growth and carcass quality of pigs by
introducing gene controlling growth

N R C Mithun
Cloning
� Cloning is a process by which animals are reproduced asexually.
�The process involves removing the chromosomal DNA from
mature oocytes and replacing it with a cell from the donor animal
to be cloned.
� The donor cell is then fused with the enucleated oocyte and
activated either chemically or with an electrical pulse to induce
activation and reprogramming of the somatic cell genome to that
of an embryonic genome.
�Reconstructed cloned embryos are then cultured for 6 to 9 d and
viable embryos are transferred to synchronized recipients and
carried to term to produce live cloned offspring

N R C Mithun