2009 actuarial report on louisiana public retirement systems
TRANSCRIPT
2009 ACTUARIAL REPORT ON LOUISIANA PUBLIC RETIREMENT SYSTEMS
ISSUED JANUARY 2012

LOUISIANA LEGISLATIVE AUDITOR 1600 NORTH THIRD STREET
POST OFFICE BOX 94397 BATON ROUGE, LOUISIANA 70804-9397
LEGISLATIVE RETIREMENT COMMITTEE CHAIRMEN
HONORABLE J. KEVIN PEARSON,
CHAIRMAN HONORABLE D. A. “BUTCH” GAUTREAUX,
CHAIRMAN HOUSE RETIREMENT COMMITTEE SENATE RETIREMENT COMMITTEE
LEGISLATIVE AUDITOR DARYL G. PURPERA, CPA, CFE
FIRST ASSISTANT LEGISLATIVE AUDITOR
AND STATE AUDIT SERVICES PAUL E. PENDAS, CPA
MANAGER OF ACTUARIAL SERVICES
PAUL T. RICHMOND, ASA, MAAA, EA
Under the provisions of state law, this report is a public document. A copy of this report has been submitted to the governor, to the retirement committee chairmen, and to other public officials. A copy of this report is available for public inspection at the Baton Rouge office of the Louisiana Legislative Auditor. For questions, please call Paul T. Richmond at 225-339-3897. This document is produced by the Louisiana Legislative Auditor, State of Louisiana, Post Office Box 94397, Baton Rouge, Louisiana 70804-9397 in accordance with Louisiana Revised Statute 24:513. Twenty-five copies of this public document were produced at an approximate cost of $313.75. This material was produced in accordance with the standards for state agencies established pursuant to R.S. 43:31. This report is available on the Legislative Auditor’s Web site at www.lla.la.gov/reports_data/actuaryreports. In compliance with the Americans With Disabilities Act, if you need special assistance relative to this document, or any documents of the Legislative Auditor, please contact Kerry Fitzgerald, Chief Administrative Officer, at 225-339-3800.

2009 Actuarial Report on
Louisiana Public Retirement Systems
January 2012

2009 ACTUARIAL REPORT
LOUISIANA PUBLIC RETIREMENT SYSTEMS
TABLE OF CONTENTS
Transmittal Letter
PAGE(S)
EXECUTIVE SUMMARY
1-20
SECTION I: EMPLOYER FUNDING FOR PENSION BENEFITS
1. Funding Methods/Components 21
2. Minimum Employer Contribution Limits – State Systems 23
3. Employer Contribution Rates 26
4. Employer Contribution Sources 28
5. Employer Actuarial Cost History – State Systems 31
6. Total Projected Contribution Rate History (All Sources) 33
7. Insurance Premium Tax Fund (IPTF) – Assessments 35
8. Experience Account Summary 38
9. IUAL Funds (Texaco Funds & Appropriations) 41
10. Asset Balances 44
11. Investment Returns 47
12. Expected Investment Experience 49
13. UAL Balances 52
14. Funding Measures Under GASB 54
15. Funding Progress – Funded Levels and Funded Ratios 55
16. Participant Census and Payroll 60
17. Funding of TRSL Optional Retirement Plan 61
TABLE OF CONTENTS (CONCLUDED) PAGE(S)
SECTION II: BENEFIT FORMULAS, RETIREMENT ELIGIBILITY, AND
CONTRIBUTION RATES
1. Benefit Accruals and Member Contribution Rates 63
2. Benefit Levels and Employee Paid Portion 68
3. Projected Contribution Rates 72
SECTION III: ACTUARIAL CONCERNS – FUNDING ISSUES
1. The Cost of Funding the UAL for State Systems 75
2. Structural Changes for Amortizing the UAL 81
3. Effect of Changing Commitment to Amortize the UAL for LASERS and TRSL
88
4. Effect of Changing Commitment to Amortize the UAL for LSERS
95
5. Effect of Changing Commitment to Amortize the UAL for STPOL
100
6. Contribution Relief for Municipal Police Employees’ Retirement System and Firefighters’ Retirement System
103
7. Cost of Living Adjustments 109
8. Indirect Funding of Pension Plan Costs 113
9. Cash Flow and Liquidity 117
10. Adverse Selection/Risk Exposure 122
11. Active Versus Inactive Trends 127
12. Actuarial Certification 132
SECTION IV: RECENT LEGISLATION
1. Summary of Retirement Legislation Enacted in 2009 133
LOUISIANA LEGISLATIVE AUDITOR
DARYL G. PURPERA, CPA, CFE
1600 NORTH THIRD STREET • POST OFFICE BOX 94397 • BATON ROUGE, LOUISIANA 70804-9397
WWW.LLA.LA.GOV • PHONE: 225-339-3800 • FAX: 225-339-3870
January 11, 2012 The Honorable Bobby Jindal The Honorable John A. Alario, President Governor of the State of Louisiana Louisiana Senate Post Office Box 94004 Post Office Box 94183 Baton Rouge, Louisiana 70804-9004 Baton Rouge, Louisiana 70804-9183 The Honorable Charles E. “Chuck” Kleckley, Speaker Louisiana House of Representatives Post Office Box 94062 Baton Rouge, Louisiana 70804-9062 Re: 2009 Annual Actuarial Report on Louisiana Public Retirement Systems The Louisiana Legislative Auditor evaluates, as to actuarial soundness, the state, municipal and parochial retirement systems, funded in whole or in part out of Louisiana public funds. This report, which is prepared by the Actuarial Services section of my office, is submitted in accordance with R.S. 24:513(C)(1) and R.S. 11:271(C)(2) and includes within its scope the thirteen state and statewide retirement systems for their fiscal years ending 2009. Our review consisted primarily of the collection of information and data provided by the systems and approved by the Public Retirement Systems’ Actuarial Committee (PRSAC), and the organization of this information into a consolidated format. This report is not an audit and therefore it has not been prepared in compliance with auditing procedures as set forth by Government Auditing Standards; nor do we offer an opinion on the systems’ financial statements or internal controls. While Actuarial Services within our office has applied certain actuarial analysis to this information, we have not examined actuarial assumptions and methods used in determining reserves and related actuarial items. Therefore, we do not express an opinion thereon. However, Section III of the report contains Statements of Actuarial Opinion that have been certified by our actuary. In general, we believe that if the systems comply with contribution rates approved by PRSAC, both now and in the future, if all assumptions are realized, and if there is due care of trust assets, the systems are and will be funded on an actuarially sound basis.

2009 ACTUARIAL REPORT ON LOUISIANA PUBLIC RETIREMENT SYSTEMS ____________________
The accompanying report presents an executive summary of our analysis as well as a consolidation of information provided by the systems. This report is intended primarily for your use and the use of the systems. Copies of this report have been delivered to those as required by law. It is also being made public through the Legislative Auditor’s Web site at www.lla.la.gov/reports_data/actuaryreports.
Respectfully submitted, Daryl G. Purpera, CPA, CFE Legislative Auditor
DGP:PTR:pm ACTUARIAL REPORT LETTER

Executive Summary

EXECUTIVE SUMMARY
2009 Actuarial Report on Louisiana Public Retirement Systems
Purpose of Report
2009 Report The 2009 Actuarial Report on Louisiana Public Retirement Systems was prepared for the legislature, the governor, and other interested parties involved in the retirement systems’ decision-making process.
This comprehensive actuarial report summarizes the funding and financial status of the thirteen state and statewide retirement systems for their fiscal years ending in 2009. It includes data and history for the four state retirement systems and the nine statewide retirement systems. The report is organized into the following sections which are summarized in this Executive Summary. SECTION I – EMPLOYER FUNDING FOR PENSION BENEFITS (pages 21 thru 62).
SECTION II – BENEFIT FORMULAS, RETIREMENT ELIGIBILITY, AND CONTRIBUTION RATES (pages 63 through 73).
SECTION III – ACTUARIAL CONCERNS – FUNDING ISSUES (pages 75 through 132). SECTION IV – RECENT LEGISLATION (pages 133 through 135).
Louisiana Statutes Pursuant to Louisiana Revised Statutes, this report is being submitted to the governor and the legislature summarizing the financial and actuarial history of the Louisiana public retirement systems. The report also includes comments on any findings that may materially affect the actuarial soundness of the retirement systems.

Page 2 Executive Summary
State Systems Benefits are guaranteed under the state constitution for the four state retirement systems listed below.
LASERS Louisiana State Employees’ Retirement System
TRSL Teachers’ Retirement System of Louisiana
LSERS Louisiana School Employees’ Retirement System
STPOL State Police Pension and Retirement System
Statewide Systems Benefits are not guaranteed under the state constitution for the
nine statewide retirement systems.
ASSR Louisiana Assessors’ Retirement Fund
CCRS Clerks of Court Retirement and Relief Fund
DARS District Attorneys’ Retirement System
FRS Firefighters’ Retirement System
MERS Municipal Employees’ Retirement System (Plans A&B)
MPERS Municipal Police Employees’ Retirement System
PERS Parochial Employees’ Retirement System (Plans A&B)
RVRS Registrars of Voters Employees’ Retirement System
SPRF Sheriffs’ Pension and Relief Fund

Executive Summary Page 3
SUMMARY OF VALUATION RESULTS FOR FY 2009a
Employer
Contribution Ratesb
Unfunded Accrued Liability
FY 2009
Actuarial Value of Assets
FY 2009
Systems: FY 2010 FY 2011 (in millions) (in millions) AVA/PBO
State Systems:
LASERS 18.6% 22.0% $ 5,694.0 $ 8,499.7 60.8%
TRSL 15.5% 20.2% 10,117.5 13,500.3 59.1%
LSERS 17.6% 24.3% 743.0 1,410.3 65.5%
STPOL 41.3% 50.9% 282.4 395.9 58.4%
State Total $ 16,836.9 $ 23,806.2 60.0%
Statewide Systems:
ASSR 8.50% 4.00% $ 22.8 $ 206.7 82.0%
CCRS 11.75% 17.25% 86.2 338.8 70.8%
DARS 5.00% 9.00% n/a 221.1 91.6%
FRS 14.00% 21.50% 336.8 1,073.8 78.4%
MERS A 10.25% 13.75% 74.6 670.9 84.4%
MERS B 4.50% 6.00% 4.9 138.4 91.1%
MPERS 11.00% 25.00% 691.3 1,297.1 65.2%
PERS A 15.75% 13.25% 53.6 2,135.2 93.4%
PERS B 10.00% 8.50% n/a 150.4 95.9%
RVRS 3.50% 11.25% n/a 60.5 83.6%
SPRF 9.00% 12.75% 72.8 1,608.2 80.0%
Statewide Total $ 1,343.0 $ 7,901.1 80.6%
Total All Systems: $ 18,179.9 $ 31,707.3 64.1%
Page Reference Page 26, 27 Page 53 Page 45, 46 Page 56, 57
Footnotes:
a FY 2009 means the fiscal year ending on June 30, 2009, for all retirement systems except ASSR and PERS. FY 2009 for ASSR means the fiscal year ending on September 30, 2009. FY 2009 for PERS means the fiscal year ending December 31, 2009.
b Rates shown for FY 2010 are contribution rates adopted by PRSAC in February 2009 (rates were adopted by PRSAC for ASSR and PERS in the fourth quarter of 2008) and multiplied by employer payroll for FY 2010 to determine employer contributions for each retirement system for FY 2010.
Rates shown for FY 2011 are employer contribution rates projected for FY 2011 based on the valuation date ending in FY 2009 for each retirement system. These rates are the rates recommended by the actuary for each retirement system and approved by the systems’ boards of directors. These rates are subject to approval by PRSAC in February 2010 (fourth quarter of 2009 for ASSR and PERS) and the Louisiana Legislature in the 2010 legislative session.

Page 4 Executive Summary
SUMMARY OF VALUATION RESULTS FOR FY 2009
Investment Returnsa Membership
Systems: Market Value
AVA
Assumed Rate Actives Retireesb Totalc
Payroll (in millions)
State Systems:
LASERS -19.6% -7.6% 8.25% 61,991 40,936 104,874 $ 2,563
TRSL -22.3% -12.3% 8.25% 88,206 65,838 159,916 3,912
LSERS -16.9% -7.1% 7.50% 13,265 12,798 26,424 315
STPOL -19.0% -7.1% 7.50% 1,103 1,193 2,321 60
State Total 164,565 120,765 293,535 $ 6,850
Statewide Systems:
ASSR 6.6% 6.8% 8.00% 761 470 1,312 $ 38
CCRS -19.3% -6.1% 8.00% 2,257 1,008 3,704 86
DARS -14.2% -3.0% 8.00% 725 183 1,194 50
FRS -20.8% -4.9% 7.50% 3,882 1,835 6,179 179
MERS A -13.8% 0.9% 8.00% 4,829 3,084 10,681 157
MERS B -13.7% 0.9% 8.00% 2,204 898 4,191 65
MPERS -24.2% -16.7% 7.50% 6,071 4,169 10,352 270
PERS A 20.6% 9.1% 7.50% 14,367 5,841 27,381 536
PERS B 20.7% 8.8% 7.50% 2,253 597 4,394 80
RVRS -18.3% -6.2% 8.00% 238 147 409 12
SPRF -17.4% -5.0% 8.00% 14,396 3,369 22,506 577
Statewide Total 51,983 21,601 92,303 $ 2,050
Total All Systems 216,548 142,366 385,838 $ 8,900
Page Reference Page 47 Page 60
Footnotes:
a Investment returns are for FY 2009. b DROP members are counted as Retirees. c Total membership includes members entitled to a deferred pension or a refund of contributions. Counts
for members in these categories are not shown separately.

Executive Summary Page 5
SECTION I – Employer Funding for Pension Benefits
Actuarial Funding The most fundamental principle of actuarial funding is:
Benefits = Contributions + Investment Earnings All benefit payments from a retirement system will be paid
from contributions into the system made by participating employees and employers and from earnings on invested contributions. The earlier that contributions are made, the greater the opportunity to invest and earn investment income. The earlier that contributions are made, the lesser the portion of benefits that will be paid from contributions and the greater the portion that will be paid from investment income.
The role of the actuary is to select an actuarial model and
assumptions that will provide for contributions from year to year that are consistent with the budgeting constraints of the plan sponsor. Because pension benefits are a form of deferred compensation, the methods and assumptions used by the actuary should closely reflect the value of benefits that are earned or allocated to each fiscal year. By doing so, the plan sponsor should be able to minimize cost transfers from one generation of workers to another.
The only true management tool that an actuary has is the
selection of the actuarial methods used to allocate benefit accruals to fiscal years and the methods used to smooth fluctuations in the market value of assets. It is tempting at times to try to use actuarial assumptions to manage contribution requirements, but the end result is a distortion of the true cost of the pension plan and such a distortion leads to intergenerational transfers of cost. It is therefore critical that the actuary use assumptions that reflect the best expectations of future events.
A retirement system that uses appropriate actuarial methods,
that uses and monitors actuarial assumptions to ensure that they are good predictors of future events, and that can require that contributions from member employees and employers be paid when due, will be a system that is actuarially sound. Such a system will accumulate assets sufficient to pay benefits when they become due and payable.
Page 6 Executive Summary
Investment Income Investment earnings include all income earned under the trust such as dividends, interest, and capital gains or losses, and are essential to meet the long range projections and assumptions under the actuarial funding method. Perhaps the most important assumption that the actuary makes in his calculations of plan liabilities and contribution requirements is the investment return assumption. Investment return assumptions used in the preparation of the 2009 actuarial valuations for the thirteen Louisiana retirement systems ranged from 7.50% to 8.25%.
Contributions Contribution requirements are a function of the benefit
provisions of the retirement system and the actuarial methods and assumptions used by the actuary. Required contributions for the thirteen systems are derived from many different sources – participating employees, participating employers, ad valorem taxes, revenue sharing funds, the Insurance Premium Tax Fund (IPTF), and special legislative appropriations.
Member contributions are fixed by statute and may vary for different group classifications within a retirement system. Annual employer contributions are determined each year through an actuarial valuation.
State Retirement Systems
General Annual employer contribution requirements can be separated into two components – the normal cost and payments toward amortization of the unfunded accrued liability.
Normal Cost The normal cost reflects the value of all benefits earned
during the plan year by participating members. The total normal cost is partially paid by participating members and partially by participating employers. Member contributions are a fixed percentage of pay that varies from system to system and by sub plan within systems. Participating employers must contribute the balance of the total normal cost, if any.
Unfunded Accrued Liability Each of the state systems has an unfunded accrued liability
(UAL). The actuary calculates the amount of assets the system would currently have if current benefit provisions had always been in place, if current actuarial methods had been used, if past experience from the plan’s inception had been

Executive Summary Page 7
exactly consistent with current actuarial assumptions, and if plan investments had always earned the current investment return assumption. This value is called the Actuarial Accrued Liability. The UAL, then, is the difference between the Actuarial Accrued Liability and the current value of system assets.
The UAL is essentially a debt that participating employers
owe to the retirement system. It reflects contributions that should have been made and investment income that should have been earned. In order for benefits to be paid as scheduled to participating members, this debt must be paid. To pay this debt, the system establishes a payment schedule that will amortize the debt over a period of years. Participating employers are primarily responsible for annual amortization payments.
Employer Contribution Sources Actuarially determined contribution requirements, not paid
by participating employees, are the responsibility of participating employers. Employer contribution sources are summarized below for each state retirement system.
Sources of Employer Contribution
System
Local 1
Ad
Valorem 2
MFP 3
State General
Fund 4
LASERS x
TRSL x x x x
LSERS x
STPOL x
1. Amounts derived from local sources raised by
individual government entities.
2. Amounts reflecting a percentage of taxes collected by the parishes in accordance with Louisiana statutes.
3. Amounts derived from the Minimum Foundation
Program (MFP), which reflects transfer payments from the state to local school districts.
4. Amounts paid out of the state General Fund.

Page 8 Executive Summary
Guaranteed Payment The Louisiana Constitution guarantees an annual employer contribution to the four state systems sufficient to pay the normal cost and to amortize by 2029 the Initial Unfunded Accrued Liability (IUAL) established as of June 30, 1988. If the legislature fails to provide this payment, the state treasurer must pay the required amount from the state General Fund upon a warrant issued by the administrative authority of the retirement system affected by the shortfall. The constitution requires that the retirement systems be funded on an actuarially sound basis.
UAL Balance As of June 30, 2009, the four state systems had a combined
UAL balance of $16.8 billion. The combined payment to fund this amount for FY 2009 is $1.076 billion. It represents 70.8% of the $1.518 billion of required employer contributions to actuarially fund the four state systems.
UAL BALANCES as of 6/30/2009
(in millions)
System
Actuarial Accrued Liability
(AL)
Valuation
Assets (VA)
Valuation
UAL (AL) – (VA)
LASERS $ 13,986.8 $ 8,292.8 $ 5,694.0
TRSL 22,839.4 12,721.9 10,117.5
LSERS 2,153.3 1,410.3 743.0
STPOL 678.3 395.9 282.4
Combined $ 39,657.8 $ 22,820.9 $ 16,836.9

Executive Summary Page 9
Projected Employer Contributions LASERS The total required employer contribution is paid directly from
appropriations from the General Fund and from programs that are federally funded.
Projected Employer Contributions
(in millions)
LASERS FY 2010 FY 2011
Employer Contributions* $480.3 $597.1
Projected Rate (% Payroll) 18.6% 22.0%
15.5% Minimum Required n/a n/a
TRSL The total required employer contribution is paid directly from
appropriations from the General Fund, from local school districts (primarily out of MFP transfer payments from the state), from ad valorem taxes, and from programs that are federally funded.
Projected Employer Contributions
(in millions)
TRSL FY 2010 FY 2011
Employer Contributions* $654.9 $920.1
Projected Rate (% Payroll) 15.5% 20.2%
15.5% Minimum Required Yes No
LSERS The total required employer contribution is paid directly from
local school districts (primarily out of MFP transfer payments from the state).
Projected Employer Contributions
(in millions)
LSERS FY 2010 FY 2011
Employer Contributions* $53.0 $79.5
Projected Rate (% Payroll) 17.6% 24.3%
6.0% Minimum Required n/a n/a

Page 10 Executive Summary
STPOL The total required employer contribution is paid directly from appropriations from the General Fund and from the IPTF.
Projected Employer Contributions
(in millions)
STPOL FY 2010 FY 2011
Employer Contributions* $24.5 $31.6
Projected Rate (% Payroll) 41.3% 50.9%
Insurance Premium Tax Fund $1.5 $1.5
Based on member pay as of 6/30/2009.
IUAL Funds LASERS and TRSL both maintain assets in a side fund that
is contained within their respective trusts. These side funds, called the IUAL Fund, have received deposits over the years from special legislative appropriations and from the Texaco Settlement. These funds are credited annually with the actuarial rate of return on assets.
Act 497 of the 2009 session provides that outstanding
balances in the Experience Account Funds will be transferred to the IUAL Funds on June 30, 2009. Amounts so transferred were $122.2 million for LASERS and $296.7 million for TRSL. Also in accordance with Act 497, the IUAL Funds will be liquidated on June 30, 2010, with the proceeds used to reduce the outstanding UAL for the retirement systems. The amounts shown below include amounts transferred from the Experience Accounts to the IUAL Funds.
IUAL FUND BALANCES
(as of 6/30/2009) (in millions)
LASERS TRSL Combined
Balance $ 206.8 $ 671.5 $ 878.3
Executive Summary Page 11
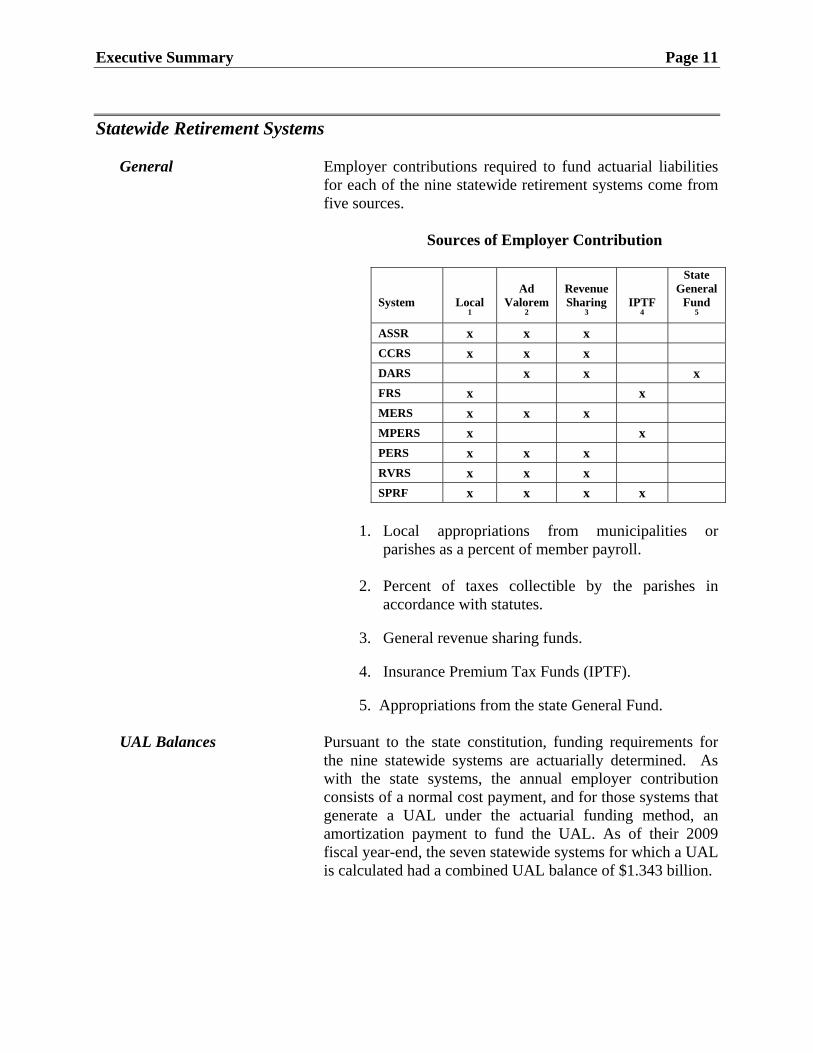
Statewide Retirement Systems General Employer contributions required to fund actuarial liabilities
for each of the nine statewide retirement systems come from five sources.
Sources of Employer Contribution
System
Local 1
Ad
Valorem 2
Revenue Sharing
3
IPTF 4
State General
Fund 5
ASSR x x x
CCRS x x x
DARS x x x
FRS x x
MERS x x x
MPERS x x
PERS x x x
RVRS x x x
SPRF x x x x
1. Local appropriations from municipalities or
parishes as a percent of member payroll. 2. Percent of taxes collectible by the parishes in
accordance with statutes.
3. General revenue sharing funds.
4. Insurance Premium Tax Funds (IPTF).
5. Appropriations from the state General Fund.
UAL Balances Pursuant to the state constitution, funding requirements for the nine statewide systems are actuarially determined. As with the state systems, the annual employer contribution consists of a normal cost payment, and for those systems that generate a UAL under the actuarial funding method, an amortization payment to fund the UAL. As of their 2009 fiscal year-end, the seven statewide systems for which a UAL is calculated had a combined UAL balance of $1.343 billion.

Page 12 Executive Summary
UAL Balances – Statewide Systems as of June 30, 2009
(in millions)
FY 2008 FY 2009
ASSR $ 23.9 $ 22.8
CCRS 85.2 86.2
FRS 187.4 336.8
MERS (Plans A & B) 79.2 79.5
MPERS 240.3 691.3
PERS Plan A 60.4 53.6
SPRF 74.3 72.8
Combined UAL $ 750.7 $ 1,343.0
Aggregate Funding DARS, PERS Plan B, and RVRS use the Aggregate Funding Method – an actuarial funding method that requires all unfunded benefit liabilities to be paid through future normal costs. Under this method, there is no unfunded accrued liability and therefore no UAL to amortize.
Projected Employer Contributions
Projected employer contribution rates for the statewide systems are shown below. These rates will be applied to the payrolls for the identified fiscal years.
Statewide System Projected Rate
FY 2010 FY 2011
ASSR 8.50% 4.00%
CCRS 11.75% 17.25%
DARS 5.00% 9.00%
FRS 14.00% 21.50%
MERSA 10.25% 13.75%
MERSB 4.50% 6.00%
MPERS 11.00% 25.00%
PERSA 15.75% 13.25%
PERSB 10.00% 8.50%
RVRS 3.50% 11.25%
SPRF 9.00% 12.75%
A minimum contribution rate is set by statute for FRS, MPERS and SPRF. The minimum rate for FRS and MPERS is 9.0% of pay. The minimum rate for SPRF is 7.0% of pay.

Executive Summary Page 13
Employer contribution requirements above the statutory rate may be paid from the IPTF. The employer is responsible for any additional funding requirements not covered by IPTF allocations. Prior to FY 2002, IPTF funds had been sufficient to meet all employer contribution requirements above the statutory rate.
Required Employer Contributions over the Sum of the IPTF and the Statutory Rate
(in millions) Fiscal Year
FRS MPERS SPRF Total
2001 $ 0.0 $ 0.0 $ 0.0 $ 0.0
2002 9.6 0.0 2.2 11.8
2003 14.2 12.1 8.1 34.4
2004 18.5 25.5 10.2 54.2
2005 18.1 24.9 15.0 58.0
2006 9.4 14.4 17.7 41.5
2007 7.4 10.6 7.8 25.8
2008 5.6 1.9 3.0 10.5
2009 8.5 5.0 10.6 24.1
2010 21.7 41.4 33.1 96.2

Page 14 Executive Summary
SECTION II - Benefit Formulas, Retirement Eligibility, and Contribution Rates
Benefit Formulas Louisiana’s thirteen state and statewide retirement systems provide lifetime benefits under a defined benefit pension plan. Under this type of retirement arrangement, a retired member receives an income based upon a formula that he or she can rely upon for the remainder of his or her lifetime. The pension benefit formula is based on a member’s years of service, final average compensation at retirement, and the form of payment elected.
Benefits accrue at specified rates for each year of service. Accrual rates for regular LASERS and TRSL members are 2.5% per year of service. Accrual rates for certain elected officials and hazardous duty personnel of LASERS and for all other state and statewide systems generally range from 3.0% to 3.5% per year of service. Final Average Compensation (FAC) is based on actual compensation received in the thirty-six (36) highest successive months of employment. FAC for members of LASERS, LSERS, and many statewide retirement systems, who joined the systems on or after the end of the 2006 fiscal year, will be based on a sixty (60) month period (Acts 780 and 835 R.S. 2006). Defined benefit pension plans are generally designed to replace a substantial portion of an employee’s pre-retirement income, particularly for long service employees. Employees with shorter periods of service receive benefits that are proportionally smaller.
Retirement Eligibility All of the state and statewide retirement systems require the attainment of some combination of years of service and age to qualify for retirement benefits. Some systems provide for early retirement benefits with an actuarial reduction to reflect the earlier pension start date and payments that will be made for a longer period of time. Vested benefits, pre-retirement survivor death benefits, disability benefits, Deferred Retirement Option Plan (DROP) benefits, and cost of living adjustments (COLAs) are also included in the overall benefit package of each retirement system and are payable upon meeting established eligibility and statutory requirements.

Executive Summary Page 15
Employee Contributions Active members of all state and statewide retirement systems are required to contribute to the system to which they belong. These contributions pay for a portion of the benefits that the members earn each year. Contribution rates are set by statute and generally range from 7.0% to 10.0% of pay. Judges, court officers and legislators must contribute 11.5% of their pay.
Social Security Social Security coverage is not available to members during
their years of participation in the state and statewide retirement systems except for members of TRSL Plan B, MERS Plan B, and PERS Plan B. The benefit accrual rate for systems covered under Social Security is 2.0% for each year of service. Employee contribution rates for members of these sub plans range from 3.0% to 5.0%.
Replacement Ratios Retirement income amounts that career members of the
various systems can expect to receive relative to the salaries they earned immediately prior to retirement are summarized in Section II, Part 2 of this report. These ratios, called replacement ratios, are based on a projection of the normal retirement benefit at age 65 and the final annual salary for a new member employed for the first time in fiscal year 2009. The ratios depend on benefit provisions that are unique to each retirement system. Because the sub plans covering law enforcement officers and firefighters are quite different from rank and file employees, replacement ratios for these employees are based on retirement at age 55 instead of age 65.
Section II, Part 2 contains a graph that compares the
replacement ratios of all retirement systems. Another graph compares the portion of the total cost of the systems that is paid for by employees (including interest). This comparison is made for new employees hired on July 1, 2009, at age 30 who will retire at age 55. Values are based on benefit provisions, interest rates, and salary increase assumptions of the retirement system in effect as of fiscal year-end 2009. Results show that replacement ratios in general fall between 67% to 83% for all state and statewide plans. However, replacement ratios for rank and file members of LASERS (state employees) and for TRSL (teachers) are only 58% and 57% respectively. Employees pay for 24% to 50% of the total benefit cost, except for judges and court officers who pay 70% of the total cost.
Page 16 Executive Summary
Contribution Rates Section II, Part 3 compares employee and employer contribution rates that will be required by each retirement system during fiscal year 2010. A graph compares the sum of all contributions attributable to the employer and the state with contributions attributable to employees. For comparison purposes, these amounts are expressed as a percentage of annual pay. Contribution requirements in the aggregate – employer contributions, contributions from other public sources, and contributions from members – range from 28.2% of pay for DARS to 58.9% of pay for STPOL.
Executive Summary Page 17
SECTION III - Actuarial Concerns – Funding Issues
Pension Considerations In this section of the report, we address our concerns about issues affecting actuarial funding and pension benefits. Although other issues are discussed, the two most significant issues analyzed in this section of the report are:
1. The UAL and the effect that this debt has had on past
contribution requirements and will have on future requirements.
2. The cost of COLAs and its effect on the UAL in the past
and the COLA program’s future impact on the debt of the retirement systems.
We address these issues primarily to alert the legislature to
potential problems with the funding and the actuarial stability of the retirement systems. The legislature may then take appropriate remedial action to ensure continued actuarial soundness in compliance with the Louisiana Constitution.
Page 18 Executive Summary
SECTION IV - Recent Legislation
Summary of Retirement Legislation for 2009
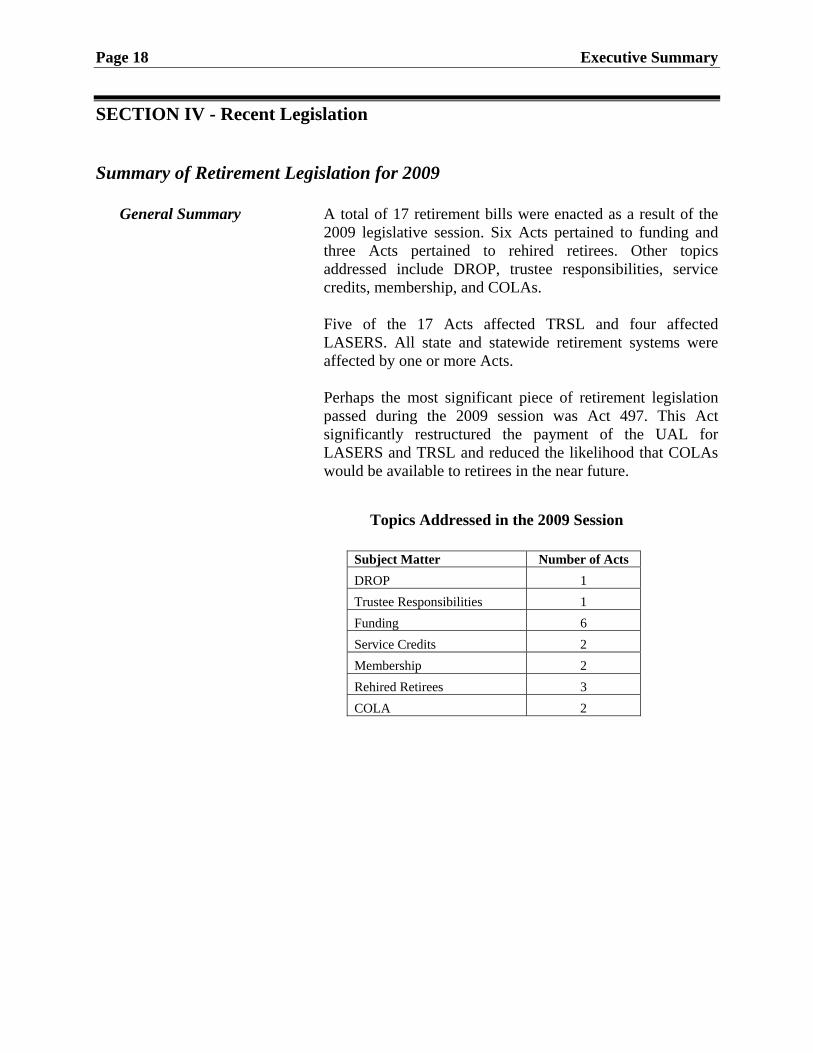
General Summary A total of 17 retirement bills were enacted as a result of the 2009 legislative session. Six Acts pertained to funding and three Acts pertained to rehired retirees. Other topics addressed include DROP, trustee responsibilities, service credits, membership, and COLAs.
Five of the 17 Acts affected TRSL and four affected
LASERS. All state and statewide retirement systems were affected by one or more Acts.
Perhaps the most significant piece of retirement legislation
passed during the 2009 session was Act 497. This Act significantly restructured the payment of the UAL for LASERS and TRSL and reduced the likelihood that COLAs would be available to retirees in the near future.
Topics Addressed in the 2009 Session
Subject Matter Number of Acts
DROP 1
Trustee Responsibilities 1
Funding 6
Service Credits 2
Membership 2
Rehired Retirees 3
COLA 2
Executive Summary Page 19
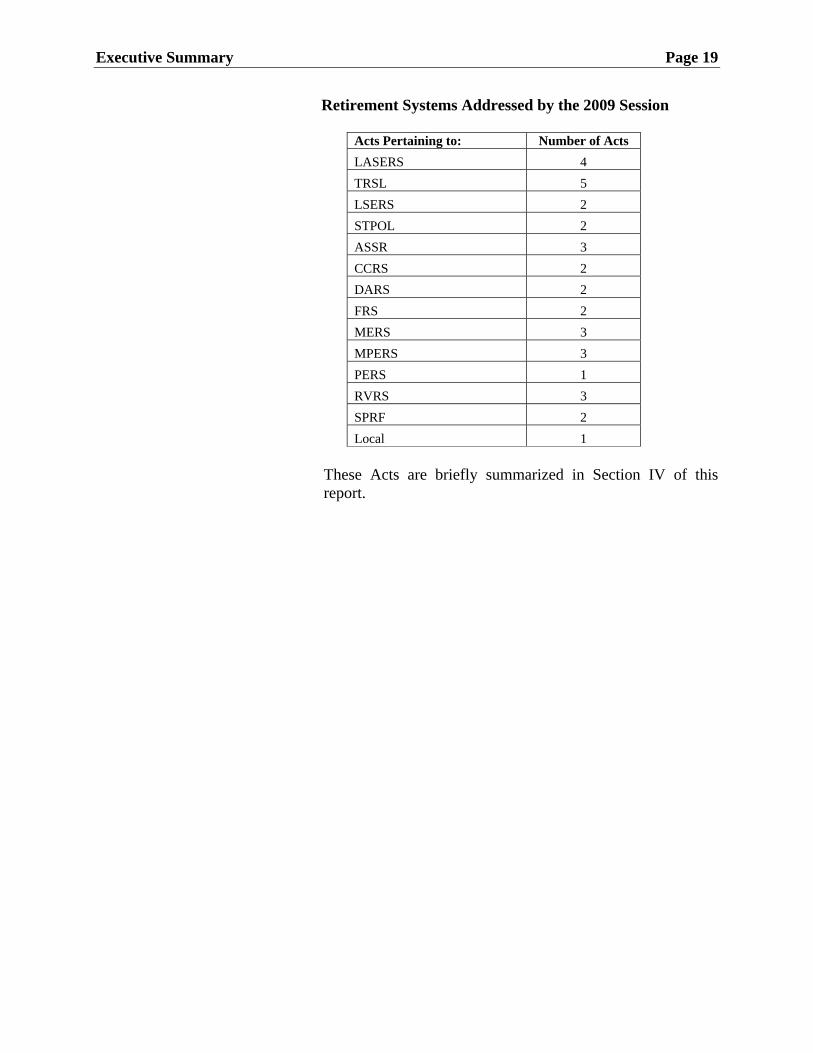
Retirement Systems Addressed by the 2009 Session
Acts Pertaining to: Number of Acts
LASERS 4
TRSL 5
LSERS 2
STPOL 2
ASSR 3
CCRS 2
DARS 2
FRS 2
MERS 3
MPERS 3
PERS 1
RVRS 3
SPRF 2
Local 1 These Acts are briefly summarized in Section IV of this
report.

Page 20 Executive Summary
This page is intentionally blank.

Section I
Employer Funding for Pension Benefits

Employer Funding for Pension Benefits Page 21
1. Funding Methods/Components Funding Method Member contribution rates are fixed by statute. Employer
contribution rates are determined by the actuaries for the retirement systems, reviewed by Actuarial Services within the Louisiana Legislative Auditor, and then approved by PRSAC, subject to review by the legislature. The employer contribution for each system is determined by performing an annual valuation that calculates the actuarial liability associated with future expected benefit payouts. An actuarial funding method allocates this liability between future normal cost payments and amortization payments on the UAL, if any. The goal of all actuarial funding methods is to have contributions plus investment earnings on system assets accumulate to an amount sufficient to provide for future expected benefits and expenses, when due and payable.
SYSTEM ACTUARIAL FUNDING METHODS
as of June 30, 2009
State Systems: System Funding Method Creates UAL LASERS Projected Unit Credit Yes TRSL Projected Unit Credit Yes LSERS Entry Age Normal Yes STPOL Entry Age Normal Yes
Statewide Systems: System Funding Method Creates UAL ASSR Frozen Attained Age Normal IUAL Only CCRS Frozen Attained Age Normal IUAL Only DARS Aggregate No FRS Entry Age Normal Yes MERSA Frozen Attained Age Normal IUAL Only MERSB Frozen Attained Age Normal IUAL Only MPERS Entry Age Normal Yes PERSA Frozen Attained Age Normal IUAL Only PERSB Aggregate No RVRS Aggregate No SPRF Frozen Attained Age Normal IUAL Only
UAL = Unfunded Accrued Liability IUAL = Initial Unfunded Accrued Liability

Page 22 Employer Funding for Pension Benefits
Normal Cost The total normal cost is the portion of the projected actuarial benefit liability allocated under the applicable actuarial cost method to the fiscal year immediately following the valuation date. The employer normal cost is the portion of the total normal cost not funded by member contributions.
Accrued Liability The portion of the projected actuarial benefit liability not
funded by future normal cost payments is the actuarial accrued liability. Under certain actuarial funding methods, the accrued liability is the liability for benefit service already earned by members of the retirement system, including all active and inactive members.
UAL The UAL is the amount by which the actuarial accrued
liability of a retirement system exceeds the assets of the system available to pay benefits on the valuation date. The UAL is based on the actuarial value of assets which reflects the market value of assets that has been smoothed to reduce wide fluctuations from year to year. The actuarial value of assets is then reduced by assets reserved for other purposes. The UAL consists of the IUAL and additional liability amounts created annually each year after 1988. These supplemental liability bases originate through actuarial gains or losses, changes in actuarial assumptions or funding methods, and changes to benefit provisions. The UAL is amortized according to payment methods and periods specified by statute. Under some actuarial funding methods supplemental liabilities are not amortized but are funded as future normal cost payments.
Employer Contributions Actuarially required employer contributions for the year
following the valuation date are determined by combining the normal cost with UAL amortization payments, along with any other expense item deemed necessary by the actuary to fund plan liabilities. These actuarial cost amounts are projected forward to be payable mid-year. Employer contribution rates are then projected for the next following fiscal year relative to payroll also projected for that year.

Employer Funding for Pension Benefits Page 23
2. Minimum Employer Contribution Limits – State Systems
Constitutional Minimum The Louisiana Constitution defines the relationship that must exist between member and employer contribution rates. The constitutional reference in this regard only pertains to state retirement systems. It does not apply to statewide systems. The relationship is summarized below:
For Systems that still have an IUAL (LASERS & TRSL): The minimum employer contribution rate for a given year
must be at least equal to:
The Member Rate on the Valuation Date
x The Constitutional Ratio where the Constitutional Ratio =
The Total Rate on January 1, 1987
- 1 The Member Rate on January 1, 1987
Minimum employer contribution rates for rank and file members of LASERS and TRSL are shown below:
Category Member
Rate Total Rate on 1/1/87
Member Rate on 1/1/87
Constitutional Ratio
Minimum Employer
Rate
LASERS Hired before July 1, 2006
7.50% 17.2% 7.0% 1.45714 10.9%
LASERS Hired after June 30, 2006
8.00% 17.2% 7.0% 1.45714 11.7%
TRSL 7.50% 17.3% 7.0% 1.47143 11.0%
Page 24 Employer Funding for Pension Benefits
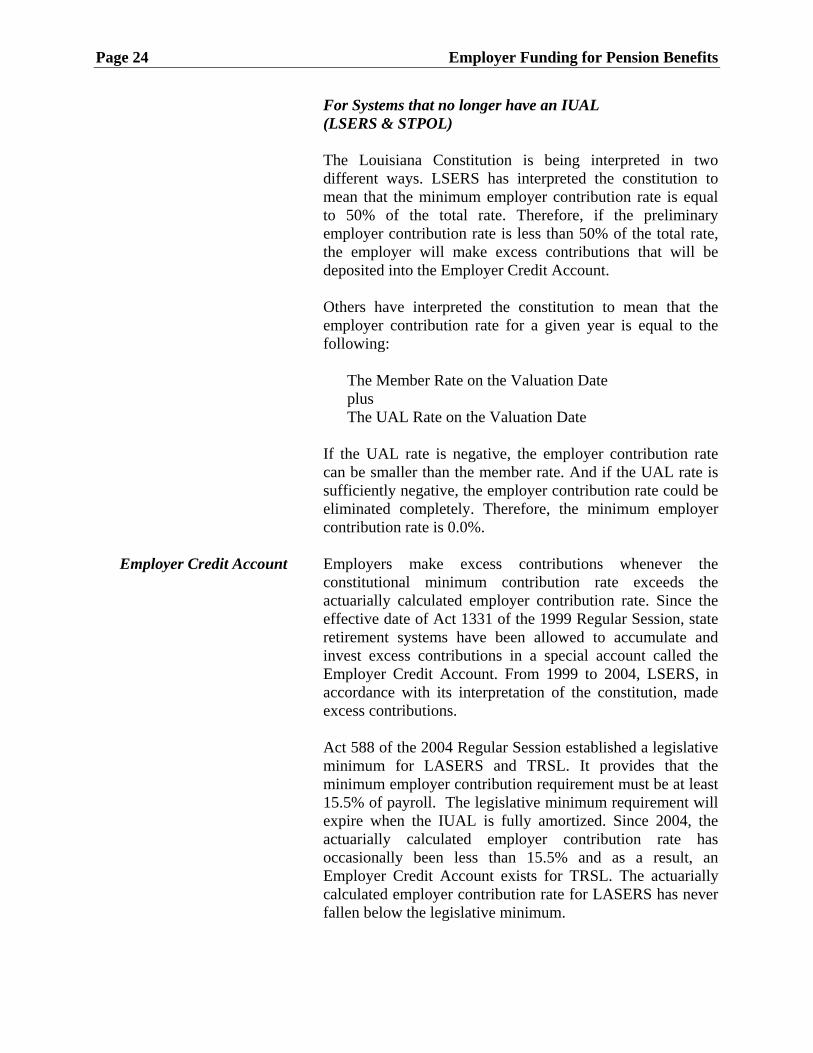
For Systems that no longer have an IUAL (LSERS & STPOL) The Louisiana Constitution is being interpreted in two
different ways. LSERS has interpreted the constitution to mean that the minimum employer contribution rate is equal to 50% of the total rate. Therefore, if the preliminary employer contribution rate is less than 50% of the total rate, the employer will make excess contributions that will be deposited into the Employer Credit Account.
Others have interpreted the constitution to mean that the
employer contribution rate for a given year is equal to the following:
The Member Rate on the Valuation Date plus The UAL Rate on the Valuation Date
If the UAL rate is negative, the employer contribution rate
can be smaller than the member rate. And if the UAL rate is sufficiently negative, the employer contribution rate could be eliminated completely. Therefore, the minimum employer contribution rate is 0.0%.
Employer Credit Account Employers make excess contributions whenever the
constitutional minimum contribution rate exceeds the actuarially calculated employer contribution rate. Since the effective date of Act 1331 of the 1999 Regular Session, state retirement systems have been allowed to accumulate and invest excess contributions in a special account called the Employer Credit Account. From 1999 to 2004, LSERS, in accordance with its interpretation of the constitution, made excess contributions.
Act 588 of the 2004 Regular Session established a legislative
minimum for LASERS and TRSL. It provides that the minimum employer contribution requirement must be at least 15.5% of payroll. The legislative minimum requirement will expire when the IUAL is fully amortized. Since 2004, the actuarially calculated employer contribution rate has occasionally been less than 15.5% and as a result, an Employer Credit Account exists for TRSL. The actuarially calculated employer contribution rate for LASERS has never fallen below the legislative minimum.

Employer Funding for Pension Benefits Page 25
Act 588 mandates that the Employer Credit Account must be used exclusively to reduce any unfunded accrued liability of the retirement system created before July 1, 2004, and cannot be debited for any other purpose.
Act 497 of the 2009 session provides that the outstanding
balance in the Employer Credit Account on June 30, 2010, will be used to reduce the UAL. Balances in this account for LASERS and TRSL as on June 30, 2009, are $0 and $107.3 million, respectively.
Page 26 Employer Funding for Pension Benefits
3. Employer Contribution Rates
Contribution Rates Employer contribution rates are shown as a percent of payroll. In addition, various retirement systems also receive supplemental appropriations from the state, ad valorem taxes, revenue sharing funds, and payments from the IPTF. The following net employer contribution rates were approved by PRSAC.
State Systems Contribution Rates for the State Systems
Fiscal Year 2010
Retirement System
Actuarially Required
Rate
Rate Approved By PRSAC
Normal Cost Rate
IPTF Funding
LASERS 21.3% 18.6% 6.5587% n/a
TRSL 19.2% 15.5% 5.7029% n/a
LSERS 23.3% 17.6% 9.1694% n/a
STPOL 51.1% 41.3% 17.4066% $1,500,000
Fiscal Year 2011
Retirement System
Actuarially Required
Rate
Rate Approved By PRSAC
Normal Cost Rate
IPTF Funding
LASERS * 22.0% 6.5587% n/a
TRSL * 20.2% 5.7029% n/a
LSERS * 24.3% 9.1694% n/a
STPOL * 50.9% 17.4066% $1,500,000
Actuarially required rates for FY 2011 will be available with the adoption of the June 30, 2011, actuarial valuations.
Values are based on the 2009 valuations and for 6/30 FYEs.
Ad Valorem Tax Rates All statewide retirement systems, except for FRS and
MPERS, receive ad valorem taxes. These taxes serve to reduce employer contributions that otherwise would be payable. Ad valorem taxes are a percentage, established by statute, of aggregate tax revenues collectible in accordance with the tax rolls of each parish. Different percentages apply for each system. Furthermore, ad valorem tax rates may vary from parish to parish. For example, rates for Orleans Parish differ from rates applicable to all other parishes. The ad valorem tax rate for MERS excludes Orleans Parish. The rate for PERS excludes Orleans and East Baton Rouge parishes. ASSR’s rate applies to the tax rolls of all parishes. TRSL, the

Employer Funding for Pension Benefits Page 27
only state system entitled to ad valorem taxes, receives one percent of parish tax revenues, except for Orleans Parish.
Statewide Systems Contribution Rates for Statewide Retirement Systems Fiscal Year 2010
Actuarially Required
Rate Approved By PRSAC
Applicable IPTF Paid FY 2009
ASSR 4.08% 8.50% n/a
CCRS 17.05% 11.75% n/a
DARS 8.64% 5.00% n/a
FRS 20.79% 14.00% $20,265,547
MERSA 13.78% 10.25% n/a
MERSB 5.95% 4.50% n/a
MPERS 24.00% 11.00% $15,071,968
PERSA 13.46% 15.75% n/a
PERSB 8.60% 10.00% n/a
RVRS 10.57% 3.50% n/a
SPRF 12.58% 9.00% $15,071,968
Fiscal Year 2011
The rates shown are employer contribution rates net of other sources such as ad valorem taxes, revenue sharing, and amounts paid from the IPTF. The boards for ASSR and SPRF exercised their statutory authority to approve rates that were higher than those approved by PRSAC. Board approved rates for ASSR and SPRF were 13.5% and 11.0%, respectively. The Ad Valorem Tax for RVRS includes the Defined Contribution allocation, if applicable.
Employer’s
Net Projected Rate
Ad Valorem FY 2010
Revenue Sharing FY 2010
IPTF
FY 2010
ASSR 4.00% 0.2500 % Max n/a CCRS 17.25% 0.2500 % Max n/a DARS 9.00% 0.2000 % Max n/a FRS 21.50% n/a n/a $21,306,059 MERSA 13.75% 0.1800 % Max n/a MERSB 6.00% 0.0700 % Max n/a MPERS 25.00% n/a n/a $15,112,480 PERSA 13.25% 0.2200 % Max n/a PERSB 8.50% 0.0300 % Max n/a RVRS 11.25% 0.0625 % Max n/a SPRF 12.75% 0.5000 % Max $15,112,480
Page 28 Employer Funding for Pension Benefits
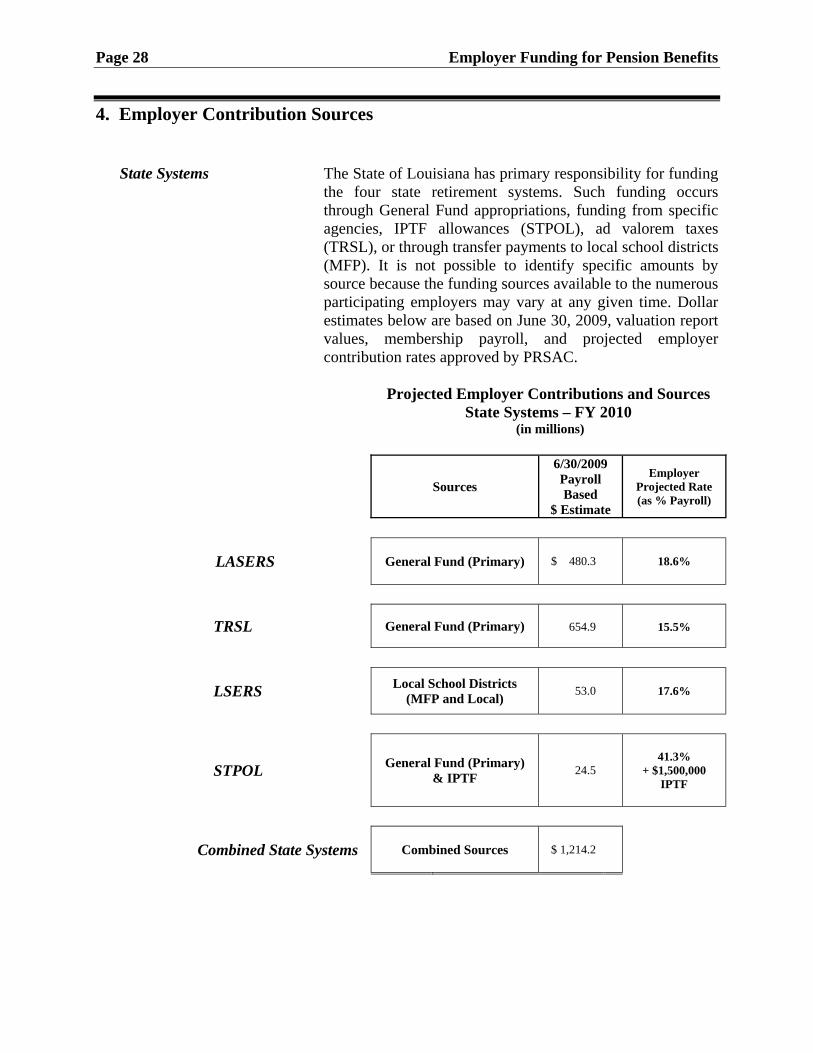
4. Employer Contribution Sources
State Systems The State of Louisiana has primary responsibility for funding the four state retirement systems. Such funding occurs through General Fund appropriations, funding from specific agencies, IPTF allowances (STPOL), ad valorem taxes (TRSL), or through transfer payments to local school districts (MFP). It is not possible to identify specific amounts by source because the funding sources available to the numerous participating employers may vary at any given time. Dollar estimates below are based on June 30, 2009, valuation report values, membership payroll, and projected employer contribution rates approved by PRSAC.
Projected Employer Contributions and Sources
State Systems – FY 2010 (in millions)
Sources
6/30/2009 Payroll Based
$ Estimate
Employer Projected Rate (as % Payroll)
LASERS General Fund (Primary)
$ 480.3
18.6%
TRSL General Fund (Primary)
654.9
15.5%
LSERS Local School Districts
(MFP and Local)
53.0
17.6%
STPOL General Fund (Primary)
& IPTF
24.5
41.3%
+ $1,500,000 IPTF
Combined State Systems Combined Sources
$ 1,214.2
Employer Funding for Pension Benefits Page 29
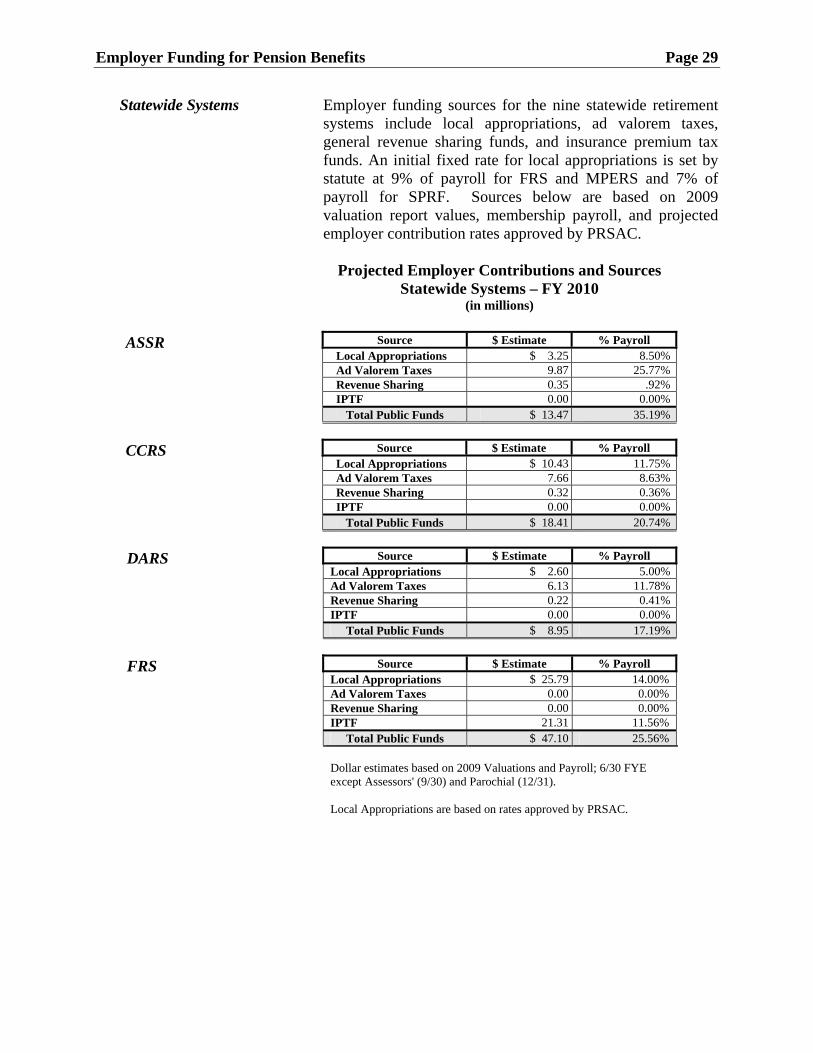
Statewide Systems Employer funding sources for the nine statewide retirement systems include local appropriations, ad valorem taxes, general revenue sharing funds, and insurance premium tax funds. An initial fixed rate for local appropriations is set by statute at 9% of payroll for FRS and MPERS and 7% of payroll for SPRF. Sources below are based on 2009 valuation report values, membership payroll, and projected employer contribution rates approved by PRSAC.
Projected Employer Contributions and Sources
Statewide Systems – FY 2010 (in millions)
ASSR Source $ Estimate % Payroll
Local Appropriations $ 3.25 8.50%Ad Valorem Taxes 9.87 25.77%Revenue Sharing 0.35 .92%IPTF 0.00 0.00%
Total Public Funds $ 13.47 35.19%
CCRS Source $ Estimate % Payroll Local Appropriations $ 10.43 11.75%Ad Valorem Taxes 7.66 8.63%Revenue Sharing 0.32 0.36%IPTF 0.00 0.00%
Total Public Funds $ 18.41 20.74%
DARS Source $ Estimate % Payroll Local Appropriations $ 2.60 5.00%Ad Valorem Taxes 6.13 11.78%Revenue Sharing 0.22 0.41%IPTF 0.00 0.00%
Total Public Funds $ 8.95 17.19%
FRS Source $ Estimate % Payroll Local Appropriations $ 25.79 14.00% Ad Valorem Taxes 0.00 0.00% Revenue Sharing 0.00 0.00% IPTF 21.31 11.56%
Total Public Funds $ 47.10 25.56%
Dollar estimates based on 2009 Valuations and Payroll; 6/30 FYE except Assessors' (9/30) and Parochial (12/31).
Local Appropriations are based on rates approved by PRSAC.

Page 30 Employer Funding for Pension Benefits
Projected Employer Contributions Sources Statewide Systems – FY 2010
(in millions)
MERSA Source $ Estimate % Payroll Local Appropriations $ 16.48 10.25% Ad Valorem Taxes 4.82 3.00% Revenue Sharing 0.11 0.07% IPTF 0.00 0.00%
Total Public Funds $ 21.41 13.32%
MERSB Source $ Estimate % Payroll Local Appropriations $ 3.00 4.50% Ad Valorem Taxes 1.99 2.99% Revenue Sharing 0.05 0.07% IPTF 0.00 0.00%
Total Public Funds $ 5.04 7.56%
MPERS Source $ Estimate % Payroll Local Appropriations $ 30.10 11.00% Ad Valorem Taxes 0.00 0.00% Revenue Sharing 0.00 0.00% IPTF 15.11 5.53%
Total Public Funds $ 45.21 16.53%
PERSA Source $ Estimate % Payroll Local Appropriations $ 86.95 15.75% Ad Valorem Taxes 6.09 1.10% Revenue Sharing 0.14 0.03% IPTF 0.00 0.00%
Total Public Funds $ 93.18 16.88%
PERSB Source $ Estimate % Payroll Local Appropriations $ 8.19 10.00% Ad Valorem Taxes 0.90 1.10% Revenue Sharing 0.21 0.03% IPTF 0.00 0.00%
Total Public Funds $ 9.30 11.13%
RVRS Source $ Estimate % Payroll Local Appropriations $ 0.42 3.50% Ad Valorem Taxes 1.92 15.92% Revenue Sharing 0.11 0.92% IPTF 0.00 0.00%
Total Public Funds $ 2.45 20.34%
SPRF Source $ Estimate % Payroll
Local Appropriations $ 58.38 9.00% Ad Valorem Taxes 15.89 2.68%
Revenue Sharing 0.43 0.07% IPTF 15.11 2.55%
Total Public Funds $ 89.81 14.30% Dollar estimates based on 2009 Valuations and Payroll; 6/30 FYE except Assessors' (9/30) and Parochial (12/31). Local Appropriations are based on rates approved by PRSAC.
Employer Funding for Pension Benefits Page 31
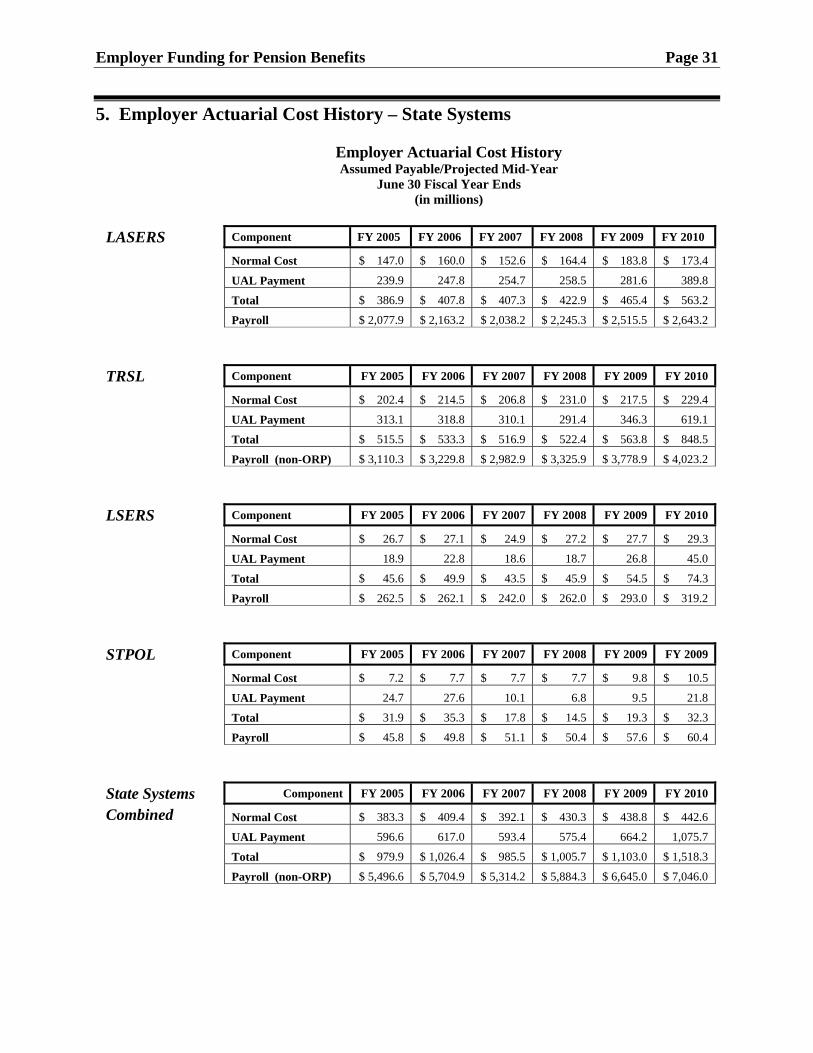
5. Employer Actuarial Cost History – State Systems
Employer Actuarial Cost History Assumed Payable/Projected Mid-Year
June 30 Fiscal Year Ends (in millions)
LASERS Component FY 2005 FY 2006 FY 2007 FY 2008 FY 2009 FY 2010
Normal Cost $ 147.0 $ 160.0 $ 152.6 $ 164.4 $ 183.8 $ 173.4
UAL Payment 239.9 247.8 254.7 258.5 281.6 389.8
Total $ 386.9 $ 407.8 $ 407.3 $ 422.9 $ 465.4 $ 563.2
Payroll $ 2,077.9 $ 2,163.2 $ 2,038.2 $ 2,245.3 $ 2,515.5 $ 2,643.2
TRSL Component FY 2005 FY 2006 FY 2007 FY 2008 FY 2009 FY 2010
Normal Cost $ 202.4 $ 214.5 $ 206.8 $ 231.0 $ 217.5 $ 229.4
UAL Payment 313.1 318.8 310.1 291.4 346.3 619.1
Total $ 515.5 $ 533.3 $ 516.9 $ 522.4 $ 563.8 $ 848.5
Payroll (non-ORP) $ 3,110.3 $ 3,229.8 $ 2,982.9 $ 3,325.9 $ 3,778.9 $ 4,023.2
LSERS Component FY 2005 FY 2006 FY 2007 FY 2008 FY 2009 FY 2010
Normal Cost $ 26.7 $ 27.1 $ 24.9 $ 27.2 $ 27.7 $ 29.3
UAL Payment 18.9 22.8 18.6 18.7 26.8 45.0
Total $ 45.6 $ 49.9 $ 43.5 $ 45.9 $ 54.5 $ 74.3
Payroll $ 262.5 $ 262.1 $ 242.0 $ 262.0 $ 293.0 $ 319.2
STPOL Component FY 2005 FY 2006 FY 2007 FY 2008 FY 2009 FY 2009
Normal Cost $ 7.2 $ 7.7 $ 7.7 $ 7.7 $ 9.8 $ 10.5
UAL Payment 24.7 27.6 10.1 6.8 9.5 21.8
Total $ 31.9 $ 35.3 $ 17.8 $ 14.5 $ 19.3 $ 32.3
Payroll $ 45.8 $ 49.8 $ 51.1 $ 50.4 $ 57.6 $ 60.4
State Systems Component FY 2005 FY 2006 FY 2007 FY 2008 FY 2009 FY 2010
Combined Normal Cost $ 383.3 $ 409.4 $ 392.1 $ 430.3 $ 438.8 $ 442.6
UAL Payment 596.6 617.0 593.4 575.4 664.2 1,075.7
Total $ 979.9 $ 1,026.4 $ 985.5 $ 1,005.7 $ 1,103.0 $ 1,518.3
Payroll (non-ORP) $ 5,496.6 $ 5,704.9 $ 5,314.2 $ 5,884.3 $ 6,645.0 $ 7,046.0
Page 32 Employer Funding for Pension Benefits
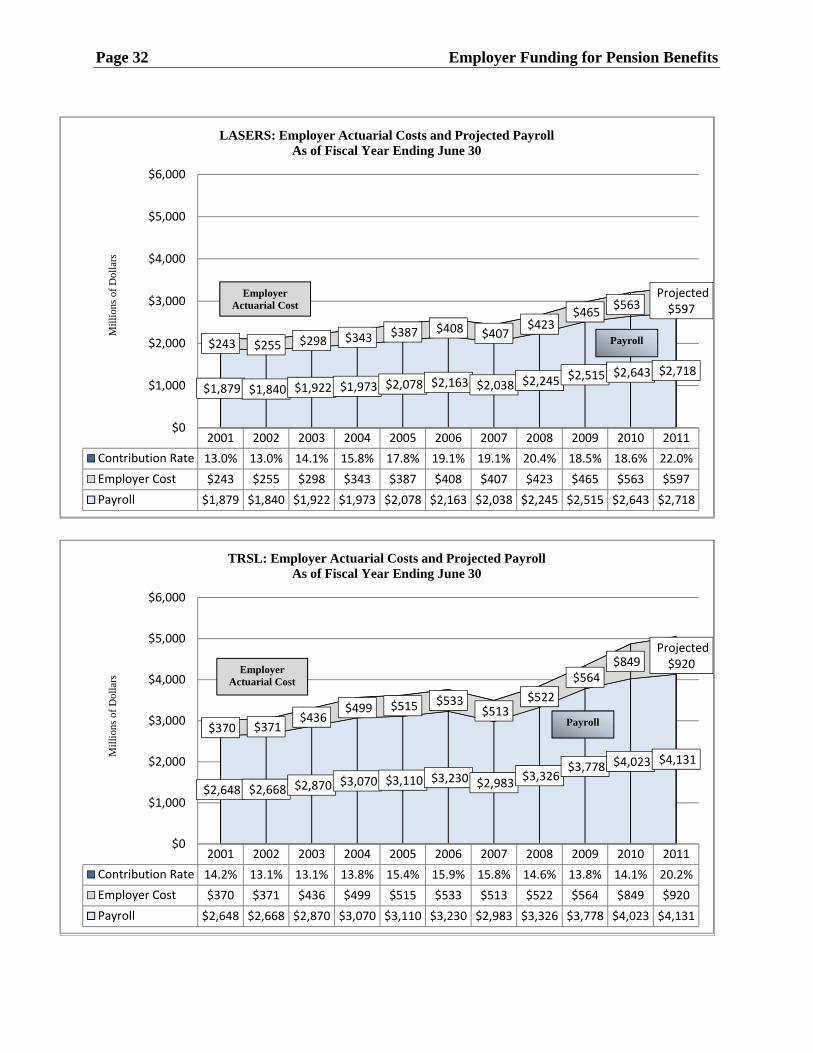
2001 2002 2003 2004 2005 2006 2007 2008 2009 2010 2011
Contribution Rate 13.0% 13.0% 14.1% 15.8% 17.8% 19.1% 19.1% 20.4% 18.5% 18.6% 22.0%
Employer Cost $243 $255 $298 $343 $387 $408 $407 $423 $465 $563 $597
Payroll $1,879 $1,840 $1,922 $1,973 $2,078 $2,163 $2,038 $2,245 $2,515 $2,643 $2,718
$1,879 $1,840 $1,922 $1,973 $2,078 $2,163 $2,038 $2,245
$2,515 $2,643 $2,718
$243 $255 $298 $343 $387 $408 $407 $423
$465 $563
Projected$597
$0
$1,000
$2,000
$3,000
$4,000
$5,000
$6,000
Mil
lion
s of
Dol
lars
LASERS: Employer Actuarial Costs and Projected PayrollAs of Fiscal Year Ending June 30
Employer Actuarial Cost
Payroll
2001 2002 2003 2004 2005 2006 2007 2008 2009 2010 2011
Contribution Rate 14.2% 13.1% 13.1% 13.8% 15.4% 15.9% 15.8% 14.6% 13.8% 14.1% 20.2%
Employer Cost $370 $371 $436 $499 $515 $533 $513 $522 $564 $849 $920
Payroll $2,648 $2,668 $2,870 $3,070 $3,110 $3,230 $2,983 $3,326 $3,778 $4,023 $4,131
$2,648 $2,668 $2,870 $3,070 $3,110 $3,230 $2,983
$3,326 $3,778 $4,023
$4,131
$370 $371 $436
$499 $515 $533 $513
$522
$564 $849
Projected$920
$0
$1,000
$2,000
$3,000
$4,000
$5,000
$6,000
Mil
lion
s of
Dol
lars
TRSL: Employer Actuarial Costs and Projected PayrollAs of Fiscal Year Ending June 30
Employer Actuarial Cost
Payroll

Employer Funding for Pension Benefits Page 33
6. Total Projected Contribution Rate History (All Sources)
Contribution requirements in general have increased over the past decade. Increases are due to reductions in the market value of assets in 2001, 2002, 2008, and 2009; the granting of COLAs; increases in benefit accrual rates; and schedules for amortizing the UAL that call for payments to increase annually. The table below shows total projected contributions to each retirement system as a percentage of projected member payroll. Total contributions include employer contributions, employee contributions, ad valorem taxes, revenue sharing amounts, and taxes on insurance premiums. Values for 2011 are based on projected contribution requirements as shown in the 2009 valuation reports for each retirement system.
TOTAL PROJECTED RATES (All Sources) AS A PERCENT OF MEMBER PAYROLL
Fiscal Year
2002 2003 2004 2005 2006 2007 2008 2009 2010 2011
State Systems:
LASERS 20.5% 21.6% 23.3% 25.3% 26.6% 26.6% 27.9% 26.0% 26.4% 29.7%
TRSL 21.1% 21.1% 21.8% 23.5% 23.9% 23.8% 24.6% 23.5% 22.1% 28.0%
LSERS 13.5% 14.5% 18.7% 22.3% 25.9% 27.1% 25.6% 25.3% 25.1% 31.8%
STPOL 64.4% 73.0% 76.4% 70.9% 75.5% 81.2% 37.2% 38.2% 51.9% 61.3%
Statewide Systems:
ASSR 31.8% 43.1% 43.0% 46.8% 42.8% 43.7% 37.9% 35.2% 41.7% 38.7% CCRS 22.2% 24.1% 26.8% 29.9% 31.0% 32.9% 27.9% 27.1% 27.9% 34.5% DARS 11.7% 15.5% 17.6% 21.6% 23.6% 21.0% 17.5% 16.8% 21.5% 28.2%
FRS 30.3% 38.4% 41.8% 45.1% 38.9% 36.2% 34.5% 33.7% 34.2% 41.1% MERSA 18.4% 19.5% 22.5% 26.6% 27.6% 28.1% 25.3% 22.6% 22.3% 26.1% MERSB 10.9% 13.5% 15.0% 16.9% 17.1% 17.3% 14.3% 12.4% 12.3% 14.1%
MPERS 19.5% 21.1% 27.8% 34.4% 29.3% 28.7% 26.9% 23.2% 24.7% 38.0% PERSA 15.9% 17.7% 22.2% 23.3% 22.7% 23.8% 19.8% 19.6% 26.4% 23.9% PERSB 5.6% 7.7% 9.2% 9.8% 9.5% 10.0% 9.3% 10.4% 14.1% 12.6%
RVRS 22.7% 23.9% 26.8% 31.4% 33.4% 34.7% 29.7% 25.2% 26.2% 35.1% SPRF 21.8% 22.3% 24.1% 24.8% 25.6% 26.0% 23.5% 22.6% 23.5% 28.1%

Page 34 Employer Funding for Pension Benefits
Non-Hazardous Duty Hazardous Duty
Contribution rates in this chart reflect all sources of contributions including member contributions and contributions from all public sources.
LASERS JUDGES TRSL LSERS ASSR CCRS DARS MERS A PERS A RVRS STPOL FRS SPRF MPERSWILDLIFE
PUBLICSAFETY
2002 20.5% 24.5% 21.1% 13.5% 31.8% 22.2% 11.7% 18.4% 15.9% 22.7% 64.4% 30.3% 21.8% 19.5% 22.5% 22.0%
2011 29.3% 33.5% 28.0% 31.8% 38.7% 34.5% 28.2% 26.1% 23.9% 35.1% 61.3% 41.1% 28.1% 38.0% 31.5% 31.0%
0.0%
5.0%
10.0%
15.0%
20.0%
25.0%
30.0%
35.0%
40.0%
45.0%
50.0%
55.0%
60.0%
65.0%
70.0%
State and Statewide Retirement SystemsChange in Projected Contribution Rates over 10 Years
2002 to 2011
Employer Funding for Pension Benefits Page 35
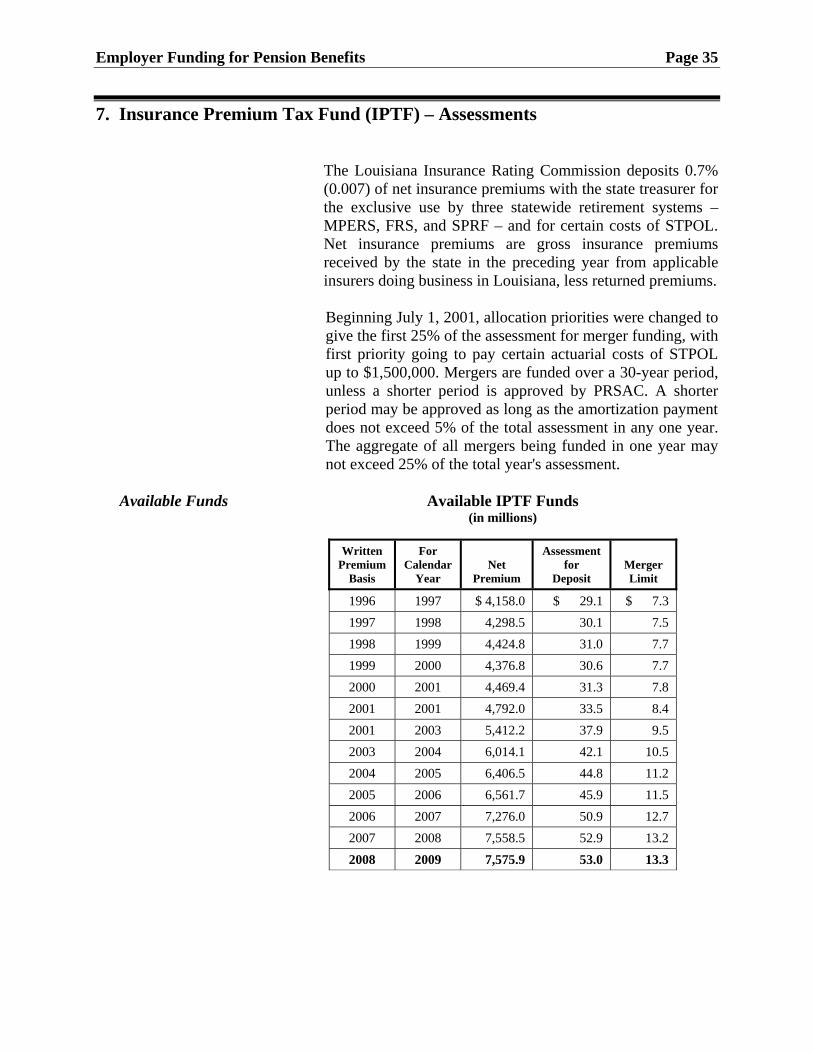
7. Insurance Premium Tax Fund (IPTF) – Assessments
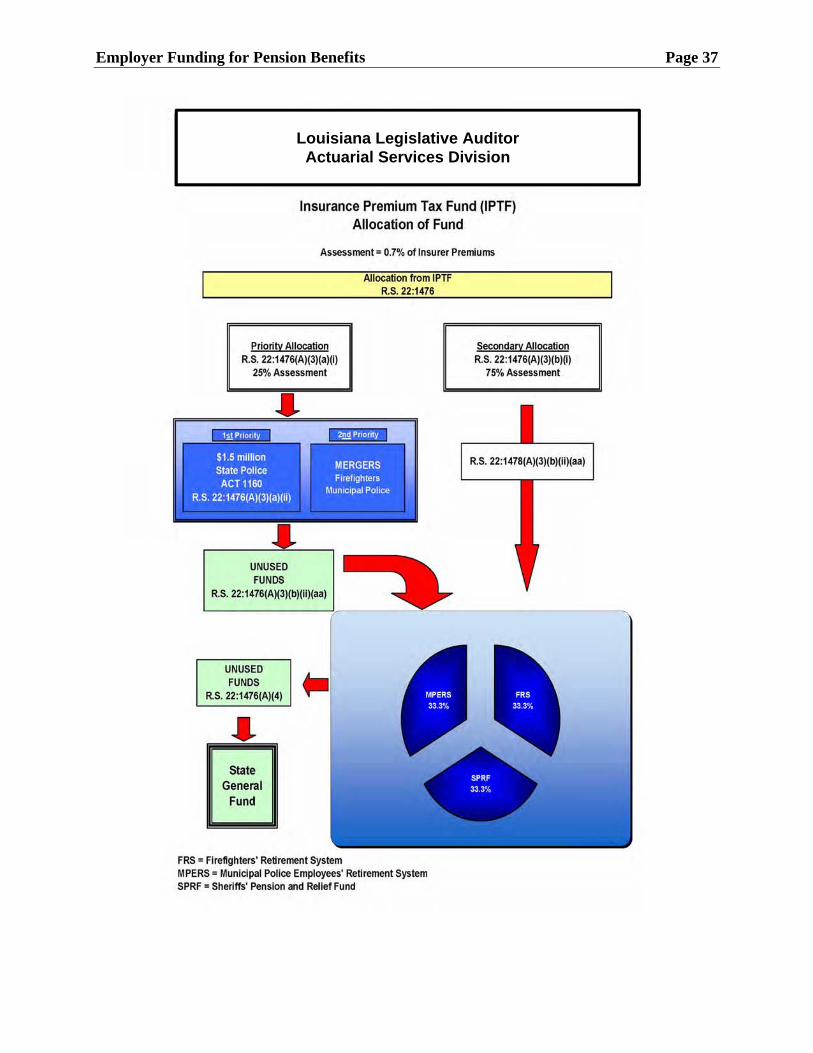
The Louisiana Insurance Rating Commission deposits 0.7% (0.007) of net insurance premiums with the state treasurer for the exclusive use by three statewide retirement systems – MPERS, FRS, and SPRF – and for certain costs of STPOL. Net insurance premiums are gross insurance premiums received by the state in the preceding year from applicable insurers doing business in Louisiana, less returned premiums.
Beginning July 1, 2001, allocation priorities were changed to give the first 25% of the assessment for merger funding, with first priority going to pay certain actuarial costs of STPOL up to $1,500,000. Mergers are funded over a 30-year period, unless a shorter period is approved by PRSAC. A shorter period may be approved as long as the amortization payment does not exceed 5% of the total assessment in any one year. The aggregate of all mergers being funded in one year may not exceed 25% of the total year's assessment.
Available Funds Available IPTF Funds (in millions)
Written Premium
Basis
For Calendar
Year
Net
Premium
Assessment for
Deposit
Merger Limit
1996 1997 $ 4,158.0 $ 29.1 $ 7.3
1997 1998 4,298.5 30.1 7.5
1998 1999 4,424.8 31.0 7.7
1999 2000 4,376.8 30.6 7.7
2000 2001 4,469.4 31.3 7.8
2001 2001 4,792.0 33.5 8.4
2001 2003 5,412.2 37.9 9.5
2003 2004 6,014.1 42.1 10.5
2004 2005 6,406.5 44.8 11.2
2005 2006 6,561.7 45.9 11.5
2006 2007 7,276.0 50.9 12.7
2007 2008 7,558.5 52.9 13.2
2008 2009 7,575.9 53.0 13.3
Page 36 Employer Funding for Pension Benefits
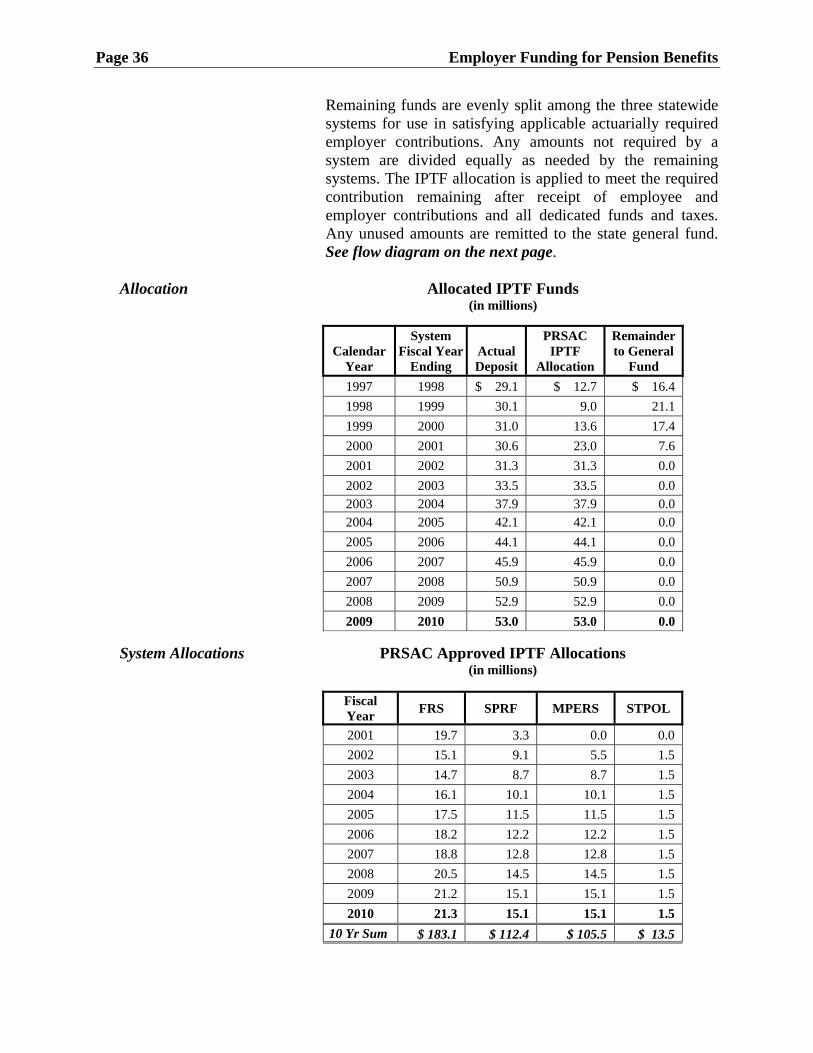
Remaining funds are evenly split among the three statewide systems for use in satisfying applicable actuarially required employer contributions. Any amounts not required by a system are divided equally as needed by the remaining systems. The IPTF allocation is applied to meet the required contribution remaining after receipt of employee and employer contributions and all dedicated funds and taxes. Any unused amounts are remitted to the state general fund. See flow diagram on the next page.
Allocation Allocated IPTF Funds (in millions)
Calendar
Year
System Fiscal Year
Ending
Actual Deposit
PRSAC IPTF
Allocation
Remainder to General
Fund 1997 1998 $ 29.1 $ 12.7 $ 16.4 1998 1999 30.1 9.0 21.1 1999 2000 31.0 13.6 17.4 2000 2001 30.6 23.0 7.6 2001 2002 31.3 31.3 0.0 2002 2003 33.5 33.5 0.0 2003 2004 37.9 37.9 0.0 2004 2005 42.1 42.1 0.0 2005 2006 44.1 44.1 0.0 2006 2007 45.9 45.9 0.0 2007 2008 50.9 50.9 0.0 2008 2009 52.9 52.9 0.0 2009 2010 53.0 53.0 0.0
System Allocations PRSAC Approved IPTF Allocations (in millions)
Fiscal Year
FRS SPRF MPERS STPOL
2001 19.7 3.3 0.0 0.0 2002 15.1 9.1 5.5 1.5 2003 14.7 8.7 8.7 1.5 2004 16.1 10.1 10.1 1.5 2005 17.5 11.5 11.5 1.5 2006 18.2 12.2 12.2 1.5 2007 18.8 12.8 12.8 1.5 2008 20.5 14.5 14.5 1.5 2009 21.2 15.1 15.1 1.5 2010 21.3 15.1 15.1 1.5
10 Yr Sum $ 183.1 $ 112.4 $ 105.5 $ 13.5
Employer Funding for Pension Benefits Page 37
Louisiana Legislative Auditor Actuarial Services Division
Page 38 Employer Funding for Pension Benefits
8. Experience Account Summary Establishment Experience Accounts (EA) were established during the 1992
Regular Session for LASERS and TRSL to provide for retiree COLAs. Act 588 of the 2004 Regular Session eliminated the negative balances that existed on June 30, 2004, prohibited future negative balances, omitted the debiting of actuarial investment experience losses, and limited the balance in the account from exceeding the value of two COLAs. Act 333 of the 2007 Regular Session established EA accounts for LSERS and STPOL effective on July 1, 2007, with zero initial balances.
EA Operations The EA is credited with one-half of any actuarial investment
experience gain (earnings in excess of the expected rate) together with actuarial interest on the beginning account balance. An amount representing funds sufficient to cover the expected value of the COLA benefits is then released back to the regular pool of system assets when COLAs are approved.
Act 497 of 2009 As a result of Act 497, accumulated balances in the EA for
LASERS and TRSL were transferred to their respective IUAL accounts on June 30, 2009. The amount of the transfer for LASERS was $122,300,895. The TRSL transfer was $296,655,328.
In addition to reducing EA balances to $0, Act 497 also
reduced amounts that will be transferred in the future from the regular pools of assets to the EAs. For LASERS, investment gains will have to exceed $100 million before any gains will be transferred. For TRSL the threshold for gains will be $200 million. If investment gains are large enough, 50% of such gains over the respective thresholds will be transferred to the EAs.
Employer Funding for Pension Benefits Page 39
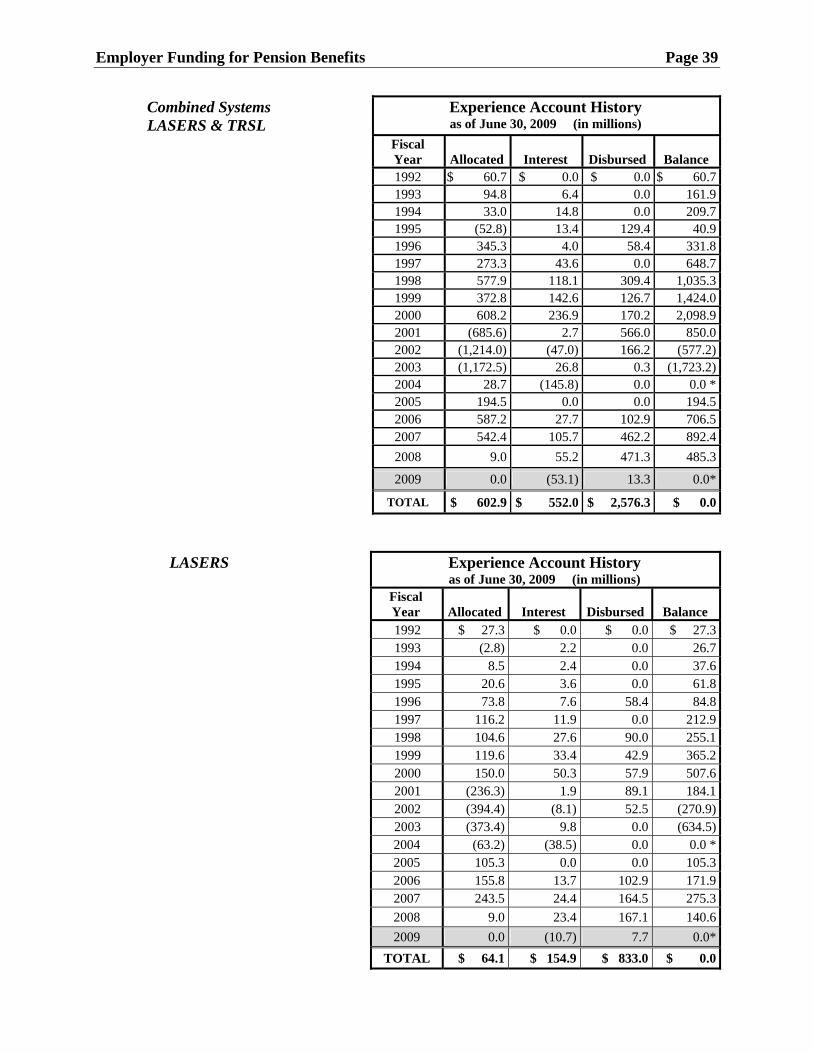
Combined Systems LASERS & TRSL
Experience Account History as of June 30, 2009 (in millions)
Fiscal Year
Allocated
Interest
Disbursed
Balance
1992 $ 60.7 $ 0.0 $ 0.0 $ 60.7 1993 94.8 6.4 0.0 161.9 1994 33.0 14.8 0.0 209.7 1995 (52.8) 13.4 129.4 40.9 1996 345.3 4.0 58.4 331.8 1997 273.3 43.6 0.0 648.7 1998 577.9 118.1 309.4 1,035.3 1999 372.8 142.6 126.7 1,424.0 2000 608.2 236.9 170.2 2,098.9 2001 (685.6) 2.7 566.0 850.0 2002 (1,214.0) (47.0) 166.2 (577.2) 2003 (1,172.5) 26.8 0.3 (1,723.2) 2004 28.7 (145.8) 0.0 0.0 * 2005 194.5 0.0 0.0 194.5 2006 587.2 27.7 102.9 706.5 2007 542.4 105.7 462.2 892.4 2008 9.0 55.2 471.3 485.3
2009 0.0 (53.1) 13.3 0.0*
TOTAL $ 602.9 $ 552.0 $ 2,576.3 $ 0.0
LASERS Experience Account History as of June 30, 2009 (in millions)
Fiscal Year
Allocated
Interest
Disbursed
Balance
1992 $ 27.3 $ 0.0 $ 0.0 $ 27.3 1993 (2.8) 2.2 0.0 26.7 1994 8.5 2.4 0.0 37.6 1995 20.6 3.6 0.0 61.8 1996 73.8 7.6 58.4 84.8 1997 116.2 11.9 0.0 212.9 1998 104.6 27.6 90.0 255.1 1999 119.6 33.4 42.9 365.2 2000 150.0 50.3 57.9 507.6 2001 (236.3) 1.9 89.1 184.1 2002 (394.4) (8.1) 52.5 (270.9) 2003 (373.4) 9.8 0.0 (634.5) 2004 (63.2) (38.5) 0.0 0.0 * 2005 105.3 0.0 0.0 105.3 2006 155.8 13.7 102.9 171.9 2007 243.5 24.4 164.5 275.3 2008 9.0 23.4 167.1 140.6 2009 0.0 (10.7) 7.7 0.0*
TOTAL $ 64.1 $ 154.9 $ 833.0 $ 0.0

Page 40 Employer Funding for Pension Benefits
TRSL Experience Account History as of June 30, 2009 (in millions)
Fiscal Year
Allocated
Interest
Disbursed
Balance
1992 $ 33.4 $ 0.0 $ 0.0 $ 33.4 1993 97.6 4.2 0.0 135.2 1994 24.5 12.4 0.0 172.1 1995 (73.4) 9.8 129.4 (20.9) 1996 271.5 (3.6) 0.0 247.0 1997 157.1 31.7 0.0 435.8 1998 473.3 90.5 219.4 780.2 1999 253.2 109.2 83.8 1,058.8 2000 458.2 186.6 112.3 1,591.3 2001 (449.3) 0.8 476.9 665.9 2002 (819.6) (38.9) 113.7 (306.3) 2003 (799.1) 17.0 0.3 (1,088.7) 2004 91.9 (107.3) 0.0 0.0 * 2005 89.2 0.0 0.0 89.2 2006 431.4 14.0 0.0 534.6 2007 298.9 81.3 297.7 617.1 2008 0.0 31.8 304.2 344.7 2009 0.0 (42.4) 5.6 0.0*
TOTAL $ 538.8 $ 397.1 $ 1,743.3 $ 0.0
Act 588 of R.S. 2004 reset the EA to $0 as of June 30,
2004, and Act 497 reset the EA to $0 as of June 30, 2009.

Employer Funding for Pension Benefits Page 41
9. IUAL Funds (Texaco Funds & Appropriations)
Initial UAL Funds Special legislative appropriations and amounts allocated
from the Texaco settlement have been placed in a separate account, called the IUAL Fund. This fund is contained within the state retirement system’s trust and credited with the actuarial rate of return. When the fund accumulates to the outstanding balance of the IUAL, or UAL if smaller, it will be released to fully liquidate the final liability.
Texaco Settlement Fund The Texaco Settlement Funds evolved from a litigation
settlement with Texaco. The proceeds were to be paid to the state over a three-year period, beginning February 28, 1994. Based on a recommendation adopted by the Bond Commission, the settlement was paid to three state retirement systems – LASERS, TRSL, and STPOL – to accelerate the payoff of the IUAL portion of the UAL.
The systems began receiving funds under Act 4 of the 1994 Regular Session. These funds are held in the IUAL Fund account and may not be used to offset regular UAL amortization payments pursuant to Act 257 of the 1992 Regular Session. An additional allocation of $19.4 million was granted to the STPOL IUAL Fund under Act 471 of the 1997 Regular Session. The STPOL Texaco Fund balance of $50,084,124 was released on June 30, 2006, to fully liquidate its IUAL. Texaco monies were released from the IUAL to the regular asset pools for LASERS ($89.2 million) and TRSL ($96.3 million) on June 30, 2003. Although these amounts corresponded to the additional UALs assumed by these systems when the LSU plan was merged into LASERS and TRSL, it appears that there may be no legislative basis to assert that the LSU UALs as of that point were fully amortized.
Special Appropriations Act 642 of 2006 appropriated $26,400,000 for TRSL and $13,600,000 for LASERS as of June 30, 2006. These allocations, as part of the IUAL Fund, are dedicated to the final payment of the IUAL.

Page 42 Employer Funding for Pension Benefits
Act 7 of the Second Extraordinary Session of 2008 provided an additional appropriation of $40,000,000 for TRSL and $20,000,000 for LASERS. These amounts are also dedicated to the final payment of the IUAL.
Act 497 of 2009 Under Act 497 of the 2009 session, outstanding balances in the IUAL Funds for LASERS and TRSL will receive transfers on June 30, 2009, from their respective Experience Accounts. IUAL Fund balances will then be transferred to the regular asset pools on June 30, 2010. The amount of such transfer for LASERS is estimated to be about $216.5 million. The transfer for TRSL is estimated to be about $699.8 million.
IUAL (Texaco) Fund History as of June 30, 2009 (in millions)
LASERS Fiscal Year Allocation Interest Balance 1994 $ 36.0 $ 0.0 $ 36.0 1995 13.8 3.4 53.2 1996 13.8 6.6 73.6 1997 0.7 10.4 84.7 1998 0.0 11.0 95.7 1999 0.0 12.5 108.2 2000 0.0 14.9 123.1 2001 0.0 0.5 123.6 2002 0.0 (5.4) 118.2 2003 (89.2) (4.3) 24.7 2004 0.0 1.5 26.2 2005 0.0 3.1 29.3 2006 13.6 3.8 46.7 2007 0.0 6.6 53.3 2008 20.0 4.8 78.1 2009 122.3 6.4 206.8 TOTAL $ 131.0 $ 75.8 $ 206.8

Employer Funding for Pension Benefits Page 43
TRSL Fiscal Year Allocation Interest Balance 1994 $ 77.2 $ 0.0 $ 77.2 1995 29.2 4.4 110.8 1996 29.2 18.9 158.9 1997 0.0 20.4 179.3 1998 0.0 37.2 216.5 1999 0.0 30.3 246.8 2000 0.0 43.5 290.3 2001 0.0 0.2 290.5 2002 0.0 (17.0) 273.5 2003 (96.3) (15.2) 162.0 2004 0.0 16.0 178.0 2005 0.0 17.6 195.6 2006 26.4 30.6 252.6 2007 0.0 38.4 291.0 2008 40.0 15.3 346.3 2009 296.6 28.6 671.5 TOTAL $ 402.3 $ 269.2 $ 671.5

Page 44 Employer Funding for Pension Benefits
10. Asset Balances
Assets The trust funds of the Louisiana retirement systems accumulate assets from employee and employer contributions and from investment earnings. The actuary for each system uses two separate measures for the value of assets – the market value and the actuarial value.
The market value of assets is the fair value of all assets held by the trust on the valuation date. This measurement is used for financial reporting purposes, including the system’s balance sheet of assets and liabilities and the income/expense statement. The actuary calculates the actuarial value of system assets. The actuarial value is calculated in such a manner as to smooth out significant fluctuations in market values that occur from year to year. The formulas selected by the actuary to calculate the actuarial value must be based on the market value, must produce a value that does not deviate too significantly from the market value, must recognize investment gains and losses within a reasonable period of time, and must not exhibit a bias that will produce actuarial values that are consistently higher or lower than the market value. Unless specifically mandated by law otherwise, the actuary must comply with Actuarial Standards of Practice in selecting or developing a formula to determine the actuarial value. The actuarial value of assets is used in the calculation of annual employer contribution requirements and for the measurements required by the Governmental Accounting Standards Board (GASB). The formula used by the actuaries to determine the actuarial value of assets differs from retirement system to retirement system. “Valuation Assets” is a term that is unique to the Louisiana state retirement systems. Valuation Assets are equal to the actuarial value of a trust fund minus amounts reserved or set aside in special side accounts such as the Experience Account, the IUAL Funds, LSU AG Fund, and the Employer Credit Account. Valuation Assets are used to determine annual employer funding requirements, funding ratios, the UAL, and COLA Target Funding tests.
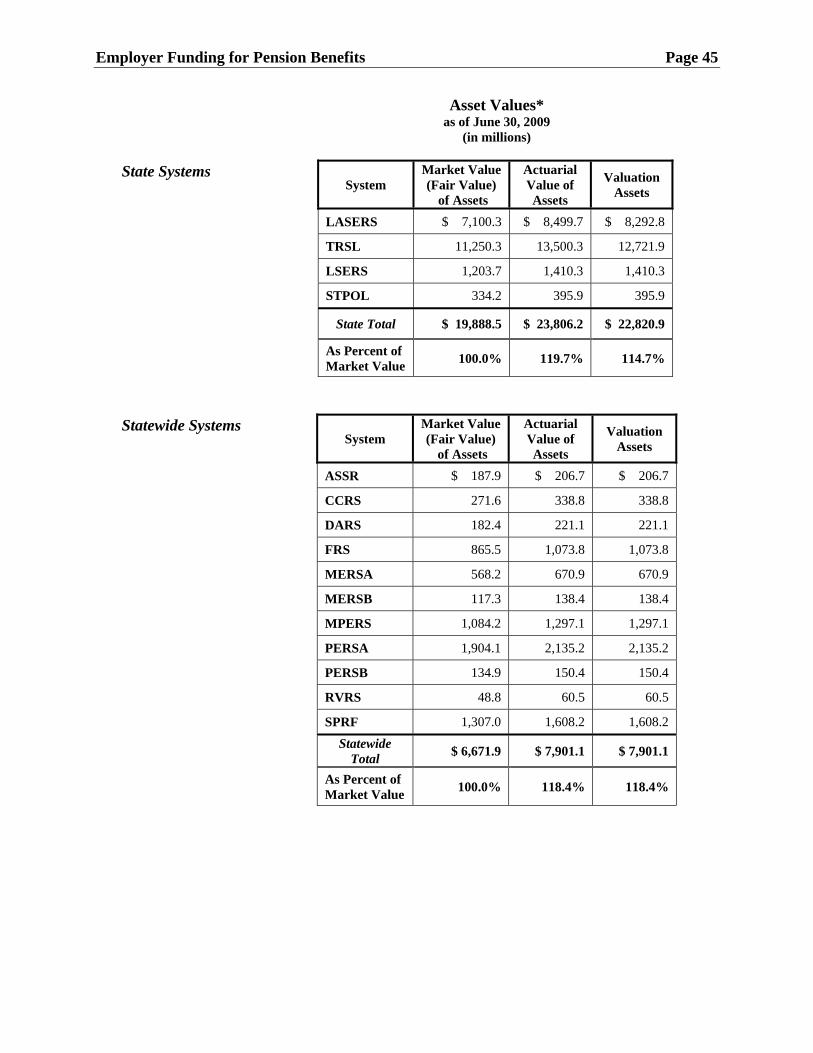
Employer Funding for Pension Benefits Page 45
Asset Values* as of June 30, 2009
(in millions)
State Systems System
Market Value (Fair Value)
of Assets
Actuarial Value of Assets
Valuation Assets
LASERS $ 7,100.3 $ 8,499.7 $ 8,292.8
TRSL 11,250.3 13,500.3 12,721.9
LSERS 1,203.7 1,410.3 1,410.3
STPOL 334.2 395.9 395.9
State Total $ 19,888.5 $ 23,806.2 $ 22,820.9
As Percent of Market Value
100.0% 119.7% 114.7%
Statewide Systems
System Market Value (Fair Value)
of Assets
Actuarial Value of Assets
Valuation Assets
ASSR $ 187.9 $ 206.7 $ 206.7
CCRS 271.6 338.8 338.8
DARS 182.4 221.1 221.1
FRS 865.5 1,073.8 1,073.8
MERSA 568.2 670.9 670.9
MERSB 117.3 138.4 138.4
MPERS 1,084.2 1,297.1 1,297.1
PERSA 1,904.1 2,135.2 2,135.2
PERSB 134.9 150.4 150.4
RVRS 48.8 60.5 60.5
SPRF 1,307.0 1,608.2 1,608.2
Statewide Total
$ 6,671.9 $ 7,901.1 $ 7,901.1
As Percent of Market Value
100.0% 118.4% 118.4%

Page 46 Employer Funding for Pension Benefits
Asset Values* as of June 30, 2009
(in millions)
All Systems Combined System
Market Value (Fair Value)
of Assets
Actuarial Value of Assets
Valuation Assets
Total For All Systems
$ 27,560.4 $ 31,707.3 $ 30,722.0
As Percent of Market Value
100.0% 115.0% 111.5%
Values based on 2009 Valuation and 6/30 FYE, except Assessors'
(9/30) and Parochial (12/31).
Employer Funding for Pension Benefits Page 47
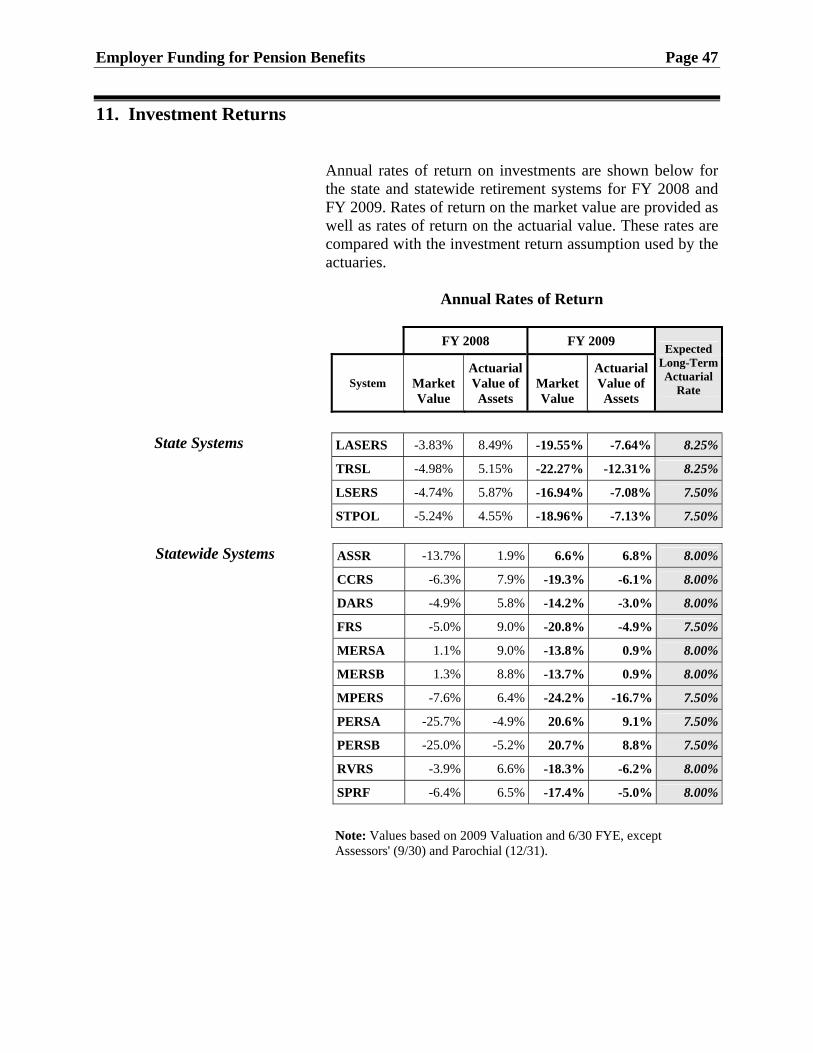
11. Investment Returns
Annual rates of return on investments are shown below for the state and statewide retirement systems for FY 2008 and FY 2009. Rates of return on the market value are provided as well as rates of return on the actuarial value. These rates are compared with the investment return assumption used by the actuaries.
Annual Rates of Return
FY 2008 FY 2009
Expected Long-TermActuarial
Rate
System
Market Value
Actuarial Value of Assets
Market Value
Actuarial Value of Assets
State Systems LASERS -3.83% 8.49% -19.55% -7.64% 8.25%
TRSL -4.98% 5.15% -22.27% -12.31% 8.25%
LSERS -4.74% 5.87% -16.94% -7.08% 7.50%
STPOL -5.24% 4.55% -18.96% -7.13% 7.50%
Statewide Systems ASSR -13.7% 1.9% 6.6% 6.8% 8.00%
CCRS -6.3% 7.9% -19.3% -6.1% 8.00%
DARS -4.9% 5.8% -14.2% -3.0% 8.00%
FRS -5.0% 9.0% -20.8% -4.9% 7.50%
MERSA 1.1% 9.0% -13.8% 0.9% 8.00%
MERSB 1.3% 8.8% -13.7% 0.9% 8.00%
MPERS -7.6% 6.4% -24.2% -16.7% 7.50%
PERSA -25.7% -4.9% 20.6% 9.1% 7.50%
PERSB -25.0% -5.2% 20.7% 8.8% 7.50%
RVRS -3.9% 6.6% -18.3% -6.2% 8.00%
SPRF -6.4% 6.5% -17.4% -5.0% 8.00%
Note: Values based on 2009 Valuation and 6/30 FYE, except Assessors' (9/30) and Parochial (12/31).

Page 48 Employer Funding for Pension Benefits
Rates of return are somewhat meaningless unless benchmark rates are also provided. Common benchmark rates are shown below:
Indices Annual Rate (as of June 30)
Indices FY 2008 FY 2009
CPI (1) 5.0% -1.4% Barclays Capital (2) 6.22% 1.7% S&P 500 (3) -14.9% -28.2% 55% Stock/ 45% Bond -5.4% -11.3% 65% Stock/ 35% Bond -7.5% -13.6%
Note: Indices are shown for the twelve-month period ending June 30. (1) CPI (All Items), (2) Barclays Capital US Aggregate Bond Index, (3) Standard & Poors' 500 Index. Composites are weighted by (2) & (3).
Employer Funding for Pension Benefits Page 49
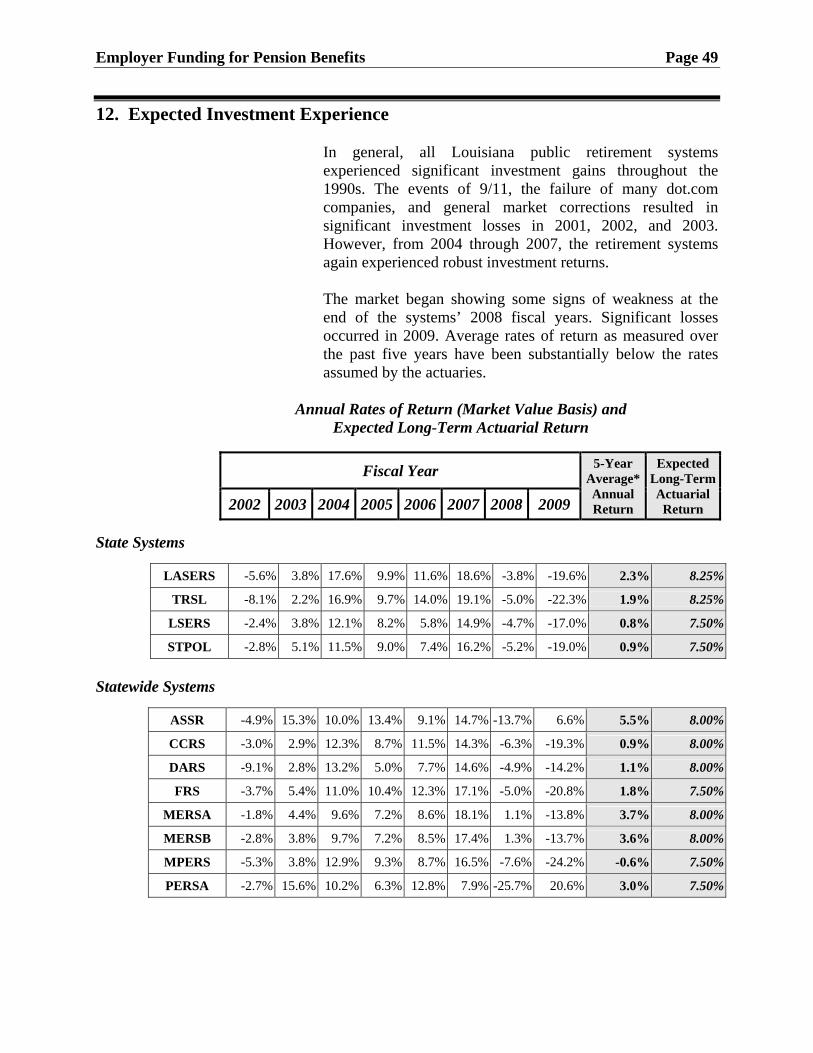
12. Expected Investment Experience
In general, all Louisiana public retirement systems experienced significant investment gains throughout the 1990s. The events of 9/11, the failure of many dot.com companies, and general market corrections resulted in significant investment losses in 2001, 2002, and 2003. However, from 2004 through 2007, the retirement systems again experienced robust investment returns. The market began showing some signs of weakness at the end of the systems’ 2008 fiscal years. Significant losses occurred in 2009. Average rates of return as measured over the past five years have been substantially below the rates assumed by the actuaries.
Annual Rates of Return (Market Value Basis) and
Expected Long-Term Actuarial Return
Fiscal Year 5-Year Average* Annual Return
Expected Long-Term Actuarial
Return 2002 2003 2004 2005 2006 2007 2008 2009
State Systems
LASERS -5.6% 3.8% 17.6% 9.9% 11.6% 18.6% -3.8% -19.6% 2.3% 8.25%
TRSL -8.1% 2.2% 16.9% 9.7% 14.0% 19.1% -5.0% -22.3% 1.9% 8.25%
LSERS -2.4% 3.8% 12.1% 8.2% 5.8% 14.9% -4.7% -17.0% 0.8% 7.50%
STPOL -2.8% 5.1% 11.5% 9.0% 7.4% 16.2% -5.2% -19.0% 0.9% 7.50%
Statewide Systems
ASSR -4.9% 15.3% 10.0% 13.4% 9.1% 14.7% -13.7% 6.6% 5.5% 8.00%
CCRS -3.0% 2.9% 12.3% 8.7% 11.5% 14.3% -6.3% -19.3% 0.9% 8.00%
DARS -9.1% 2.8% 13.2% 5.0% 7.7% 14.6% -4.9% -14.2% 1.1% 8.00%
FRS -3.7% 5.4% 11.0% 10.4% 12.3% 17.1% -5.0% -20.8% 1.8% 7.50%
MERSA -1.8% 4.4% 9.6% 7.2% 8.6% 18.1% 1.1% -13.8% 3.7% 8.00%
MERSB -2.8% 3.8% 9.7% 7.2% 8.5% 17.4% 1.3% -13.7% 3.6% 8.00%
MPERS -5.3% 3.8% 12.9% 9.3% 8.7% 16.5% -7.6% -24.2% -0.6% 7.50%
PERSA -2.7% 15.6% 10.2% 6.3% 12.8% 7.9% -25.7% 20.6% 3.0% 7.50%
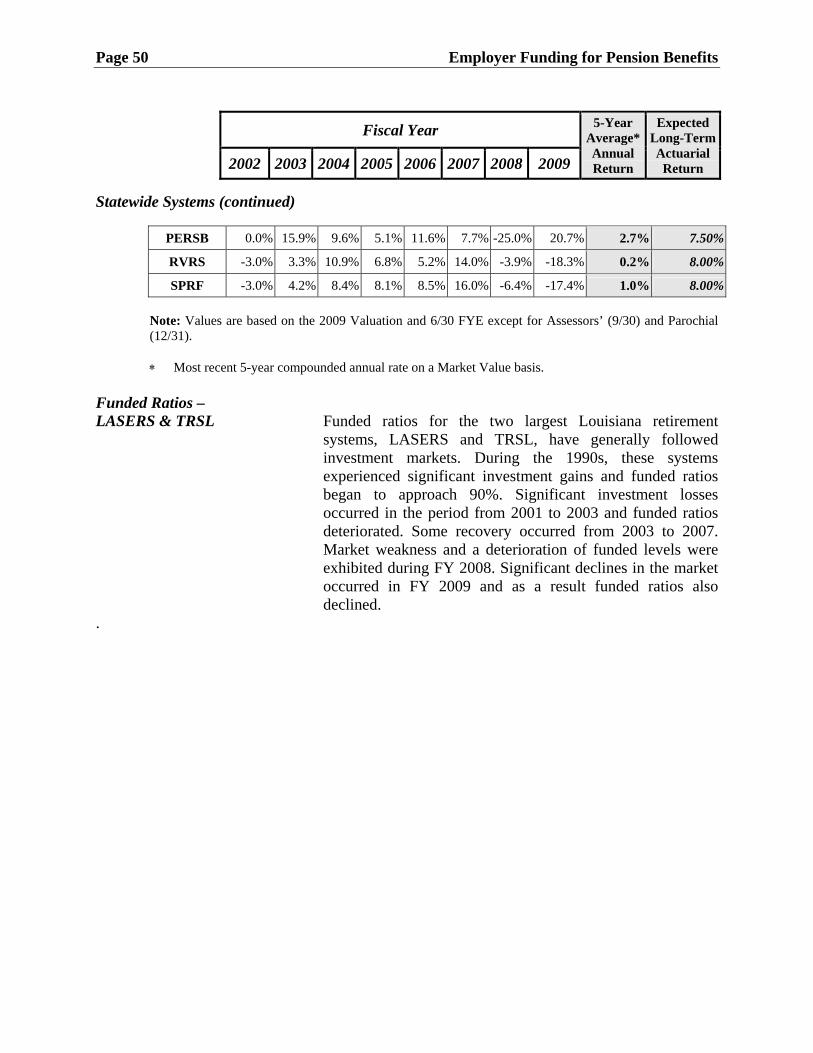
Page 50 Employer Funding for Pension Benefits
Fiscal Year 5-Year Average* Annual Return
Expected Long-Term Actuarial
Return 2002 2003 2004 2005 2006 2007 2008 2009
Statewide Systems (continued)
PERSB 0.0% 15.9% 9.6% 5.1% 11.6% 7.7% -25.0% 20.7% 2.7% 7.50%
RVRS -3.0% 3.3% 10.9% 6.8% 5.2% 14.0% -3.9% -18.3% 0.2% 8.00%
SPRF -3.0% 4.2% 8.4% 8.1% 8.5% 16.0% -6.4% -17.4% 1.0% 8.00%
Note: Values are based on the 2009 Valuation and 6/30 FYE except for Assessors’ (9/30) and Parochial (12/31).
Most recent 5-year compounded annual rate on a Market Value basis.
Funded Ratios – LASERS & TRSL Funded ratios for the two largest Louisiana retirement
systems, LASERS and TRSL, have generally followed investment markets. During the 1990s, these systems experienced significant investment gains and funded ratios began to approach 90%. Significant investment losses occurred in the period from 2001 to 2003 and funded ratios deteriorated. Some recovery occurred from 2003 to 2007. Market weakness and a deterioration of funded levels were exhibited during FY 2008. Significant declines in the market occurred in FY 2009 and as a result funded ratios also declined.
.

Employer Funding for Pension Benefits Page 51
1992 1993 1994 1995 1996 1997 1998 1999 2000 2001 2002 2003 2004 2005 2006 2007 2008 2009
LASERS 0.58 0.60 0.63 0.65 0.67 0.73 0.77 0.78 0.81 0.76 0.67 0.60 0.60 0.62 0.66 0.69 0.69 0.61
TRSL 0.51 0.55 0.59 0.59 0.65 0.68 0.75 0.80 0.89 0.83 0.72 0.62 0.63 0.65 0.70 0.74 0.72 0.59
0.00
0.10
0.20
0.30
0.40
0.50
0.60
0.70
0.80
0.90
1.00
Funded Levels for LASERS and TRSL1992 through 2009
Actuarial Value of Assets / Actuarial Accrued Benefit Liability
TRSL0.59
LASERS0.61

Page 52 Employer Funding for Pension Benefits
13. UAL Balances
Valuation Balances UAL values depend on the actuarial funding method
prescribed by statute for each system (R.S. 11:22). UAL bases are amortized over the number of years also specified by statute. Certain funding methods do not have UAL bases, but instead spread all costs over the future working lifetime of all active participants. UAL balances are not reduced by any assets allocated to separate accounts such as the IUAL Funds, Experience Accounts, and Employer Credit Accounts.
Valuation UAL Balance
(in millions)
FY 2002 FY 2003 FY 2004 FY 2005 FY 2006 FY 2007 FY 2008 FY 2009
State Systems
LASERS $ 2,864.3 $ 3,333.5 $ 4,165.9 $ 4,202.8 $ 4,164.5 $ 4,129.7 $ 4,473.1 $ 5,694.0 TRSL 4,517.2 5,531.9 6,836.1 6,812.6 6,555.0 6,250.6 6,967.6 10,117.5 LSERS 148.2 361.2 439.8 466.2 391.8 389.3 481.2 743.0 STPOL 155.1 215.7 229.0 238.2 166.5 158.6 199.7 282.4
State Total
$ 7,684.8 $ 9,442.3 $11,670.8 $11,719.8 $11,277.8 $10,928.2 $12,121.6 $16,836.9
Statewide Systems
ASSR $ 35.3 $ 35.2 $ 35.5 $ 35.8 $ 35.0 $ 32.1 $ 23.9 $ 22.8
CCRS 77.9 79.2 80.4 81.4 82.8 84.1 85.2 86.2 DARS n/a n/a n/a n/a n/a n/a n/a n/a FRS 246.0 286.3 284.4 193.7 178.0 166.7 187.4 336.8 MERSA 67.7 68.9 70.1 71.3 72.3 73.2 74.0 74.6
MERSB 6.7 6.4 6.2 6.0 5.7 5.4 5.2 4.9 MPERS 195.2 379.5 423.4 318.8 279.1 188.2 240.3 691.3 PERSA 98.9 97.4 95.4 92.9 89.8 66.3 60.4 53.6 PERSB n/a n/a n/a n/a n/a n/a n/a n/a RVRS n/a n/a n/a n/a n/a n/a n/a n/a SPRF 91.1 92.3 93.5 94.6 95.5 96.3 74.3 72.8
Statewide Total
$ 818.8 $ 1,045.2 $ 1,088.9 $ 894.5 $ 838.2 $ 712.3 $ 750.7 $ 1,343.0
All Systems
Total $ 8,503.6 $10,487.5 $12,759.7 $12,614.3 $12,116.0 $11,640.5 $12,872.3 $18,179.9
Note: Values based on 2009 Valuation and 6/30 FYE except Assessors’ (9/30) and Parochial (12/31).

Employer Funding for Pension Benefits Page 53
Net UAL Balances The Net UAL balance for each state retirement system is equal to the UAL minus amounts in the system’s IUAL Fund and Employer Credit Account. Net UAL balances shown below have been adjusted for balances held in these separate accounts.
Net UAL Balance
State Systems as of June 30, 2009
(in millions)
Fiscal Year
2002 2003 2004 2005 2006 2007 2008 2009
State Systems
LASERS $ 2,746.1 $ 3,308.8 $ 4,139.8 $ 4,173.6 $ 4,117.9 $ 4,076.4 $ 4,395.0 $ 5,487.2
TRSL 4,243.7 5,369.9 6,658.1 6,617.1 6,302.4 5,959.6 6,582.7 9,338.6
LSERS 111.8 355.3 439.8 466.2 391.8 389.3 481.3 743.0
STPOL 115.0 176.6 188.2 193.9 166.5 158.6 199.8 282.4
State Total $ 7,216.6 $ 9,210.6 $11,425.9 $11,450.8 $10,978.6 $10,583.9 $11,658.8 $15,851.2
Page 54 Employer Funding for Pension Benefits
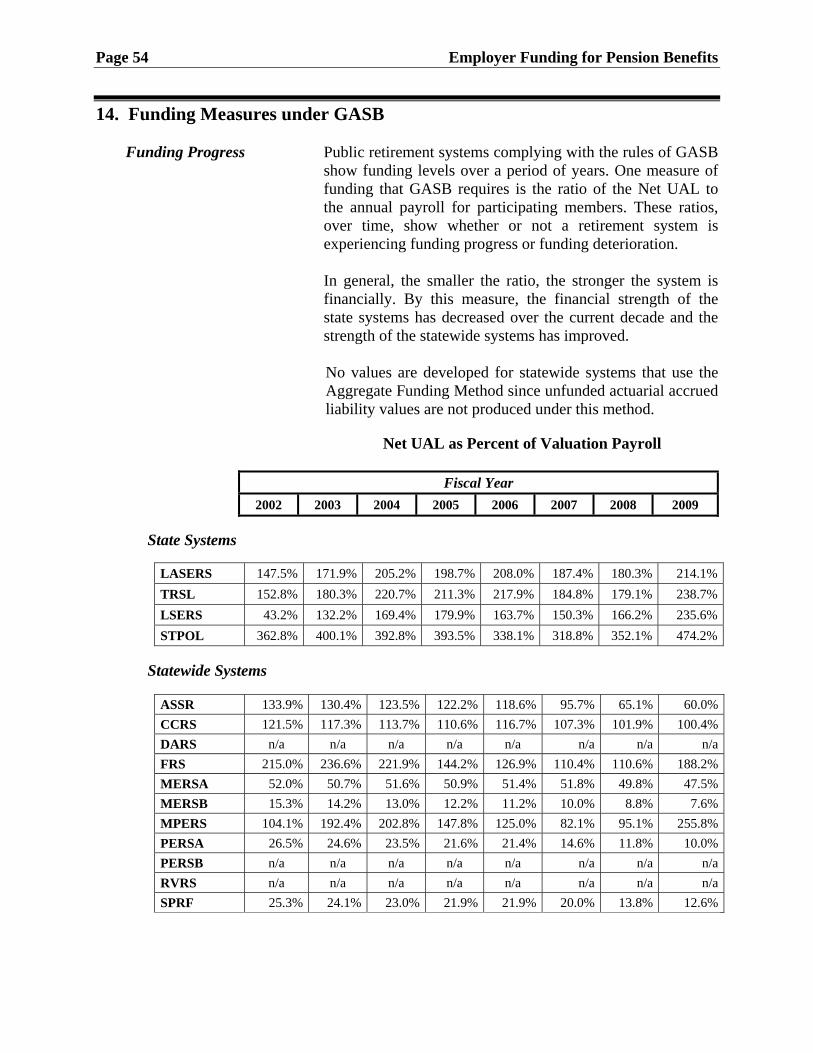
14. Funding Measures under GASB
Funding Progress Public retirement systems complying with the rules of GASB show funding levels over a period of years. One measure of funding that GASB requires is the ratio of the Net UAL to the annual payroll for participating members. These ratios, over time, show whether or not a retirement system is experiencing funding progress or funding deterioration.
In general, the smaller the ratio, the stronger the system is
financially. By this measure, the financial strength of the state systems has decreased over the current decade and the strength of the statewide systems has improved.
No values are developed for statewide systems that use the Aggregate Funding Method since unfunded actuarial accrued liability values are not produced under this method.
Net UAL as Percent of Valuation Payroll
Fiscal Year
2002 2003 2004 2005 2006 2007 2008 2009
State Systems
LASERS 147.5% 171.9% 205.2% 198.7% 208.0% 187.4% 180.3% 214.1% TRSL 152.8% 180.3% 220.7% 211.3% 217.9% 184.8% 179.1% 238.7% LSERS 43.2% 132.2% 169.4% 179.9% 163.7% 150.3% 166.2% 235.6% STPOL 362.8% 400.1% 392.8% 393.5% 338.1% 318.8% 352.1% 474.2%
Statewide Systems
ASSR 133.9% 130.4% 123.5% 122.2% 118.6% 95.7% 65.1% 60.0% CCRS 121.5% 117.3% 113.7% 110.6% 116.7% 107.3% 101.9% 100.4% DARS n/a n/a n/a n/a n/a n/a n/a n/a FRS 215.0% 236.6% 221.9% 144.2% 126.9% 110.4% 110.6% 188.2% MERSA 52.0% 50.7% 51.6% 50.9% 51.4% 51.8% 49.8% 47.5% MERSB 15.3% 14.2% 13.0% 12.2% 11.2% 10.0% 8.8% 7.6% MPERS 104.1% 192.4% 202.8% 147.8% 125.0% 82.1% 95.1% 255.8% PERSA 26.5% 24.6% 23.5% 21.6% 21.4% 14.6% 11.8% 10.0% PERSB n/a n/a n/a n/a n/a n/a n/a n/a RVRS n/a n/a n/a n/a n/a n/a n/a n/a SPRF 25.3% 24.1% 23.0% 21.9% 21.9% 20.0% 13.8% 12.6%

Employer Funding for Pension Benefits Page 55
15. Funding Progress – Funded Levels and Funded Ratios
Funded Levels Another measure of the actuarial strength of a retirement system is the ratio of the actuarial value of assets to the Projected Benefit Obligation (PBO).
The actuarial value of assets, in this measurement, includes
the amounts set aside in the IUAL Fund, the Experience Account, and the Employer Credit Account.
The PBO is the value of all service earned to date assuming
that pay levels will increase in accordance with the salary increase assumption used by the actuary. The PBO is a consistent measure of accrued benefits across all systems because the measurement is independent of the actuarial cost method selected for valuation purposes.
Funded levels are given below for the state and statewide
retirement systems.
Funded Levels as of June 30, 2009
(in millions)
State Systems
System AVA
Actuarial Value of Assets
PBO Projected Accrued Benefit Liability
Funded Level
LASERS $ 8,499.7 $ 13,986.8 60.8%
TRSL 13,500.3 22,839.4 59.1%
LSERS 1,410.3 2,153.4 65.5%
STPOL 395.9 678.3 58.4%
State Total $ 23,806.2 $ 39,657.9 60.0%
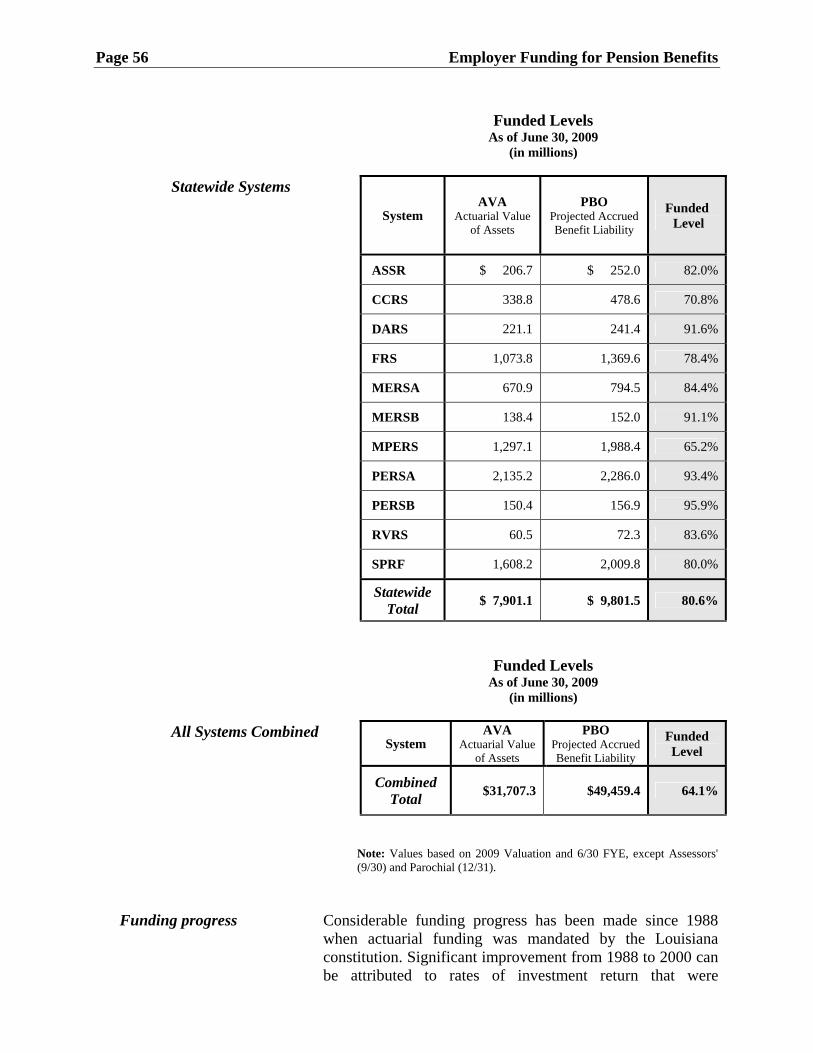
Page 56 Employer Funding for Pension Benefits
Funded Levels
As of June 30, 2009 (in millions)
Statewide Systems
System AVA
Actuarial Value of Assets
PBO Projected Accrued Benefit Liability
Funded Level
ASSR $ 206.7 $ 252.0 82.0%
CCRS 338.8 478.6 70.8%
DARS 221.1 241.4 91.6%
FRS 1,073.8 1,369.6 78.4%
MERSA 670.9 794.5 84.4%
MERSB 138.4 152.0 91.1%
MPERS 1,297.1 1,988.4 65.2%
PERSA 2,135.2 2,286.0 93.4%
PERSB 150.4 156.9 95.9%
RVRS 60.5 72.3 83.6%
SPRF 1,608.2 2,009.8 80.0%
Statewide Total
$ 7,901.1 $ 9,801.5 80.6%
Funded Levels As of June 30, 2009
(in millions)
All Systems Combined System
AVA Actuarial Value
of Assets
PBO Projected Accrued Benefit Liability
Funded Level
Combined
Total $31,707.3 $49,459.4 64.1%
Note: Values based on 2009 Valuation and 6/30 FYE, except Assessors' (9/30) and Parochial (12/31).
Funding progress Considerable funding progress has been made since 1988 when actuarial funding was mandated by the Louisiana constitution. Significant improvement from 1988 to 2000 can be attributed to rates of investment return that were

Employer Funding for Pension Benefits Page 57
consistently larger than the rates assumed by the actuaries. Investment losses in 2001, 2002, 2008, and 2009, benefit improvements, and the use of actuarial gains to provide for COLAs have compromised funding levels over the past eight years. This is seen by the changes in Funded Levels over time as shown below.
FUNDED LEVELS (AVA / PBO)
Fiscal Year
2000 2001 2002 2003 2004 2005 2006 2007 2008 2009
State Systems
LASERS 80.9% 76.3% 67.2% 59.7% 59.6% 62.5% 65.8% 69.4% 68.6% 60.8%
TRSL 88.8% 82.7% 72.0% 62.4% 63.1% 65.1% 70.3% 74.3% 71.8% 59.1%
LSERS 133.7% 114.5% 90.7% 84.0% 79.4% 78.9% 82.3% 83.3% 76.6% 65.5%
STPOL 72.0% 77.1% 73.5% 62.4% 62.8% 62.5% 72.4% 75.9% 74.5% 58.4%
State Total 88.1% 82.2% 71.5% 62.7% 62.9% 64.9% 69.4% 73.1% 71.0% 60.0%
Statewide Systems
ASSR 73.6% 66.4% 61.3% 59.5% 61.2% 65.9% 73.4% 77.8% 78.1% 82.0%
CCRS 78.3% 76.6% 72.5% 67.8% 66.5% 66.8% 76.3% 78.9% 79.1% 70.8%
DARS 131.9% 128.5% 117.7% 103.7% 98.2% 100.6% 108.4% 109.6% 103.8% 91.6%
FRS 86.0% 82.3% 74.9% 72.3% 74.5% 83.5% 86.4% 88.6% 88.4% 78.4%
MERSA 92.4% 91.0% 85.5% 78.8% 77.1% 78.4% 83.3% 87.9% 89.3% 84.4%
MERSB 101.9% 92.3% 87.4% 81.3% 78.7% 80.1% 88.6% 94.7% 96.1% 91.1%
MPERS 109.4% 105.6% 95.6% 77.4% 76.6% 83.6% 87.4% 93.5% 86.9% 65.2%
PERSA 102.0% 99.1% 90.9% 87.9% 89.5% 89.6% 97.3% 101.6% 89.3% 93.4%
PERSB 130.3% 117.8% 108.4% 106.3% 107.4% 106.7% 108.3% 107.4% 91.9% 95.9%
RVRS 104.8% 104.2% 97.7% 91.5% 87.0% 88.2% 91.6% 97.2% 95.9% 83.6%
SPRF 93.8% 87.8% 84.2% 81.9% 79.9% 80.3% 86.8% 90.1% 88.8% 80.0%
Statewide Total
98.1% 94.1% 86.9% 80.2% 80.0% 83.3% 89.0% 93.1% 88.3% 80.6%
All Systems Combined
Total: 89.8% 84.3% 74.2% 65.8% 66.0% 68.3% 73.1% 76.9% 74.2% 64.1%

Page 58 Employer Funding for Pension Benefits
PBO – Projected Benefit Obligation AVA – Actuarial Value of Assets
1998 1999 2000 2001 2002 2003 2004 2005 2006 2007 2008 2009
State 77.70% 82.00% 88.10% 82.20% 71.50% 62.70% 62.90% 64.90% 69.40% 73.10% 71.00% 60.00%
Statewide 100.00%99.30% 98.10% 94.10% 86.90% 80.20% 80.00% 83.30% 89.00% 93.10% 83.30% 80.60%
0.00%
10.00%
20.00%
30.00%
40.00%
50.00%
60.00%
70.00%
80.00%
90.00%
100.00%
Historical Funded Ratios Percentage of the PBO Covered by the AVA

Employer Funding for Pension Benefits Page 59
Funded Ratios Statewide Systems Eligibility for COLAs
Under current statutes, if the "Funded Ratio" is less than the "Target Ratio,” a statewide retirement system may not grant COLA benefits. For all statewide systems except MPERS, the Funded Ratio is calculated as the ratio of the actuarial value of assets to the PBO. For MPERS, the Funded Ratio is the ratio of the actuarial value of assets to accrued liability under the actuarial funding method used by system. Theseratios are then compared to a Target Ratio that is specified by formula in Louisiana public retirement law. Prior to 2007, COLA benefits for LSERS and STPOL also depended on a comparison of the Funded Ratio and the Target Ratio. However, Act 333 of the 2007 Regular Session changed this practice and in its stead created Experience Accounts that operate similarly to the Experience Accounts for LASERS and TRSL.
Funding Eligibility for COLAs
as of June 30, 2009
Statewide Systems System Target Ratio Funded Ratio ASSR 86.1% 82.0% CCRS 90.4% 70.8% DARS 100.0% 91.6% FRS 94.1% 78.4% MERSA 95.4% 84.4% MERSB 95.4% 91.1% MPERS 94.9% 65.2% PERSA 92.8% 93.4% PERSB 100.0% 95.9% RVRS 100.0% 83.6% SPRF 100.0% 80.0%
Note: Values based on 2009 Valuation and 6/30 FYE, except Assessors' (9/30) and Parochial (12/31).

Page 60 Employer Funding for Pension Benefits
16. Participant Census and Payroll
Membership The following table presents data pertaining to membership
in the state and statewide systems. Participants are categorized as active members, retired members, or members currently in the DROP.
Participant Census As of June 30, 2009
Actives Retirees Current DROP
Total Members
% of All Systems
FY 2009 Payroll*
State LASERS 61,991 38,253 2,683 104,874 27.2% $ 2,562.6
Systems TRSL 88,206 62,417 3,421 159,916 41.5% 3,912.3
LSERS 13,265 12,290 508 26,424 6.8% 315.4
STPOL 1,103 1,175 18 2,321 0.6% 59.6
State Total
164,565 114,135 6,630 293,535 76.1% $ 6,849.9
Statewide ASSR 761 454 16 1,312 0.3% $ 38.0
Systems CCRS 2,257 894 114 3,704 1.0% 85.8
DARS 725 176 7 1,194 0.3% 50.5
FRS 3,882 1,688 147 6,179 1.6% 178.9
MERSA 4,829 2,861 223 10,681 2.8% 157.1
MERSB 2,204 833 65 4,191 1.1% 64.8
MPERS 6,071 3,984 185 10,352 2.7% 270.2
PERSA 14,367 5,413 428 27,381 7.1% 536.4
PERSB 2,253 560 37 4,394 1.1% 79.4
RVRS 238 138 9 409 0.1% 11.8
SPRF 14,396 3,369 0 22,506 5.8% 577.1
Statewide Total
51,983 20,370 1,231 92,303 23.9% $ 2,050.0
All Systems
Total 216,548 134,505 7,861 385,838 100.0% $ 8,899.9
Millions of dollars
Total membership includes members entitled to a deferred pension benefit or a refund of contributions. Participant counts are not shown for these members.
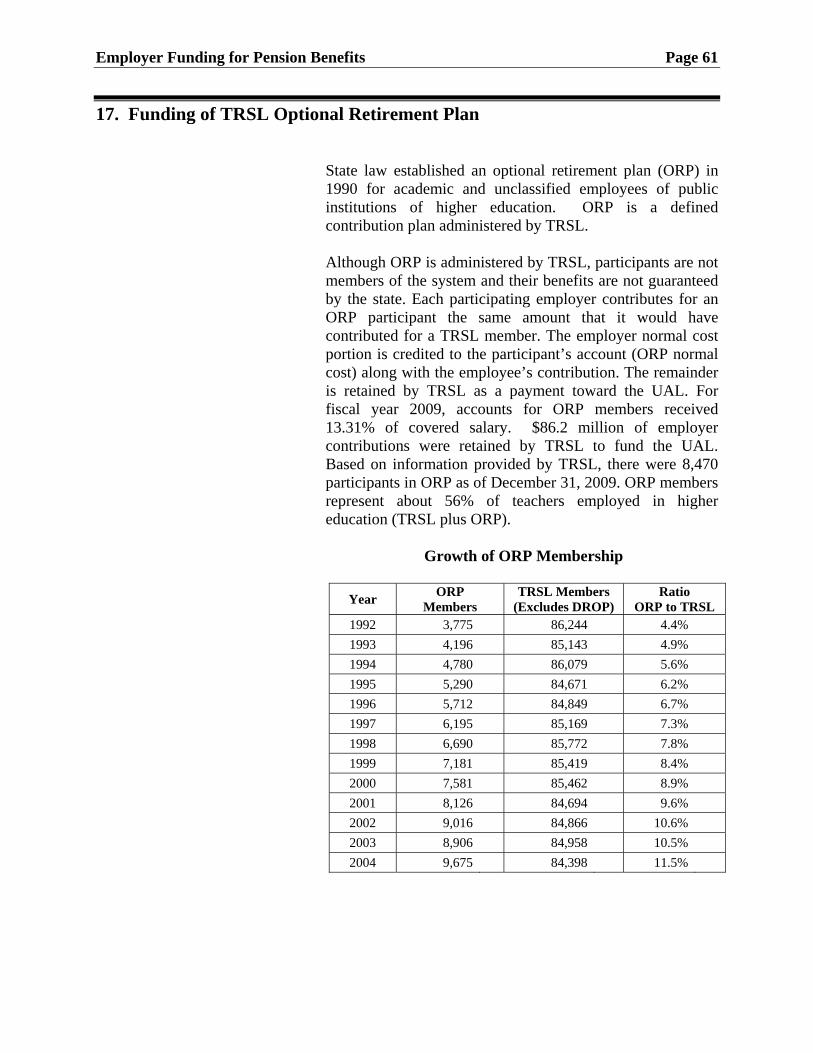
Employer Funding for Pension Benefits Page 61
17. Funding of TRSL Optional Retirement Plan
State law established an optional retirement plan (ORP) in 1990 for academic and unclassified employees of public institutions of higher education. ORP is a defined contribution plan administered by TRSL. Although ORP is administered by TRSL, participants are not members of the system and their benefits are not guaranteed by the state. Each participating employer contributes for an ORP participant the same amount that it would have contributed for a TRSL member. The employer normal cost portion is credited to the participant’s account (ORP normal cost) along with the employee’s contribution. The remainder is retained by TRSL as a payment toward the UAL. For fiscal year 2009, accounts for ORP members received 13.31% of covered salary. $86.2 million of employer contributions were retained by TRSL to fund the UAL. Based on information provided by TRSL, there were 8,470 participants in ORP as of December 31, 2009. ORP members represent about 56% of teachers employed in higher education (TRSL plus ORP).
Growth of ORP Membership
Year ORP
Members TRSL Members
(Excludes DROP) Ratio
ORP to TRSL 1992 3,775 86,244 4.4%
1993 4,196 85,143 4.9%
1994 4,780 86,079 5.6%
1995 5,290 84,671 6.2%
1996 5,712 84,849 6.7%
1997 6,195 85,169 7.3%
1998 6,690 85,772 7.8%
1999 7,181 85,419 8.4%
2000 7,581 85,462 8.9%
2001 8,126 84,694 9.6%
2002 9,016 84,866 10.6%
2003 8,906 84,958 10.5%
2004 9,675 84,398 11.5%

Page 62 Employer Funding for Pension Benefits
Growth of ORP Membership (Continued)
Year ORP
Members TRSL Members
(Excludes DROP) Ratio
ORP to TRSL 2005 8,845 84,546 10.5%
2006 8,635 78,456 11.0%
2007 8,955 79,796 11.2%
2008 8,677 85,979 10.1%
2009 8,470 84,719 10.0%
Section II
Benefit Formulas, Retirement Eligibility, and Contribution Rates

Benefit Formulas, Retirement Eligibility, and Contribution Rates Page 63
1. Benefit Accruals and Member Contribution Rates
Formula The retirement benefit for the thirteen systems is generally based on the
following formula:
Annual Benefit at
Retirement
=
Benefit Accrual
Rate
x
Years of Service at
Retirement
x
Final Average
Compensation The benefit may not exceed final average compensation.
Benefit Accrual Rates, Retirement Eligibility, & Member Contribution Rates
(as of July 1, 2009)
Benefit Accrual
Final Avg
Comp
Retirement Eligibility Member
Contribution Service Age
LASERS Regular 2.50%
3 yrs
10 60 7.50%
2.50% 25 55 7.50%
2.50% 30 any age 7.50%
Hired On/After 7/1/2006 2.50% 5 yrs 10 60 8.00%
Legislators 3.50%
3 yrs
12 55 11.50%
3.50% 16 any age 11.50%
3.50% 20 50 11.50%
Wildlife Agents [eff. 7/1/2003]
Employed Before 7/1/2003 3.0% Service Before 7/01/2003
3 1/3% Service On or After 7/01/2003
See Above 3 yrs
10 25 9.50%
20 any age 9.50%
Employed On/After 7/1/2003 3 1/3% 3 yrs
10 60 9.50%
3 1/3% 25 any age 9.50%
Corrections Officers and DPS
Employed Before 8/15/1986 2.50% 3 yrs
20 any age 9.00%
Employed 8/15/86 – 12/31/01 2.50% 20 50 9.00%
All Members 2.50%* 3 yrs
25 any age 9.00%
AG Opinion / LASERS Policy 2.50%* 10 60 9.00%
* Public Safety Service Secondary Plan – 3 1/3% for service after 12/31/2001.
Judges & Court Officers [eff. 7/1 & 8/15/2003]
3.50%
3 yrs
10 65 11.50%
3.50% 12 55 11.50%
3.50% 18 any age 11.50%
* At least 12 yrs as judge/court officer
3.50% 20* 50 11.50%
3.50% any 70 11.50%
LASERS: Early retirement – 20 years of service with actuarially reduced benefits.

Page 64 Benefit Formulas, Retirement Eligibility, and Contribution Rates
Benefit Accrual Rates, Retirement Eligibility, & Member Contribution Rates
(as of July 1, 2009)
Benefit Accrual
Final Avg
Comp
Retirement Eligibility Member
ContributionService Age
TRSL Regular Teachers
Employed Before 7/1/1999 2.00%
3 yrs
5 60 8.00%
2.00% 20 any age 8.00%
2.50% 20 65 8.00%
Employed On/After 7/1/1999 2.50% 3 yrs
5 60 8.00%
2.50%* 20* any age* 8.00%
All Teachers 2.50% 3 yrs
25 55 8.00%
2.50% 30 any age 8.00%
Lunch Plan A 3.00%
3 yrs
5 60 9.10%
3.00% 25 55 9.10%
3.00% 30 any age 9.10%
Lunch Plan B (In Social Security)
2.00% 3 yrs
5 60 5.00%
2.00% 30 55 5.00%
Teachers’ early retirement – actuarially reduced.
Benefit Accrual
Final Avg
Comp
Retirement Eligibility Member
ContributionService Age
LSERS All Employees (Retirement on or after July 1, 2001)
Employed Before 7/1/2006 3 1/3%
3 yrs
10 60 7.50%
3 1/3% 25 55 7.50%
3 1/3% 30 any age 7.50%
Employed On/After 7/1/2006 3 1/3%
5 yrs
10 60 7.50%
3 1/3% 25 55 7.50%
3 1/3% 30 any age 7.50%
Early retirement – 20 years of service with actuarially reduced benefits.
Benefit Accrual
Final Avg
Comp
Retirement Eligibility Member
ContributionService Age
STPOL All Employees 3 1/3%
3 yrs
10 50 8.00%
Employed Before 9/8/1978 3 1/3% 20 any age 8.00%
Employed On/After 7/1/1978 3 1/3% 25 any age 8.00%

Benefit Formulas, Retirement Eligibility, and Contribution Rates Page 65
Benefit Accrual Rates, Retirement Eligibility, & Member Contribution Rates
(as of July 1, 2009)
Benefit Accrual
Final Avg
Comp
Retirement Eligibility Member
ContributionService Age
ASSR All Employees
Hired Before 10/1/2006 3 1/3% 3 yrs
12 55 8.00%
3 1/3% 30 any age 8.00%
Hired On/After 10/1/2006 3 1/3% 5 yrs
12 55 8.00%
3 1/3% 30 any age 8.00%
Benefit Accrual
Final Avg
Comp
Retirement Eligibility Member
ContributionService Age
CCRS All Employees
Hired Before 7/1/2006
Service Before 7/1/1999 3.00% 3 yrs
12 55 8.25%
Service After 7/1/1999 3 1/3% 12 55 8.25%
Hired On/After 7/1/2006
Service Before 7/1/1999 3.00% 5 yrs
12 55 8.25%
Service After 7/1/1999 3 1/3% 12 55 8.25%
Benefit Accrual
Final Avg
Comp
Retirement Eligibility Member
ContributionService Age
DARS All Employees 3.50%
3 yrs
10 60 7.00%
3.50% 24 55 7.00%
3.50% 30 any age 7.00%
Members employed prior to 7/1/1990 may elect prior provisions (3% formula).
Early retirement – eligibility and 3% reductions based on age and service.
Benefit Accrual
Final Avg
Comp
Retirement Eligibility Member
ContributionService Age
FRS All Employees 3 1/3%
3 yrs
12 55 8.00%
3 1/3% 20 50 8.00%
3 1/3% 25 any age 8.00%

Page 66 Benefit Formulas, Retirement Eligibility, and Contribution Rates
Benefit Accrual Rates, Retirement Eligibility, & Member Contribution Rates
(as of July 1, 2009)
Benefit Accrual
Final Avg
Comp
Retirement Eligibility Member
ContributionService Age
MERS Plan A
Hired Before 7/1/2006 3.00% 3 yrs
10 60 9.25%
3.00% 25 any age 9.25%
Hired On/After 7/1/2006 3.00% 5 yrs
10 60 9.25%
3.00% 25 any age 9.25%
Plan B
Hired Before 7/1/2006 2.00% 3 yrs
10 60 5.00%
2.00% 30 any age 5.00%
Hired On/After 7/1/2006 2.00% 5 yrs
10 60 5.00%
2.00% 30 any age 5.00%
Benefit Accrual
Final Avg
Comp
Retirement Eligibility Member
ContributionService Age
MPERS All Employees 3 1/3%
3 yrs
12 55 7.50%
3 1/3% 20 50 7.50%
3 1/3% 25 any age 7.50%
Early retirement – 20 years of service with actuarially reduced benefits.
Member contributions reduced from 8.00% upon full funding – R.S. 1991 Act 397.
Benefit Accrual
Final Avg
Comp
Retirement Eligibility Member
ContributionService Age
PERS Plan A*
Hired Before 1/1/2007 3.00%
3 yrs
7 65 9.50%
3.00% 10 60 9.50%
3.00% 25 55 9.50%
3.00% 30 any age 9.50%
Hired On/After 1/1/2007 3.00%
5 yrs
7 67 9.50%
3.00% 10 62 9.50%
3.00% 30 55 9.50%
* For members of the supplemental plan only, the accrual rate is 1% plus $2 for each month of service prior to the revision date.

Benefit Formulas, Retirement Eligibility, and Contribution Rates Page 67
Benefit Accrual Rates, Retirement Eligibility, & Member Contribution Rates
(as of July 1, 2009)
Benefit Accrual
Final Avg
Comp
Retirement Eligibility Member
ContributionService Age
PERS Plan B (In Social Security)
Hired Before 1/1/2007 2.00%
3 yrs
7 65 3.00%
2.00% 10 60 3.00%
2.00% 30 55 3.00%
Hired On/After 1/1/2007 2.00%
5 yrs
7 67 3.00%
2.00% 10 62 3.00%
2.00% 30 55 3.00%
Benefit Accrual
Final Avg
Comp
Retirement Eligibility Member
ContributionService Age
RVRS Hired Before 7/1/2006 3 1/3%
3 yrs
10 60 7.00%
3 1/3% 20 55 7.00%
3 1/3% 30 any age 7.00%
Hired On/After 7/1/2006 3 1/3%
5 yrs
10 60 7.00%
3 1/3% 20 55 7.00%
3 1/3% 30 any age 7.00%
Benefit Accrual
Final Avg
Comp
Retirement Eligibility Member*
ContributionService Age
SPRF Hired Before 7/1/2006 3 1/3% 3 yrs
12 55 10.00%
3 1/3% 30 any age 10.00%
Hired On/After 7/1/2006 3 1/3% 5 yrs
12 55 10.00%
3 1/3% 30 any age 10.00%
Early retirement – 20 years of service and age 50 with actuarially reduced benefits.
* Effective 7/1/2004 not less than 9.8% or more than 10.25% – R.S.2004 Act 782.

Page 68 Benefit Formulas, Retirement Eligibility, and Contribution Rates
2. Benefit Levels and Employee Paid Portion
The following table and graph illustrates two aspects of the retirement benefit.
Income Replacement Ratio The income replacement ratio is the portion of a member’s average income immediately before retirement that is replaced by pension benefits immediately after retirement. The following table shows the ratios expected for a person newly hired in fiscal years after June 30, 2009 (un-shaded portion of the table). The retirement benefit is calculated using the five highest consecutive earning years that the member has over his entire salary history or three highest consecutive earning years, depending on the retirement system to which the member belongs. Showing the benefit as a percentage of pre-retirement earnings provides the employer an indication of the plan's benefit adequacy level. It gives the income replacement ratio which benefits are expected to provide upon retirement.
Employee Funding The shaded percentages show the portion of the cost for
retirement benefits that will be funded by employee contributions. A new member's future expected contributions are accumulated with interest at the valuation return rate over the designated time period. The accumulated value is then divided by the actuarial present value of his future retirement benefits. This is the portion of the benefit cost that will be funded by the member's contributions.
Hazardous Duty: The table separates plans that are predominantly for members performing hazardous duties from plans that apply to members employed in non-hazardous occupations. Benefit formulas for employees engaged in hazardous duty are traditionally at higher levels and with earlier normal retirement ages than plans for other types of employment. Hazardous duty personnel are typically members employed in law enforcement and public safety. The group shown on the following page is composed of state police, firefighters, sheriffs, municipal police, wildlife enforcement agents, and public safety officers. Benefit/Cost Illustrations: Retirement benefit provisions, employee contribution rates, and actuarial assumptions applied in this section are those in effect for FY 2009, including legislation under Acts of the 2009 Regular Session.

Benefit Formulas, Retirement Eligibility, and Contribution Rates Page 69
For Fiscal Year 2009
Division Age
Replacement Ratios (Benefit as % of Pay)
Employee Paid Portion of Benefit Cost (with interest)
Non-Hazardous Group Years of Service
20 30 40 20 30 40
(Projected for a New Member)
LASERS Regular 65 46% 69% 91% 52% 66% 77%
Legislators 65 67% 95% 95% 71% 100% 100%
Judges 65 67% 95% 95% 70% 100% 100%
TRSL Teachers 65 45% 69% 90% 51% 62% 73%
Lunch A 65 55% 82% 92% 51% 62% 81%
Lunch B 65 36% 55% 77% 40% 50% 66%
LSERS Regular 65 61% 92% 93% 35% 41% 57%
ASSR Regular 65 60% 89% 89% 35% 39% 47%
CCRS Regular 65 60% 89% 89% 36% 39% 47%
DARS Regular 65 66% 94% 94% 27% 28% 32%
MERS Plan A 65 54% 80% 89% 50% 55% 64%
Plan B 65 36% 54% 71% 40% 45% 49%
PERS Plan A 65 54% 81% 90% 46% 50% 57%
Plan B 65 36% 54% 72% 22% 24% 26%
RVRS Regular 65 58% 88% 88% 28% 29% 32%

Page 70 Benefit Formulas, Retirement Eligibility, and Contribution Rates
For Fiscal Year 2009
Division Age
Replacement Ratios (Benefit as % of Pay)
Employee Paid Portion of Benefit Cost (with interest)
Hazardous Group Years of Service
20 25 20 25
(Projected for a New Member)
LASERS Wildlife 55 59% 74% 33% 35%
Corrections 55 45% 56% 46% 49%
Public Safety 55 59% 74% 35% 37%
STPOL Regular 55 60% 74% 30% 31%
FRS Regular 55 63% 79% 27% 29%
MPERS Regular 55 61% 75% 31% 32%
SPRF Regular 55 60% 74% 40% 42%

Benefit Formulas, Retirement Eligibility, and Contribution Rates Page 71
Non Hazardous Duty Hazardous Duty
Retirement % – Retirement Income as a Percentage of Pre Retirement Income Employee % – Portion of the Total Benefit Funded by the Employee
LASERS JUDGES TRSL LSERS ASSR CCRS DARS MERS A PERS A RVRS STPOL FRS SPRF MPERSWILDLIFE
PUBLICSAFETY
RETIREMENT % 58% 83% 57% 76% 74% 74% 82% 67% 67% 73% 74% 79% 74% 75% 74% 74%
EMPLOYEE % 50% 70% 46% 32% 32% 33% 24% 43% 40% 25% 31% 29% 42% 32% 35% 37%
0%
10%
20%
30%
40%
50%
60%
70%
80%
90%
100%
Ratio of Retirement Benefit to Retirement Income andThe Portion of the Benefit Paid by Employees
Retirement Age 55 with 25 Years of Service
Page 72 Benefit Formulas, Retirement Eligibility, and Contribution Rates
3. Projected Contribution Rates Public Sources (Employer) As discussed in the Employer Funding for Pension Benefits
section of this report, the State of Louisiana is primarily responsible for funding the four state retirement systems through general fund appropriations, agency self-generated funds, IPTF allocations, or as transfer payments to local school districts. Funding sources for the nine statewide retirement systems include local appropriations, ad valorem taxes, general revenue sharing funds, IPTF allocations, and special General Fund appropriations. Other incidental funding sources, available to participating employers, may vary from time to time. The larger systems, LASERS and TRSL, have combined sub plans to determine a single aggregated projected employer rate.
Member Rates Employee contribution rates are fixed by statute and are
summarized in the first part of this section. Required member contributions vary by plan and, with some exceptions, range from 7.0% to 10.0% of employee pay. Judges/court officers and legislators are required to contribute 11.5%.
Total Projected Rates The combination of total public sources of employer funding
plus member contributions, are required to fund the system’s total future expected retirement plan obligations. Total projected rates reflect the total funding requirement for the plan’s fiscal year as a percentage of member payroll. For FY 2011, we expect total projected rates to range from 23.9% to 58.9% of member payroll, with a median rate of 31.5%. Last year’s range was 21.5% to 51.9%, with a median of 26.4%.
The following graph compares total projected rates (all sources including member rates) with member rates only. These are based on actuarial valuation results as approved by PRSAC to be paid for FY 2011.

Benefit Formulas, Retirement Eligibility, and Contribution Rates Page 73
Non Hazardous Duty Hazardous Duty
LASERS JUDGES TRSL LSERS ASSR CCRS DARS MERS A PERS A RVRS STPOL FRS SPRF MPERSWILDLIFE
PUBLICSAFETY
ALL SOURCES 29.5% 33.5% 28.2% 31.8% 38.7% 34.5% 28.2% 26.1% 23.9% 35.1% 58.9% 41.1% 28.1% 37.9% 31.5% 31.0%
MEMBER ONLY 7.50% 11.50% 8.00% 7.50% 8.00% 8.25% 7.00% 9.25% 9.50% 7.00% 8.00% 8.00% 10.00% 7.50% 9.50% 9.00%
0.0%
10.0%
20.0%
30.0%
40.0%
50.0%
60.0%
70.0%
80.0%
90.0%
100.0%
Projected Contribution RatesAll Sources and Members Only
2011 Fiscal Year

Page 74 Benefit Formulas, Retirement Eligibility, and Contribution Rates
This page is intentionally blank.
Section III
Actuarial Concerns - Funding Issues

Actuarial Concerns – Funding Issues Page 75
1. The Cost of Funding the UAL for State Systems
Issue The UAL for the four state retirement systems in the
aggregate was $16.8 billion on June 30, 2009. This debt is being amortized over the next 30 years. The general pattern of payments scheduled to be made over this period is summarized below.
1. Amortization payments for FY 2010 are scheduled to be
$1,076.2 million. 2. Payments will steadily increase to about $1.6 billion in
FY 2019 and to $1.75 billion by FY 2029. 3. Beginning in FY 2030, payments will fall to about $1.13
billion and steadily decrease thereafter, until full funding is attained on June 30, 2040.
The fundamental issue is: “Will the state be able to afford these amortization payments as the dollar amount continues to rise?”
Amortization Payments Under rules adopted in 1992, amortization payment
schedules for LASERS and TRSL were developed to pay off the UAL debt with annual payments increasing 4.5% a year. The final payment was scheduled to be made in FY 2029.
An increasing payment schedule was adopted because it was
assumed that growth in Louisiana government combined with inflation would lead to an aggregate payroll increase of 4.5% a year. Under this assumption, amortization payments as a percentage of government payrolls would remain constant from year to year.
. Several changes have been made to the payment schedules
since to 1992, with the most recent change occurring with Act 497 of the 2009 legislative session. Although payments are scheduled to increase, they are no longer linked in any manner to anticipated future payrolls of the state. As a result of Act 497:
Page 76 Actuarial Concerns – Funding Issues
1. The UALs will be reduced by balances in the LASERS and TRSL IUAL Funds, the Experience Accounts, and the Employer Credit Accounts. The UALs will be reduced by $206.8 million and $671.5 million for LASERS and TRSL, respectively.
2. Annual amortization payments will be smaller than they
would have been otherwise because the outstanding principal amounts are less. Under Act 497, amortization payments will not be sufficient to cover interest on the UAL until June 30, 2013, and the UAL will continue to increase. Prior to Act 497, payments would have been insufficient to pay interest until June 30, 2016.
3. Amortization payments will be more than enough to
cover interest charges after June 30, 2013, and UAL balances will begin to decline.
Note: amortization schedules under Act 497 comply with the law requiring the IUAL established on June 30, 1988, to be fully amortized by June 30, 2029. Longer periods of time are available to amortize adjustments to the UAL that have occurred since 1988 due to gains, losses, benefit improvements and changes in methods and assumptions.
Amortization payments for each of the state retirement
systems are shown in the graph below. Outstanding balances for the UALs over the next 30 years are also shown.

Actuarial Concerns – Funding Issues Page 77
$-
$200
$400
$600
$800
$1,000
$1,200
$1,400
$1,600
$1,800
$2,000
2010 2014 2018 2022 2026 2030 2034 2038
Mil
lion
s
Fiscal Year Ending
Annual Payments toward Amortization of the UAL for theFour State Retirement Systems
LASERS TRSL LSERS STPOL TOTAL
$-
$2,000
$4,000
$6,000
$8,000
$10,000
$12,000
$14,000
$16,000
$18,000
2009 2013 2017 2021 2025 2029 2033 2037
Mil
lion
s
Balance on June 30
Projected Unfunded Accrued Liability for theFour State Retirement Systems
LASERS TRSL LSERS STPOL TOTAL

Page 78 Actuarial Concerns – Funding Issues
Mid-year amortization payment amounts for selected years are shown below in the aggregate and separately for each retirement system.
SCHEDULED MID-YEAR AMORTIZATION PAYMENTS FOR THE TOTAL UAL
(of June 30, 2009)
Combined State Systems
Fiscal Year
Years Out
UAL Mid-Year Amortization Payment
2010 1 $ 1,076,200,000
2014 5 1,382,400,000
2019 10 1,598,800,000
2024 15 1,668,400,000
2029 20 1,747,500,000
2034 25 1,022,200,000
2040 31 629,500,000
LASERS
Fiscal Year
Years Out
UAL Mid-Year Amortization Payment
2010 1 $ 390,200,000
2014 5 483,300,000
2019 10 555,800,000
2024 15 578,100,000
2029 20 602,800,000
2034 25 340,900,000
2040 31 239,200,000
TRSL
Fiscal Year
Years Out
UAL Mid-Year Amortization Payment
2010 1 $ 619,100,000
2014 5 820,900,000
2019 10 953,000,000
2024 15 984,500,000
2029 20 1,019,200,000
2034 25 650,600,000
2040 31 390,200,000
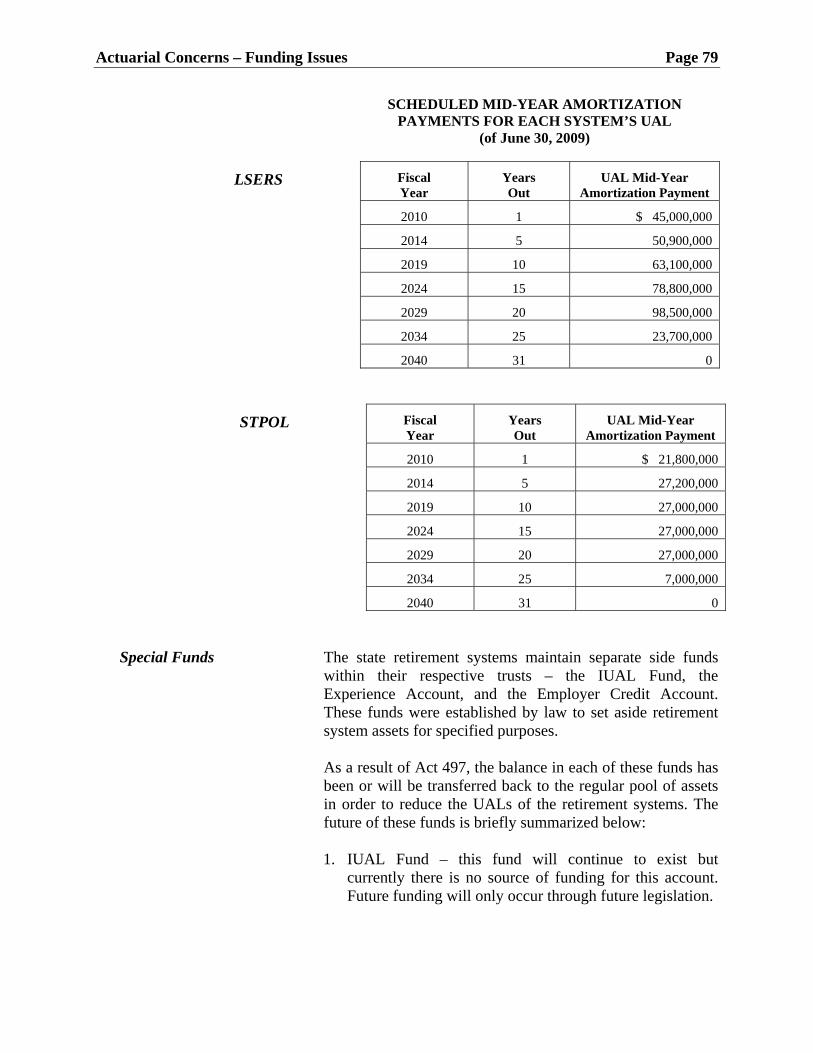
Actuarial Concerns – Funding Issues Page 79
SCHEDULED MID-YEAR AMORTIZATION PAYMENTS FOR EACH SYSTEM’S UAL
(of June 30, 2009)
LSERS
Fiscal Year
Years Out
UAL Mid-Year Amortization Payment
2010 1 $ 45,000,000
2014 5 50,900,000
2019 10 63,100,000
2024 15 78,800,000
2029 20 98,500,000
2034 25 23,700,000
2040 31 0
STPOL
Fiscal Year
Years Out
UAL Mid-Year Amortization Payment
2010 1 $ 21,800,000
2014 5 27,200,000
2019 10 27,000,000
2024 15 27,000,000
2029 20 27,000,000
2034 25 7,000,000
2040 31 0
Special Funds The state retirement systems maintain separate side funds
within their respective trusts – the IUAL Fund, the Experience Account, and the Employer Credit Account. These funds were established by law to set aside retirement system assets for specified purposes.
As a result of Act 497, the balance in each of these funds has
been or will be transferred back to the regular pool of assets in order to reduce the UALs of the retirement systems. The future of these funds is briefly summarized below:
1. IUAL Fund – this fund will continue to exist but
currently there is no source of funding for this account. Future funding will only occur through future legislation.
Page 80 Actuarial Concerns – Funding Issues
2. Experience Account – this account will continue to receive 50% of any investment gains that exceed a stated threshold. The thresholds for LASERS and TRSL are $100 million and $200 million, respectively. For LSERS and STPOL, 50% of any investment gain will be transferred from the regular pool of assets to the Experience Account.
3. Employer Credit Account – this account will also
continue to exist, but given the current financial status of the retirement systems, it is unlikely that any funding will be available in the foreseeable future.
Actuarial Concerns – Funding Issues Page 81
2. Structural Changes for Amortizing the UAL Issue The state’s commitment to amortize UAL for LASERS and
TRSL has changed several times since actuarial funding began on July 1, 1988.
The Louisiana Constitution, as amended in 1988, mandated
the IUAL to be fully funded by June 30, 2029. Thereafter, the only cost to employers for retirement benefits will be for employer normal costs and payments to amortize offsetting gains and losses that have occurred after 1988, and that will continue to occur in the future. Large legacy costs should no longer exist.
Significant structural changes for amortizing the UAL
occurred in 1990, 1992, 1993, 2004, and 2008. The most recent change occurred with the enactment of Act 497 during the 2009 Regular Session. The effects that Act 497 will have on amortization schedules for LASERS and TRSL are shown below. A history of the effects of all prior changes follows thereafter.
Act 497 of 2009 Act 497 of the 2009 Regular Session applied to LASERS and
TRSL. The Act made the following changes to their amortization schedules.
LASERS
1. A new amortization base called the Original Amortization Base (OAB) will be established as of June 30, 2010. Essentially, the outstanding balance of the IUAL will be reduced by the outstanding balances of net actuarial gains and losses occurring from 1989 to 1993 and actuarial gains that occurred in 1993-1995, 1997-1998, and 2005-2007. The IUAL will be further reduced by amounts in the IUAL Fund.
2. The OAB will be amortized over 19 years from FY 2011
through FY 2029 with payments that increase 6.5% for one year, 5.5% for four years, 5.0% for four years and 2% per year for the remaining period.

Page 82 Actuarial Concerns – Funding Issues
3. Another new amortization base called the Experience Account Amortization Base (EAAB) will be established on June 30, 2010. This base will be the sum of the outstanding balances associated with actuarial losses occurring in 1996, 1999-2004, and 2008. The amount will be reduced by the balance in the Experience Account.
4. The EAAB will be amortized over 30 years with
payments that increase 6.5% for one year, 5.5% for four years, 5.0% for four years and 0.0% per year for the remaining period.
TRSL
1. A new amortization base called the OAB will be established as of June 30, 2010. Essentially, the outstanding balance of the IUAL will be reduced by the outstanding balances of net actuarial gains and losses occurring from 1989 to 1993 and actuarial gains that occurred in 1993-1996, 1998-2000, and 2005-2008. The IUAL will be further reduced by amounts in the IUAL Fund and the Employer Credit Account.
2. The OAB will be amortized over 19 years from FY 2011
through FY 2029 with payments that increase 7.0% for three years, 6.5% for four years, and 2.0% per year for the remaining period.
3. Another new amortization base called the EAAB will be
established on June 30, 2010. This base will be the sum of the outstanding balances associated with actuarial losses occurring in 1997, 2001-2004, and 2008. The amount will be reduced by the balance in the Experience Account.
4. The EAAB will be amortized over 30 years with
payments that increase 7.0% for three years, 6.5% for four years, and 0.0% per year for the remaining period.
History – Initial UAL IUALs for the four state retirement systems were established
on June 30, 1988. No payments were made to amortize IUALs during FY 1989. The IUALs as measured on June 30, 1988, were allowed to grow with interest at the valuation interest rate to June 30, 1989. Payments toward amortizing the IUALs began in FY 1990.

Actuarial Concerns – Funding Issues Page 83
IUAL amounts on June 30, 1988, and June 30, 1989, for each of the four state retirement systems are shown below:
Retirement System
IUAL on June 30, 1988 June 30, 1989
LASERS $ 1,825,421,035 $ 1,962,327,613
TRSL 4,169,250,465 4,481,944,250
LSERS 10,999,431 11,769,391
STPOL 186,389,702 199,436,981
Total $ 6,192,060,633 $ 6,655,478,235
History - New UALs New charges or credits have been incurred by all four state
systems every year after June 30, 1988. Charges or credits are incurred annually for the following reasons:
1. Gains and Losses 2. Changes in Actuarial Assumptions
3. Changes in the Asset Valuation Method
4. Changes in Actuarial Methods other than the Asset
Valuation Method
5. Benefit Changes
The actuary for each system determines the extent to which the UAL has increased or decreased as a result of each of the above factors. An amortization schedule is established for each new UAL charge or credit. The initial balance of each charge or credit is commonly called a charge or credit base.
History – Act 81 of the 1988 Session Act 81 of the 1988 Regular Session applied to all four state
retirement systems. The Act established the following amortization rules in order to implement the constitutional mandate:
1. IUALs established on July 1, 1988, for LASERS, TRSL,
and LSERS were to be amortized over a 40-year period beginning July 1, 1989, and ending June 30, 2029, with payments increasing 4.0% a year for the first four years; 3.5% for the next five years; 3.0% for the next five years; and so on. Payments over the last five years of the 40-year period would increase 0.5% a year.

Page 84 Actuarial Concerns – Funding Issues
2. The IUAL for STPOL was to be amortized with level payments over 20 years.
3. New UAL bases (changes in liability after June 30, 1988)
due to actuarial gains and losses, changes in assumptions, changes in the method of valuing assets, and changes in benefits were to be amortized with level payments over 15 years.
4. New UALs due to changes in actuarial funding methods
other than the actuarial value of assets were to be amortized with level payments over 30 years.
History - Act 470 of the 1990 Session Act 470 of the 1990 Regular Session applied to all four state
retirement systems. The Act modified amortization rules in accordance with the following:
New UAL bases established for the June 30, 1989,
valuation and all subsequent valuations due to changes in actuarial assumptions were to be amortized with level payments over 30 years (instead of 15 years).
History - Act 257 of the 1992 Session Act 257 of the 1992 Regular Session applied to all four state
retirement systems. The Act modified amortization rules in accordance with the following:
1. The outstanding balances of the IUALs on June 30,
1992 – for LASERS and TRSL only – were to be re-amortized over 37 years with payments increasing 4.5% per year.
2. Outstanding balances on June 30, 1992, of New UAL
bases initiated with the 1989, 1990, 1991, and 1992 valuations were to be re-amortized with payments increasing 4.5% a year. Amortization periods were not changed.
3. New UAL bases established with the 1993 and later
valuations were to be amortized in the following manner:
a. New UAL bases due to actuarial gains and losses, changes in the method of valuing assets, and changes in benefits were to be amortized over 15 years with payments increasing 4.5% a year.

Actuarial Concerns – Funding Issues Page 85
b. New UAL bases due to changes in actuarial assumptions and changes in actuarial funding methods other than the actuarial value of assets were to be amortized over 30 years with payments increasing 4.5% a year.
History - Act 734 of the 1993 Session Act 734 of the 1993 Session applied to all four state
retirement systems. The Act provided that at the end of the fiscal year during which assets exceed the actuarial accrued liability, outstanding balances of all amortization bases would be fully liquidated. The amount by which assets exceeded the accrued liability would be amortized as a credit to be amortized over 15 years with credit amounts increasing 4.5% a year.
Asset values for LSERS exceeded the accrued liability on
June 30, 1993, and in accordance with Act 734 all prior balances were liquidated and a new credit base was established subject to amortization over 15 years with credits increasing 4.5% a year. LSERS has interpreted Act 734 to mean that liquidation occurs only for the first year for which assets exceed the accrued liability. Therefore, new payment or credit bases will be established each year thereafter as the surplus or deficit increases or decreases. Liquidation will occur next when the plan again moves from a UAL on a given valuation date to a surplus on the next following valuation date.
LASERS, TRSL, and STPOL have not as yet been affected
by this provision of law. History - Act 588 of the 2004 Session Act 588 of the 2004 Regular Session applied to LASERS,
TRSL, and LSERS. It did not apply to STPOL. The Act modified amortization rules in accordance with the following:
LASERS
1. Assets of the plan were transferred to the Experience Account to pay off the negative balance in the account that existed as of June 30, 2004. A charge base was established for the 2004 valuation to reflect this asset transfer.

Page 86 Actuarial Concerns – Funding Issues
2. The amortization schedule for the IUAL was not changed.
3. The outstanding credit balances on June 30, 2004, of New
UAL bases established by the 1989 through 1998 valuations were re-amortized effective with the 2004 valuation with level payments over 25 years.
4. Amortization schedules for New UAL debit bases
established by the 1999 through 2003 valuations were not changed.
5. New UAL bases established for the 2004 and later
valuations were to be amortized with level payments over 30 years.
TRSL
1. Assets of the plan were transferred to the Experience Account to pay off the negative balance in the account that existed on June 30, 2004. A charge base was established for the 2004 valuation to reflect this asset transfer.
2. The amortization schedule for the IUAL was not
changed.
3. The outstanding balances on June 30, 2004, of New UAL bases established by the 1989 through 2000 valuations were re-amortized effective with the 2004 valuation with level payments over 25 years.
4. Amortization schedules for New UAL bases established
by the 2001 through 2003 valuations were not changed.
5. New UAL bases established for the 2004 and later valuations were to be amortized with level payments over 30 years.
LSERS 1. New rules for LSERS were the same as for TRSL.
2. Note: LSERS did not have an Experience Account in
2004.

Actuarial Concerns – Funding Issues Page 87
STPOL
No changes were made.
History - Act 852 of 2008 Act 852 of the 2008 Regular Session applied to STPOL. The
Act modified amortization rules in accordance with the following:
1. All outstanding balances for amortization bases on
June 30, 2009, currently providing for a schedule of increasing payments were re-amortized with level payments over 20 years.
2. New bases established on June 30, 2009, or later will be
amortized with level payments over 30 years.

Page 88 Actuarial Concerns – Funding Issues
3. Effect of Changing Commitment to Amortize the UAL for LASERS and TRSL
As a result of Act 497 of the 2009 session, amortization
payments were reduced and repayment of the state’s debt to the retirement systems was further postponed. This was a continuation of a pattern of such changes that have occurred since the Louisiana Constitution mandated actuarial funding in 1988. The effect of Act 497 on debt payments and projections of outstanding balances will be shown first. A history of the effect on all prior changes will then be illustrated.
Amortization under Act 497 Act 497 of the 2009 Regular Session had the following
impact on amortization schedules for LASERS and TRSL (see the charts below).
1. Balances in the IUAL Funds, Experience Accounts, and
Employer Credit Accounts for LASERS and TRSL were used to reduce the UALs of the two systems.
2. Amortization payments through FY 2018 were essentially
unchanged.
3. Beginning in FY 2019, payments begin to be substantially reduced. As shown in the following chart, future payments from 2019 through 2029 are substantially smaller after Act 497 than before.
4. Beginning in FY 2030, payments will be lower than they
are currently, but will be larger than they would have been without Act 497.
5. Because the UAL has been reduced, payments will begin
to reduce UAL principal beginning in FY 2013 for LASERS and FY 2014 for TRSL.
Act 497 continued a pattern of refinancing that has occurred
repeatedly since 1988 – payment reductions and postponement of complete amortization of the UAL.

Actuarial Concerns – Funding Issues Page 89
$-
$200
$400
$600
$800
$1,000
$1,200
$1,400
$1,600
1989 1993 1997 2001 2005 2009 2013 2017 2021 2025 2029 2033 2037
Mil
lion
s
Fiscal Year Ending
Change in Amortization Payments Due to Act 497
LASERS before Act 497 LASERS after Act 497
TRSL before Act 497 TRSL after Act 497
$-
$2,000
$4,000
$6,000
$8,000
$10,000
$12,000
1988 1992 1996 2000 2004 2008 2012 2016 2020 2024 2028 2032 2036 2040
Mil
lion
s
Balance on June 30
Change in Projected Outstanding Balances Due to Act 497
LASERS before Act 497 LASERS after Act 497
TRSL before Act 497 TRSL after Act 497

Page 90 Actuarial Concerns – Funding Issues
History - Amortization under Act 81 Amortization schedules are shown below for LASERS and
TRSL. The first graph shows the pattern of annual payments that were required for these systems under Act 81 of the 1988 session. The second graph shows the projected outstanding balance of the IUAL at the end of each year until FY 2029 when the debt is paid off.
$-
$200
$400
$600
$800
$1,000
$1,200
1989 1993 1997 2001 2005 2009 2013 2017 2021 2025 2029
Mil
lion
s
Fiscal Year Ending
Amortization Payment Schedule Established in 1988
LASERS TRSL
$-
$1,000
$2,000
$3,000
$4,000
$5,000
$6,000
$7,000
$8,000
1988 1992 1996 2000 2004 2008 2012 2016 2020 2024 2028
Mil
lion
s
Balance on June 30
Expected Unfunded Accrued Liability Amounts Established in 1988
LASERS TRSL

Actuarial Concerns – Funding Issues Page 91
The following observations can be made from these graphs.
1. Payments increase more rapidly in early years of the period than in later years.
2. Annual payments at the end of the period (FY 2029) will
be more than two times the annual payment at the beginning (FY 1990).
3. Payments through FY 2006 will not be sufficient to pay
interest on the debt. Therefore, the debt increases year after year.
4. Beginning FY 2007, payments are large enough to pay
down some of the outstanding principal.
5. However, the outstanding debt does not return to its original level until FY 2019.
6. Essentially, payment on the original debt is postponed for
30 years and then paid off over the remaining 10-year period.
History - Amortization under Act 257 The charts below shows the effect that Act 257 of the 1992
session had on amortization schedules for LASERS and TRSL.
$-
$200
$400
$600
$800
$1,000
$1,200
1989 1993 1997 2001 2005 2009 2013 2017 2021 2025 2029
Mil
lion
s
Fiscal Year Ending
Change in Amortization Payments Due to Act 257
LASERS before Act 257 LASERS after Act 257
TRSL before Act 257 TRSL after Act 257

Page 92 Actuarial Concerns – Funding Issues
Note the following about these charts:
1. Amortization payments scheduled between FY 1993 and FY 2006 were reduced by relatively small amounts.
2. Amortization payments scheduled after FY 2006 were
increased significantly, growing to a level that is almost 5 times as large as the initial payment.
3. Amortization payments after Act 257 were not projected
to be sufficient to pay interest on the debt until about FY 2014.
4. The outstanding debt was not scheduled to return to its
original level until about FY 2024.
5. Essentially, payment of the outstanding debt was postponed another 5 years with the debt then being paid off over the remaining 5 years.
$-
$1,000
$2,000
$3,000
$4,000
$5,000
$6,000
$7,000
$8,000
1988 1992 1996 2000 2004 2008 2012 2016 2020 2024 2028
Mil
lion
s
Balance on June 30
Change in Projected Outstanding Balances Due to Act 257
LASERS before Act 257 LASERS after Act 257
TRSL before Act 257 TRSL after Act 257
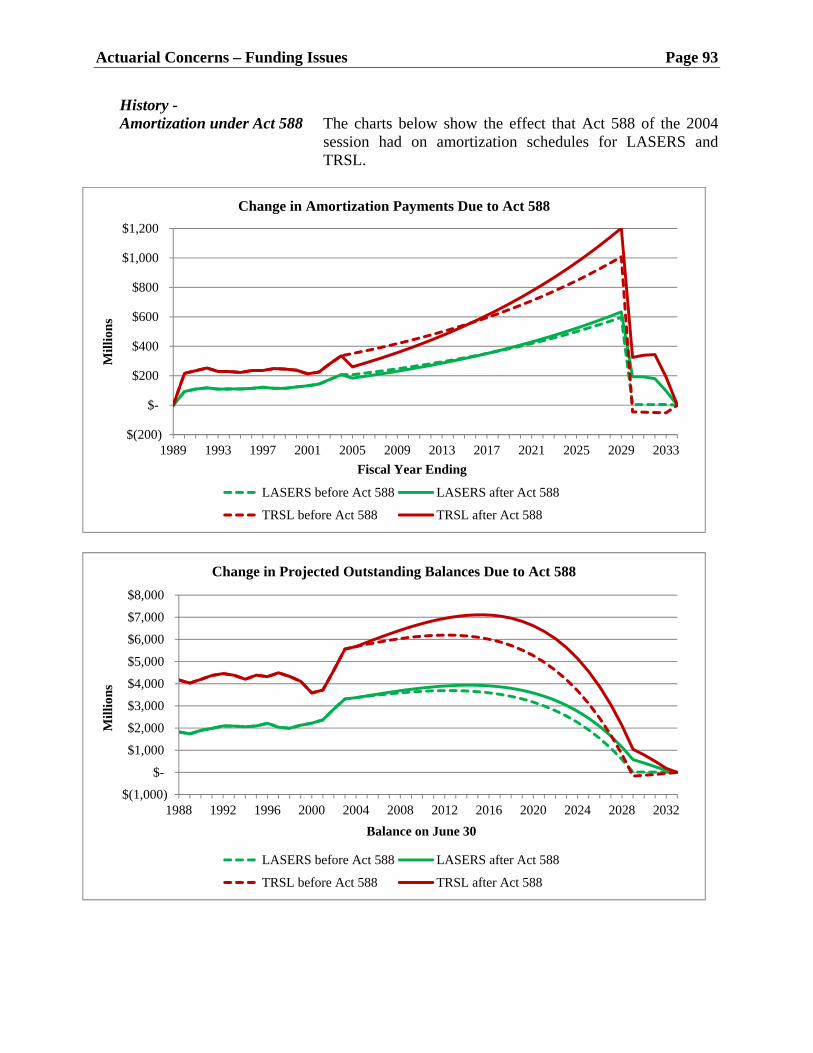
Actuarial Concerns – Funding Issues Page 93
History - Amortization under Act 588 The charts below show the effect that Act 588 of the 2004
session had on amortization schedules for LASERS and TRSL.
$(200)
$-
$200
$400
$600
$800
$1,000
$1,200
1989 1993 1997 2001 2005 2009 2013 2017 2021 2025 2029 2033
Mil
lion
s
Fiscal Year Ending
Change in Amortization Payments Due to Act 588
LASERS before Act 588 LASERS after Act 588
TRSL before Act 588 TRSL after Act 588
$(1,000)
$-
$1,000
$2,000
$3,000
$4,000
$5,000
$6,000
$7,000
$8,000
1988 1992 1996 2000 2004 2008 2012 2016 2020 2024 2028 2032
Mil
lion
s
Balance on June 30
Change in Projected Outstanding Balances Due to Act 588
LASERS before Act 588 LASERS after Act 588
TRSL before Act 588 TRSL after Act 588

Page 94 Actuarial Concerns – Funding Issues
Once again, payments were lowered and payment of the debt was postponed. The debt will continue to grow until FY 2016. Payments will eventually be 6 times as large as the original payment. The debt will be fully paid at the end of FY 2032 instead of FY 2029.

Actuarial Concerns – Funding Issues Page 95
4. Effect of Changing Commitment to Amortize the UAL for LSERS
History - Amortization under Act 81 Amortization schedules are shown below for LSERS. The
first graph shows the pattern of annual payments that were required for this system under Act 81 of the 1988 session. The second graph shows the projected outstanding balance of the IUAL at the end of each year until FY 2029 when the debt is paid off.
$-
$200
$400
$600
$800
$1,000
$1,200
$1,400
$1,600
$1,800
$2,000
1989 1993 1997 2001 2005 2009 2013 2017 2021 2025 2029
Th
ousa
nd
s
Fiscal Year Ending
Amortization Payment Schedule Established in 1988
LSERS
$-
$2
$4
$6
$8
$10
$12
$14
$16
1988 1992 1996 2000 2004 2008 2012 2016 2020 2024 2028
Mil
lion
s
Balance on June 30
Expected Unfunded Accrued Liability Amounts Established in 1988
LSERS

Page 96 Actuarial Concerns – Funding Issues
Although the numbers are significantly smaller, the pattern of the amortization schedule is very similar to LASERS and TRSL.
History - Amortization under Act 257 LSERS experienced actuarial gains between 1988 and 1992.
As a result, LSERS had surplus assets rather than a UAL on June 30, 1992. Nevertheless, the IUAL base and the UAL bases established between 1989 and 1992 continued to be maintained as required under the law. Amortization schedules (credit schedules), before and after the enactment of Act 257, are shown below.
Note the change of vertical scale. The effect of a change from one
vertical tick mark to the next is much more significant in the charts below than in the charts on the previous page.
$(10)
$(8)
$(6)
$(4)
$(2)
$-
$2
1989 1993 1997 2001 2005 2009 2013 2017 2021 2025 2029
Mil
lion
s
Fiscal Year Ending
Change in Amortization Payments Due to Act 257
LSERS before Act 257 LSERS after Act 257
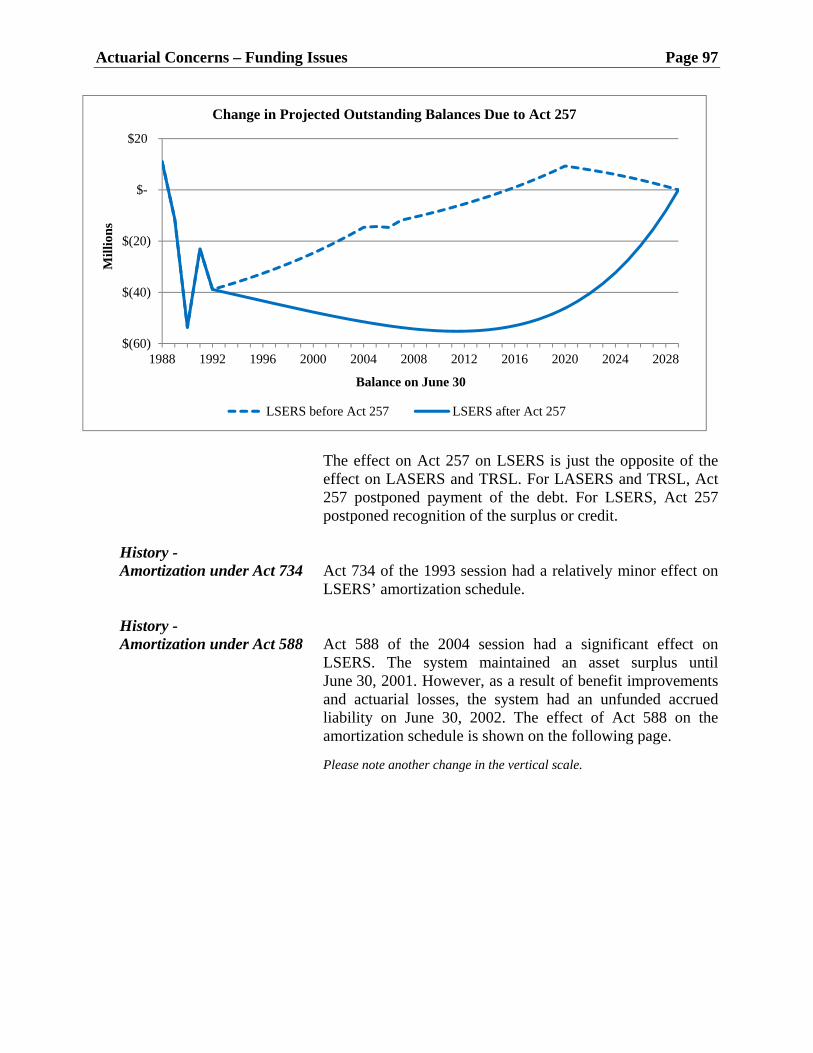
Actuarial Concerns – Funding Issues Page 97
The effect on Act 257 on LSERS is just the opposite of the
effect on LASERS and TRSL. For LASERS and TRSL, Act 257 postponed payment of the debt. For LSERS, Act 257 postponed recognition of the surplus or credit.
History - Amortization under Act 734 Act 734 of the 1993 session had a relatively minor effect on
LSERS’ amortization schedule. History - Amortization under Act 588 Act 588 of the 2004 session had a significant effect on
LSERS. The system maintained an asset surplus until June 30, 2001. However, as a result of benefit improvements and actuarial losses, the system had an unfunded accrued liability on June 30, 2002. The effect of Act 588 on the amortization schedule is shown on the following page.
Please note another change in the vertical scale.
$(60)
$(40)
$(20)
$-
$20
1988 1992 1996 2000 2004 2008 2012 2016 2020 2024 2028
Mil
lion
s
Balance on June 30
Change in Projected Outstanding Balances Due to Act 257
LSERS before Act 257 LSERS after Act 257

Page 98 Actuarial Concerns – Funding Issues
Once again, the net effect of Act 588 was to reduce payments
and postpone payment of the debt. The debt on June 30, 2004, was about $420 million. The debt will increase to about $600 million in about FY 2020. The debt returns to the $420 million level in about FY 2026 and is paid off over the remaining seven years.
$(20)
$-
$20
$40
$60
$80
$100
$120
1989 1993 1997 2001 2005 2009 2013 2017 2021 2025 2029 2033
Mil
lion
s
Fiscal Year Ending
Change in Amortization Payments Due to Act 588
LSERS before Act 588 LSERS after Act 588
$(400)
$(200)
$-
$200
$400
$600
$800
1988 1992 1996 2000 2004 2008 2012 2016 2020 2024 2028 2032
Mil
lion
s
Balance on June 30
Change in Projected Outstanding Balances Due to Act 588
LSERS before Act 257 LSERS after Act 257
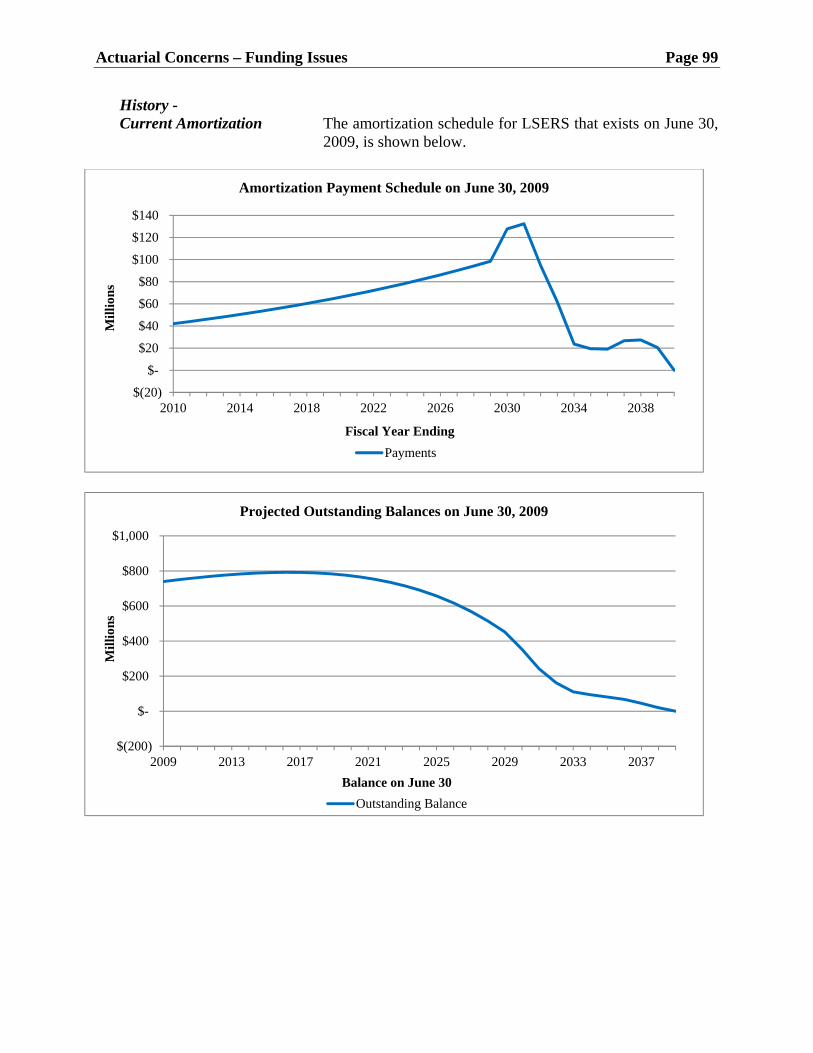
Actuarial Concerns – Funding Issues Page 99
History - Current Amortization The amortization schedule for LSERS that exists on June 30,
2009, is shown below.
$(20)
$-
$20
$40
$60
$80
$100
$120
$140
2010 2014 2018 2022 2026 2030 2034 2038
Mil
lion
s
Fiscal Year Ending
Amortization Payment Schedule on June 30, 2009
Payments
$(200)
$-
$200
$400
$600
$800
$1,000
2009 2013 2017 2021 2025 2029 2033 2037
Mil
lion
s
Balance on June 30
Projected Outstanding Balances on June 30, 2009
Outstanding Balance

Page 100 Actuarial Concerns – Funding Issues
5. Effect of Changing Commitment to Amortize the UAL for STPOL
History - Amortization under Act 81 Amortization schedules are shown below for STPOL. The
first graph shows the pattern of annual payments that were required for this system under Act 81 of the 1988 session. The second graph shows the projected outstanding balance of the IUAL at the end of each year until FY 2029 when the debt is paid off.
$(5)
$-
$5
$10
$15
$20
$25
$30
$35
$40
1989 1993 1997 2001 2005 2009 2013 2017 2021 2025 2029
Mil
lion
s
Fiscal Year Ending
Amortization Payment Schedule Established in 1988
STPOL
$(50)
$-
$50
$100
$150
$200
$250
1988 1992 1996 2000 2004 2008 2012 2016 2020 2024 2028
Mil
lion
s
Balance on June 30
Projected Outstanding Balances on June 30, 2008
STPOL
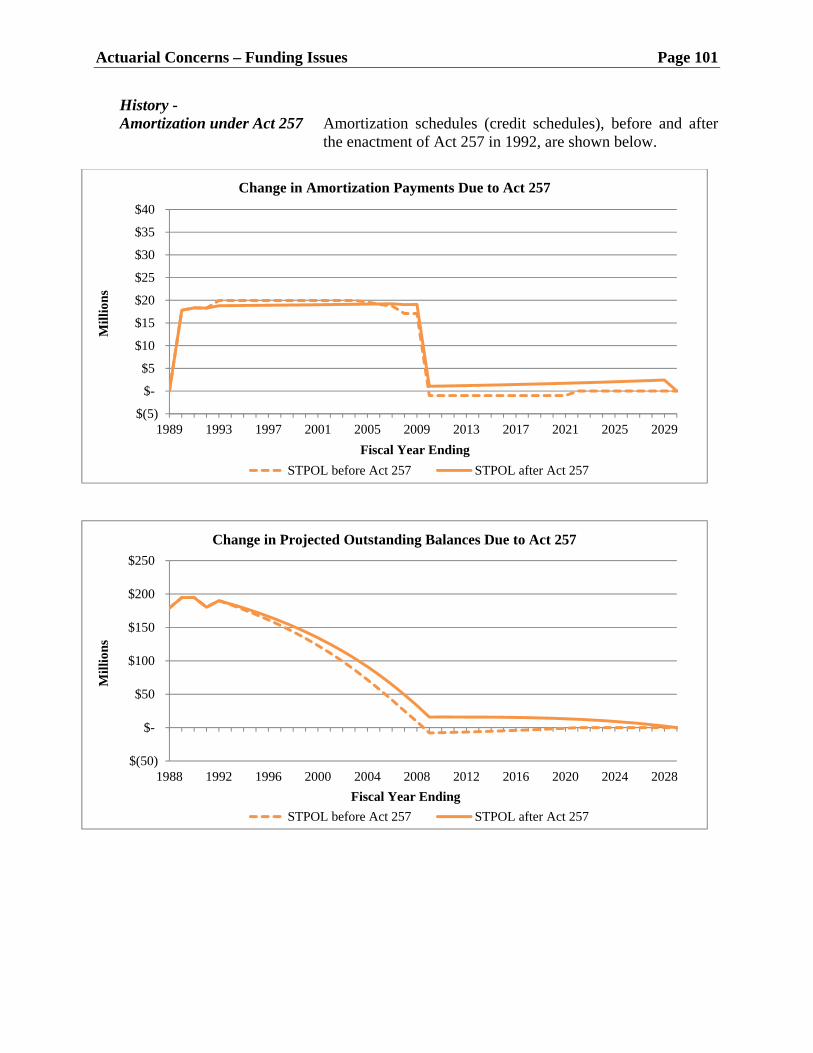
Actuarial Concerns – Funding Issues Page 101
History - Amortization under Act 257 Amortization schedules (credit schedules), before and after
the enactment of Act 257 in 1992, are shown below.
$(5)
$-
$5
$10
$15
$20
$25
$30
$35
$40
1989 1993 1997 2001 2005 2009 2013 2017 2021 2025 2029
Mil
lion
s
Fiscal Year Ending
Change in Amortization Payments Due to Act 257
STPOL before Act 257 STPOL after Act 257
$(50)
$-
$50
$100
$150
$200
$250
1988 1992 1996 2000 2004 2008 2012 2016 2020 2024 2028
Mil
lion
s
Fiscal Year Ending
Change in Projected Outstanding Balances Due to Act 257
STPOL before Act 257 STPOL after Act 257
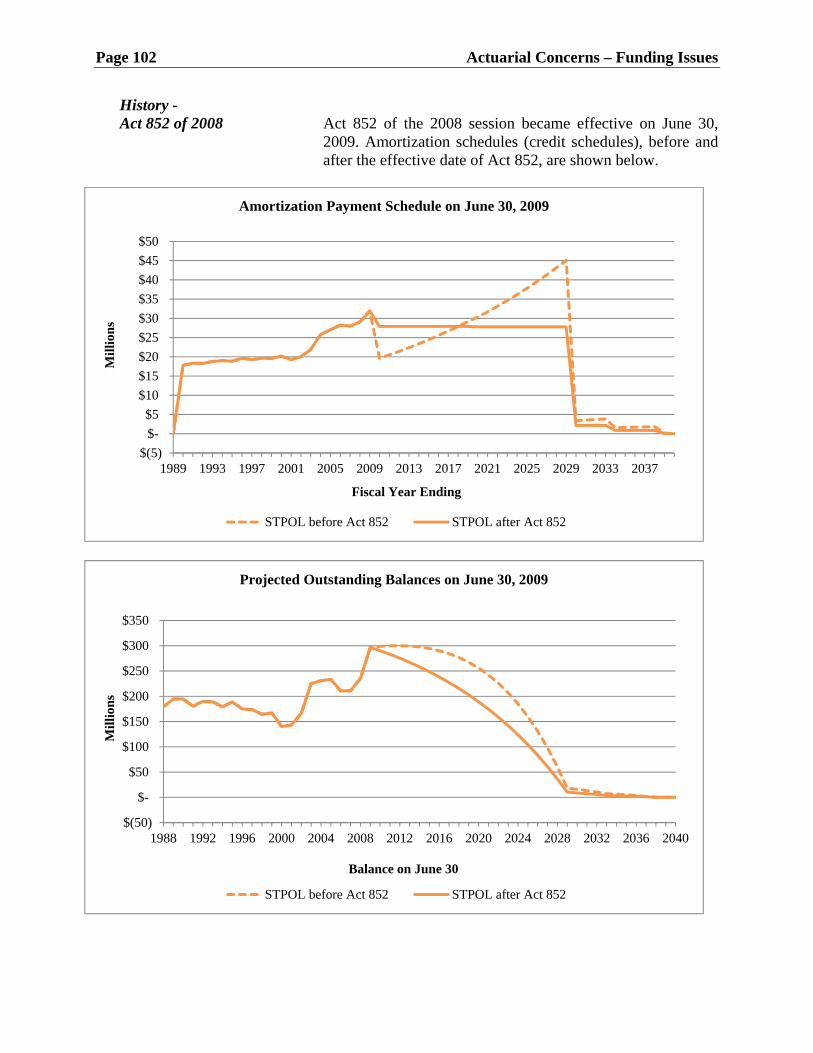
Page 102 Actuarial Concerns – Funding Issues
History - Act 852 of 2008 Act 852 of the 2008 session became effective on June 30,
2009. Amortization schedules (credit schedules), before and after the effective date of Act 852, are shown below.
$(5)
$-
$5
$10
$15
$20
$25
$30
$35
$40
$45
$50
1989 1993 1997 2001 2005 2009 2013 2017 2021 2025 2029 2033 2037
Mil
lion
s
Fiscal Year Ending
Amortization Payment Schedule on June 30, 2009
STPOL before Act 852 STPOL after Act 852
$(50)
$-
$50
$100
$150
$200
$250
$300
$350
1988 1992 1996 2000 2004 2008 2012 2016 2020 2024 2028 2032 2036 2040
Mil
lion
s
Balance on June 30
Projected Outstanding Balances on June 30, 2009
STPOL before Act 852 STPOL after Act 852

Actuarial Concerns – Funding Issues Page 103
6. Contribution Relief for Municipal Police Employees' Retirement System and Firefighters' Retirement System
Issue Employer contribution rates for the Firefighters’ Retirement System (FRS) and the Municipal Police Employees’ Retirement System (MPERS) began to increase significantly beginning with the 2001 valuations. The increases were largely attributable to the following:
1. Unfunded liabilities of retirement plans that were merged
into FRS and MPERS from 1990 to 2001.
2. Investment losses resulting from the downturn in the market following the dot.com bubble and the events of September 11, 2001.
For example, the employer contribution rate for MPERS was about 5% of pay for 1999 and 2000. In 2001, the rate increased to almost 12%; in 2002, the rate exceeded 15%; and in 2003 the rate increased to over 20%. Rates for FRS followed a similar pattern of increase.
History - Acts 620 and 1079 Acts 620 and 1079 were enacted in the 2003 Regular Session
to provide relief to employers (municipalities and fire districts) participating in FRS and MPERS, respectively. These Acts are briefly summarized below:
1. Act 620 (FRS)
Prior to Act 620, changes in liability occurring from year to year as a result of gains and losses were amortized with level payments over a 15-year period. Act 620 combined all outstanding balances attributable to gains and losses as of June 30, 2002, and re-amortized the aggregate amount with level payments over 27 years. Future gains and losses were to be amortized with level payments over 15 years.
2. Act 1079 (MPERS)
Prior to Act 1079, changes in liability occurring from year to year were amortized with level payments over a 15-year period. Act 1079 provided that changes in liability occurring with the June 30, 2002, valuation and

Page 104 Actuarial Concerns – Funding Issues
valuations thereafter would be amortized with level payments over a 30-year period.
History - Effect on the UAL The effect of Acts 620 and 1079 on the amortization
schedules for FRS and MPERS are shown below.
FRS The effect of Act 620 at the time of the change is shown below:
$(5)
$-
$5
$10
$15
$20
$25
$30
2003 2007 2011 2015 2019 2023 2027 2031
Mil
lion
s
Fiscal Year Ending
Change in Amortization Payments Due to Act 620
FRS before Act 620 FRS after Act 620
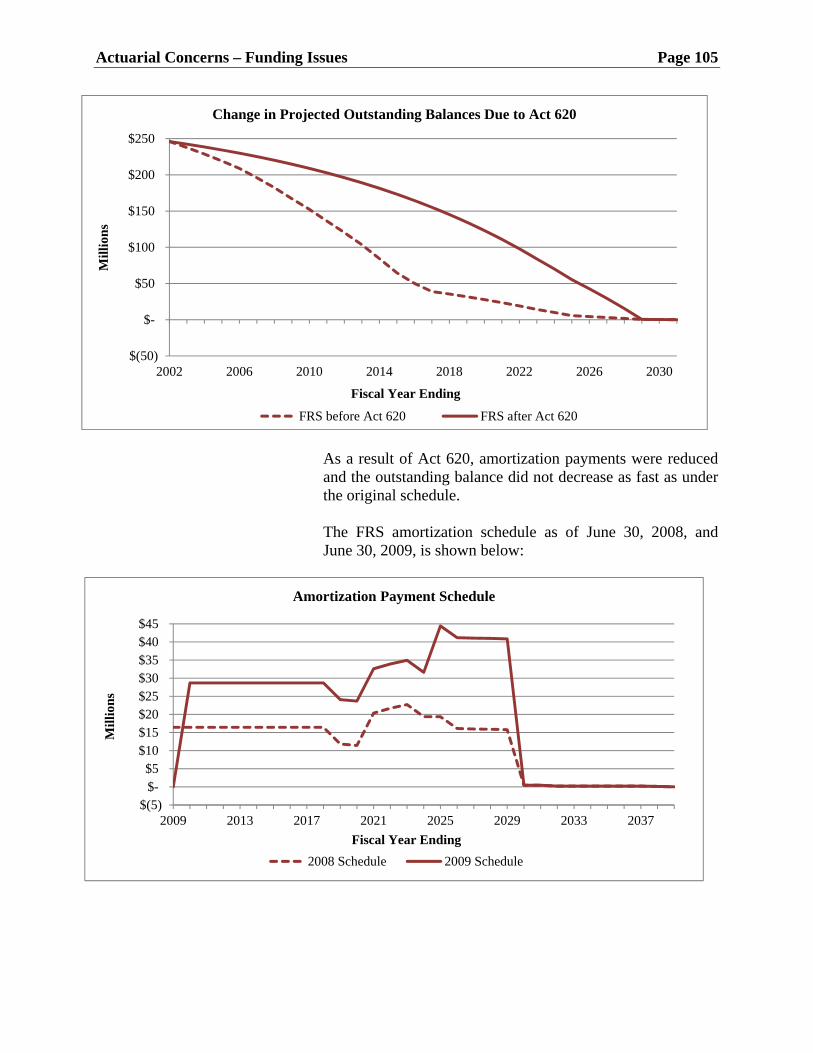
Actuarial Concerns – Funding Issues Page 105
As a result of Act 620, amortization payments were reduced
and the outstanding balance did not decrease as fast as under the original schedule.
The FRS amortization schedule as of June 30, 2008, and
June 30, 2009, is shown below:
$(50)
$-
$50
$100
$150
$200
$250
2002 2006 2010 2014 2018 2022 2026 2030
Mil
lion
s
Fiscal Year Ending
Change in Projected Outstanding Balances Due to Act 620
FRS before Act 620 FRS after Act 620
$(5) $- $5
$10 $15 $20 $25 $30 $35 $40 $45
2009 2013 2017 2021 2025 2029 2033 2037
Mil
lion
s
Fiscal Year Ending
Amortization Payment Schedule
2008 Schedule 2009 Schedule

Page 106 Actuarial Concerns – Funding Issues
MPERS The effect of Act 1079 at the time of the change is shown below:
$(50)
$-
$50
$100
$150
$200
$250
$300
$350
2008 2012 2016 2020 2024 2028 2032 2036
Mil
lion
s
Balance on June 30
Projected Outstanding Balances
2008 Schedule 2009 Schedule
$(5)
$-
$5
$10
$15
$20
$25
$30
$35
2003 2007 2011 2015 2019 2023 2027 2031
Mil
lion
s
Fiscal Year Ending
Change in Amortization Payments Due to Act 1079
MPERS before Act 1079 MPERS after Act 1079
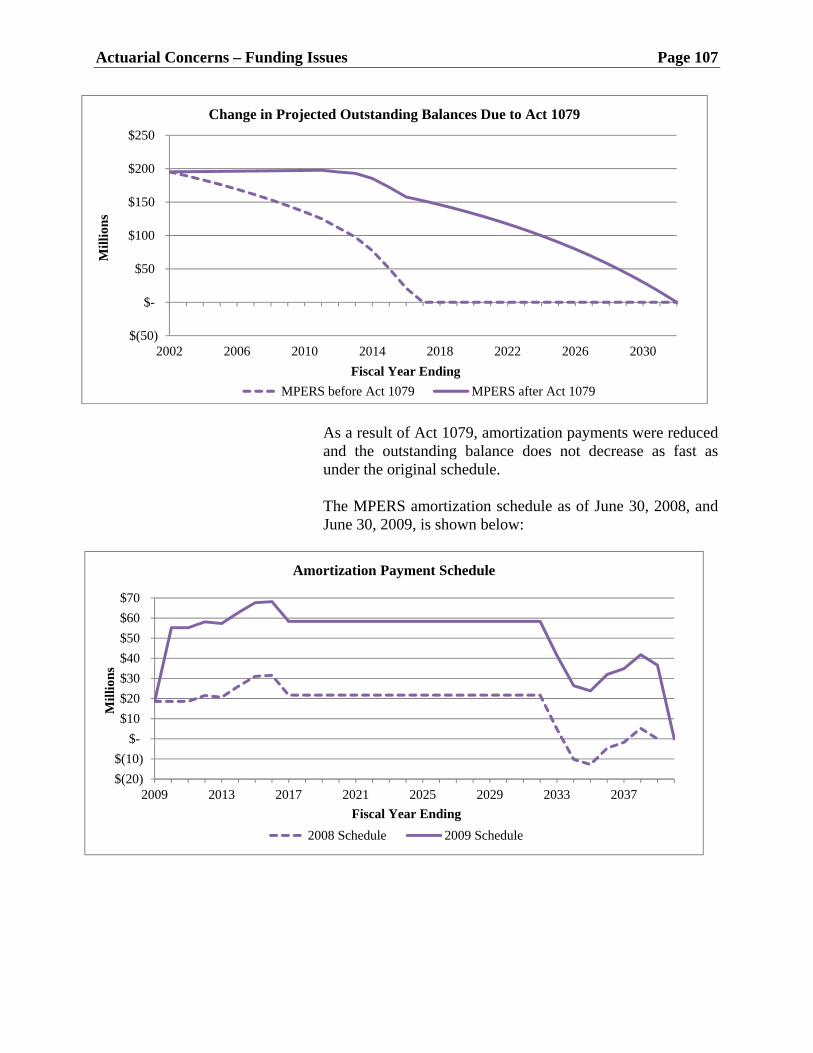
Actuarial Concerns – Funding Issues Page 107
As a result of Act 1079, amortization payments were reduced
and the outstanding balance does not decrease as fast as under the original schedule.
The MPERS amortization schedule as of June 30, 2008, and
June 30, 2009, is shown below:
$(50)
$-
$50
$100
$150
$200
$250
2002 2006 2010 2014 2018 2022 2026 2030
Mil
lion
s
Fiscal Year Ending
Change in Projected Outstanding Balances Due to Act 1079
MPERS before Act 1079 MPERS after Act 1079
$(20)
$(10)
$-
$10
$20
$30
$40
$50
$60
$70
2009 2013 2017 2021 2025 2029 2033 2037
Mil
lion
s
Fiscal Year Ending
Amortization Payment Schedule
2008 Schedule 2009 Schedule
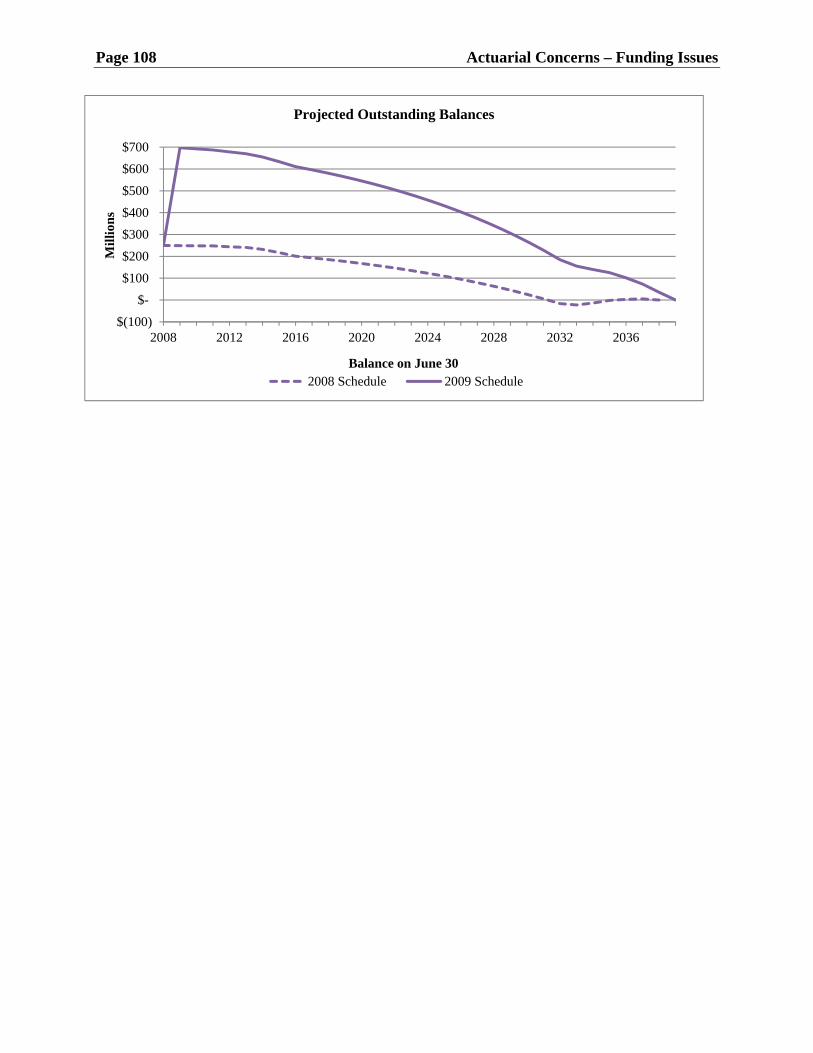
Page 108 Actuarial Concerns – Funding Issues
$(100)
$-
$100
$200
$300
$400
$500
$600
$700
2008 2012 2016 2020 2024 2028 2032 2036
Mil
lion
s
Balance on June 30
Projected Outstanding Balances
2008 Schedule 2009 Schedule

Actuarial Concerns – Funding Issues Page 109
7. Cost of Living Adjustments
Issue Inflation erodes the purchasing power of fixed pensions
provided under the four state retirement systems. Since 1992, the first year that the legislature enacted provisions to provide for COLAs, inflation has averaged 2.6% per year. Over the same period 1992 through 2009, the state has periodically, but intermittently, granted COLAs that have averaged about 1.3% for members of LASERS and 1.2% for members of TRSL.
With the COLAs provided by the state, the pension income
for a LASERS member who retired in 1992 will now purchase 81% of what his pension would have purchased when he originally retired. Similarly, a TRSL retiree would be able to purchase 80%. Without the COLAs, the retiree would be able to purchase only 65% of what he could have purchased in 1992.
COLA Policy Under current law (as changed by Act 497 of the 2009
Regular Session), retirees of LASERS and TRSL may receive an adjustment for inflation of up to 2% per year, based on the Consumer Price Index (CPI). The adjustment may be as large as 3% in years where the actuarial rate of return on investments exceeds 8.25%. A COLA can be paid only if there are sufficient funds in the Experience Account to offset the increase in the present value cost for the COLA.
An Experience Account was established for LASERS and
TRSL in 1992 with $0 account balances. From 1992 through 2004, allocations from the regular pools of assets were made to the Experience Accounts equal to 50% of investment gains on the actuarial value of assets. Conversely, amounts were transferred from the Experience Accounts to the regular pools of assets whenever there were actuarial losses. The amounts so transferred were equal to 50% of investment losses on the actuarial value of assets.
On June 30, 2004, balances in the Experience Accounts for
both LASERS and TRSL were negative. The LASERS balance was a negative $0.659 billion; the TRSL balance was a negative $1.104 billion. Negative balances occurred because amounts were transferred out of the Experience Accounts to fund COLAs between 1992 and 2004 and
Page 110 Actuarial Concerns – Funding Issues
because significant investment losses were sustained in the period from 2002 to 2004.
During the 2004 Regular Session, legislation was enacted to
transfer from LASERS and TRSL an amount sufficient to return the balances to $0 as of June 30, 2004. Thereafter, the Experience Account would share 50% of investment gains but not any investment losses.
According to Act 497 of the 2009 session, balances in the
LASERS and TRSL Experience Accounts on June 30, 2009, were to be transferred to a subaccount in the IUAL Fund and then would be further transferred on June 30, 2010, back to the regular pool of assets. As a result, the balances in the Experience Accounts on June 30, 2009, after the transfers was $0.
The Experience Accounts for LASERS and TRSL would
continue to be funding in the future by 50% of investment gains, but only to the extent that the gains exceeded $100 million and $200 million, respectively.
The COLA program, briefly summarized above, has come
with considerable cost to the retirement system and the taxpayers of the state. The unfunded liability of LASERS has increased $0.833 billion since 1992 solely to provide COLAs. The increase in unfunded liabilities for TRSL due to COLAs has been $1.743 billion.
Funding Issue The diversion of investment gains to pay for COLAs creates
a funding issue. The valuation interest assumption is based on the premise that over time investment gains and investment losses will offset one another. However, if as a result of a period of favorable investment performance COLA benefits are adopted and funded with those gains, such gains are no longer available to offset future investment losses. This is what occurred in the early part of this decade.
LASERS and TRSL enjoyed favorable returns on
investments during most of the 1990s. Amounts accumulated in the Experience Accounts. COLA benefit adjustments were made. Costs associated with these adjustments were transferred back into the regular asset pools. But then the market turned in 2001 through 2003 and these systems sustained significant investment losses. But investment gains that would have otherwise been available to offset these

Actuarial Concerns – Funding Issues Page 111
losses had been used to fund COLA benefits to members and were not available.
Remedies There are at least three ways to reflect the COLA program in
the valuation process. Direct Recognition Under direct recognition, the actuary for the system will
estimate the future expenditures for COLA benefits. Plan liabilities and employer contribution requirements will both increase.
Indirect Recognition Under this method, the investment return assumption used by
the actuary to calculate plan liabilities will be reduced to reflect the fact that the real return on assets is smaller because 50% of the gains are diverted. This creates a problem, however, because if the return assumption is reduced, the potential for investment gains increases and the amount of gains diverted increases. There is no way to stop the cycle unless the investment gain is targeted against a fixed rate rather than the investment return assumption.
Amortization LASERS and TRSL have elected to treat the diversion as an
ad hoc benefit improvement and have amortized the cost over a 30-year period. The problem with this method is that the COLA benefit is being financed by employer contributions for many years beyond the life expectancy of the members who originally received the benefit.
The systems will experience an investment gain or loss every
year. If the 8.25% investment return assumption is correct, the plan will experience an investment gain 50% of the time and an investment loss 50% of the time. Therefore, benefit improvements on average will be given every other year. And every other year, amortization costs will increase. After 30 years, amortization costs will no longer increase because whenever a new amortization schedule is added, an old schedule expires.

Page 112 Actuarial Concerns – Funding Issues
LASERS and TRSL are only four years into the 30-year cycle. Amortization cost will continue to rise as a result of the COLA program for the next 26 years.
LSERS and STPOL COLA procedures, similar to the LASERS and TRSL
programs, were established for LSERS and STPOL under Act 333 of the 2007 Regular Session effective July 1, 2007. These Experience Accounts replaced all other COLA provisions.
Neither system has incurred an investment gain since 2007,
so the balances in the LSERS and STPOL Experience Accounts have remained at $0 and no COLA benefits have been paid.
COLAs versus Inflation The following exhibits compare the compounded average
annual rate of increase in actual benefits for those who retired from the state systems 5, 10, and 15 years ago and since the inception of the COLA program in 1992 with CPI inflation increases over the same periods, as of June 30, 2009.
RETIREE COLA INCREASES vs. CPI Average Annual Rate of Increase from
Date of Retirement to 6/30/2009
LASERS Years Retired
Average Annual Rate of Increase
CPI Increase*
5 1.7% 2.6% 10 1.6% 2.6% 15 1.4% 2.5% 17 1.3% 2.6%
TRSL Years Retired
Average Annual Rate of Increase
CPI Increase*
5 1.2% 2.6% 10 1.6% 2.6% 15 1.4% 2.5% 17 1.2% 2.6%
Consumer Price Index (CPI) – All Urban Consumers: All Items;
Not seasonally adjusted; U.S. City average.

Actuarial Concerns – Funding Issues Page 113
8. Indirect Funding of Pension Plan Costs Concern Employers and employees who enjoy the benefits of
participating in the retirement systems of Louisiana do not bear the full cost of the retirement programs. The cost for most of the systems is supplemented by revenues from other government sources. As a result, participating employers are generally not aware of the total cost of their benefit programs.
General State and statewide retirement systems receive contributions
or allocations of revenue from a number of sources other than employer and employee contributions. These sources include ad valorem taxes, revenue sharing, and insurance premium taxes. In many cases the alternative sources provide substantial revenues for the retirement system and shelter employees and employers from the true cost of the benefit provisions of the system.
Indirect funding and the effect on each state and statewide
retirement system are summarized below. LASERS The retirement system has been subdivided into sub plans for
each of the following groups of employees:
1. Rank and file employees. 2. Full time law enforcement personnel, supervisors, or
administrators who are employed with the Department of Revenue or Office of Alcohol and Tobacco Control and who are P.O.S.T. certified, have the power to arrest, and hold a commission from such office.
3. Peace officers, as defined by R.S. 40:2402(3)(a),
employed by the Department of Public Safety and Corrections, office of state police, other than troopers.
4. Judges and court officers to whom Subpart A of Part VII
of Chapter 1 of Subtitle II of Title 11 is applicable.
5. Wildlife agents to whom Subpart B of Part VII of Chapter 1 of Subtitle II of Title 11 is applicable.
6. Wardens, correctional officers, probation and parole
officers, and security personnel employed by the Department of Public Safety and Corrections who are

Page 114 Actuarial Concerns – Funding Issues
members of the secondary component pursuant to Subpart C of Part VIII of Chapter 1 of Subtitle II of Title 11.
7. Correctional officers, probation and parole officers, and
security personnel employed by the Department of Public Safety and Corrections who are members of the primary component.
8. Legislators, the governor, and the lieutenant governor.
9. Employees of the bridge police section of the Crescent
City Connection Division of the Department of Transportation and Development.
Although each of these sub plans has a different benefit
structure, all employers pay the same contribution rate. As a result, employers with employees participating in sub plans with less rich benefit structures subsidize employers with employees participating in richer sub plan benefit structures.
TRSL & LSERS School districts receive a block grant from the state called the
MFP. The purpose of this allocation is to give funds to local school boards to operate local school districts. This allocation is set each year without direct recognition of budgetary line items including the contributions that employers must make to TRSL and LSERS. Therefore, all else being equal, if the retirement systems increase the employer contribution rates, local school districts have less money to spend on educating the children of the state.
STPOL STPOL receives revenues from the state and taxes on
insurance premiums. For fiscal year 2010, the state will pay only 94% of the total annual amount needed to fund the retirement system.
ASSR ASSR receives revenues from employers with employees in
ASSR, ad valorem taxes, and revenue sharing. For fiscal year 2010, local governmental entities will pay only 24% of the total annual amount needed to fund the retirement system.
CCRS CCRS receives revenues from employers with employees in
CCRS, ad valorem taxes, and revenue sharing. For fiscal year 2010, local governmental entities will pay only 49% of the total annual amount needed to fund the retirement system.

Actuarial Concerns – Funding Issues Page 115
DARS DARS receives revenues from employers with employees in DARS, and from ad valorem taxes. For fiscal year 2010, local governmental entities will pay only 29% of the total annual amount needed to fund the retirement system.
FRS FRS receives revenues from employers with employees in
FRS and taxes on insurance premiums. For fiscal year 2010, municipalities will pay only 55% of the total annual amount needed to fund the retirement system.
MERS MERS receives revenues from employers with employees in
MERS, ad valorem taxes, and revenue sharing. For fiscal year 2010, municipalities will pay only 73% of the total annual amount needed to fund the retirement system.
MPERS MPERS receives revenues from employers with employees
in MPERS and taxes on insurance premiums. For fiscal year 2010, municipalities will pay only 69% of the total annual amount needed to fund the retirement system.
PERS PERS receives revenues from employers with employees in
PERS, ad valorem taxes, and revenue sharing. For fiscal year 2010, parishes will pay only 93% of the total annual amount needed to fund the retirement system.
RVRS RVRS receives revenues from employers with employees in
RVRS, ad valorem taxes, and revenue sharing. For fiscal year 2010, local governmental entities will pay only 17% of the total annual amount needed to fund the retirement system.
SPRF SPRF receives revenues from employers with employees in
SPRF, ad valorem taxes, revenue sharing, and taxes on insurance premiums. For fiscal year 2010, local governmental entities will pay only 69% of the total annual amount needed to fund the retirement system.
Subsidies Subsidies have the largest effect on statewide retirement
systems. As shown in the chart below, employees and employers participating in ASSR contribute about 13% of pay (the blue based portion of each bar graph). Subsidies account for about 25% of pay (the red based portion of each graph).
It is also interesting to note that ASSR, CCRS, DARS, FRS,
and RVRS receive substantial subsidies. Subsidies for MERS, MPERS, and PERS are quite small.

Page 116 Actuarial Concerns – Funding Issues
0.00%
5.00%
10.00%
15.00%
20.00%
25.00%
30.00%
35.00%
40.00%
45.00%
50.00%
Subsidies Available to the Statewide Retirement Systems
Employer Contributions Employee Contributions Ad Valorem Taxes
Insurance Premium Taxes Revenue Sharing

Actuarial Concerns – Funding Issues Page 117
9. Cash Flow and Liquidity
Concern Contributions to the state retirement systems are less than
benefit payments. Without cash income from investments, the retirement systems may be forced to sell securities or other investments while in an unfavorable market or to adjust investment strategies to support cash flow requirements.
Investment Allocations The larger state systems have significantly changed their
asset allocation strategies over the past decade. Allocations to equities (including hedge funds, alternative investments, private placements, Real Estate Investment Trusts, and venture capital) have increased and allocations to fixed income investments have declined. These newer investments tend to be less liquid in bear markets, require additional cash commitments, and may produce minimal regular and predictable cash (interest and dividend) income. The systems have experienced another period of investment losses in 2008 and 2009 and as a result TRSL, LSERS, and STPOL have been forced to liquidate investments at a loss to cover plan benefit payments and expenses. Dividend and interest income alone may not be sufficient to cover the net difference between benefit payments and contributions. The following exhibits titled “Net External Cash Flow” show the cash available from external additions (contributions) minus required deductions (benefits + expenses) for each state system as of June 30, 2009 (column c). The last column (column e) shows the value of assets that must be liquidated to satisfy benefit and expense payments. For example, in 2009 LASERS received $703.6 million in contributions, but paid $821.3 million in benefits and expenses. This resulted in a shortfall of $117.7 million. However, this was not a concern for LASERS because it earned $201.1 million of cash income through dividends and interest. It did not need to liquidate any assets to meet retiree payroll. On the other hand, TRSL did have a problem. Its contribution income was $458.2 million less than benefit payments and dividend and interest income was only $312.1 million. As a result, $146.1 million of securities had to be sold to meet retiree payroll.

Page 118 Actuarial Concerns – Funding Issues
NET EXTERNAL CASH FLOW (Excludes Net Investment Income)
STATE SYSTEMS
As of June 30, 2009
(in millions)
System Amounts
Added Amounts Deducted
Net External
Cash Flow
Interest & Dividends
Required Investment
Sales (a) (b) (c) = (a) -(b) (d) (e)
LASERS $ 703.6 $ 821.3 $ (117.7) $ 201.1 $ 0.0
TRSL 1,059.2 1,517.4 (458.2) 312.1 146.1
LSERS 78.7 139.1 (60.4) 37.6 22.8
STPOL 25.6 37.0 (11.4) 6.6 4.8
Combined $ 1,867.1 $ 2,514.8 $ (647.7) $ 557.4 $ 173.7
The pressure to liquidate assets has decreased somewhat for LASERS over the past five or six years, but has remained quite constant for TRSL and LSERS. Another downturn in the market would only increase the liquidation risks that the systems currently bear. HISTORICAL NET EXTERNAL CASH FLOW
(Excludes Net Investment Income)
STATE SYSTEMS
FY 2004 to FY 2009
(in millions)
System FY 2004 FY 2005 FY 2006 FY 2007 FY 2008 FY 2009
LASERS $ (106.7) $ (32.3) $ (50.8) $ (130.9) $ (36.2) $ (117.7)
TRSL (365.8) (345.4) (419.1) (481.3) (358.8) (458.2)
LSERS (67.3) (59.5) (70.0) (69.5) (68.2) (60.4)
STPOL 5.7 8.4 13.9 14.6 (10.1) (11.4)
Combined $ (534.1) $ (428.8) $ (526.0) $ (667.1) $ (473.3) $ (647.7)
The following charts for LASERS, TRSL, and LSERS
compare historical revenues (contributions) and costs (benefits + expenses) over the period from 1995 through 2009. As a general observation, benefits plus expenses exceed contributions for all three systems and have for LASERS and TRSL since about 1996. Costs and revenues for LASERS have paralleled one another. Costs for TRSL have increased significantly relative to revenues. LSERS has exhibited a pattern similar to TRSL.

Actuarial Concerns – Funding Issues Page 119
1995 1996 1997 1998 1999 2000 2001 2002 2003 2004 2005 2006 2007 2008 2009
Contributions 9.0% 8.4% 6.8% 6.4% 6.1% 5.9% 6.6% 7.5% 8.2% 7.7% 8.3% 7.8% 6.4% 8.2% 9.9%
Distributions 8.4% 8.1% 7.4% 7.1% 7.3% 7.1% 8.3% 9.7% 10.2% 9.3% 8.7% 8.4% 7.8% 8.6% 11.6%
9.0%
8.4%
6.8%
6.4%
6.1%5.9%
6.6%
7.5%
8.2%
7.7%
8.3%
7.8%
6.4%
8.2%
9.9%
8.4%
8.1%
7.4%
7.1%7.3%
7.1%
8.3%
9.7%
10.2%
9.3%
8.7%
8.4%
7.8%
8.6%
11.6%
5.0%
6.0%
7.0%
8.0%
9.0%
10.0%
11.0%
12.0%
13.0%
14.0%
LASERS
Comparison of Revenues and DistributionsAs a Percentage of the Market Value of Assets
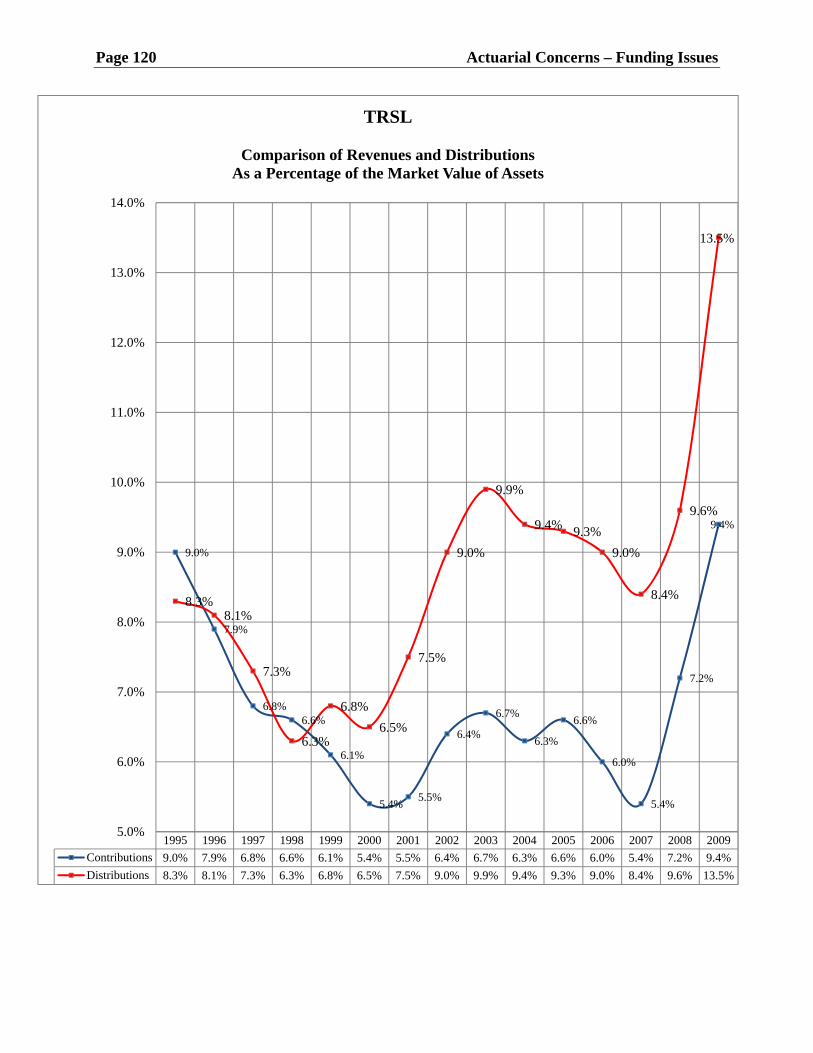
Page 120 Actuarial Concerns – Funding Issues
1995 1996 1997 1998 1999 2000 2001 2002 2003 2004 2005 2006 2007 2008 2009
Contributions 9.0% 7.9% 6.8% 6.6% 6.1% 5.4% 5.5% 6.4% 6.7% 6.3% 6.6% 6.0% 5.4% 7.2% 9.4%
Distributions 8.3% 8.1% 7.3% 6.3% 6.8% 6.5% 7.5% 9.0% 9.9% 9.4% 9.3% 9.0% 8.4% 9.6% 13.5%
9.0%
7.9%
6.8%6.6%
6.1%
5.4%5.5%
6.4%
6.7%
6.3%
6.6%
6.0%
5.4%
7.2%
9.4%
8.3%8.1%
7.3%
6.3%
6.8%
6.5%
7.5%
9.0%
9.9%
9.4% 9.3%
9.0%
8.4%
9.6%
13.5%
5.0%
6.0%
7.0%
8.0%
9.0%
10.0%
11.0%
12.0%
13.0%
14.0%
TRSL
Comparison of Revenues and DistributionsAs a Percentage of the Market Value of Assets

Actuarial Concerns – Funding Issues Page 121
1995 1996 1997 1998 1999 2000 2001 2002 2003 2004 2005 2006 2007 2008 2009
Contributions 2.4% 2.4% 2.1% 1.9% 1.9% 1.9% 2.0% 2.5% 3.7% 3.3% 3.8% 4.1% 4.2% 4.8% 6.5%
Distributions 4.7% 5.0% 4.7% 4.5% 4.7% 6.0% 6.8% 7.9% 9.9% 8.0% 7.8% 8.7% 8.4% 9.4% 11.3%
2.4% 2.4%
2.1%1.9% 1.9% 1.9% 2.0%
2.5%
3.7%
3.3%
3.8%
4.1% 4.2%
4.8%
6.5%
4.7%5.0%
4.7%4.5%
4.7%
6.0%
6.8%
7.9%
9.9%
8.0%7.8%
8.7%8.4%
9.4%
11.3%
1.0%
2.0%
3.0%
4.0%
5.0%
6.0%
7.0%
8.0%
9.0%
10.0%
11.0%
12.0%
LSERS
Comparison of Revenues and DistributionsAs a Percentage of the Market Value of Assets

Page 122 Actuarial Concerns – Funding Issues
10. Adverse Selection/Risk Exposure Concern The trust fund of a retirement system becomes vulnerable to
unknown costs whenever members are allowed to change or rescind previous benefit choices, purchase membership service, or make elections retroactively. Laws, allowing members to make such changes, expose the system to adverse selection and additional risk.
Adverse selection occurs when a member is allowed to use knowledge of his own circumstances to make a benefit choice or election that provides him with a significant financial advantage over the retirement system. As a result of such an election, the member is enriched over and above other members of the system, and retirement system costs are increased. Many bills are presented to the legislature each session that would allow individual members or groups of members to make elections in the future or to rescind elections made in the past in order to “correct” a perceived inequity. These bills are generally not successful because of cost and policy considerations. However, from time to time, the legislature has adopted new policy permitting members to make elections that may be financially advantageous to the individual and to the detriment of the retirement system. Some examples of such legislation are summarized below.
Back-DROP Act 480 for STPOL of the 2009 Regular Session − STPOL The STPOL DROP was replaced with Back-DROP. ANTI-SELECTION: A member who elects to enter DROP
accepts the risk that he may eventually gain or lose as a result of his DROP election. Back-DROP removes all risk and the member becomes entitled to the better of the regular benefit or the Back-DROP benefit.
Back-DROP Act 398 for ASSR of the 2008 Regular Session − ASSR The ASSR DROP was replaced with Back-DROP.

Actuarial Concerns – Funding Issues Page 123
ANTI-SELECTION: A member who elects to enter DROP accepts the risk that he may eventually gain or lose as a result of his DROP election. Back-DROP removes all risk and the member becomes entitled to the better of the regular benefit or the Back-DROP benefit.
Back-DROP Act 835 for DARS of the 2008 Regular Session − DARS The DARS DROP was replaced with Back-DROP. ANTI-SELECTION: A member who elects to enter DROP
accepts the risk that he may eventually gain or lose as a result of his DROP election. Back-DROP removes all risk and the member becomes entitled to the better of the regular benefit or the Back-DROP benefit.
Rehired Retirees Act 719 for DARS of the 2008 Regular Session − DARS A district attorney or assistant attorney will be allowed to
retire and be rehired without a suspension of retirement benefits under certain conditions.
ANTI-SELECTION: A member is allowed to retire and
collect a pension at the same time he continues to work in employment covered by the system from which he draws his pension.
Rehired Retirees Act 832 for LSERS of the 2008 Regular Session − LSERS A bus driver will be allowed to retire and then return to full
time employment as a bus driver without a suspension of pension benefits after 12 months from the date of his original retirement.
ANTI-SELECTION: A member is allowed to retire and
collect a pension at the same time he continues to work in employment covered by the system from which he draws his pension.
ORP Rescission Act 923 of the 2004 Regular Session – LASERS
Under this legislation, an employee who irrevocably elected to participate in ORP prior to July 31, 2002, was permitted to rescind his election and instead receive service credit in the defined benefit plan for the period of ORP participation. The employee could also re-establish prior credit under the

Page 124 Actuarial Concerns – Funding Issues
defined benefit plan by returning all contributions that had been transferred into ORP with interest. ANTI-SELECTION: This enables an employee to rescind his/her ORP participation if the defined benefit plan subsequently results in a better value for that service period. Obviously, the only members who would make this election are those who would gain from it. As a result, benefits from the retirement systems would increase and additional contributions would be required from employers.
Airtime Purchase Act 340 of the 2004 Regular Session – LASERS
This Act allowed members to purchase up to five years of service credit without actually rendering that employment with the state or with any other entity covered by the system. ANTI-SELECTION: It is assumed that a member will purchase such additional service only if he expects to gain financially from such a purchase. The member expects to gain a benefit that has a greater value than the cost he incurs to pay for the service. In spite of all efforts made by actuaries to make sure the cost of purchase is equivalent to the value of the additional benefits, the circumstances of some members will allow them to purchase the credits at a cost that is less than the actual cost.
Back-DROP Act 854 of the 2004 Regular Session – SPRF
In addition to paying the Back-DROP lump sum, this legislation also returns all contributions the member had been required to pay as an active employee during the period elected for Back-DROP. Back-DROP allows a retiring member of SPRF to elect an alternative monthly benefit plus lump sum at actual retirement. The alternative benefit equals the accrued monthly benefit that existed at the beginning of the Back-DROP period, which may be as long as 36 months. The lump sum is an amount equal to the alternative benefit for each month of the selected Back-DROP period. If the employee chooses not to select the Back-DROP alternative, he receives his regular accrued retirement benefit. The Back-DROP value is not the same as an actuarially reduced option payment (e.g., Initial Benefit Option) since it is not

Actuarial Concerns – Funding Issues Page 125
determined as an actuarial equivalent of the regular retirement benefit value. The retention of required employee contributions by SPRF was a major feature of the original SPRF Back-DROP because it limited the cost of the program and it allowed it to be reasonably sound actuarially. This feature, which was removed by Act 854 of the 2004 Regular Session, now refunds employee contributions paid during the look-back period in addition to the lump sum Back-DROP account and the alternative monthly retirement benefit payable to the member for life. ANTI-SELECTION: Generally, the plan loses when a member is allowed to elect between options that are not actuarially equivalent. Back-DROP allows a member to participate retroactively in DROP upon his actual retirement. This means that members can look back and determine whether they would gain from salary increases or legislated benefit changes by entering the program retroactively. DROP members did not have this retroactive opportunity. The retention of employee contributions under the original SPRF program helped to neutralize the adverse risk and therefore mitigated some of the costs to the system. This is no longer true under Act 854. Effective July 1, 2004, the system board can now set the employee rate between 9.8% and 10.25% of pay to fairly apportion the cost of benefit improvements.
DROP Rescission Act 866 of the 2004 Regular Session – SPRF
This legislation allows a member who is in DROP or a member who continues to be employed Post-DROP who has not severed employment to rescind his participation in DROP and then elect either regular retirement status or Back-DROP. ANTI-SELECTION: The member will have the option of looking back to see if significant benefit improvement can be gained by opting out of DROP. If plan benefits are increased by legislation or the member has had a significant pay increase, he can rescind his DROP participation to receive the higher future benefit value. Allowing a member to change options retrospectively can significantly affect the

Page 126 Actuarial Concerns – Funding Issues
actuarial funding assumptions underlying the system’s benefit structure. Anti-selection may also occur relative to the mortality assumption and the system's survivorship provisions. When a member enters DROP, he must select an annuity payout option, similar to that of a retiree. Under the amendment, a member may elect out of DROP in anticipation of death if the non-DROP active survivor benefit would be greater. Effective July 1, 2004, the system board can now set the employee rate between 9.8% and 10.25% of pay to fairly apportion the cost of benefit improvements.
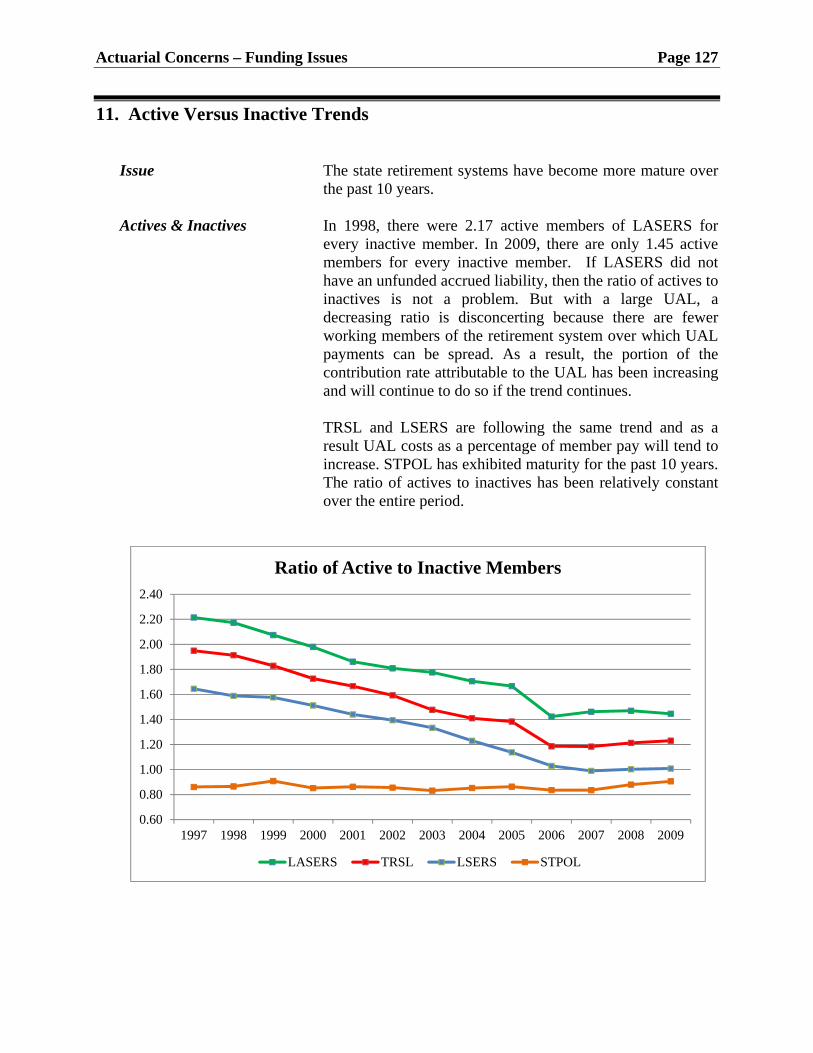
Actuarial Concerns – Funding Issues Page 127
11. Active Versus Inactive Trends Issue The state retirement systems have become more mature over
the past 10 years. Actives & Inactives In 1998, there were 2.17 active members of LASERS for
every inactive member. In 2009, there are only 1.45 active members for every inactive member. If LASERS did not have an unfunded accrued liability, then the ratio of actives to inactives is not a problem. But with a large UAL, a decreasing ratio is disconcerting because there are fewer working members of the retirement system over which UAL payments can be spread. As a result, the portion of the contribution rate attributable to the UAL has been increasing and will continue to do so if the trend continues.
TRSL and LSERS are following the same trend and as a
result UAL costs as a percentage of member pay will tend to increase. STPOL has exhibited maturity for the past 10 years. The ratio of actives to inactives has been relatively constant over the entire period.
0.60
0.80
1.00
1.20
1.40
1.60
1.80
2.00
2.20
2.40
1997 1998 1999 2000 2001 2002 2003 2004 2005 2006 2007 2008 2009
Ratio of Active to Inactive Members
LASERS TRSL LSERS STPOL
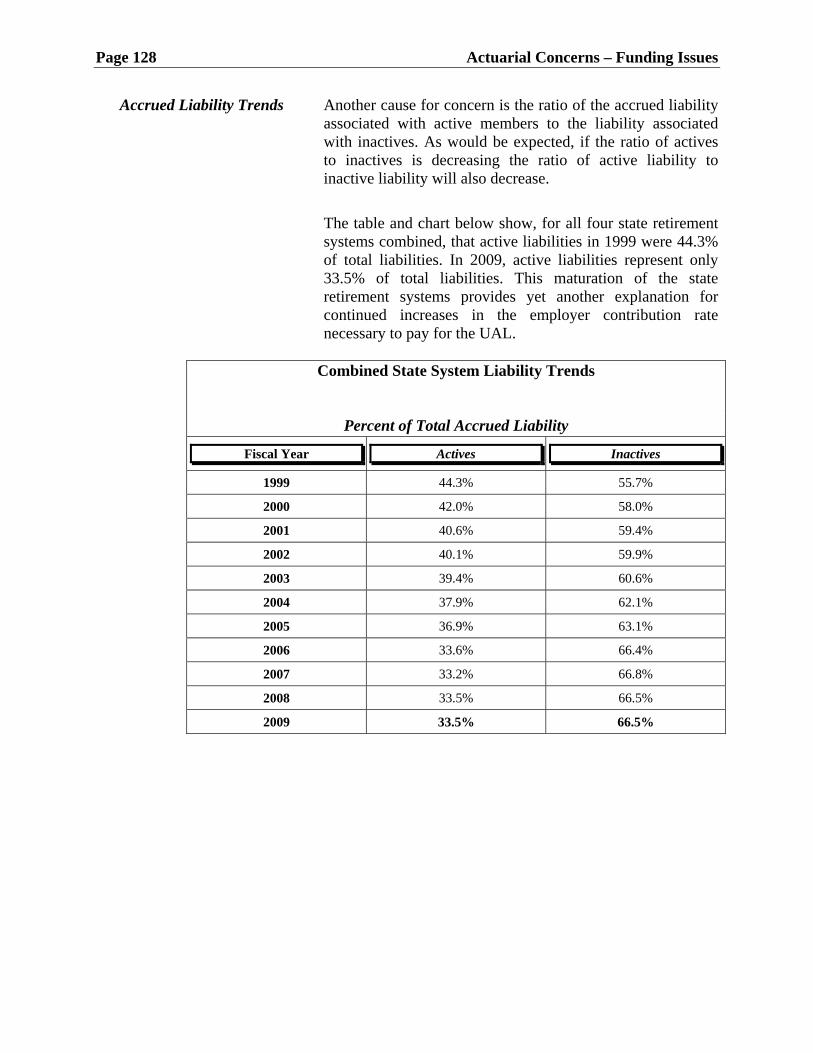
Page 128 Actuarial Concerns – Funding Issues
Accrued Liability Trends Another cause for concern is the ratio of the accrued liability associated with active members to the liability associated with inactives. As would be expected, if the ratio of actives to inactives is decreasing the ratio of active liability to inactive liability will also decrease.
The table and chart below show, for all four state retirement systems combined, that active liabilities in 1999 were 44.3% of total liabilities. In 2009, active liabilities represent only 33.5% of total liabilities. This maturation of the state retirement systems provides yet another explanation for continued increases in the employer contribution rate necessary to pay for the UAL.
Combined State System Liability Trends
Percent of Total Accrued Liability
Fiscal Year Actives Inactives
1999 44.3% 55.7%
2000 42.0% 58.0%
2001 40.6% 59.4%
2002 40.1% 59.9%
2003 39.4% 60.6%
2004 37.9% 62.1%
2005 36.9% 63.1%
2006 33.6% 66.4%
2007 33.2% 66.8%
2008 33.5% 66.5%
2009 33.5% 66.5%

Actuarial Concerns – Funding Issues Page 129
Percent Funded The following table provides yet another way to view
maturing retirement systems with a large UALs. In 1998, plan assets were sufficient to cover 100% of the inactive accrued liabilities and over 50% of active liabilities. However, as the dot.com bubble, the events of 9/11, and the market corrections resulting therefrom unfolded, the state systems still had sufficient assets to cover inactive liabilities, but by 2004, assets available for actives were less than 2% of the active liability. And, as a result of negative investment returns over the past couple of years, assets of the state retirement systems on June 30, 2009, were not sufficient to cover liabilities for even retired members.
The problem is that an underfunded plan is at significant risk
of not being able to fulfill its promises to active members should it be necessary to revise the retirement program. Underfunded retirement systems limit the options available to the state for managing its work force and its benefit programs.
25.0%
30.0%
35.0%
40.0%
45.0%
50.0%
55.0%
60.0%
65.0%
70.0%
75.0%
1999 2000 2001 2002 2003 2004 2005 2006 2007 2008 2009
Comparison of the Active and Inactive Accrued LiabilitiesAs a Percentage of the Total
Actives Inactives

Page 130 Actuarial Concerns – Funding Issues
Combined State System Liability Trends
Percent Funded
Fiscal Year Actives Inactives Combined
1998 50.5% 100.0% 77.4%
1999 58.7% 100.0% 81.7%
2000 71.0% 100.0% 87.8%
2001 55.1% 100.0% 81.8%
2002 29.1% 100.0% 71.6%
2003 4.9% 100.0% 62.5%
2004 1.4% 100.0% 62.7%
2005 4.6% 100.0% 64.8%
2006 8.4% 100.0% 69.2%
2007 18.2% 100.0% 72.9%
2008 13.0% 100.0% 70.9%
2009 0.0% 90.2% 60.0%
0.0%
20.0%
40.0%
60.0%
80.0%
100.0%
120.0%
1998 1999 2000 2001 2002 2003 2004 2005 2006 2007 2008 2009
Portion of the Accrued Liability Covered byThe Actuarial Value of Assets
Actives Inactives Combined
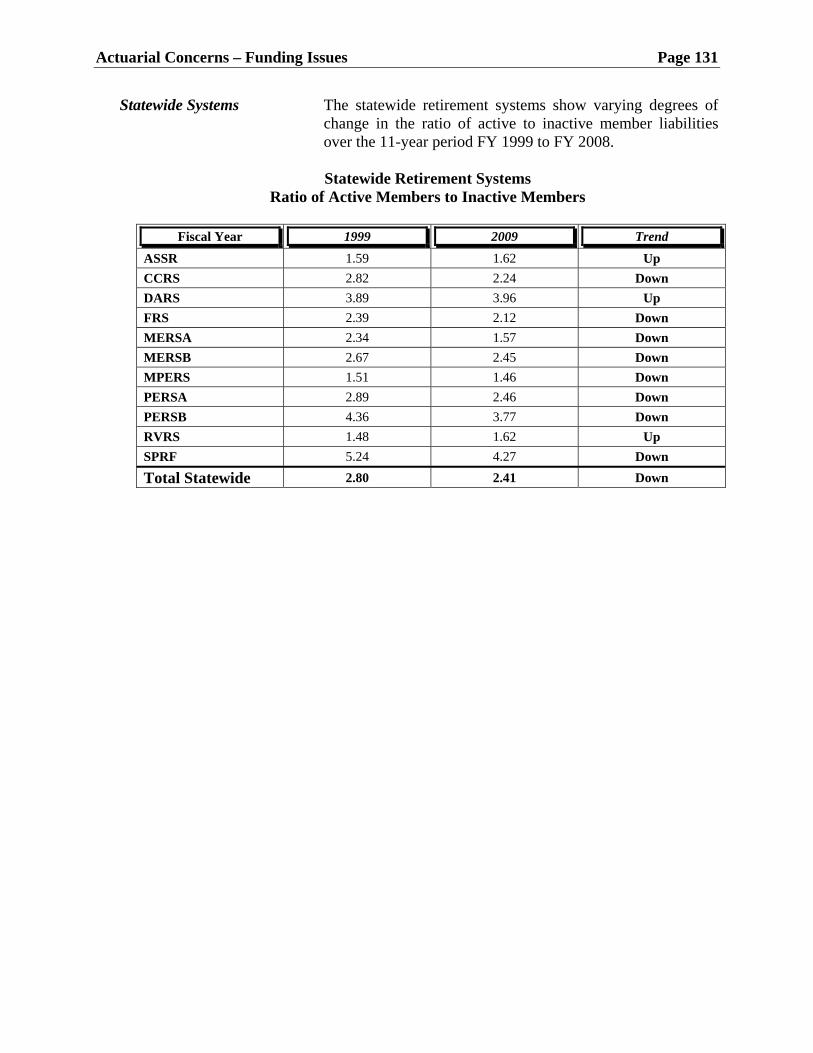
Actuarial Concerns – Funding Issues Page 131
Statewide Systems The statewide retirement systems show varying degrees of change in the ratio of active to inactive member liabilities over the 11-year period FY 1999 to FY 2008.
Statewide Retirement Systems
Ratio of Active Members to Inactive Members
Fiscal Year 1999 2009 Trend
ASSR 1.59 1.62 Up
CCRS 2.82 2.24 Down
DARS 3.89 3.96 Up
FRS 2.39 2.12 Down
MERSA 2.34 1.57 Down
MERSB 2.67 2.45 Down
MPERS 1.51 1.46 Down
PERSA 2.89 2.46 Down
PERSB 4.36 3.77 Down
RVRS 1.48 1.62 Up
SPRF 5.24 4.27 Down
Total Statewide 2.80 2.41 Down

Page 132 Actuarial Concerns - Funding Issues
12. Actuarial Certification
Most of the material in this section of the report and some of the information in the other sections may be considered to be Statements of Actuarial Opinion. Therefore, I make the following certification:
I, Paul T. Richmond, am the Manager of Actuarial Services for the Louisiana Legislative Auditor. I am a member of the American Academy of Actuaries, an Associate in the Society of Actuaries, an Enrolled Actuary, and I meet the Qualification Standards of the American Academy of Actuaries to render the actuarial opinion contained herein.
Date

Section IV
Recent Legislation

Recent Legislation Page 133
1. Summary of Retirement Legislation Enacted in 2009 Retirement legislation enacted into law as a result of the 2009
Regular Session of the Louisiana Legislature is summarized below. A brief summary is provided for each Act as well as the cost identified in the associated actuarial note.
DROP: Act 480 for STPOL replaces the current DROP with a Back-
DROP option for members of the State Police Pension and Retirement Fund who have not already elected to participate in DROP. The Act also increases the employee contribution requirement from 8.0% of pay to 8.5% to help offset the cost associated with the benefit change from DROP to Back-DROP. Annual cost for the next 10 years will increase from $8,000 to $2,500,000 a year.
Trustee Responsibilities: Act 398 for the Shreveport Police Pension and Relief Fund
broadens the board’s investment powers, gives the board the authority to award a permanent benefit increase of up to 3% each year as long as the funded ratio of the plan is 80% or more, and removes the authority of the City of Shreveport to use excess assets for salaries and wages of City of Shreveport police officers. The increase in the present value of future benefit costs is estimated to be $6 million.
Funding: Act 504 for ASSR removes the cap on the amount of revenue
sharing dollars that the system may demand for satisfaction of certain required tax remittances due the system by a parish, city, or other governmental entity. Savings may occur in the future.
Act 422 for FRS extends the period for amortizing the
unfunded accrued liability. Annual contribution requirements will decrease $3,799,588 per year for the first 15 years. In years 16 through 20, required contributions will increase $24,528,380 per year.
Act 296 for CCRS, MPERS, PERS, and RVRS establishes
Funding Deposit Accounts into which surplus contributions will be deposited, accumulated, and dispersed in at the discretion of the boards. The cost is negligible.

Page 134 Recent Legislation
Act 68 for MERS amends existing law to provide for the continuing liability of participating employers which terminate participation in MERS; to allow for installment payments to discharge amounts owed by such employers to the system and to provide for an interest rate applicable to installment payments and to delinquent payments. Revenues into the retirement system will increase.
Act 247 for STPOL establishes a Funding Deposit Account
into which surplus contributions will be deposited, accumulated, and dispersed in at the discretion of the board. The unfunded accrued liability is likely to increase by a small amount.
Act 497 for LASERS and TRSL transferred amounts in the
Employer Experience Accounts, the IUAL Funds and the Employer Credit Accounts to the regular pool of assets; restructured the amortization payments for the UAL, and increased the threshold of actuarial gains that must be attained for COLAs to be paid. Contribution requirements to LASERS and TRSL will decrease $16.8 million over the 5-year measurement period.
Service Credits: Act 59 for MERS allows members to purchase certain prior
service credit not included in the service credit as certified by their employing city, town, or village in such entity’s participation agreement with MERS. The present value cost is $0.
Act 301 for LASERS and TRSL allows employees of a
public college or university or governing board or management board of a public college or university who are members of LASERS and TRSL who are furloughed voluntarily or involuntarily due to budget reductions to accrue up to 30 days of service credit during their furlough period and earn benefits in their respective retirement systems. The cost of this Act is negligible.
Membership: Act 412 for TRSL provides that foreign teachers holding J-1
Visas who are teaching in a Louisiana public school through a J-1 exchange visitor program shall be members of TRSL. The annual cost to school districts is estimated to be $2,790,000.
Act 44 for RVRS extends membership to employees of the
Louisiana Registrar of Voters Association, Inc. The net cost over the 5-year fiscal measurement period is estimated to be $67,652.

Recent Legislation Page 135
Rehired Retirees: Act 516 for LSERS requires any employer participating in
LSERS to pay the actuarial cost in the aggregate, if such employer opts to re-employ a retired school bus driver under provisions allowing such retiree to receive full benefits plus salary and to require employers to declare their intent to reemploy a retired bus driver under the 100% Rule of R.S. 11:1007. The costs or savings cannot be measured because it depends on the extent to which schools re-employ retired bus drivers.
Act 300 for MPERS allows a re-employed retiree, upon
leaving employment for the second time, to choose an IBO for the additional benefits accrued during the retiree’s period of re-employment. The cost is negligible.
Act 389 for DARS allows a retiree of a retirement system
other than the DARS who is elected or appointed to a position of District Attorney or Assistant District Attorney on or after November 15, 2008, to become a member of DARS and accrue a supplemental pension. The cost is negligible.
COLA: Act 270 for all FRS permits retirees from the state and
statewide retirement systems to select a retirement option that provides for automatic COLAs subject to an actuarial reduction of benefits. The cost is negligible.
Act 144 for LASERS and TRSL grants a minimum benefit
increase to certain retirees, beneficiaries, and survivors with small benefits. The cost is estimated to be about $6.8 million for LASERS and $10.2 million for TRSL.

Page 136 Recent Legislation
This page is intentionally blank.