florida retirement system pension plan - edr -...
TRANSCRIPT

Milliman Actuarial Valuation
Issued December 1, 2017
Florida Retirement System Pension Plan
Actuarial Valuation as of July 1, 2017
Prepared by:
Matt Larrabee, FSA, EA, MAAA
Principal and Consulting Actuary
Daniel Wade, FSA, EA, MAAA
Principal and Consulting Actuary
Kathryn Hunter, FSA, EA, MAAA
Consulting Actuary
111 SW Fifth Avenue, Suite 3700
Portland OR 97204
Tel 503 227 0634
1301 Fifth Avenue, Suite 3800
Seattle, WA 98101
Tel 206 624 7940
milliman.com

Offices in Principal Cities Worldwide
This work product was prepared solely for Florida Department of Management Services for the purposes described herein and may not be appropriate to use for other purposes. Milliman does not intend to benefit and assumes no duty or liability to other parties who receive this work. Milliman recommends
that third parties be aided by their own actuary or other qualified professional when reviewing the Milliman work product.
FRS 2017 Funding Actuarial Valuation Report.docx 0088 FLA 01 / ML/DW/KH/nlo
111 SW Fifth Avenue, Suite 3700
Portland, OR 97204
Tel 503 227 0634
1301 Fifth Avenue, Suite 3800
Seattle, WA 98101
Tel 206 624 7940
milliman.com
December 1, 2017
Ms. Elizabeth Stevens
State Retirement Director
Florida Department of Management Services, Division of Retirement
Re: Actuarial Valuation as of July 1, 2017
Dear Director Stevens:
We have conducted an annual actuarial valuation of the Florida Retirement System (FRS) Pension Plan as of
July 1, 2017, for assessing plan funded status and determining actuarially calculated contribution rates for the
July 2018 - June 2019 plan year. The major findings of the valuation are contained in the following report.
Section 1 contains an Executive Summary of the results of our valuation followed by four sections containing
detailed information on Assets (Section 2), Liabilities (Section 3), Contributions (Section 4), and Accounting
Statements (Section 5). In the Appendices, we provide information regarding actuarial methods and assumptions,
a summary of plan provisions, membership statistics, cost projections, comparisons/reconciliation, and a glossary
of terms.
All costs and liabilities shown in this report have been determined on the basis of actuarial assumptions and
methods set forth in Appendix A. Preliminary 2017 valuation results using the actuarial assumptions and methods
used in the previous valuation as of July 1, 2016 were presented by the actuary to the 2017 FRS Actuarial
Assumption Conference held on October 5, 2017. The assumptions are based on Milliman’s most recent review
of the System’s experience, which was for the observation period from July 1, 2008 through June 30, 2013.
Additional details on that review of System experience can be located in our August 11, 2014 presentation
materials to the 2014 FRS Actuarial Assumption Conference and our formal 2014 Experience Study report, which
was issued on September 8, 2014. The assumptions used in this valuation are unchanged from those used in the
prior valuation as of July 1, 2016 except for the investment return assumption for purposes of developing
actuarially calculated contribution rates, which was decreased from 7.60% to 7.50%.
With one exception, in our professional opinion we believe the assumptions and methods used in this report for
purposes of developing actuarially calculated contribution rates are reasonable. The investment return
assumption, which was set by the 2017 FRS Actuarial Assumption Conference, is a prescribed assumption as
defined by Actuarial Standard of Practice No. 27 (ASOP 27). The prescribed assumption conflicts with our
professional judgment regarding what would constitute a reasonable assumption for the purpose of the
measurement as discussed in ASOP 27. Details and discussion regarding the return assumption are shown in our
2017 FRS Actuarial Assumption Conference presentation materials and discussed in the Executive Summary of
this report.

Ms. Elizabeth Stevens Division of Retirement
December 1, 2017 Page 2
This work product was prepared solely for Florida Department of Management Services for the purposes described herein and may not be appropriate to use for other purposes. Milliman does not intend to benefit and assumes no duty or liability to other parties who receive this work. Milliman recommends
that third parties be aided by their own actuary or other qualified professional when reviewing the Milliman work product.
FRS 2017 Funding Actuarial Valuation Report.docx 0088 FLA 01 / ML/DW/KH/nlo
The accounting calculations for the FRS Pension Plan’s financial reporting and its June 30, 2017 CAFR in
compliance with the GASB Statement No. 67 use some methods and assumptions that differ from those used in
this report. The GASB financial reporting information, which is issued under separate cover, uses assumptions
and methods which in our professional opinion are reasonable without any exceptions.
The results of this report are dependent upon future experience conforming to the assumptions disclosed in this
report. Future actuarial measurements may differ significantly from the current measurements presented in this
report due to many factors, including: plan experience differing from that anticipated by the economic or
demographic assumptions; changes in economic or demographic assumptions; increases or decreases expected
as part of the natural operation of the methodology used for these measurements (such as the end of an
amortization period); and changes in plan provisions or applicable law. Due to the limited scope of our
assignment, we did not perform an analysis of the potential range of future measurements.
Actuarial computations presented in this report are for purposes of assessing funded status and determining the
actuarially calculated contribution rates for the FRS Pension Plan. The calculations in the enclosed report have
been made on a basis consistent with our understanding of the FRS Pension Plan’s funding requirements and
goals. Determinations for purposes other than meeting those requirements referenced in this paragraph may be
significantly different from the results contained in this report. Accordingly, additional determinations may be
needed for other purposes.
In preparing our report we relied, without audit, on information (some oral and some written) supplied by the
Florida Department of Management Services, Division of Retirement. This information includes, but is not limited
to, statutory provisions, employee census, and financial information. In our examination of these data, we have
found them to be reasonably consistent and comparable with data used for other purposes. Since the valuation
results are dependent on the integrity of the data supplied, the results can be expected to differ if the underlying
data is incomplete or missing. It should be noted that if any data or other information is inaccurate or incomplete,
our calculations may need to be revised.
This actuarial valuation was prepared and completed by us and those under our direct supervision, and we
acknowledge responsibility for the results. To the best of our knowledge, the results are complete and accurate.
With the exception of the one assumption noted above, the techniques and assumptions used are reasonable. In
our opinion this valuation meets the requirements and intent of Part VII, Chapter 112, Florida Statutes. Regarding
the one noted exception, Section 216.136(10) of Florida Statutes indicates that the 2017 FRS Actuarial
Assumption Conference holds the statutory authority to determine the investment return assumption for purposes
of developing actuarially calculated contribution rates. There is no benefit provision or related expense to be
provided by the plan and/or paid from the plan’s assets for which liabilities or current costs have not been
established or otherwise taken into account in the valuation. To the best of our knowledge, there were no known
events that were not taken into account in the valuation.
Milliman’s work product was prepared exclusively for the internal business use of Florida Department of
Management Services, Division of Retirement, for a specific and limited purpose. It is a complex technical
analysis that assumes a high level of knowledge concerning the Florida Retirement System’s operations, and
uses Division data, which Milliman has not audited. To the extent that Milliman’s work is not subject to disclosure
under applicable public record laws, Milliman’s work may not be provided to third parties without Milliman’s prior

Ms. Elizabeth Stevens Division of Retirement
December 1, 2017 Page 3
This work product was prepared solely for Florida Department of Management Services for the purposes described herein and may not be appropriate to use for other purposes. Milliman does not intend to benefit and assumes no duty or liability to other parties who receive this work. Milliman recommends
that third parties be aided by their own actuary or other qualified professional when reviewing the Milliman work product.
FRS 2017 Funding Actuarial Valuation Report.docx 0088 FLA 01 / ML/DW/KH/nlo
written consent. Milliman does not intend to benefit or create a legal duty to any third party recipient of its work
product. Milliman’s consent to release its work product to any third party may be conditioned on the third party
signing a Release, subject to the following exceptions:
(a) The Division of Retirement may provide a copy of Milliman’s work, in its entirety, to the System’s professional
service advisors who are subject to a duty of confidentiality and who agree to not use Milliman’s work for any
purpose other than to benefit the System.
(b) The Division of Retirement may provide a copy of Milliman’s work, in its entirety, to other governmental
entities, as required by law.
No third party recipient of Milliman’s work product should rely upon Milliman’s work product. Such recipients
should engage qualified professionals for advice appropriate to their own specific needs.
The consultants who worked on this assignment are pension actuaries. Milliman’s advice is not intended to be a
substitute for qualified legal or accounting counsel.
The signing actuaries are independent of the plan sponsor. We are not aware of any relationship that would
impair the objectivity of our work.
On the basis of the foregoing, we hereby certify that, to the best of our knowledge and belief, this report is
complete and accurate and has been prepared in accordance with generally recognized and accepted actuarial
principles and practices which are consistent with Actuarial Standards of Practice, the Code of Professional
Conduct and Qualification Standards for Public Statements of Actuarial Opinion of the American Academy of
Actuaries. We are members of the American Academy of Actuaries and meet the Qualification Standards to
render the actuarial opinion contained herein.
Respectfully submitted,
Matt Larrabee, FSA, EA, MAAA Daniel Wade, FSA, EA, MAAA
Principal and Consulting Actuary Principal and Consulting Actuary
Kathryn Hunter, FSA, EA, MAAA
Consulting Actuary
ML/DW/KH/nlo

Actuarial Valuation as of July 1, 2017
Florida Retirement System Pension Plan
This work product was prepared solely for Florida Department of Management Services for the purposes described herein and may not be appropriate to use for other purposes. Milliman does not intend to benefit and assumes no duty or liability to other parties who receive this work. Milliman recommends that third parties be aided by their own actuary or other qualified professional when reviewing the Milliman work product.
i
FRS 2017 Funding Actuarial Valuation Report.docx
Table of Contents
Page
1. Executive Summary ......................................................................................................................................... 1
2. Assets ............................................................................................................................................................. 12
3. Liabilities ........................................................................................................................................................ 19
4. Contributions ................................................................................................................................................. 24
5. Accounting Statement ................................................................................................................................... 39
Appendix A: Actuarial Methods, Procedures and Assumptions .............................................................. A-1
Appendix B: Summary of Plan Provisions ................................................................................................. B-1
Appendix C: Membership Data .................................................................................................................... C-1
Appendix D: Projections .............................................................................................................................. D-1
Appendix E: Comparisons/Reconciliation.................................................................................................. E-1
Appendix F: Glossary .................................................................................................................................. F-1

Actuarial Valuation as of July 1, 2017
Florida Retirement System Pension Plan Executive Summary
This work product was prepared solely for Florida Department of Management Services for the purposes described herein and may not be appropriate to use for other purposes. Milliman does not intend to benefit and assumes no duty or liability to other parties who receive this work. Milliman recommends that third parties be aided by their own actuary or other qualified professional when reviewing the Milliman work product.
1
1. Executive Summary
This report presents the results of our July 1, 2017 actuarial valuation of the defined benefit Florida Retirement
System (FRS) Pension Plan. This valuation is used to determine actuarially calculated Pension Plan-specific
employer contribution rates for the July 1, 2018 – June 30, 2019 plan year. The Pension Plan-specific rates
developed in this valuation report are then combined with contribution rates from the defined contribution FRS
Investment Plan to create blended proposed statutory employer contribution rates. The actual contribution rates
paid by employers during the 2018-2019 plan year will be determined by Florida Statutes. The statutory
contribution rates in effect for the current 2017-2018 plan year are identical to the blended proposed statutory
rates developed in conjunction with the July 1, 2016 actuarial valuation as subsequently modified to reflect the
effects of Senate Bill 7022, which was enacted during the 2017 legislative session.
On the smoothed Actuarial Value of Assets (AVA) basis used to determine actuarially calculated contribution
rates and the Unfunded Actuarial Liability (UAL), Pension Plan funded status decreased from 85.4% to 84.3%. On
a Market Value of Assets (MVA) basis, Pension Plan funded status calculated on the assumptions and methods
in this report for system funding purposes increased from 83.2% to 86.3% due to actual plan year investment
return of approximately +13.6% compared to an assumed prior year return of 7.60%.1
Pension Plan actuarially calculated employer contribution rates, prior to blending with Investment Plan rates to
create blended proposed statutory contribution rates, increased from 9.80% of pay to 10.50% of pay on a
composite basis. The most significant rate increase source was the 0.10% decrease in the assumed future
average annual long-term investment return. Actual retirement and DROP entry behavior of eligible members
during 2016-2017 plan year compared to the long-term assumption played the next largest role in the rate
increase. Other actual member demographic experience during the year, which includes the effects of actual
salary increase and mortality experience compared to long-term assumption, and an increase to in-line-of-duty
death benefits for beneficiaries of Special Risk members played lesser roles in the year-over-year increase. The
increase factors noted above were partially offset by a plan year investment return on a smoothed Actuarial Value
of Assets basis of +8.2%, which is above the long-term assumption used in the prior valuation, and a 4.1%
increase in the payroll on which UAL rates are calculated prior to blending with Investment Plan rates, compared
to the long-term average payroll growth assumption of 3.25%.
Due to strong market value investment performance over the past plan year, the Market Value of Assets exceeds
the smoothed Actuarial Value of Assets used for funded status and contribution rate calculations by $3.46 billion
as of July 1, 2017. That $3.46 billion not yet recognized market investment gain will be systematically recognized
as a sequence of actuarial investment gains in the UAL over the next several years if market value investment
experience during that period meets or exceeds the 7.50% investment return assumption. If actual market value
investment experience during that period fails to meet or exceed the 7.50% assumption used in this valuation, the
not yet recognized market investment gain will serve as buffer, either mitigating or eliminating increases in
actuarially calculated employer contribution rates.
For this valuation, a long-term average annual future investment return assumption of 7.50% was used, a
decrease of 0.10% from the assumption used in the previous valuation. The 7.50% assumed return is a
prescribed assumption as defined by Actuarial Standard of Practice No. 27 (ASOP 27), as it was set by the 2017
FRS Actuarial Assumption Conference. The prescribed assumption conflicts with our judgment regarding what
1 The required financial reporting information under GASB 67 also uses market value of assets, but has a cost allocation method and an investment return assumption different from those used in this valuation for funding purposes. GASB 67 information was issued under separate cover, and indicated a funded ratio of 83.9% as of June 30, 2017 using a 7.10% investment return assumption.

Actuarial Valuation as of July 1, 2017
Florida Retirement System Pension Plan Executive Summary
This work product was prepared solely for Florida Department of Management Services for the purposes described herein and may not be appropriate to use for other purposes. Milliman does not intend to benefit and assumes no duty or liability to other parties who receive this work. Milliman recommends that third parties be aided by their own actuary or other qualified professional when reviewing the Milliman work product.
2
would constitute a reasonable assumption for the purpose of the measurement as discussed in ASOP 27. It is
materially above the 50th percentile average returns in the proprietary capital market outlook models developed by
both Milliman and the Florida State Board of Administration’s outside investment consultant (Aon Hewitt
Investment Consulting). All models developed in 2017 by Milliman and Aon Hewitt had 50th percentile geometric
average annual long-term future returns in the 6.6%-6.8% range, and all models developed in 2017 indicated a
likelihood of less than 40% of actual long-term future returns meeting or exceeding 7.50%. More details are
shown in our 2017 FRS Actuarial Assumption Conference presentation materials.
All else being equal, the lower the selected investment return assumption, the higher the likelihood the FRS
Pension Plan will meet or exceed its assumed investment return in future years. A lower assumption would result
in higher short-term actuarially calculated contribution rates for employers, but would also serve to lessen the
magnitude of actuarially calculated contribution rate increases in the event that actual future investment
performance fails to meet the assumption.
Actual future investment return experience for the FRS Pension Plan is not affected by the assumption used in
the actuarial valuation. Applying the 7.50% assumption used in this valuation, the following graph illustrates the
UAL (Unfunded Actuarial Liability) on a Market Value of Assets basis under four scenarios for steady actual future
investment returns:
7.50%, which is the assumption selected for this valuation by the 2017 FRS Actuarial Assumption Conference
7.10%, which is the assumption used for GASB 67 calculations as of a June 30, 2017 Measurement Date
7.00%, which is moderate recurring annual underperformance compared to the valuation assumption
6.80%, which is near the 50th percentile assumption for a model developed by Aon Hewitt Investment Consulting in consultation with the Florida State Board of Administration for the 2017 asset-liability study
As illustrated in the graph, if actual future investment returns match the 7.50% assumption the UAL would
decrease by approximately one-quarter by the end of the illustrated 15-year period. Currently, there are market
investment gains that are not yet recognized in the smoothed Actuarial Value of Assets as of the valuation date.
When that is the case, the pattern shown over the first 15 years in the 7.50% actual return scenario is typical of
the method of closed 30-year amortization periods used to calculate contribution rates in the valuation. (The UAL
still remaining after 15 years is amortized over the latter 15 years of the amortization schedule if actual investment
performance continues to match the assumption.) If actual returns underperform the 7.50% assumption by 0.40%
$15
$20
$25
$30
$35
$40
$45
2017 2020 2023 2026 2029 2032
UAL (Market Value of Assets basis) in $ billions
7.50% Actual Return 7.10% Actual Return 7.00% Actual Return 6.80% Actual Return

Actuarial Valuation as of July 1, 2017
Florida Retirement System Pension Plan Executive Summary
This work product was prepared solely for Florida Department of Management Services for the purposes described herein and may not be appropriate to use for other purposes. Milliman does not intend to benefit and assumes no duty or liability to other parties who receive this work. Milliman recommends that third parties be aided by their own actuary or other qualified professional when reviewing the Milliman work product.
3
to 0.50%, the UAL would increase by between $8 and $12 billion over the illustrated 15-year projection period. If
actual investment returns equal the 50th percentile return from Aon Hewitt Investment Consulting’s “SBA
Approach” model of 6.8%, the UAL would increase by 75% over the modeled 15-year period even if actuarially
calculated contributions are made and all other experience follows the assumptions used in this valuation.
We also want to point out other key items regarding this valuation:
Consistent with the previous valuation, the contribution rate calculation methodology uses the Ultimate Entry
Age Normal (Ultimate EAN) actuarial cost allocation method as selected by the FRS Actuarial Assumption
Conference. Under the Ultimate EAN method, the Normal Cost Rate is calculated as the rate that would be
applicable if the plan provisions of Senate Bill 2100 for members hired on or after July 1, 2011 applied to all
FRS Pension Plan members for the entirety of their projected working careers. The present value of total
projected benefits calculated for each member reflects the actual tier in which the member participates. As
such, the methodology used for calculating contribution rates understates Normal Cost Rate but overstates
Actuarial Liability and UAL Rate when compared to some alternative calculation methodologies, such as the
Individual Entry Age Normal (Individual EAN) methodology that is mandated by GASB for financial reporting
calculations under GASB Statements Nos. 67 & 68.
The Ultimate EAN actuarial cost allocation method being used for liability and rate calculations, like any
actuarial cost allocation method, divides the present value of total projected benefits for each active member
between past service (Actuarial Liability, or AL) and future service (present value of future normal costs). The
cost allocation method does not impact the calculation of the present value of total projected benefits.
The tables immediately following compare July 1, 2016 actuarial valuation results with July 1, 2017 actuarial
valuation results. The difference column shows the change between the July 1, 2016 valuation results and the
July 1, 2017 valuation results.
A. Assets, Liabilities, and Funded Status
A comparison of the Actuarial Liability and Actuarial Value of Assets (AVA) follows. These figures are based upon
the actuarial assumptions used to determine the actuarial costs of the FRS Pension Plan (see Appendix A).
Under current methodology, and as required by Florida law, the AVA cannot be less than 80% or greater than
120% of the Market Value of Assets (MVA). This corridor restriction does not come into play unless there are
dramatic asset gains or losses in the prior plan year. The purpose of the corridor is to ensure that the “smoothed”
value of assets does not vary from the market value by more than 20%. As of July 1, 2017, the AVA is 97.8% of
the MVA.
In Section 5 of this report we present an additional measure of funded status based on a different liability
measure, the "Accumulated Benefit Obligation" (ABO), based on both the AVA and the MVA.
B. Contributions
Actuarially calculated contribution rates by class are determined annually in the actuarial valuation. Actual
contribution rates paid by employers for each class are set by statute and consist of Normal Cost and UAL Cost
Valuation Results (numbers in $ billions)
July 1, 2016 July 1, 2017 Difference
1. Actuarial Liability $170.4 $178.6 $8.2
2. Actuarial Value of Assets $145.5 $150.6 $5.1
3. Unfunded Actuarial Liability (1 - 2) $24.9 $28.0 $3.1
4. Funded Percentage (2 / 1) 85.4% 84.3% -1.1%

Actuarial Valuation as of July 1, 2017
Florida Retirement System Pension Plan Executive Summary
This work product was prepared solely for Florida Department of Management Services for the purposes described herein and may not be appropriate to use for other purposes. Milliman does not intend to benefit and assumes no duty or liability to other parties who receive this work. Milliman recommends that third parties be aided by their own actuary or other qualified professional when reviewing the Milliman work product.
4
components. For the 2017-2018 plan year, the actuarially calculated rates determined by the July 1, 2016
valuation, as subsequently modified to reflect the effects of Senate Bill 7022, and the legislated rates are
equivalent. The 2018-2019 actual contribution rates will be set by the 2018 session of the Florida Legislature, with
advice from this valuation and the associated 2018-2019 Blended Rate Study that will be issued subsequent to
the publication of this valuation. The Unfunded Actuarial Liability (UAL) amortization payment will consist primarily
of costs or savings associated with plan changes, assumption changes, differences in actual and expected
experience, or changes in actuarial methodology. As of July 1, 2017 the FRS Pension Plan has a UAL of $28.0
billion on a smoothed Actuarial Value of Assets basis. The UAL Cost is calculated to eliminate the UAL over a
pre-determined amortization period if future experience follows assumptions.
The comparative FRS Regular and Special Risk contribution rates resulting from this valuation and the prior
valuation are as follows. See Section 4 for more details on rate development and valuation results for all classes.
C. Membership
The total membership (active, terminated vested, retired, and DROP) of the FRS Pension Plan increased by
15,995 members from 1,047,482 as of July 1, 2016 to 1,063,477 as of July 1, 2017, an increase of 1.5%. The
total annualized projected payroll of non-DROP active Pension Plan members increased by 3.0%, from
$23.3 billion for the 2016-2017 plan year to $24.0 billion for the 2017-2018 plan year, a $0.7 billion increase in
payroll. Note that the payroll on which UAL Cost rates are determined is higher, and includes the payroll of DROP
and members in Optional Retirement Plans subject to the UAL contribution.
A summary of Pension Plan membership change by status follows:
Valuation Valuation Difference
Special Special Special
Regular Risk Regular Risk Regular Risk
Normal Cost 2.75% 11.57% 2.91% 11.95% 0.16% 0.38%
UAL Cost 1
3.93% 11.28% 4.19% 12.44% 0.26% 1.16%
Total Cost for FRS Employers 6.68% 22.85% 7.10% 24.39% 0.42% 1.54%
July 1, 2016 July 1, 2017
(2017-2018 Rates) (2018-2019 Rates)
1) The 0.26% increase in UAL Cost for the Regular class represents an 0.34% increase in rates due to assumption changes, and a 0.08% decrease in rates due to
other experience. The 1.16% increase in UAL Cost for the Special Risk class represents a 0.14% increase in rates due to plan change, a 0.61% increase in rates due to
assumption changes, and a 0.41% increase in rates due to other experience, including the effect of year-over-year salary increases.
Valuation Results: Counts
July 1, 2016 July 1, 2017 % Change
Active Members 514,629 518,622 0.8%
Terminated Vested Members 108,692 108,612 -0.1%
Retired Members 392,789 402,791 2.5%
DROP Members 31,609 33,452 5.8%
Total Members 1,047,719 1,063,477 1.5%

Actuarial Valuation as of July 1, 2017
Florida Retirement System Pension Plan Executive Summary
This work product was prepared solely for Florida Department of Management Services for the purposes described herein and may not be appropriate to use for other purposes. Milliman does not intend to benefit and assumes no duty or liability to other parties who receive this work. Milliman recommends that third parties be aided by their own actuary or other qualified professional when reviewing the Milliman work product.
5
D. Experience
Changes to assets and liabilities between July 1, 2016 and July 1, 2017 are described in this section.
1. Assets:
Changes in the smoothed Actuarial Value of Assets (AVA) during the plan year were due to:
Contributions received $3.419
Payment of benefits and administrative expenses (9.949)
Assumed plan year investment returns 10.807
Investment plan year gain/(loss) experience 0.865
Total plan year Actuarial Value of Assets increase $5.142 Billion
The actual plan investment return on the AVA was 8.21% compared to the prior valuation’s assumed return of
7.60%. On a market-value basis, the assets earned 13.57%. On a year-by-year basis, asset returns were as
follows:
* Assumes net cash flow occurs mid-year.
2. Actuarial Liability (AL):
Changes in the Actuarial Liability during the plan year were due to:
Expected increase, due to combined effects of Normal Cost plus interest-
related growth in Actuarial Liability less benefit payments during plan year
Change in plan provisions
$4.417
0.085
Changes in assumptions 2.124
Liability Plan Year (Gain) / Loss Experience
Active member salary increases different than assumption 0.181
New active members 0.522
Retirement and DROP entry behavior 0.787
Inactive mortality 0.046
Other demographic sources not noted above1 0.043
Liability plan year (gain) / loss experience 1.579
Total plan year Actuarial Liability increase $8.205 Billion
1 Reflects the combined effects of all other liability (gain)/loss sources for actuarial experience compared to assumptions used in the July 1, 2016 actuarial valuation. These include actual experience for pre-retirement turnover, second election transfers to the Investment Plan, active member death and disability, and all other actual experience not otherwise noted in the table above compared to assumed on the demographic assumptions used to calculate July 1, 2016 actuarial valuation results.
Rates of Return*
2014/2015 2015/2016 2016/2017
Market Value 3.76% 0.54% 13.57%
Actuarial Value 8.62% 6.99% 8.21%

Actuarial Valuation as of July 1, 2017
Florida Retirement System Pension Plan Executive Summary
This work product was prepared solely for Florida Department of Management Services for the purposes described herein and may not be appropriate to use for other purposes. Milliman does not intend to benefit and assumes no duty or liability to other parties who receive this work. Milliman recommends that third parties be aided by their own actuary or other qualified professional when reviewing the Milliman work product.
6
3. Unfunded Actuarial Liability (UAL):
The net change in the UAL of the FRS Pension Plan was an increase of $3.048 billion, from $24.923 billion to
$27.971 billion. The net increase is attributable to the following:
Change due to:
Expected increase, based on the net combined effect of plan contributions
received, interest, and assumed investment and demographic experience
$0.140
Change in plan provisions 0.085
Changes in assumptions 2.124
Investment plan year (gain)/loss experience (0.865)
Liability plan year (gain)/loss experience 1.579
Total plan year increase/(decrease) in UAL $3.063 Billion
See table on the following page for total gains/losses by class.

Actuarial Valuation as of July 1, 2017
Florida Retirement System Pension Plan Executive Summary
This work product was prepared solely for Florida Department of Management Services for the purposes described herein and may not be appropriate to use for other purposes. Milliman does not intend to benefit and assumes no duty or liability to other parties who receive this work. Milliman recommends that third parties be aided by their own actuary or other qualified professional when reviewing the Milliman work product.
7
2016-2017 Plan Year (Gain)/Loss Experience1
(All Amounts in Thousands)
Special Risk Senior
Regular Special Risk Administrative Judicial Leg-Atty-Cab Local Management Grand Total
Investment plan year (gain)/loss experience ($666,231) ($174,166) ($454) ($5,353) ($360) ($1,890) ($16,551) ($865,005)
Liability plan year (gain) / loss experience by source
Assumption changes 1,531,457 507,500 909 15,208 1,269 6,881 60,355 2,123,579
Plan Changes 0 84,998 0 0 0 0 0 84,998
Active member salary increases different than assumption (19,413) 202,953 (231) (12,730) (539) 1,972 9,285 181,297
New active Pension Plan members 2
388,688 106,897 2,474 3,286 492 3,341 16,402 521,580
Retirement and Drop Entry Behavior 523,891 240,797 132 4,887 1,179 1,923 14,778 787,587
Inactive Mortality 22,543 17,472 (1,376) (2,308) 434 2,106 7,054 45,925
Other demographic sources not noted above 3
(41,221) 26,995 1,031 (16,475) 678 7,696 64,027 42,731
Liability plan year (gain) / loss experience $2,405,945 $1,187,612 $2,939 ($8,132) $3,513 $23,919 $171,901 $3,787,697
Includes transfers and re-hires.
-- Elected Officers' Class --
For purposes of this exhibit, liabilities and assets associated with members in DROP are allocated to their respective membership classes. This differs from their representation in Section 4, where UAL bases are
tracked separately for the DROP.
Reflects the combined effects of all other liability (gain)/loss sources for actuarial demographic experience compared to assumptions used in the July 1, 2016 valuation. This includes the effects of second election
transfers to the Investment Plan and changes to census data reporting.

Actuarial Valuation as of July 1, 2017
Florida Retirement System Pension Plan Executive Summary
This work product was prepared solely for Florida Department of Management Services for the purposes described herein and may not be appropriate to use for other purposes. Milliman does not intend to benefit and assumes no duty or liability to other parties who receive this work. Milliman recommends that third parties be aided by their own actuary or other qualified professional when reviewing the Milliman work product.
8
4. Actuarially Calculated Contribution Rates:
On a level-rate-of-pay basis, the FRS Pension Plan employer contribution rates for each membership class changed as follows:
Special Special Risk Senior
Regular Risk Administrative Judicial Leg-Atty-Cab Local Management
A. 1. July 1, 2016 Employer Normal Cost 2.75% 11.57% 3.09% 11.73% 6.27% 8.37% 4.05%
2. UAL Cost 3.93% 11.42% 42.81% 28.75% 55.87% 49.25% 22.16%
3. Total July 1, 2016 Actuarially Calculated
Employer Contribution Rate (1.+2.) 6.68% 22.99% 45.90% 40.48% 62.14% 57.62% 26.21%
B. 1. July 1, 2017 Employer Normal Cost 2.91% 11.95% 3.05% 12.10% 6.58% 8.32% 4.27%
2. UAL Cost (See Table 4-11) 4.19% 12.44% 39.25% 29.83% 58.61% 52.90% 23.76%
3. Total July 1, 2017 Actuarially Calculated
Employer Contribution Rate (1.+2.) 7.10% 24.39% 42.30% 41.93% 65.19% 61.22% 28.03%
C. Change in Total Actuarially Calculated
Employer Contribution Rate (B.3.-A.3.) 0.42% 1.40% -3.60% 1.45% 3.05% 3.60% 1.82%
-- Elected Officers' Class --

Actuarial Valuation as of July 1, 2017
Florida Retirement System Pension Plan Executive Summary
This work product was prepared solely for Florida Department of Management Services for the purposes described herein and may not be appropriate to use for other purposes. Milliman does not intend to benefit and assumes no duty or liability to other parties who receive this work. Milliman recommends that third parties be aided by their own actuary or other qualified professional when reviewing the Milliman work product.
9
E. Graphs
Chart A: Assets / Liabilities
Chart B: Cash Flows
$0
$20
$40
$60
$80
$100
$120
$140
$160
$180
$200
Bil
lio
ns
Accumulated Benefit Obligation (ABO) Actuarial Liability AVA MVA
-$30
-$25
-$20
-$15
-$10
-$5
$0
$5
$10
$15
$20
$25
$30
Billi
on
s
Contributions Benefit Payments Investment Income (Market Value Basis)

Actuarial Valuation as of July 1, 2017
Florida Retirement System Pension Plan Executive Summary
This work product was prepared solely for Florida Department of Management Services for the purposes described herein and may not be appropriate to use for other purposes. Milliman does not intend to benefit and assumes no duty or liability to other parties who receive this work. Milliman recommends that third parties be aided by their own actuary or other qualified professional when reviewing the Milliman work product.
10
Chart C: Actuarially Calculated Pension Plan Contribution Rates1 (as % of Payroll)
Chart D: Actuarially Calculated vs. Legislated Employer Contribution Rates1 (as % of Payroll)
1 Charts C and D show the Pension Plan components of proposed contribution rates prior to blending with Investment Plan contribution rates to create proposed statutory contribution rates. Historically, the Florida Legislature has enacted contribution rates which are charged uniformly on combined Investment Plan and Pension Plan payroll. Charts C and D reflect the Pension Plan component of proposed blended statutory rates, consistent with Table 4-12.
0%
2%
4%
6%
8%
10%
12%
14%
16%
Rates Developed in July 1 Valuation of Year Shown(2010 Adjusted to Reflect Legislated Benefit Changes
and Introduction of Employee Contribution)
Normal Cost Rate UAL Rate Employee Contribution Rate
0%
4%
8%
12%
16%
2009-2010
2010-2011
2011-2012
2012-2013
2013-2014
2014-2015
2015-2016
2016-2017
2017-2018
2018-2019
NC Rate UAL Rate Employee Contribution Rate Legislated Employer Contribution Rate

Actuarial Valuation as of July 1, 2017
Florida Retirement System Pension Plan Executive Summary
This work product was prepared solely for Florida Department of Management Services for the purposes described herein and may not be appropriate to use for other purposes. Milliman does not intend to benefit and assumes no duty or liability to other parties who receive this work. Milliman recommends that third parties be aided by their own actuary or other qualified professional when reviewing the Milliman work product.
11
F. Summary Comments
We caution that the results herein are applicable only for the next plan year. More than anything, actual future
investment results will impact long-term future contribution rates. The investment return assumption selected
affects the timing and pattern of contributions but does not affect the long-term cost of the plan, which is governed
by the Fundamental Cost Equation [Benefit Payments + Expenses = Contributions + Actual Investment Returns].
The most recent experience study covered the period from July 1, 2008 to June 30, 2013. Experience studies
are performed every five years and compare actual plan experience to the assumptions used in the annual
valuations. With the exceptions noted below, this valuation reflects the method and assumptions changes
proposed by the 2014 Experience Study and first adopted by the 2014 FRS Actuarial Assumption Conference
for use in the July 1, 2014 valuation.
Subsequent FRS Assumption Conferences may, at the discretion of the Conference Principals, consider
changes to items such as the investment return assumption, the cost allocation method, or modifications to
other assumptions and methods. For this valuation, the 2017 FRS Assumption Conference decreased the
investment return assumption to better anticipate expected future experience.
Future proposed blended statutory rates for the System will be impacted by choice elections for the defined
contribution FRS Investment Plan (IP), which is available as an alternative to the defined benefit FRS Pension
Plan for members. The existence of the IP affects the FRS Pension Plan contribution rates insomuch as active
members can elect to participate in either the FRS Pension Plan or the IP. Thus, member plan election decisions
can affect the demographic composition of the FRS Pension Plan. Current IP membership is between 18% and
19% of total active membership on a headcount basis.
We mention these caveats because the actuarial valuation process merely measures the impact of these factors
on FRS Pension Plan costs and liabilities after they have occurred. Unanticipated benefit or salary changes,
changes in member behavior (e.g., withdrawal rates, rates of retirement, etc.), or variations in actual investment
return could necessitate changes in the actuarially calculated contribution rates.
Finally, we caution the readers of this report not to overemphasize the results of any single valuation as long-term
trends are more important.
G. DROP Contribution Rate
The DROP (Deferred Retirement Option Program) started in 1998, with a study completed prior to the DROP’s
implementation showing an anticipated material cost increase due to its introduction. Since its introduction and
consistent with legislative directive, employers have been charged a uniform DROP contribution rate on all DROP
payroll without regard to a participant’s membership class. In addition, the asset allocation developed in Table 2-5
is performed so that the DROP’s funded percentage is set equal to the composite funded percentage of the FRS
Pension Plan.
The DROP contribution rate has two components: Normal Cost and UAL Cost. The Normal Cost is set to the
composite FRS Pension Plan average employer-paid Normal Cost Rate of 4.41%. The calculation of the UAL
Cost for the DROP is consistent with the calculation of the UAL Cost component of the other membership
classes. Essentially, the DROP is allocated a share of plan assets such that the DROP’s funded percentage is
equal to the composite FRS Pension Plan’s funded percentage. This asset allocation to DROP results in a UAL
Cost for DROP payroll of 7.96%. The total DROP contribution rate (Normal Cost plus UAL Cost) in this valuation
is 12.37%, compared to a DROP contribution rate of 11.60% in the prior valuation.

Actuarial Valuation as of July 1, 2017
Florida Retirement System Pension Plan Assets
This work product was prepared solely for Florida Department of Management Services for the purposes described herein and may not be appropriate to use for other purposes. Milliman does not intend to benefit and assumes no duty or liability to other parties who receive this work. Milliman recommends that third parties be aided by their own actuary or other qualified professional when reviewing the Milliman work product.
12
2. Assets
In many respects, an actuarial valuation can be considered similar to an inventory process. The inventory is taken
annually as of the actuarial valuation date, which for this valuation is July 1, 2017. On that date the assets
available for the payment of current and future benefits are appraised. These assets are compared with the
inventory of Actuarial Liability. This inventory process leads to a method of calculating what contributions by
members and/or their employers are needed to systematically eliminate any shortfall if future experience follows
assumptions. Prior to publication of this report, preliminary results based on assumptions and methods used in
the previous valuation were discussed with the 2017 FRS Actuarial Assumption Conference.
This section of the report deals with the asset determination. In the next section, the Actuarial Liability will be
discussed. Section 4 will deal with the process for determining actuarially calculated contribution rates in order to
systematically eliminate any shortfall between the assets and Actuarial Liability.
Two measures of FRS Pension Plan assets are presented in the valuation:
1. The Market Value of Assets (MVA) provides the most accurate fair market “snapshot date” assessment of
plan resources at a given date, and will be used on the balance sheet statements of position for the FRS
Pension Plan and its participating employers for GASB financial reporting purposes.1 It tends to be the
more volatile of the two asset measures and is not used for determining the actuarially calculated
contribution rates.
2. The Actuarial Value of Assets (AVA) is a second measure of FRS Pension Plan asset holdings. It is
related to the Market Value of Assets, but uses a smoothing technique applied to mitigate year-to-year
market fluctuations by recognizing actual single year investment returns different from the long-term
assumption systematically over a multi-year period. The AVA is the basis for determining actuarially
calculated contribution rates, and the smoothing technique is used to stabilize year-to-year contribution
rate changes.
The actuarial smoothed asset valuation measure, implemented in 1989, reflects a five-year averaging
methodology, as required by Section 121.031(3)(a) of Florida Statutes. Under this method, the expected actuarial
value of assets is determined by crediting the rate of investment return assumed in the prior valuation (7.60%) to
the prior year’s AVA. Then, 20% of the difference between the actual market value and the expected actuarial
value of assets is immediately recognized in the AVA. The AVA is also restricted by a 20% corridor around the
MVA, so that the AVA cannot be greater than 120% or less than 80% of the MVA. Table 2-3 presents the details
of this calculation. As of July 1, 2017 the AVA is 97.8% of the MVA.
Six tables are presented in this section, summarizing the financial resources of the FRS Pension Plan on July 1,
2017. Table 2-1 shows the reconciliation of valuation assets from June 30, 2016 to June 30, 2017. The assets are
presented by category in Table 2-2. Table 2-3 provides a detailed development of the July 1, 2017 Actuarial Value
of Assets. In Table 2-4, the AVA is initially allocated to each membership class, based on estimated cash flows.
The table also shows the allocation of assets to/from the various classes from/to the DROP. Table 2-5 shows the
derivation of the allocation of assets to/from the DROP in order that the DROP’s funded percentage is equal to
the funded percentage of the FRS Pension Plan as a whole. Finally, Table 2-6 presents rates of return for the
2016-2017 plan year and the two prior plan years.
1 The financial reporting information under GASB 67 requirements is issued under separate cover and uses an investment return assumption and a cost allocation method different from that used in this valuation report, which is for the purpose of developing actuarially determined contribution rates.

Actuarial Valuation as of July 1, 2017
Florida Retirement System Pension Plan Assets
This work product was prepared solely for Florida Department of Management Services for the purposes described herein and may not be appropriate to use for other purposes. Milliman does not intend to benefit and assumes no duty or liability to other parties who receive this work. Milliman recommends that third parties be aided by their own actuary or other qualified professional when reviewing the Milliman work product.
13
The Market Value of Assets as of July 1, 2017 was based on information furnished to us by the Division of
Retirement, Florida Department of Management Services. The values have been accepted for use in this report
without audit but have been reviewed for consistency and reasonableness, when compared to prior reports.
Table 2-1
Florida Retirement System
Reconciliation of Market Value of Assets Used for Valuation
DB Plan Trust
Market Value of Assets for Actuarial Valuation as of June 30, 2016 $141,780,920,515
Adjustment for Contribution Clearing Trust -
Contributions by Source:
Pension Contributions - Employer 2,603,246,196
Pension Contributions - Employees 737,776,492
Transfers from IP - Second Elections 71,109,940
Purchase of Time by Employees 7,062,918
Investment Income
Interest Income 683,643,798
Dividend Income 1,790,068,722
Real Estate Income 469,305,831
Securities Lending income 63,625,418
Other 2,186,430,639
Less Investment Activity Expense (571,859,418)
Less Securities Lending Expense (14,200,232)
Other Income 2,484,714
Net Realized and Unrealized Appreciation 14,192,417,076
Pension Payments1
(9,348,035,738)
Contribution Refunds (13,481,914)
Disbursements to IP - Second Elections (568,911,732)
Administrative Expenses (18,340,257)
Market Value of Assets for Actuarial Valuation as of June 30, 2017 $154,053,262,968
1Includes Accrued DROP Liability of $216,703,029 representing single sum DROP benefits
of members who retired from DROP on or before June 30, 2017.

Actuarial Valuation as of July 1, 2017
Florida Retirement System Pension Plan Assets
This work product was prepared solely for Florida Department of Management Services for the purposes described herein and may not be appropriate to use for other purposes. Milliman does not intend to benefit and assumes no duty or liability to other parties who receive this work. Milliman recommends that third parties be aided by their own actuary or other qualified professional when reviewing the Milliman work product.
14
Table 2-2
Florida Retirement System Pension Plan
Summary of Market Value of Assets for Actuarial Valuation
(by Asset Category; $ in Thousands)
Market Value as of July 1,
2016 2017
$137,044 $130,731
1,994 60,429
$139,038 $191,161
$775,062 $800,169
11,074,341 10,910,710
7,725,369 8,418,178
3,516,125 4,050,193
38,673 17,211
850,000 750,000
1,717,406 1,952,266
6,593,710 6,859,418
10,581,549 10,984,655
5,452,110 7,911,256
1,097 16,867
41,029,902 45,250,543
22,440,286 24,004,242
31,814,912 34,509,635
$143,610,542 $156,435,345
155,931 189,586
1,499,740 1,221,252
4,040,803 4,510,179
1,031,730 855,430
$6,728,204 $6,776,447
$1,915,672 $1,289,852
Prepaid items; Furniture & Equipment net Accumulated Depreciation 8,139 8,145
Total Assets $152,401,595 $164,700,949
411,260 216,703
1,960,173 1,328,234
3,168,482 3,701,087
4,008,032 4,494,948
1,072,727 906,714
Total Liabilities $10,620,674 $10,647,686
$141,780,921 $154,053,263
1Amounts shown in exhibit are rounded to the nearest thousand. As such, sums may differ from amounts
displayed due to rounding.2
Per our understanding, the accrued DROP liability represents lump sum DROP exit payments made early in
the subsequent plan year for members exiting the DROP on or shortly before the asset measurement date.
Other Liabilities and Payables
FIDUCIARY NET POSITION
Held in trust for pension benefits
Pending Investment Purchases
Forward Contracts payable
Obligations under Security Lending Agreements
LIABILITIES
Accrued DROP liability 2
Other Receivables
Total receivables
Security Lending Collateral
Pending Investment Sales
Forward Contracts receivable
Receivables:
Contributions receivable
Short Term Investment Funds
Domestic Equity / Domestic Equity Commingled
Alternative Investment
International Equity
Total Investments
Repurchase Agreements
International Bonds and Notes
Bonds and Notes
Real Estate Contracts
International Equity Commingled
Certificates of Deposit
U.S. Government and Federally Guaranteed Obligations
Federal Agencies
Commercial Paper
Other Investments
ASSETS
Cash and cash equivalents
State Treasury Investment Pool
Total cash and cash equivalents
Investments:

Actuarial Valuation as of July 1, 2017
Florida Retirement System Pension Plan Assets
This work product was prepared solely for Florida Department of Management Services for the purposes described herein and may not be appropriate to use for other purposes. Milliman does not intend to benefit and assumes no duty or liability to other parties who receive this work. Milliman recommends that third parties be aided by their own actuary or other qualified professional when reviewing the Milliman work product.
15
Table 2-3
Florida Retirement System Pension Plan
Development of 2017 Actuarial Value of Assets
1. FRS Market Value of Assets on June 30, 2016 for Actuarial Valuation $141,780,920,515
2. Actuarial Value of Assets on July 1, 2016 $145,451,612,486
3. 2016/2017 Net Cash Flow
(Contributions less Benefits and Expenses) ($6,529,574,095)
4. Preliminary Actuarial Value of Assets, July 1, 2017, if $149,728,237,124
Items 2 and 3 earned an assumed rate of 7.60%
5. Market Value of Assets, June 30, 2017 for Actuarial Valuation $154,053,262,968
6. Net Assets (Actuarial Value Basis) Available for
Benefits Prior to Application of 80%/20% Corridor
4 + ((5 - 4) x 20%) $150,593,242,293
7. 120% of Market Value
[120% (5)] $184,863,915,562
8. 80% of Market Value
[80% (5)] $123,242,610,375
9. Actuarial Value of Assets on July 1, 2017
Lesser of (6) and (7), but not less than (8) $150,593,242,293
10. Ratio of July 1, 2017 Actuarial Value of Assets to
Market Value on June 30, 2017 for Actuarial Valuation 97.75%

Actuarial Valuation as of July 1, 2017
Florida Retirement System Pension Plan Assets
This work product was prepared solely for Florida Department of Management Services for the purposes described herein and may not be appropriate to use for other purposes. Milliman does not intend to benefit and assumes no duty or liability to other parties who receive this work. Milliman recommends that third parties be aided by their own actuary or other qualified professional when reviewing the Milliman work product.
16
Table 2-4
Florida Retirement System Pension Plan
Development of Actuarial Value of Assets
by Membership Class
($ in Thousands)
Special Risk -- Elected Officers' Class -- Senior Total
Regular Special Risk Administrative Judicial Leg-Atty-Cab Local Management DROP System
1. Allocated Actuarial Value of Assets
by Class, July 1, 2016 $102,895,674 $26,333,344 $72,623 $824,375 $57,569 $306,180 $2,523,558 $12,438,289 $145,451,612
2. Total Contribution for the Plan Year 1,914,521 981,384 1,005 43,139 3,135 21,035 135,768 319,209 3,419,196
3. Benefit Payments and other Disbursements (7,083,078) (1,724,094) (7,311) (79,710) (7,913) (50,208) (224,802) (771,655) (9,948,771)
4. Allocated Investment Earnings on AVA Basis 8,233,919 2,131,054 5,702 66,166 4,529 23,936 203,489 1,002,410 11,671,205
5. Unadjusted Actuarial Value of Assets
(1) + (2) + (3) + (4) 105,961,036 27,721,688 72,019 853,970 57,320 300,943 2,638,013 12,988,253 150,593,242
6. Net Reallocation (see Table 2-5) (202,680) (74,287) (26) (4,225) (216) (903) (10,606) 292,943 0
7. Allocated Actuarial Value of Assets
by Class, July 1, 2017: (5) + (6) $105,758,356 $27,647,401 $71,993 $849,745 $57,104 $300,040 $2,627,407 $13,281,196 $150,593,242

Actuarial Valuation as of July 1, 2017
Florida Retirement System Pension Plan Assets
This work product was prepared solely for Florida Department of Management Services for the purposes described herein and may not be appropriate to use for other purposes. Milliman does not intend to benefit and assumes no duty or liability to other parties who receive this work. Milliman recommends that third parties be aided by their own actuary or other qualified professional when reviewing the Milliman work product.
17
Table 2-5
Florida Retirement System Pension Plan
Reallocation of Actuarial Value of Assets
by Membership Class
($ in Thousands)
Special Risk -- Elected Officers' Class -- Senior Total
Regular Special Risk Administrative Judicial Leg-Atty-Cab Local Management DROP System
1. Actuarial Accrued Liability, July 1, 2017 $15,749,075 $178,579,116
2. Unadjusted Actuarial Value of Assets, July 1, 2017 prior to reallocation 12,988,253 150,593,242
3. Unfunded Actuarial Liability (UAL): (1) - (2) $2,760,822 $27,985,874
4. Aggregate Funded Percentage: (2) / (1) 82.47% 84.33%
5. DROP Assets Required to Meet Aggregate Funded
Percentage: (1) x (4) [Total System] - (2) $292,943
6. Proportion of DROP Liability by Class 0.6919 0.2536 0.0001 0.0144 0.0007 0.0031 0.0362 N/A 1.0000
7. Assets to be Reallocated ($202,680) ($74,287) ($26) ($4,225) ($216) ($903) ($10,606) $292,943 $0

Actuarial Valuation as of July 1, 2017
Florida Retirement System Pension Plan Assets
This work product was prepared solely for Florida Department of Management Services for the purposes described herein and may not be appropriate to use for other purposes. Milliman does not intend to benefit and assumes no duty or liability to other parties who receive this work. Milliman recommends that third parties be aided by their own actuary or other qualified professional when reviewing the Milliman work product.
18
Table 2-6
Florida Retirement System Pension Plan
Rates of Return on Investments
(Assumes net cash flow occurs mid-year)
Asset Bases 2014/2015 2015/2016 2016/2017
Market Value 3.76% 0.54% 13.57%
Actuarial Value 8.62% 6.99% 8.21%
Rates of Return

Actuarial Valuation as of July 1, 2017
Florida Retirement System Pension Plan Liabilities
This work product was prepared solely for Florida Department of Management Services for the purposes described herein and may not be appropriate to use for other purposes. Milliman does not intend to benefit and assumes no duty or liability to other parties who receive this work. Milliman recommends that third parties be aided by their own actuary or other qualified professional when reviewing the Milliman work product.
19
3. Liabilities
In the previous section, an actuarial valuation was compared to an inventory process, and an analysis was given
of the inventory of assets of the FRS Pension Plan as of the valuation date, July 1, 2017. In this section, the
discussion will focus on the future benefit commitments of the FRS Pension Plan, which will be referred to as its
Actuarial Liability. In Section 5 other liability measures are presented based on accounting principles of the
Financial Accounting Standards Board (FASB). Calculations required by the Governmental Accounting Standards
Board (GASB) are developed and issued as part of a separate report. It is important to note that the accounting
liabilities shown in Section 5 of this report and in the separate GASB report are for informational disclosure and
comparison purposes, while the Actuarial Liability calculated in this section is used for determining the FRS
Pension Plan actuarially calculated contribution rates prior to blending with FRS Investment Plan contribution
rates to create blended proposed statutory rates.
A fundamental principle in financing a retirement program is that the projected cost of retirement benefits should
be accrued during the period in which service is performed, rather than during the post-retirement period of
benefit distribution. There are several methods that can be used in making such an allocation.
Consistent with the previous valuation’s methodology and with preliminary 2017 valuation results discussed in
October with the 2017 FRS Actuarial Assumption Conference, the Pension Plan’s Normal Cost and Actuarial
Liability are calculated using the Ultimate Entry Age Normal (Ultimate EAN) actuarial cost allocation method. The
actuarial cost method used does not affect the calculation of overall projected Pension Plan benefits (Present
Value of Benefits), but it does affect the allocation of those benefits over a member’s projected working career
between past (Actuarial Liability), current year (Normal Cost) and all future year projected (Present Value of
Future Normal Costs) service. The Present Value of Benefits is equal to the sum of the Actuarial Liability and the
Present Value of Future Normal Costs.
For a system such as the FRS Pension Plan with two membership tiers, Ultimate EAN calculates the Normal Cost
allocation for individual members as if each member participates in the tier available to new hires for his or her full
working career. For members in Tier I, this means the Normal Cost under the Ultimate EAN method will be based
on the benefit and retirement eligibility provisions of Tier II. Because Tier II results in lower expected benefit
payments than under Tier I, the calculated Normal Cost Rate is lower than it would be if the plan provisions
specific to the member’s actual tier were used by the actuarial cost allocation method.
The actuarial cost allocation method does not affect the calculation of the Present Value of Benefits, which is
based on the plan provisions specific to each member’s enrollment date. The Actuarial Liability is the Present
Value of Benefits minus the Present Value of Future Normal Costs. Thus, the Ultimate EAN method used in this
valuation leads to a lower Normal Cost Rate and a higher Actuarial Liability for Tier I members than would be
calculated under a method that based the Normal Costs of Tier I members on the Tier I benefit plan provisions.
The difference between the Actuarial Liability and the Actuarial Value of Assets accumulated as of the actuarial
valuation date is referred to as the Unfunded Actuarial Liability (UAL). (If the difference is negative, the excess of
the funds accumulated over the liabilities may be referred to as the surplus.) The UAL Contribution Rate is
calculated in a manner such that the UAL will fully amortize in accordance with the schedules in Section 4 of this
report if actual future experience follows the assumptions used in the valuation and contributions are made each
year at levels equal to actuarially calculated contribution rates.
Please note that GASB Statements Nos. 67 & 68 do not permit the use of the Ultimate EAN cost allocation
method for accounting calculations. The Ultimate EAN method and the GASB 67 & 68 mandated variation of
Entry Age Normal (Individual EAN) will produce different Actuarial Liability and Normal Cost Rate results.
Determining which EAN methodology (Ultimate or Individual) generates higher current contribution rates depends

Actuarial Valuation as of July 1, 2017
Florida Retirement System Pension Plan Liabilities
This work product was prepared solely for Florida Department of Management Services for the purposes described herein and may not be appropriate to use for other purposes. Milliman does not intend to benefit and assumes no duty or liability to other parties who receive this work. Milliman recommends that third parties be aided by their own actuary or other qualified professional when reviewing the Milliman work product.
20
on the period used to amortize the UAL. For the FRS Pension Plan, the amortization periods used in this report’s
contribution rate calculation methodology will lead to the Ultimate EAN methodology having lower current
calculated contribution rates than the Individual EAN methodology. As the number of Tier I active participants
decreases, the Individual EAN Normal Cost Rate would trend downward toward the Tier II Normal Cost Rate.
When all Tier I active participants have left the workforce, the Normal Cost Rates of the two variations will
converge.
The UAL will grow with interest and Normal Cost while contributions will reduce it.
Benefit improvements, actuarial gains and losses (variations in investment results and demographic changes from
assumption), and changes in actuarial assumptions and methods will also have an effect on the Actuarial Liability
and on the UAL.
After the amount of the UAL has been determined, as part of the rate calculation methodology used in the
previous valuation and in preliminary 2017 valuation results discussed with the 2017 FRS Actuarial Assumption
Conference, the actuarially calculated contribution rates include a component for the amortization of the UAL. A
schedule of contributions is established to amortize the UAL. In Section 4 of the report, we discuss the
contribution schedules in detail.
Table 3-1 contains a breakdown of the Actuarial Liabilities and Unfunded Actuarial Liabilities in the FRS Pension
Plan for the 2016 valuation and the 2017 valuation. In Table 3-2, the 2017 liabilities are shown for each
membership class.
Legislation enacted in 2001 “walls off,” for 25 years, the actuarial gains arising from former FRS Pension Plan
participants electing to participate in the FRS Investment Plan. The “walled off” amount is called the contingent
liability. The Actuarial Liabilities generally do not include the contingent liability. However, surplus, if any, used for
contribution rate reductions is net of the contingent liability. Table 3-3 shows the contingent liability and the
number of current active participants, by class, who elected to transfer from the FRS Pension Plan to the FRS
Investment Plan during the original 2002-2003 election periods available to FRS Pension Plan members who
were active when the Investment Plan first became available for participation.

Actuarial Valuation as of July 1, 2017
Florida Retirement System Pension Plan Liabilities
This work product was prepared solely for Florida Department of Management Services for the purposes described herein and may not be appropriate to use for other purposes. Milliman does not intend to benefit and assumes no duty or liability to other parties who receive this work. Milliman recommends that third parties be aided by their own actuary or other qualified professional when reviewing the Milliman work product.
21
Table 3-1
Florida Retirement System Pension Plan
Actuarial Liabilities
($ in Thousands)
July 1, 2016 July 1, 2017
Valuation Valuation
1. Actuarial Liabilities for:
(a) Active Members $54,444,492 $56,093,533
(b) Retired, Disabled and Beneficiary Members 96,445,460 101,665,423
(c) Terminated Vested Members 4,914,799 5,071,085
(d) DROP 14,569,858 15,749,075
2. Total Actuarial Liability $170,374,609 $178,579,116
3. Actuarial Value of Assets $145,451,612 $150,593,242
4. Unfunded Actuarial Liability / (Surplus) $24,922,997 $27,985,874
5. Investment Plan Contingent Liability 1
$231,815 $229,415
6. Surplus Available for Rate Reduction $0 $0
1 See Table 3-3.

Actuarial Valuation as of July 1, 2017
Florida Retirement System Pension Plan Liabilities
This work product was prepared solely for Florida Department of Management Services for the purposes described herein and may not be appropriate to use for other purposes. Milliman does not intend to benefit and assumes no duty or liability to other parties who receive this work. Milliman recommends that third parties be aided by their own actuary or other qualified professional when reviewing the Milliman work product.
22
Table 3-2
Florida Retirement System Pension Plan
Actuarial Liabilities by Membership Class
July 1, 2017
($ in Thousands)
Special Risk -- Elected Officers' Class -- Senior Total
Regular Special Risk Administrative Judicial Leg-Atty-Cab Local Management DROP System
1. Present Value of Benefits for:
a. Active Members $49,848,668 $20,019,074 $14,398 $532,407 $26,375 $180,955 $1,952,869 $0 $72,574,746
b. Retired, Disabled and Beneficiary Members 76,841,026 20,508,389 74,711 881,630 87,734 499,000 2,772,933 15,749,075 117,414,498
c. Terminated Vested Members 4,208,360 656,240 1,402 19,053 8,312 18,121 159,597 0 5,071,085
d. Total Present Value of Benefits (a)+(b)+(c) 130,898,054 41,183,703 90,511 1,433,090 122,421 698,076 4,885,399 15,749,075 195,060,329
2. Present Value of Future Normal Cost (Actives): $9,782,228 $6,252,796 $1,599 $114,161 $3,585 $29,335 $297,509 $0 $16,481,213
3. Actuarial Liabilities for:
a. Active Members (1a) - (2) $40,066,440 $13,766,278 $12,799 $418,246 $22,790 $151,620 $1,655,360 $0 $56,093,533
b. Retired, Disabled and Beneficiary Members (1b) 76,841,026 20,508,389 74,711 881,630 87,734 499,000 2,772,933 15,749,075 117,414,498
c. Terminated Vested Members (1c) 4,208,360 656,240 1,402 19,053 8,312 18,121 159,597 0 5,071,085
d. Total Actuarial Liability (a)+(b)+(c) $121,115,826 $34,930,907 $88,912 $1,318,929 $118,836 $668,741 $4,587,890 $15,749,075 $178,579,116
4. Actuarial Value of Assets $105,758,356 $27,647,401 $71,993 $849,745 $57,104 $300,040 $2,627,407 $13,281,196 $150,593,242
5. Unfunded Actuarial Liability / (Surplus) $15,357,470 $7,283,506 $16,919 $469,184 $61,732 $368,701 $1,960,483 $2,467,879 ¹ $27,985,874
6. Present Value of Future Pay $170,754,668 $42,499,913 $24,651 $767,098 $39,012 $266,455 $4,154,265 $0 $218,506,062
¹ This is a bookkeeping item. DROP liabilities include the total present value of benefits to all members currently in DROP. When a member leaves DROP, their liability is transferred to
the class of membership from which they retired.

Actuarial Valuation as of July 1, 2017
Florida Retirement System Pension Plan Liabilities
This work product was prepared solely for Florida Department of Management Services for the purposes described herein and may not be appropriate to use for other purposes. Milliman does not intend to benefit and assumes no duty or liability to other parties who receive this work. Milliman recommends that third parties be aided by their own actuary or other qualified professional when reviewing the Milliman work product.
23
Table 3-3
Florida Retirement System Investment Plan
Contingent Actuarial Liabilities
July 1, 2017
($ in Thousands)
Special Risk -- Elected Officers' Class -- Senior Total
Regular Special Risk Administrative Judicial Leg-Atty-Cab Local Management DROP System
As of July 1, 2016
Contingent Liability $213,212 $9,007 ($32) ($704) $162 $109 $10,061 NA $231,815
Participant Counts 5,665 159 1 4 3 8 144 NA 5,984
As of July 1, 2017
Contingent Liability 1 & 2
$211,435 $8,960 ($34) ($758) $116 $73 $9,623 NA $229,415
Participant Counts 5,221 147 1 4 2 5 128 NA 5,508
1The contingent liability is not included in the actuarial liabilities of FRS and is removed from the surplus.
2The contingent liability as of July 1, 2017 is calculated as the July 1, 2003 contingent liability increased by 14 years of interest,
adjusted for the proportion of original transfers remaining in the Investment Plan.

Actuarial Valuation as of July 1, 2017
Florida Retirement System Pension Plan Contributions
This work product was prepared solely for Florida Department of Management Services for the purposes described herein and may not be appropriate to use for other purposes. Milliman does not intend to benefit and assumes no duty or liability to other parties who receive this work. Milliman recommends that third parties be aided by their own actuary or other qualified professional when reviewing the Milliman work product.
24
4. Contributions
Differences between the Actuarial Liabilities and the assets can be made up through (1) future contributions in
excess of the Normal Costs to amortize the shortfall and/or (2) actual future investment returns in excess of
assumed returns. An actuarial valuation sets out a schedule of future contributions that will fully amortize the
Unfunded Actuarial Liability (UAL) in a systematic manner if future experience follows the assumptions. By
contrast, in prior years when the FRS Pension Plan had an actuarial surplus, legislated contribution rates were
generally below the Normal Cost Rate. In this section we develop and present the FRS Pension Plan contribution
rates proposed to be effective for the Plan Year beginning July 1, 2018 based on the July 1, 2017 membership
data. Under separate cover, the FRS Pension Plan contribution rates calculated in this valuation are blended with
contribution rates for the FRS Investment Plan to develop proposed blended statutory contribution rates for the
Plan Year beginning July 1, 2018.
First, we present a description of the actuarial method used to determine the actuarially calculated FRS Pension
Plan contribution rates for the 2018-2019 plan year. This is followed by a series of tables presenting the details of
our calculations.
A. Funding Methods
The actuarial cost method used to determine the pattern of future contributions is called the Ultimate Entry Age
Normal (Ultimate EAN) actuarial cost allocation method. Under this method (as is the case for most actuarial cost
allocation methods), the contribution rates calculated have two components:
Normal Cost Rate
UAL Contribution Rate, which amortizes the UAL if future experience follows assumptions.
These components are described in more detail below.
1. Normal Cost Rate
Under the Ultimate EAN method, the Normal Cost Rate is that level percentage of pay which would fully fund a
member's benefit at retirement, if paid from the year of entry (i.e., "entry age") to the year of retirement if future
experience were to exactly match the actuarial assumptions. For a system such as the FRS Pension Plan with
two membership tiers, Ultimate EAN determines the Normal Cost allocation for individual members as if each
member participates in the tier available to new hires for his or her full working career. For members in Tier I, this
means the Normal Cost Rate under the Ultimate EAN method will be based on the benefit and retirement
eligibility provisions of Tier II. Because Tier II results in lower expected benefits than under Tier I, the calculated
Normal Cost Rate is lower than it would be if the plan provisions specific to the member’s actual tier were used.
This lower Normal Cost Rate leads to a higher Actuarial Liability, all else equal, as is discussed below.
We have determined the Normal Cost Rates for the FRS Pension Plan separately by membership class and type
of benefit (e.g., retirement, disability). These are summarized in Table 4-1.
2. UAL (Unfunded Actuarial Liability) Contribution Rate
The Actuarial Liability is the difference between the Present Value of Projected Benefits (PVB) and the Present
Value of Future Normal Costs (PVFNC). Because the Ultimate EAN cost allocation method produces lower
Normal Costs than would be determined if each individual’s tier-specific benefit and retirement eligibility
provisions were used, the Actuarial Liability is higher under Ultimate EAN than it would be if the cost allocation
method used tier-specific plan provisions applicable to each member.

Actuarial Valuation as of July 1, 2017
Florida Retirement System Pension Plan Contributions
This work product was prepared solely for Florida Department of Management Services for the purposes described herein and may not be appropriate to use for other purposes. Milliman does not intend to benefit and assumes no duty or liability to other parties who receive this work. Milliman recommends that third parties be aided by their own actuary or other qualified professional when reviewing the Milliman work product.
25
The term "fully funded" is often applied to a system where contributions at the Normal Cost Rate are projected to
be completely adequate to fully fund the projected future benefits of all existing members if future experience
follows assumptions. Currently, most systems are not fully funded. This can be because contributions for the
estimated value of benefits earned in a year have not been fully made, benefit improvements for past service are
granted but then are funded gradually over future years, or actual experience has not been as favorable as
assumed. Under these circumstances, a UAL exists. For the FRS Pension Plan, there has been a UAL for every
valuation since the July 1, 2009 valuation. Prior to that time, the Actuarial Value of Assets exceeded the Actuarial
Liability for the valuations from 1998 through 2008 and no UAL existed in those valuations.
Tables 4-2 through 4-10 show how the UAL contribution rates were derived for the FRS Pension Plan. Table 4-2
shows the calculations on a composite basis, while Tables 4-3 through 4-10 show the calculations for each
individual membership class and sub-class and for the DROP.
As part of the funding policy selected by the Florida Legislature, the actuarially calculated contribution rate is
based on a “layered” approach that includes closed 30-year charge and credit bases for the amortization of the
UAL. Starting in the 1998 actuarial valuation, the Legislature required all UAL bases in existence at that time to be
considered fully amortized, since the Plan was in a surplus position. Since then, new amortization bases were
created whenever there were changes in plan provisions or changes in assumptions pursuant to an experience
study or other action by the FRS Assumptions Conference to modify actuarial assumptions or methods. Since a
UAL currently exists, all experience gains and losses are also subject to amortization. In this valuation, we show
the amortization base of each plan/assumption change since 1998 and amortization bases for experience
gains/losses starting in 2009. The plan changes include those attributable to House Bill 479 in 2009 (enacted,
effective July 1, 2010), Senate Bill 2100 in 2011, and Senate Bill 7012 in 2016.
For a given base of UAL amortization, annual amortization payments in non-inflation-adjusted dollars are
calculated as increasing by 3.25% per year (“level percent of projected payroll amortization”), consistent with the
valuation’s long-term annual payroll growth assumption as adopted by the FRS Actuarial Assumptions
Conference. If future experience follows the actuarial assumptions, this should result in amortization payments
that align with the assumed growth in overall compensation. Please note that with the current closed amortization
periods of 30 years, amortization payments will not be large enough to cover interest on the UAL for several
years, which means that as a dollar amount the UAL for each amortization base is expected to grow for a period
of time subsequent to its establishment. Under current assumptions, the expected UAL for a newly established
amortization base will grow until the amortization period is down to 18 years remaining. After that time, the
amortization payments will be large enough that the amortization payments will cover both interest and principal,
and the UAL as a dollar amount will be projected to decrease in each subsequent year. After approximately
20 years, the unamortized balance for the base will be approximately at the same level (in non-inflation-adjusted
dollars) as the initial amount of the base.
The benefit changes effective in 2011 legislated by Senate Bill 2100 reduced the Normal Cost, PVFNC, and the
PVB for current and future active members. All members initially enrolled before July 1, 2011 (Tier I) will continue
to earn benefits at levels greater than those annually earned by members initially enrolled on or after July 1, 2011
(Tier II). While the base benefits are higher for Tier I members than Tier II members, the projected benefit levels
for Tier I members are decreased from what they would have been absent Senate Bill 2100, due to the
determination of the annual COLA percentage being based on the ratio of pre-July 2011 service to total service.
As noted on the prior page, the Actuarial Liability is defined as PVB less PVFNC. For some membership classes
the decrease in the PVFNC from Senate Bill 2100 was larger than the decrease in the PVB, resulting in an
increase in an Actuarial Liability. For the remaining membership classes, the decrease in the PVFNC from Senate
Bill 2100 was smaller than the decrease in the PVB, resulting in a decrease in the Actuarial Liability. The variation
is due to the different demographics, benefit multipliers and unique interrelation of the modified benefit provisions

Actuarial Valuation as of July 1, 2017
Florida Retirement System Pension Plan Contributions
This work product was prepared solely for Florida Department of Management Services for the purposes described herein and may not be appropriate to use for other purposes. Milliman does not intend to benefit and assumes no duty or liability to other parties who receive this work. Milliman recommends that third parties be aided by their own actuary or other qualified professional when reviewing the Milliman work product.
26
of each membership class. The PVB will be lower in future valuations than it would have been had Senate
Bill 2100 not been adopted.
B. Employer Contribution Rates
Table 4-11 presents the actuarially calculated 2018-2019 employer contribution rates for the FRS Pension Plan
prior to blending with FRS Investment Plan contribution rates to create 2018-2019 blended proposed statutory
rates.
The reader should note that the payroll base for UAL Cost contributions is larger than the payroll base for Normal
Cost contributions. Florida Statute requires the employers of certain defined contribution program participants to
make UAL Cost contributions based on their payroll. The payroll base for UAL Cost contributions includes
approximately $3.2 billion of payroll for employees who are not currently participating in the FRS Pension Plan or
the FRS Investment Plan. Thus, the total contribution shown is an arithmetic sum, but the actual contribution
percentages will be determined on a blended rate basis so that employers pay the same contribution rate for FRS
Pension Plan members and FRS Investment Plan members.
Table 4-12 compares the legislated employer contribution rates to those calculated in the actuarial valuations for
the prior plan years. The legislated rates for the 2014-2015 through 2017-2018 plan years were the same as the
actuarially calculated rates in the 2013 through 2016 actuarial valuations, respectively.

Actuarial Valuation as of July 1, 2017
Florida Retirement System Pension Plan Contributions
This work product was prepared solely for Florida Department of Management Services for the purposes described herein and may not be appropriate to use for other purposes. Milliman does not intend to benefit and assumes no duty or liability to other parties who receive this work. Milliman recommends that third parties be aided by their own actuary or other qualified professional when reviewing the Milliman work product.
27
Table 4-1
Florida Retirement System Pension Plan
Normal Cost Rates by Decrement
July 1, 2017
Special Risk ----- Elected Officers' Class ----- Senior
Regular Special Risk Administrative Judicial Leg-Atty-Cab Local Management DROP Total
1. Vested Benefits and
Early Retirement 1.25% 1.86% 1.56% 1.54% 3.58% 2.76% 1.27% NA 1.35%
2. Regular Retirement 3.76% 11.63% 3.59% 12.42% 4.99% 7.57% 4.99% NA 5.08%
3. Non-Duty Death 0.20% 0.34% 0.15% 0.73% 0.34% 0.45% 0.25% NA 0.23%
4. Line of Duty Death 0.02% 0.41% 0.01% 0.03% 0.02% 0.03% 0.02% NA 0.08%
5. Non-Duty Disability 0.12% 0.15% 0.09% 0.30% 0.15% 0.17% 0.14% NA 0.12%
6. Line of Duty Disability 0.01% 0.29% 0.01% 0.02% 0.01% 0.02% 0.01% NA 0.05%
7. Refund of Employee
Contributions 0.55% 0.27% 0.64% 0.06% 0.49% 0.32% 0.59% NA 0.50%
8. Total Normal Cost 5.91% 14.95% 6.05% 15.10% 9.58% 11.32% 7.27% NA 7.41%
9. Expected Employee
Contributions -3.00% -3.00% -3.00% -3.00% -3.00% -3.00% -3.00% NA -3.00%
10. Employer Normal Cost 2.91% 11.95% 3.05% 12.10% 6.58% 8.32% 4.27% 4.41%1
4.41%
1DROP Normal Cost is set equivalent to the Pension Plan composite Normal Cost rate.

Actuarial Valuation as of July 1, 2017
Florida Retirement System Pension Plan Contributions
This work product was prepared solely for Florida Department of Management Services for the purposes described herein and may not be appropriate to use for other purposes. Milliman does not intend to benefit and assumes no duty or liability to other parties who receive this work. Milliman recommends that third parties be aided by their own actuary or other qualified professional when reviewing the Milliman work product.
28
Table 4-2
Florida Retirement System Pension Plan
Unfunded Actuarial Liability (UAL) Bases
July 1, 2017
Composite Plan
($ in Thousands)
(a) (b) (c) (d) (e) (f) = (d) / (e) (g) (h) (i) (j) = (h) / (i)
Date
Established Description
Remaining
Payments as of
Valuation Date
Balance as of
Valuation Date
Amortization
Factor1
Amortization
Payment for FY
2017-2018
Remaining
Payments one
year after
Valuation Date
Balance One Year
After Valuation
Date
Amortization
Factor1
Amortization
Payment for FY
2018-2019
June 30, 1999 Assumption Change from 1998 Experience Study 13 ($371,267) 9.9008 ($37,499) 12 ($360,232) 9.3611 ($38,482)
June 30, 2000 Special Risk 65% In-Line-Of-Duty Disability (2000) 14 (2,438) 10.4645 (233) 13 (2,379) 9.9555 (239)
June 30, 2000Special Risk-Regular 12% Pre-2000 Retired Benefit
Increase (2000) 14 310,581 10.4645 29,679 13 303,102 9.9555 30,446
June 30, 2004 Assumption Change from 2003 Experience Study 18 (3,495,467) 12.5007 (279,621) 17 (3,467,710) 12.1072 (286,417)
June 30, 2009 Assumption Change from 2008 Experience Study 23 6,942,035 14.6160 474,962 22 6,970,237 14.3517 485,672
June 30, 2009 2008-2009 Experience (Gains) / Losses 23 21,785,051 14.6160 1,490,495 22 21,873,552 14.3517 1,524,106
June 30, 2009 Unrecognized (Gains)/Losses while in Surplus 23 (6,372,320) 14.6160 (435,983) 22 (6,398,207) 14.3517 (445,814)
June 30, 2009 2009-2010 Plan Changes (HB 479) 23 (1,317,367) 14.6160 (90,132) 22 (1,322,719) 14.3517 (92,164)
June 30, 2010 2009-2010 Experience (Gains) / Losses 24 1,179,971 14.9891 78,722 23 1,186,849 14.7488 80,471
June 30, 2010 2010-2011 Plan Changes (SB 2100) 24 (1,292,491) 14.9891 (86,229) 23 (1,300,024) 14.7488 (88,144)
June 30, 2011 2010-2011 Experience (Gains) / Losses 25 2,869,205 15.3472 186,953 24 2,890,558 15.1302 191,045
June 30, 2012 2011-2012 Experience (Gains) / Losses 26 (115,121) 15.6908 (7,337) 25 (116,148) 15.4965 (7,495)
June 30, 2013 2012-2013 Experience (Gains) / Losses 27 2,892,418 16.0205 180,545 26 2,922,156 15.8484 184,382
June 30, 2014 Assumption/Method Change from 2013 Experience Study 28 2,069,670 16.3369 126,687 27 2,093,543 16.1863 129,341
June 30, 2014 2013-2014 Experience (Gains) / Losses 28 (2,806,971) 16.3369 (171,818) 27 (2,839,349) 16.1863 (175,417)
June 30, 2015 2014-2015 Experience (Gains) / Losses 29 572,168 16.6404 34,384 28 579,431 16.5108 35,094
June 30, 2016 Special Risk 100% In-Line-Of-Duty Death (2016) 30 43,420 16.9317 2,564 29 44,017 16.8226 2,617
June 30, 2016 2016 Assumption Changes 30 1,150,555 16.9317 67,953 29 1,166,392 16.8226 69,335
June 30, 2016 2015-2016 Experience (Gains) / Losses 30 1,267,063 16.9317 74,834 29 1,284,503 16.8226 76,356
June 30, 2017 Special Risk 100% In-Line-Of-Duty Death (2017) 84,998 30 91,373 17.1220 5,337
June 30, 2017 2017 Assumption Changes 2,123,579 30 2,282,847 17.1220 133,328
June 30, 2017 2016-2017 Experience (Gains) / Losses 468,601 2 30 503,746 17.1220 29,421
UAL as of Valuation Date $27,985,874 $1,638,927 $28,385,539 Total: $1,842,777
Projected FY 2018-2019 UAL Payroll: $30,278,632
NC Rate: 4.41%
UAL Contribution Rate: 6.09%
NCR + UALR: 10.50%
1The 2017-2018 amortization factors are based on the assumptions used in the July 1, 2016 actuarial valuation, which determined actuarially calculated contribution rates for 2017-2018.
The 2018-2019 amortization factors are based on the assumptions used in this July 1, 2017 actuarial valuation, which determines actuarially calculated contribution rates for 2018-2019. 2
The experience (gains)/losses developed on this table and the subsequent tables in this section are derived using a methodology which assumes 2016-2017 UAL contributions precisely equal the scheduled UAL amortization payments.
Actual System contributions differ somewhat from the amortization schedules in this section, and there is no clear delineation in actual contributions received between Normal Cost and UAL contributions.
The UAL (gain)/loss shown in the Executive Summary is derived using a methodology which incorporates actual 2016-2017 contributions.

Actuarial Valuation as of July 1, 2017
Florida Retirement System Pension Plan Contributions
This work product was prepared solely for Florida Department of Management Services for the purposes described herein and may not be appropriate to use for other purposes. Milliman does not intend to benefit and assumes no duty or liability to other parties who receive this work. Milliman recommends that third parties be aided by their own actuary or other qualified professional when reviewing the Milliman work product.
29
Table 4-3 Florida Retirement System Pension Plan Unfunded Actuarial Liability (UAL) Bases
July 1, 2017 Regular Class ($ in Thousands)
(a) (b) (c) (d) (e) (f) = (d) / (e) (g) (h) (i) (j) = (h) / (i)
Date
Established Description
Remaining
Payments as of
Valuation Date
Balance as of
Valuation Date
Amortization
Factor
Amortization
Payment for FY
2017-2018
Remaining
Payments one
year after
Valuation Date
Balance One Year
After Valuation
Date
Amortization
Factor
Amortization
Payment for FY
2018-2019
June 30, 1999 Assumption Change from 1998 Experience Study 13 ($282,829) 9.9008 ($28,566) 12 ($274,423) 9.3611 ($29,315)
June 30, 2004 Assumption Change from 2003 Experience Study 18 (3,088,064) 12.5007 (247,030) 17 (3,063,543) 12.1072 (253,035)
June 30, 2009 Assumption Change from 2008 Experience Study 23 5,646,950 14.6160 386,355 22 5,669,891 14.3517 395,067
June 30, 2009 2008-2009 Experience (Gains) / Losses 23 34,690,087 14.6160 2,373,435 22 34,831,013 14.3517 2,426,956
June 30, 2009 Unrecognized (Gains)/Losses while in Surplus 23 (27,211,227) 14.6160 (1,861,745) 22 (27,321,771) 14.3517 (1,903,727)
June 30, 2009 2009-2010 Plan Changes (HB 479) 23 (1,035,666) 14.6160 (70,858) 22 (1,039,873) 14.3517 (72,456)
June 30, 2010 2009-2010 Experience (Gains) / Losses 24 1,315,374 14.9891 87,755 23 1,323,040 14.7488 89,705
June 30, 2010 2010-2011 Plan Changes (SB 2100) 24 (1,669,822) 14.9891 (111,402) 23 (1,679,554) 14.7488 (113,877)
June 30, 2011 2010-2011 Experience (Gains) / Losses 25 1,419,291 15.3472 92,479 24 1,429,854 15.1302 94,503
June 30, 2012 2011-2012 Experience (Gains) / Losses 26 510,772 15.6908 32,552 25 515,328 15.4965 33,254
June 30, 2013 2012-2013 Experience (Gains) / Losses 27 1,757,014 16.0205 109,673 26 1,775,079 15.8484 112,004
June 30, 2014 Assumption/Method Change from 2013 Experience Study 28 605,979 16.3369 37,093 27 612,969 16.1863 37,870
June 30, 2014 2013-2014 Experience (Gains) / Losses 28 (1,271,655) 16.3369 (77,840) 27 (1,286,323) 16.1863 (79,470)
June 30, 2015 2014-2015 Experience (Gains) / Losses 29 756,417 16.6404 45,457 28 766,018 16.5108 46,395
June 30, 2016 2016 Assumption Changes 30 779,769 16.9317 46,054 29 790,502 16.8226 46,991
June 30, 2016 2015-2016 Experience (Gains) / Losses 30 1,303,515 16.9317 76,987 29 1,321,458 16.8226 78,553
June 30, 2017 2017 Assumption Changes 1,424,753 30 1,531,609 17.1220 89,453
June 30, 2017 2016-2017 Experience (Gains) / Losses (293,188) 30 (315,177) 17.1220 (18,408)
UAL as of Valuation Date $15,357,470 $890,397 $15,586,097 Total: $980,462
Projected FY 2018-2019 UAL Payroll: $23,412,818
NC Rate: 2.91%
UAL Contribution Rate: 4.19%
NCR + UALR: 7.10%

Actuarial Valuation as of July 1, 2017
Florida Retirement System Pension Plan Contributions
This work product was prepared solely for Florida Department of Management Services for the purposes described herein and may not be appropriate to use for other purposes. Milliman does not intend to benefit and assumes no duty or liability to other parties who receive this work. Milliman recommends that third parties be aided by their own actuary or other qualified professional when reviewing the Milliman work product.
30
Table 4-4 Florida Retirement System Pension Plan Unfunded Actuarial Liability (UAL) Bases
July 1, 2017 Special Risk Class
($ in Thousands)
(a) (b) (c) (d) (e) (f) = (d) / (e) (g) (h) (i) (j) = (h) / (i)
Date
Established Description
Remaining
Payments as of
Valuation Date
Balance as of
Valuation Date
Amortization
Factor
Amortization
Payment for FY
2017-2018
Remaining
Payments one
year after
Valuation Date
Balance One Year
After Valuation
Date
Amortization
Factor
Amortization
Payment for FY
2018-2019
June 30, 1999 Assumption Change from 1998 Experience Study 13 ($85,628) 9.9008 ($8,649) 12 ($83,083) 9.3611 ($8,875)
June 30, 2000 Special Risk 65% In-Line-Of-Duty Disability (2000) 14 (2,487) 10.4645 (238) 13 (2,427) 9.9555 (244)
June 30, 2000Special Risk-Regular 12% Pre-2000 Retired Benefit
Increase (2000) 14 310,581 10.4645 29,679 13 303,102 9.9555 30,446
June 30, 2004 Assumption Change from 2003 Experience Study 18 (630,864) 12.5007 (50,466) 17 (625,854) 12.1072 (51,693)
June 30, 2009 Assumption Change from 2008 Experience Study 23 554,651 14.6160 37,948 22 556,904 14.3517 38,804
June 30, 2009 2008-2009 Experience (Gains) / Losses 23 7,642,950 14.6160 522,917 22 7,673,999 14.3517 534,709
June 30, 2009 Unrecognized (Gains)/Losses while in Surplus 23 (2,536,137) 14.6160 (173,518) 22 (2,546,440) 14.3517 (177,431)
June 30, 2009 2009-2010 Plan Changes (HB 479) 23 (193,436) 14.6160 (13,235) 22 (194,222) 14.3517 (13,533)
June 30, 2010 2009-2010 Experience (Gains) / Losses 24 (417,906) 14.9891 (27,881) 23 (420,342) 14.7488 (28,500)
June 30, 2010 2010-2011 Plan Changes (SB 2100) 24 466,978 14.9891 31,154 23 469,700 14.7488 31,847
June 30, 2011 2010-2011 Experience (Gains) / Losses 25 264,501 15.3472 17,235 24 266,470 15.1302 17,612
June 30, 2012 2011-2012 Experience (Gains) / Losses 26 (569,574) 15.6908 (36,300) 25 (574,656) 15.4965 (37,083)
June 30, 2013 2012-2013 Experience (Gains) / Losses 27 502,887 16.0205 31,390 26 508,058 15.8484 32,057
June 30, 2014 Assumption/Method Change from 2013 Experience Study 28 1,365,977 16.3369 83,613 27 1,381,733 16.1863 85,364
June 30, 2014 2013-2014 Experience (Gains) / Losses 28 (890,671) 16.3369 (54,519) 27 (900,944) 16.1863 (55,661)
June 30, 2015 2014-2015 Experience (Gains) / Losses 29 (17,454) 16.6404 (1,049) 28 (17,676) 16.5108 (1,071)
June 30, 2016 Special Risk 100% In-Line-Of-Duty Death (2016) 30 43,420 16.9317 2,564 29 44,017 16.8226 2,617
June 30, 2016 2016 Assumption Changes 30 248,186 16.9317 14,658 29 251,602 16.8226 14,956
June 30, 2016 2015-2016 Experience (Gains) / Losses 30 217,197 16.9317 12,828 29 220,187 16.8226 13,089
June 30, 2017 Special Risk 100% In-Line-Of-Duty Death (2017) 84,998 30 91,373 17.1220 5,337
June 30, 2017 2017 Assumption Changes 463,191 30 497,930 17.1220 29,081
June 30, 2017 2016-2017 Experience (Gains) / Losses 462,146 30 496,807 17.1220 29,016
UAL as of Valuation Date $7,283,506 $418,134 $7,396,238 Total: $490,844
Projected FY 2018-2019 UAL Payroll: $3,945,979
NC Rate: 11.95%
UAL Contribution Rate: 12.44%
NCR + UALR: 24.39%

Actuarial Valuation as of July 1, 2017
Florida Retirement System Pension Plan Contributions
This work product was prepared solely for Florida Department of Management Services for the purposes described herein and may not be appropriate to use for other purposes. Milliman does not intend to benefit and assumes no duty or liability to other parties who receive this work. Milliman recommends that third parties be aided by their own actuary or other qualified professional when reviewing the Milliman work product.
31
Table 4-5 Florida Retirement System Pension Plan Unfunded Actuarial Liability (UAL) Bases
July 1, 2017 Special Risk Administrative Support Class
($ in Thousands)
(a) (b) (c) (d) (e) (f) = (d) / (e) (g) (h) (i) (j) = (h) / (i)
Date
Established Description
Remaining
Payments as of
Valuation Date
Balance as of
Valuation Date
Amortization
Factor
Amortization
Payment for FY
2017-2018
Remaining
Payments one
year after
Valuation Date
Balance One Year
After Valuation
Date
Amortization
Factor
Amortization
Payment for FY
2018-2019
June 30, 1999 Assumption Change from 1998 Experience Study 13 ($308) 9.9008 ($31) 12 ($298) 9.3611 ($32)
June 30, 2000 Special Risk 65% In-Line-Of-Duty Disability (2000) 14 49 10.4645 5 13 48 9.9555 5
June 30, 2004 Assumption Change from 2003 Experience Study 18 10,532 12.5007 842 17 10,448 12.1072 863
June 30, 2009 Assumption Change from 2008 Experience Study 23 1,334 14.6160 91 22 1,340 14.3517 93
June 30, 2009 2008-2009 Experience (Gains) / Losses 23 20,056 14.6160 1,372 22 20,138 14.3517 1,403
June 30, 2009 Unrecognized (Gains)/Losses while in Surplus 23 (22,258) 14.6160 (1,523) 22 (22,349) 14.3517 (1,557)
June 30, 2009 2009-2010 Plan Changes (HB 479) 23 0 14.6160 0 22 0 14.3517 0
June 30, 2010 2009-2010 Experience (Gains) / Losses 24 1,203 14.9891 80 23 1,210 14.7488 82
June 30, 2010 2010-2011 Plan Changes (SB 2100) 24 (548) 14.9891 (37) 23 (552) 14.7488 (37)
June 30, 2011 2010-2011 Experience (Gains) / Losses 25 2,892 15.3472 188 24 2,913 15.1302 193
June 30, 2012 2011-2012 Experience (Gains) / Losses 26 599 15.6908 38 25 605 15.4965 39
June 30, 2013 2012-2013 Experience (Gains) / Losses 27 2,863 16.0205 179 26 2,892 15.8484 182
June 30, 2014 Assumption/Method Change from 2013 Experience Study 28 (5,900) 16.3369 (361) 27 (5,968) 16.1863 (369)
June 30, 2014 2013-2014 Experience (Gains) / Losses 28 6,684 16.3369 409 27 6,761 16.1863 418
June 30, 2015 2014-2015 Experience (Gains) / Losses 29 (5,857) 16.6404 (352) 28 (5,931) 16.5108 (359)
June 30, 2016 2016 Assumption Changes 30 490 16.9317 29 29 496 16.8226 30
June 30, 2016 2015-2016 Experience (Gains) / Losses 30 1,950 16.9317 115 29 1,977 16.8226 118
June 30, 2017 2017 Assumption Changes 892 30 959 17.1220 56
June 30, 2017 2016-2017 Experience (Gains) / Losses 2,246 30 2,415 17.1220 141
UAL as of Valuation Date $16,919 $1,046 $17,104 Total: $1,268
Projected FY 2018-2019 UAL Payroll: $3,230
NC Rate: 3.05%
UAL Contribution Rate: 39.25%
NCR + UALR: 42.30%

Actuarial Valuation as of July 1, 2017
Florida Retirement System Pension Plan Contributions
This work product was prepared solely for Florida Department of Management Services for the purposes described herein and may not be appropriate to use for other purposes. Milliman does not intend to benefit and assumes no duty or liability to other parties who receive this work. Milliman recommends that third parties be aided by their own actuary or other qualified professional when reviewing the Milliman work product.
32
Table 4-6 Florida Retirement System Pension Plan Unfunded Actuarial Liability (UAL) Bases
July 1, 2017 Elected Officers' Class: Judicial Subclass
($ in Thousands)
(a) (b) (c) (d) (e) (f) = (d) / (e) (g) (h) (i) (j) = (h) / (i)
Date
Established Description
Remaining
Payments as of
Valuation Date
Balance as of
Valuation Date
Amortization
Factor
Amortization
Payment for FY
2017-2018
Remaining
Payments one
year after
Valuation Date
Balance One Year
After Valuation
Date
Amortization
Factor
Amortization
Payment for FY
2018-2019
June 30, 1999 Assumption Change from 1998 Experience Study 13 $40 9.9008 $4 12 $39 9.3611 $4
June 30, 2004 Assumption Change from 2003 Experience Study 18 27,829 12.5007 2,226 17 27,608 12.1072 2,280
June 30, 2009 Assumption Change from 2008 Experience Study 23 20,386 14.6160 1,395 22 20,469 14.3517 1,426
June 30, 2009 2008-2009 Experience (Gains) / Losses 23 515,713 14.6160 35,284 22 517,808 14.3517 36,080
June 30, 2009 Unrecognized (Gains)/Losses while in Surplus 23 (279,755) 14.6160 (19,140) 22 (280,892) 14.3517 (19,572)
June 30, 2009 2009-2010 Plan Changes (HB 479) 23 (25,764) 14.6160 (1,763) 22 (25,869) 14.3517 (1,802)
June 30, 2010 2009-2010 Experience (Gains) / Losses 24 (22,442) 14.9891 (1,497) 23 (22,573) 14.7488 (1,530)
June 30, 2010 2010-2011 Plan Changes (SB 2100) 24 3,226 14.9891 215 23 3,245 14.7488 220
June 30, 2011 2010-2011 Experience (Gains) / Losses 25 85,490 15.3472 5,570 24 86,126 15.1302 5,692
June 30, 2012 2011-2012 Experience (Gains) / Losses 26 6,699 15.6908 427 25 6,759 15.4965 436
June 30, 2013 2012-2013 Experience (Gains) / Losses 27 108,783 16.0205 6,790 26 109,901 15.8484 6,935
June 30, 2014 Assumption/Method Change from 2013 Experience Study 28 24,807 16.3369 1,518 27 25,094 16.1863 1,550
June 30, 2014 2013-2014 Experience (Gains) / Losses 28 (54,856) 16.3369 (3,358) 27 (55,489) 16.1863 (3,428)
June 30, 2015 2014-2015 Experience (Gains) / Losses 29 5,470 16.6404 329 28 5,539 16.5108 335
June 30, 2016 2016 Assumption Changes 30 7,259 16.9317 429 29 7,359 16.8226 437
June 30, 2016 2015-2016 Experience (Gains) / Losses 30 35,520 16.9317 2,098 29 36,009 16.8226 2,140
June 30, 2017 2017 Assumption Changes 13,203 30 14,193 17.1220 829
June 30, 2017 2016-2017 Experience (Gains) / Losses (2,423) 30 (2,605) 17.1220 (152)
UAL as of Valuation Date $469,184 $30,528 $472,721 Total: $31,881
Projected FY 2018-2019 UAL Payroll: $106,884
NC Rate: 12.10%
UAL Contribution Rate: 29.83%
NCR + UALR: 41.93%

Actuarial Valuation as of July 1, 2017
Florida Retirement System Pension Plan Contributions
This work product was prepared solely for Florida Department of Management Services for the purposes described herein and may not be appropriate to use for other purposes. Milliman does not intend to benefit and assumes no duty or liability to other parties who receive this work. Milliman recommends that third parties be aided by their own actuary or other qualified professional when reviewing the Milliman work product.
33
Table 4-7 Florida Retirement System Pension Plan Unfunded Actuarial Liability (UAL) Bases
July 1, 2017 Elected Officers' Class: Legislature/Attorney/Cabinet Subclass
($ in Thousands)
(a) (b) (c) (d) (e) (f) = (d) / (e) (g) (h) (i) (j) = (h) / (i)
Date
Established Description
Remaining
Payments as of
Valuation Date
Balance as of
Valuation Date
Amortization
Factor
Amortization
Payment for FY
2017-2018
Remaining
Payments one
year after
Valuation Date
Balance One Year
After Valuation
Date
Amortization
Factor
Amortization
Payment for FY
2018-2019
June 30, 1999 Assumption Change from 1998 Experience Study 13 $2 9.9008 $0 12 $2 9.3611 $0
June 30, 2004 Assumption Change from 2003 Experience Study 18 2,095 12.5007 168 17 2,079 12.1072 172
June 30, 2009 Assumption Change from 2008 Experience Study 23 2,046 14.6160 140 22 2,054 14.3517 143
June 30, 2009 2008-2009 Experience (Gains) / Losses 23 62,664 14.6160 4,287 22 62,919 14.3517 4,384
June 30, 2009 Unrecognized (Gains)/Losses while in Surplus 23 (35,837) 14.6160 (2,452) 22 (35,983) 14.3517 (2,507)
June 30, 2009 2009-2010 Plan Changes (HB 479) 23 (814) 14.6160 (56) 22 (817) 14.3517 (57)
June 30, 2010 2009-2010 Experience (Gains) / Losses 24 2,922 14.9891 195 23 2,939 14.7488 199
June 30, 2010 2010-2011 Plan Changes (SB 2100) 24 133 14.9891 9 23 133 14.7488 9
June 30, 2011 2010-2011 Experience (Gains) / Losses 25 8,617 15.3472 561 24 8,681 15.1302 574
June 30, 2012 2011-2012 Experience (Gains) / Losses 26 (4,040) 15.6908 (257) 25 (4,076) 15.4965 (263)
June 30, 2013 2012-2013 Experience (Gains) / Losses 27 19,310 16.0205 1,205 26 19,508 15.8484 1,231
June 30, 2014 Assumption/Method Change from 2013 Experience Study 28 (2,977) 16.3369 (182) 27 (3,011) 16.1863 (186)
June 30, 2014 2013-2014 Experience (Gains) / Losses 28 (917) 16.3369 (56) 27 (928) 16.1863 (57)
June 30, 2015 2014-2015 Experience (Gains) / Losses 29 (7,266) 16.6404 (437) 28 (7,358) 16.5108 (446)
June 30, 2016 2016 Assumption Changes 30 611 16.9317 36 29 620 16.8226 37
June 30, 2016 2015-2016 Experience (Gains) / Losses 30 10,296 16.9317 608 29 10,438 16.8226 620
June 30, 2017 2017 Assumption Changes 1,162 30 1,249 17.1220 73
June 30, 2017 2016-2017 Experience (Gains) / Losses 3,724 30 4,003 17.1220 234
UAL as of Valuation Date $61,732 $3,770 $62,453 Total: $4,160
Projected FY 2018-2019 UAL Payroll: $7,098
NC Rate: 6.58%
UAL Contribution Rate: 58.61%
NCR + UALR: 65.19%

Actuarial Valuation as of July 1, 2017
Florida Retirement System Pension Plan Contributions
This work product was prepared solely for Florida Department of Management Services for the purposes described herein and may not be appropriate to use for other purposes. Milliman does not intend to benefit and assumes no duty or liability to other parties who receive this work. Milliman recommends that third parties be aided by their own actuary or other qualified professional when reviewing the Milliman work product.
34
Table 4-8 Florida Retirement System Pension Plan Unfunded Actuarial Liability (UAL) Bases
July 1, 2017 Elected Officers' Class: Local Subclass
($ in Thousands)
(a) (b) (c) (d) (e) (f) = (d) / (e) (g) (h) (i) (j) = (h) / (i)
Date
Established Description
Remaining
Payments as of
Valuation Date
Balance as of
Valuation Date
Amortization
Factor
Amortization
Payment for FY
2017-2018
Remaining
Payments one
year after
Valuation Date
Balance One Year
After Valuation
Date
Amortization
Factor
Amortization
Payment for FY
2018-2019
June 30, 1999 Assumption Change from 1998 Experience Study 13 $5 9.9008 $0 12 $5 9.3611 $0
June 30, 2004 Assumption Change from 2003 Experience Study 18 35,225 12.5007 2,818 17 34,945 12.1072 2,886
June 30, 2009 Assumption Change from 2008 Experience Study 23 11,895 14.6160 814 22 11,943 14.3517 832
June 30, 2009 2008-2009 Experience (Gains) / Losses 23 244,157 14.6160 16,705 22 245,149 14.3517 17,081
June 30, 2009 Unrecognized (Gains)/Losses while in Surplus 23 (60,452) 14.6160 (4,136) 22 (60,698) 14.3517 (4,229)
June 30, 2009 2009-2010 Plan Changes (HB 479) 23 (7,380) 14.6160 (505) 22 (7,410) 14.3517 (516)
June 30, 2010 2009-2010 Experience (Gains) / Losses 24 2,139 14.9891 143 23 2,151 14.7488 146
June 30, 2010 2010-2011 Plan Changes (SB 2100) 24 305 14.9891 20 23 307 14.7488 21
June 30, 2011 2010-2011 Experience (Gains) / Losses 25 14,238 15.3472 928 24 14,344 15.1302 948
June 30, 2012 2011-2012 Experience (Gains) / Losses 26 (5,807) 15.6908 (370) 25 (5,858) 15.4965 (378)
June 30, 2013 2012-2013 Experience (Gains) / Losses 27 111,513 16.0205 6,961 26 112,660 15.8484 7,109
June 30, 2014 Assumption/Method Change from 2013 Experience Study 28 (23,666) 16.3369 (1,449) 27 (23,939) 16.1863 (1,479)
June 30, 2014 2013-2014 Experience (Gains) / Losses 28 (10,515) 16.3369 (644) 27 (10,636) 16.1863 (657)
June 30, 2015 2014-2015 Experience (Gains) / Losses 29 (10,446) 16.6404 (628) 28 (10,579) 16.5108 (641)
June 30, 2016 2016 Assumption Changes 30 3,261 16.9317 193 29 3,306 16.8226 197
June 30, 2016 2015-2016 Experience (Gains) / Losses 30 21,508 16.9317 1,270 29 21,804 16.8226 1,296
June 30, 2017 2017 Assumption Changes 6,416 30 6,897 17.1220 403
June 30, 2017 2016-2017 Experience (Gains) / Losses 36,305 30 39,028 17.1220 2,279
UAL as of Valuation Date $368,701 $22,120 $373,419 Total: $25,298
Projected FY 2018-2019 UAL Payroll: $47,827
NC Rate: 8.32%
UAL Contribution Rate: 52.90%
NCR + UALR: 61.22%

Actuarial Valuation as of July 1, 2017
Florida Retirement System Pension Plan Contributions
This work product was prepared solely for Florida Department of Management Services for the purposes described herein and may not be appropriate to use for other purposes. Milliman does not intend to benefit and assumes no duty or liability to other parties who receive this work. Milliman recommends that third parties be aided by their own actuary or other qualified professional when reviewing the Milliman work product.
35
Table 4-9 Florida Retirement System Pension Plan Unfunded Actuarial Liability (UAL) Bases
July 1, 2017 Senior Management Service Class
($ in Thousands)
(a) (b) (c) (d) (e) (f) = (d) / (e) (g) (h) (i) (j) = (h) / (i)
Date
Established Description
Remaining
Payments as of
Valuation Date
Balance as of
Valuation Date
Amortization
Factor
Amortization
Payment for FY
2017-2018
Remaining
Payments one
year after
Valuation Date
Balance One Year
After Valuation
Date
Amortization
Factor
Amortization
Payment for FY
2018-2019
June 30, 1999 Assumption Change from 1998 Experience Study 13 ($2,548) 9.9008 ($257) 12 ($2,473) 9.3611 ($264)
June 30, 2004 Assumption Change from 2003 Experience Study 18 216,367 12.5007 17,308 17 214,649 12.1072 17,729
June 30, 2009 Assumption Change from 2008 Experience Study 23 65,579 14.6160 4,487 22 65,846 14.3517 4,588
June 30, 2009 2008-2009 Experience (Gains) / Losses 23 1,277,248 14.6160 87,387 22 1,282,437 14.3517 89,358
June 30, 2009 Unrecognized (Gains)/Losses while in Surplus 23 (289,909) 14.6160 (19,835) 22 (291,087) 14.3517 (20,282)
June 30, 2009 2009-2010 Plan Changes (HB 479) 23 (54,307) 14.6160 (3,716) 22 (54,528) 14.3517 (3,799)
June 30, 2010 2009-2010 Experience (Gains) / Losses 24 35,407 14.9891 2,362 23 35,614 14.7488 2,415
June 30, 2010 2010-2011 Plan Changes (SB 2100) 24 (92,763) 14.9891 (6,189) 23 (93,304) 14.7488 (6,326)
June 30, 2011 2010-2011 Experience (Gains) / Losses 25 133,716 15.3472 8,713 24 134,711 15.1302 8,903
June 30, 2012 2011-2012 Experience (Gains) / Losses 26 68,603 15.6908 4,372 25 69,216 15.4965 4,467
June 30, 2013 2012-2013 Experience (Gains) / Losses 27 384,908 16.0205 24,026 26 388,866 15.8484 24,537
June 30, 2014 Assumption/Method Change from 2013 Experience Study 28 (150,938) 16.3369 (9,239) 27 (152,679) 16.1863 (9,433)
June 30, 2014 2013-2014 Experience (Gains) / Losses 28 60,902 16.3369 3,728 27 61,605 16.1863 3,806
June 30, 2015 2014-2015 Experience (Gains) / Losses 29 51,992 16.6404 3,124 28 52,652 16.5108 3,189
June 30, 2016 2016 Assumption Changes 30 30,823 16.9317 1,820 29 31,247 16.8226 1,857
June 30, 2016 2015-2016 Experience (Gains) / Losses 30 96,769 16.9317 5,715 29 98,101 16.8226 5,831
June 30, 2017 2017 Assumption Changes 54,592 30 58,686 17.1220 3,428
June 30, 2017 2016-2017 Experience (Gains) / Losses 74,041 30 79,594 17.1220 4,649
UAL as of Valuation Date $1,960,483 $123,808 $1,979,153 Total: $134,651
Projected FY 2018-2019 UAL Payroll: $566,672
NC Rate: 4.27%
UAL Contribution Rate: 23.76%
NCR + UALR: 28.03%

Actuarial Valuation as of July 1, 2017
Florida Retirement System Pension Plan Contributions
This work product was prepared solely for Florida Department of Management Services for the purposes described herein and may not be appropriate to use for other purposes. Milliman does not intend to benefit and assumes no duty or liability to other parties who receive this work. Milliman recommends that third parties be aided by their own actuary or other qualified professional when reviewing the Milliman work product.
36
Table 4-10 Florida Retirement System Pension Plan Unfunded Actuarial Liability (UAL) Bases
July 1, 2017 DROP
($ in Thousands)
(a) (b) (c) (d) (e) (f) = (d) / (e) (g) (h) (i) (j) = (h) / (i)
Date
Established Description
Remaining
Payments as of
Valuation Date
Balance as of
Valuation Date
Amortization
Factor
Amortization
Payment for FY
2017-2018
Remaining
Payments one
year after
Valuation Date
Balance One Year
After Valuation
Date
Amortization
Factor
Amortization
Payment for FY
2018-2019
June 30, 2004 Assumption Change from 2003 Experience Study 18 ($68,586) 12.5007 ($5,487) 17 ($68,042) 12.1072 ($5,620)
June 30, 2009 Assumption Change from 2008 Experience Study 23 639,194 14.6160 43,733 22 641,791 14.3517 44,719
June 30, 2009 2008-2009 Experience (Gains) / Losses 23 (22,667,825) 14.6160 (1,550,893) 22 (22,759,911) 14.3517 (1,585,866)
June 30, 2009 Unrecognized (Gains)/Losses while in Surplus 23 24,063,257 14.6160 1,646,366 22 24,161,012 14.3517 1,683,492
June 30, 2010 2009-2010 Experience (Gains) / Losses 24 263,276 14.9891 17,564 23 264,810 14.7488 17,955
June 30, 2011 2010-2011 Experience (Gains) / Losses 25 940,459 15.3472 61,279 24 947,458 15.1302 62,620
June 30, 2012 2011-2012 Experience (Gains) / Losses 26 (122,373) 15.6908 (7,799) 25 (123,465) 15.4965 (7,967)
June 30, 2013 2012-2013 Experience (Gains) / Losses 27 5,140 16.0205 321 26 5,192 15.8484 328
June 30, 2014 Assumption/Method Change from 2013 Experience Study 28 256,387 16.3369 15,694 27 259,344 16.1863 16,022
June 30, 2014 2013-2014 Experience (Gains) / Losses 28 (645,944) 16.3369 (39,539) 27 (653,395) 16.1863 (40,367)
June 30, 2015 2014-2015 Experience (Gains) / Losses 29 (200,688) 16.6404 (12,060) 28 (203,235) 16.5108 (12,309)
June 30, 2016 2016 Assumption Changes 30 80,157 16.9317 4,734 29 81,260 16.8226 4,830
June 30, 2016 2015-2016 Experience (Gains) / Losses 30 (419,693) 16.9317 (24,787) 29 (425,470) 16.8226 (25,292)
June 30, 2017 2017 Assumption Changes 159,370 30 171,323 17.1220 10,006
June 30, 2017 2016-2017 Experience (Gains) / Losses 185,750 30 199,681 17.1220 11,662
UAL as of Valuation Date $2,467,879 $149,125 $2,498,354 Total: $174,213
Projected FY 2018-2019 UAL Payroll: $2,188,124
NC Rate: 4.41%
UAL Contribution Rate: 7.96%
NCR + UALR: 12.37%

Actuarial Valuation as of July 1, 2017
Florida Retirement System Pension Plan Contributions
This work product was prepared solely for Florida Department of Management Services for the purposes described herein and may not be appropriate to use for other purposes. Milliman does not intend to benefit and assumes no duty or liability to other parties who receive this work. Milliman recommends that third parties be aided by their own actuary or other qualified professional when reviewing the Milliman work product.
37
Table 4-11 Florida Retirement System Pension Plan
Actuarially Calculated Employer Contribution Rates July 1, 2017 Valuation for Fiscal Year Beginning July 1, 2018
Special Risk -- Elected Officers' Class -- Senior Composite Composite
Regular Special Risk Administrative Judicial Leg-Atty-Cab Local Management (excluding DROP) DROP ¹ (including DROP)
1. Employer Normal Cost 2.91% 11.95% 3.05% 12.10% 6.58% 8.32% 4.27% 4.41% 4.41% 4.41%
2. UAL Cost 4.19% 12.44% 39.25% 29.83% 58.61% 52.90% 23.76% 5.94% 7.96% 6.09%
3. Total Employer Cost [(1) + (2)] 7.10% 24.39% 42.30% 41.93% 65.19% 61.22% 28.03% 10.35% 12.37% 10.50%
4. UAL Cost Paid from Surplus 0.00% 0.00% 0.00% 0.00% 0.00% 0.00% 0.00% 0.00% 0.00% 0.00%
5. Rate Reduction from Surplus 0.00% 0.00% 0.00% 0.00% 0.00% 0.00% 0.00% 0.00% 0.00% 0.00%
6. Total Adjusted Employer Contribution for FRS Trust Fund
[(3) + (4) + (5)] 7.10% 24.39% 42.30% 41.93% 65.19% 61.22% 28.03% 10.35% 12.37% 10.50%
1DROP rates are special charges to cover the assumed cost of DROP participants; they are not Normal Cost or UAL Cost in the traditional sense.
See Section G of Executive Summary for discussion of the DROP contribution rate.

Actuarial Valuation as of July 1, 2017
Florida Retirement System Pension Plan Contributions
This work product was prepared solely for Florida Department of Management Services for the purposes described herein and may not be appropriate to use for other purposes. Milliman does not intend to benefit and assumes no duty or liability to other parties who receive this work. Milliman recommends that third parties be aided by their own actuary or other qualified professional when reviewing the Milliman work product.
38
Table 4-12 Florida Retirement System Pension Plan
Actuarially Calculated vs. Legislated Defined Benefit Plan Contribution Rates (Before Blending) 1 & 2 & 3 & 4
Plan Year 2016-2017 Plan Year 2017-2018
Actuarially Actuarially Actuarially
Membership Class Calculated Legislated Calculated Legislated Calculated Legislated
1. Regular 6.21% 6.21% 6.68% 6.68% 7.10% TBD
2. Special Risk 22.24% 22.24% 22.99% 22.99% 24.39% TBD
3. Special Risk Administrative 35.49% 35.49% 45.90% 45.90% 42.30% TBD
4. Elected Officers' Class - Judicial 37.17% 37.17% 40.48% 40.48% 41.93% TBD
5. Elected Officers' Class - Leg-Atty-Cab 51.19% 51.19% 62.14% 62.14% 65.19% TBD
6. Elected Officers' Class - Local 52.99% 52.99% 57.62% 57.62% 61.22% TBD
7. Senior Management Service 25.18% 25.18% 26.21% 26.21% 28.03% TBD
8. Composite without DROP 9.14% 9.14% 9.69% 9.69% 10.35% TBD
9. DROP 11.33% 11.33% 11.60% 11.60% 12.37% TBD
10. Composite with DROP 9.32% 9.32% 9.82% 9.82% 10.50% TBD
1The above rates (applied to DB plan payroll) are combined with the Investment Plan contribution rates (applied to IP payroll) to derive
the uniform blended rates employers contribute.2
Contribution rates show above do not include the 3% required employee contribution rate.3
The Plan Year 2016-2017 rates shown in this table differ from those developed in the July 1, 2015 actuarial valuation due to the modification
of Special Risk in-line-of-duty death benefit provisions by the Florida Legislature subsequent to the publication of the valuation report.4
The Plan Year 2017-2018 rates shown in this table differ from those developed in the July 1, 2016 actuarial valuation due to the modification
of Special Risk in-line-of-duty death benefit provisions by the Florida Legislature subsequent to the publication of the valuation report.
Plan Year 2018-2019

Actuarial Valuation as of July 1, 2017
Florida Retirement System Pension Plan Accounting Statement
This work product was prepared solely for Florida Department of Management Services for the purposes described herein and may not be appropriate to use for other purposes. Milliman does not intend to benefit and assumes no duty or liability to other parties who receive this work. Milliman recommends that third parties be aided by their own actuary or other qualified professional when reviewing the Milliman work product.
39
5. Accounting Statement
The liabilities presented in this report differ by section regarding whether future anticipated salary increases or
service credits are included in the calculation. Actuarial Liabilities in Sections 3 and 4 are determined for plan
funding purposes and include a provision for the projected effects of future salary increases and future service
performed by current FRS Pension Plan members.
Statement No. 67 of the Governmental Accounting Standards Board (GASB) is the current standard for pension
plan accounting disclosure by governmental pension systems. GASB 67 information for the FRS Pension Plan as
of July 1, 2017 was provided under separate cover in November 2017.1 GASB 67 liability calculations also include
a provision for the projected effects of future salary increases and future service performed by current FRS
Pension Plan members, but use a different actuarial cost allocation method to be in compliance with GASB
standards.
Accounting Standards Codification (ASC) 960 – Plan Accounting – Defined Benefit Pension Plans, formerly titled
Statement No. 35 of the Financial Accounting Standards Board (FASB), specifies a different methodology for
disclosure of certain information regarding pension plan funded status. Accounting liabilities calculated under
ASC 960 do not include the effects of either projected future salary increases or projected future service
performed.
The ASC 960 disclosures are intended to provide a “snap shot” view of how the Plan’s assets compare to its
liabilities if contributions stopped and accrued benefit claims had to be satisfied. The Accumulated Benefit
Obligation (ABO) is determined based on each member’s accrued benefit, that is, the benefit based on employee
service performed and compensation earned up to the valuation date. We assume that the plan is ongoing and
that members continue to terminate employment, retire, and otherwise act in accordance with the actuarial
assumptions. Liabilities are discounted at the assumed valuation interest rate of 7.50% per annum.
Table 5-1 presents the ABO for the FRS Pension Plan determined as of July 1, 2017. All of the calculations
presented in that table are based on the actuarial assumptions used in the valuation, as described in Appendix A,
except salaries are not projected to increase and no future benefit service is credited for service performed after
the valuation date. Values of the ABO are shown by type of member and by class. The active members' values
are also divided between the employee-financed (accumulated member contributions) and employer-financed
portions, with the employer-financed portions shown separately for vested benefits and non-vested benefits. For
purposes of calculating the ABO post-Senate Bill 2100, we estimated the COLA percentage for each member as
3% multiplied by service through June 30, 2011, divided by projected total service at the time of retirement.
Table 5-2 presents the total ABO for the FRS Pension Plan for the current and two prior valuations. The trend of
the Pension Plan’s ASC 960 funded status, as measured by the ABO over a period of time, is one indication of
the progress being made in accumulating sufficient assets to pay benefits when due. Past and future results are
affected by changes in actuarial assumptions, benefit provisions, and accounting policies.
Table 5-3 reconciles the ABO determined as of the prior valuation, July 1, 2016, to the ABO as of July 1, 2017.
This reconciliation indicates the impact of the assumption changes and plan changes, if any.
1 The valuation report in prior years included Table 5-4 which showed the Net Pension Obligation under GASB Statement No. 27. That exhibit has been discontinued since GASB Statement No. 27 is not applicable after plan year 2013-2014. Please refer to the separate GASB 67 report for financial reporting information.

Actuarial Valuation as of July 1, 2017
Florida Retirement System Pension Plan Accounting Statement
This work product was prepared solely for Florida Department of Management Services for the purposes described herein and may not be appropriate to use for other purposes. Milliman does not intend to benefit and assumes no duty or liability to other parties who receive this work. Milliman recommends that third parties be aided by their own actuary or other qualified professional when reviewing the Milliman work product.
40
Table 5-1
Florida Retirement System Pension Plan
Accumulated Benefit Obligation - ASC 960
July 1, 2017
(All Amounts in Thousands)
Special Risk -- Elected Officers' Class -- Senior
Regular Special Risk Administrative Judicial Leg-Atty-Cab Local Management DROP Total
A. Accumulated Benefit Obligation
1. Active Members
a. Accumulated Member Contributions $2,637,035 $503,195 $509 $15,224 $977 $6,038 $74,923 $0 $3,237,901
b. Employer-Financed Vested Benefits 19,363,337 6,407,491 6,847 252,799 12,828 93,040 903,731 0 27,040,073
c. Employer-Financed Non-Vested Benefits 831,813 224,426 269 7,231 907 3,637 21,991 0 1,090,274
d. Total $22,832,185 $7,135,112 $7,625 $275,254 $14,712 $102,715 $1,000,645 $0 $31,368,248
2. Annuitants $76,841,026 $20,508,389 $74,711 $881,630 $87,734 $499,000 $2,772,933 $15,749,075 $117,414,498
3. Other Inactive Members $4,208,360 $656,240 $1,402 $19,053 $8,312 $18,121 $159,597 $0 $5,071,085
4. Total Accumulated Benefit Obligation $103,881,571 $28,299,741 $83,738 $1,175,937 $110,758 $619,836 $3,933,175 $15,749,075 $153,853,831
B. Assets Available for Benefits
1. Market $108,188,253 $28,282,626 $73,647 $869,269 $58,416 $306,934 $2,687,774 $13,586,344 $154,053,263
2. Actuarial Basis $105,758,356 $27,647,401 $71,993 $849,745 $57,104 $300,040 $2,627,407 $13,281,196 $150,593,242
C. Unfunded / (Surplus) Total Accumulated Benefit Obligation,
Assets at:
1. Market ($4,306,682) $17,115 $10,091 $306,668 $52,342 $312,902 $1,245,401 $2,162,731 ($199,432)
2. Actuarial Basis ($1,876,785) $652,340 $11,745 $326,192 $53,654 $319,796 $1,305,768 $2,467,879 $3,260,589
D. Percent of Accumulated Obligation Funded,
Assets at:
1. Market 104.15% 99.94% 87.95% 73.92% 52.74% 49.52% 68.34% 86.27% 100.13%
2. Actuarial Basis 101.81% 97.69% 85.97% 72.26% 51.56% 48.41% 66.80% 84.33% 97.88%

Actuarial Valuation as of July 1, 2017
Florida Retirement System Pension Plan Accounting Statement
This work product was prepared solely for Florida Department of Management Services for the purposes described herein and may not be appropriate to use for other purposes. Milliman does not intend to benefit and assumes no duty or liability to other parties who receive this work. Milliman recommends that third parties be aided by their own actuary or other qualified professional when reviewing the Milliman work product.
41
Table 5-2
Florida Retirement System Pension Plan
Analysis of Funding Progress - ASC 960
(All Amounts in Thousands)
July 1, 2015 July 1, 2016 July 1, 2017
Valuation Basis Valuation Basis Valuation Basis
A. Accumulated Benefit Obligation
1. Active Members
a. Accumulated Member Contributions $2,304,079 $2,775,994 $3,237,901
b. Employer-Financed Vested Benefits 27,805,980 26,754,501 27,040,073
c. Employer-Financed Non-Vested Benefits 1,086,499 1,064,426 1,090,274
d. Total $31,196,558 $30,594,921 $31,368,248
2. Annuitants $88,519,139 $96,445,460 $101,665,423
3. Other Inactive Members $4,647,199 $4,914,799 $5,071,085
4. Other Inactive MembersDROP $18,058,528 $14,569,858 $15,749,075
5. Total Accumulated Benefit Obligation $142,421,424 $146,525,038 $153,853,831
B. Assets Available for Benefits
1. Market $148,454,394 $141,780,921 $154,053,263
2. Actuarial Basis $143,195,531 $145,451,612 $150,593,242
C. Unfunded/(Surplus) Total Accumulated Benefit Obligation,
Assets at:
1. Market ($6,032,970) $4,744,117 ($199,432)
2. Actuarial Basis ($774,107) $1,073,426 $3,260,589
D. Percent of Accumulated Benefit Obligation Funded,
Assets at:
1. Market 104.24% 96.76% 100.13%
2. Actuarial Basis 100.54% 99.27% 97.88%
E. Annual Salaries¹ $25,063,048 $25,204,393 $26,171,584
F. Unfunded/(Surplus) Accumulated Benefit Obligation as a
Percent of Salary, Assets at:
1. Market -24.07% 18.82% -0.76%
2. Actuarial Basis -3.09% 4.26% 12.46%
¹ Includes Drop Salaries

Actuarial Valuation as of July 1, 2017
Florida Retirement System Pension Plan Accounting Statement
This work product was prepared solely for Florida Department of Management Services for the purposes described herein and may not be appropriate to use for other purposes. Milliman does not intend to benefit and assumes no duty or liability to other parties who receive this work. Milliman recommends that third parties be aided by their own actuary or other qualified professional when reviewing the Milliman work product.
42
Table 5-3
Florida Retirement System Pension Plan
Statement of Changes in Accumulated
Benefit Obligation
(All Amounts in Thousands)
ASC 960
Basis
Accumulated Benefit Obligation
at July 1, 2016 $146,525,038
Increase (Decrease) During Year Attributable to:
Increase for Interest Due to Decrease in Discount Period $10,767,425
Benefits Paid - PY 2017 ($9,877,660)
Benefits Accrued, & Other Gains/Losses $4,679,651
Plan Provision / Assumption Changes $1,759,377
Net Increase (Decrease) $7,328,793
Accumulated Benefit Obligation
at July 1, 2017 $153,853,831
Actuarial Valuation as of July 1, 2017
Florida Retirement System Pension Plan Appendix A
This work product was prepared solely for Florida Department of Management Services for the purposes described herein and may not be appropriate to use for other purposes. Milliman does not intend to benefit and assumes no duty or liability to other parties who receive this work. Milliman recommends that third parties be aided by their own actuary or other qualified professional when reviewing the Milliman work product.
A-1
Appendix A: Actuarial Methods, Procedures and Assumptions
The actuarial assumptions are intended to estimate the future experience of FRS Pension Plan members,
employers and investments. Any variations in future actual experience from these assumptions will result in
corresponding changes in actuarially calculated contribution rates.
Assumption Tables
A complete listing of all the assumptions, methods, and procedures that are used in the 2017 actuarial valuation
of the FRS Pension Plan are summarized on the following pages. These assumptions, methods, and procedures
were approved by the 2017 FRS Actuarial Assumption Conference and are based on the 2014 Experience Study.
For this valuation, the one assumption update approved by the 2017 FRS Actuarial Assumption Conference was
a decrease in the investment return assumption from 7.60% to 7.50%.
Data
Except where noted, the analysis in this valuation was based on data as of June 30, 2017, as provided by the
Division of Retirement, Florida Department of Management Services. The data used in this valuation consists of
financial information and records of age, service and income of active members, annuitants, and other inactive
members entitled to future benefits. The Division of Retirement, Florida Department of Management Services is
solely responsible for the validity, accuracy and comprehensiveness of this information; the results of our analysis
can be expected to differ and may need to be revised if the underlying data supplied is incomplete or inaccurate.
Methods and Procedures
Actuarial cost method: The total cost of the FRS Pension Plan, over time, will be equal to the benefits paid and
expenses less actual investment earnings and is not affected directly by the actuarial cost method. The actuarial
cost method is simply a tool to allocate costs to past, current, or future years and thus primarily affects the timing
of cost recognition.
The FRS Pension Plan uses Entry Age Normal (EAN), which is the most commonly used general cost method
approach for state pension systems. Conceptually, EAN sets the normal cost rate level as a percent of payroll
over a member’s full projected working career. There are different categories of EAN, including Individual EAN,
which is by far the most commonly used EAN category, and Ultimate EAN, which is the category of EAN used by
the FRS Pension Plan. Even each category of EAN contains different interpretations of how to calculate the key
metrics. GASB Statements Nos. 67 & 68 mandate the use of a particular interpretation of Individual EAN for
financial reporting purposes. GASB 67 & 68 information is provided under separate cover.
Sponsors have autonomy to choose any cost method and identify any variation of that cost method for purposes
of setting system funding policy. Ultimate EAN, which is used by the FRS, sets normal cost as if each member
was initially enrolled on or after July 1, 2011 (Tier II). As such, normal cost is lower for Ultimate EAN than for
Individual EAN, which sets normal cost in a manner that is representative of the tier in which the member actually
participates. Cost methods do allocate benefits between past and projected future service, but do not affect the
level of projected benefits; benefits are based on the actual tier of membership under either Ultimate EAN or
Individual EAN. Compared to the Individual EAN method, the Ultimate EAN method allocates fewer projected
benefits to future service (via lower normal cost) and hence produces a higher actuarial accrued liability for past
service as a counterbalance.
The interpretation of Ultimate EAN used in this 2017 valuation sets normal cost rates as if each member in the
Pension Plan was in Tier II as noted above. The projected future service period used for calculating the present
value of future normal costs is based on Tier I retirement timing assumptions for members in Tier I. This is the
same method used in the prior valuation.

Actuarial Valuation as of July 1, 2017
Florida Retirement System Pension Plan Appendix A
This work product was prepared solely for Florida Department of Management Services for the purposes described herein and may not be appropriate to use for other purposes. Milliman does not intend to benefit and assumes no duty or liability to other parties who receive this work. Milliman recommends that third parties be aided by their own actuary or other qualified professional when reviewing the Milliman work product.
A-2
UAL amortization method: The Unfunded Actuarial Liability (UAL) is amortized as a level percentage of
projected payroll on which UAL Rates are charged in an effort to maintain level contribution rates as a percentage
of payroll during the specified amortization period if future experience follows assumptions.
New UAL arises each year and is calculated in each new actuarial valuation. The newly arising UAL can be either
positive or negative, and can be due either to experience varying from assumptions or to changes in actuarial
liability from modifications to assumptions, plan provisions, or actuarial methods. Each year’s newly arising UAL is
currently amortized over a closed 30-year period as a level percent of the projected payroll on which UAL rates
are charged.
Amortization periods longer than 20 years can incur significant negative amortization, wherein the calculated UAL
increases for an extended period of time prior to final payoff even if all contributions are made and all
assumptions are met. This was discussed and illustrated in Milliman’s August 11, 2014 presentation materials to
the FRS Actuarial Assumptions Conference.
Asset valuation method: This method recognizes actual investment performance different from the long-term
assumption systematically. The expected Actuarial Value of Assets (AVA) is determined by crediting the rate of
investment return assumed in the prior valuation to the prior year’s AVA. Then, 20% of the difference between the
actual Market Value of Assets (MVA) and the expected AVA is immediately recognized in the AVA. To ensure that
the AVA remains reasonably close to the MVA, the asset method includes a corridor whereby the AVA must
remain within 80% to 120% of MVA.
Economic Assumptions
Assumption
Inflation 2.60%
Real wage growth 0.65%
Payroll growth 3.25% (sum of two items above)
Investment Return 7.50%
Demographic Assumptions
Mortality
Healthy Inactive Mortality (Post-Employment)
Female Non-Disabled: RP2000 Generational, 100% Annuitant White Collar, Scale BB
Male Non-Disabled (other than Special Risk): RP2000 Generational, 50% Annuitant White Collar / 50%
Annuitant Blue Collar, Scale BB
Male Non-Disabled (Special Risk): RP2000 Generational, 10% Annuitant White Collar / 90% Annuitant
Blue Collar, Scale BB

Actuarial Valuation as of July 1, 2017
Florida Retirement System Pension Plan Appendix A
This work product was prepared solely for Florida Department of Management Services for the purposes described herein and may not be appropriate to use for other purposes. Milliman does not intend to benefit and assumes no duty or liability to other parties who receive this work. Milliman recommends that third parties be aided by their own actuary or other qualified professional when reviewing the Milliman work product.
A-3
Healthy Active Mortality (During Employment) [Updated assumption for this valuation]
Female Non-Disabled: RP2000 Generational, 100% Combined Healthy White Collar, Scale BB
Male Non-Disabled (other than Special Risk): RP2000 Generational, 50% Combined Healthy White
Collar / 50% Combined Healthy Blue Collar, Scale BB
Male Non-Disabled (Special Risk): RP2000 Generational, 10% Combined Healthy White Collar / 90%
Combined Healthy Blue Collar, Scale BB
For Special Risk members, 25% of future active member deaths are assumed to be in the line of duty
For all other members, 2% of future active member deaths are assumed to be in the line of duty
Disabled Mortality
Female Disabled (other than Special Risk): RP2000, 100% Disabled Female set forward two years, no
projection scale
Female Disabled (Special Risk): 60% RP2000 Disabled Female set forward two years / 40% Annuitant
White Collar with no setback, no projection scale
Male Disabled (other than Special Risk): RP2000, 100% Disabled Male setback four years, no projection
scale
Male Disabled (Special Risk): 60% RP2000 Disabled Male setback four years / 40% Annuitant White
Collar with no setback, no projection scale
Retirement for Vested Terminated Members (Tier I and Tier II)
All current vested terminated members are assumed to begin receiving benefits on the normal retirement benefit
age for the appropriate class and tier. All future members who terminate employment with a vested benefit are
also assumed to commence benefit at the normal retirement benefit age.
Optional Form of Payment
All future retirees are assumed to elect the straight life (Option 1) form of benefit. For current retirees and
members in DROP, the actual elected form is used.

This work product was prepared solely for Florida Department of Management Services for the purposes described herein and may not be appropriate to use for other purposes. Milliman does not intend to benefit and assumes no duty or liability to other parties who receive this work. Milliman recommends that third parties be aided by their own actuary or other qualified professional when reviewing the Milliman work product.
A-4
Retirement Assumptions (Tier I) DROP Entry at first retirement eligibility
Immediate Retirement at first retirement eligibility
Age Female Male Female Male Female Male
45 0.0% 0.0% 20.0% 23.0% 0.0% 0.0%
46 0.0% 0.0% 20.0% 23.0% 0.0% 0.0%
47 0.0% 0.0% 20.0% 23.0% 0.0% 0.0%
48 27.0% 23.0% 20.0% 30.0% 30.0% 30.0%
49 27.0% 23.0% 20.0% 30.0% 32.5% 32.5%
50 27.0% 23.0% 20.0% 30.0% 35.0% 35.0%
51 27.0% 23.0% 20.0% 40.0% 37.5% 37.5%
52 27.0% 23.0% 30.0% 50.0% 40.0% 40.0%
53 27.0% 23.0% 20.0% 50.0% 42.5% 42.5%
54 27.0% 23.0% 20.0% 50.0% 45.0% 45.0%
55 33.0% 30.0% 31.0% 29.0% 47.5% 47.5%
56 33.0% 30.0% 20.0% 5.0% 50.0% 50.0%
57 48.0% 55.0% 5.0% 5.0% 52.5% 52.5%
58 48.0% 55.0% 5.0% 5.0% 55.0% 55.0%
59 55.0% 55.0% 5.0% 5.0% 57.5% 57.5%
60 55.0% 55.0% 5.0% 5.0% 60.0% 60.0%
61 55.0% 55.0% 5.0% 5.0% 62.5% 62.5%
62 45.5% 41.0% 5.0% 5.0% 50.0% 50.0%
63 5.0% 5.0% 5.0% 5.0% 15.0% 15.0%
64 5.0% 5.0% 5.0% 5.0% 15.0% 15.0%
65 5.0% 5.0% 5.0% 5.0% 15.0% 15.0%
66 5.0% 5.0% 5.0% 5.0% 15.0% 15.0%
67 5.0% 5.0% 5.0% 5.0% 15.0% 15.0%
68 5.0% 5.0% 5.0% 5.0% 15.0% 15.0%
69 5.0% 5.0% 5.0% 5.0% 15.0% 15.0%
70-79 5.0% 5.0% 0.0% 0.0% 15.0% 15.0%
80 0.0% 0.0% 0.0% 0.0% 0.0% 0.0%
RegularSpecial Risk and
Special Risk AdminAll Other
Age Female Male Female Male Female Male Female Male
45 0.0% 0.0% 4.0% 4.0% 0.0% 0.0% 0.0% 0.0%
46 0.0% 0.0% 4.0% 4.0% 0.0% 0.0% 0.0% 0.0%
47 0.0% 0.0% 4.0% 7.0% 0.0% 0.0% 0.0% 0.0%
48 4.0% 4.0% 4.0% 7.0% 10.0% 10.0% 5.0% 5.0%
49 4.0% 4.0% 4.0% 7.0% 10.0% 10.0% 5.0% 5.0%
50 4.0% 4.0% 7.0% 7.0% 10.0% 10.0% 5.0% 5.0%
51 4.0% 4.0% 7.0% 7.0% 10.0% 10.0% 5.0% 5.0%
52 4.0% 4.0% 7.0% 7.0% 10.0% 10.0% 5.0% 5.0%
53 4.0% 4.0% 7.0% 7.0% 10.0% 10.0% 5.0% 5.0%
54 5.0% 4.0% 7.0% 7.0% 10.0% 10.0% 5.0% 5.0%
55 5.0% 5.0% 7.0% 6.0% 10.0% 10.0% 5.0% 5.0%
56 7.0% 5.0% 6.0% 6.0% 10.0% 10.0% 5.0% 5.0%
57 7.0% 5.0% 6.0% 6.0% 10.0% 10.0% 5.0% 5.0%
58 7.0% 5.0% 6.0% 6.0% 10.0% 10.0% 10.0% 10.0%
59 7.0% 5.0% 6.0% 6.0% 10.0% 10.0% 10.0% 10.0%
60 7.0% 5.0% 6.0% 6.0% 10.0% 10.0% 10.0% 10.0%
61 9.0% 8.0% 10.0% 10.0% 10.0% 10.0% 10.0% 10.0%
62 9.0% 11.0% 15.0% 15.0% 10.0% 10.0% 10.0% 10.0%
63 9.0% 10.0% 20.0% 20.0% 10.0% 10.0% 5.0% 5.0%
64 9.0% 10.0% 25.0% 25.0% 10.0% 10.0% 5.0% 5.0%
65 15.0% 10.0% 30.0% 30.0% 10.0% 10.0% 5.0% 5.0%
66 10.0% 10.0% 35.0% 35.0% 10.0% 10.0% 5.0% 5.0%
67 10.0% 10.0% 35.0% 35.0% 10.0% 10.0% 5.0% 5.0%
68 10.0% 10.0% 35.0% 35.0% 10.0% 10.0% 5.0% 5.0%
69 10.0% 10.0% 35.0% 35.0% 10.0% 10.0% 5.0% 5.0%
70-79 10.0% 10.0% 100.0% 100.0% 10.0% 10.0% 5.0% 5.0%
80 100.0% 100.0% 100.0% 100.0% 100.0% 100.0% 100.0% 100.0%
RegularSpecial Risk and
Special Risk Admin
Senior Management
Service Class
Elected Officers'
(All Subclasses)

This work product was prepared solely for Florida Department of Management Services for the purposes described herein and may not be appropriate to use for other purposes. Milliman does not intend to benefit and assumes no duty or liability to other parties who receive this work. Milliman recommends that third parties be aided by their own actuary or other qualified professional when reviewing the Milliman work product.
A-5
Retirement Assumptions (Tier I) (continued)
Combined DROP/Immediate Retirement at first retirement eligibility
Deferred Retirement subsequent to first retirement eligibility
Age Female Male Female Male Female Male Female Male
45 0.0% 0.0% 24.0% 27.0% 0.0% 0.0% 0.0% 0.0%
46 0.0% 0.0% 24.0% 27.0% 0.0% 0.0% 0.0% 0.0%
47 0.0% 0.0% 24.0% 30.0% 0.0% 0.0% 0.0% 0.0%
48 31.0% 27.0% 24.0% 37.0% 40.0% 40.0% 35.0% 35.0%
49 31.0% 27.0% 24.0% 37.0% 42.5% 42.5% 37.5% 37.5%
50 31.0% 27.0% 27.0% 37.0% 45.0% 45.0% 40.0% 40.0%
51 31.0% 27.0% 27.0% 47.0% 47.5% 47.5% 42.5% 42.5%
52 31.0% 27.0% 37.0% 57.0% 50.0% 50.0% 45.0% 45.0%
53 31.0% 27.0% 27.0% 57.0% 52.5% 52.5% 47.5% 47.5%
54 32.0% 27.0% 27.0% 57.0% 55.0% 55.0% 50.0% 50.0%
55 38.0% 35.0% 38.0% 35.0% 57.5% 57.5% 52.5% 52.5%
56 40.0% 35.0% 26.0% 11.0% 60.0% 60.0% 55.0% 55.0%
57 55.0% 60.0% 11.0% 11.0% 62.5% 62.5% 57.5% 57.5%
58 55.0% 60.0% 11.0% 11.0% 65.0% 65.0% 65.0% 65.0%
59 62.0% 60.0% 11.0% 11.0% 67.5% 67.5% 67.5% 67.5%
60 62.0% 60.0% 11.0% 11.0% 70.0% 70.0% 70.0% 70.0%
61 64.0% 63.0% 15.0% 15.0% 72.5% 72.5% 72.5% 72.5%
62 54.5% 52.0% 20.0% 20.0% 60.0% 60.0% 60.0% 60.0%
63 14.0% 15.0% 25.0% 25.0% 25.0% 25.0% 20.0% 20.0%
64 14.0% 15.0% 30.0% 30.0% 25.0% 25.0% 20.0% 20.0%
65 20.0% 15.0% 35.0% 35.0% 25.0% 25.0% 20.0% 20.0%
66 15.0% 15.0% 40.0% 40.0% 25.0% 25.0% 20.0% 20.0%
67 15.0% 15.0% 40.0% 40.0% 25.0% 25.0% 20.0% 20.0%
68 15.0% 15.0% 40.0% 40.0% 25.0% 25.0% 20.0% 20.0%
69 15.0% 15.0% 40.0% 40.0% 25.0% 25.0% 20.0% 20.0%
70-79 15.0% 15.0% 100.0% 100.0% 25.0% 25.0% 20.0% 20.0%
80 100.0% 100.0% 100.0% 100.0% 100.0% 100.0% 100.0% 100.0%
RegularSpecial Risk and
Special Risk Admin
Senior Management
Service Class
Elected Officers'
(All Subclasses)
Age Female Male Female Male Female Male
45 0.0% 0.0% 3.0% 3.0% 0.0% 0.0%
46 0.0% 0.0% 3.0% 3.0% 0.0% 0.0%
47 0.0% 0.0% 3.0% 3.0% 0.0% 0.0%
48 2.0% 2.0% 4.0% 4.0% 5.0% 5.0%
49 2.0% 2.0% 4.0% 4.0% 5.0% 5.0%
50 2.0% 2.0% 4.0% 4.0% 5.0% 5.0%
51 2.0% 2.0% 4.0% 4.0% 5.0% 5.0%
52 2.0% 2.0% 5.0% 5.0% 5.0% 5.0%
53 2.0% 2.0% 5.0% 5.0% 5.0% 5.0%
54 2.0% 2.0% 5.0% 5.0% 5.0% 5.0%
55 2.0% 2.0% 5.0% 5.0% 5.0% 5.0%
56 2.0% 2.0% 5.0% 5.0% 5.0% 5.0%
57 2.0% 2.0% 5.0% 5.0% 5.0% 5.0%
58 3.5% 2.0% 5.0% 5.0% 5.0% 5.0%
59 5.0% 2.0% 5.0% 5.0% 5.0% 5.0%
60 5.0% 5.0% 7.0% 7.0% 5.0% 5.0%
61 5.0% 5.0% 9.0% 9.0% 5.0% 5.0%
62 12.0% 11.0% 20.0% 20.0% 15.0% 15.0%
63 8.0% 8.0% 20.0% 20.0% 11.0% 11.0%
64 8.0% 8.0% 20.0% 20.0% 11.0% 11.0%
65 15.0% 13.0% 20.0% 20.0% 15.0% 15.0%
66 15.0% 13.0% 25.0% 25.0% 15.0% 15.0%
67 15.0% 13.0% 25.0% 25.0% 15.0% 15.0%
68 15.0% 13.0% 25.0% 25.0% 15.0% 15.0%
69 15.0% 13.0% 25.0% 25.0% 15.0% 15.0%
70-79 15.0% 13.0% 100.0% 100.0% 15.0% 15.0%
80 100.0% 100.0% 100.0% 100.0% 100.0% 100.0%
Special Risk and
Special Risk AdminAll Other Regular

This work product was prepared solely for Florida Department of Management Services for the purposes described herein and may not be appropriate to use for other purposes. Milliman does not intend to benefit and assumes no duty or liability to other parties who receive this work. Milliman recommends that third parties be aided by their own actuary or other qualified professional when reviewing the Milliman work product.
A-6
Retirement Assumptions (Tier II)
DROP Entry at first retirement eligibility
Immediate Retirement at first retirement eligibility
Age Female Male Female Male Female Male
45 0.0% 0.0% 20.0% 23.0% 0.0% 0.0%
46 0.0% 0.0% 20.0% 23.0% 0.0% 0.0%
47 0.0% 0.0% 20.0% 23.0% 0.0% 0.0%
48 27.0% 23.0% 20.0% 30.0% 30.0% 30.0%
49 27.0% 23.0% 20.0% 30.0% 32.5% 32.5%
50 27.0% 23.0% 20.0% 30.0% 35.0% 35.0%
51 27.0% 23.0% 20.0% 40.0% 37.5% 37.5%
52 27.0% 23.0% 30.0% 50.0% 40.0% 40.0%
53 27.0% 23.0% 20.0% 50.0% 42.5% 42.5%
54 27.0% 23.0% 20.0% 50.0% 45.0% 45.0%
55 33.0% 30.0% 20.0% 50.0% 47.5% 47.5%
56 33.0% 30.0% 20.0% 50.0% 50.0% 50.0%
57 48.0% 55.0% 20.0% 50.0% 52.5% 52.5%
58 48.0% 55.0% 20.0% 50.0% 55.0% 55.0%
59 55.0% 55.0% 20.0% 50.0% 57.5% 57.5%
60 55.0% 55.0% 31.0% 29.0% 60.0% 60.0%
61 55.0% 55.0% 20.0% 5.0% 62.5% 62.5%
62 55.0% 55.0% 5.0% 5.0% 62.5% 62.5%
63 55.0% 55.0% 5.0% 5.0% 62.5% 62.5%
64 55.0% 55.0% 5.0% 5.0% 62.5% 62.5%
65 45.5% 41.0% 5.0% 5.0% 50.0% 50.0%
66 5.0% 5.0% 5.0% 5.0% 15.0% 15.0%
67 5.0% 5.0% 5.0% 5.0% 15.0% 15.0%
68 5.0% 5.0% 5.0% 5.0% 15.0% 15.0%
69 5.0% 5.0% 5.0% 5.0% 15.0% 15.0%
70-79 5.0% 5.0% 0.0% 0.0% 15.0% 15.0%
80 0.0% 0.0% 0.0% 0.0% 0.0% 0.0%
RegularSpecial Risk and
Special Risk AdminAll Other
Age Female Male Female Male Female Male Female Male
45 0.0% 0.0% 4.0% 4.0% 0.0% 0.0% 0.0% 0.0%
46 0.0% 0.0% 4.0% 4.0% 0.0% 0.0% 0.0% 0.0%
47 0.0% 0.0% 4.0% 7.0% 0.0% 0.0% 0.0% 0.0%
48 4.0% 4.0% 4.0% 7.0% 10.0% 10.0% 5.0% 5.0%
49 4.0% 4.0% 4.0% 7.0% 10.0% 10.0% 5.0% 5.0%
50 4.0% 4.0% 7.0% 7.0% 10.0% 10.0% 5.0% 5.0%
51 4.0% 4.0% 7.0% 7.0% 10.0% 10.0% 5.0% 5.0%
52 4.0% 4.0% 7.0% 7.0% 10.0% 10.0% 5.0% 5.0%
53 4.0% 4.0% 7.0% 7.0% 10.0% 10.0% 5.0% 5.0%
54 5.0% 4.0% 7.0% 7.0% 10.0% 10.0% 5.0% 5.0%
55 5.0% 5.0% 7.0% 6.0% 10.0% 10.0% 5.0% 5.0%
56 7.0% 5.0% 6.0% 6.0% 10.0% 10.0% 5.0% 5.0%
57 7.0% 5.0% 6.0% 6.0% 10.0% 10.0% 5.0% 5.0%
58 7.0% 5.0% 6.0% 6.0% 10.0% 10.0% 10.0% 10.0%
59 7.0% 5.0% 6.0% 6.0% 10.0% 10.0% 10.0% 10.0%
60 7.0% 5.0% 6.0% 6.0% 10.0% 10.0% 10.0% 10.0%
61 9.0% 8.0% 10.0% 10.0% 10.0% 10.0% 10.0% 10.0%
62 9.0% 8.0% 15.0% 15.0% 10.0% 10.0% 10.0% 10.0%
63 9.0% 8.0% 20.0% 20.0% 10.0% 10.0% 10.0% 10.0%
64 9.0% 8.0% 25.0% 25.0% 10.0% 10.0% 10.0% 10.0%
65 15.0% 11.0% 30.0% 30.0% 10.0% 10.0% 10.0% 10.0%
66 10.0% 10.0% 35.0% 35.0% 10.0% 10.0% 5.0% 5.0%
67 10.0% 10.0% 35.0% 35.0% 10.0% 10.0% 5.0% 5.0%
68 10.0% 10.0% 35.0% 35.0% 10.0% 10.0% 5.0% 5.0%
69 10.0% 10.0% 35.0% 35.0% 10.0% 10.0% 5.0% 5.0%
70-79 10.0% 10.0% 100.0% 100.0% 10.0% 10.0% 5.0% 5.0%
80 100.0% 100.0% 100.0% 100.0% 100.0% 100.0% 100.0% 100.0%
RegularSpecial Risk and
Special Risk Admin
Elected Officers'
(All Subclasses)
Senior Management
Service Class

This work product was prepared solely for Florida Department of Management Services for the purposes described herein and may not be appropriate to use for other purposes. Milliman does not intend to benefit and assumes no duty or liability to other parties who receive this work. Milliman recommends that third parties be aided by their own actuary or other qualified professional when reviewing the Milliman work product.
A-7
Retirement Assumptions (Tier II) (continued)
Combined DROP/Immediate Retirement at first retirement eligibility
Deferred Retirement subsequent to first retirement eligibility
Age Female Male Female Male Female Male Female Male
45 0.0% 0.0% 24.0% 27.0% 0.0% 0.0% 0.0% 0.0%
46 0.0% 0.0% 24.0% 27.0% 0.0% 0.0% 0.0% 0.0%
47 0.0% 0.0% 24.0% 30.0% 0.0% 0.0% 0.0% 0.0%
48 31.0% 27.0% 24.0% 37.0% 40.0% 40.0% 35.0% 35.0%
49 31.0% 27.0% 24.0% 37.0% 42.5% 42.5% 37.5% 37.5%
50 31.0% 27.0% 27.0% 37.0% 45.0% 45.0% 40.0% 40.0%
51 31.0% 27.0% 27.0% 47.0% 47.5% 47.5% 42.5% 42.5%
52 31.0% 27.0% 37.0% 57.0% 50.0% 50.0% 45.0% 45.0%
53 31.0% 27.0% 27.0% 57.0% 52.5% 52.5% 47.5% 47.5%
54 32.0% 27.0% 27.0% 57.0% 55.0% 55.0% 50.0% 50.0%
55 38.0% 35.0% 27.0% 56.0% 57.5% 57.5% 52.5% 52.5%
56 40.0% 35.0% 26.0% 56.0% 60.0% 60.0% 55.0% 55.0%
57 55.0% 60.0% 26.0% 56.0% 62.5% 62.5% 57.5% 57.5%
58 55.0% 60.0% 26.0% 56.0% 65.0% 65.0% 65.0% 65.0%
59 62.0% 60.0% 26.0% 56.0% 67.5% 67.5% 67.5% 67.5%
60 62.0% 60.0% 37.0% 35.0% 70.0% 70.0% 70.0% 70.0%
61 64.0% 63.0% 30.0% 15.0% 72.5% 72.5% 72.5% 72.5%
62 64.0% 63.0% 20.0% 20.0% 72.5% 72.5% 72.5% 72.5%
63 64.0% 63.0% 25.0% 25.0% 72.5% 72.5% 72.5% 72.5%
64 64.0% 63.0% 30.0% 30.0% 72.5% 72.5% 72.5% 72.5%
65 60.5% 52.0% 35.0% 35.0% 60.0% 60.0% 60.0% 60.0%
66 15.0% 15.0% 40.0% 40.0% 25.0% 25.0% 20.0% 20.0%
67 15.0% 15.0% 40.0% 40.0% 25.0% 25.0% 20.0% 20.0%
68 15.0% 15.0% 40.0% 40.0% 25.0% 25.0% 20.0% 20.0%
69 15.0% 15.0% 40.0% 40.0% 25.0% 25.0% 20.0% 20.0%
70-79 15.0% 15.0% 100.0% 100.0% 25.0% 25.0% 20.0% 20.0%
80 100.0% 100.0% 100.0% 100.0% 100.0% 100.0% 100.0% 100.0%
RegularSpecial Risk and
Special Risk Admin
Senior Management
Service Class
Elected Officers'
(All Subclasses)
Age Female Male Female Male Female Male
45 0.0% 0.0% 3.0% 3.0% 0.0% 0.0%
46 0.0% 0.0% 3.0% 3.0% 0.0% 0.0%
47 0.0% 0.0% 3.0% 3.0% 0.0% 0.0%
48 2.0% 2.0% 4.0% 4.0% 5.0% 5.0%
49 2.0% 2.0% 4.0% 4.0% 5.0% 5.0%
50 2.0% 2.0% 4.0% 4.0% 5.0% 5.0%
51 2.0% 2.0% 4.0% 4.0% 5.0% 5.0%
52 2.0% 2.0% 5.0% 5.0% 5.0% 5.0%
53 2.0% 2.0% 5.0% 5.0% 5.0% 5.0%
54 2.0% 2.0% 5.0% 5.0% 5.0% 5.0%
55 2.0% 2.0% 5.0% 5.0% 5.0% 5.0%
56 2.0% 2.0% 5.0% 5.0% 5.0% 5.0%
57 2.0% 2.0% 5.0% 5.0% 5.0% 5.0%
58 3.5% 2.0% 5.0% 5.0% 5.0% 5.0%
59 5.0% 2.0% 5.0% 5.0% 5.0% 5.0%
60 5.0% 5.0% 7.0% 7.0% 5.0% 5.0%
61 5.0% 5.0% 9.0% 9.0% 5.0% 5.0%
62 5.0% 5.0% 20.0% 20.0% 5.0% 5.0%
63 5.0% 5.0% 20.0% 20.0% 5.0% 5.0%
64 5.0% 5.0% 20.0% 20.0% 5.0% 5.0%
65 12.0% 11.0% 20.0% 20.0% 15.0% 15.0%
66 8.0% 8.0% 25.0% 25.0% 11.0% 11.0%
67 8.0% 8.0% 25.0% 25.0% 11.0% 11.0%
68 15.0% 13.0% 25.0% 25.0% 15.0% 15.0%
69 15.0% 13.0% 25.0% 25.0% 15.0% 15.0%
70-79 15.0% 13.0% 100.0% 100.0% 15.0% 15.0%
80 100.0% 100.0% 100.0% 100.0% 100.0% 100.0%
Special Risk and
Special Risk AdminAll Other Regular

This work product was prepared solely for Florida Department of Management Services for the purposes described herein and may not be appropriate to use for other purposes. Milliman does not intend to benefit and assumes no duty or liability to other parties who receive this work. Milliman recommends that third parties be aided by their own actuary or other qualified professional when reviewing the Milliman work product.
A-8
Line-of-Duty Disability Annual Rates
Age SR Male SR Female Other Male Other Female
20 0.010% 0.000% 0.000% 0.000%
21 0.010% 0.000% 0.000% 0.000%
22 0.010% 0.000% 0.000% 0.000%
23 0.010% 0.000% 0.000% 0.000%
24 0.010% 0.000% 0.000% 0.000%
25 0.010% 0.004% 0.001% 0.001%
26 0.010% 0.004% 0.001% 0.001%
27 0.010% 0.004% 0.001% 0.001%
28 0.010% 0.004% 0.001% 0.001%
29 0.010% 0.004% 0.001% 0.001%
30 0.010% 0.004% 0.001% 0.001%
31 0.010% 0.004% 0.001% 0.001%
32 0.010% 0.004% 0.001% 0.001%
33 0.010% 0.004% 0.001% 0.001%
34 0.010% 0.004% 0.001% 0.001%
35 0.010% 0.004% 0.001% 0.001%
36 0.010% 0.004% 0.001% 0.001%
37 0.010% 0.040% 0.001% 0.001%
38 0.020% 0.040% 0.001% 0.001%
39 0.020% 0.040% 0.001% 0.001%
40 0.020% 0.040% 0.001% 0.001%
41 0.020% 0.060% 0.004% 0.001%
42 0.020% 0.060% 0.004% 0.001%
43 0.020% 0.060% 0.004% 0.001%
44 0.040% 0.040% 0.004% 0.001%
45 0.060% 0.040% 0.004% 0.001%
46 0.080% 0.040% 0.004% 0.001%
47 0.100% 0.040% 0.004% 0.001%
48 0.120% 0.040% 0.004% 0.001%
49 0.140% 0.040% 0.004% 0.001%
50 0.140% 0.050% 0.006% 0.006%
51 0.100% 0.060% 0.006% 0.006%
52 0.100% 0.070% 0.006% 0.006%
53 0.100% 0.080% 0.006% 0.006%
54 0.100% 0.080% 0.006% 0.006%
55 0.100% 0.080% 0.006% 0.006%
56 0.100% 0.080% 0.006% 0.006%
57 0.100% 0.080% 0.006% 0.006%
58 0.100% 0.150% 0.006% 0.006%
59 0.100% 0.150% 0.010% 0.015%
60 0.140% 0.150% 0.010% 0.013%
61 0.180% 0.150% 0.010% 0.010%
62 0.220% 0.150% 0.010% 0.010%
63 0.260% 0.150% 0.010% 0.010%
64 0.300% 0.150% 0.010% 0.010%
65 0.260% 0.150% 0.010% 0.010%
66 0.240% 0.100% 0.010% 0.010%
67 0.200% 0.100% 0.010% 0.010%
68 0.100% 0.100% 0.010% 0.010%
69 0.100% 0.100% 0.010% 0.010%
70-79 0.100% 0.100% 0.010% 0.010%
80 0.100% 0.100% 0.001% 0.001%

This work product was prepared solely for Florida Department of Management Services for the purposes described herein and may not be appropriate to use for other purposes. Milliman does not intend to benefit and assumes no duty or liability to other parties who receive this work. Milliman recommends that third parties be aided by their own actuary or other qualified professional when reviewing the Milliman work product.
A-9
Non-Duty Disability Annual Rates
Age SR Male SR Female Other Male Other Female
20 0.020% 0.000% 0.000% 0.000%
21 0.020% 0.000% 0.010% 0.010%
22 0.020% 0.000% 0.010% 0.010%
23 0.020% 0.000% 0.010% 0.010%
24 0.020% 0.000% 0.010% 0.010%
25 0.020% 0.020% 0.010% 0.010%
26 0.020% 0.020% 0.010% 0.010%
27 0.020% 0.020% 0.010% 0.010%
28 0.030% 0.020% 0.010% 0.010%
29 0.030% 0.020% 0.010% 0.010%
30 0.030% 0.020% 0.010% 0.010%
31 0.030% 0.020% 0.010% 0.010%
32 0.030% 0.020% 0.010% 0.010%
33 0.030% 0.030% 0.010% 0.010%
34 0.030% 0.030% 0.020% 0.010%
35 0.030% 0.030% 0.020% 0.010%
36 0.030% 0.030% 0.020% 0.020%
37 0.030% 0.030% 0.020% 0.020%
38 0.030% 0.030% 0.020% 0.020%
39 0.030% 0.030% 0.020% 0.020%
40 0.030% 0.030% 0.020% 0.020%
41 0.030% 0.030% 0.040% 0.040%
42 0.030% 0.060% 0.040% 0.040%
43 0.030% 0.060% 0.040% 0.040%
44 0.030% 0.060% 0.080% 0.040%
45 0.030% 0.060% 0.080% 0.060%
46 0.030% 0.060% 0.080% 0.060%
47 0.080% 0.060% 0.080% 0.100%
48 0.080% 0.110% 0.080% 0.100%
49 0.080% 0.110% 0.120% 0.100%
50 0.080% 0.110% 0.160% 0.100%
51 0.080% 0.110% 0.200% 0.140%
52 0.080% 0.110% 0.200% 0.140%
53 0.050% 0.110% 0.200% 0.140%
54 0.050% 0.110% 0.200% 0.140%
55 0.050% 0.110% 0.250% 0.160%
56 0.050% 0.110% 0.250% 0.180%
57 0.050% 0.110% 0.250% 0.200%
58 0.050% 0.110% 0.300% 0.220%
59 0.050% 0.110% 0.300% 0.240%
60 0.050% 0.110% 0.300% 0.260%
61 0.050% 0.110% 0.200% 0.200%
62 0.050% 0.110% 0.150% 0.140%
63 0.050% 0.110% 0.100% 0.080%
64 0.050% 0.110% 0.100% 0.080%
65 0.050% 0.110% 0.100% 0.080%
66 0.050% 0.110% 0.040% 0.080%
67 0.050% 0.110% 0.040% 0.040%
68 0.050% 0.110% 0.040% 0.040%
69 0.050% 0.110% 0.040% 0.040%
70-79 0.050% 0.110% 0.040% 0.040%
80 0.050% 0.110% 0.040% 0.040%

Actuarial Valuation as of July 1, 2017
Florida Retirement System Pension Plan Appendix A
This work product was prepared solely for Florida Department of Management Services for the purposes described herein and may not be appropriate to use for other purposes. Milliman does not intend to benefit and assumes no duty or liability to other parties who receive this work. Milliman recommends that third parties be aided by their own actuary or other qualified professional when reviewing the Milliman work product.
A-10
Withdrawal – Other Terminations of Employment Annual Rates
Combined Years of Service 20 25 30 35 40 45 50 55 60 65
0 32.8% 27.2% 25.8% 25.8% 24.4% 24.4% 23.4% 27.4% 27.4% 27.4%
1 25.4% 18.5% 15.4% 14.3% 12.6% 12.5% 12.2% 12.2% 12.2% 12.2%
2 22.7% 17.2% 14.0% 12.8% 12.0% 11.6% 10.7% 10.7% 10.7% 10.7%
3 18.4% 14.6% 13.2% 12.6% 10.7% 10.3% 9.4% 9.3% 9.3% 9.3%
4 15.8% 12.7% 11.8% 10.9% 9.0% 8.8% 7.9% 7.8% 7.8% 7.8%
5 11.7% 9.7% 8.8% 8.5% 7.4% 6.8% 6.0% 6.8% 6.8% 6.8%
6 11.1% 8.5% 7.8% 7.5% 6.7% 6.5% 5.5% 5.4% 5.4% 5.4%
7 11.1% 8.4% 7.1% 6.8% 6.2% 6.0% 5.3% 5.2% 5.1% 5.1%
8 11.0% 7.7% 6.4% 6.2% 5.8% 5.1% 4.6% 4.4% 4.3% 4.3%
9 10.0% 6.3% 5.5% 5.3% 5.3% 5.1% 4.6% 4.3% 4.2% 4.2%
10+ 9.8% 6.2% 4.7% 4.2% 3.0% 2.7% 3.0% 4.5% 5.3% 3.7%
Combined Years
of Service 20 25 30 35 40 45 50 55 60 65
0 30.3% 26.6% 25.4% 25.4% 24.4% 24.4% 23.2% 23.2% 23.2% 23.2%
1 25.8% 19.8% 16.9% 15.9% 14.0% 13.9% 13.4% 13.4% 13.4% 13.4%
2 22.1% 17.1% 14.5% 13.5% 12.1% 11.9% 11.0% 11.0% 11.0% 11.0%
3 17.4% 13.0% 11.6% 11.2% 10.0% 9.8% 8.8% 8.7% 8.7% 8.7%
4 15.4% 12.9% 11.3% 10.9% 9.1% 8.8% 8.4% 8.3% 8.3% 8.3%
5 13.5% 10.7% 9.4% 9.0% 7.0% 6.7% 6.2% 6.1% 6.1% 6.1%
6 11.4% 9.7% 8.7% 8.0% 6.5% 6.5% 5.9% 5.8% 5.8% 5.8%
7 11.3% 9.2% 8.1% 7.8% 6.3% 6.1% 5.5% 5.4% 5.4% 5.4%
8 10.5% 7.8% 7.1% 6.8% 6.1% 5.8% 5.5% 5.4% 5.4% 5.4%
9 10.2% 7.1% 6.5% 6.2% 5.0% 4.7% 4.6% 4.5% 4.5% 4.5%
10+ 11.6% 5.3% 5.4% 4.6% 3.3% 3.0% 3.0% 3.0% 3.0% 3.0%
Attained Age
Regular – Female
Attained Age
Regular – Male

Actuarial Valuation as of July 1, 2017
Florida Retirement System Pension Plan Appendix A
This work product was prepared solely for Florida Department of Management Services for the purposes described herein and may not be appropriate to use for other purposes. Milliman does not intend to benefit and assumes no duty or liability to other parties who receive this work. Milliman recommends that third parties be aided by their own actuary or other qualified professional when reviewing the Milliman work product.
A-11
Withdrawal (continued)
Combined Years
of Service 20 25 30 35 40 45 50 55 60 65
0 8.2% 8.2% 8.2% 8.2% 8.2% 8.2% 8.2% 8.2% 8.2% 8.2%
1 3.8% 3.8% 3.8% 3.8% 3.8% 3.8% 3.8% 3.8% 3.8% 3.8%
2 1.9% 1.9% 1.9% 1.9% 1.9% 1.9% 1.9% 1.9% 1.9% 1.9%
3 3.0% 3.0% 3.0% 3.0% 3.0% 3.0% 3.0% 3.0% 3.0% 3.0%
4 20.0% 20.0% 20.0% 20.0% 20.0% 20.0% 20.0% 20.0% 20.0% 20.0%
5 2.3% 2.3% 2.3% 2.3% 2.3% 2.3% 2.3% 2.3% 2.3% 2.3%
6 2.7% 2.7% 2.7% 2.7% 2.7% 2.7% 2.7% 2.7% 2.7% 2.7%
7 2.4% 2.4% 2.4% 2.4% 2.4% 2.4% 2.4% 2.4% 2.4% 2.4%
8 13.8% 13.8% 13.8% 13.8% 13.8% 13.8% 13.6% 13.4% 13.3% 11.5%
9 4.8% 4.8% 4.8% 4.8% 4.8% 4.8% 4.6% 4.4% 4.3% 2.5%
10+ 5.7% 5.7% 5.7% 5.7% 5.7% 5.7% 5.6% 5.3% 5.2% 3.5%
Combined Years
of Service 20 25 30 35 40 45 50 55 60 65
0 0 0 0 0 0 0 0 0 0 0
1 2.2% 2.2% 2.2% 2.2% 2.2% 2.2% 2.2% 2.2% 2.2% 2.2%
2 4.5% 4.5% 4.5% 4.5% 4.5% 4.5% 4.5% 4.5% 4.5% 4.5%
3 2.5% 2.5% 2.5% 2.5% 2.5% 2.5% 2.5% 2.5% 2.5% 2.5%
4 18.1% 18.1% 18.1% 18.1% 18.1% 18.1% 18.1% 18.1% 18.1% 18.1%
5 3.2% 3.2% 3.2% 3.2% 3.2% 3.2% 3.2% 3.2% 3.2% 3.2%
6 1.5% 1.5% 1.5% 1.5% 1.5% 1.5% 1.5% 1.5% 1.5% 1.5%
7 1.5% 1.5% 1.5% 1.5% 1.5% 1.5% 1.5% 1.5% 1.5% 1.5%
8 12.0% 12.0% 12.0% 12.0% 12.0% 12.0% 11.9% 11.7% 11.6% 10.2%
9 3.2% 3.2% 3.2% 3.2% 3.2% 3.2% 3.1% 2.8% 2.7% 1.0%
10+ 4.2% 4.2% 4.2% 4.2% 4.2% 4.2% 4.1% 3.9% 3.8% 2.4%
Elected Officers' Class: Local – Male
Attained Age
Elected Officers' Class: Local – Female
Attained Age

Actuarial Valuation as of July 1, 2017
Florida Retirement System Pension Plan Appendix A
This work product was prepared solely for Florida Department of Management Services for the purposes described herein and may not be appropriate to use for other purposes. Milliman does not intend to benefit and assumes no duty or liability to other parties who receive this work. Milliman recommends that third parties be aided by their own actuary or other qualified professional when reviewing the Milliman work product.
A-12
Combined Years
of Service 20 25 30 35 40 45 50 55 60 65
0 4.2% 4.2% 4.2% 4.2% 4.2% 4.2% 4.2% 4.2% 4.2% 4.2%
1 4.3% 4.3% 4.3% 4.3% 4.3% 4.3% 4.3% 4.3% 4.3% 4.3%
2 11.7% 11.7% 11.7% 11.7% 11.7% 11.7% 11.7% 11.7% 11.7% 11.7%
3 3.9% 3.9% 3.9% 3.9% 3.9% 3.9% 3.9% 3.9% 3.9% 3.9%
4 20.0% 20.0% 20.0% 20.0% 20.0% 20.0% 20.0% 20.0% 20.0% 20.0%
5 4.0% 4.0% 4.0% 4.0% 4.0% 4.0% 4.0% 4.0% 4.0% 4.0%
6 10.6% 10.6% 10.6% 10.6% 10.6% 10.6% 10.6% 10.6% 10.6% 10.6%
7 1.6% 1.6% 1.6% 1.6% 1.6% 1.6% 1.6% 1.6% 1.6% 1.6%
8 20.2% 20.2% 20.2% 20.2% 20.2% 20.8% 20.0% 18.7% 18.4% 16.7%
9 6.6% 6.6% 6.6% 6.6% 6.6% 7.2% 6.4% 5.2% 4.9% 3.1%
10+ 6.7% 6.7% 6.7% 6.7% 6.7% 7.1% 6.6% 5.7% 5.5% 4.2%
Combined Years
of Service 20 25 30 35 40 45 50 55 60 65
0 0.0% 0.0% 0.0% 0.0% 0.0% 0.0% 0.0% 0.0% 0.0% 0.0%
1 9.1% 9.1% 9.1% 9.1% 9.1% 9.1% 9.1% 9.1% 9.1% 9.1%
2 15.9% 15.9% 15.9% 15.9% 15.9% 15.9% 15.9% 15.9% 15.9% 15.9%
3 4.5% 4.5% 4.5% 4.5% 4.5% 4.5% 4.5% 4.5% 4.5% 4.5%
4 16.3% 16.3% 16.3% 16.3% 16.3% 16.3% 16.3% 16.3% 16.3% 16.3%
5 0.0% 0.0% 0.0% 0.0% 0.0% 0.0% 0.0% 0.0% 0.0% 0.0%
6 7.5% 7.5% 7.5% 7.5% 7.5% 7.5% 7.5% 7.5% 7.5% 7.5%
7 0.0% 0.0% 0.0% 0.0% 0.0% 0.0% 0.0% 0.0% 0.0% 0.0%
8 17.8% 17.8% 17.8% 17.8% 17.8% 18.4% 17.6% 16.3% 16.0% 14.3%
9 3.5% 3.5% 3.5% 3.5% 3.5% 4.1% 3.3% 2.1% 1.8% 0.0%
10+ 10.8% 10.8% 10.8% 10.8% 10.8% 11.4% 10.6% 9.4% 9.1% 7.3%
Elected Officers' Class: Leg-Atty-Cab – Male
Elected Officers' Class: Leg-Atty-Cab – Female
Attained Age
Attained Age
Withdrawal (continued)

Actuarial Valuation as of July 1, 2017
Florida Retirement System Pension Plan Appendix A
This work product was prepared solely for Florida Department of Management Services for the purposes described herein and may not be appropriate to use for other purposes. Milliman does not intend to benefit and assumes no duty or liability to other parties who receive this work. Milliman recommends that third parties be aided by their own actuary or other qualified professional when reviewing the Milliman work product.
A-13
Withdrawal (continued)
Combined Years
of Service 20 25 30 35 40 45 50 55 60 65
0 0.9% 0.9% 0.9% 0.9% 0.9% 0.9% 0.9% 0.9% 0.9% 0.9%
1 0.9% 0.9% 0.9% 0.9% 0.9% 0.9% 0.9% 0.9% 0.9% 0.9%
2 0.9% 0.9% 0.9% 0.9% 0.9% 0.9% 0.9% 0.9% 0.9% 0.9%
3 0.9% 0.9% 0.9% 0.9% 0.9% 0.9% 0.9% 0.9% 0.9% 0.9%
4 3.0% 3.0% 3.0% 3.0% 3.0% 3.0% 3.0% 3.0% 3.0% 3.0%
5 0.5% 0.5% 0.5% 0.5% 0.5% 0.5% 0.5% 0.5% 0.5% 0.5%
6 0.5% 0.5% 0.5% 0.5% 0.5% 0.5% 0.5% 0.5% 0.5% 0.5%
7 0.5% 0.5% 0.5% 0.5% 0.5% 0.5% 0.5% 0.5% 0.5% 0.5%
8 0.5% 0.5% 0.5% 0.5% 0.5% 0.5% 0.5% 0.5% 0.5% 0.5%
9 1.3% 1.3% 1.3% 1.2% 1.2% 1.2% 1.1% 0.8% 0.7% 0.5%
10+ 2.0% 2.0% 2.0% 1.9% 1.9% 1.9% 1.7% 1.3% 1.1% 0.7%
Combined Years
of Service 20 25 30 35 40 45 50 55 60 65
0 1.5% 1.5% 1.5% 1.5% 1.5% 1.5% 1.5% 1.5% 1.5% 1.5%
1 1.5% 1.5% 1.5% 1.5% 1.5% 1.5% 1.5% 1.5% 1.5% 1.5%
2 1.5% 1.5% 1.5% 1.5% 1.5% 1.5% 1.5% 1.5% 1.5% 1.5%
3 1.5% 1.5% 1.5% 1.5% 1.5% 1.5% 1.5% 1.5% 1.5% 1.5%
4 4.6% 4.6% 4.6% 4.6% 4.6% 4.6% 4.6% 4.6% 4.6% 4.6%
5 1.5% 1.5% 1.5% 1.5% 1.5% 1.5% 1.5% 1.5% 1.5% 1.5%
6 1.5% 1.5% 1.5% 1.5% 1.5% 1.5% 1.5% 1.5% 1.5% 1.5%
7 1.5% 1.5% 1.5% 1.5% 1.5% 1.5% 1.5% 1.5% 1.5% 1.5%
8 1.5% 1.5% 1.5% 1.5% 1.5% 1.5% 1.5% 1.5% 1.5% 1.5%
9 1.5% 1.5% 1.5% 1.5% 1.5% 1.5% 1.4% 1.1% 1.0% 0.8%
10+ 2.9% 2.9% 2.9% 2.7% 2.7% 2.7% 2.4% 2.0% 1.8% 1.4%
Elected Officers' Class: Judicial – Male
Attained Age
Elected Officers' Class: Judicial – Female
Attained Age

Actuarial Valuation as of July 1, 2017
Florida Retirement System Pension Plan Appendix A
This work product was prepared solely for Florida Department of Management Services for the purposes described herein and may not be appropriate to use for other purposes. Milliman does not intend to benefit and assumes no duty or liability to other parties who receive this work. Milliman recommends that third parties be aided by their own actuary or other qualified professional when reviewing the Milliman work product.
A-14
Withdrawal (continued)
Combined Years
of Service 20 25 30 35 40 45 50 55 60 65
0 8.5% 8.5% 8.5% 8.5% 8.5% 8.5% 8.5% 8.5% 8.5% 8.5%
1 21.0% 17.5% 15.5% 14.6% 14.1% 14.1% 14.1% 14.1% 14.1% 14.1%
2 21.0% 17.5% 15.5% 14.6% 14.1% 14.1% 14.1% 14.1% 14.1% 14.1%
3 19.5% 18.5% 17.7% 17.1% 16.7% 16.4% 16.2% 16.0% 16.0% 16.0%
4 15.5% 14.9% 14.5% 13.6% 12.9% 12.6% 12.4% 12.3% 12.2% 12.2%
5 10.9% 10.5% 10.0% 9.7% 9.3% 8.6% 8.2% 8.1% 8.0% 8.0%
6 10.6% 10.3% 9.8% 9.3% 9.0% 8.7% 8.4% 8.3% 8.1% 8.1%
7 10.5% 10.2% 9.7% 9.2% 8.8% 8.5% 8.3% 8.1% 8.0% 8.0%
8 9.6% 9.5% 9.1% 8.8% 8.5% 8.3% 8.1% 8.0% 7.9% 7.8%
9 6.6% 6.6% 6.3% 6.1% 5.9% 5.7% 5.6% 5.4% 5.3% 5.3%
10+ 4.8% 4.8% 4.1% 3.6% 3.2% 2.9% 3.0% 3.1% 3.5% 2.6%
Combined Years
of Service 20 25 30 35 40 45 50 55 60 65
0 8.5% 8.5% 8.5% 8.5% 8.5% 8.5% 8.5% 8.5% 8.5% 8.5%
1 15.5% 13.0% 11.8% 11.1% 10.8% 10.8% 10.8% 10.8% 10.8% 10.8%
2 18.3% 16.0% 14.7% 13.8% 13.4% 13.2% 13.2% 13.2% 13.2% 13.2%
3 17.1% 16.2% 15.5% 15.0% 14.6% 14.3% 14.1% 14.0% 14.0% 14.0%
4 12.1% 11.3% 10.5% 9.9% 9.4% 9.0% 8.7% 8.6% 8.5% 8.5%
5 12.1% 11.3% 10.5% 9.9% 9.4% 9.0% 8.7% 8.6% 8.5% 8.5%
6 10.9% 10.6% 10.1% 9.7% 9.4% 9.1% 8.8% 8.7% 8.5% 8.5%
7 10.3% 10.1% 9.6% 9.2% 8.8% 8.6% 8.4% 8.2% 8.1% 8.1%
8 7.7% 7.6% 7.1% 6.8% 6.5% 6.2% 6.0% 5.9% 5.8% 5.7%
9 7.4% 7.4% 6.9% 6.5% 6.1% 5.8% 5.5% 5.3% 5.1% 5.1%
10+ 4.8% 4.8% 3.9% 3.2% 2.7% 2.4% 2.1% 1.9% 1.9% 1.9%
Senior Management – Male
Attained Age
Senior Management – Female
Attained Age

Actuarial Valuation as of July 1, 2017
Florida Retirement System Pension Plan Appendix A
This work product was prepared solely for Florida Department of Management Services for the purposes described herein and may not be appropriate to use for other purposes. Milliman does not intend to benefit and assumes no duty or liability to other parties who receive this work. Milliman recommends that third parties be aided by their own actuary or other qualified professional when reviewing the Milliman work product.
A-15
Withdrawal (continued)
Combined Years of Service 20 25 30 35 40 45 50 55 60 65
0 21.4% 20.6% 20.6% 20.6% 20.6% 20.6% 20.6% 20.6% 20.6% 20.6%
1 10.3% 9.8% 9.5% 8.8% 8.0% 7.3% 6.5% 5.8% 5.3% 5.3%
2 8.6% 8.1% 7.7% 7.4% 6.8% 6.0% 5.3% 4.7% 4.7% 4.7%
3 8.4% 7.9% 7.5% 7.2% 6.7% 6.0% 5.3% 4.7% 4.7% 4.7%
4 7.5% 7.0% 6.7% 6.5% 6.0% 5.5% 5.0% 4.6% 4.6% 4.6%
5 5.3% 5.3% 5.3% 5.3% 4.8% 4.3% 3.8% 3.3% 3.3% 3.3%
6 5.2% 5.2% 5.2% 5.1% 4.6% 4.1% 3.6% 3.2% 3.2% 3.2%
7 3.1% 3.1% 3.1% 3.1% 3.1% 3.1% 3.1% 3.1% 3.1% 3.1%
8 2.9% 2.9% 2.9% 2.9% 2.9% 2.9% 2.9% 2.9% 2.9% 2.9%
9 2.6% 2.6% 2.6% 2.6% 2.6% 2.6% 2.6% 2.6% 2.6% 2.6%
10+ 2.3% 2.3% 2.1% 2.0% 1.9% 1.8% 1.8% 1.8% 1.8% 1.8%
Combined Years
of Service 20 25 30 35 40 45 50 55 60 65
0 21.3% 21.3% 21.3% 21.3% 21.3% 21.3% 21.3% 21.3% 21.3% 21.3%
1 15.5% 14.2% 13.2% 12.2% 11.2% 10.2% 9.2% 8.4% 8.4% 8.4%
2 12.3% 11.6% 10.6% 9.6% 8.6% 7.6% 6.6% 5.8% 5.8% 5.8%
3 10.3% 9.8% 9.3% 8.8% 8.3% 7.6% 6.6% 5.6% 5.6% 5.6%
4 9.7% 9.2% 8.7% 8.4% 7.6% 7.0% 6.4% 5.4% 5.4% 5.4%
5 6.1% 6.1% 6.1% 6.1% 6.1% 6.1% 6.1% 5.3% 5.3% 5.3%
6 5.9% 5.9% 5.9% 5.9% 5.9% 5.9% 5.9% 5.1% 5.1% 5.1%
7 5.0% 5.0% 5.0% 5.0% 5.0% 5.0% 5.0% 5.0% 5.0% 5.0%
8 4.2% 4.2% 4.2% 4.2% 4.1% 4.1% 4.1% 4.1% 4.1% 4.1%
9 4.2% 4.2% 4.2% 4.1% 4.1% 4.1% 4.0% 4.0% 4.0% 4.0%
10+ 1.9% 1.9% 1.7% 1.5% 2.5% 2.5% 1.6% 4.0% 4.0% 4.0%
Special Risk – Male
Attained Age
Special Risk – Female
Attained Age

Actuarial Valuation as of July 1, 2017
Florida Retirement System Pension Plan Appendix A
This work product was prepared solely for Florida Department of Management Services for the purposes described herein and may not be appropriate to use for other purposes. Milliman does not intend to benefit and assumes no duty or liability to other parties who receive this work. Milliman recommends that third parties be aided by their own actuary or other qualified professional when reviewing the Milliman work product.
A-16
Withdrawal (continued)
Combined Years of Service 20 25 30 35 40 45 50 55 60 65
0 14.6% 13.9% 13.9% 13.9% 13.9% 13.9% 13.9% 13.9% 13.9% 13.9%
1 11.3% 10.8% 10.3% 9.9% 9.7% 9.5% 9.4% 9.4% 9.4% 9.4%
2 10.4% 9.7% 9.3% 8.9% 8.7% 8.5% 8.4% 8.4% 8.4% 8.4%
3 9.7% 9.1% 8.7% 8.3% 7.9% 7.8% 7.7% 7.6% 7.6% 7.6%
4 8.8% 8.3% 8.0% 7.8% 7.6% 7.4% 7.4% 7.4% 7.4% 7.4%
5 4.5% 4.5% 4.5% 4.5% 4.5% 4.5% 4.5% 4.5% 4.5% 4.5%
6 4.4% 4.4% 4.4% 4.2% 3.9% 3.9% 3.9% 3.9% 3.9% 3.9%
7 3.8% 3.8% 3.8% 3.8% 3.8% 3.8% 3.8% 3.8% 3.8% 3.8%
8 3.4% 3.4% 3.4% 3.4% 3.4% 3.4% 3.4% 3.4% 3.4% 3.4%
9 3.3% 3.3% 3.3% 3.3% 3.3% 3.3% 3.3% 3.3% 3.3% 3.3%
10+ 3.9% 3.9% 3.6% 3.4% 3.2% 3.3% 3.6% 7.5% 7.5% 7.5%
Combined Years
of Service 20 25 30 35 40 45 50 55 60 65
0 22.5% 22.5% 22.5% 22.5% 22.5% 22.5% 22.5% 22.5% 22.5% 22.5%
1 19.4% 18.0% 17.1% 16.5% 16.1% 15.9% 15.7% 15.7% 15.7% 15.7%
2 17.5% 16.9% 16.5% 16.2% 15.9% 15.8% 15.7% 15.7% 15.7% 15.7%
3 20.3% 19.8% 19.3% 19.0% 18.7% 18.6% 18.4% 18.4% 18.4% 18.4%
4 20.8% 20.2% 19.8% 19.4% 19.0% 18.8% 18.7% 18.7% 18.7% 18.7%
5 18.8% 18.8% 18.8% 18.8% 18.8% 18.8% 18.8% 18.8% 18.8% 18.8%
6 18.7% 18.7% 18.7% 18.7% 18.7% 18.7% 18.7% 18.7% 18.7% 18.7%
7 17.9% 17.9% 17.9% 17.9% 17.9% 17.9% 17.9% 17.9% 17.9% 17.9%
8 17.8% 17.8% 17.7% 17.7% 17.7% 17.6% 17.6% 17.6% 17.6% 17.6%
9 17.8% 17.8% 17.8% 17.8% 17.7% 17.7% 17.6% 17.6% 17.6% 17.6%
10+ 18.4% 18.4% 18.1% 17.8% 17.6% 17.7% 18.0% 21.0% 21.0% 21.0%
Special Risk Administrative – Male
Attained Age
Special Risk Administrative – Female
Attained Age

Actuarial Valuation as of July 1, 2017
Florida Retirement System Pension Plan Appendix A
This work product was prepared solely for Florida Department of Management Services for the purposes described herein and may not be appropriate to use for other purposes. Milliman does not intend to benefit and assumes no duty or liability to other parties who receive this work. Milliman recommends that third parties be aided by their own actuary or other qualified professional when reviewing the Milliman work product.
A-17
Individual Member Salary Increase Assumptions
(Based on 2.60% inflation assumption)
Combined Years
of ServiceFemale Male Female Male Female Male Female Male Female Male Female Male Female Male
0 7.80% 7.60% 7.60% 7.80% 4.60% 7.00% 4.10% 4.10% 5.20% 4.70% 4.10% 4.10%
1 5.50% 5.70% 5.90% 6.50% 4.60% 7.00% 4.10% 4.10% 5.20% 4.70% 4.10% 4.10% 6.60% 7.10%
2 5.00% 5.30% 5.60% 6.10% 4.60% 7.00% 4.10% 4.10% 5.20% 4.70% 4.10% 4.10% 6.20% 6.40%
3 5.00% 5.10% 5.60% 6.00% 4.60% 7.00% 4.10% 4.10% 5.20% 4.70% 4.10% 4.10% 6.20% 6.10%
4 4.90% 5.00% 5.60% 6.00% 4.60% 6.00% 4.10% 4.10% 5.20% 4.70% 4.10% 4.10% 5.30% 5.40%
5 4.80% 4.90% 5.60% 6.00% 4.60% 6.00% 4.10% 4.10% 5.20% 4.70% 4.10% 4.10% 5.30% 5.00%
6 4.80% 4.80% 5.60% 5.90% 4.60% 6.00% 4.10% 4.10% 5.20% 4.70% 4.10% 4.10% 5.30% 5.00%
7 4.70% 4.80% 5.50% 5.70% 4.60% 6.00% 4.10% 4.10% 5.20% 4.70% 4.10% 4.10% 4.80% 4.70%
8 4.60% 4.70% 5.50% 5.70% 4.60% 6.00% 4.10% 4.10% 5.20% 4.70% 4.10% 4.10% 4.80% 4.70%
9 4.60% 4.70% 5.50% 5.70% 4.60% 6.00% 4.10% 4.10% 5.20% 4.70% 4.10% 4.10% 4.80% 4.70%
10 4.60% 4.50% 5.50% 5.60% 4.60% 6.00% 4.10% 4.10% 5.20% 4.70% 4.10% 4.10% 4.80% 4.70%
11 4.50% 4.50% 5.30% 5.60% 4.60% 6.00% 4.10% 4.10% 5.20% 4.70% 4.10% 4.10% 4.80% 4.70%
12 4.40% 4.50% 5.30% 5.40% 4.60% 6.00% 4.10% 4.10% 5.20% 4.70% 4.10% 4.10% 4.80% 4.70%
13 4.40% 4.50% 5.20% 5.40% 4.60% 6.00% 4.10% 4.10% 5.20% 4.70% 4.10% 4.10% 4.80% 4.70%
14 4.40% 4.50% 5.20% 5.30% 4.60% 6.00% 4.10% 4.10% 5.20% 4.70% 4.10% 4.10% 4.80% 4.30%
15 4.40% 4.40% 5.20% 5.30% 4.60% 6.00% 4.10% 4.10% 5.20% 4.70% 4.10% 4.10% 4.80% 4.30%
16 4.40% 4.40% 5.00% 5.30% 4.60% 6.00% 4.10% 4.10% 5.20% 4.70% 4.10% 4.10% 4.80% 4.30%
17 4.40% 4.40% 5.00% 5.30% 4.60% 6.00% 4.10% 4.10% 5.20% 4.70% 4.10% 4.10% 4.30% 4.30%
18 4.30% 4.30% 5.00% 5.30% 4.60% 6.00% 4.10% 4.10% 5.20% 4.70% 4.10% 4.10% 4.30% 4.30%
19 4.30% 4.30% 5.00% 5.20% 4.60% 6.00% 4.10% 4.10% 5.20% 4.70% 4.10% 4.10% 4.30% 4.30%
20 4.30% 4.30% 5.00% 5.20% 4.60% 6.00% 4.10% 4.10% 5.20% 4.70% 4.10% 4.10% 4.30% 4.30%
21 4.20% 4.30% 5.00% 5.10% 4.60% 5.30% 4.10% 4.10% 5.20% 4.70% 4.10% 4.10% 4.30% 4.30%
22 4.20% 4.30% 5.00% 5.00% 4.60% 5.30% 4.10% 4.10% 5.20% 4.70% 4.10% 4.10% 4.30% 4.30%
23 4.10% 4.20% 5.00% 5.00% 4.60% 5.30% 4.10% 4.10% 5.20% 4.70% 4.10% 4.10% 4.30% 4.30%
24 4.10% 4.10% 5.10% 5.40% 4.60% 5.30% 4.10% 4.10% 5.20% 4.70% 4.10% 4.10% 4.30% 4.30%
25 4.00% 4.00% 5.10% 5.40% 4.60% 5.30% 4.10% 4.10% 5.20% 4.70% 4.10% 4.10% 4.30% 4.00%
26 3.90% 4.00% 5.10% 5.40% 4.60% 5.30% 4.10% 4.10% 5.20% 4.70% 4.10% 4.10% 4.30% 4.00%
27 3.80% 4.00% 5.10% 5.40% 4.60% 5.30% 4.10% 4.10% 5.20% 4.70% 4.10% 4.10% 4.30% 4.00%
28 3.70% 3.90% 5.10% 5.40% 4.60% 5.30% 4.10% 4.10% 5.20% 4.70% 4.10% 4.10% 4.30% 4.00%
29 4.00% 4.40% 5.10% 5.40% 4.60% 5.30% 4.10% 4.10% 5.20% 4.70% 4.10% 4.10% 5.20% 4.70%
30+ 4.00% 4.40% 5.10% 5.40% 4.60% 5.30% 4.10% 4.10% 5.20% 4.70% 4.10% 4.10% 5.20% 4.70%
-- Elected Officers' Class --
Senior ManagementRegular Special Risk Special Risk Admin Local Leg-Atty-Cab Judicial

Actuarial Valuation as of July 1, 2017
Florida Retirement System Pension Plan Appendix A
This work product was prepared solely for Florida Department of Management Services for the purposes described herein and may not be appropriate to use for other purposes. Milliman does not intend to benefit and assumes no duty or liability to other parties who receive this work. Milliman recommends that third parties be aided by their own actuary or other qualified professional when reviewing the Milliman work product.
A-18
Unused Annual Leave Available at Retirement
Membership Class Hours
Regular 230
Special Risk 290
Senior Management 290
Others Not Listed Above 230
Eligible Survivors
It is assumed that 80% of deceased active members will have survivors eligible for lifetime benefits upon their
death. Males are assumed to be three years older than their female spouses.
Commencement of Survivor Benefits
It is assumed that survivors of deceased active members will defer commencement of benefits until the following:
Membership Class / Tier Member Age
Special Risk / Tier 1 45
Special Risk / Tier 2 50
Other classes/ Tier 1 and 2 55
Military Service and Out-of-State Service Credits
Active members are assumed to have purchased the following additional years of service credit.
Type of Service Credit
Special Risk Class All other classes
Men Women Men Women
Military Service Credit 1 0.2818 0 0.1853 0
Out-of-State Service Credit 2 0 0 0.0910 0.0910
1 Pre-1987 hires only; service is eligible for the COLA. 2 Service for pre-July 1, 2011 enrollees is eligible for the COLA; assumption applies to both tiers.
No extra service credit was assumed for TRS and IFAS participants.
Changes to the Actuarial Assumptions
The 2014 Experience Study was the most recent experience study review and informs most assumptions used in
this valuation. For this valuation, the 2017 FRS Actuarial Assumption Conference adopted a new assumption for
investment return.

Actuarial Valuation as of July 1, 2017
Florida Retirement System Pension Plan Appendix B
This work product was prepared solely for Florida Department of Management Services for the purposes described herein and may not be appropriate to use for other purposes. Milliman does not intend to benefit and assumes no duty or liability to other parties who receive this work. Milliman recommends that third parties be aided by their own actuary or other qualified professional when reviewing the Milliman work product.
B-1
Appendix B: Summary of Plan Provisions
All actuarial calculations are based upon our understanding of Florida Statutes regarding the benefit and eligibility
provisions of the retirement systems. These provisions are briefly summarized below for reference purposes,
along with corresponding references to the Statutes. This summary encompasses the major provisions; it does
not attempt to cover all of the detailed provisions.
Florida Retirement System (FRS)
The benefit, eligibility, and contribution provisions of the FRS are set forth in Chapter 121 of the Florida Statutes.
Provisions relating to other State-administered retirement systems are set forth in other sections of the Florida
Statutes, under Chapters 112, 122, and 238.
Effective Date
The effective date of the FRS was December 1, 1970. The FRS was created with closure and consolidation of the
Teachers’ Retirement System, the State and County Officers and Employees’ Retirement System, and the
Highway Patrol Pension Fund. In 1972, the Judicial Retirement System was also consolidated with the FRS. The
FRS was created to provide a defined benefit retirement, disability, and survivor program for participating public
employees. Social Security coverage is also required for all members.
Beginning in 2002, the FRS became one system with two primary programs, the existing defined benefit FRS
Pension Plan and a defined contribution plan alternative known as the FRS Investment Plan (IP). The earliest that
any member could participate in the IP was July 1, 2002.
As of July 1, 2007, the Institute for Food and Agricultural Sciences Supplemental Retirement Program was
consolidated under the FRS as a closed group.
(Section 121.011(2))
Membership
Membership is a condition of employment for all new state, county, or other participating agency employees filling
regularly established positions and employed on or after December 1, 1970, or who elected to transfer from an
existing system. Employees may be full-time or part-time and can be elected, appointed, or employed in state
government, county government, a state university, or a community college. A city or special district may join the
FRS at its option.
Effective July 1, 1978, a member in an existing retirement system who is re-employed after termination of
employment may remain in that system, provided his or her member contributions have not been withdrawn.
Members of the FRS Pension Plan when the FRS Investment Plan was created were provided an educational
period about their plan choice options prior to a 90-day election period to elect between the FRS Pension Plan
and the FRS Investment Plan (IP). Members newly hired after the IP became effective are provided five months
after their month of hire to file an election between the two primary programs. Members who do not make an
election default into the FRS Pension Plan.
After the initial active or default election to participate in the FRS Pension Plan or the FRS Investment Plan, the
employee has one opportunity, at the employee’s discretion before termination or retirement, to choose to move
from the FRS Pension Plan to the FRS Pension Plan or vice versa.
(Sections 121.051, 121.4501)

Actuarial Valuation as of July 1, 2017
Florida Retirement System Pension Plan Appendix B
This work product was prepared solely for Florida Department of Management Services for the purposes described herein and may not be appropriate to use for other purposes. Milliman does not intend to benefit and assumes no duty or liability to other parties who receive this work. Milliman recommends that third parties be aided by their own actuary or other qualified professional when reviewing the Milliman work product.
B-2
Classification
There are five separate classes of members: Regular Class, Special Risk Class, Special Risk Administrative
Support Class, Elected Officers' Class, and Senior Management Service Class. In addition, the Deferred
Retirement Option Program (DROP) is available to FRS Pension Plan members who meet the requirements for
normal retirement under the FRS Pension Plan.
Regular Class – members who are not classified as members of the Special Risk Class, Special Risk
Administrative Support Class, Elected Officers' Class, or Senior Management Service Class.
Special Risk Class – members employed as law enforcement officers, emergency medical technicians,
paramedics, firefighters, firefighter trainers, fire prevention inspectors, correctional officers, correctional
probation officers, certain professional health care positions within the Department of Children and Family
Services and the Department of Corrections, or certain forensic positions within a law enforcement agency, or
a medical examiner’s office who meet the criteria set forth in the Florida Retirement System law and
administrative rules.
Special Risk Administrative Support Class – former Special Risk Class members employed as law
enforcement officers, firefighters, correctional officers, or emergency medical technicians who have been
moved or been re-assigned to non-Special Risk administrative support positions within a Florida Retirement
System Special Risk employing agency.
Elected Officers' Class – members include the Governor, Lieutenant Governor, cabinet officers, legislators,
Supreme Court justices, district court of appeals judges, circuit judges, county court judges, state attorneys,
public defenders, and elected county officers. Also included are city and special district officers if the
employer chose to place their elected officials in this class. All such elected officers may withdraw from the
Florida Retirement System, elect membership in the Senior Management Service Class or, if state officers,
elect membership in the Senior Management Service Optional Annuity Program.
Senior Management Service Class – members who hold positions in the Senior Management Service of the
State of Florida; community college presidents; appointed school board superintendents; county and city
managers; selected managerial staff of the Legislature; the Auditor General and managerial staff; the
Executive Director of the Ethics Commission; the State University System Executive Service and university
presidents; selected managerial staff of the State Board of Administration; judges of compensation claims;
selected managerial staff with the Judicial Branch; Chief Deputy Court Administrator; capital collateral
regional counsels and assistant capital collateral regional counsels; assistant state attorneys; assistant public
defenders; assistant statewide prosecutors or assistant attorneys general; and non-elective managerial
positions designated for SMSC membership by local government agencies. Members in this class have either
chosen not to participate or are not eligible to participate in the elective Senior Management Service Optional
Annuity Program for state senior managers or to withdraw from the FRS if employed by non-state employers.
This class became effective February 1, 1987, and members of an existing retirement system and members
of the Special Risk or Special Risk Administrative Support Classes who were employed prior to February 1,
1987, could elect to remain in such system or class.
Deferred Retirement Option Program (DROP) – allows members of the FRS Pension Plan in any of the
above five classes to elect to retire and have their FRS benefits accumulate in the FRS Trust Fund, earning
interest, while the member continues to work for an FRS employer. DROP membership is for a specific and
limited period.
(Sections 121.021(12), 121.0515, 121.052, 121.055, 121.091 (13))

Actuarial Valuation as of July 1, 2017
Florida Retirement System Pension Plan Appendix B
This work product was prepared solely for Florida Department of Management Services for the purposes described herein and may not be appropriate to use for other purposes. Milliman does not intend to benefit and assumes no duty or liability to other parties who receive this work. Milliman recommends that third parties be aided by their own actuary or other qualified professional when reviewing the Milliman work product.
B-3
Contributions
From January 1, 1975, for the state and for school boards, and from October 1, 1975, for other agencies, through
June 30, 2011, the total cost of the System was paid by the participating employers.
Beginning July 1, 2011, all FRS Pension Plan and FRS Investment Plan members, except those FRS Pension
Plan members participating in DROP, are required to pay member contributions equal to 3% of compensation.
TRS members already pay required employee contributions. Member contributions do not accrue interest except
for TRS members.
(Section 121.071 (2))
The employer contribution rates enacted for the July 1, 2017 – June 30, 2018 plan year are as follows:
Special Special Risk Elected Officers Class Senior
Regular Risk Administrative Judicial Leg-Atty-Cab Local Management DROP
Defined Benefit Plan
- Normal Cost Rate 2.75% 11.57% 3.09% 11.73% 6.27% 8.37% 4.05% 4.17%
- UAL Rate 3.93 11.42 42.81 28.75 55.87 49.25 22.16 7.43
- Total DB Rate 6.68 22.99 45.90 40.48 62.14 57.62 26.21 11.60
Investment Plan
- Employer Rate 3.60% 13.48% 5.43% 11.05% 6.94% 8.95% 4.98% n/a
- UAL Rate 0.00 0.00 0.00 0.00 0.00 0.00 0.00 n/a
- Total IP Rate 3.60 13.48 5.43 11.05 6.94 8.95 4.98 n/a
Blended Uniform Contribution Rates
- Normal Cost Rate 2.90% 11.86% 3.83% 11.67% 6.45% 8.54% 4.29% 4.17%
- UAL Rate 3.30 9.69 29.08 26.25 42.69 35.24 16.70 7.43
- Total Rate 6.20 21.55 32.91 37.92 49.14 43.78 20.99 11.60
The above rates exclude the 0.06% administrative charge for Investment Plan administration and education
(except DROP), and the 1.66% for the financing of the Florida Retiree Health Insurance Subsidy program.
(Sections 121.71, 121.74)
Compensation
“Compensation” means the monthly salary paid a member by his or her employer for work performed arising from
that employment.
(a) Compensation shall include:
1. Overtime payments paid from a salary fund.
2. Accumulated annual leave payments.
3. Payments in addition to the employee’s base rate of pay if all the following apply:
a. The payments are paid according to a formal written policy that applies to all eligible
employees equally;
b. The policy provides that payments shall commence no later than the 11th year of employment;
c. The payments are paid for as long as the employee continues his or her employment; and
d. The payments are paid at least annually.

Actuarial Valuation as of July 1, 2017
Florida Retirement System Pension Plan Appendix B
This work product was prepared solely for Florida Department of Management Services for the purposes described herein and may not be appropriate to use for other purposes. Milliman does not intend to benefit and assumes no duty or liability to other parties who receive this work. Milliman recommends that third parties be aided by their own actuary or other qualified professional when reviewing the Milliman work product.
B-4
4. Amounts withheld for tax sheltered annuities or deferred compensation programs, or any other type of
salary reduction plan authorized under the Internal Revenue Code.
5. Payments made in lieu of a permanent increase in the base rate of pay, whether made annually or in 12
or 26 equal payments within a 12-month period, when the member’s base pay is at the maximum of his or
her pay range. When a portion of a member’s annual increase raises his or her pay range and the excess
is paid as a lump sum payment, such lump sum payment shall be compensation for retirement purposes.
(b) Compensation for a member participating in the FRS Pension Plan or the FRS Investment Plan may not
include:
1. Fees paid professional persons for special or particular services or salary payments made from a faculty
practice plan authorized by the Board of Governors of the State University System for eligible clinical
faculty at a college in a state university that has a faculty practice plan; or
2. Any bonuses or other payments prohibited from inclusion in the member’s average final compensation.
(c) For all purposes under this chapter, the member’s compensation or gross compensation contributed as
employee-elective salary reductions or deferrals to any salary reduction, deferred compensation, or tax-
sheltered annuity program authorized under the Internal Revenue Code shall be deemed to be the
compensation or gross compensation which the member would receive if he or she were not participating in
such program and shall be treated as compensation for retirement purposes under this chapter. Any public
funds otherwise paid by an employer into an employee’s salary reduction, deferred compensation, or tax-
sheltered annuity program on or after July 1, 1990 (the date as of which all employers were notified in writing
by the division to cease making contributions to the System Trust Fund based on such amounts), shall be
considered a fringe benefit and shall not be treated as compensation for retirement purposes under this
chapter. However, if an employer was notified in writing by the division to cease making such contributions as
of a different date, that employer shall be subject to the requirements of said written notice.
(d) For any person who first becomes a member on or after July 1, 1996, compensation for any plan year shall
not include any amounts in excess of the Section 401(a)(17), Internal Revenue Code limitation (as amended
by the Omnibus Budget Reconciliation Act of 1993), which limitation of $150,000 effective July 1, 1996, shall
be adjusted as required by federal law for qualified government plans and shall be further adjusted for
changes in the cost of living in the manner provided by Section 401(a)(17)(B), Internal Revenue Code. For
any person who first became a member prior to July 1, 1996, compensation for all plan years beginning on or
after July 1, 1990, shall not include any amounts in excess of the compensation limitation (originally
$200,000) established by Section 401(a)(17), Internal Revenue Code prior to the Omnibus Budget
Reconciliation Act of 1993, which limitation shall be adjusted for changes in the cost of living since 1989, in
the manner provided by Section 401(a)(17) of the Internal Revenue Code of 1991. This limitation, which has
been part of the Florida Retirement System since plan years beginning on or after July 1, 1990, shall be
adjusted as required by federal law for qualified government plans.
“Annual compensation” means the total compensation paid a member during a year. A “year” is 12 continuous
months.
(Section 121.021(22) and (23))

Actuarial Valuation as of July 1, 2017
Florida Retirement System Pension Plan Appendix B
This work product was prepared solely for Florida Department of Management Services for the purposes described herein and may not be appropriate to use for other purposes. Milliman does not intend to benefit and assumes no duty or liability to other parties who receive this work. Milliman recommends that third parties be aided by their own actuary or other qualified professional when reviewing the Milliman work product.
B-5
FRS Pension Plan
Normal Retirement Benefit
Eligibility – Members initially enrolled before July 1, 2011 (Tier I)
Regular Class
1. 30 years of creditable service at any age.
2. Age 62 and 6 or more years of creditable service.
(Section 121.021(29)(a)(1))
Special Risk Class
1. 25 years of special risk service at any age; or
2. Age 55 and 6 or more years of special risk service; or
3. Age 52 and 25 years of creditable service, including special risk service and up to a maximum of four
years of active duty wartime military service credit.
4. 30 years of any creditable service, at any age, or age 62 and 6 or more years of creditable service
(same requirement as the Regular Class).
(Section 121.021(29)(b)(1))
Special Risk Administrative Support Class
(with six or more years of Special Risk Class service, the same requirements as apply to the Special Risk
Class, otherwise same as apply to the Regular Class)
(Sections 121.0515(8) and 121.021(29)(b)(1))
Elected Officers’ Class
(same requirements as apply to Regular Class)
(Section 121.021(29)(a)(1))
Senior Management Service Class
(same requirements as apply to Regular Class)
(Section 121.021(29)(a)(1))
Eligibility – Members initially enrolled on and after July 1, 2011 (Tier II)
Regular Class
1. 33 years of creditable service at any age.
2. Age 65 and 8 or more years of creditable service.
(Section 121.021(29)(a)(2))
Special Risk Class
1. 30 years of special risk service at any age; or
2. Age 60 and 8 or more years of special risk service; or
3. 33 years of any creditable service, at any age, or age 65 and 8 or more years of creditable service
(same requirement as the Regular Class).
(Section 121.021(29)(b)(2))

Actuarial Valuation as of July 1, 2017
Florida Retirement System Pension Plan Appendix B
This work product was prepared solely for Florida Department of Management Services for the purposes described herein and may not be appropriate to use for other purposes. Milliman does not intend to benefit and assumes no duty or liability to other parties who receive this work. Milliman recommends that third parties be aided by their own actuary or other qualified professional when reviewing the Milliman work product.
B-6
Special Risk Administrative Support Class
(with eight or more years of Special Risk Class service, the same requirements as apply to the Special
Risk Class, otherwise same as apply to the Regular Class)
(Sections 121.0515(8) and 121.021(29)(b)(2))
Elected Officers’ Class
(same requirements as apply to Regular Class)
(Section 121.021(29)(a)(2))
Senior Management Service Class
(same requirements as apply to Regular Class)
(Section 121.021(29)(a)(2))
Normal Form
Straight life benefit (Option 1), payable on the last state working day of each month, with a guarantee that
benefits paid will at least equal member contributions.
(Section 121.091(1))
Optional Forms
10-year certain and life benefit (Option 2), 100% joint and contingent benefit (Option 3), or 66-2/3% joint and
survivor benefit (Option 4). If the joint annuitant is the member's non-disabled child, payment ceases upon
attainment of the joint annuitant's 25th birthday under the 100% and 66- 2/3% joint and survivor benefit.
(Section 121.091(6))
Dual Retirement
In the event a member accumulates retirement benefits to commence at different normal retirement ages by
virtue of having performed duties for an employer which would entitle him or her to benefits as both a Special
Risk Class member and a member of another class, the amount of the benefits payable shall be computed
separately with respect to each such age, and the sum of such computed amounts shall be paid. Note that
this does not apply to a Special Risk Administrative Support Class member with at least 6 years of Special
Risk Class Membership (8 years for members enrolled on or after July 1, 2011) when the Special Risk and
Special Risk Administrative Support Classes are the only memberships held because such a member is
treated as a Special Risk Class member.
(Section 121.091(2))
Regular Benefit Amount
The monthly FRS Pension Plan allowance is the product of:
1. Average final compensation
a. For members initially enrolled before July 1, 2011, the average of the highest five plan years of
creditable service;
b. For members initially enrolled on or after July 1, 2011, the average of the highest eight plan years of
creditable service;
2. Creditable service during the applicable period; and
3. The appropriate benefit percentage for periods of service.

Actuarial Valuation as of July 1, 2017
Florida Retirement System Pension Plan Appendix B
This work product was prepared solely for Florida Department of Management Services for the purposes described herein and may not be appropriate to use for other purposes. Milliman does not intend to benefit and assumes no duty or liability to other parties who receive this work. Milliman recommends that third parties be aided by their own actuary or other qualified professional when reviewing the Milliman work product.
B-7
All benefits are limited to 100% of average final compensation.
(Sections 121.021(17), (24) and (25), 121.091(1))
The appropriate benefit percentages are as follows:
For Members initially enrolled before July 1, 2011, for Creditable Service as a Regular Class member
Subsequent to November 30, 1970:
Retirement at: Percentage
Age 62 with 6 years of creditable service, or 30 years of creditable service
1.60%
Age 63 with 6 years of creditable service, or 31 years of creditable service
1.63%
Age 64 with 6 years of creditable service, or 32 years of creditable service
1.65%
Age 65 with 6 years of creditable service, or 33 years of creditable service
1.68%
For Members initially enrolled on or after July 1, 2011, for Creditable Service as a Regular Class member
Subsequent to November 30, 1970:
Retirement at: Percentage
Age 65 with 8 years of creditable service, or 33 years of creditable service
1.60%
Age 66 with 8 years of creditable service, or 34 years of creditable service
1.63%
Age 67 with 8 years of creditable service, or 35 years of creditable service
1.65%
Age 68 with 8 years of creditable service, or 36 years of creditable service
1.68%
(Section 121.091(1))
Service as a Special Risk Class member:
Retirement on or After July 1, 2001 with Service Performed During:
Percentage
December 1, 1970 to September 30, 1974 2.00%
October 1, 1974 and thereafter 3.00%%
(Section 121.091(1))

Actuarial Valuation as of July 1, 2017
Florida Retirement System Pension Plan Appendix B
This work product was prepared solely for Florida Department of Management Services for the purposes described herein and may not be appropriate to use for other purposes. Milliman does not intend to benefit and assumes no duty or liability to other parties who receive this work. Milliman recommends that third parties be aided by their own actuary or other qualified professional when reviewing the Milliman work product.
B-8
For Members initially enrolled before July 1, 2011, for Creditable Service as a Special Risk Administrative
Support Class member Subsequent to November 30, 1970:
Retirement at: Percentage
Age 55 with 6 years of creditable special risk service, or age 52 with 25 years of creditable service, which may include up to four years of active duty wartime military service, or 25 years of creditable special risk service
1.60%
Age 56 with 6 years of creditable special risk service, or age 53 with 26 years of creditable service, which may include up to four years of active duty wartime military service, or 26 years of creditable special risk service
1.63%
Age 57 with 6 years of creditable special risk service, or age 54 with 27 years of creditable service, which may include up to four years of active duty wartime military service, or 27 years of creditable special risk service
1.65%
Age 58 with 6 years of creditable special risk service, or age 55 with 28 years of creditable service, which may include up to four years of active duty wartime military service, or 28 years of creditable special risk service
1.68%
For Members initially enrolled on or after July 1, 2011, for Creditable Service as a Special Risk
Administrative Support Class member Subsequent to November 30, 1970:
Retirement at: Percentage
Age 60 with 8 years of creditable special risk service, or age 57 with 30 years of creditable service, which may include up to four years of active duty wartime military service, or 30 years of creditable special risk service
1.60%
Age 61 with 8 years of creditable special risk service, or age 58 with 31 years of creditable service, which may include up to four years of active duty wartime military service, or 31 years of creditable special risk service
1.63%
Age 62 with 8 years of creditable special risk service, or age 59 with 32 years of creditable service, which may include up to four years of active duty wartime military service, or 32 years of creditable special risk service
1.65%
Age 63 with 8 years of creditable special risk service, or age 60 with 33 years of creditable service, which may include up to four years of active duty wartime military service, or 33 years of creditable special risk service
1.68%
(Section 121.0515(8) and 121.091(1))
Actuarial Valuation as of July 1, 2017
Florida Retirement System Pension Plan Appendix B
This work product was prepared solely for Florida Department of Management Services for the purposes described herein and may not be appropriate to use for other purposes. Milliman does not intend to benefit and assumes no duty or liability to other parties who receive this work. Milliman recommends that third parties be aided by their own actuary or other qualified professional when reviewing the Milliman work product.
B-9
For Service as an Elected Officers’ Class member:
3% for each year of creditable service in such class, except 3-1/3% for service in the judicial class.
Military service credit is at the rate for Regular Class members.
(Sections 121.052(5)(a) and (d), 121.091(1))
For Service as a Senior Management Service Class member:
2% for each year of creditable service in such class, after January 31, 1987.
(Section 121.055(4)(d))
Early Retirement
Eligibility
For members initially enrolled before July 1, 2011, six years of creditable service for all classes of
membership.
For members initially enrolled on or after July 1, 2011, eight years of creditable service for all classes of
membership.
(Section 121.021(30))
Benefit Amount
The normal retirement benefit accrued to the date of early retirement, reduced by 5/12% for each month that
the early retirement date precedes the normal retirement date based upon age. The normal retirement date is
as follows:
1. Special Risk Class members:
a. Initially enrolled before July 1, 2011: Age 55
b. Initially enrolled on or after July 1, 2011: Age 60
2. Members in all other Classes
a. Initially enrolled before July 1, 2011: Age 62
b. Initially enrolled on or after July 1, 2011: Age 65
(Sections 121.021(30), 121.091(3))
Non-Duty Disability Retirement
Eligibility
Members are eligible if totally and permanently disabled after completing at least 8 years of creditable service
(or after 6 years if disability retirement is ordered for a judge by the Supreme Court).
Benefit Amount
Same as for normal retirement, but based on average final compensation and creditable service to the date of
disability retirement.
Minimum Benefit Amount
25% of average final compensation.
If the Supreme Court orders disability retirement for a judge, the minimum is two-thirds of compensation at
disability. This benefit for a defined benefit plan member is not paid from the FRS Trust Fund. This benefit for

Actuarial Valuation as of July 1, 2017
Florida Retirement System Pension Plan Appendix B
This work product was prepared solely for Florida Department of Management Services for the purposes described herein and may not be appropriate to use for other purposes. Milliman does not intend to benefit and assumes no duty or liability to other parties who receive this work. Milliman recommends that third parties be aided by their own actuary or other qualified professional when reviewing the Milliman work product.
B-10
an Investment Plan member is paid from the FRS Trust Fund after the member’s IP account balance is
transferred to the FRS Trust Fund.
(Section 121.091(4))
Line-of-Duty Disability
Eligibility
Members are eligible if totally and permanently disabled during the actual performance of duty. There is no
service credit requirement.
Benefit Amount
Same as for normal retirement, but based on average final compensation and creditable service to the date of
disability retirement.
Minimum Benefit Amount
42% of average final compensation, except for the Special Risk and the Special Risk Administrative Support
classes whose members are entitled to 65% of average final compensation.
If the Supreme Court orders disability retirement for a judge, the minimum is two-thirds of compensation at
disability. This benefit for a defined benefit plan member is not paid from the FRS Trust Fund.
(Section 121.091(4))
Post-Retirement Death Benefits
Based on the optional form elected.
Non-Duty Pre-Retirement Death Benefits
Eligibility
Employment is terminated by death after vested for all classes of membership.
Benefit Amount
The normal or early retirement benefit amount for which the member would have been eligible had the
member retired on his or her date of death and elected the 100% joint and survivor (Option 3) form of
payment in favor of his or her beneficiary who is the surviving spouse or other eligible dependent. The
monthly benefit is normally payable to the member's beneficiary for the beneficiary's lifetime. If the beneficiary
is the member's non-disabled child, payment ceases upon attainment of the beneficiary's 25th birthday.
If the member is more than 10 years away from normal retirement age, the reduction is 5% for each year the
member would be younger than the normal retirement age at retirement. There are exceptions if within 10
years of normal retirement:
1. For members initially enrolled before July 1, 2011, who were within 10 years of normal retirement
eligibility, the reduction for early retirement is applied from the earlier of age 62 (age 55 for Special Risk
Class and Special Risk Administrative Support Class members) or the date on which the member would
have completed 30 years of creditable service, had he or she continued employment.
2. For members initially enrolled on or after July 1, 2011, who were within 10 years of normal retirement
eligibility, the reduction for early retirement is applied from the earlier of age 65 (age 60 for Special Risk

Actuarial Valuation as of July 1, 2017
Florida Retirement System Pension Plan Appendix B
This work product was prepared solely for Florida Department of Management Services for the purposes described herein and may not be appropriate to use for other purposes. Milliman does not intend to benefit and assumes no duty or liability to other parties who receive this work. Milliman recommends that third parties be aided by their own actuary or other qualified professional when reviewing the Milliman work product.
B-11
Class and Special Risk Administrative Support Class members) or the date on which the member would
have completed 33 years of creditable service, had he or she continued employment. The value of this
benefit may not be less than the member's accumulated contributions, if any.
(Sections 121.091(3) and (7))
Line-of-Duty Pre-Retirement Death Benefits
Eligibility
Member died during the actual performance of duty. There is no service credit requirement.
Benefit Amount
The surviving spouse will receive one-half of the member's monthly compensation at death. If the spouse
dies, or if there is no surviving spouse, the monthly benefits continue until the youngest child is 18.
Effective July 1, 2016, an additional benefit equal to one-half the member’s monthly compensation at death is
payable to the surviving dependent(s) of Special Risk Class members killed in the line of duty on or after
July 1, 2013. For such Special Risk Class members, surviving child payments may be extended to age 25 if
the child is unmarried and enrolled as a full-time student.
A surviving spouse may elect to receive a non-duty death benefit in lieu of the duty death benefit.
(Section 121.091(7))
Vesting
Eligibility
For members initially enrolled before July 1, 2011, six years of creditable service for all classes of
membership. For members initially enrolled on or after July 1, 2011, eight years of creditable service for all
membership classes.
Benefit Amount
The normal or early retirement benefit amount based on average final compensation and creditable service to
the date of termination.
(Sections 121.021(45), 121.091(5))
DROP – Deferred Retirement Option Program
Eligibility
Except as allowed by statute, notably for K-12 instructional personnel1, members have a limited eligibility
window during which they can elect to enter the DROP. A member initially becomes eligible to enter DROP in
the same month he or she first becomes eligible to file for unreduced immediate retirement benefits. Eligibility
windows differ by tier and membership class, and are initially reached via satisfying either service-only criteria
or age-plus-service criteria.
1 Instructional personnel in grades K-12 may defer DROP participation to any age.

Actuarial Valuation as of July 1, 2017
Florida Retirement System Pension Plan Appendix B
This work product was prepared solely for Florida Department of Management Services for the purposes described herein and may not be appropriate to use for other purposes. Milliman does not intend to benefit and assumes no duty or liability to other parties who receive this work. Milliman recommends that third parties be aided by their own actuary or other qualified professional when reviewing the Milliman work product.
B-12
For most members achieving DROP entry eligibility via service-only criteria, the window to enter DROP lasts
more than 12 months, with the window’s length varying by individual. (The window must be at least 12 months
in length.) The window for members satisfying service-only eligibility criteria is shown in the table below.
DROP Entry Eligibility Window for Members Satisfying Service-Only Criteria Membership Class Tier Window Opens Window Closes
Special Risk Tier I 25 Years of Service 53rd Birthday*
Special Risk Tier II 30 Years of Service 56th Birthday*
All Other Classes Tier I 30 Years of Service 58th Birthday*
All Other Classes Tier II 33 Years of Service 61st Birthday*
*Or 12 months after the window opens, if later than the date listed above for the member
Members who do not reach unreduced retirement eligibility through service-only eligibility criteria become
eligible to enter DROP upon satisfaction of age-plus-service criteria. For those members, the eligibility window
to enter DROP lasts for 12 months.
DROP Entry Eligibility Window for Members Satisfying Age-Plus-Service Criteria Membership Class Tier Window Opens Window Closes
Special Risk Tier I Age 55 and 6 Years of Service After 12 months
Special Risk Tier II Age 60 and 8 Years of Service After 12 months
All Other Classes Tier I Age 62 and 6 Years of Service After 12 months
All Other Classes Tier II Age 65 and 8 Years of Service After 12 months
The maximum length of DROP participation is five years. As such, members who satisfy service-only criteria
and enter DROP prior to age 60 are required to exit DROP and terminate FRS-covered employment prior to
becoming eligible for Medicare benefits at age 65.
Benefit Amount
Effective July 1, 1998, eligible members can retire without terminating their employment during DROP
participation. Monthly retirement benefits will be invested in the FRS Trust Fund, earning tax-deferred interest
while the member continues to work for a maximum of 60 months. The interest credit for those entering the
DROP prior to July 1, 2011, is 6.5% annually. For those entering the DROP after that date, it is 1.3%
annually. Upon completion of the maximum five-year period, DROP participation ends and participants must
terminate employment with all FRS employers. At that time, the participant will receive payment of the
accumulated DROP benefits, and begin receiving his FRS monthly retirement benefit (in the same amount as
determined at retirement, plus annual cost-of-living increases).
Effective July 1, 2003, participants employed in eligible instructional positions with a district school board, the
Florida School for the Deaf and Blind, or a developmental research school can extend their participation
beyond their initial 60-month period, for up to an additional 36 months. The employer must approve the
request for DROP extension as well as the period of extension granted to an eligible DROP participant, if any,
within the 36-month limit.

Actuarial Valuation as of July 1, 2017
Florida Retirement System Pension Plan Appendix B
This work product was prepared solely for Florida Department of Management Services for the purposes described herein and may not be appropriate to use for other purposes. Milliman does not intend to benefit and assumes no duty or liability to other parties who receive this work. Milliman recommends that third parties be aided by their own actuary or other qualified professional when reviewing the Milliman work product.
B-13
Disabled While in DROP
Participants that became disabled while participating in DROP will continue to accumulate the same monthly
benefit in the FRS Trust Fund until termination. Since the normal retirement benefit commenced upon DROP
participation, a disability benefit will not be issued.
Death While in DROP
The designated beneficiary of a participant who dies while participating in DROP will receive all accumulated
DROP benefits, and a continuing monthly benefit, if the participant had elected Option 2, 3, or 4. Survivors of
DROP participants are not eligible for FRS line-of-duty death benefits.
(Section 121.091 (13))
Return of Employee Contributions
A member who terminates employment but is not eligible to retire, receive a vested retirement allowance, or
receive a disability pension will be entitled to a refund of any employee contributions. The beneficiary of a
member who passes away before satisfying the requirement for a pre-retirement death benefit will be entitled to a
refund of any employee contributions made by the member. No interest is credited on employee contribution
accounts.
A vested terminated participant may elect to receive a return of employee contributions in lieu of a retirement
benefit.
(Sections 121.071(2)(b), 121.091(7)(a), Sections 121.091(5)(a) and (c))
Cost-of-Living Adjustment
Senate Bill 2100 (2011) eliminated post-retirement benefit increases on benefits earned on and after July 1, 2011.
FRS Pension Plan benefits earned before July 1, 2011 will receive post-retirement benefit increases of 3% per
year. Tier II members (those initially enrolled on and after July 1, 2011) will receive no post-retirement benefit
increases. Tier I members (those initially enrolled before July 1, 2011) will receive post-retirement benefit
increases equal to 3% per year multiplied by a fraction, the numerator of which is service through June 30, 2011
and the denominator of which is total service at retirement. Cost-of-Living Adjustments take effect annually on
July 1. A pro-rated rate may apply in the initial year of applicability.
(Section 121.101)
Additional Benefit Amount
In addition, members may receive an additional retirement allowance under the pre-1971 existing systems. The
benefit is a percentage of average final compensation times the creditable service in that system up to
November 30, 1970. The system percentages are:
State and County Officers and Employees' Retirement System:
2.00% for creditable service rendered under Division A prior to Social Security coverage; and 1.50% for
creditable service rendered under Division B subsequent to Social Security coverage.
Teachers Retirement System:
Plan E: 2.00%
(Sections 121.091(1)(c), 122.28, 238.07(7)(a))

Actuarial Valuation as of July 1, 2017
Florida Retirement System Pension Plan Appendix B
This work product was prepared solely for Florida Department of Management Services for the purposes described herein and may not be appropriate to use for other purposes. Milliman does not intend to benefit and assumes no duty or liability to other parties who receive this work. Milliman recommends that third parties be aided by their own actuary or other qualified professional when reviewing the Milliman work product.
B-14
Minimum Benefit
Eligibility
The month following attainment of age 65 by a pensioner or, in the case of a beneficiary receiving the
survivor’s portion of a member’s benefit, the 65th anniversary of the deceased member's birth. The member
must have earned at least 10 years of creditable service and retired under normal retirement.
Benefit Amount
An eligible benefit recipient will receive a benefit adjustment to bring the benefit to the calculated minimum
benefit. Effective July 1, 2017, the minimum monthly benefit is $31.34 multiplied by years of creditable service
prior to application of the reduction factor for electing an optional form of payment. For retirements on or after
July 1, 1987, creditable service for the minimum benefit calculation does not include any service earned on or
after that date.
(Section 112.362)
FRS Investment Plan (IP)
The FRS Investment Plan (IP) is a defined contribution plan offered to eligible members as an alternative to the
FRS Pension Plan. The plan is qualified under sec. 401(a) of the Internal Revenue Code.
Benefits
Under the IP, benefits accrue in individual member accounts funded by employer and employee contributions
made on or after July 1, 2011, and earnings thereon. Benefits are provided through employee-directed
investments offered by approved investment providers. Vested benefits are payable upon termination or death as
a lump-sum distribution, direct rollover distribution, or periodic distribution. In addition to normal benefits and
death benefits, the plan also provides disability coverage as described below.
(Sections 121.4501, 121.591)
Contributions
The employer contributions deposited in each participant’s IP account are based upon allocation rates established
by law for each membership class. This statutorily prescribed percentage of the participant’s gross compensation
for the reporting month is deducted from the total amount paid by the employer on behalf of all members in the
same class of membership based on the uniform contribution rate established by law. Current IP allocation rates
are set forth in the following charts. The allocation rates shown in the first chart below do not include the 0.06%
charge for FRS Investment Plan administration and education, the separate employer contribution assessed to
fund the IP disability program, or the contribution of 1.66% for the financing of the Florida Retiree Health
Insurance Subsidy program.
(Sections 121.71, 121.72)

Actuarial Valuation as of July 1, 2017
Florida Retirement System Pension Plan Appendix B
This work product was prepared solely for Florida Department of Management Services for the purposes described herein and may not be appropriate to use for other purposes. Milliman does not intend to benefit and assumes no duty or liability to other parties who receive this work. Milliman recommends that third parties be aided by their own actuary or other qualified professional when reviewing the Milliman work product.
B-15
Effective July 1, 2012, the employer allocations to the IP accounts are based on contribution rates as follows:
Classification 2017-2018 Plan Year Rates
Regular 3.30%
Special Risk 11.00%
Special Risk Administrative Support 4.95%
Elected Officers’
- Judicial 10.23%
- Leg/Atty/Cab 6.38%
- Local 8.34%
Senior Management Service 4.67%
The employer contribution rates to fund the disability benefit under the IP are as follows:
Classification 2017-2018 Plan Year Rates
Regular 0.25%
Special Risk 1.33%
Special Risk Administrative Support 0.45%
Elected Officers’
- Judicial 0.73%
- Leg/Atty/Cab 0.41%
- Local 0.41%
Senior Management Service 0.26%
(Section 121.73)
Effective July 1, 2017 the employer contribution rates to fund the line of duty death benefit under the IP are as
follows:
Classification 2017-2018 Plan Year Rates
Regular 0.05%
Special Risk 1.15%
Special Risk Administrative Support 0.03%
Elected Officers’
- Judicial 0.09%
- Leg/Atty/Cab 0.15%
- Local 0.20%
Senior Management Service 0.05%
(Section 121.735)

Actuarial Valuation as of July 1, 2017
Florida Retirement System Pension Plan Appendix B
This work product was prepared solely for Florida Department of Management Services for the purposes described herein and may not be appropriate to use for other purposes. Milliman does not intend to benefit and assumes no duty or liability to other parties who receive this work. Milliman recommends that third parties be aided by their own actuary or other qualified professional when reviewing the Milliman work product.
B-16
Non-Duty Disability Retirement
Eligibility
Investment Plan participants who have completed at least eight years of creditable service (or six years of
creditable service if disability retirement is ordered for a judge by the Supreme Court) are eligible for regular
disability benefits if they become totally and permanently disabled due to injury or illness suffered while
actively employed in an FRS-covered position. Upon approval for disability retirement, the IP participant may
choose either to retain his/her IP account balance or to surrender his/her account balance to the FRS Pension
Plan and receive guaranteed lifetime monthly disability benefits, assuming the member remains disabled.
Benefit Amount
If the disabled IP participant chooses to retain his/her account balance, he/she may elect to receive the
normal benefit payable under the IP. If he/she elects to surrender the account balance and receive lifetime
monthly disability benefits, the amount of each monthly payment is calculated in the same manner as
provided for regular disability retirement under the FRS Pension Plan and is subject to the same threshold
benefit amounts.
(Sections 121.091(4), 121.591(1) and (2))
Line-of-Duty Disability
Eligibility
IP participants are eligible for in-line-of-duty disability benefits if they become totally and permanently disabled
due to injury or illness suffered during the actual performance of duty while actively employed in an FRS-
covered position. There is no service credit requirement for in-line-of-duty disability benefits. Upon approval
for disability retirement, the IP member may choose either to retain his/her IP account balance or to surrender
his/her account balance to the FRS Pension Plan and receive guaranteed lifetime monthly disability benefits,
assuming the member remains disabled.
Benefit Amount
If the disabled IP participant elects to retain his/her account balance, he/she may elect to receive the normal
benefit payable under the IP. If he/she elects to surrender the account balance and receive lifetime monthly
disability benefits, the amount of each monthly payment is calculated in the same manner as provided for line-
of-duty disability retirement under the FRS Pension Plan, and is subject to the same threshold benefit
amounts.
(Sections 121.091(4), 121.591(1) and (2))
Line-of-Duty Death
Eligibility
IP participants are eligible for in-line-of-duty death benefits if they die during the actual performance of duty
while actively employed in an FRS-covered position. There is no service credit requirement for in-line-of-duty
death benefits. The beneficiary of the IP member may choose either to retain the member’s IP account
balance or to surrender his/her account balance to the FRS Pension Plan and receive guaranteed monthly
death benefits, payable for the life of the surviving spouse or, if the spouse dies or there is no spouse, until
the 18th birthday of the member’s youngest surviving child. Such payments may be extended until the 25th
birthday of the youngest child of a Special Risk Class member if the child is unmarried and enrolled as a full-
time student.

Actuarial Valuation as of July 1, 2017
Florida Retirement System Pension Plan Appendix B
This work product was prepared solely for Florida Department of Management Services for the purposes described herein and may not be appropriate to use for other purposes. Milliman does not intend to benefit and assumes no duty or liability to other parties who receive this work. Milliman recommends that third parties be aided by their own actuary or other qualified professional when reviewing the Milliman work product.
B-17
Benefit Amount
If the beneficiary of the IP participant elects to retain his/her account balance, he/she may elect to receive the
normal benefit payable under the IP. If he/she elects to surrender the account balance and receive the
annuity from the FRS Pension Plan, the amount of each monthly payment is calculated in the same manner
as provided for line-of-duty death benefits under the FRS Pension Plan, and is subject to the same threshold
benefit amounts.
(Sections 121.091(7), 121.591(1), (3) and (4))
Teachers’ Retirement System (TRS)
The benefit and contribution provisions of the Statutes for this closed system are set forth in Chapter 238 of the
Florida Statutes. Certain provisions are from other sections of the Florida Statutes.
Effective Date
The effective date of the Retirement System was July 1, 1939.
(Section 238.02)
Membership
All employees who were teachers in public schools, employees of professional non-profit teachers associations,
county superintendents, Department of Education employees and the staff of the Teachers' Retirement System,
and who were employed prior to December 1, 1970, are members of the Teachers' Retirement System. The
benefit and contribution provisions of the Statutes are set forth in Chapter 238 of the Florida Statutes. Certain
provisions are drawn from other sections of the Florida Statutes. TRS retirees are included with the Regular
Membership Class in the valuation.
State and County Officers and Employees’ Retirement System (SCOERS)
The benefit and contribution provisions of the Statutes are set forth in Chapter 122 of the Florida Statutes. Certain
provisions are drawn from other sections of the Florida Statutes. This is a closed system that no longer includes
any members in the high hazard or legislative categories. Effective with the July 1, 2013 valuation, there are no
longer any actively employed members of this system. SCOERS retirees are included with the Regular
Membership Class in the valuation.
Effective Date
The effective date of the Retirement System was July 1, 1955.
(Section 122.01(2))
Membership
All full-time employees of the state and its counties not covered by another system who were employed prior to
December 1, 1970.
Institute of Food and Agricultural Sciences Supplemental Retirement Program (IFAS)
The benefit and contribution provisions of the Statutes are set forth in Chapter 121 of the Florida Statutes. Certain
provisions are drawn from other sections of the Florida Statutes. This is a closed system. IFAS retirees are
included with the Regular Membership Class in the valuation.
Effective Date
The effective date of the Supplemental Retirement Program was July 1, 1985.

Actuarial Valuation as of July 1, 2017
Florida Retirement System Pension Plan Appendix B
This work product was prepared solely for Florida Department of Management Services for the purposes described herein and may not be appropriate to use for other purposes. Milliman does not intend to benefit and assumes no duty or liability to other parties who receive this work. Milliman recommends that third parties be aided by their own actuary or other qualified professional when reviewing the Milliman work product.
B-18
(Section 121.40)
Membership
Employees hired on or before July 1, 1983 who:
a. hold both state and federal appointments while employed at the Institute,
b. are not entitled to any benefit from a state-supported retirement system or Social Security based on
service as an employee of the Institute, and
c. are participants in the Federal Civil Service Retirement System.

Actuarial Valuation as of July 1, 2017
Florida Retirement System Pension Plan Appendix C
This work product was prepared solely for Florida Department of Management Services for the purposes described herein and may not be appropriate to use for other purposes. Milliman does not intend to benefit and assumes no duty or liability to other parties who receive this work. Milliman recommends that third parties be aided by their own actuary or other qualified professional when reviewing the Milliman work product.
C-1
Appendix C: Membership Data
This valuation is based upon the membership of the Pension Plan as of July 1, 2017.
The membership of the FRS Pension Plan includes employees of the State of Florida and participating political
subdivisions. The membership is divided into several categories by membership class and subclass.
Tables C-1 through C-5 present distributions of annuitants (including beneficiaries of deceased members), and
potential annuitants (terminated vested members). Shown in the tables are the numbers of persons receiving
benefits and the total annual benefits.
Table C-6 summarizes the DROP membership and provides total annual benefits.
Table C-7 presents a summary by category of active membership, payroll, and accumulated employee
contributions.
Tables C-8 through C-17 contain summaries of the active members in each category of membership. Values
shown in the tables are the numbers of members and their average annual salaries. Table C-17 is the grand total
of active members included in this valuation.

Actuarial Valuation as of July 1, 2017
Florida Retirement System Pension Plan Appendix C
This work product was prepared solely for Florida Department of Management Services for the purposes described herein and may not be appropriate to use for other purposes. Milliman does not intend to benefit and assumes no duty or liability to other parties who receive this work. Milliman recommends that third parties be aided by their own actuary or other qualified professional when reviewing the Milliman work product.
C-2
Table C-1
Florida Retirement System Pension Plan
Annuitants at July 1, 2017
Regular and Early Retirement by Age
Table C-2
Florida Retirement System Pension Plan
Annuitants at July 1, 2017
Disability Retirement by Age
Number Annual Benefits
Age of Persons (in Thousands)
Under 50 2,800 $38,401
50 to 54 5,193 153,437
55 to 59 20,368 514,810
60 to 64 52,741 1,245,322
65 to 69 95,183 2,141,797
70 to 74 87,121 1,929,231
75 to 79 55,570 1,151,737
80 & Up 69,604 1,442,641
Total 388,580 $8,617,376
Number Annual Benefits
Age of Persons (in Thousands)
Under 50 701 11,864
50 to 54 1,221 22,181
55 to 59 2,281 36,030
60 to 64 3,204 50,898
65 to 69 2,844 44,962
70 to 74 2,117 33,668
75 to 79 1,112 17,067
80 & Up 731 9,855
Total 14,211 $226,525

Actuarial Valuation as of July 1, 2017
Florida Retirement System Pension Plan Appendix C
This work product was prepared solely for Florida Department of Management Services for the purposes described herein and may not be appropriate to use for other purposes. Milliman does not intend to benefit and assumes no duty or liability to other parties who receive this work. Milliman recommends that third parties be aided by their own actuary or other qualified professional when reviewing the Milliman work product.
C-3
Table C-3
Florida Retirement System Pension Plan
Potential Annuitants at July 1, 2017
Vested Terminated Members by Age for the Regular,
Senior Management Service, and Elected Officers' Classes
Table C-4
Florida Retirement System Pension Plan
Potential Annuitants at July 1, 2017
Vested Terminated Members by Age for the
Special Risk & Special Risk Administrative Support Classes
Number Annual Benefits
Age of Persons (in Thousands)1
Under 30 415 $993
30 to 34 3,328 13,148
35 to 39 7,973 40,094
40 to 44 11,409 62,677
45 to 49 16,154 97,452
50 to 54 20,911 131,390
55 to 59 19,438 133,638
60 & Up 22,951 125,443
Total 102,579 $604,835
1 Deferred to Age 62
Number Annual Benefits
Age of Persons (in Thousands)2
Under 30 51 $422
30 to 34 420 4,122
35 to 39 680 7,607
40 to 44 1,088 12,370
45 to 49 1,625 21,862
50 to 54 1,202 16,439
55 to 59 489 6,365
60 & Up 478 5,048
Total 6,033 $74,235
2 Deferred to Age 55

Actuarial Valuation as of July 1, 2017
Florida Retirement System Pension Plan Appendix C
This work product was prepared solely for Florida Department of Management Services for the purposes described herein and may not be appropriate to use for other purposes. Milliman does not intend to benefit and assumes no duty or liability to other parties who receive this work. Milliman recommends that third parties be aided by their own actuary or other qualified professional when reviewing the Milliman work product.
C-4
Table C-5
Florida Retirement System Pension Plan
Annuitants and Potential Annuitants at July 1, 2017
All Types of Retirement by System
Table C-6
Florida Retirement System Pension Plan
Annuitants at July 1, 2017
DROP Members
Potential
System Annuitants Annuitants Total
Number of Persons
Regular 360,062 101,099 461,161
Senior Management Service 4,421 1,129 5,550
Special Risk 35,593 6,018 41,611
Special Risk Administrative 169 15 184
EOC: Judicial 898 45 943
EOC: Legislative/Attorneys/Cabinet 218 88 306
EOC: Local 1,430 218 1,648
Total 402,791 108,612 511,403
Annual Benefits (in Thousands)
Regular $6,940,187 $577,873 $7,518,060
Senior Management Service 222,374 21,419 243,793
Special Risk 1,535,035 74,100 1,609,135
Special Risk Administrative 6,695 135 6,830
EOC: Judicial 83,566 2,294 85,860
EOC: Legislative/Attorneys/Cabinet 8,251 1,002 9,253
EOC: Local 47,793 2,247 50,040
Total $8,843,901 $679,070 $9,522,971
Number Annual Benefits
Age of Persons (in Thousands)
Under 50 419 $26,834
50 to 54 2,643 139,193
55 to 59 7,541 281,077
60 to 64 14,955 348,225
65 to 69 7,716 153,149
70 to 74 156 2,518
75 to 79 17 259
80 & Up 5 74
Total 33,452 $951,329

Actuarial Valuation as of July 1, 2017
Florida Retirement System Pension Plan Appendix C
This work product was prepared solely for Florida Department of Management Services for the purposes described herein and may not be appropriate to use for other purposes. Milliman does not intend to benefit and assumes no duty or liability to other parties who receive this work. Milliman recommends that third parties be aided by their own actuary or other qualified professional when reviewing the Milliman work product.
C-5
Table C-7
Florida Retirement System Pension Plan
Summary of Active Members at July 1, 2017
Accumulated
Employee
Annual Salary Contributions
System Number of Persons (in Thousands)1
(in Thousands)
Regular 450,467 $19,152,497 $2,632,652
Senior Management Service 5,731 516,727 74,923
Special Risk 60,720 3,664,881 503,195
Special Risk Administrative 68 3,046 509
EOC: Judicial 707 99,986 15,224
EOC: Legislative/Attorneys/Cabinet 116 6,275 977
EOC: Local 786 41,457 6,038
Teachers' Retirement System (TRS) 13 1,430 4,383
Institute of Food and Agricultural Sciences (IFAS) 14 1,557 0
Total 518,622 $23,487,856 $3,237,901
¹ The salary shown in Tables C-7 through C-17 represents the salaries of the FRS DB plan members on July 1, 2017.
The payroll on which normal costs are determined ($24,049,285,000) equals the salaries for these DB plan members
(excluding TRS and IFAS), adjusted to the middle of the plan year. The payroll on which UAL costs are charged
additionally includes the payroll of certain other groups, and is described in Section 4 of the report.

Actuarial Valuation as of July 1, 2017
Florida Retirement System Pension Plan Appendix C
This work product was prepared solely for Florida Department of Management Services for the purposes described herein and may not be appropriate to use for other purposes. Milliman does not intend to benefit and assumes no duty or liability to other parties who receive this work. Milliman recommends that third parties be aided by their own actuary or other qualified professional when reviewing the Milliman work product.
C-6
Table C-8
Florida Retirement System Pension Plan
Member Counts and Average Salaries at July 1, 2017
Regular Class
Years of Service
Age Under 5 5 to 10 10 to 15 15 to 20 20 to 25 25 to 30 30 to 35 35 to 40 40 to 45 45 to 50 50 & Up All Years
Under 20 995 995
20 to 24 13,817 132 13,949
25 to 29 30,366 4,942 189 35,497
30 to 34 22,570 14,231 5,641 141 42,583
35 to 39 16,907 10,805 16,414 4,393 90 48,609
40 to 44 14,368 8,954 13,132 12,667 3,385 72 52,578
45 to 49 14,082 9,474 13,034 12,891 12,039 3,656 161 65,337
50 to 54 11,868 8,582 12,651 12,089 10,709 10,737 2,884 88 69,608
55 to 59 9,012 7,315 11,919 12,265 10,854 10,479 4,362 594 9 66,809
60 to 64 4,283 4,788 7,573 7,423 6,201 6,199 1,561 672 111 2 38,813
65 & Up 2,157 2,540 4,028 2,851 1,704 1,096 601 354 237 107 14 15,689
Total Count 140,425 71,763 84,581 64,720 44,982 32,239 9,569 1,708 357 109 14 450,467
Years of Service
Age Under 5 5 to 10 10 to 15 15 to 20 20 to 25 25 to 30 30 to 35 35 to 40 40 to 45 45 to 50 50 & Up All Years
Under 20 9,967 9,967
20 to 24 22,374 22,688 22,377
25 to 29 32,102 37,991 37,478 32,950
30 to 34 33,123 42,404 43,718 46,296 37,672
35 to 39 32,418 41,691 47,878 49,803 51,973 41,307
40 to 44 31,950 40,504 46,940 53,237 54,845 57,181 43,788
45 to 49 31,830 39,115 44,447 50,614 59,118 59,603 55,213 45,749
50 to 54 31,472 37,877 42,314 46,860 54,386 62,909 61,302 60,899 46,552
55 to 59 30,695 37,636 41,972 45,348 51,340 59,275 66,249 63,239 57,610 46,608
60 to 64 28,744 37,658 41,763 45,202 50,111 56,793 63,872 65,695 56,469 66,216 45,559
65 & Up 20,086 31,645 38,435 41,835 46,888 54,327 64,425 79,041 83,415 88,079 120,934 40,463
Avg. Annual
Salary 30,717 39,560 44,241 48,357 54,074 59,872 64,070 67,360 74,386 87,677 120,934 42,517
Average Salary ($)
Count

Actuarial Valuation as of July 1, 2017
Florida Retirement System Pension Plan Appendix C
This work product was prepared solely for Florida Department of Management Services for the purposes described herein and may not be appropriate to use for other purposes. Milliman does not intend to benefit and assumes no duty or liability to other parties who receive this work. Milliman recommends that third parties be aided by their own actuary or other qualified professional when reviewing the Milliman work product.
C-7
Table C-9
Florida Retirement System Pension Plan
Member Counts and Average Salaries at July 1, 2017
Special Risk Class
Years of Service
Age Under 5 5 to 10 10 to 15 15 to 20 20 to 25 25 to 30 30 to 35 35 to 40 40 to 45 45 to 50 50 & Up All Years
Under 20 36 1 37
20 to 24 4,115 12 4,127
25 to 29 7,448 1,711 50 9,209
30 to 34 4,107 3,313 2,170 25 9,615
35 to 39 1,892 2,040 3,737 1,259 17 8,945
40 to 44 1,029 1,205 2,674 2,790 1,064 6 8,768
45 to 49 824 938 1,952 2,438 2,952 687 7 9,798
50 to 54 523 633 1,184 1,232 1,738 961 125 6,396
55 to 59 241 415 563 432 407 295 106 10 2,469
60 to 64 67 183 265 197 153 124 40 15 3 1,047
65 & Up 10 45 98 72 38 22 15 6 3 309
Total Count 20,292 10,496 12,693 8,445 6,369 2,095 293 31 6 60,720
Years of Service
Age Under 5 5 to 10 10 to 15 15 to 20 20 to 25 25 to 30 30 to 35 35 to 40 40 to 45 45 to 50 50 & Up All Years
Under 20 23,284 39,100 23,712
20 to 24 35,558 36,734 35,561
25 to 29 41,934 50,072 56,161 43,523
30 to 34 44,323 56,216 66,164 68,101 53,412
35 to 39 43,792 56,029 71,011 73,574 72,186 62,200
40 to 44 43,519 56,097 70,697 77,614 80,729 95,522 68,936
45 to 49 45,888 56,329 69,566 77,425 83,834 88,626 104,061 73,923
50 to 54 48,790 59,288 67,266 74,586 82,178 81,628 81,179 72,858
55 to 59 47,746 59,506 67,245 70,458 70,595 72,406 79,756 85,405 66,383
60 to 64 45,101 55,238 62,840 66,743 66,115 76,767 79,196 81,295 121,284 64,295
65 & Up 27,675 52,017 62,650 70,522 71,474 82,575 78,500 112,787 114,227 66,551
Avg. Annual
Salary 41,755 55,431 69,084 75,807 81,487 82,386 80,803 88,716 117,756 60,357
Count
Average Salary ($)

Actuarial Valuation as of July 1, 2017
Florida Retirement System Pension Plan Appendix C
This work product was prepared solely for Florida Department of Management Services for the purposes described herein and may not be appropriate to use for other purposes. Milliman does not intend to benefit and assumes no duty or liability to other parties who receive this work. Milliman recommends that third parties be aided by their own actuary or other qualified professional when reviewing the Milliman work product.
C-8
Table C-10
Florida Retirement System Pension Plan
Member Counts and Average Salaries at July 1, 2017
Special Risk Administrative Support Class
Years of Service
Age Under 5 5 to 10 10 to 15 15 to 20 20 to 25 25 to 30 30 to 35 35 to 40 40 to 45 45 to 50 50 & Up All Years
Under 20
20 to 24
25 to 29 1 2 3
30 to 34 5 4 9
35 to 39 1 6 5 12
40 to 44 1 3 3 5 12
45 to 49 1 3 12 2 18
50 to 54 1 3 4 8
55 to 59 2 1 1 4
60 to 64 1 1
65 & Up 1 1
Total Count 1 10 19 12 17 9 68
Years of Service
Age Under 5 5 to 10 10 to 15 15 to 20 20 to 25 25 to 30 30 to 35 35 to 40 40 to 45 45 to 50 50 & Up All Years
Under 20
20 to 24
25 to 29 35,507 35,772 35,684
30 to 34 39,817 38,290 39,138
35 to 39 37,341 43,750 40,537 41,877
40 to 44 39,996 42,247 51,221 47,499 46,491
45 to 49 44,513 39,558 52,145 51,560 49,558
50 to 54 33,805 40,034 56,474 47,475
55 to 59 43,366 40,290 47,088 43,528
60 to 64 37,624 37,624
65 & Up 42,723 42,723
Avg. Annual
Salary 35,507 38,177 41,776 42,943 50,778 50,717 44,794
Count
Average Salary ($)

Actuarial Valuation as of July 1, 2017
Florida Retirement System Pension Plan Appendix C
This work product was prepared solely for Florida Department of Management Services for the purposes described herein and may not be appropriate to use for other purposes. Milliman does not intend to benefit and assumes no duty or liability to other parties who receive this work. Milliman recommends that third parties be aided by their own actuary or other qualified professional when reviewing the Milliman work product.
C-9
Table C-11
Florida Retirement System Pension Plan
Member Counts and Average Salaries at July 1, 2017
Elected Officers’ Class: Judicial Subclass
Years of Service
Age Under 5 5 to 10 10 to 15 15 to 20 20 to 25 25 to 30 30 to 35 35 to 40 40 to 45 45 to 50 50 & Up All Years
Under 20
20 to 24
25 to 29
30 to 34 1 1 2
35 to 39 12 5 2 19
40 to 44 20 10 15 11 56
45 to 49 18 21 25 30 22 1 117
50 to 54 25 21 20 30 25 22 143
55 to 59 15 28 28 34 34 29 13 181
60 to 64 7 16 22 32 22 22 8 4 133
65 & Up 11 20 10 6 9 56
Total Count 98 113 132 147 109 83 21 4 707
Years of Service
Age Under 5 5 to 10 10 to 15 15 to 20 20 to 25 25 to 30 30 to 35 35 to 40 40 to 45 45 to 50 50 & Up All Years
Under 20
20 to 24
25 to 29
30 to 34 127,046 120,042 123,544
35 to 39 133,498 154,586 138,020 139,524
40 to 44 125,286 140,339 138,805 140,956 134,673
45 to 49 134,745 129,881 143,172 141,662 144,467 123,124 139,175
50 to 54 127,348 143,480 144,548 143,705 144,502 144,042 141,121
55 to 59 133,661 144,929 144,554 140,483 141,630 142,494 143,297 141,975
60 to 64 147,231 144,618 145,371 146,116 143,653 143,900 141,487 146,080 144,818
65 & Up 143,882 145,274 146,886 144,794 144,310 145,082
Avg. Annual
Salary 131,422 141,518 143,784 143,079 143,444 143,241 142,607 146,080 141,423
Count
Average Salary ($)

Actuarial Valuation as of July 1, 2017
Florida Retirement System Pension Plan Appendix C
This work product was prepared solely for Florida Department of Management Services for the purposes described herein and may not be appropriate to use for other purposes. Milliman does not intend to benefit and assumes no duty or liability to other parties who receive this work. Milliman recommends that third parties be aided by their own actuary or other qualified professional when reviewing the Milliman work product.
C-10
Table C-12
Florida Retirement System Pension Plan
Member Counts and Average Salaries at July 1, 2017
Elected Officers’ Class: Legislators/Attorney/Cabinet Subclass
Years of Service
Age Under 5 5 to 10 10 to 15 15 to 20 20 to 25 25 to 30 30 to 35 35 to 40 40 to 45 45 to 50 50 & Up All Years
Under 20
20 to 24
25 to 29 2 2
30 to 34 4 2 6
35 to 39 7 6 1 14
40 to 44 6 2 6 2 1 17
45 to 49 5 5 3 2 15
50 to 54 5 7 4 16
55 to 59 4 5 4 3 3 2 1 22
60 to 64 1 5 2 2 2 2 14
65 & Up 2 5 2 1 10
Total Count 34 27 28 11 6 8 1 1 116
Years of Service
Age Under 5 5 to 10 10 to 15 15 to 20 20 to 25 25 to 30 30 to 35 35 to 40 40 to 45 45 to 50 50 & Up All Years
Under 20
20 to 24
25 to 29 29,697 29,697
30 to 34 24,417 29,697 26,177
35 to 39 23,521 27,937 19,137 25,101
40 to 44 29,391 109,705 69,900 86,633 29,697 59,889
45 to 49 25,275 27,585 86,774 154,140 55,527
50 to 54 27,189 28,188 145,907 57,306
55 to 59 28,955 27,585 36,663 62,789 67,672 154,140 154,140 57,009
60 to 64 29,697 54,586 29,697 154,140 91,919 137,018 80,584
65 & Up 29,697 29,697 97,505 154,140 55,703
Avg. Annual
Salary 26,644 39,059 44,668 106,655 69,425 145,743 154,140 154,140 54,096
Count
Average Salary ($)

Actuarial Valuation as of July 1, 2017
Florida Retirement System Pension Plan Appendix C
This work product was prepared solely for Florida Department of Management Services for the purposes described herein and may not be appropriate to use for other purposes. Milliman does not intend to benefit and assumes no duty or liability to other parties who receive this work. Milliman recommends that third parties be aided by their own actuary or other qualified professional when reviewing the Milliman work product.
C-11
Table C-13
Florida Retirement System Pension Plan
Member Counts and Average Salaries at July 1, 2017
Elected Officers’ Class: Local Subclass
Years of Service
Age Under 5 5 to 10 10 to 15 15 to 20 20 to 25 25 to 30 30 to 35 35 to 40 40 to 45 45 to 50 50 & Up All Years
Under 20
20 to 24 1 1
25 to 29 2 2
30 to 34 8 7 1 16
35 to 39 20 7 8 5 40
40 to 44 20 19 8 8 5 60
45 to 49 34 27 12 12 11 7 1 104
50 to 54 34 22 12 12 8 19 12 119
55 to 59 36 23 22 16 17 20 9 3 1 147
60 to 64 22 17 26 25 15 7 6 4 122
65 & Up 24 47 42 23 24 9 2 3 1 175
Total Count 201 169 131 101 80 62 30 10 2 786
Years of Service
Age Under 5 5 to 10 10 to 15 15 to 20 20 to 25 25 to 30 30 to 35 35 to 40 40 to 45 45 to 50 50 & Up All Years
Under 20
20 to 24 6,000 6,000
25 to 29 16,863 16,863
30 to 34 47,836 45,581 23,521 45,330
35 to 39 25,576 34,299 38,528 73,667 35,704
40 to 44 40,079 38,147 93,872 41,892 83,395 50,491
45 to 49 35,851 60,470 76,352 59,433 71,240 99,392 140,440 58,662
50 to 54 39,013 37,695 67,507 66,193 79,113 94,686 102,494 62,370
55 to 59 40,163 44,043 61,585 61,213 61,103 90,587 83,170 100,853 95,583 59,798
60 to 64 34,162 36,738 47,390 64,613 57,677 86,068 67,721 107,576 53,507
65 & Up 28,147 40,016 43,145 53,841 47,574 51,248 15,575 49,498 3,600 42,246
Avg. Annual
Salary 35,591 42,983 55,024 59,842 60,990 86,617 85,213 88,136 49,592 52,744
Count
Average Salary ($)

Actuarial Valuation as of July 1, 2017
Florida Retirement System Pension Plan Appendix C
This work product was prepared solely for Florida Department of Management Services for the purposes described herein and may not be appropriate to use for other purposes. Milliman does not intend to benefit and assumes no duty or liability to other parties who receive this work. Milliman recommends that third parties be aided by their own actuary or other qualified professional when reviewing the Milliman work product.
C-12
Table C-14
Florida Retirement System Pension Plan
Member Counts and Average Salaries at July 1, 2017
Senior Management Service Class
Years of Service
Age Under 5 5 to 10 10 to 15 15 to 20 20 to 25 25 to 30 30 to 35 35 to 40 40 to 45 45 to 50 50 & Up All Years
Under 20
20 to 24 2 2
25 to 29 456 9 465
30 to 34 421 222 19 2 664
35 to 39 130 180 176 33 519
40 to 44 80 83 152 208 60 2 585
45 to 49 52 81 131 224 272 101 5 866
50 to 54 69 78 119 139 219 329 77 1 1,031
55 to 59 53 68 94 120 150 287 112 14 898
60 to 64 23 54 78 87 89 106 34 16 2 489
65 & Up 5 29 46 47 31 22 13 11 7 1 212
Total Count 1,291 804 815 860 821 847 241 42 9 1 5,731
Years of Service
Age Under 5 5 to 10 10 to 15 15 to 20 20 to 25 25 to 30 30 to 35 35 to 40 40 to 45 45 to 50 50 & Up All Years
Under 20
20 to 24 42,213 42,213
25 to 29 43,415 59,560 43,728
30 to 34 47,497 59,617 65,616 77,917 52,159
35 to 39 54,373 63,303 77,227 94,623 67,779
40 to 44 86,275 81,211 82,680 87,639 95,121 76,608 85,982
45 to 49 90,199 87,944 93,891 100,111 105,726 103,740 93,780 99,587
50 to 54 98,832 96,847 101,400 100,678 103,630 110,776 100,463 41,864 104,124
55 to 59 116,705 108,555 99,917 103,248 107,663 113,481 118,638 99,109 109,958
60 to 64 125,929 116,685 97,271 107,701 113,543 123,246 110,038 150,978 97,024 113,855
65 & Up 125,030 138,692 114,859 132,041 111,745 162,708 124,151 169,015 200,298 131,020 132,955
Avg. Annual
Salary 58,145 79,961 90,841 99,874 105,820 113,682 111,399 135,814 177,348 131,020 90,163
Count
Average Salary ($)

Actuarial Valuation as of July 1, 2017
Florida Retirement System Pension Plan Appendix C
This work product was prepared solely for Florida Department of Management Services for the purposes described herein and may not be appropriate to use for other purposes. Milliman does not intend to benefit and assumes no duty or liability to other parties who receive this work. Milliman recommends that third parties be aided by their own actuary or other qualified professional when reviewing the Milliman work product.
C-13
Table C-15
Florida Retirement System Pension Plan
Member Counts and Average Salaries at July 1, 2017
TRS – Teachers’ Retirement System
Years of Service
Age Under 5 5 to 10 10 to 15 15 to 20 20 to 25 25 to 30 30 to 35 35 to 40 40 to 45 45 to 50 50 & Up All Years
Under 20
20 to 24
25 to 29
30 to 34
35 to 39
40 to 44
45 to 49
50 to 54
55 to 59
60 to 64
65 & Up 1 9 3 13
Total Count 1 9 3 13
Years of Service
Age Under 5 5 to 10 10 to 15 15 to 20 20 to 25 25 to 30 30 to 35 35 to 40 40 to 45 45 to 50 50 & Up All Years
Under 20
20 to 24
25 to 29
30 to 34
35 to 39
40 to 44
45 to 49
50 to 54
55 to 59
60 to 64
65 & Up 2,865 89,008 208,665 109,995
Avg. Annual
Salary 2,865 89,008 208,665 109,995
Count
Average Salary ($)
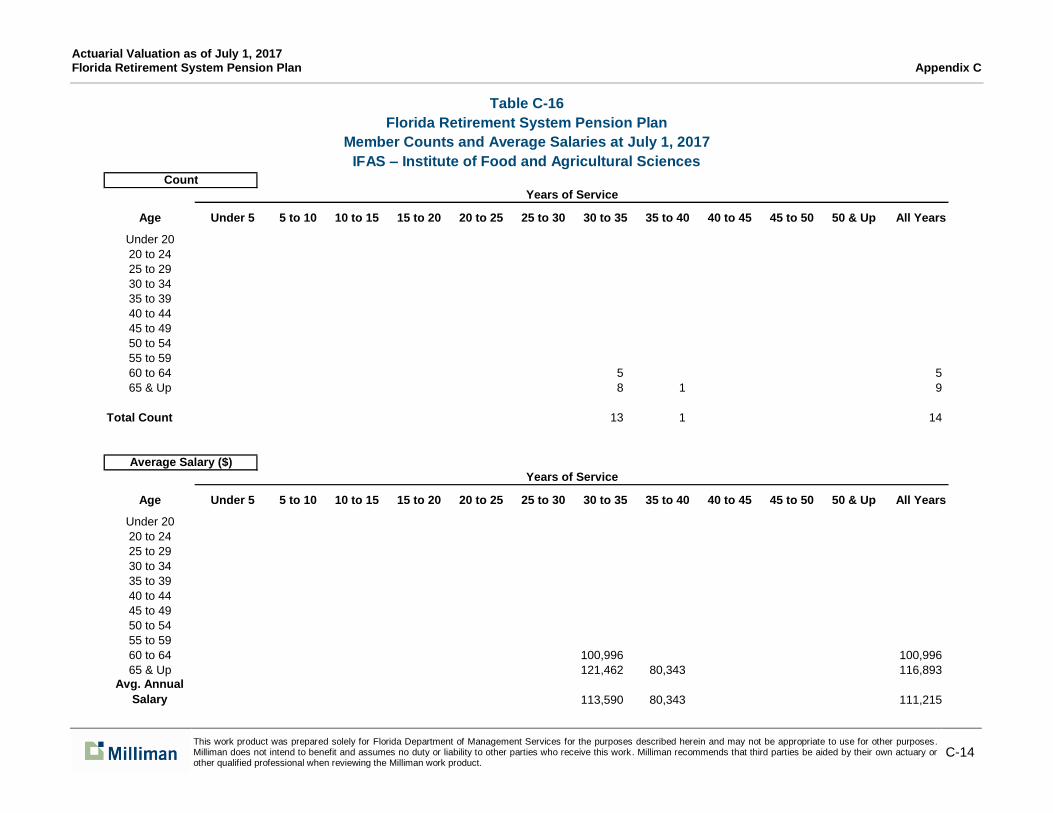
Actuarial Valuation as of July 1, 2017
Florida Retirement System Pension Plan Appendix C
This work product was prepared solely for Florida Department of Management Services for the purposes described herein and may not be appropriate to use for other purposes. Milliman does not intend to benefit and assumes no duty or liability to other parties who receive this work. Milliman recommends that third parties be aided by their own actuary or other qualified professional when reviewing the Milliman work product.
C-14
Table C-16
Florida Retirement System Pension Plan
Member Counts and Average Salaries at July 1, 2017
IFAS – Institute of Food and Agricultural Sciences
Years of Service
Age Under 5 5 to 10 10 to 15 15 to 20 20 to 25 25 to 30 30 to 35 35 to 40 40 to 45 45 to 50 50 & Up All Years
Under 20
20 to 24
25 to 29
30 to 34
35 to 39
40 to 44
45 to 49
50 to 54
55 to 59
60 to 64 5 5
65 & Up 8 1 9
Total Count 13 1 14
Years of Service
Age Under 5 5 to 10 10 to 15 15 to 20 20 to 25 25 to 30 30 to 35 35 to 40 40 to 45 45 to 50 50 & Up All Years
Under 20
20 to 24
25 to 29
30 to 34
35 to 39
40 to 44
45 to 49
50 to 54
55 to 59
60 to 64 100,996 100,996
65 & Up 121,462 80,343 116,893
Avg. Annual
Salary 113,590 80,343 111,215
Count
Average Salary ($)

Actuarial Valuation as of July 1, 2017
Florida Retirement System Pension Plan Appendix C
This work product was prepared solely for Florida Department of Management Services for the purposes described herein and may not be appropriate to use for other purposes. Milliman does not intend to benefit and assumes no duty or liability to other parties who receive this work. Milliman recommends that third parties be aided by their own actuary or other qualified professional when reviewing the Milliman work product.
C-15
Table C-17
Florida Retirement System Pension Plan
Member Counts and Average Salaries at July 1, 2017
Grand Totals of All Active Participants
Age Under 5 5 to 10 10 to 15 15 to 20 20 to 25 25 to 30 30 to 35 35 to 40 40 to 45 45 to 50 50 & Up All Years
Under 20 1,031 1 1,032
20 to 24 17,935 144 18,079
25 to 29 38,275 6,664 239 45,178
30 to 34 27,111 17,781 7,835 168 52,895
35 to 39 18,968 13,044 20,344 5,695 107 58,158
40 to 44 15,523 10,274 15,990 15,689 4,520 80 62,076
45 to 49 15,015 10,546 15,158 15,600 15,308 4,454 174 76,255
50 to 54 12,524 9,337 13,996 13,502 12,699 12,076 3,098 89 77,321
55 to 59 9,361 7,854 12,632 12,871 11,465 11,113 4,603 621 10 70,530
60 to 64 4,403 5,063 7,966 7,766 6,482 6,461 1,654 711 116 2 40,624
65 & Up 2,197 2,674 4,239 3,005 1,803 1,159 639 375 248 118 17 16,474
Total Count 162,343 83,382 98,399 74,296 52,384 35,343 10,168 1,796 374 120 17 518,622
Age Under 5 5 to 10 10 to 15 15 to 20 20 to 25 25 to 30 30 to 35 35 to 40 40 to 45 45 to 50 50 & Up All Years
Under 20 10,432 39,100 10,460
20 to 24 25,400 23,859 25,388
25 to 29 34,149 41,121 41,386 35,216
30 to 34 35,050 45,196 49,982 49,917 40,719
35 to 39 33,756 44,265 52,384 55,331 55,184 44,781
40 to 44 33,126 42,768 51,370 58,088 61,491 60,542 47,831
45 to 49 32,934 41,251 48,305 55,708 64,838 65,154 58,776 50,144
50 to 54 32,776 40,058 45,087 50,176 59,232 65,926 63,237 60,686 49,697
55 to 59 31,822 39,801 43,790 47,006 53,047 61,313 68,104 64,586 61,408 48,382
60 to 64 29,716 39,488 43,309 46,955 51,708 58,617 65,693 68,631 58,845 66,216 47,231
65 & Up 20,439 33,756 40,365 44,412 48,856 57,585 66,532 81,987 86,765 89,073 136,416 42,623
Avg. Annual
Salary 32,380 42,092 47,979 52,284 58,415 62,756 65,971 69,628 77,427 88,692 136,416 45,289
Count
Years of Service
Average Salary ($)
Years of Service

Actuarial Valuation as of July 1, 2017
Florida Retirement System Pension Plan Appendix D
This work product was prepared solely for Florida Department of Management Services for the purposes described herein and may not be appropriate to use for other purposes. Milliman does not intend to benefit and assumes no duty or liability to other parties who receive this work. Milliman recommends that third parties be aided by their own actuary or other qualified professional when reviewing the Milliman work product.
D-1
Appendix D: Projections
Table D-1 presents a projection of total costs of the employers covered by the FRS Pension Plan (exclusive of the
Investment Plan) during the five-year period following the actuarial valuation date, July 1, 2017. The contributions
shown beginning with plan year 2018-2019 are based on the assumption that the contribution levels calculated in
this report are extended throughout the projection period. The contributions shown for plan year 2017-2018 are
based on the legislated rates (before blending) on page B-3 of this report.
Table D-2 reflects, for each membership class and DROP, the outstanding UAL balance of all amortization bases
combined as of July 1, 2017. The table develops the associated duration of the amortization of the combined
amortization bases.
Beginning in the July 1, 1998 actuarial valuation with the emergence of the surplus, all UAL bases in existence as
that time were considered to be fully amortized. While the Plan was in surplus, the UAL amortization payment or
credit was made from the surplus for certain post-1998 benefit increases and the 1998 and 2003 experience
studies prior to any use of the surplus for contribution rate reductions or any other FRS uses. Now that the plan is
no longer in surplus, the UAL payment is made by employers as part of the contribution rate.
Table D-3 estimates the UAL payment / (available surplus) for the next three plan years based on Florida law.
The estimates are projections of the July 1, 2017 valuation results, and assume experience occurs as stated in
the July 1, 2017 valuation.
All three tables reflect that no surplus is available for rate reduction. The amortization methodology recognizes the
time value of money.

Actuarial Valuation as of July 1, 2017
Florida Retirement System Pension Plan Appendix D
This work product was prepared solely for Florida Department of Management Services for the purposes described herein and may not be appropriate to use for other purposes. Milliman does not intend to benefit and assumes no duty or liability to other parties who receive this work. Milliman recommends that third parties be aided by their own actuary or other qualified professional when reviewing the Milliman work product.
D-2
Table D-1
Florida Retirement System Pension Plan
Projection of Retirement Costs (Excluding Member Contributions)
July 1, 2017
Based on Contribution Rates Before Blending
(All Amounts in Millions)
2017 2018 2019 2020 2021
-2018 -2019 -2020 -2021 -2022
A. Employer Normal Cost ¹ $1,101 $1,190 $1,229 $1,269 $1,310
B. UAL Payment / (Surplus Utilization) ² $1,664 $1,8432
$1,9032
$1,9652
$2,0292
C. Total $2,765 $3,033 $3,132 $3,234 $3,339
1 Includes DROP contributions on behalf of DROP members.
2UAL Payment increase is based on assumed increasing payroll, but does not reflect the recognition and funding
of deferred investment gains/losses.

Actuarial Valuation as of July 1, 2017
Florida Retirement System Pension Plan Appendix D
This work product was prepared solely for Florida Department of Management Services for the purposes described herein and may not be appropriate to use for other purposes. Milliman does not intend to benefit and assumes no duty or liability to other parties who receive this work. Milliman recommends that third parties be aided by their own actuary or other qualified professional when reviewing the Milliman work product.
D-3
Table D-2
Florida Retirement System Pension Plan
Funding of UAL / (Surplus) by Duration of Amortization
July 1, 2017
($ in thousands)
Special Risk -- Elected Officers' Class -- Senior
Regular Special Risk Administrative Judicial Leg-Atty-Cab Local Management DROP
Valuation Date Outstanding UAL Balance / (Surplus) $15,357,470 $7,283,506 $16,919 $469,184 $61,732 $368,701 $1,960,483 $2,467,879
UAL Cost / (Savings) Rate (see Table 4-11) 4.19% 12.44% 39.25% 29.83% 58.61% 52.90% 23.76% 7.96%
Projected UAL Payroll PY 2018 - 2019* $23,412,818 $3,945,979 $3,230 $106,884 $7,098 $47,827 $566,672 $2,188,124
Annual Payment / (Savings) for PY 2018 - 2019 $980,462 $490,844 $1,268 $31,881 $4,160 $25,298 $134,651 $174,213
Amortization Period Calculated Assuming
Level Dollar NA ** NA ** 39 NA ** NA ** NA ** NA ** NA **
Level Percent of Payroll 25 22 19 22 22 22 22 21
* The UAL payroll includes salaries for defined contribution program members who pay only the UAL contribution rate.
** Current annual payment / (savings) will never accumulate to the UAL if the earned interest rate is 7.50%.

Actuarial Valuation as of July 1, 2017
Florida Retirement System Pension Plan Appendix D
This work product was prepared solely for Florida Department of Management Services for the purposes described herein and may not be appropriate to use for other purposes. Milliman does not intend to benefit and assumes no duty or liability to other parties who receive this work. Milliman recommends that third parties be aided by their own actuary or other qualified professional when reviewing the Milliman work product.
D-4
Table D-3
Florida Retirement System Pension Plan
Projected Annual Payments of UAL Amortization Bases1
July 1, 2017
2018 - 2019 2019 - 2020 2020 - 2021
1 Estimated Surplus Available Rate Stabilization Mechanism 2
$0.0 $0.0 $0.0
2 (Increase)/Decrease in Available Surplus from prior year $0.0 $0.0 $0.0
UAL Bases
3 12% Increase in Special Risk benefits (in pay status before 07/01/2000) 3
$30.4 $31.4 $32.5
4 Special Risk Minimum In-Line-of-Duty Disability Increased to 65% 4
($0.2) ($0.2) ($0.3)
5 1993 - 1998 Experience Study Assumption Changes 5
($38.5) ($39.7) ($41.0)
6 1998 - 2003 Experience Study Assumption Changes 5
($286.4) ($295.7) ($305.3)
7 2003 - 2008 Experience Study Assumption Changes $485.7 $501.5 $517.8
8 2009 Experience (Gain)/Loss $1,524.1 $1,573.6 $1,624.8
9 Unrecognized (Gains)/Losses while in Surplus ($445.8) ($460.3) ($475.3)
10 2009 Plan Change (House Bill 479) ($92.2) ($95.2) ($98.3)
11 2010 Experience (Gain)/Loss $80.5 $83.1 $85.8
12 2010 Plan Change (Senate Bill 2100) ($88.1) ($91.0) ($94.0)
13 2011 Experience (Gain)/Loss $191.0 $197.3 $203.7
14 2012 Experience (Gain)/Loss ($7.5) ($7.7) ($8.0)
15 2013 Experience (Gain)/Loss $184.4 $190.4 $196.6
16 2008 - 2013 Experience Study Assumption/Method Changes $129.3 $133.5 $137.9
17 2014 Experience (Gain)/Loss ($175.4) ($181.1) ($187.0)
18 2015 Experience (Gain)/Loss $35.1 $36.2 $37.4
19 Special Risk 100% In-Line-Of-Duty Death (2016) $2.6 $2.7 $2.8
20 2016 Assumption Changes $69.3 $71.6 $73.9
21 2016 Experience (Gain)/Loss $76.4 $78.8 $81.4
22 Special Risk 100% In-Line-Of-Duty Death (2017) $5.3 $5.5 $5.7
23 2017 Assumption Changes $133.3 $137.7 $142.1
24 2017 Experience (Gain)/Loss $29.4 $30.4 $31.4
Subtotal [(3) through (24)] $1,842.7 $1,902.8 $1,964.6
25 Across the Board Rate Reduction of 0% 6
$0.0 $0.0 $0.0
Total [Subtotal + (25)] $1,842.7 $1,902.8 $1,964.6
26 UAL payment / (Surplus Available)
[(1) + Total] = $1,842.7 $1,902.8 $1,964.6
1 Numbers exclude contributions to the Investment Plan.
2 Projected surplus based on 07/01/2017 valuation results. Using amortization method that reflects interest.
3 In the absence of a surplus there is an additional cost to the Special Risk Class of 0.77% attributable to the 12% increase
in pre-2000 retired benefits.
4 In the absence of a surplus there is an additional cost to the Special Risk Administrative Class of 0.15% and an additional
cost to the Special Risk Class of -0.01% attributable to the Increase in Minimum ILOD Disability Benefit.
5 In the absence of a surplus there is an additional charge or credit to each class. See Tables 4-2 through 4-10 for details.
6 No surplus available for rate reduction.
Projected PY 2018-2019 and Forward Based on 07/01/2017 Valuation Results and 07/01/2017 Assets

Actuarial Valuation as of July 1, 2017
Florida Retirement System Pension Plan Appendix E
This work product was prepared solely for Florida Department of Management Services for the purposes described herein and may not be appropriate to use for other purposes. Milliman does not intend to benefit and assumes no duty or liability to other parties who receive this work. Milliman recommends that third parties be aided by their own actuary or other qualified professional when reviewing the Milliman work product.
E-1
Appendix E: Comparisons/Reconciliation
This Appendix contains certain comparative information required by the state. The table below compares actual
investment return, aggregate payroll growth, and individual salary increases with the actuarial assumptions.
The next table reconciles the flow of participants from the 2016 actuarial valuation to the 2017 actuarial valuation,
while the last table cross-references the required sections of 112.64 with this report.
Table E-1
Florida Retirement System Pension Plan
One-Year Comparisons
1. Annual Rate of Investment Return on Actuarial Value of Assets
Period Ending Actual Assumed
June 30, 2015 8.62% 7.65%
June 30, 2016 6.99% 7.65%
June 30, 2017 8.21% 7.60%
2. Annual Rate of Payroll Growth
Period Ending Actual ¹ Assumed ¹
June 30, 2015 2.28% 3.25%
June 30, 2016 1.10% 3.25%
June 30, 2017 4.10% 3.25%
3. Individual Rates of Salary Increases for Regular Members and
Special Risk Members
Year Ended
June 30 Regular Members Special Risk Assumed ²
2015 4.8% 5.9% 4.59%
2016 4.7% 5.5% 4.59%
2017 5.8% 8.6% 4.59%
¹ The payroll base compared is used for UAL cost calculations and
includes payroll for DROP members and certain defined contribution plan
participants for whom only UAL contributions are due.
² Individual rates of salary increase vary by age and service. Single
Assumed rate shown above reflects the population and assumptions
adopted study with each experience study. The most recent experience
was for the period July 1, 2008 through June 30, 2013.
Rate of Increase During Year

Actuarial Valuation as of July 1, 2017
Florida Retirement System Pension Plan Appendix E
This work product was prepared solely for Florida Department of Management Services for the purposes described herein and may not be appropriate to use for other purposes. Milliman does not intend to benefit and assumes no duty or liability to other parties who receive this work. Milliman recommends that third parties be aided by their own actuary or other qualified professional when reviewing the Milliman work product.
E-2
Table E-2
Florida Retirement System Pension Plan
Data Reconciliation
Retired
Participants Terminated
Active Disabled and Vested
Participants Participants Beneficiaries DROP Participants Total
Number reported as of
July 1, 2016 514,629 13,919 378,870 31,609 108,692 1,047,719
New Entrants1
62,895 0 0 0 0 62,895
Exits from Active Status2
or DROP (49,384) 300 14,930 (7,721) 9,022 (32,853)
DROP Entry (9,518) 0 0 9,518 0 0
Cessation of benefit
payments NA (605) (12,069) 0 0 (12,674)
Other reported status changes,
including changes from
Terminated Vested status 0 597 6,849 46 (9,102) (1,610)
Number reported as of
July 1, 2017 518,622 14,211 388,580 33,452 108,612 1,063,477
1Includes rehires
2Includes retirement, vested termination, IP transfer, non-vested termination and death

This work product was prepared solely for Florida Department of Management Services for the purposes described herein and may not be appropriate to use for other purposes. Milliman does not intend to benefit and assumes no duty or liability to other parties who receive this work. Milliman recommends that third parties be aided by their own actuary or other qualified professional when reviewing the Milliman work product.
E-3
Table E-3
Florida Retirement System Pension Plan
Cross Reference to Section 112.64 Reporting Requirements
Code Ref Page/Section
1 General Information:
1.003 (3g) Includes certification by the enrolled actuary (signed and dated)? Cover Letter
1.003 (11) Do procedures follow commonly accepted procedures and determinations? Cover Letter
1.003 (4g) Disclosure of events not taken into account by actuary? Cover Letter
1.003 (4g) Disclosure of trends not assumed to continue (by actuary)? Executive Summary
2 Assumptions: Page/Section
1.003 (3e) Description and explanation of all actuarial assumptions? Appendix A
1.003 (3f) Is there a comparison of actual to expected salary increases over the preceding 3-year period? E-1
1.003 (3f) Is there a comparison of actual to expected investment returns over the preceding 3-year period? E-1
1.003 (6) Do assumptions factor in actual experience? Appendix A
1.003 (6) Is impact of inflation considered? A-3
1.003 (6) Any consistent experience gains or losses to suggest assumption changes? No
1.003 (7) Listing of changed assumptions? A-18
3 Plan Provisions & Funding Method: Section
1.003 (4c) Contain a summary of plan provisions? Appendix B
1.003 (4d) Contain a detailed summary of funding method? Appendix A
1.003 (5) Does funding method provide a contribution sufficient to meet the NC and amortize the UAL? Section 4
4 Assets & Method: Exhibit
1.003 (3a) Is the MVA breakdown included (by cash, bonds, stocks, and other)? 2-2
1.003 (3a) Is the "statement value" breakdown included? No
1.003 (3a) Is the derivation of AVA included? 2-3
1.003 (8) Are administrative expenses being paid on a current basis? 2-1
Asset reconciliation, including: Exhibit
1.003 (4j) - contributions by source 2-1
1.003 (4j) - interest and dividends 2-1
1.003 (4j) - realized gains / (losses) 2-1
1.003 (4j) - unrealized appreciation 2-1
1.003 (4j) - pension payments 2-1
1.003 (4j) - contribution refunds 2-1
1.003 (4j) - expenses 2-1
1.003 (4j)
- other receipts (identified) 2-1 (transfer)
1.003 (4j) - other disbursements (identified) 2-1 (IP)

This work product was prepared solely for Florida Department of Management Services for the purposes described herein and may not be appropriate to use for other purposes. Milliman does not intend to benefit and assumes no duty or liability to other parties who receive this work. Milliman recommends that third parties be aided by their own actuary or other qualified professional when reviewing the Milliman work product.
E-4
Code Ref Page/Section
5 UAL & Amortization Schedule: Exhibit
1.003 (3b) Include a plan to amortize any UAL? 4-2 & D-3
Does amortization schedule of UAL exist (as of the valuation date) … Page
1.003 (3c) - on an annual basis for the next 3-years? Exhibit D-3
1.003 (3c) - for the final year? No
1.003 (3c) Is a statement as to how method was derived included? A-2
1.003 (3d) Is a description of actions taken to reduce the UAL included? Section 4
Exec Summary
Reconciliation of UAL (must include items below): Exhibit
1.003 (4h) - UAL for prior valuation (w/ start date) Page 6
1.003 (4h) - Normal Cost, contributions, & accrued interest Page 6
1.003 (4h) - Impact of changes (assumption, funding method, amendments, gain/loss) 4-2—4-10
1.003 (4h) - UAL for current valuation 4-2—4-10
6 Results: Exhibit
1.003 (4a) Valuation Date clearly indicated? Page 1
1.003 (4e) Are results separated by employee group? 3-2 and
Sections 4 & 5
1.003 (4f)
Is there disclosure of any benefit and expense provided by and/or paid from plan assets for which no liabilities or current costs have been established? Cover Letter
1.003 (4i) Projection of emerging liabilities/cash flow needs for next 10-15 years (optional) No
1.003 (4l) Summary of principal results (for current and prior valuation) including:
- participant data (counts, total pay, total annual benefits by group) Appendix C
- assets (market and actuarial) 2-2, 2-3
- PVB (split: active by decrement, tv, ret & ben, dis, and total) 3-2
- PV of future benefit payments 3-2
- AL and UAL, i.e., including amount, date, amortization period 3-2, 4-2
- PVVB (by group), non-vested PVAB, Total PVAB 5-1, 5-2
1.003 (4l) Reconciliation of PVAB, including:
- PVAB at beginning of year 5-3
- changes due to amendment and/or assumptions 5-3
- change due to decrease in discount period and benefits accrued 5-3
- Benefits paid 5-3
- Other changes 5-3
- Net increase (decrease) 5-3
- PVAB at end of year 5-3
1.003 (4l) Pension Cost
- Normal cost (shown for each benefit and amount for admin expense) 4-1
- Payment to amortize UAL 4-2—4-10
- Expected plan sponsor contribution (i.e. total of above pieces with interest, also as % of pay) 4-11
- Amount to be contributed by members (total and % of pay) Pages B-3—B-4
1.003 (4l) Past Contributions
- Required plan sponsor & member contribution 4-12
- Actual contributions made by: plan sponsor, members, other 4-12
1.003 (4k) Active member accumulated contributions with interest 5-2
1.003 (4l) Net actuarial gain / loss 4-2—4-10

This work product was prepared solely for Florida Department of Management Services for the purposes described herein and may not be appropriate to use for other purposes. Milliman does not intend to benefit and assumes no duty or liability to other parties who receive this work. Milliman recommends that third parties be aided by their own actuary or other qualified professional when reviewing the Milliman work product.
E-5
Code Ref Page/Section
1.003 (4l)
Other (PVFS & PVFC at attained age and at entry age, PVFC from other sources, PVF Expected BP) 3-2
7 Data: Exhibit
1.003 (4i) Are membership demographics and financial statistics included? Appendix C
1.003 (4i) Age/service table for actives included? C-7—C-17
1.003 (4i) Data reconciliation? E-2
8 Contribution Rate: Page
1.003 (4a) Applicable beginning and ending dates for recommended contribution indicated? 4
1.003 (4b) Are ER and EE contribution rates adequate to meet benefits? 4
1.003 (4b)
Are contribution rate changes necessary to achieve or preserve funding?
Yes, Executive Summary and Exhibit 4-11
1.003 (7) Is the impact of assumption or cost method changes indicated? 7, Exhibit 3-1
1.003 (9) Were costs to be paid at a later date adjusted for interest and/or salary? Yes 3—4
1.003 (10) Is the effective date of recommended changes no later than the next fiscal year? Yes 3—4

Actuarial Valuation as of July 1, 2017
Florida Retirement System Pension Plan Appendix F
This work product was prepared solely for Florida Department of Management Services for the purposes described herein and may not be appropriate to use for other purposes. Milliman does not intend to benefit and assumes no duty or liability to other parties who receive this work. Milliman recommends that third parties be aided by their own actuary or other qualified professional when reviewing the Milliman work product.
F-1
Appendix F: Glossary
The following definitions are largely excerpts from a list adopted in 1981 by the major actuarial organizations in
the United States. In some cases the definitions have been modified for specific applicability to the FRS.
Accrued Benefit
The amount of an individual’s benefit (whether or not vested) as of a specific date, determined in accordance with
the terms of a pension plan and based on compensation and service to that date.
Accumulated Benefit Obligation (ABO)
The actuarial present value of benefits attributed by the pension benefit formula to employee service rendered
before a specified date and based on employee service and compensation prior to that date.
Actuarial Assumptions
Assumptions as to the occurrence of future events affecting pension costs, such as: mortality, withdrawal,
disability, and retirement; changes in compensation, rates of investment earnings, and asset appreciation or
depreciation; procedures used to determine the Actuarial Value of Assets; and other relevant items.
Actuarial Cost Method
A procedure for determining the Actuarial Present Value of pension plan benefits and expenses and for
developing an actuarially equivalent allocation of such value to time periods, usually in the form of a Normal Cost
and an Actuarial Liability.
Actuarially Equivalent
Of equal Actuarial Present Value, determined as of a given date with each value based on the same set of
Actuarial Assumptions.
Actuarial Gain/Loss
A measure of the difference between actual experience and that expected based upon a set of Actuarial
Assumptions during the period between two Actuarial Valuation Dates, as determined in accordance with a
particular Actuarial Cost Method.
Actuarial Liability (AL)
That portion, as determined by a particular Actuarial Cost Method, of the Actuarial Present Value of pension plan
benefits and expenses which is not provided for by future Normal Costs.
Actuarial Present Value of Pension Plan Benefits
Total projected benefits include all benefits estimated to be payable to plan members as a result of their service
through the valuation date and their expected future service. The actuarial present value of total projected
benefits as of the valuation date is the present value of the cost to finance benefits payable in the future,
discounted to reflect the expected effects of the time value (present value) of money and the probabilities of
payment.
Actuarial Valuation
The determination, as of a valuation date, of the Normal Cost, Actuarial Liability, Actuarial Value of Assets, and
related Actuarial Present Values for a pension plan.

Actuarial Valuation as of July 1, 2017
Florida Retirement System Pension Plan Appendix F
This work product was prepared solely for Florida Department of Management Services for the purposes described herein and may not be appropriate to use for other purposes. Milliman does not intend to benefit and assumes no duty or liability to other parties who receive this work. Milliman recommends that third parties be aided by their own actuary or other qualified professional when reviewing the Milliman work product.
F-2
Actuarial Value of Assets (AVA)
The value of cash, investments, and other property belonging to a pension plan, as used by the actuary for the
purpose of an Actuarial Valuation.
Amortization
Paying an interest-bearing liability by gradual reduction through a series of installments, as opposed to one lump-
sum payment.
Amortization Payment
That portion of the pension plan contribution which is designed to pay interest on and to amortize the Unfunded
Actuarial Liability.
Level Percent of Pay: Produces a level series of payments when expressed as a percent of payroll.
Cash payment increases in line with payroll growth assumption.
Level Dollar: Produces a decreasing pattern of payments when expressed as a percent of payroll.
Cash payment remains level.
Annual Pension Cost (APC)
Under GASB, when the Net Pension Obligation is positive, the APC is equal to the Annual Required Contribution
plus the Interest on the beginning Net Pension Obligation minus the amortization of the Net Pension Obligation.
When the Net Pension Obligation is negative, the APC is equal to the Annual Required Contribution minus the
Interest on the beginning Net Pension Obligation plus the amortization of the Net Pension Obligation.
Annual Required Contribution (ARC)
Under GASB, this amount is equal to the Normal Cost plus the Amortization Payment. GASB does not require
contributions to be equal to the ARC; however it requires the calculation and reporting of the ARC.
Entry Age Normal Actuarial Cost Method (EAN)
A method under which the Actuarial Present Value of the Projected Benefits of each individual included in an
Actuarial Valuation is allocated on a level basis over the earnings or service of the individual between entry age
and assumed exit ages. The portion of this Actuarial Present Value allocated to a valuation year is called the
Normal Cost. The portion of this Actuarial Present Value not provided for at a valuation date by the Actuarial
Present Value of future Normal Costs is called the Actuarial Liability.
Funded Ratio
Ratio of the assets of a pension plan to its liabilities.
Government Accounting Standards Board (GASB)
This Board sets standards of state and local accounting and financial reporting.
Interest Rate
The rate used to discount projected benefit payments to determine the present value in a valuation.
Market Value of Assets (MVA)
The price for which an asset could be sold at a particular date. May also be referred to as the Fair Value of
Assets.

Actuarial Valuation as of July 1, 2017
Florida Retirement System Pension Plan Appendix F
This work product was prepared solely for Florida Department of Management Services for the purposes described herein and may not be appropriate to use for other purposes. Milliman does not intend to benefit and assumes no duty or liability to other parties who receive this work. Milliman recommends that third parties be aided by their own actuary or other qualified professional when reviewing the Milliman work product.
F-3
Normal Cost (NC)
That portion of the Actuarial Present Value of pension plan benefits and expenses which is allocated to a
valuation year by the Actuarial Cost Method.
Net Pension Obligation (NPO)
Under GASB, the cumulative difference between Annual Pension Cost and the employer’s contributions to the
plan, including the pension liability or asset at transition, if any.
Present Value (PV)/ Actuarial Present Value (APV)
The value of an amount or series of amounts of cash flows payable or receivable at various times, determined as
of a given date by the application of a particular set of Actuarial Assumptions, including selected interest rate.
Projected Benefits
Those pension plan benefit amounts which are expected to be paid at various future times under a particular set
of Actuarial Assumptions, taking into account such items as the effect of advancement in age and anticipated
future compensation and service credits.
Unfunded Actuarial Liability
The excess of the Actuarial Liability over the Actuarial Value of Assets. When the Actuarial Value of Assets
exceeds Actuarial Liabilities a surplus exists.
Valuation Date
The date as of which the liabilities are determined.