california public employees’ retirement system actuarial
TRANSCRIPT
California Public Employees’ Retirement System Actuarial Office 400 Q Street, Sacramento, CA 95811 | Phone: (916) 795-3000 | Fax: (916) 795-2744 888 CalPERS (or 888-225-7377) | TTY: (877) 249-7442 | www.calpers.ca.gov
July 2021 Miscellaneous Plan of the City of Anaheim (CalPERS ID: 6207170049) Annual Valuation Report as of June 30, 2020 Dear Employer, Attached to this letter, you will find the June 30, 2020 actuarial valuation report of your CalPERS pension plan. Provided in this report is the determination of the minimum required employer contributions for fiscal year 2022-23. In addition, the report also contains important information regarding the current financial status of the plan as well as projections and risk measures to aid in planning for the future. Actuarial valuations are based on assumptions regarding future plan experience including investment return and payroll growth, eligibility for the types of benefits provided, and longevity among retirees. The CalPERS Board of Administration adopts these assumptions after considering the advice of CalPERS actuarial and investment teams and other professionals. Each actuarial valuation reflects all prior differences between actual and assumed experience and adjusts the contribution requirements as needed. This valuation is based on an investment return assumption of 7.0%, which was adopted by the board in December 2016. Other assumptions used in this report are those recommended in the CalPERS Experience Study and Review of Actuarial Assumptions report from December 2017. Required Contributions The table below shows the minimum required employer contributions and the Employee PEPRA Rate for fiscal year 2022-23 along with an estimate of the required contribution for fiscal year 2023-24. Employee contributions other than cost
sharing (whether paid by the employer or the employee) are in addition to the results shown below. The required employer contributions in this report do not reflect any cost sharing arrangement you may have with your employees.
Fiscal Year Employer Normal
Cost Rate Employer Amortization of Unfunded Accrued Liability
Employee PEPRA Rate
2022-23 11.75% $41,939,550 7.50%
Projected Results
2023-24 11.3% $44,562,000 TBD
The actual investment return for fiscal year 2020-21 was not known at the time this report was prepared. The projections above assume the investment return for that year would be 7.0%. To the extent the actual investment return for fiscal year 2020-21 differs from 7.0%, the actual contribution requirements for fiscal year 2023-24 will differ from those shown above. For additional details regarding the assumptions and methods used for these projections please refer to the “Projected Employer Contributions” in the “Highlights and Executive Summary” section. This section also contains projected required contributions through fiscal year 2027-28. Changes from Previous Year’s Valuations There are no significant changes in actuarial assumptions or policies in your 2020 actuarial valuation. Your annual valuation report is an important tool for monitoring the health of your CalPERS pension Plan. Your report contains useful information about future required contributions and ways to control your plan’s funding progress.
In addition to your annual actuarial report, my office has developed tools for employers to plan, project and protect the retirement benefits of your employees. Pension Outlook is a tool to help plan and budget pension costs into the future with easy to understand results and charts.
You will be able to view the projected funded status and required employer contributions for pension plans in different potential scenarios for up to 30 years into the future — which will make budgeting more predictable. While

Miscellaneous Plan of the City of Anaheim (CalPERS ID: 6207170049) Annual Valuation Report as of June 30, 2020 Page 2
Pension Outlook cannot predict the future, it can provide valuable planning information based on a variety of future scenarios that you select.
Pension Outlook can help you answer specific questions about your plans, including:
• When is my plan’s funded status expected to increase?
• What happens to my required contributions in a down market?
• How does the discount rate assumption affect my contributions?
• What is the impact of making an additional discretionary payment to my plan?
To get started, visit our Pension Outlook page at www.calpers.ca.gov/page/employers/actuarial-resources/pension-outlook-overview and take the steps to register online. CalPERS will be completing an Asset Liability Management (ALM) review process in November 2021 that will review the
capital market assumptions and the strategic asset allocation and ascertain whether a change in the discount rate and other economic assumptions is warranted. In addition, the Actuarial Office will be completing its Experience Study to review the demographic experience within the pension system and make recommendations to modify future assumptions where appropriate. Any assumption change stemming from these studies will be reflected in the June 30, 2021 actuarial valuation. Furthermore, this valuation does not reflect any impacts from the COVID-19 pandemic on your pension plan. The impact of COVID-19 on retirement plans is not yet known and CalPERS actuaries will continue to monitor the effects and, where necessary, make future adjustments to actuarial assumptions. Further descriptions of general changes are included in the “Highlights and Executive Summary” section and in Appendix A, “Actuarial Methods and Assumptions.” The effects of the changes on the required contributions are included in the “Reconciliation of Required Employer Contributions” section. Questions
We understand that you might have questions about these results, and your assigned CalPERS actuary whose signature is on the valuation report is available to discuss. If you have other questions, you may call the Customer Contact Center at (888)-CalPERS or (888-225-7377). Sincerely,
SCOTT TERANDO, ASA, EA, MAAA, FCA, CFA Chief Actuary, CalPERS

Actuarial Valuation as of June 30, 2020
for the Miscellaneous Plan
of the City of Anaheim (CalPERS ID: 6207170049)
(Rate Plan ID: 257)
Required Contributions
for Fiscal Year July 1, 2022 – June 30, 2023

Table of Contents
Actuarial Certification 1
Highlights and Executive Summary
Introduction 3 Purpose of the Report 3 Required Contributions 4 Additional Discretionary Employer Contributions 5 Plan’s Funded Status 6 Projected Employer Contributions 6 Cost 7 Changes Since the Prior Year’s Valuation 8 Subsequent Events 8
Assets
Reconciliation of the Market Value of Assets 10 Asset Allocation 11
CalPERS History of Investment Returns 12
Liabilities and Contributions
Development of Accrued and Unfunded Liabilities 14 (Gain) / Loss Analysis 6/30/19 - 6/30/20 15 Schedule of Amortization Bases 16 Amortization Schedule and Alternatives 18 Reconciliation of Required Employer Contributions 20 Employer Contribution History 21 Funding History 21 Normal Cost by Benefit Group 22 PEPRA Member Contribution Rates 23
Risk Analysis
Future Investment Return Scenarios 25 Discount Rate Sensitivity 26 Mortality Rate Sensitivity 26 Maturity Measures 27 Maturity Measures History 28 Hypothetical Termination Liability 29
Plan’s Major Benefit Provisions
Plan’s Major Benefit Options 31
Appendix A – Actuarial Methods and Assumptions
Actuarial Data A-1 Actuarial Methods A-1 Actuarial Assumptions A-4
Miscellaneous A-22 Appendix B – Principal Plan Provisions B-1 Appendix C – Participant Data
Summary of Valuation Data C-1 Active Members C-2 Transferred and Terminated Members C-3 Retired Members and Beneficiaries C-4
Appendix D – Glossary of Actuarial Terms D-1
(CY) FIN JOB INSTANCE ID: 385978 (PY) FIN JOB INSTANCE ID: 349878 REPORT ID: 385979

CalPERS Actuarial Valuation - June 30, 2020 Miscellaneous Plan of the City of Anaheim CalPERS ID: 6207170049
Page 1
Actuarial Certification To the best of our knowledge, this report is complete and accurate and contains sufficient information to disclose, fully and fairly, the funded condition of the Miscellaneous Plan of the City of Anaheim. This valuation is based on the member and financial data as of June 30, 2020 provided by the various CalPERS databases and the benefits under this plan with CalPERS as of the date this report was produced. It is our opinion that the valuation has been performed in accordance with generally accepted actuarial principles, in accordance with standards of practice prescribed by the Actuarial Standards Board, and that the assumptions and methods are internally consistent and reasonable for this plan, as prescribed by the CalPERS Board of Administration according to provisions set forth in the California Public Employees’ Retirement Law. The undersigned is an actuary who satisfies the Qualification Standards for Actuaries Issuing Statements of Actuarial Opinion in the United States with regard to pensions.
KERRY J. WORGAN, MAAA, FSA, FCIA Supervising Pension Actuary, CalPERS
Highlights and Executive Summary
• Introduction
• Purpose of the Report
• Required Contributions
• Additional Discretionary Employer Contributions
• Plan’s Funded Status
• Projected Employer Contributions
• Cost
• Changes Since the Prior Year’s Valuation
• Subsequent Events
CalPERS Actuarial Valuation - June 30, 2020 Miscellaneous Plan of the City of Anaheim CalPERS ID: 6207170049
Page 3
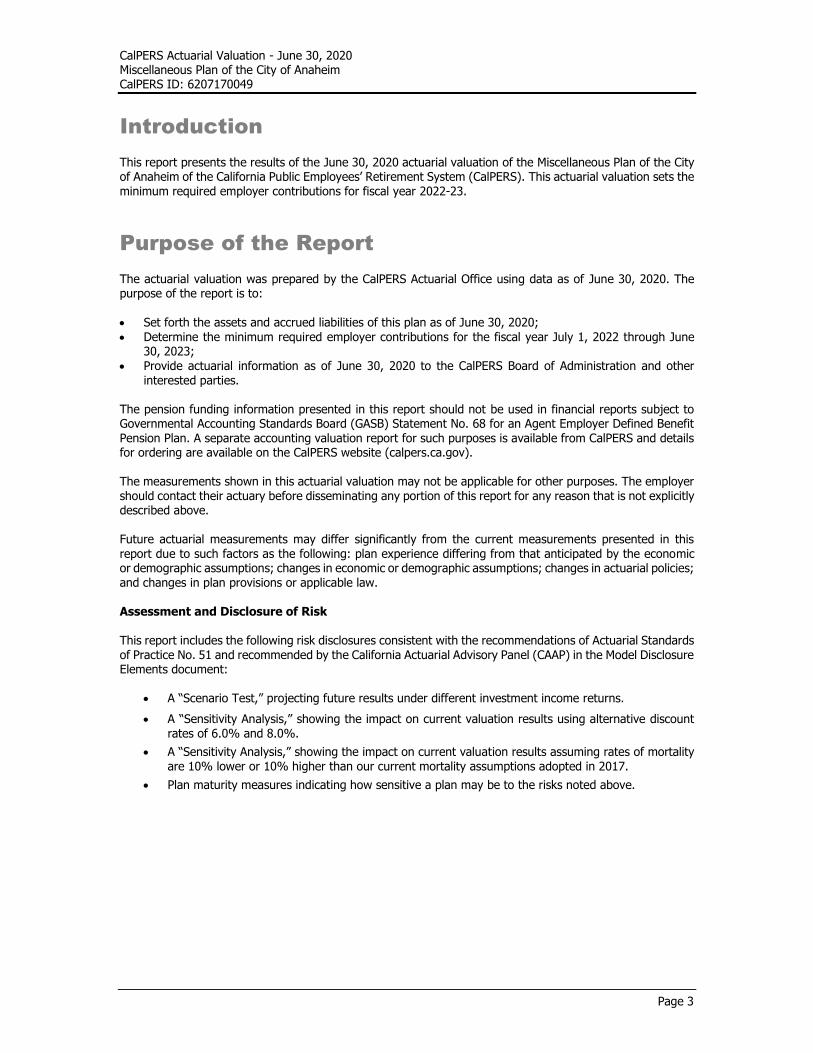
Introduction This report presents the results of the June 30, 2020 actuarial valuation of the Miscellaneous Plan of the City of Anaheim of the California Public Employees’ Retirement System (CalPERS). This actuarial valuation sets the minimum required employer contributions for fiscal year 2022-23.
Purpose of the Report The actuarial valuation was prepared by the CalPERS Actuarial Office using data as of June 30, 2020. The purpose of the report is to: • Set forth the assets and accrued liabilities of this plan as of June 30, 2020;
• Determine the minimum required employer contributions for the fiscal year July 1, 2022 through June 30, 2023;
• Provide actuarial information as of June 30, 2020 to the CalPERS Board of Administration and other interested parties.
The pension funding information presented in this report should not be used in financial reports subject to Governmental Accounting Standards Board (GASB) Statement No. 68 for an Agent Employer Defined Benefit Pension Plan. A separate accounting valuation report for such purposes is available from CalPERS and details for ordering are available on the CalPERS website (calpers.ca.gov). The measurements shown in this actuarial valuation may not be applicable for other purposes. The employer should contact their actuary before disseminating any portion of this report for any reason that is not explicitly described above. Future actuarial measurements may differ significantly from the current measurements presented in this
report due to such factors as the following: plan experience differing from that anticipated by the economic or demographic assumptions; changes in economic or demographic assumptions; changes in actuarial policies; and changes in plan provisions or applicable law. Assessment and Disclosure of Risk This report includes the following risk disclosures consistent with the recommendations of Actuarial Standards of Practice No. 51 and recommended by the California Actuarial Advisory Panel (CAAP) in the Model Disclosure Elements document:
• A “Scenario Test,” projecting future results under different investment income returns.
• A “Sensitivity Analysis,” showing the impact on current valuation results using alternative discount rates of 6.0% and 8.0%.
• A “Sensitivity Analysis,” showing the impact on current valuation results assuming rates of mortality are 10% lower or 10% higher than our current mortality assumptions adopted in 2017.
• Plan maturity measures indicating how sensitive a plan may be to the risks noted above.

CalPERS Actuarial Valuation - June 30, 2020 Miscellaneous Plan of the City of Anaheim CalPERS ID: 6207170049
Page 4
Required Contributions
Fiscal Year
Required Employer Contribution 2022-23
Employer Normal Cost Rate
11.75%
Plus, Either
1) Monthly Employer Dollar UAL Payment $3,494,963
Or
2) Annual UAL Prepayment Option*
$40,544,493
Required PEPRA Member Contribution Rate
7.50%
The total minimum required employer contribution is the sum of the Plan’s Employer Normal Cost Rate (expressed as a percentage of payroll) and the Employer Unfunded Accrued Liability (UAL) Contribution Amount (billed monthly in dollars).
* Only the UAL portion of the employer contribution can be prepaid (which must be received in full no later than July 31). Any prepayment totaling over $5 million requires a 72-hour notice email to [email protected]. Plan Normal Cost contributions will be made as part of the payroll reporting process. If there is contractual cost sharing or other change, this amount will change.
In accordance with Sections 20537 and 20572 of the Public Employees’ Retirement Law, if a contracting agency fails to remit the required contributions when due, interest and penalties may apply.
For additional detail regarding the determination of the required contribution for PEPRA members, see ”PEPRA Member Contribution Rates” in the “Liabilities and Contributions” section. Required member contributions for Classic members can be found in Appendix B.
Fiscal Year Fiscal Year
2021-22 2022-23
Normal Cost Contribution as a Percentage of Payroll
Total Normal Cost 19.80% 19.58%
Employee Contribution1 7.84% 7.83%
Employer Normal Cost2 11.96% 11.75%
Projected Annual Payroll for Contribution Year $134,910,574 $135,273,441
Estimated Employer Contributions Based On
Projected Payroll
Total Normal Cost $26,712,294 $26,486,540
Employee Contribution1 10,576,989 10,591,910
Employer Normal Cost2 16,135,305 15,894,630
Unfunded Liability Contribution
38,823,435
41,939,550
% of Projected Payroll (illustrative only) 28.78% 31.00%
Estimated Total Employer Contribution $54,958,740 $57,834,180
% of Projected Payroll (illustrative only) 40.74% 42.75%
1 For classic members, this is the percentage specified in the Public Employees’ Retirement Law, net of any reduction from
the use of a modified formula or other factors. For PEPRA members, the member contribution rate is based on 50% of the normal cost. A development of PEPRA member contribution rates can be found in the “Liabilities and Contributions” section. Employee cost sharing is not shown in this report.
2 The Employer Normal Cost is a blended rate for all benefit groups in the plan. For a breakout of normal cost by benefit group, see “Normal Cost by Benefit Group” in the “Liabilities and Contributions” section.

CalPERS Actuarial Valuation - June 30, 2020 Miscellaneous Plan of the City of Anaheim CalPERS ID: 6207170049
Page 5
Additional Discretionary Employer Contributions The minimum required employer contribution towards the Unfunded Accrued Liability (UAL) for this rate plan for the 2022-23 fiscal year is $41,939,550. CalPERS allows employers to make additional discretionary payments (ADPs) at any time and in any amount. These optional payments serve to reduce the UAL and future required contributions and can result in significant long-term savings. Employers can also use ADPs to stabilize annual contributions as a fixed dollar amount, percent of payroll or percent of revenue. Provided below are select ADP options for consideration. Making such an ADP during fiscal year 2022-23 does not require an ADP be made in any future year, nor does it change the remaining amortization period of any portion of unfunded liability. For information on permanent changes to amortization periods, see the “Amortization Schedule and Alternatives” section of the report. If you are considering making an ADP, please contact your actuary for additional information. Minimum Required Employer Contribution for Fiscal Year 2022-23
Estimated Normal Cost
Minimum UAL Payment
ADP Total UAL Contribution
Estimated Total Contribution
$15,894,630 $41,939,550 $0 $41,939,550 $57,834,180
Alternative Fiscal Year 2022-23 Employer Contributions for Greater UAL Reduction
Funding Target
Estimated Normal Cost
Minimum UAL Payment
ADP1 Total UAL Contribution
Estimated Total Contribution
15 years $15,894,630 $41,939,550 $5,489,437 $47,428,987 $63,323,617
10 years $15,894,630 $41,939,550 $19,564,560 $61,504,110 $77,398,740
5 years $15,894,630 $41,939,550 $63,416,141 $105,355,691 $121,250,321
1 The ADP amounts are assumed to be made in the middle of the fiscal year. A payment made earlier or later in the fiscal year would have to be less or more than the amount shown to have the same effect on the UAL amortization.
Note that the calculations above are based on the projected Unfunded Accrued Liability as of June 30, 2022 as determined in the June 30, 2020 actuarial valuation. New unfunded liabilities can emerge in future years due to assumption or method changes, changes in plan provisions and actuarial experience different than assumed. Making an ADP illustrated above for the indicated number of years will not result in a plan that is exactly 100% funded in the indicated number of years. Valuation results will vary from one year to the next and can diverge significantly from projections over a period of several years.
CalPERS Actuarial Valuation - June 30, 2020 Miscellaneous Plan of the City of Anaheim CalPERS ID: 6207170049
Page 6
Plan’s Funded Status
This measure of funded status is an assessment of the need for future employer contributions based on the actuarial cost method used to fund the plan. The UAL is the present value of future employer contributions for service that has already been earned and is in addition to future normal cost contributions for active members. For a measure of funded status that is appropriate for assessing the sufficiency of plan assets to cover estimated termination liabilities, please see “Hypothetical Termination Liability” in the “Risk Analysis” section.
Projected Employer Contributions
The table below shows the required and projected employer contributions (before cost sharing) for the next six fiscal years. The projection assumes that all actuarial assumptions will be realized and that no further changes to assumptions, contributions, benefits, or funding will occur during the projection period. Actual contribution rates during this projection period could be significantly higher or lower than the projection shown below. The projected normal cost percentages in the projections below reflect that the normal cost will continue to decline over time as new employees are hired into PEPRA or other lower cost benefit tiers.
Required
Contribution Projected Future Employer Contributions
(Assumes 7.00% Return for Fiscal Year 2020-21)
Fiscal Year 2022-23 2023-24 2024-25 2025-26 2026-27 2027-28
Normal Cost % 11.75% 11.3% 11.0% 10.7% 10.4% 10.1%
UAL Payment $41,939,550 $44,562,000 $47,423,000 $49,470,000 $51,430,000 $52,781,000
Total as a % of Payroll* 42.75% 43.4% 44.2% 44.4% 44.5% 44.2%
Projected Payroll $135,273,441 $138,993,461 $142,815,781 $146,743,215 $150,778,654 $154,925,066
*Illustrative only and based on the projected payroll shown. For some sources of UAL, the change in UAL is amortized using a 5-year ramp up. For more information, please see “Amortization of the Unfunded Actuarial Accrued Liability” under “Actuarial Methods” in Appendix A. This method phases in the impact of the change in UAL over a 5-year period in order to reduce employer cost volatility from year to year. As a result of this methodology, dramatic changes in the required employer contributions in any one year are less likely. However, required contributions can change gradually and significantly over the next five years. In years when there is a large increase in UAL, the relatively small amortization payments during the ramp up period could result in a funded ratio that is projected to decrease initially while the contribution impact of the increase in the UAL is phased in. For projected contributions under alternate investment return scenarios, please see the “Future Investment Return Scenarios” in the “Risk Analysis” section. Our online pension plan modeling and projection tool, Pension Outlook, is available in the Employers section of the CalPERS website. Pension Outlook is a tool to help plan and budget pension costs into the future with results and charts that are easy to understand.
June 30, 2019 June 30, 2020
1. Present Value of Projected Benefits $1,693,642,256 $1,732,280,281
2. Entry Age Accrued Liability 1,502,706,398 1,543,927,214
3. Market Value of Assets (MVA) 1,057,123,078 1,084,188,232
4. Unfunded Accrued Liability (UAL) [(2) – (3)] $445,583,320 $459,738,982
5. Funded Ratio [(3) / (2)] 70.3% 70.2%
CalPERS Actuarial Valuation - June 30, 2020 Miscellaneous Plan of the City of Anaheim CalPERS ID: 6207170049
Page 7
Cost Actuarial Determination of Pension Plan Cost Contributions to fund the pension plan are comprised of two components:
• Normal Cost, expressed as a percentage of total active payroll • Amortization of the Unfunded Accrued Liability (UAL), expressed as a dollar amount
For fiscal years prior to 2017-18, the Amortization of UAL component was expressed as percentage of total active payroll. Starting with fiscal year 2017-18, the Amortization of UAL component is expressed as a dollar amount and invoiced on a monthly basis. There is an option to prepay this amount during July of each fiscal year.
The Normal Cost component is expressed as a percentage of active payroll with employer and employee contributions payable as part of the regular payroll reporting process. The determination of both components requires complex actuarial calculations. The calculations are based on a set of actuarial assumptions which can be divided into two categories:
• Demographic assumptions (e.g., mortality rates, retirement rates, employment termination rates,
disability rates)
• Economic assumptions (e.g., future investment earnings, inflation, salary growth rates)
These assumptions reflect CalPERS’ best estimate of future experience of the plan and are long term in nature. We recognize that all assumptions will not be realized in any given year. For example, the investment earnings at CalPERS have averaged 5.5% over the 20 years ending June 30, 2020, yet individual fiscal year returns have ranged from -23.6% to +20.7%. In addition, CalPERS reviews all actuarial assumptions by conducting in-depth experience studies every four years, with the most recent experience study completed in 2017.
CalPERS Actuarial Valuation - June 30, 2020 Miscellaneous Plan of the City of Anaheim CalPERS ID: 6207170049
Page 8
Changes Since the Prior Year’s Valuation Benefits The standard actuarial practice at CalPERS is to recognize mandated legislative benefit changes in the first annual valuation following the effective date of the legislation. Voluntary benefit changes by plan amendment are generally included in the first valuation that is prepared after the amendment becomes effective, even if the valuation date is prior to the effective date of the amendment. This valuation generally reflects plan changes by amendments effective before the date of the report. Please refer to the “Plan’s Major Benefit Options” and Appendix B for a summary of the plan provisions used in this valuation. The effect of any mandated benefit changes or plan amendments on the unfunded liability is shown in the “(Gain)/Loss Analysis” and the effect on the employer contribution is shown in the “Reconciliation of Required Employer Contributions.” It should be noted that no change in liability or contribution is shown for
any plan changes which were already included in the prior year’s valuation. Actuarial Methods and Assumptions The are no significant changes to the actuarial methods or assumptions for the 2020 actuarial valuation.
Subsequent Events
The contribution requirements determined in this actuarial valuation report are based on demographic and financial information as of June 30, 2020. Changes in the value of assets subsequent to that date are not reflected. Investment returns below the assumed rate of return will increase future required contributions while investment returns above the assumed rate of return will decrease future required contributions. CalPERS will be completing an Asset Liability Management (ALM) review process in November 2021 that will
review the capital market assumptions and the strategic asset allocation and ascertain whether a change in the discount rate and other economic assumptions is warranted. In addition, the Actuarial Office will be completing its Experience Study to review the demographic experience within the pension system and make recommendations to modify future assumptions where appropriate. Furthermore, this valuation does not reflect any impacts from the COVID-19 pandemic on your pension plan. The impact of COVID-19 on retirement plans is not yet known and CalPERS actuaries will continue to monitor the effects and, where necessary, make future adjustments to actuarial assumptions. The projected employer contributions on Page 6 are calculated under the assumption that the discount rate remains at 7.0% going forward and that the realized rate of return on assets for fiscal year 2020-21 is 7.0%. This actuarial valuation report reflects statutory changes, regulatory changes and CalPERS Board actions through January 2021. Any subsequent changes or actions are not reflected.

Assets
• Reconciliation of the Market Value of Assets
• Asset Allocation
• CalPERS History of Investment Returns
CalPERS Actuarial Valuation - June 30, 2020 Miscellaneous Plan of the City of Anaheim CalPERS ID: 6207170049
Page 10
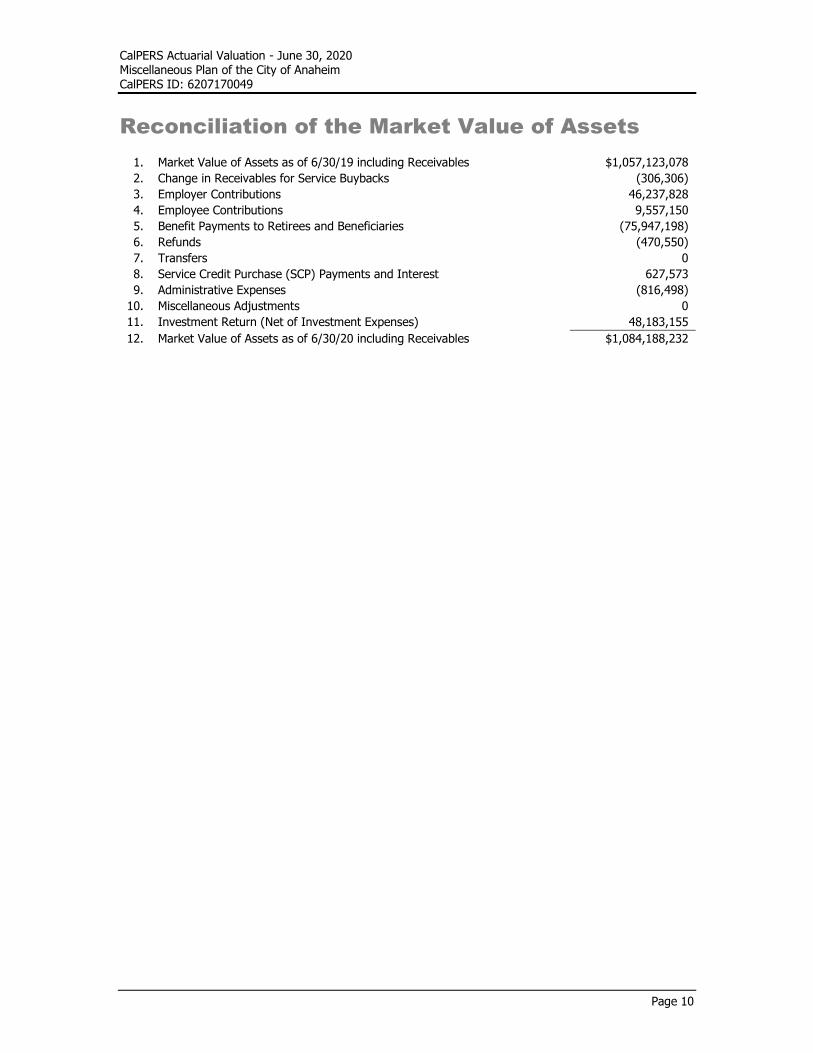
Reconciliation of the Market Value of Assets
1. Market Value of Assets as of 6/30/19 including Receivables $1,057,123,078
2. Change in Receivables for Service Buybacks (306,306)
3. Employer Contributions 46,237,828
4. Employee Contributions 9,557,150
5. Benefit Payments to Retirees and Beneficiaries (75,947,198)
6. Refunds (470,550)
7. Transfers 0
8. Service Credit Purchase (SCP) Payments and Interest 627,573
9. Administrative Expenses (816,498)
10. Miscellaneous Adjustments 0
11. Investment Return (Net of Investment Expenses) 48,183,155
12. Market Value of Assets as of 6/30/20 including Receivables $1,084,188,232

CalPERS Actuarial Valuation - June 30, 2020 Miscellaneous Plan of the City of Anaheim CalPERS ID: 6207170049
Page 11
Asset Allocation CalPERS adheres to an Asset Allocation Strategy which establishes asset class allocation policy targets and ranges and manages those asset class allocations within their policy ranges. CalPERS Investment Belief No. 6 recognizes that strategic asset allocation is the dominant determinant of portfolio risk and return. On December 19, 2017, the CalPERS Board of Administration adopted changes to the current asset allocation as shown in the Policy Target Allocation below expressed as a percentage of total assets. The asset allocation shown below reflect the allocation of the Public Employees’ Retirement Fund (PERF) in its entirety as of June 30, 2020. The assets for City of Anaheim Miscellaneous Plan are part of the PERF and are invested accordingly.
Asset Class
Actual Allocation
Policy Target Allocation
Public Equity 53.0% 50.0%
Private Equity 6.3% 8.0%
Global Fixed Income 28.3% 28.0%
Real Assets 11.3% 13.0%
Liquidity 0.9% 1.0%
Inflation Sensitive Assets 0.0% 0.0%
Trust Level1 0.2% 0.0%
Total Fund 100.0% 100.0%
1 Trust Level includes Multi-Asset Class, Completion Overlay, Risk Mitigation, Absolute Return Strategies, Plan Level Transition and other Total Fund level portfolios.
Strategic Asset Allocation Policy Targets
CalPERS Actuarial Valuation - June 30, 2020 Miscellaneous Plan of the City of Anaheim CalPERS ID: 6207170049
Page 12
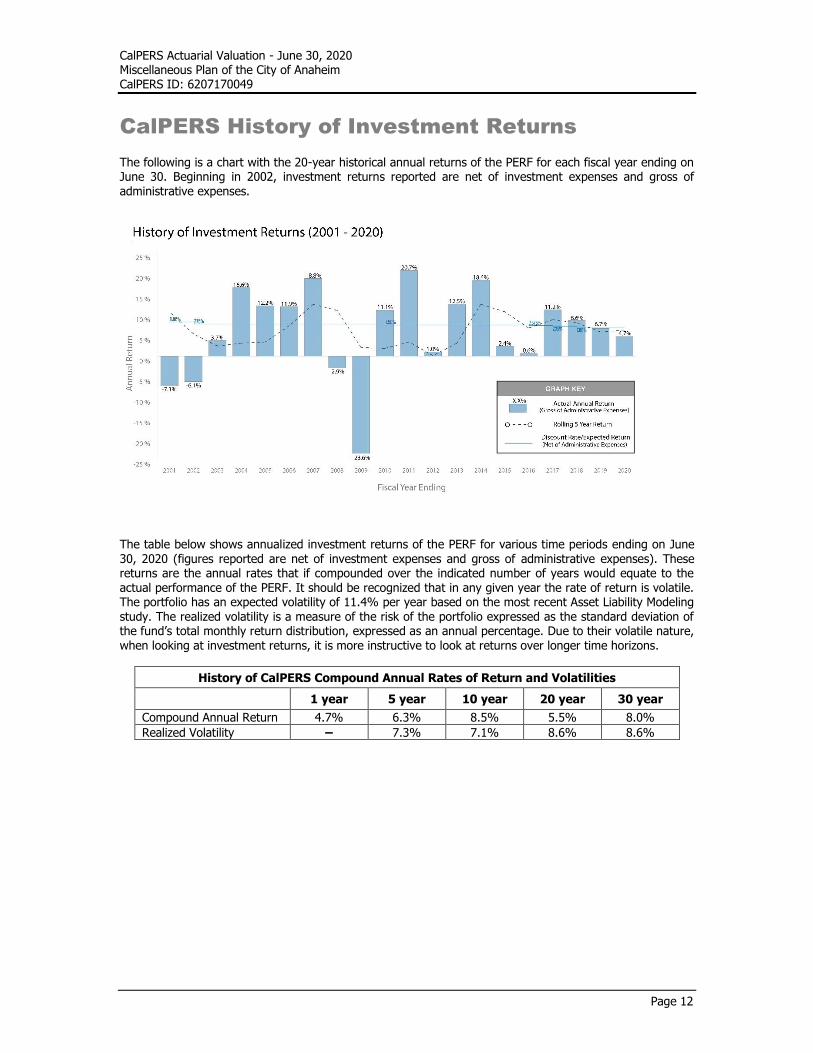
CalPERS History of Investment Returns
The following is a chart with the 20-year historical annual returns of the PERF for each fiscal year ending on June 30. Beginning in 2002, investment returns reported are net of investment expenses and gross of administrative expenses.
The table below shows annualized investment returns of the PERF for various time periods ending on June
30, 2020 (figures reported are net of investment expenses and gross of administrative expenses). These returns are the annual rates that if compounded over the indicated number of years would equate to the actual performance of the PERF. It should be recognized that in any given year the rate of return is volatile. The portfolio has an expected volatility of 11.4% per year based on the most recent Asset Liability Modeling study. The realized volatility is a measure of the risk of the portfolio expressed as the standard deviation of the fund’s total monthly return distribution, expressed as an annual percentage. Due to their volatile nature, when looking at investment returns, it is more instructive to look at returns over longer time horizons.
History of CalPERS Compound Annual Rates of Return and Volatilities
1 year 5 year 10 year 20 year 30 year
Compound Annual Return 4.7% 6.3% 8.5% 5.5% 8.0%
Realized Volatility – 7.3% 7.1% 8.6% 8.6%

Liabilities and Contributions
• Development of Accrued and Unfunded Liabilities
• (Gain) / Loss Analysis 6/30/19 - 6/30/20
• Schedule of Amortization Bases
• Amortization Schedule and Alternatives
• Reconciliation of Required Employer Contributions
• Employer Contribution History
• Funding History
• Normal Cost by Benefit Group
• PEPRA Member Contribution Rates

CalPERS Actuarial Valuation - June 30, 2020 Miscellaneous Plan of the City of Anaheim CalPERS ID: 6207170049
Page 14
Development of Accrued and Unfunded Liabilities June 30, 2019 June 30, 2020
1. Present Value of Projected Benefits
a) Active Members $677,918,337 $681,467,490
b) Transferred Members 55,365,718 57,108,310
c) Terminated Members 27,646,249 29,605,851
d) Members and Beneficiaries Receiving Payments 932,711,952 964,098,630
e) Total $1,693,642,256 $1,732,280,281
2. Present Value of Future Employer Normal Costs $110,155,194 $107,572,200
3. Present Value of Future Employee Contributions $80,780,664 $80,780,867
4. Entry Age Accrued Liability
a) Active Members [(1a) - (2) - (3)] $486,982,479 $493,114,423
b) Transferred Members (1b) 55,365,718 57,108,310
c) Terminated Members (1c) 27,646,249 29,605,851
d) Members and Beneficiaries Receiving Payments (1d) 932,711,952 964,098,630
e) Total $1,502,706,398 $1,543,927,214
5. Market Value of Assets (MVA) $1,057,123,078 $1,084,188,232
6. Unfunded Accrued Liability (UAL) [(4e) - (5)] $445,583,320 $459,738,982
7. Funded Ratio [(5) / (4e)] 70.3% 70.2%

CalPERS Actuarial Valuation - June 30, 2020 Miscellaneous Plan of the City of Anaheim CalPERS ID: 6207170049
Page 15
(Gain)/Loss Analysis 6/30/19 – 6/30/20
To calculate the cost requirements of the plan, assumptions are made about future events that affect the amount and timing of benefits to be paid and assets to be accumulated. Each year, actual experience is compared to the expected experience based on the actuarial assumptions. This results in actuarial gains or losses, as shown below.
1. Total (Gain)/Loss for the Year a) Unfunded Accrued Liability (UAL) as of 6/30/19 $445,583,320 b) Expected Payment on the UAL during 2019-20 31,473,395 c) Interest through 6/30/20 [.07 x (1a) - ((1.07)½ - 1) x (1b)] 30,107,895 d) Expected UAL before all other changes [(1a) - (1b) + (1c)] 444,217,820 e) Change due to plan changes 0 f) Change due to AL Significant Increase 0
g) Change due to assumption change 0 h) Change due to method change 0 i) Expected UAL after all other changes [(1d) + (1e) + (1f) + (1g) + (1h)] 444,217,820 j) Actual UAL as of 6/30/20 459,738,982
k) Total (Gain)/Loss for 2019-20 [(1j) - (1i)] $15,521,162 2. Contribution (Gain)/Loss for the Year a) Expected Contribution (Employer and Employee) $57,388,957 b) Interest on Expected Contributions 1,974,642 c) Actual Contributions 55,794,978 d) Interest on Actual Contributions 1,919,796 e) Expected Contributions with Interest [(2a) + (2b)] 59,363,599 f) Actual Contributions with Interest [(2c) + (2d)] 57,714,774
g) Contribution (Gain)/Loss [(2e) - (2f)] $1,648,825 3. Investment (Gain)/Loss for the Year a) Market Value of Assets as of 6/30/19 $1,057,123,078 b) Prior Fiscal Year Receivables (2,440,738) c) Current Fiscal Year Receivables 2,134,431 d) Contributions Received 55,794,978 e) Benefits and Refunds Paid (76,417,747) f) Transfers, SCP Payments and Interest, and Miscellaneous Adjustments 627,573 g) Expected Return [.07 x (3a + 3b) + ((1.07)½ - 1) x ((3d) + (3e) + (3f))] 73,139,768 h) Expected Assets as of 6/30/20 [(3a) + (3b) + (3c) + (3d) + (3e) + (3f) + (3g)] 1,109,961,343 i) Actual Market Value of Assets as of 6/30/20 1,084,188,232
j) Investment (Gain)/Loss [(3h) - (3i)] $25,773,111 4. Liability (Gain)/Loss for the Year a) Total (Gain)/Loss (1j) $15,521,162 b) Contribution (Gain)/Loss (2g) 1,648,825 c) Investment (Gain)/Loss (3j) 25,773,111
d) Liability (Gain)/Loss [(4a) - (4b) - (4c)] ($11,900,774) 5. Non-Investment (Gain)/Loss for the Year a) Contribution (Gain)/Loss (2g) $1,648,825 b) Liability (Gain)/Loss (4d) (11,900,774)
c) Non-Investment (Gain)/Loss [(5a) + (5b)] ($10,251,949)

CalPERS Actuarial Valuation - June 30, 2020 Miscellaneous Plan of the City of Anaheim CalPERS ID: 6207170049
Page 16
Schedule of Amortization Bases
Below is the schedule of the plan’s amortization bases. Note that there is a two-year lag between the valuation date and the start of the contribution fiscal year.
• The assets, liabilities, and funded status of the plan are measured as of the valuation date: June 30, 2020. • The required employer contributions determined by the valuation are for the fiscal year beginning two years after the valuation date: fiscal year 2022-23.
This two-year lag is necessary due to the amount of time needed to extract and test the membership and financial data, and the need to provide public agencies with their required employer contribution well in advance of the start of the fiscal year.
The Unfunded Accrued Liability (UAL) is used to determine the employer contribution and therefore must be rolled forward two years from the valuation date to the first day of the fiscal year for which the contribution is being determined. The UAL is rolled forward each year by subtracting the expected payment on the UAL for the fiscal year and adjusting for interest. The expected payment on the UAL for a fiscal year is equal to the Expected Employer Contribution for the fiscal year minus the Expected Normal Cost for the year. The Employer Contribution for the first fiscal year is determined by the actuarial valuation two years ago and the contribution for the second year is from the actuarial valuation one year ago. Additional discretionary payments are reflected in the Expected Payments column in the fiscal year they were made by the agency.
Reason for Base Date Est.
Ramp Level
2022-23 Ramp Shape
Escala-tion Rate
Amort. Period
Balance 6/30/20
Expected Payment 2020-21
Balance 6/30/21
Expected Payment 2021-22
Balance 6/30/22
Minimum Required Payment 2022-23
Fresh Start 6/30/06 No Ramp 2.75% 6 55,913,440 8,295,716 51,246,225 8,523,849 46,016,323 8,758,255
Assumption Change 6/30/09 No Ramp 2.75% 9 42,068,276 4,805,101 40,042,620 4,937,242 37,738,481 5,073,016
Special (Gain)/Loss 6/30/09 No Ramp 2.75% 19 24,258,631 1,739,232 24,157,660 1,787,061 24,000,146 1,836,205
Special (Gain)/Loss 6/30/10 No Ramp 2.75% 20 10,171,556 708,295 10,150,899 727,773 10,108,648 747,786
Assumption Change 6/30/11 No Ramp 2.75% 11 21,030,087 2,109,692 20,319,911 2,167,708 19,500,010 2,227,320
Special (Gain)/Loss 6/30/11 No Ramp 2.75% 21 (35,109,563) (2,379,185) (35,106,184) (2,444,613) (35,034,890) (2,511,840)
Payment (Gain)/Loss 6/30/12 No Ramp 2.75% 22 4,778,129 315,647 4,786,090 324,327 4,785,630 333,247
(Gain)/Loss 6/30/12 No Ramp 2.75% 22 44,905,976 2,966,526 44,980,796 3,048,105 44,976,467 3,131,928
(Gain)/Loss 6/30/13 100% Up/Down 2.75% 23 165,283,905 11,212,362 165,255,621 11,520,702 164,906,408 11,837,521
Assumption Change 6/30/14 100% Up/Down 2.75% 14 73,229,298 6,963,316 71,152,439 7,154,807 68,732,120 7,351,564
(Gain)/Loss 6/30/14 100% Up/Down 2.75% 24 (118,610,984) (7,843,375) (118,800,503) (8,059,068) (118,780,173) (8,280,692)
(Gain)/Loss 6/30/15 100% Up/Down 2.75% 25 27,085,357 1,416,675 27,515,912 1,819,542 27,559,877 1,869,579
Assumption Change 6/30/16 100% Up/Down 2.75% 16 25,331,167 1,379,152 25,677,743 1,889,438 25,520,735 2,426,746
(Gain)/Loss 6/30/16 100% Up/Down 2.75% 26 86,156,209 3,385,823 88,684,821 4,638,578 90,094,576 5,957,674
Assumption Change 6/30/17 80% Up/Down 2.75% 17 21,834,164 796,192 22,538,968 1,227,131 22,847,342 1,681,169
(Gain)/Loss 6/30/17 80% Up/Down 2.75% 27 (41,294,031) (1,097,664) (43,049,181) (1,691,775) (44,312,638) (2,317,732)
Method Change 6/30/18 60% Up/Down 2.75% 18 9,242,906 172,331 9,711,649 354,139 10,025,140 545,817
Assumption Change 6/30/18 60% Up/Down 2.75% 18 46,575,175 868,377 48,937,181 1,784,515 50,516,867 2,750,383
(Gain)/Loss 6/30/18 60% Up/Down 2.75% 28 (18,956,975) (258,911) (20,016,144) (532,063) (20,866,904) (820,041)
Non-Investment (Gain)/Loss 6/30/19 No Ramp 0.00% 19 (4,869,846) 0 (5,210,735) (475,496) (5,083,630) (475,496)

CalPERS Actuarial Valuation - June 30, 2020 Miscellaneous Plan of the City of Anaheim CalPERS ID: 6207170049
Page 17
Schedule of Amortization Bases (continued)
Reason for Base Date Est.
Ramp Level
2022-23 Ramp Shape
Escala-tion Rate
Amort. Period
Balance 6/30/20
Expected Payment 2020-21
Balance 6/30/21
Expected Payment 2021-22
Balance 6/30/22
Minimum Required Payment 2022-23
Investment (Gain)/Loss 6/30/19 40% Up Only 0.00% 19 5,194,943 0 5,558,589 121,533 5,821,976 243,066
Non-Investment (Gain)/Loss 6/30/20 No Ramp 0.00% 20 (10,251,949) 0 (10,969,585) 0 (11,737,456) (1,071,079)
Investment (Gain)/Loss 6/30/20 20% Up Only 0.00% 20 25,773,111 0 27,577,229 0 29,507,635 645,154
Total 459,738,982 35,555,302 455,142,021 38,823,435 446,842,690 41,939,550

CalPERS Actuarial Valuation - June 30, 2020 Miscellaneous Plan of the City of Anaheim CalPERS ID: 6207170049
Page 20 Page 18
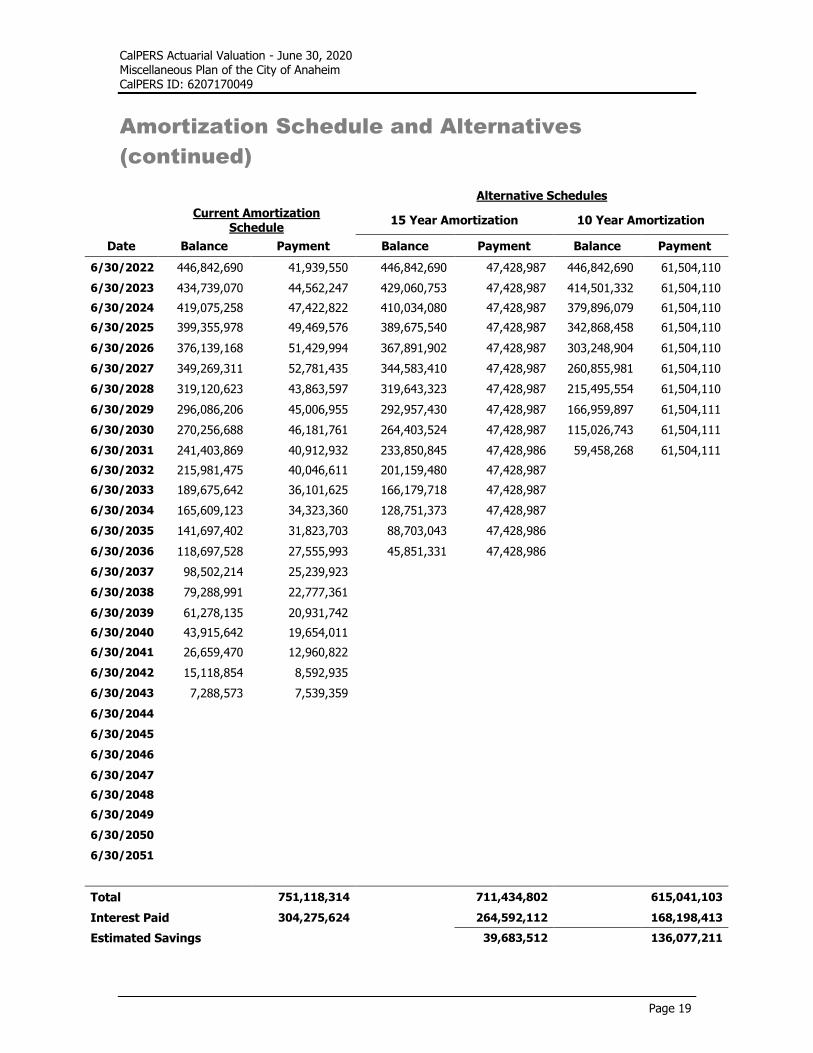
Amortization Schedule and Alternatives
The amortization schedule on the previous page shows the minimum contributions required according to the CalPERS amortization policy. Many agencies have expressed a desire for a more stable pattern of payments or have indicated interest in paying off the unfunded accrued liabilities more quickly than required. As such, we have provided alternative amortization schedules to help analyze the current amortization schedule and illustrate the potential savings of accelerating unfunded liability payments. Shown on the following page are future year amortization payments based on 1) the current amortization schedule reflecting the individual bases and remaining periods shown on the previous page, and 2) alternative “fresh start” amortization schedules using two sample periods that would both result in interest savings relative to the current amortization schedule. To initiate a Fresh Start, please consult with your plan actuary. The Current Amortization Schedule typically contains both positive and negative bases. Positive bases result
from plan changes, assumption changes, method changes or plan experience that increase unfunded liability. Negative bases result from plan changes, assumption changes, method changes, or plan experience that decrease unfunded liability. The combination of positive and negative bases within an amortization schedule can result in unusual or problematic circumstances in future years, such as:
• When a negative payment would be required on a positive unfunded actuarial liability; or • When the payment would completely amortize the total unfunded liability in a very short time period,
and results in a large change in the employer contribution requirement. In any year when one of the above scenarios occurs, the actuary will consider corrective action such as replacing the existing unfunded liability bases with a single “fresh start” base and amortizing it over a reasonable period. The Current Amortization Schedule on the following page may appear to show that, based on the current amortization bases, one of the above scenarios will occur at some point in the future. It is impossible to know today whether such a scenario will in fact arise since there will be additional bases added to the amortization schedule in each future year. Should such a scenario arise in any future year, the actuary will take appropriate action based on guidelines in the CalPERS amortization policy.
CalPERS Actuarial Valuation - June 30, 2020 Miscellaneous Plan of the City of Anaheim CalPERS ID: 6207170049
Page 19
Amortization Schedule and Alternatives
(continued)
Alternative Schedules
Current Amortization
Schedule 15 Year Amortization 10 Year Amortization
Date Balance Payment Balance Payment Balance Payment
6/30/2022 446,842,690 41,939,550 446,842,690 47,428,987 446,842,690 61,504,110
6/30/2023 434,739,070 44,562,247 429,060,753 47,428,987 414,501,332 61,504,110
6/30/2024 419,075,258 47,422,822 410,034,080 47,428,987 379,896,079 61,504,110
6/30/2025 399,355,978 49,469,576 389,675,540 47,428,987 342,868,458 61,504,110
6/30/2026 376,139,168 51,429,994 367,891,902 47,428,987 303,248,904 61,504,110
6/30/2027 349,269,311 52,781,435 344,583,410 47,428,987 260,855,981 61,504,110
6/30/2028 319,120,623 43,863,597 319,643,323 47,428,987 215,495,554 61,504,110
6/30/2029 296,086,206 45,006,955 292,957,430 47,428,987 166,959,897 61,504,111
6/30/2030 270,256,688 46,181,761 264,403,524 47,428,987 115,026,743 61,504,111
6/30/2031 241,403,869 40,912,932 233,850,845 47,428,986 59,458,268 61,504,111
6/30/2032 215,981,475 40,046,611 201,159,480 47,428,987
6/30/2033 189,675,642 36,101,625 166,179,718 47,428,987
6/30/2034 165,609,123 34,323,360 128,751,373 47,428,987
6/30/2035 141,697,402 31,823,703 88,703,043 47,428,986
6/30/2036 118,697,528 27,555,993 45,851,331 47,428,986
6/30/2037 98,502,214 25,239,923
6/30/2038 79,288,991 22,777,361
6/30/2039 61,278,135 20,931,742
6/30/2040 43,915,642 19,654,011
6/30/2041 26,659,470 12,960,822
6/30/2042 15,118,854 8,592,935
6/30/2043 7,288,573 7,539,359
6/30/2044
6/30/2045
6/30/2046
6/30/2047
6/30/2048
6/30/2049
6/30/2050
6/30/2051
Total 751,118,314 711,434,802 615,041,103
Interest Paid 304,275,624 264,592,112 168,198,413
Estimated Savings 39,683,512 136,077,211

CalPERS Actuarial Valuation - June 30, 2020 Miscellaneous Plan of the City of Anaheim CalPERS ID: 6207170049
Page 20
Reconciliation of Required Employer
Contributions
Normal Cost (% of Payroll)
1. For Period 7/1/21 – 6/30/22
a) Employer Normal Cost 11.96%
b) Employee Contribution 7.84%
c) Total Normal Cost 19.80%
2. Changes since the prior year annual valuation
a) Effect of demographic experience (0.22%)
b) Effect of plan changes 0.00%
c) Effect of assumption changes 0.00%
d) Effect of method changes 0.00%
e) Net effect of the changes above [sum of (a) through (d)] (0.22%)
3. For Period 7/1/22 – 6/30/23
a) Employer Normal Cost 11.75%
b) Employee Contribution 7.83%
c) Total Normal Cost 19.58%
Employer Normal Cost Change [(3a) – (1a)] (0.21%)
Employee Contribution Change [(3b) – (1b)] (0.01%)
Unfunded Liability Contribution ($)
1. For Period 7/1/21 – 6/30/22 38,823,435
2. Changes since the prior year annual valuation
a) Effect of adjustments to prior year’s amortization schedule 0
b) Effect of investment (gain)/loss during prior year1 645,154
c) Effect of non-investment (gain)/loss during prior year (1,071,079)
d) Effect of plan changes 0
e) Effect of AL Significant Increase 0
f) Effect of assumption changes 0
g) Changes to prior year amortization payments2
3,542,040
h) Effect of changes due to Fresh Start or immediate recognition of small balances 0
i) Effect of elimination of amortization base 0
j) Effect of method change 0
k) Net effect of the changes above [sum of (a) through (j)] 3,116,115
3. For Period 7/1/22 – 6/30/23 [(1) + (2k)] 41,939,550
The amounts shown for the period 7/1/21 – 6/30/22 may be different if a prepayment of unfunded actuarial liability is made or a plan change became effective after the prior year’s actuarial valuation was performed. 1 The unfunded liability contribution for the investment (gain)/loss during the year prior to the valuation date is 20% of the
“full” annual requirement due to the 5-year ramp. Increases to this amount that occur during the ramp period will be included in line g) in future years.
2 Includes scheduled escalation in individual amortization base payments due to the 5-year ramp and payroll growth assumption used in the pre-2019 amortization policy.

CalPERS Actuarial Valuation - June 30, 2020 Miscellaneous Plan of the City of Anaheim CalPERS ID: 6207170049
Page 21
Employer Contribution History
The table below provides a recent history of the required employer contributions for the plan. The amounts are based on the actuarial valuation from two years prior and does not account for prepayments or benefit changes made during a fiscal year. Additional discretionary payments before July 1, 2018 or after June 30, 2020 are not included.
Fiscal Year
Employer Normal Cost
Unfunded Rate
Unfunded Liability Payment ($)
Additional Discretionary Payments
2013 - 14 10.635% 11.396% N/A N/A
2014 - 15 10.440% 13.831% N/A N/A
2015 - 16 10.692% 15.679% N/A N/A
2016 - 17 10.851% 17.564% N/A N/A
2017 - 18 10.587% N/A 23,787,214 N/A
2018 - 19 10.896% N/A 28,092,418 0
2019 - 20 11.679% N/A 32,659,864 0
2020 - 21 12.447% N/A 35,555,302
2021 - 22 11.96% N/A 38,823,435
2022 - 23 11.75% N/A 41,939,550
Funding History
The table below shows the recent history of actuarial accrued liability, market value of assets, unfunded accrued liability, funded ratio and annual covered payroll.
[]
Valuation
Date
Accrued Liability
(AL)
Market Value of Assets
(MVA)
Unfunded Accrued
Liability (UAL)
Funded Ratio
Annual
Covered Payroll
6/30/2011 $1,004,444,176 $729,623,951 $274,820,225 72.6% $110,233,905
6/30/2012 1,045,037,179 712,496,875 332,540,304 68.2% 105,544,063
6/30/2013 1,101,160,179 786,277,764 314,882,415 71.4% 107,586,903
6/30/2014 1,194,358,553 900,750,001 293,608,552 75.4% 108,776,145
6/30/2015 1,217,106,269 896,992,397 320,113,872 73.7% 108,153,867
6/30/2016 1,295,861,876 881,702,968 414,158,908 68.0% 117,138,428
6/30/2017 1,361,536,161 957,141,479 404,394,682 70.3% 120,747,577
6/30/2018 1,455,034,735 1,014,033,704 441,001,031 69.7% 120,193,536
6/30/2019 1,502,706,398 1,057,123,078 445,583,320 70.3% 124,365,666
6/30/2020 1,543,927,214 1,084,188,232 459,738,982 70.2% 124,700,170
CalPERS Actuarial Valuation - June 30, 2020 Miscellaneous Plan of the City of Anaheim CalPERS ID: 6207170049
Page 22
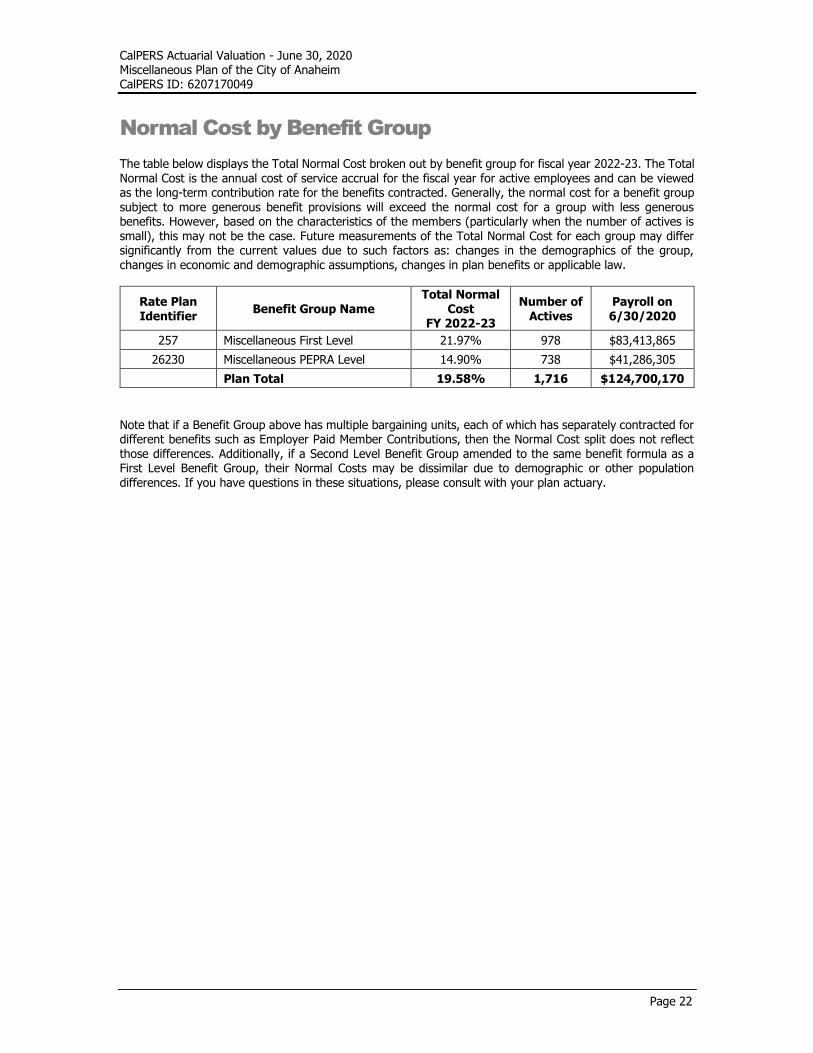
Normal Cost by Benefit Group The table below displays the Total Normal Cost broken out by benefit group for fiscal year 2022-23. The Total Normal Cost is the annual cost of service accrual for the fiscal year for active employees and can be viewed as the long-term contribution rate for the benefits contracted. Generally, the normal cost for a benefit group subject to more generous benefit provisions will exceed the normal cost for a group with less generous benefits. However, based on the characteristics of the members (particularly when the number of actives is small), this may not be the case. Future measurements of the Total Normal Cost for each group may differ significantly from the current values due to such factors as: changes in the demographics of the group, changes in economic and demographic assumptions, changes in plan benefits or applicable law.
Rate Plan Identifier
Benefit Group Name Total Normal
Cost FY 2022-23
Number of Actives
Payroll on 6/30/2020
257 Miscellaneous First Level 21.97% 978 $83,413,865
26230 Miscellaneous PEPRA Level 14.90% 738 $41,286,305
Plan Total 19.58% 1,716 $124,700,170
Note that if a Benefit Group above has multiple bargaining units, each of which has separately contracted for different benefits such as Employer Paid Member Contributions, then the Normal Cost split does not reflect those differences. Additionally, if a Second Level Benefit Group amended to the same benefit formula as a First Level Benefit Group, their Normal Costs may be dissimilar due to demographic or other population differences. If you have questions in these situations, please consult with your plan actuary.

CalPERS Actuarial Valuation - June 30, 2020 Miscellaneous Plan of the City of Anaheim CalPERS ID: 6207170049
Page 23
PEPRA Member Contribution Rates
The California Public Employees’ Pension Reform Act of 2013 (“PEPRA”) established new benefit formulas, final compensation period, and contribution requirements for “new” employees (generally those first hired into a CalPERS-covered position on or after January 1, 2013). In accordance with Government Code section 7522.30(b), “new members … shall have an initial contribution rate of at least 50% of the normal cost rate.” The normal cost for the plan is dependent on the benefit levels, actuarial assumptions and demographics of the plan, particularly members’ entry age into the plan. Should the total normal cost of the plan change by more than 1% from the base total normal cost established for the plan, the new member rate shall be 50% of the new normal cost rounded to the nearest quarter percent. The table below shows the determination of the PEPRA member contribution rates effective July 1, 2022, based on 50% of the Total Normal Cost for each respective plan as of the June 30, 2020 valuation.
Basis for Current Rate Rates Effective July 1, 2022
Rate Plan Identifier
Benefit Group Name Total
Normal Cost
Member Rate
Total Normal
Cost Change
Change Needed
Member Rate
26230 Miscellaneous PEPRA Level
14.809% 7.50% 14.90% 0.091% No 7.50%
For purposes of setting member rates, it is preferable to determine total normal cost using a large active population so that the rate remains relatively stable. While each CalPERS non-pooled plan has a sufficiently large active population for this purpose, the PEPRA active population by itself may not be sufficiently large. The total PEPRA normal cost will be determined based on the plan’s PEPRA membership only if the number of members covered under the PEPRA formula meets either:
1. 50% of the active population, or 2. 25% of the active population and 100 or more PEPRA members
Until one of these conditions is met, the plan’s total PEPRA normal cost will be determined using the entire active plan population (both PEPRA and Classic) based on the PEPRA benefit provisions. For this reason, the PEPRA member contribution rate determined in the table above may not equal 50% of the total normal cost of the PEPRA group shown on the “Normal Cost by Benefit Group” page.
Risk Analysis
• Future Investment Return Scenarios
• Discount Rate Sensitivity
• Mortality Rate Sensitivity
• Maturity Measures
• Maturity Measures History
• Hypothetical Termination Liability

CalPERS Actuarial Valuation - June 30, 2020 Miscellaneous Plan of the City of Anaheim CalPERS ID: 6207170049
Page 25
Future Investment Return Scenarios
Analysis was performed to determine the effects of various future investment returns on required employer contributions. The projections below provide a range of results based on five investment return scenarios assumed to occur during the next four fiscal years (2020-21, 2021-22, 2022-23 and 2023-24). The projections also assume that all other actuarial assumptions will be realized and that no further changes to assumptions, contributions, benefits, or funding will occur. For fiscal years 2020-21, 2021-22, 2022-23, and 2023-24 each scenario assumes an alternate fixed annual return. The fixed return assumptions for the five scenarios are 1.0%, 4.0%, 7.0%, 9.0% and 12.0%. These alternate investment returns were chosen based on stochastic analysis of possible future investment returns over the four-year period ending June 30, 2024. Using the expected returns and volatility of the asset classes in which the funds are invested, we produced five thousand stochastic outcomes for this period based
on the recently completed Asset Liability Management process. We then selected annual returns that approximate the 5th, 25th, 50th, 75th, and 95th percentiles for these outcomes. For example, of all the four-year outcomes generated in the stochastic analysis, approximately 25% had an average annual return of 4.0% or less. Required contributions outside of this range are also possible. In particular, whereas it is unlikely that investment returns will average less than 1.0% or greater than 12.0% over a four-year period, the likelihood of a single investment return less than 1.0% or greater than 12.0% in any given year is much greater.
Assumed Annual Return From 2020-21 through 2023-24
Projected Employer Contributions
2023-24 2024-25 2025-26 2026-27
1.0%
Normal Cost 11.3% 11.0% 10.7% 10.4%
UAL Contribution $46,175,000 $52,253,000 $59,116,000 $67,487,000
4.0%
Normal Cost 11.3% 11.0% 10.7% 10.4%
UAL Contribution $45,369,000 $49,862,000 $54,390,000 $59,705,000
7.0%
Normal Cost 11.3% 11.0% 10.7% 10.4%
UAL Contribution $44,562,000 $47,423,000 $49,470,000 $51,430,000
9.0%
Normal Cost 11.6% 11.6% 11.6% 11.7%
UAL Contribution $44,118,000 $46,204,000 $47,115,000 $47,534,000
12.0%
Normal Cost 11.6% 11.6% 11.6% 11.7%
UAL Contribution $43,316,000 $43,708,000 $41,934,000 $38,557,000
These projections reflect changes to the amortization policy effective with the June 30, 2019 valuation as well as the impact of the CalPERS risk mitigation policy (which reduces the discount rate when investment returns exceed specified trigger points). The projected normal cost percentages reflect that normal cost is anticipated to decline over time as new employees are hired into PEPRA or other lower-cost benefit tiers.
CalPERS Actuarial Valuation - June 30, 2020 Miscellaneous Plan of the City of Anaheim CalPERS ID: 6207170049
Page 26
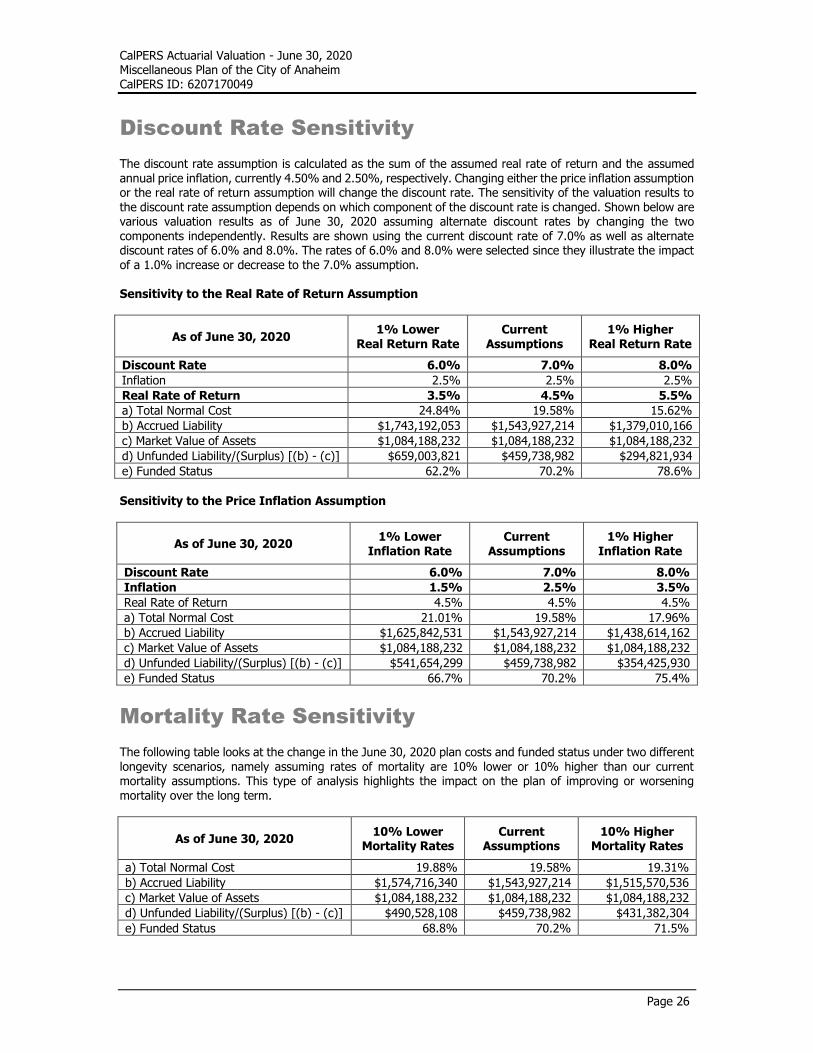
Discount Rate Sensitivity
The discount rate assumption is calculated as the sum of the assumed real rate of return and the assumed annual price inflation, currently 4.50% and 2.50%, respectively. Changing either the price inflation assumption or the real rate of return assumption will change the discount rate. The sensitivity of the valuation results to the discount rate assumption depends on which component of the discount rate is changed. Shown below are various valuation results as of June 30, 2020 assuming alternate discount rates by changing the two components independently. Results are shown using the current discount rate of 7.0% as well as alternate discount rates of 6.0% and 8.0%. The rates of 6.0% and 8.0% were selected since they illustrate the impact of a 1.0% increase or decrease to the 7.0% assumption. Sensitivity to the Real Rate of Return Assumption
As of June 30, 2020 1% Lower
Real Return Rate
Current
Assumptions
1% Higher
Real Return Rate
Discount Rate 6.0% 7.0% 8.0%
Inflation 2.5% 2.5% 2.5%
Real Rate of Return 3.5% 4.5% 5.5%
a) Total Normal Cost 24.84% 19.58% 15.62%
b) Accrued Liability $1,743,192,053 $1,543,927,214 $1,379,010,166
c) Market Value of Assets $1,084,188,232 $1,084,188,232 $1,084,188,232
d) Unfunded Liability/(Surplus) [(b) - (c)] $659,003,821 $459,738,982 $294,821,934
e) Funded Status 62.2% 70.2% 78.6%
Sensitivity to the Price Inflation Assumption
As of June 30, 2020 1% Lower
Inflation Rate Current
Assumptions 1% Higher
Inflation Rate
Discount Rate 6.0% 7.0% 8.0%
Inflation 1.5% 2.5% 3.5%
Real Rate of Return 4.5% 4.5% 4.5%
a) Total Normal Cost 21.01% 19.58% 17.96%
b) Accrued Liability $1,625,842,531 $1,543,927,214 $1,438,614,162
c) Market Value of Assets $1,084,188,232 $1,084,188,232 $1,084,188,232
d) Unfunded Liability/(Surplus) [(b) - (c)] $541,654,299 $459,738,982 $354,425,930
e) Funded Status 66.7% 70.2% 75.4%
Mortality Rate Sensitivity
The following table looks at the change in the June 30, 2020 plan costs and funded status under two different longevity scenarios, namely assuming rates of mortality are 10% lower or 10% higher than our current mortality assumptions. This type of analysis highlights the impact on the plan of improving or worsening mortality over the long term.
As of June 30, 2020 10% Lower
Mortality Rates Current
Assumptions 10% Higher
Mortality Rates
a) Total Normal Cost 19.88% 19.58% 19.31%
b) Accrued Liability $1,574,716,340 $1,543,927,214 $1,515,570,536
c) Market Value of Assets $1,084,188,232 $1,084,188,232 $1,084,188,232
d) Unfunded Liability/(Surplus) [(b) - (c)] $490,528,108 $459,738,982 $431,382,304
e) Funded Status 68.8% 70.2% 71.5%

CalPERS Actuarial Valuation - June 30, 2020 Miscellaneous Plan of the City of Anaheim CalPERS ID: 6207170049
Page 27
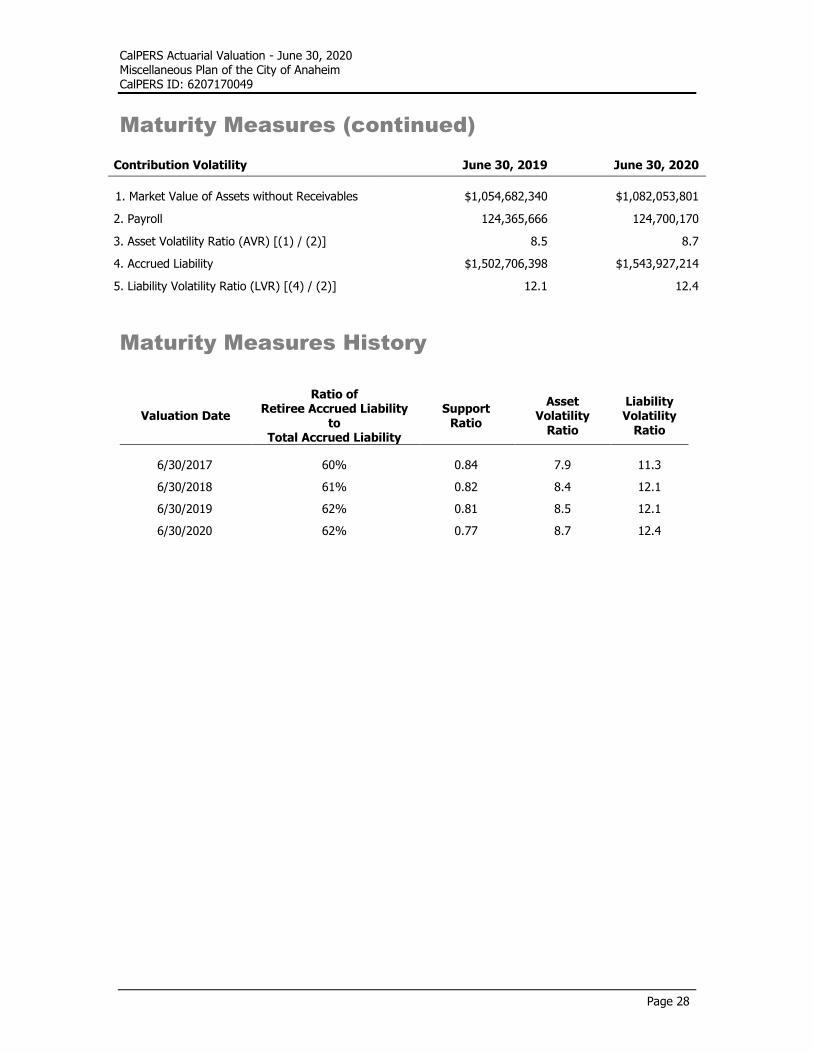
Maturity Measures
As pension plans mature they become more sensitive to risks. Understanding plan maturity and how it affects the ability of a pension plan sponsor to tolerate risk is important in understanding how the plan is impacted by investment return volatility, other economic variables and changes in longevity or other demographic assumptions. One way to look at the maturity level of CalPERS and its plans is to look at the ratio of a plan’s retiree liability to its total liability. A pension plan in its infancy will have a very low ratio of retiree liability to total liability. As the plan matures, the ratio increases. A mature plan will often have a ratio above 60%-65%. Ratio of Retiree Accrued Liability to Total Accrued Liability
June 30, 2019 June 30, 2020
1. Retiree Accrued Liability 932,711,952 964,098,630
2. Total Accrued Liability 1,502,706,398 1,543,927,214
3. Ratio of Retiree AL to Total AL [(1) / (2)] 62% 62%
Another measure of the maturity level of CalPERS and its plans is the ratio of actives to retirees, also called Support Ratio. A pension plan in its infancy will have a very high ratio of active to retired members. As the plan matures, and members retire, the ratio declines. A mature plan will often have a ratio near or below one. The average support ratio for CalPERS public agency plans is 1.25.
Support Ratio June 30, 2019 June 30, 2020
1. Number of Actives 1,772 1,716
2. Number of Retirees 2,191 2,229
3. Support Ratio [(1) / (2)] 0.81 0.77
The actuarial calculations supplied in this communication are based on various assumptions about long-term demographic and economic behavior. Unless these assumptions (e.g., terminations, deaths, disabilities, retirements, salary growth, investment return) are exactly realized each year, there will be differences on a year-to-year basis. The year-to-year differences between actual experience and the assumptions are called actuarial gains and losses and serve to lower or raise required employer contributions from one year to the next. Therefore, employer contributions will inevitably fluctuate, especially due to the ups and downs of investment returns. Asset Volatility Ratio Shown in the table below is the asset volatility ratio (AVR), which is the ratio of market value of assets to payroll. Plans that have a higher AVR experience more volatile employer contributions (as a percentage of payroll) due to investment return. For example, a plan with AVR of 8 may experience twice the contribution volatility due to investment return volatility than a plan with AVR of 4. It should be noted that this ratio is a measure of the current situation. It increases over time but generally tends to stabilize as a plan matures.
Liability Volatility Ratio Also shown in the table below is the liability volatility ratio (LVR), which is the ratio of accrued liability to payroll. Plans that have a higher LVR experience more volatile employer contributions (as a percentage of payroll) due to changes in liability. For example, a plan with LVR of 8 is expected to have twice the contribution volatility of a plan with LVR of 4 when there is a change in accrued liability, such as when there is a change in actuarial assumptions. It should be noted that this ratio indicates a longer-term potential for contribution volatility, since the AVR, described above, will tend to move closer to the LVR as the funded status approaches 100%.
CalPERS Actuarial Valuation - June 30, 2020 Miscellaneous Plan of the City of Anaheim CalPERS ID: 6207170049
Page 28
Maturity Measures (continued)
Contribution Volatility June 30, 2019 June 30, 2020
1. Market Value of Assets without Receivables $1,054,682,340 $1,082,053,801
2. Payroll 124,365,666 124,700,170
3. Asset Volatility Ratio (AVR) [(1) / (2)] 8.5 8.7
4. Accrued Liability $1,502,706,398 $1,543,927,214
5. Liability Volatility Ratio (LVR) [(4) / (2)] 12.1 12.4
Maturity Measures History
Valuation Date
Ratio of Retiree Accrued Liability
to Total Accrued Liability
Support Ratio
Asset Volatility
Ratio
Liability Volatility
Ratio
6/30/2017
60%
0.84
7.9
11.3
6/30/2018
61%
0.82
8.4
12.1
6/30/2019
62%
0.81
8.5
12.1
6/30/2020
62%
0.77
8.7
12.4
CalPERS Actuarial Valuation - June 30, 2020 Miscellaneous Plan of the City of Anaheim CalPERS ID: 6207170049
Page 29
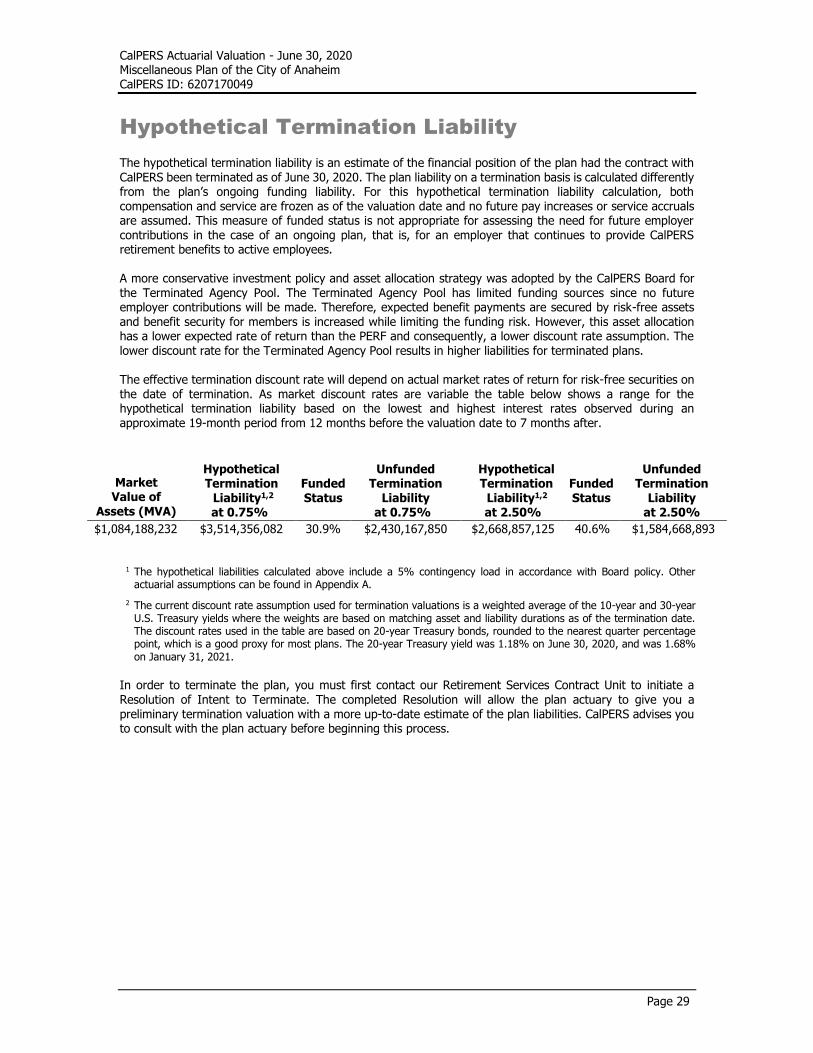
Hypothetical Termination Liability The hypothetical termination liability is an estimate of the financial position of the plan had the contract with CalPERS been terminated as of June 30, 2020. The plan liability on a termination basis is calculated differently from the plan’s ongoing funding liability. For this hypothetical termination liability calculation, both compensation and service are frozen as of the valuation date and no future pay increases or service accruals are assumed. This measure of funded status is not appropriate for assessing the need for future employer contributions in the case of an ongoing plan, that is, for an employer that continues to provide CalPERS retirement benefits to active employees. A more conservative investment policy and asset allocation strategy was adopted by the CalPERS Board for the Terminated Agency Pool. The Terminated Agency Pool has limited funding sources since no future employer contributions will be made. Therefore, expected benefit payments are secured by risk-free assets and benefit security for members is increased while limiting the funding risk. However, this asset allocation has a lower expected rate of return than the PERF and consequently, a lower discount rate assumption. The lower discount rate for the Terminated Agency Pool results in higher liabilities for terminated plans. The effective termination discount rate will depend on actual market rates of return for risk-free securities on the date of termination. As market discount rates are variable the table below shows a range for the hypothetical termination liability based on the lowest and highest interest rates observed during an approximate 19-month period from 12 months before the valuation date to 7 months after.
[
Market Value of
Assets (MVA)
Hypothetical Termination Liability1,2
at 0.75%
Funded Status
Unfunded Termination
Liability at 0.75%
Hypothetical Termination
Liability1,2 at 2.50%
Funded Status
Unfunded Termination
Liability at 2.50%
$1,084,188,232 $3,514,356,082 30.9% $2,430,167,850 $2,668,857,125 40.6% $1,584,668,893
1 The hypothetical liabilities calculated above include a 5% contingency load in accordance with Board policy. Other
actuarial assumptions can be found in Appendix A.
2 The current discount rate assumption used for termination valuations is a weighted average of the 10-year and 30-year U.S. Treasury yields where the weights are based on matching asset and liability durations as of the termination date. The discount rates used in the table are based on 20-year Treasury bonds, rounded to the nearest quarter percentage point, which is a good proxy for most plans. The 20-year Treasury yield was 1.18% on June 30, 2020, and was 1.68% on January 31, 2021.
In order to terminate the plan, you must first contact our Retirement Services Contract Unit to initiate a Resolution of Intent to Terminate. The completed Resolution will allow the plan actuary to give you a preliminary termination valuation with a more up-to-date estimate of the plan liabilities. CalPERS advises you to consult with the plan actuary before beginning this process.

Plan’s Major Benefit Provisions

CalPERS Actuarial Valuation - June 30, 2020 Miscellaneous Plan of the City of Anaheim CalPERS ID: 6207170049
Page 31
Plan’s Major Benefit Options Shown below is a summary of the major optional benefits for which your agency has contracted. A description of principal standard and optional plan provisions is in Appendix B.
Benefit Group
Member Category Misc Misc Misc Misc Misc
Demographics Actives No Yes Yes No No Transfers/Separated Yes Yes Yes No No Receiving Yes Yes Yes Yes Yes Benefit Group Key 105265 105267 111217 201765 201766 Benefit Provision Benefit Formula 2% @ 55 2.7% @ 55 2% @ 62
Social Security Coverage No No No Full/Modified Full Full Full
Employee Contribution Rate 8.00% 7.50% Final Average Compensation Period One Year One Year Three Year Sick Leave Credit Yes Yes Yes
Non-Industrial Disability Standard Standard Standard Industrial Disability No No No Pre-Retirement Death Benefits
Optional Settlement 2 Yes Yes Yes 1959 Survivor Benefit Level Level 4 Level 4 Level 4 Special No No No Alternate (firefighters) No No No
Post-Retirement Death Benefits
Lump Sum $5000 $5000 $5000 $5000 $5000 Survivor Allowance (PRSA) Yes Yes Yes Yes Yes
COLA 2% 2% 2% 2% 2%
Appendices
• Appendix A – Actuarial Methods and Assumptions
• Appendix B – Principal Plan Provisions
• Appendix C – Participant Data
• Appendix D – Glossary of Actuarial Terms

Appendix A
Actuarial Methods and Assumptions
• Actuarial Data
• Actuarial Methods
• Actuarial Assumptions
• Miscellaneous

CalPERS Actuarial Valuation – June 30, 2020 Appendix A Actuarial Methods and Assumptions
A-1
Actuarial Data As stated in the Actuarial Certification, the data which serves as the basis of this valuation has been obtained from the various CalPERS databases. We have reviewed the valuation data and believe that it is reasonable and appropriate in aggregate. We are unaware of any potential data issues that would have a material effect on the results of this valuation, except that data does not always contain the latest salary information for former members now in reciprocal systems and does not recognize the potential for unusually large salary deviation in certain cases such as elected officials. Therefore, salary information in these cases may not be accurate. These situations are relatively infrequent, however, and generally do not have a material impact on the required employer contributions.
Actuarial Methods Actuarial Cost Method
The actuarial cost method used is the Entry Age Actuarial Cost Method. Under this method, projected benefits are determined for all members and the associated liabilities are spread in a manner that produces level annual cost as a percentage of pay in each year from the member’s entry age to their assumed retirement age on the valuation date. The cost allocated to the current fiscal year is called the normal cost. The actuarial accrued liability for active members is then calculated as the portion of the total cost of the plan allocated to prior years. The actuarial accrued liability for members currently receiving benefits and for members entitled to deferred benefits is equal to the present value of the benefits expected to be paid. No normal costs are applicable for these participants. CalPERS uses an in-house proprietary actuarial model for calculating pension plan costs. We believe this model is fit for its intended purpose and meets all applicable Actuarial Standards of Practice. Furthermore, the actuarial results of our model are independently confirmed periodically by outside auditing actuaries. The actuarial assumptions used are internally consistent and the generated results reasonable. A further
refinement to the actuarial model will be the introduction of generational mortality in the June 30, 2021 actuarial valuation. Amortization of Unfunded Actuarial Accrued Liability The excess of the total actuarial accrued liability over the market value of plan assets is called the unfunded actuarial accrued liability (UAL). Funding requirements are determined by adding the normal cost and a payment toward the UAL. The UAL payment is equal to the sum of individual amortization payments, each representing a different source of UAL for a given measurement period. Amortization payments are determined according to the CalPERS amortization policy. The CalPERS Board adopted a new policy effective for the June 30, 2019 actuarial valuation. The new policy applies prospectively only; amortization bases (sources of UAL) established prior to the June 30, 2019 valuation will continue to be amortized according to the prior policy.
Prior Policy (Bases Established prior to June 30, 2019) Amortization payments are determined as a level percentage of payroll whereby the payment increases each year at an escalation rate. Gains or losses are amortized over a fixed 30-year period with a 5-year ramp up at the beginning and a 5-year ramp down at the end of the amortization period. All changes in liability due to plan amendments (other than golden handshakes) are amortized over a 20-year period with no ramp. Changes in actuarial assumptions or changes in actuarial methodology are amortized over a 20-year period with a 5-year ramp up at the beginning and a 5-year ramp down at the end of the amortization period. Changes in unfunded accrued liability due to a Golden Handshake will be amortized over a period of five years. Bases established prior to June 30, 2013 may be amortized differently. A summary is provided in the following table:

CalPERS Actuarial Valuation – June 30, 2020 Appendix A Actuarial Methods and Assumptions
A-2
Driver
Source
(Gain)/Loss
Assumption/Method Change
Benefit Change
Golden Handshake Investment
Non-investment
Amortization Period 30 Years 30 Years 20 Years 20 Years 5 Years
Escalation Rate - Active Plans - Inactive Plans
2.75%
0%
2.75%
0%
2.75%
0%
2.75%
0%
2.75%
0%
Ramp Up 5 5 5 0 0
Ramp Down 5 5 5 0 0
The 5-year ramp up means that the payments in the first four years of the amortization period are 20%, 40%, 60% and 80% of the “full” payment which begins in year five. The 5-year ramp down means that the reverse is true in the final four years of the amortization period. Current Policy (Bases Established on or after June 30, 2019) Amortization payments are determined as a level dollar amount. Investment gains or losses are amortized over a fixed 20-year period with a 5-year ramp up at the beginning of the amortization period. Non-investment gains or losses are amortized over a fixed 20-year period with no ramps. All changes in liability due to plan amendments (other than golden handshakes) are amortized over a 20-year period with no ramps. Changes in actuarial assumptions or changes in actuarial methodology are amortized over a 20-year period with no ramps. Changes in unfunded accrued liability due to a Golden Handshake are amortized over a period of five years. A summary is provided in the table below:
Source
(Gain)/Loss Assumption/
Method Change
Benefit Change
Golden Handshake Investment
Non-investment
Amortization Period 20 Years 20 Years 20 Years 20 Years 5 Years
Escalation Rate 0% 0% 0% 0% 0%
Ramp Up 5 0 0 0 0
Ramp Down 0 0 0 0 0
Exceptions for Inconsistencies An exception to the amortization rules above is used whenever their application results in inconsistencies. In these cases, a “fresh start” approach is used. This means that the current unfunded actuarial liability is projected and amortized over a set number of years. For example, a fresh start is needed in the following situations:
• When a negative payment would be required on a positive unfunded actuarial liability; or • When the payment would completely amortize the total unfunded liability in a very short time period,
and results in a large change in the employer contribution requirement. It should be noted that the actuary may determine that a fresh start is necessary under other circumstances. In all cases of a fresh start, the period is set by the actuary at what is deemed appropriate; however, the period will not be greater than 20 years.

CalPERS Actuarial Valuation – June 30, 2020 Appendix A Actuarial Methods and Assumptions
A-3
Exceptions for Plans in Surplus If a surplus exists (i.e. the Market Value of Assets exceeds the plan’s accrued liability) any prior amortization layers shall be considered fully amortized, and the surplus shall not be amortized. In the event of any subsequent unfunded liability, a Fresh Start shall be used with an amortization period of 20 years or less. Exceptions for Small Amounts Where small unfunded liabilities are identified in annual valuations which result in small payment amounts, the actuary may shorten the remaining period for these bases.
• When the balance of a single amortization base has an absolute value less than $250, the amortization period is reduced to one year.
• When the entire unfunded liability is a small amount the actuary may perform a Fresh Start and
use an appropriate amortization period. Exceptions for Inactive Plans The following exceptions apply to plans classified as Inactive. These plans have no active members and no expectation to have active members in the future.
• Amortization of the unfunded liability is on a “level dollar” basis rather than a “level percent of pay” basis. For amortization layers, which utilize a ramp up and ramp down, the “ultimate” payment is constant.
• Actuarial judgment will be used to shorten amortization periods for Inactive plans with existing periods that are deemed too long given the duration of the liability. The specific demographics of the plan will be used to determine if shorter periods may be more appropriate.
Exceptions for Inactive Agencies For a public agency with no active members in any CalPERS rate plan, the unfunded liability shall be amortized over a closed amortization period of no more than 15 years.
Asset Valuation Method The Actuarial Value of Assets is set equal to the market value of assets. Asset values include accounts receivable.
PEPRA Normal Cost Rate Methodology Per Government Code Section 7522.30(b), the “normal cost rate” shall mean the annual actuarially determined normal cost for the plan of retirement benefits provided to the new member and shall be established based on actuarial assumptions used to determine the liabilities and costs as part of the annual actuarial valuation. The plan of retirement benefits shall include any elements that would impact the actuarial determination of the normal cost, including, but not limited to, the retirement formula, eligibility and vesting criteria, ancillary benefit provisions, and any automatic cost-of-living adjustments as determined by the public retirement system. For purposes of setting member rates, it is preferable to determine total normal cost using a large active population so that the rate remains relatively stable. While each CalPERS non-pooled plan has a sufficiently large active population for this purpose, the PEPRA active population by itself may not be sufficiently large. The total PEPRA normal cost will be determined based on the plan’s PEPRA membership only if the number of members covered under the PEPRA formula meets either:
1. 50% of the active population, or 2. 25% of the active population and 100 or more PEPRA members
Until one of these conditions is met, the plan’s total PEPRA normal cost will be determined using the entire active plan population (both PEPRA and Classic) based on the PEPRA benefit provisions.

CalPERS Actuarial Valuation – June 30, 2020 Appendix A Actuarial Methods and Assumptions
A-4
Actuarial Assumptions In 2017, CalPERS completed its most recent asset liability management study incorporating actuarial assumptions and strategic asset allocation. In December 2017, the CalPERS Board of Administration adopted relatively modest changes to the asset allocation that reduced the expected volatility of returns. The adopted asset allocation was expected to have a long-term blended return that continued to support a discount rate assumption of 7.00%. The Board also approved several changes to the demographic assumptions that more closely aligned with actual experience. On December 21, 2016, the CalPERS Board of Administration lowered the discount rate from 7.50% to 7.00% using a three-year phase-in beginning with the June 30, 2016 actuarial valuations. The minimum employer contributions for fiscal year 2022-23 determined in this valuation were calculated using a discount rate of 7.00%. The decision to reduce the discount rate was primarily based on reduced capital market assumptions provided by external investment consultants and CalPERS investment staff. The specific decision adopted by the Board reflected recommendations from CalPERS staff and additional input from employer and employee
stakeholder groups. Based on the investment allocation adopted by the Board and capital market assumptions, the reduced discount rate schedule provides a more realistic assumption for the long-term investment return of the fund. Notwithstanding the Board’s decision to phase into a 7.00% discount rate, subsequent analysis of the expected investment return of CalPERS assets or changes to the investment allocation may result in a change to this discount rate schedule. For more details and additional rationale for the selection of the actuarial assumptions, please refer to the CalPERS Experience Study and Review of Actuarial Assumptions report from December 2017 that can be found on the CalPERS website under: “Forms and Publications”. Click on “View All” and search for Experience Study. All actuarial assumptions (except the discount rates used for the hypothetical termination liability) represent an estimate of future experience rather than observations of the estimates inherent in market data.
Economic Assumptions
Discount Rate The prescribed discount rate assumption, adopted by the Board on December 21, 2016, is 7.00% compounded annually (net of investment and administrative expenses) as of June 30, 2020.
Termination Liability Discount Rate
The current discount rate assumption used for termination valuations is a weighted average of the 10-year and 30-year U.S. Treasury yields where the weights are based on matching asset and liability durations as of the termination date. The hypothetical termination liabilities in this report are calculated using an observed range of market interest rates. This range is based on the lowest and highest 20-year Treasury bond observed during an approximate 19-month period from 12 months before the valuation date to 7 months after. The 20-year Treasury bond has a similar duration to most plan liabilities and serves as a good proxy for
the termination discount rate. The 20-year Treasury yield was 1.18% on June 30, 2020.
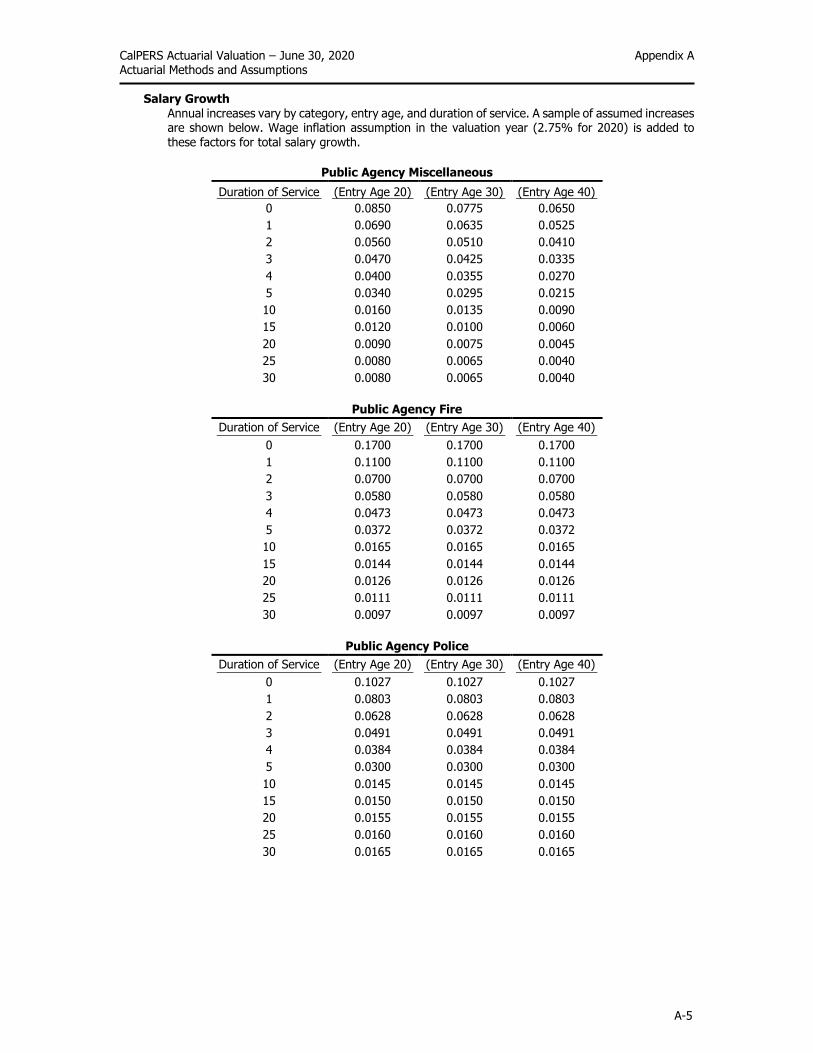
CalPERS Actuarial Valuation – June 30, 2020 Appendix A Actuarial Methods and Assumptions
A-5
Salary Growth
Annual increases vary by category, entry age, and duration of service. A sample of assumed increases are shown below. Wage inflation assumption in the valuation year (2.75% for 2020) is added to these factors for total salary growth.
Public Agency Miscellaneous
Duration of Service (Entry Age 20) (Entry Age 30) (Entry Age 40)
0 0.0850 0.0775 0.0650
1 0.0690 0.0635 0.0525
2 0.0560 0.0510 0.0410
3 0.0470 0.0425 0.0335
4 0.0400 0.0355 0.0270
5 0.0340 0.0295 0.0215
10 0.0160 0.0135 0.0090
15 0.0120 0.0100 0.0060
20 0.0090 0.0075 0.0045
25 0.0080 0.0065 0.0040
30 0.0080 0.0065 0.0040
Public Agency Fire
Duration of Service (Entry Age 20) (Entry Age 30) (Entry Age 40)
0 0.1700 0.1700 0.1700
1 0.1100 0.1100 0.1100
2 0.0700 0.0700 0.0700
3 0.0580 0.0580 0.0580
4 0.0473 0.0473 0.0473
5 0.0372 0.0372 0.0372
10 0.0165 0.0165 0.0165
15 0.0144 0.0144 0.0144
20 0.0126 0.0126 0.0126
25 0.0111 0.0111 0.0111
30 0.0097 0.0097 0.0097
Public Agency Police
Duration of Service (Entry Age 20) (Entry Age 30) (Entry Age 40)
0 0.1027 0.1027 0.1027
1 0.0803 0.0803 0.0803
2 0.0628 0.0628 0.0628
3 0.0491 0.0491 0.0491
4 0.0384 0.0384 0.0384
5 0.0300 0.0300 0.0300
10 0.0145 0.0145 0.0145
15 0.0150 0.0150 0.0150
20 0.0155 0.0155 0.0155
25 0.0160 0.0160 0.0160
30 0.0165 0.0165 0.0165

CalPERS Actuarial Valuation – June 30, 2020 Appendix A Actuarial Methods and Assumptions
A-6
Salary Growth (continued)
Public Agency County Peace Officers
Duration of Service (Entry Age 20) (Entry Age 30) (Entry Age 40)
0 0.1320 0.1320 0.1320
1 0.0960 0.0960 0.0960
2 0.0657 0.0657 0.0657
3 0.0525 0.0525 0.0525
4 0.0419 0.0419 0.0419
5 0.0335 0.0335 0.0335
10 0.0170 0.0170 0.0170
15 0.0150 0.0150 0.0150
20 0.0150 0.0150 0.0150
25 0.0175 0.0175 0.0175
30 0.0200 0.0200 0.0200
Schools
Duration of Service (Entry Age 20) (Entry Age 30) (Entry Age 40)
0 0.0428 0.0419 0.0380
1 0.0428 0.0419 0.0380
2 0.0428 0.0419 0.0380
3 0.0354 0.0332 0.0280
4 0.0305 0.0279 0.0224
5 0.0262 0.0234 0.0180
10 0.0171 0.0154 0.0112
15 0.0152 0.0134 0.0098
20 0.0135 0.0117 0.0086
25 0.0120 0.0103 0.0076
30 0.0087 0.0071 0.0048
• The Miscellaneous salary scale is used for Local Prosecutors. • The Police salary scale is used for Other Safety, Local Sheriff, and School Police.
Overall Payroll Growth
2.75% compounded annually (used in projecting the payroll over which the unfunded liability is amortized). This assumption is used for all plans with active members.
Inflation 2.50% compounded annually.
Non-valued Potential Additional Liabilities The potential liability loss for a cost-of-living increase exceeding the 2.50% inflation assumption and any potential liability loss from future member service purchases are not reflected in the valuation.
Miscellaneous Loading Factors
Credit for Unused Sick Leave Total years of service is increased by 1% for those plans that have adopted the provision of providing Credit for Unused Sick Leave.

CalPERS Actuarial Valuation – June 30, 2020 Appendix A Actuarial Methods and Assumptions
A-7
Conversion of Employer Paid Member Contributions (EPMC)
Total years of service is increased by the Employee Contribution Rate for those plans with the provision providing for the Conversion of Employer Paid Member Contributions (EPMC) during the final compensation period.
Norris Decision (Best Factors)
Employees hired prior to July 1, 1982 have projected benefit amounts increased in order to reflect the use of “Best Factors” in the calculation of optional benefit forms. This is due to a 1983 Supreme Court decision, known as the Norris decision, which required males and females to be treated equally in the determination of benefit amounts. Consequently, anyone already employed at that time is given the best possible conversion factor when optional benefits are determined. No loading is necessary for employees hired after July 1, 1982.
Termination Liability The termination liabilities include a 5% contingency load. This load is for unforeseen negative experience.
Demographic Assumptions
Pre-Retirement Mortality Non-industrial death rates vary by age and gender. Industrial death rates vary by age. See sample rates in table below. The non-industrial death rates are used for all plans. The industrial death rates are used for safety plans (except for Local Prosecutor safety members where the corresponding miscellaneous plan does not have the Industrial Death Benefit).
Non-Industrial Death Industrial Death (Not Job-Related) (Job-Related)
Age Male Female Male and Female
20 0.00022 0.00007 0.00004 25 0.00029 0.00011 0.00006 30 0.00038 0.00015 0.00007
35 0.00049 0.00027 0.00009 40 0.00064 0.00037 0.00010 45 0.00080 0.00054 0.00012 50 0.00116 0.00079 0.00013 55 0.00172 0.00120 0.00015 60 0.00255 0.00166 0.00016 65 0.00363 0.00233 0.00018 70 0.00623 0.00388 0.00019 75 0.01057 0.00623 0.00021 80 0.01659 0.00939 0.00022
Miscellaneous plans usually have industrial death rates set to zero unless the agency has specifically contracted for industrial death benefits. If so, each non-industrial death rate shown above will be split into two components; 99% will become the non-industrial death rate and 1% will become the industrial death rate.
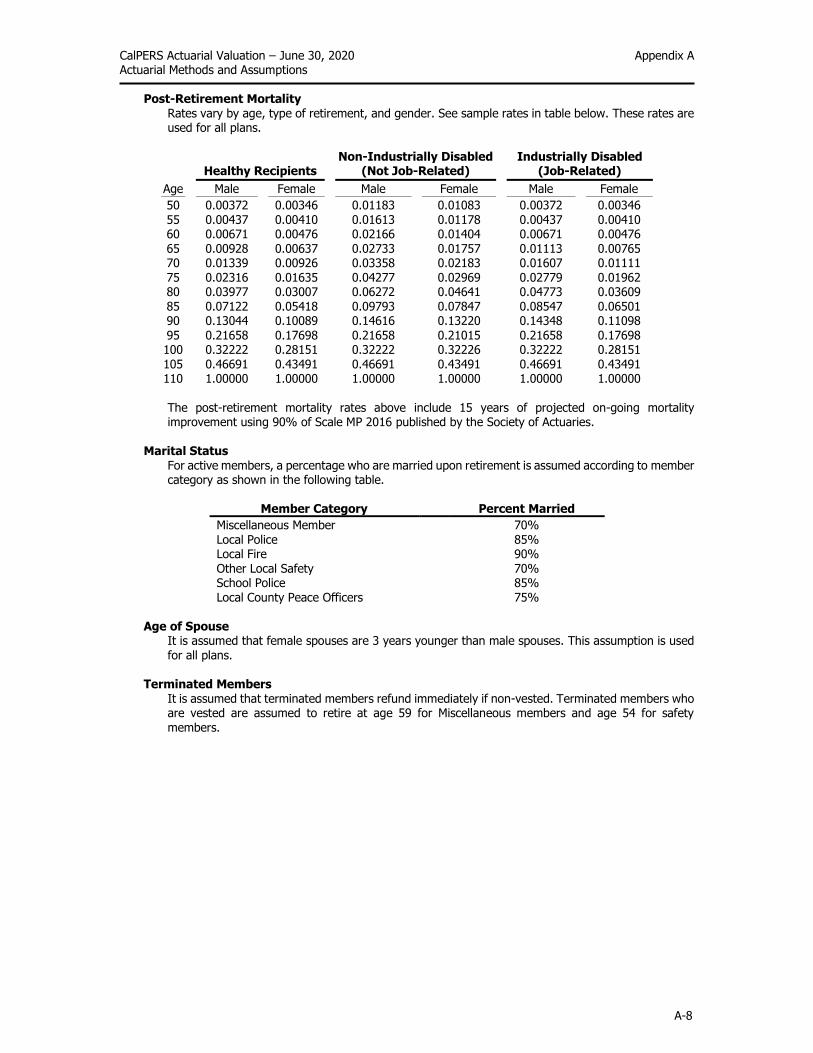
CalPERS Actuarial Valuation – June 30, 2020 Appendix A Actuarial Methods and Assumptions
A-8
Post-Retirement Mortality
Rates vary by age, type of retirement, and gender. See sample rates in table below. These rates are used for all plans.
Healthy Recipients Non-Industrially Disabled Industrially Disabled
(Not Job-Related) (Job-Related)
Age Male Female Male Female Male Female
50 0.00372 0.00346 0.01183 0.01083 0.00372 0.00346 55 0.00437 0.00410 0.01613 0.01178 0.00437 0.00410 60 0.00671 0.00476 0.02166 0.01404 0.00671 0.00476 65 0.00928 0.00637 0.02733 0.01757 0.01113 0.00765 70 0.01339 0.00926 0.03358 0.02183 0.01607 0.01111 75 0.02316 0.01635 0.04277 0.02969 0.02779 0.01962 80 0.03977 0.03007 0.06272 0.04641 0.04773 0.03609 85 0.07122 0.05418 0.09793 0.07847 0.08547 0.06501 90 0.13044 0.10089 0.14616 0.13220 0.14348 0.11098
95 0.21658 0.17698 0.21658 0.21015 0.21658 0.17698 100 0.32222 0.28151 0.32222 0.32226 0.32222 0.28151 105 0.46691 0.43491 0.46691 0.43491 0.46691 0.43491 110 1.00000 1.00000 1.00000 1.00000 1.00000 1.00000
The post-retirement mortality rates above include 15 years of projected on-going mortality improvement using 90% of Scale MP 2016 published by the Society of Actuaries.
Marital Status
For active members, a percentage who are married upon retirement is assumed according to member category as shown in the following table.
Member Category Percent Married
Miscellaneous Member 70% Local Police 85% Local Fire 90% Other Local Safety 70% School Police 85% Local County Peace Officers 75%
Age of Spouse
It is assumed that female spouses are 3 years younger than male spouses. This assumption is used for all plans.
Terminated Members It is assumed that terminated members refund immediately if non-vested. Terminated members who are vested are assumed to retire at age 59 for Miscellaneous members and age 54 for safety members.
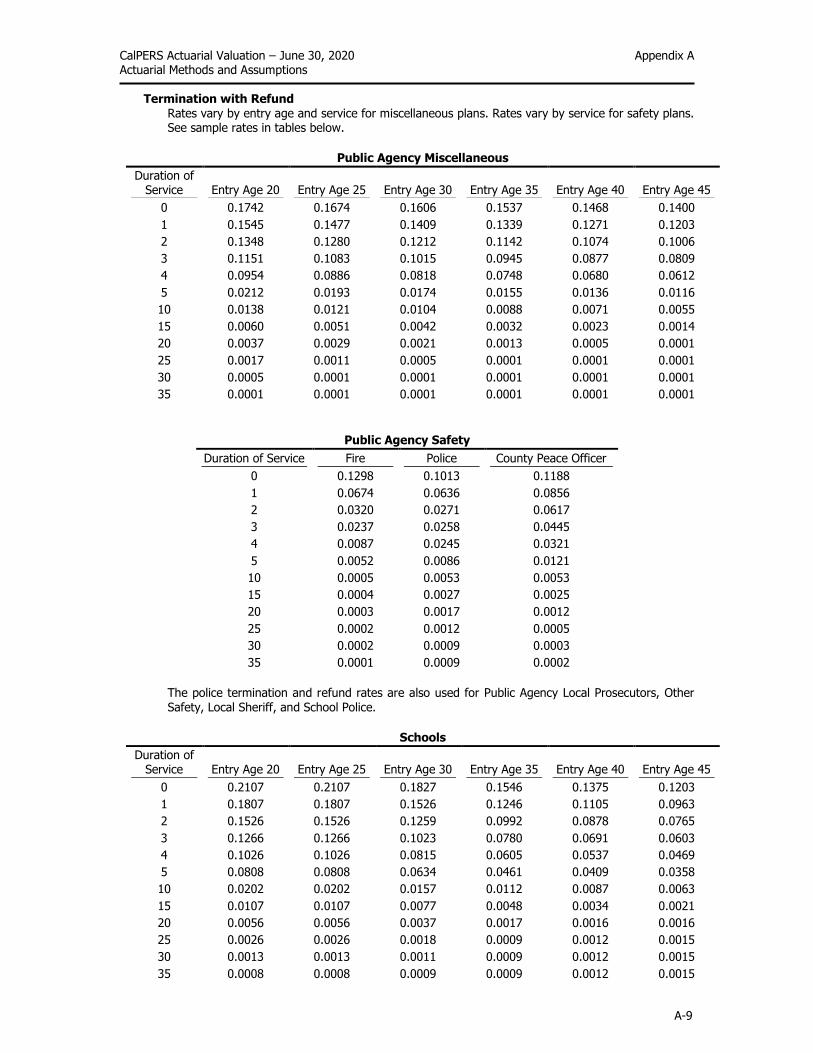
CalPERS Actuarial Valuation – June 30, 2020 Appendix A Actuarial Methods and Assumptions
A-9
Termination with Refund
Rates vary by entry age and service for miscellaneous plans. Rates vary by service for safety plans. See sample rates in tables below.
Public Agency Miscellaneous
Duration of Service Entry Age 20 Entry Age 25 Entry Age 30 Entry Age 35 Entry Age 40 Entry Age 45
0 0.1742 0.1674 0.1606 0.1537 0.1468 0.1400
1 0.1545 0.1477 0.1409 0.1339 0.1271 0.1203
2 0.1348 0.1280 0.1212 0.1142 0.1074 0.1006
3 0.1151 0.1083 0.1015 0.0945 0.0877 0.0809
4 0.0954 0.0886 0.0818 0.0748 0.0680 0.0612
5 0.0212 0.0193 0.0174 0.0155 0.0136 0.0116
10 0.0138 0.0121 0.0104 0.0088 0.0071 0.0055
15 0.0060 0.0051 0.0042 0.0032 0.0023 0.0014
20 0.0037 0.0029 0.0021 0.0013 0.0005 0.0001
25 0.0017 0.0011 0.0005 0.0001 0.0001 0.0001
30 0.0005 0.0001 0.0001 0.0001 0.0001 0.0001
35 0.0001 0.0001 0.0001 0.0001 0.0001 0.0001
Public Agency Safety
Duration of Service Fire Police County Peace Officer
0 0.1298 0.1013 0.1188
1 0.0674 0.0636 0.0856
2 0.0320 0.0271 0.0617
3 0.0237 0.0258 0.0445
4 0.0087 0.0245 0.0321
5 0.0052 0.0086 0.0121
10 0.0005 0.0053 0.0053
15 0.0004 0.0027 0.0025
20 0.0003 0.0017 0.0012
25 0.0002 0.0012 0.0005
30 0.0002 0.0009 0.0003
35 0.0001 0.0009 0.0002
The police termination and refund rates are also used for Public Agency Local Prosecutors, Other Safety, Local Sheriff, and School Police.
Schools
Duration of Service Entry Age 20 Entry Age 25 Entry Age 30 Entry Age 35 Entry Age 40 Entry Age 45
0 0.2107 0.2107 0.1827 0.1546 0.1375 0.1203
1 0.1807 0.1807 0.1526 0.1246 0.1105 0.0963
2 0.1526 0.1526 0.1259 0.0992 0.0878 0.0765
3 0.1266 0.1266 0.1023 0.0780 0.0691 0.0603
4 0.1026 0.1026 0.0815 0.0605 0.0537 0.0469
5 0.0808 0.0808 0.0634 0.0461 0.0409 0.0358
10 0.0202 0.0202 0.0157 0.0112 0.0087 0.0063
15 0.0107 0.0107 0.0077 0.0048 0.0034 0.0021
20 0.0056 0.0056 0.0037 0.0017 0.0016 0.0016
25 0.0026 0.0026 0.0018 0.0009 0.0012 0.0015
30 0.0013 0.0013 0.0011 0.0009 0.0012 0.0015
35 0.0008 0.0008 0.0009 0.0009 0.0012 0.0015
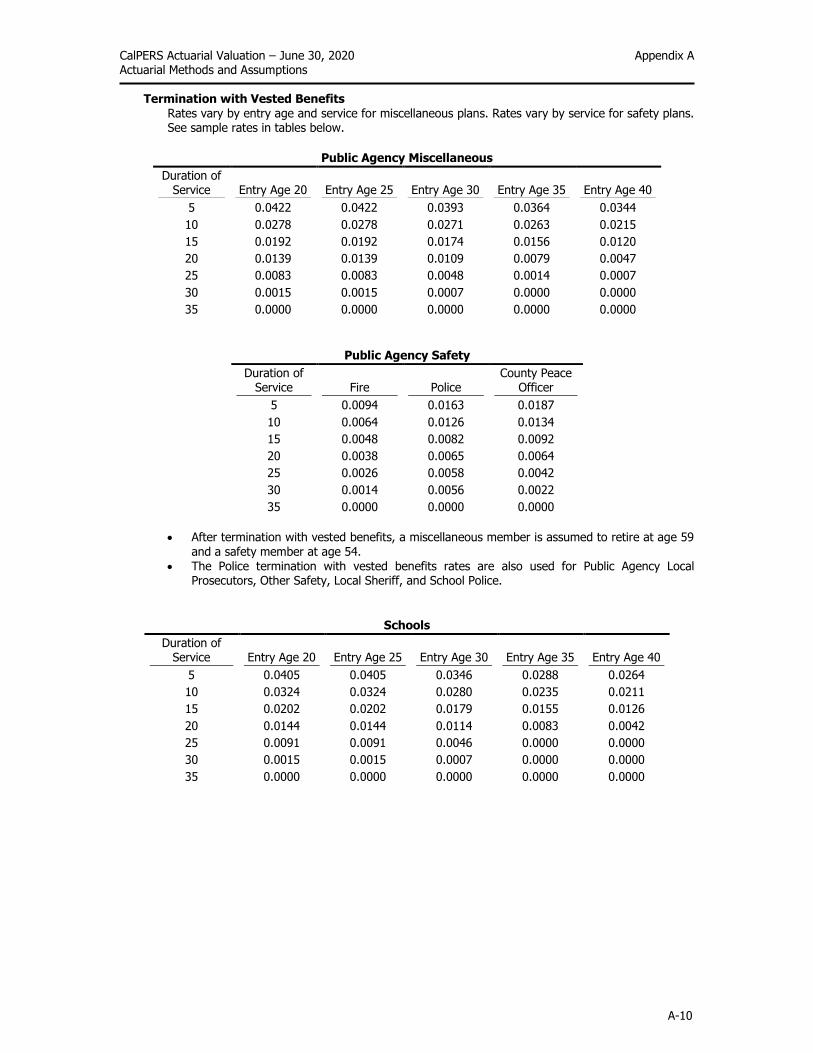
CalPERS Actuarial Valuation – June 30, 2020 Appendix A Actuarial Methods and Assumptions
A-10
Termination with Vested Benefits
Rates vary by entry age and service for miscellaneous plans. Rates vary by service for safety plans. See sample rates in tables below.
Public Agency Miscellaneous
Duration of Service Entry Age 20 Entry Age 25 Entry Age 30 Entry Age 35 Entry Age 40
5 0.0422 0.0422 0.0393 0.0364 0.0344
10 0.0278 0.0278 0.0271 0.0263 0.0215
15 0.0192 0.0192 0.0174 0.0156 0.0120
20 0.0139 0.0139 0.0109 0.0079 0.0047
25 0.0083 0.0083 0.0048 0.0014 0.0007
30 0.0015 0.0015 0.0007 0.0000 0.0000
35 0.0000 0.0000 0.0000 0.0000 0.0000
Public Agency Safety
Duration of Service Fire Police
County Peace Officer
5 0.0094 0.0163 0.0187
10 0.0064 0.0126 0.0134
15 0.0048 0.0082 0.0092
20 0.0038 0.0065 0.0064
25 0.0026 0.0058 0.0042
30 0.0014 0.0056 0.0022
35 0.0000 0.0000 0.0000
• After termination with vested benefits, a miscellaneous member is assumed to retire at age 59
and a safety member at age 54.
• The Police termination with vested benefits rates are also used for Public Agency Local Prosecutors, Other Safety, Local Sheriff, and School Police.
Schools
Duration of Service Entry Age 20 Entry Age 25 Entry Age 30 Entry Age 35 Entry Age 40
5 0.0405 0.0405 0.0346 0.0288 0.0264
10 0.0324 0.0324 0.0280 0.0235 0.0211
15 0.0202 0.0202 0.0179 0.0155 0.0126
20 0.0144 0.0144 0.0114 0.0083 0.0042
25 0.0091 0.0091 0.0046 0.0000 0.0000
30 0.0015 0.0015 0.0007 0.0000 0.0000
35 0.0000 0.0000 0.0000 0.0000 0.0000

CalPERS Actuarial Valuation – June 30, 2020 Appendix A Actuarial Methods and Assumptions
A-11
Non-Industrial (Not Job-Related) Disability
Rates vary by age and gender for miscellaneous plans. Rates vary by age and category for safety plans.
Miscellaneous Fire Police County Peace Officer Schools
Age Male Female Male and Female Male and Female Male and Female Male Female
20 0.0002 0.0001 0.0001 0.0001 0.0001 0.0001 0.0001
25 0.0002 0.0001 0.0001 0.0001 0.0001 0.0001 0.0001
30 0.0002 0.0002 0.0001 0.0002 0.0001 0.0001 0.0002
35 0.0004 0.0007 0.0001 0.0003 0.0004 0.0005 0.0004
40 0.0010 0.0014 0.0001 0.0004 0.0007 0.0012 0.0008
45 0.0015 0.0019 0.0002 0.0005 0.0013 0.0020 0.0017
50 0.0016 0.0020 0.0005 0.0008 0.0018 0.0026 0.0022
55 0.0016 0.0015 0.0007 0.0013 0.0010 0.0025 0.0018
60 0.0015 0.0011 0.0007 0.0020 0.0006 0.0022 0.0011
• The miscellaneous non-industrial disability rates are used for Local Prosecutors. • The police non-industrial disability rates are also used for Other Safety, Local Sheriff, and School
Police.
Industrial (Job-Related) Disability Rates vary by age and category.
Age Fire Police County Peace Officer
20 0.0001 0.0000 0.0004
25 0.0002 0.0017 0.0013
30 0.0006 0.0048 0.0025
35 0.0012 0.0079 0.0037
40 0.0023 0.0110 0.0051
45 0.0040 0.0141 0.0067
50 0.0208 0.0185 0.0092
55 0.0307 0.0479 0.0151
60 0.0438 0.0602 0.0174
• The police industrial disability rates are also used for Local Sheriff and Other Safety. • 50% of the police industrial disability rates are used for School Police. • 1% of the police industrial disability rates are used for Local Prosecutors. • Normally, rates are zero for miscellaneous plans unless the agency has specifically contracted
for industrial disability benefits. If so, each miscellaneous non-industrial disability rate will be split into two components: 50% will become the non-industrial disability rate and 50% will become the industrial disability rate.
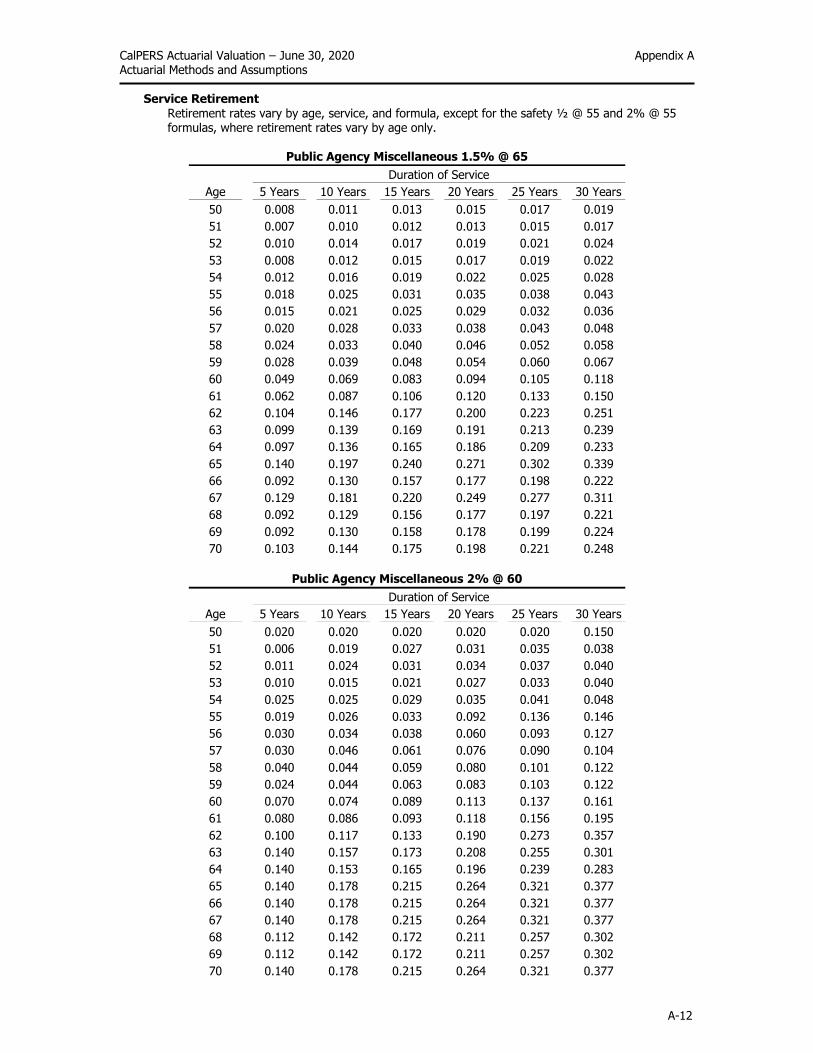
CalPERS Actuarial Valuation – June 30, 2020 Appendix A Actuarial Methods and Assumptions
A-12
Service Retirement
Retirement rates vary by age, service, and formula, except for the safety ½ @ 55 and 2% @ 55 formulas, where retirement rates vary by age only.
Public Agency Miscellaneous 1.5% @ 65
Duration of Service
Age 5 Years 10 Years 15 Years 20 Years 25 Years 30 Years
50 0.008 0.011 0.013 0.015 0.017 0.019
51 0.007 0.010 0.012 0.013 0.015 0.017
52 0.010 0.014 0.017 0.019 0.021 0.024
53 0.008 0.012 0.015 0.017 0.019 0.022
54 0.012 0.016 0.019 0.022 0.025 0.028
55 0.018 0.025 0.031 0.035 0.038 0.043
56 0.015 0.021 0.025 0.029 0.032 0.036
57 0.020 0.028 0.033 0.038 0.043 0.048
58 0.024 0.033 0.040 0.046 0.052 0.058
59 0.028 0.039 0.048 0.054 0.060 0.067
60 0.049 0.069 0.083 0.094 0.105 0.118
61 0.062 0.087 0.106 0.120 0.133 0.150
62 0.104 0.146 0.177 0.200 0.223 0.251
63 0.099 0.139 0.169 0.191 0.213 0.239
64 0.097 0.136 0.165 0.186 0.209 0.233
65 0.140 0.197 0.240 0.271 0.302 0.339
66 0.092 0.130 0.157 0.177 0.198 0.222
67 0.129 0.181 0.220 0.249 0.277 0.311
68 0.092 0.129 0.156 0.177 0.197 0.221
69 0.092 0.130 0.158 0.178 0.199 0.224
70 0.103 0.144 0.175 0.198 0.221 0.248
Public Agency Miscellaneous 2% @ 60
Duration of Service
Age 5 Years 10 Years 15 Years 20 Years 25 Years 30 Years
50 0.020 0.020 0.020 0.020 0.020 0.150
51 0.006 0.019 0.027 0.031 0.035 0.038
52 0.011 0.024 0.031 0.034 0.037 0.040
53 0.010 0.015 0.021 0.027 0.033 0.040
54 0.025 0.025 0.029 0.035 0.041 0.048
55 0.019 0.026 0.033 0.092 0.136 0.146
56 0.030 0.034 0.038 0.060 0.093 0.127
57 0.030 0.046 0.061 0.076 0.090 0.104
58 0.040 0.044 0.059 0.080 0.101 0.122
59 0.024 0.044 0.063 0.083 0.103 0.122
60 0.070 0.074 0.089 0.113 0.137 0.161
61 0.080 0.086 0.093 0.118 0.156 0.195
62 0.100 0.117 0.133 0.190 0.273 0.357
63 0.140 0.157 0.173 0.208 0.255 0.301
64 0.140 0.153 0.165 0.196 0.239 0.283
65 0.140 0.178 0.215 0.264 0.321 0.377
66 0.140 0.178 0.215 0.264 0.321 0.377
67 0.140 0.178 0.215 0.264 0.321 0.377
68 0.112 0.142 0.172 0.211 0.257 0.302
69 0.112 0.142 0.172 0.211 0.257 0.302
70 0.140 0.178 0.215 0.264 0.321 0.377

CalPERS Actuarial Valuation – June 30, 2020 Appendix A Actuarial Methods and Assumptions
A-13
Service Retirement
Public Agency Miscellaneous 2% @ 55
Duration of Service
Age 5 Years 10 Years 15 Years 20 Years 25 Years 30 Years
50 0.008 0.013 0.018 0.021 0.022 0.033
51 0.009 0.016 0.020 0.023 0.026 0.036
52 0.015 0.018 0.020 0.021 0.025 0.030
53 0.016 0.020 0.024 0.028 0.031 0.035
54 0.018 0.022 0.026 0.030 0.034 0.038
55 0.040 0.040 0.056 0.093 0.109 0.154
56 0.034 0.050 0.066 0.092 0.107 0.138
57 0.042 0.048 0.058 0.082 0.096 0.127
58 0.046 0.054 0.062 0.090 0.106 0.131
59 0.045 0.055 0.066 0.097 0.115 0.144
60 0.058 0.075 0.093 0.126 0.143 0.169
61 0.065 0.088 0.111 0.146 0.163 0.189
62 0.136 0.118 0.148 0.190 0.213 0.247
63 0.130 0.133 0.174 0.212 0.249 0.285
64 0.113 0.129 0.165 0.196 0.223 0.249
65 0.145 0.173 0.201 0.233 0.266 0.289
66 0.170 0.199 0.229 0.258 0.284 0.306
67 0.250 0.204 0.233 0.250 0.257 0.287
68 0.227 0.175 0.193 0.215 0.240 0.262
69 0.200 0.180 0.180 0.198 0.228 0.246
70 0.150 0.171 0.192 0.239 0.304 0.330
Public Agency Miscellaneous 2.5% @ 55
Duration of Service
Age 5 Years 10 Years 15 Years 20 Years 25 Years 30 Years
50 0.008 0.014 0.020 0.026 0.033 0.050
51 0.008 0.015 0.023 0.030 0.037 0.059
52 0.009 0.016 0.023 0.030 0.037 0.061
53 0.014 0.021 0.028 0.035 0.042 0.063
54 0.014 0.022 0.030 0.039 0.047 0.068
55 0.020 0.038 0.055 0.073 0.122 0.192
56 0.025 0.047 0.069 0.091 0.136 0.196
57 0.030 0.048 0.065 0.083 0.123 0.178
58 0.035 0.054 0.073 0.093 0.112 0.153
59 0.035 0.054 0.073 0.092 0.131 0.183
60 0.044 0.072 0.101 0.130 0.158 0.197
61 0.050 0.078 0.105 0.133 0.161 0.223
62 0.055 0.093 0.130 0.168 0.205 0.268
63 0.090 0.124 0.158 0.192 0.226 0.279
64 0.080 0.112 0.144 0.175 0.207 0.268
65 0.120 0.156 0.193 0.229 0.265 0.333
66 0.132 0.172 0.212 0.252 0.292 0.366
67 0.132 0.172 0.212 0.252 0.292 0.366
68 0.120 0.156 0.193 0.229 0.265 0.333
69 0.120 0.156 0.193 0.229 0.265 0.333
70 0.120 0.156 0.193 0.229 0.265 0.333
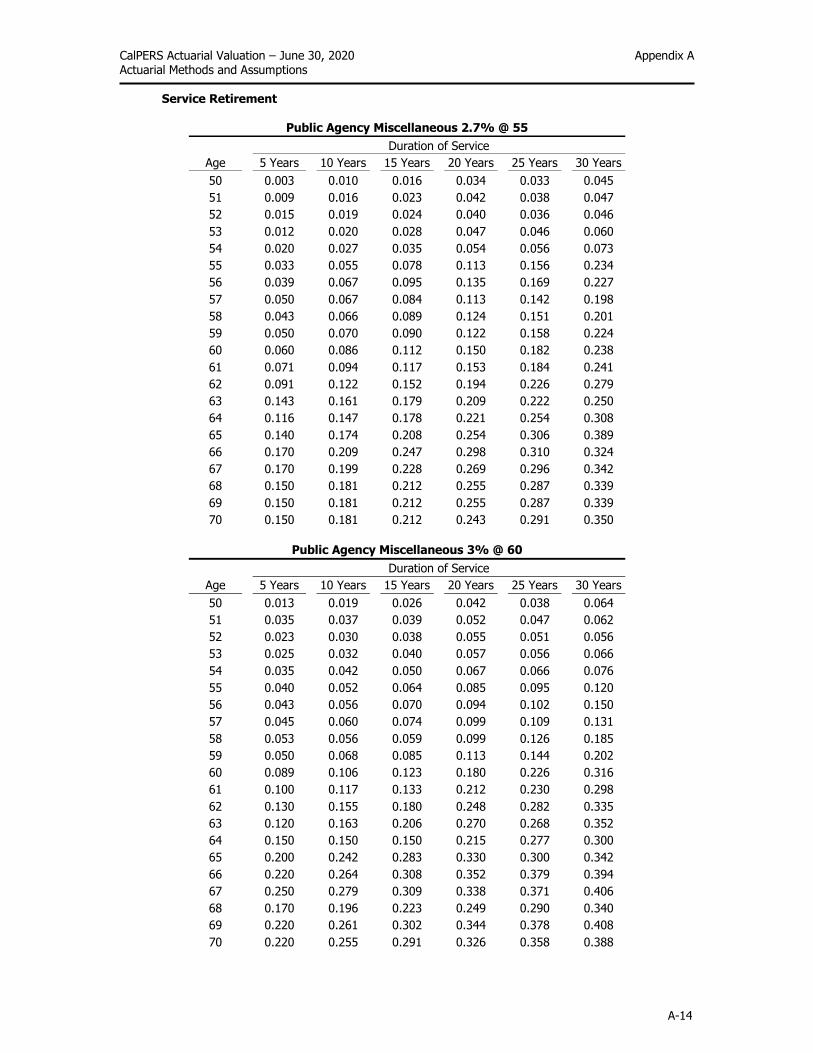
CalPERS Actuarial Valuation – June 30, 2020 Appendix A Actuarial Methods and Assumptions
A-14
Service Retirement
Public Agency Miscellaneous 2.7% @ 55
Duration of Service
Age 5 Years 10 Years 15 Years 20 Years 25 Years 30 Years
50 0.003 0.010 0.016 0.034 0.033 0.045
51 0.009 0.016 0.023 0.042 0.038 0.047
52 0.015 0.019 0.024 0.040 0.036 0.046
53 0.012 0.020 0.028 0.047 0.046 0.060
54 0.020 0.027 0.035 0.054 0.056 0.073
55 0.033 0.055 0.078 0.113 0.156 0.234
56 0.039 0.067 0.095 0.135 0.169 0.227
57 0.050 0.067 0.084 0.113 0.142 0.198
58 0.043 0.066 0.089 0.124 0.151 0.201
59 0.050 0.070 0.090 0.122 0.158 0.224
60 0.060 0.086 0.112 0.150 0.182 0.238
61 0.071 0.094 0.117 0.153 0.184 0.241
62 0.091 0.122 0.152 0.194 0.226 0.279
63 0.143 0.161 0.179 0.209 0.222 0.250
64 0.116 0.147 0.178 0.221 0.254 0.308
65 0.140 0.174 0.208 0.254 0.306 0.389
66 0.170 0.209 0.247 0.298 0.310 0.324
67 0.170 0.199 0.228 0.269 0.296 0.342
68 0.150 0.181 0.212 0.255 0.287 0.339
69 0.150 0.181 0.212 0.255 0.287 0.339
70 0.150 0.181 0.212 0.243 0.291 0.350
Public Agency Miscellaneous 3% @ 60
Duration of Service
Age 5 Years 10 Years 15 Years 20 Years 25 Years 30 Years
50 0.013 0.019 0.026 0.042 0.038 0.064
51 0.035 0.037 0.039 0.052 0.047 0.062
52 0.023 0.030 0.038 0.055 0.051 0.056
53 0.025 0.032 0.040 0.057 0.056 0.066
54 0.035 0.042 0.050 0.067 0.066 0.076
55 0.040 0.052 0.064 0.085 0.095 0.120
56 0.043 0.056 0.070 0.094 0.102 0.150
57 0.045 0.060 0.074 0.099 0.109 0.131
58 0.053 0.056 0.059 0.099 0.126 0.185
59 0.050 0.068 0.085 0.113 0.144 0.202
60 0.089 0.106 0.123 0.180 0.226 0.316
61 0.100 0.117 0.133 0.212 0.230 0.298
62 0.130 0.155 0.180 0.248 0.282 0.335
63 0.120 0.163 0.206 0.270 0.268 0.352
64 0.150 0.150 0.150 0.215 0.277 0.300
65 0.200 0.242 0.283 0.330 0.300 0.342
66 0.220 0.264 0.308 0.352 0.379 0.394
67 0.250 0.279 0.309 0.338 0.371 0.406
68 0.170 0.196 0.223 0.249 0.290 0.340
69 0.220 0.261 0.302 0.344 0.378 0.408
70 0.220 0.255 0.291 0.326 0.358 0.388
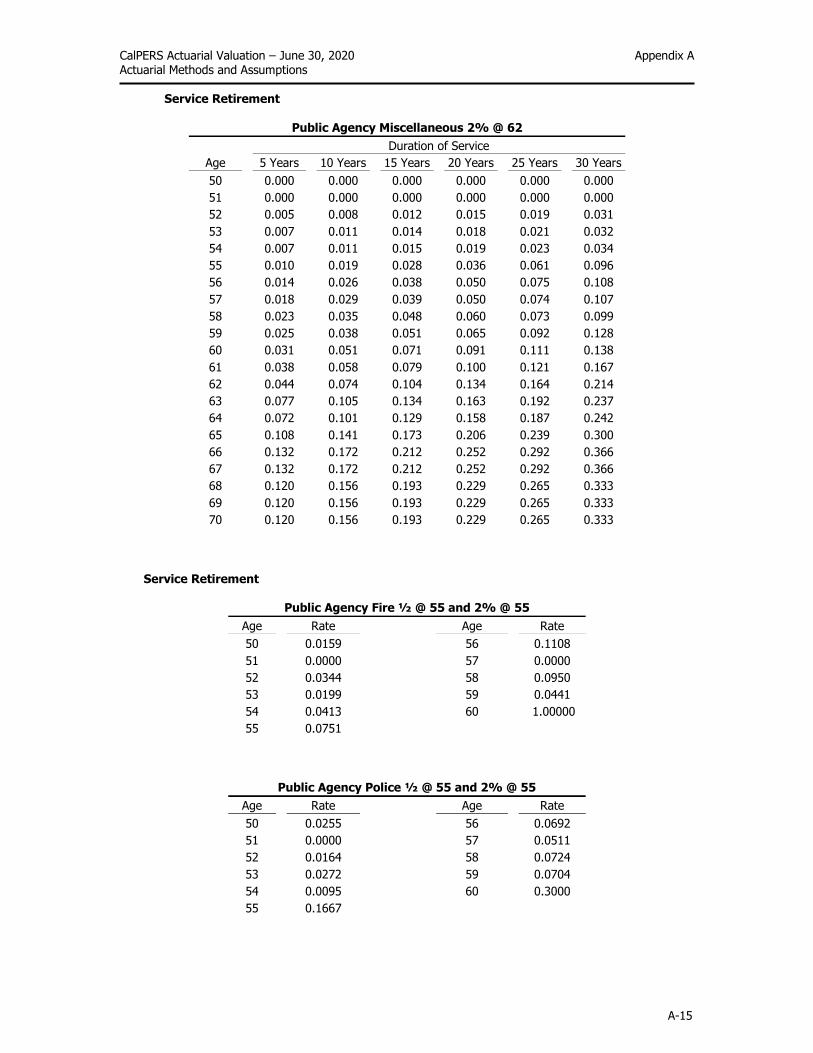
CalPERS Actuarial Valuation – June 30, 2020 Appendix A Actuarial Methods and Assumptions
A-15
Service Retirement
Public Agency Miscellaneous 2% @ 62
Duration of Service
Age 5 Years 10 Years 15 Years 20 Years 25 Years 30 Years
50 0.000 0.000 0.000 0.000 0.000 0.000
51 0.000 0.000 0.000 0.000 0.000 0.000
52 0.005 0.008 0.012 0.015 0.019 0.031
53 0.007 0.011 0.014 0.018 0.021 0.032
54 0.007 0.011 0.015 0.019 0.023 0.034
55 0.010 0.019 0.028 0.036 0.061 0.096
56 0.014 0.026 0.038 0.050 0.075 0.108
57 0.018 0.029 0.039 0.050 0.074 0.107
58 0.023 0.035 0.048 0.060 0.073 0.099
59 0.025 0.038 0.051 0.065 0.092 0.128
60 0.031 0.051 0.071 0.091 0.111 0.138
61 0.038 0.058 0.079 0.100 0.121 0.167
62 0.044 0.074 0.104 0.134 0.164 0.214
63 0.077 0.105 0.134 0.163 0.192 0.237
64 0.072 0.101 0.129 0.158 0.187 0.242
65 0.108 0.141 0.173 0.206 0.239 0.300
66 0.132 0.172 0.212 0.252 0.292 0.366
67 0.132 0.172 0.212 0.252 0.292 0.366
68 0.120 0.156 0.193 0.229 0.265 0.333
69 0.120 0.156 0.193 0.229 0.265 0.333
70 0.120 0.156 0.193 0.229 0.265 0.333
Service Retirement
Public Agency Fire ½ @ 55 and 2% @ 55
Age Rate
Age Rate
50 0.0159 56 0.1108
51 0.0000 57 0.0000
52 0.0344 58 0.0950
53 0.0199 59 0.0441
54 0.0413 60 1.00000
55 0.0751
Public Agency Police ½ @ 55 and 2% @ 55
Age Rate
Age Rate
50 0.0255 56 0.0692
51 0.0000 57 0.0511
52 0.0164 58 0.0724
53 0.0272 59 0.0704
54 0.0095 60 0.3000
55 0.1667

CalPERS Actuarial Valuation – June 30, 2020 Appendix A Actuarial Methods and Assumptions
A-16
Service Retirement
Public Agency Police 2% @ 50
Duration of Service
Age 5 Years 10 Years 15 Years 20 Years 25 Years 30 Years
50 0.050 0.050 0.050 0.050 0.050 0.100
51 0.040 0.040 0.040 0.040 0.058 0.094
52 0.040 0.040 0.040 0.040 0.061 0.087
53 0.040 0.040 0.040 0.040 0.082 0.123
54 0.040 0.040 0.040 0.046 0.098 0.158
55 0.072 0.072 0.072 0.096 0.141 0.255
56 0.066 0.066 0.066 0.088 0.129 0.228
57 0.060 0.060 0.060 0.080 0.118 0.213
58 0.080 0.080 0.080 0.088 0.138 0.228
59 0.080 0.080 0.080 0.092 0.140 0.228
60 0.150 0.150 0.150 0.150 0.150 0.228
61 0.144 0.144 0.144 0.144 0.144 0.170
62 0.150 0.150 0.150 0.150 0.150 0.213
63 0.150 0.150 0.150 0.150 0.150 0.213
64 0.150 0.150 0.150 0.150 0.150 0.319
65 1.000 1.000 1.000 1.000 1.000 1.000
• These rates also apply to County Peace officers, Local Prosecutors, Local Sheriff, School Police, and Other Safety.
Service Retirement
Public Agency Fire 2% @ 50
Duration of Service
Age 5 Years 10 Years 15 Years 20 Years 25 Years 30 Years
50 0.009 0.009 0.009 0.009 0.013 0.020
51 0.013 0.013 0.013 0.013 0.020 0.029
52 0.018 0.018 0.018 0.018 0.028 0.042
53 0.052 0.052 0.052 0.052 0.079 0.119
54 0.067 0.067 0.067 0.067 0.103 0.154
55 0.089 0.089 0.089 0.089 0.136 0.204
56 0.083 0.083 0.083 0.083 0.127 0.190
57 0.082 0.082 0.082 0.082 0.126 0.189
58 0.088 0.088 0.088 0.088 0.136 0.204
59 0.074 0.074 0.074 0.074 0.113 0.170
60 0.100 0.100 0.100 0.100 0.154 0.230
61 0.072 0.072 0.072 0.072 0.110 0.165
62 0.099 0.099 0.099 0.099 0.152 0.228
63 0.114 0.114 0.114 0.114 0.175 0.262
64 0.114 0.114 0.114 0.114 0.175 0.262
65 1.000 1.000 1.000 1.000 1.000 1.000

CalPERS Actuarial Valuation – June 30, 2020 Appendix A Actuarial Methods and Assumptions
A-17
Service Retirement
Public Agency Police 3% @ 55
Duration of Service
Age 5 Years 10 Years 15 Years 20 Years 25 Years 30 Years
50 0.035 0.035 0.035 0.035 0.070 0.090
51 0.028 0.028 0.028 0.029 0.065 0.101
52 0.032 0.032 0.032 0.039 0.066 0.109
53 0.028 0.028 0.028 0.043 0.075 0.132
54 0.038 0.038 0.038 0.074 0.118 0.333
55 0.070 0.070 0.070 0.120 0.175 0.340
56 0.060 0.060 0.060 0.110 0.165 0.330
57 0.060 0.060 0.060 0.110 0.165 0.320
58 0.080 0.080 0.080 0.100 0.185 0.350
59 0.090 0.090 0.095 0.130 0.185 0.350
60 0.150 0.150 0.150 0.150 0.185 0.350
61 0.120 0.120 0.120 0.120 0.160 0.350
62 0.150 0.150 0.150 0.150 0.200 0.350
63 0.150 0.150 0.150 0.150 0.200 0.400
64 0.150 0.150 0.150 0.150 0.175 0.350
65 1.000 1.000 1.000 1.000 1.000 1.000
• These rates also apply to County Peace officers, Local Prosecutors, Local Sheriff, School Police, and Other Safety.
Service Retirement
Public Agency Fire 3% @ 55
Duration of Service
Age 5 Years 10 Years 15 Years 20 Years 25 Years 30 Years
50 0.001 0.001 0.001 0.006 0.016 0.069
51 0.002 0.002 0.002 0.006 0.018 0.071
52 0.012 0.012 0.012 0.021 0.040 0.098
53 0.032 0.032 0.032 0.049 0.085 0.149
54 0.057 0.057 0.057 0.087 0.144 0.217
55 0.073 0.073 0.073 0.109 0.179 0.259
56 0.064 0.064 0.064 0.097 0.161 0.238
57 0.063 0.063 0.063 0.095 0.157 0.233
58 0.065 0.065 0.065 0.099 0.163 0.241
59 0.088 0.088 0.088 0.131 0.213 0.299
60 0.105 0.105 0.105 0.155 0.251 0.344
61 0.118 0.118 0.118 0.175 0.282 0.380
62 0.087 0.087 0.087 0.128 0.210 0.295
63 0.067 0.067 0.067 0.100 0.165 0.243
64 0.067 0.067 0.067 0.100 0.165 0.243
65 1.000 1.000 1.000 1.000 1.000 1.000
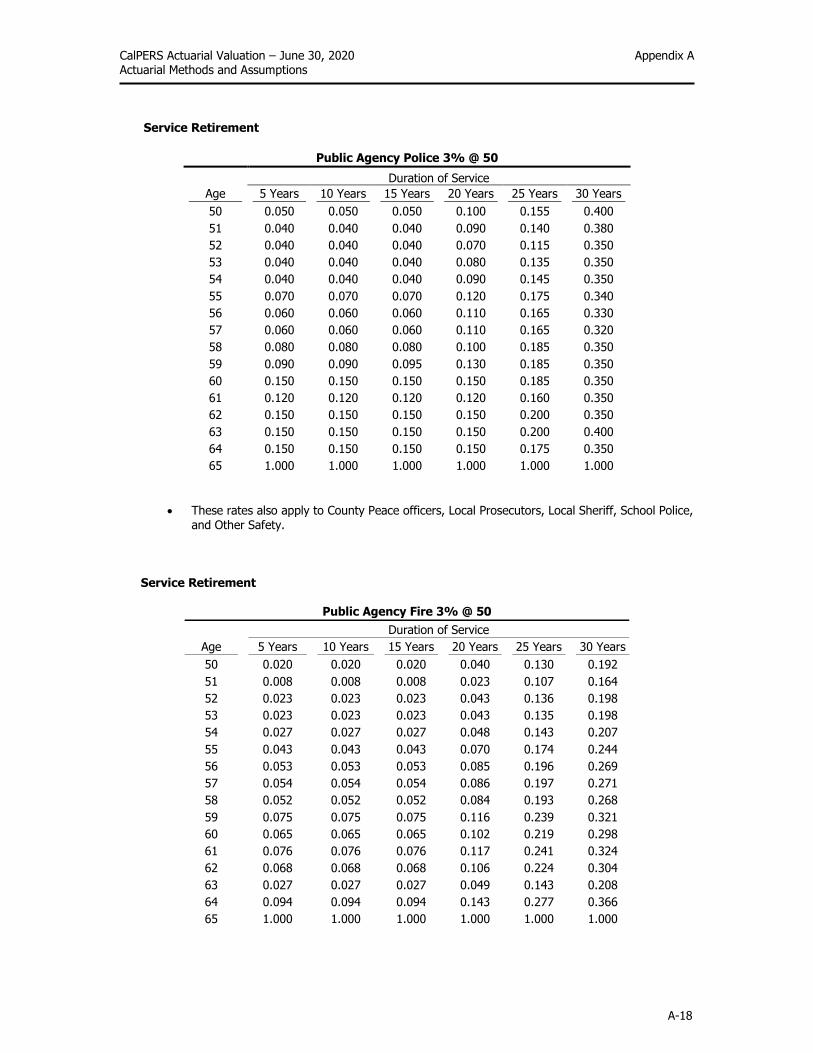
CalPERS Actuarial Valuation – June 30, 2020 Appendix A Actuarial Methods and Assumptions
A-18
Service Retirement
Public Agency Police 3% @ 50
Duration of Service
Age 5 Years 10 Years 15 Years 20 Years 25 Years 30 Years
50 0.050 0.050 0.050 0.100 0.155 0.400
51 0.040 0.040 0.040 0.090 0.140 0.380
52 0.040 0.040 0.040 0.070 0.115 0.350
53 0.040 0.040 0.040 0.080 0.135 0.350
54 0.040 0.040 0.040 0.090 0.145 0.350
55 0.070 0.070 0.070 0.120 0.175 0.340
56 0.060 0.060 0.060 0.110 0.165 0.330
57 0.060 0.060 0.060 0.110 0.165 0.320
58 0.080 0.080 0.080 0.100 0.185 0.350
59 0.090 0.090 0.095 0.130 0.185 0.350
60 0.150 0.150 0.150 0.150 0.185 0.350
61 0.120 0.120 0.120 0.120 0.160 0.350
62 0.150 0.150 0.150 0.150 0.200 0.350
63 0.150 0.150 0.150 0.150 0.200 0.400
64 0.150 0.150 0.150 0.150 0.175 0.350
65 1.000 1.000 1.000 1.000 1.000 1.000
• These rates also apply to County Peace officers, Local Prosecutors, Local Sheriff, School Police, and Other Safety.
Service Retirement
Public Agency Fire 3% @ 50
Duration of Service
Age 5 Years 10 Years 15 Years 20 Years 25 Years 30 Years
50 0.020 0.020 0.020 0.040 0.130 0.192
51 0.008 0.008 0.008 0.023 0.107 0.164
52 0.023 0.023 0.023 0.043 0.136 0.198
53 0.023 0.023 0.023 0.043 0.135 0.198
54 0.027 0.027 0.027 0.048 0.143 0.207
55 0.043 0.043 0.043 0.070 0.174 0.244
56 0.053 0.053 0.053 0.085 0.196 0.269
57 0.054 0.054 0.054 0.086 0.197 0.271
58 0.052 0.052 0.052 0.084 0.193 0.268
59 0.075 0.075 0.075 0.116 0.239 0.321
60 0.065 0.065 0.065 0.102 0.219 0.298
61 0.076 0.076 0.076 0.117 0.241 0.324
62 0.068 0.068 0.068 0.106 0.224 0.304
63 0.027 0.027 0.027 0.049 0.143 0.208
64 0.094 0.094 0.094 0.143 0.277 0.366
65 1.000 1.000 1.000 1.000 1.000 1.000
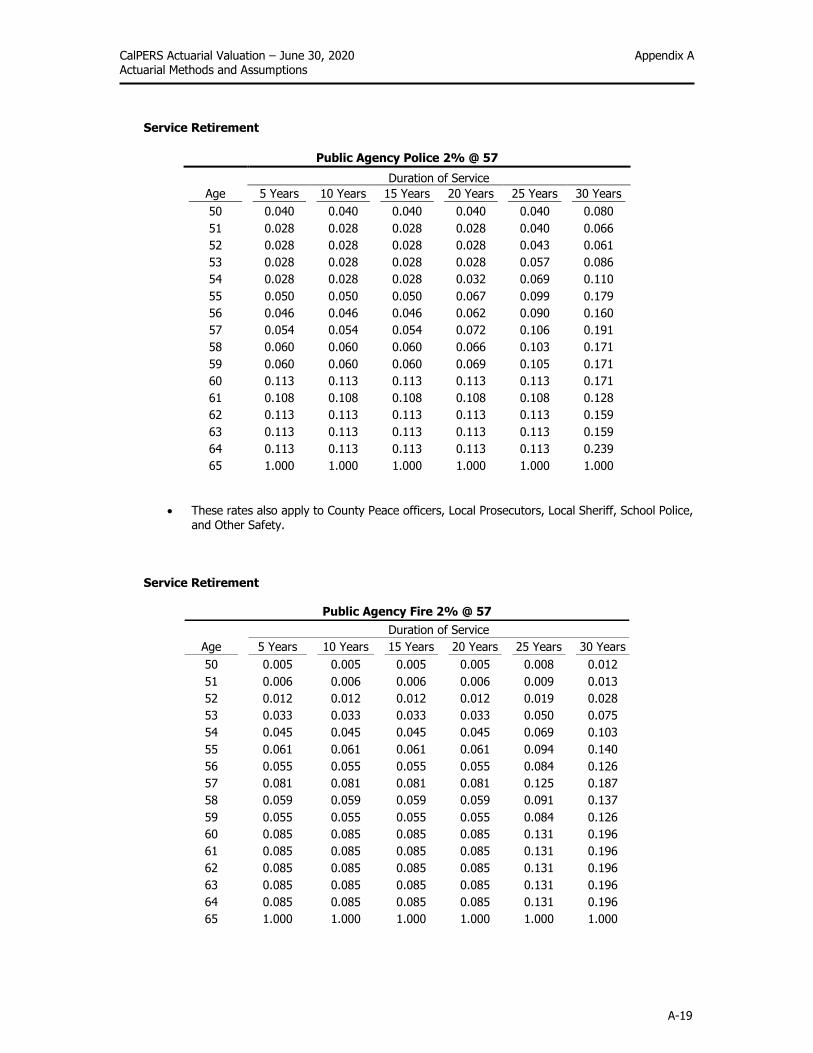
CalPERS Actuarial Valuation – June 30, 2020 Appendix A Actuarial Methods and Assumptions
A-19
Service Retirement
Public Agency Police 2% @ 57
Duration of Service
Age 5 Years 10 Years 15 Years 20 Years 25 Years 30 Years
50 0.040 0.040 0.040 0.040 0.040 0.080
51 0.028 0.028 0.028 0.028 0.040 0.066
52 0.028 0.028 0.028 0.028 0.043 0.061
53 0.028 0.028 0.028 0.028 0.057 0.086
54 0.028 0.028 0.028 0.032 0.069 0.110
55 0.050 0.050 0.050 0.067 0.099 0.179
56 0.046 0.046 0.046 0.062 0.090 0.160
57 0.054 0.054 0.054 0.072 0.106 0.191
58 0.060 0.060 0.060 0.066 0.103 0.171
59 0.060 0.060 0.060 0.069 0.105 0.171
60 0.113 0.113 0.113 0.113 0.113 0.171
61 0.108 0.108 0.108 0.108 0.108 0.128
62 0.113 0.113 0.113 0.113 0.113 0.159
63 0.113 0.113 0.113 0.113 0.113 0.159
64 0.113 0.113 0.113 0.113 0.113 0.239
65 1.000 1.000 1.000 1.000 1.000 1.000
• These rates also apply to County Peace officers, Local Prosecutors, Local Sheriff, School Police, and Other Safety.
Service Retirement
Public Agency Fire 2% @ 57
Duration of Service
Age 5 Years 10 Years 15 Years 20 Years 25 Years 30 Years
50 0.005 0.005 0.005 0.005 0.008 0.012
51 0.006 0.006 0.006 0.006 0.009 0.013
52 0.012 0.012 0.012 0.012 0.019 0.028
53 0.033 0.033 0.033 0.033 0.050 0.075
54 0.045 0.045 0.045 0.045 0.069 0.103
55 0.061 0.061 0.061 0.061 0.094 0.140
56 0.055 0.055 0.055 0.055 0.084 0.126
57 0.081 0.081 0.081 0.081 0.125 0.187
58 0.059 0.059 0.059 0.059 0.091 0.137
59 0.055 0.055 0.055 0.055 0.084 0.126
60 0.085 0.085 0.085 0.085 0.131 0.196
61 0.085 0.085 0.085 0.085 0.131 0.196
62 0.085 0.085 0.085 0.085 0.131 0.196
63 0.085 0.085 0.085 0.085 0.131 0.196
64 0.085 0.085 0.085 0.085 0.131 0.196
65 1.000 1.000 1.000 1.000 1.000 1.000
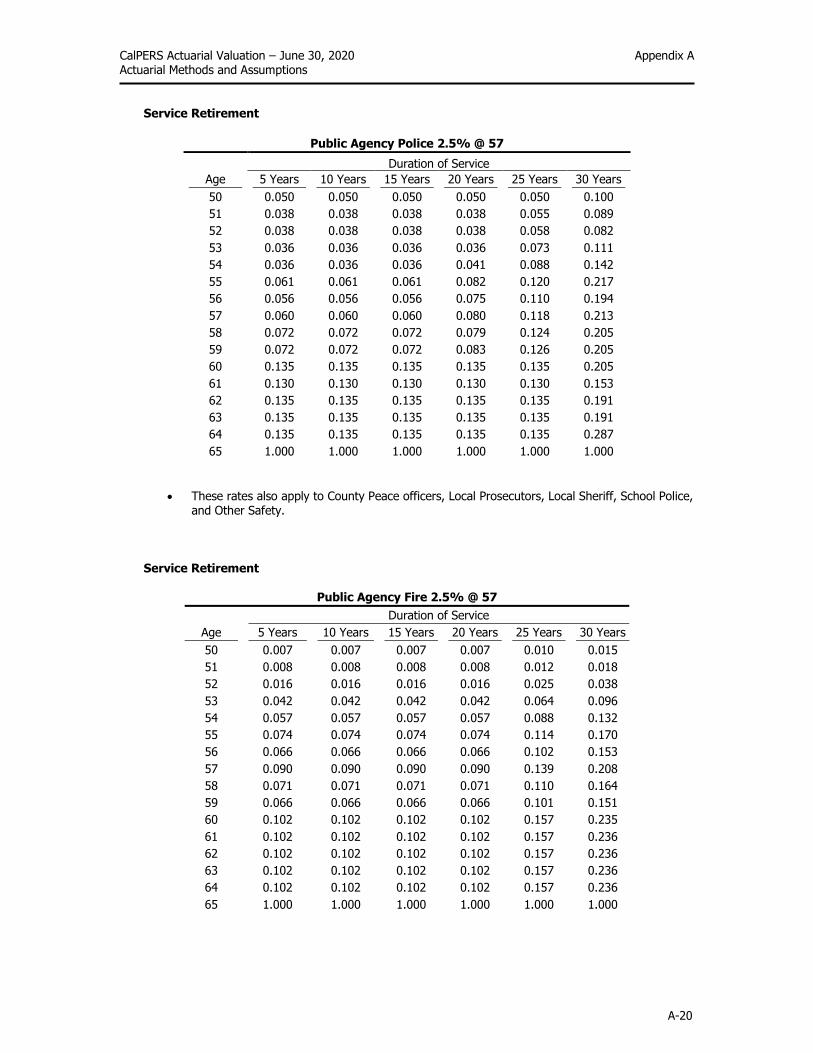
CalPERS Actuarial Valuation – June 30, 2020 Appendix A Actuarial Methods and Assumptions
A-20
Service Retirement
Public Agency Police 2.5% @ 57
Duration of Service
Age 5 Years 10 Years 15 Years 20 Years 25 Years 30 Years
50 0.050 0.050 0.050 0.050 0.050 0.100
51 0.038 0.038 0.038 0.038 0.055 0.089
52 0.038 0.038 0.038 0.038 0.058 0.082
53 0.036 0.036 0.036 0.036 0.073 0.111
54 0.036 0.036 0.036 0.041 0.088 0.142
55 0.061 0.061 0.061 0.082 0.120 0.217
56 0.056 0.056 0.056 0.075 0.110 0.194
57 0.060 0.060 0.060 0.080 0.118 0.213
58 0.072 0.072 0.072 0.079 0.124 0.205
59 0.072 0.072 0.072 0.083 0.126 0.205
60 0.135 0.135 0.135 0.135 0.135 0.205
61 0.130 0.130 0.130 0.130 0.130 0.153
62 0.135 0.135 0.135 0.135 0.135 0.191
63 0.135 0.135 0.135 0.135 0.135 0.191
64 0.135 0.135 0.135 0.135 0.135 0.287
65 1.000 1.000 1.000 1.000 1.000 1.000
• These rates also apply to County Peace officers, Local Prosecutors, Local Sheriff, School Police, and Other Safety.
Service Retirement
Public Agency Fire 2.5% @ 57
Duration of Service
Age 5 Years 10 Years 15 Years 20 Years 25 Years 30 Years
50 0.007 0.007 0.007 0.007 0.010 0.015
51 0.008 0.008 0.008 0.008 0.012 0.018
52 0.016 0.016 0.016 0.016 0.025 0.038
53 0.042 0.042 0.042 0.042 0.064 0.096
54 0.057 0.057 0.057 0.057 0.088 0.132
55 0.074 0.074 0.074 0.074 0.114 0.170
56 0.066 0.066 0.066 0.066 0.102 0.153
57 0.090 0.090 0.090 0.090 0.139 0.208
58 0.071 0.071 0.071 0.071 0.110 0.164
59 0.066 0.066 0.066 0.066 0.101 0.151
60 0.102 0.102 0.102 0.102 0.157 0.235
61 0.102 0.102 0.102 0.102 0.157 0.236
62 0.102 0.102 0.102 0.102 0.157 0.236
63 0.102 0.102 0.102 0.102 0.157 0.236
64 0.102 0.102 0.102 0.102 0.157 0.236
65 1.000 1.000 1.000 1.000 1.000 1.000
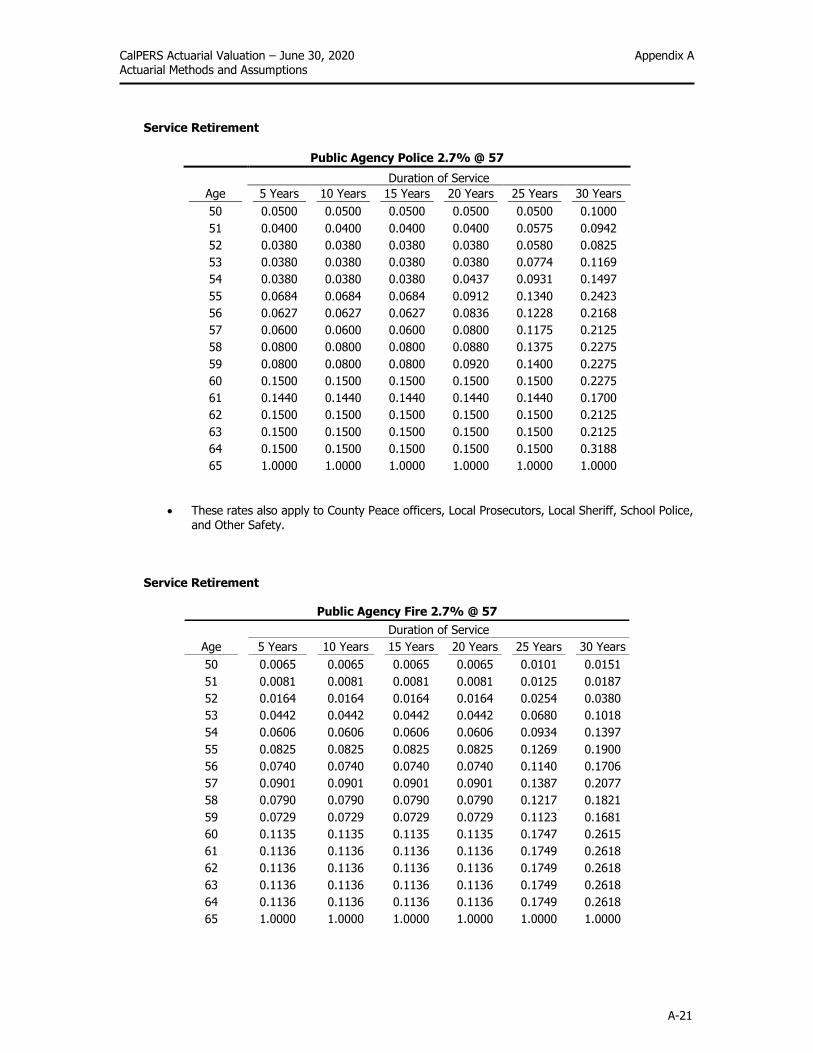
CalPERS Actuarial Valuation – June 30, 2020 Appendix A Actuarial Methods and Assumptions
A-21
Service Retirement
Public Agency Police 2.7% @ 57
Duration of Service
Age 5 Years 10 Years 15 Years 20 Years 25 Years 30 Years
50 0.0500 0.0500 0.0500 0.0500 0.0500 0.1000
51 0.0400 0.0400 0.0400 0.0400 0.0575 0.0942
52 0.0380 0.0380 0.0380 0.0380 0.0580 0.0825
53 0.0380 0.0380 0.0380 0.0380 0.0774 0.1169
54 0.0380 0.0380 0.0380 0.0437 0.0931 0.1497
55 0.0684 0.0684 0.0684 0.0912 0.1340 0.2423
56 0.0627 0.0627 0.0627 0.0836 0.1228 0.2168
57 0.0600 0.0600 0.0600 0.0800 0.1175 0.2125
58 0.0800 0.0800 0.0800 0.0880 0.1375 0.2275
59 0.0800 0.0800 0.0800 0.0920 0.1400 0.2275
60 0.1500 0.1500 0.1500 0.1500 0.1500 0.2275
61 0.1440 0.1440 0.1440 0.1440 0.1440 0.1700
62 0.1500 0.1500 0.1500 0.1500 0.1500 0.2125
63 0.1500 0.1500 0.1500 0.1500 0.1500 0.2125
64 0.1500 0.1500 0.1500 0.1500 0.1500 0.3188
65 1.0000 1.0000 1.0000 1.0000 1.0000 1.0000
• These rates also apply to County Peace officers, Local Prosecutors, Local Sheriff, School Police, and Other Safety.
Service Retirement
Public Agency Fire 2.7% @ 57
Duration of Service
Age 5 Years 10 Years 15 Years 20 Years 25 Years 30 Years
50 0.0065 0.0065 0.0065 0.0065 0.0101 0.0151
51 0.0081 0.0081 0.0081 0.0081 0.0125 0.0187
52 0.0164 0.0164 0.0164 0.0164 0.0254 0.0380
53 0.0442 0.0442 0.0442 0.0442 0.0680 0.1018
54 0.0606 0.0606 0.0606 0.0606 0.0934 0.1397
55 0.0825 0.0825 0.0825 0.0825 0.1269 0.1900
56 0.0740 0.0740 0.0740 0.0740 0.1140 0.1706
57 0.0901 0.0901 0.0901 0.0901 0.1387 0.2077
58 0.0790 0.0790 0.0790 0.0790 0.1217 0.1821
59 0.0729 0.0729 0.0729 0.0729 0.1123 0.1681
60 0.1135 0.1135 0.1135 0.1135 0.1747 0.2615
61 0.1136 0.1136 0.1136 0.1136 0.1749 0.2618
62 0.1136 0.1136 0.1136 0.1136 0.1749 0.2618
63 0.1136 0.1136 0.1136 0.1136 0.1749 0.2618
64 0.1136 0.1136 0.1136 0.1136 0.1749 0.2618
65 1.0000 1.0000 1.0000 1.0000 1.0000 1.0000

CalPERS Actuarial Valuation – June 30, 2020 Appendix A Actuarial Methods and Assumptions
A-22
Service Retirement
Schools 2% @ 55
Duration of Service
Age 5 Years 10 Years 15 Years 20 Years 25 Years 30 Years
50 0.004 0.007 0.011 0.012 0.013 0.015
51 0.004 0.008 0.011 0.014 0.016 0.017
52 0.005 0.010 0.014 0.016 0.018 0.021
53 0.006 0.012 0.016 0.020 0.022 0.025
54 0.008 0.017 0.023 0.027 0.031 0.034
55 0.021 0.042 0.058 0.069 0.077 0.086
56 0.019 0.037 0.053 0.062 0.069 0.078
57 0.019 0.038 0.054 0.064 0.071 0.079
58 0.022 0.045 0.062 0.074 0.082 0.092
59 0.025 0.049 0.069 0.082 0.090 0.101
60 0.033 0.066 0.092 0.109 0.121 0.135
61 0.037 0.072 0.101 0.119 0.133 0.149
62 0.066 0.131 0.184 0.218 0.242 0.271
63 0.064 0.126 0.178 0.209 0.233 0.261
64 0.059 0.117 0.163 0.193 0.215 0.240
65 0.080 0.158 0.221 0.261 0.291 0.326
66 0.081 0.160 0.224 0.265 0.296 0.330
67 0.070 0.139 0.194 0.229 0.255 0.286
68 0.063 0.124 0.173 0.205 0.228 0.255
69 0.066 0.130 0.183 0.216 0.241 0.270
70 0.071 0.140 0.196 0.231 0.258 0.289
Miscellaneous Internal Revenue Code Section 415 The limitations on benefits imposed by Internal Revenue Code Section 415 are taken into account in this valuation. Each year the impact of any changes in this limitation since the prior valuation is included and amortized as part of the actuarial gain or loss base. This results in lower contributions for those employers contributing to the Replacement Benefit Fund and protects CalPERS from prefunding expected benefits in excess of limits imposed by federal tax law. The Section 415(b) dollar limit for the 2020 calendar year is $230,000. Internal Revenue Code Section 401(a)(17) The limitations on compensation imposed by Internal Revenue Code Section 401(a)(17) are taken into account in this valuation. Each year, the impact of any changes in the compensation limitation since the prior valuation is included and amortized as part of the actuarial gain or loss base. The compensation limit for classic members for the 2020 calendar year is $285,000.

Appendix B
Principal Plan Provisions

CalPERS Actuarial Valuation – June 30, 2020 Appendix B Miscellaneous Plan of the City of Anaheim Principal Plan Provisions
B-1
The following is a description of the principal plan provisions used in calculating costs and liabilities. We have indicated whether a plan provision is standard or optional. Standard benefits are applicable to all members while optional benefits vary among employers. Optional benefits that apply to a single period of time, such as Golden Handshakes, have not been included. Many of the statements in this summary are general in nature, and are intended to provide an easily understood summary of the Public Employees’ Retirement Law. The law itself governs in all situations.
Service Retirement Eligibility A classic CalPERS member or PEPRA Safety member becomes eligible for Service Retirement upon attainment of age 50 with at least 5 years of credited service (total service across all CalPERS employers, and with certain other retirement systems with which CalPERS has reciprocity agreements). For employees hired into a plan with the 1.5% at age 65 formula, eligibility for service retirement is age 55 with at least 5 years of service. PEPRA miscellaneous members become eligible for service retirement upon attainment of age 52 with at least 5 years of service.
Benefit The service retirement benefit is a monthly allowance equal to the product of the benefit factor, years of service, and final compensation. • The benefit factor depends on the benefit formula specified in your agency’s contract. The table below shows the
factors for each of the available formulas. Factors vary by the member’s age at retirement. Listed are the factors for retirement at whole year ages:
Miscellaneous Plan Formulas
Retirement Age
1.5% at 65
2% at 60 2% at 55 2.5% at
55 2.7% at
55 3% at 60
PEPRA 2% at 62
50 0.5000% 1.092% 1.426% 2.000% 2.000% 2.000% N/A
51 0.5667% 1.156% 1.522% 2.100% 2.140% 2.100% N/A
52 0.6334% 1.224% 1.628% 2.200% 2.280% 2.200% 1.000%
53 0.7000% 1.296% 1.742% 2.300% 2.420% 2.300% 1.100%
54 0.7667% 1.376% 1.866% 2.400% 2.560% 2.400% 1.200%
55 0.8334% 1.460% 2.000% 2.500% 2.700% 2.500% 1.300%
56 0.9000% 1.552% 2.052% 2.500% 2.700% 2.600% 1.400%
57 0.9667% 1.650% 2.104% 2.500% 2.700% 2.700% 1.500%
58 1.0334% 1.758% 2.156% 2.500% 2.700% 2.800% 1.600%
59 1.1000% 1.874% 2.210% 2.500% 2.700% 2.900% 1.700%
60 1.1667% 2.000% 2.262% 2.500% 2.700% 3.000% 1.800%
61 1.2334% 2.134% 2.314% 2.500% 2.700% 3.000% 1.900%
62 1.3000% 2.272% 2.366% 2.500% 2.700% 3.000% 2.000%
63 1.3667% 2.418% 2.418% 2.500% 2.700% 3.000% 2.100%
64 1.4334% 2.418% 2.418% 2.500% 2.700% 3.000% 2.200%
65 1.5000% 2.418% 2.418% 2.500% 2.700% 3.000% 2.300%
66 1.5000% 2.418% 2.418% 2.500% 2.700% 3.000% 2.400%
67 & up 1.5000% 2.418% 2.418% 2.500% 2.700% 3.000% 2.500%

CalPERS Actuarial Valuation – June 30, 2020 Appendix B Miscellaneous Plan of the City of Anaheim Principal Plan Provisions
B-2
Safety Plan Formulas
Retirement Age
½ at 55 * 2% at 55 2% at 50 3% at 55 3% at 50
50 1.783% 1.426% 2.000% 2.400% 3.000%
51 1.903% 1.522% 2.140% 2.520% 3.000%
52 2.035% 1.628% 2.280% 2.640% 3.000%
53 2.178% 1.742% 2.420% 2.760% 3.000%
54 2.333% 1.866% 2.560% 2.880% 3.000%
55 & Up 2.500% 2.000% 2.700% 3.000% 3.000%
* For this formula, the benefit factor also varies by entry age. The factors shown are for members with an entry age of 35 or greater. If entry age is less than 35, then the age 55 benefit factor is 50% divided by the difference between age 55 and entry age. The benefit factor for ages prior to age 55 is the same proportion of the age 55 benefit factor as in the above table. PEPRA Safety Plan Formulas
Retirement Age 2% at 57 2.5% at 57 2.7% at 57
50 1.426% 2.000% 2.000%
51 1.508% 2.071% 2.100%
52 1.590% 2.143% 2.200%
53 1.672% 2.214% 2.300%
54 1.754% 2.286% 2.400%
55 1.836% 2.357% 2.500%
56 1.918% 2.429% 2.600%
57 & Up 2.000% 2.500% 2.700%
• The years of service is the amount credited by CalPERS to a member while he or she is employed in this group (or
for other periods that are recognized under the employer’s contract with CalPERS). For a member who has earned service with multiple CalPERS employers, the benefit from each employer is calculated separately according to each employer’s contract, and then added together for the total allowance. An agency may contract for an optional benefit where any unused sick leave accumulated at the time of retirement will be converted to credited service at a rate of 0.004 years of service for each day of sick leave.
• The final compensation is the monthly average of the member’s highest 36 or 12 consecutive months’ full-time
equivalent monthly pay (no matter which CalPERS employer paid this compensation). The standard benefit is 36 months. Employers had the option of providing a final compensation equal to the highest 12 consecutive months for classic plans only. Final compensation must be defined by the highest 36 consecutive months’ pay under the 1.5% at 65 formula. PEPRA members have a cap on the annual salary that can be used to calculate final compensation for all new members based on the Social Security contribution and benefit base. For employees that participate in Social Security this cap is $126,291 for 2020 and for those employees that do not participate in Social Security the cap for 2020 is $151,549. Adjustments to the caps are permitted annually based on changes to the CPI for all urban consumers.
• Employees must be covered by Social Security with the 1.5% at 65 formula. Social Security is optional for all other
benefit formulas. For employees covered by Social Security, the modified formula is the standard benefit. Under this type of formula, the final compensation is offset by $133.33 (or by one third if the final compensation is less than $400). Employers may contract for the full benefit with Social Security that will eliminate the offset applicable to the final compensation. For employees not covered by Social Security, the full benefit is paid with no offsets.

CalPERS Actuarial Valuation – June 30, 2020 Appendix B Miscellaneous Plan of the City of Anaheim Principal Plan Provisions
B-3
Auxiliary organizations of the CSUC system may elect reduced contribution rates, in which case the offset is $317 if members are not covered by Social Security or $513 if members are covered by Social Security.
• The miscellaneous and PEPRA safety service retirement benefit is not capped. The classic Safety service retirement
benefit is capped at 90% of final compensation.
Vested Deferred Retirement Eligibility for Deferred Status A CalPERS member becomes eligible for a deferred vested retirement benefit when he or she leaves employment, keeps his or her contribution account balance on deposit with CalPERS, and has earned at least 5 years of credited service (total service across all CalPERS employers, and with certain other retirement systems with which CalPERS has reciprocity agreements). Eligibility to Start Receiving Benefits The CalPERS classic members and PEPRA safety members become eligible to receive the deferred retirement benefit upon satisfying the eligibility requirements for deferred status and upon attainment of age 50 (55 for employees hired into a 1.5% @ 65 plan). PEPRA miscellaneous members become eligible to receive the deferred retirement benefit upon satisfying the eligibility requirements for deferred status and upon attainment of age 52. Benefit The vested deferred retirement benefit is the same as the service retirement benefit, where the benefit factor is based on the member’s age at allowance commencement. For members who have earned service with multiple CalPERS employers, the benefit from each employer is calculated separately according to each employer’s contract, and then added together for the total allowance.
Non-Industrial (Non-Job Related) Disability Retirement Eligibility A CalPERS member is eligible for Non-Industrial Disability Retirement if he or she becomes disabled and has at least 5 years of credited service (total service across all CalPERS employers, and with certain other retirement systems with which CalPERS has reciprocity agreements). There is no special age requirement. Disabled means the member is unable to perform his or her job because of an illness or injury, which is expected to be permanent or to last indefinitely. The illness or injury does not have to be job related. A CalPERS member must be actively employed by any CalPERS employer at the time of disability in order to be eligible for this benefit. Standard Benefit
The standard Non-Industrial Disability Retirement benefit is a monthly allowance equal to 1.8% of final compensation, multiplied by service, which is determined as follows: • Service is CalPERS credited service, for members with less than 10 years of service or greater than 18.518 years
of service; or • Service is CalPERS credited service plus the additional number of years that the member would have worked until
age 60, for members with at least 10 years but not more than 18.518 years of service. The maximum benefit in this case is 33⅓% of final compensation.

CalPERS Actuarial Valuation – June 30, 2020 Appendix B Miscellaneous Plan of the City of Anaheim Principal Plan Provisions
B-4
Improved Benefit Employers have the option of providing the improved Non-Industrial Disability Retirement benefit. This benefit provides a monthly allowance equal to 30% of final compensation for the first 5 years of service, plus 1% for each additional year of service to a maximum of 50% of final compensation. Members who are eligible for a larger service retirement benefit may choose to receive that benefit in lieu of a disability benefit. Members eligible to retire, and who have attained the normal retirement age determined by their service retirement benefit formula, will receive the same dollar amount for disability retirement as that payable for service retirement. For members who have earned service with multiple CalPERS employers, the benefit attributed to each employer is the total disability allowance multiplied by the ratio of service with a particular employer to the total CalPERS service.
Industrial (Job Related) Disability Retirement All safety members have this benefit. For miscellaneous members, employers have the option of providing this benefit. An employer may choose to provide the increased benefit option or the improved benefit option. Eligibility An employee is eligible for Industrial Disability Retirement if he or she becomes disabled while working, where disabled means the member is unable to perform the duties of the job because of a work-related illness or injury, which is expected to be permanent or to last indefinitely. A CalPERS member who has left active employment within this group is not eligible for this benefit, except to the extent described below. Standard Benefit The standard Industrial Disability Retirement benefit is a monthly allowance equal to 50% of final compensation. Increased Benefit (75% of Final Compensation) The increased Industrial Disability Retirement benefit is a monthly allowance equal to 75 percent final compensation for total disability. Improved Benefit (50% to 90% of Final Compensation) The improved Industrial Disability Retirement benefit is a monthly allowance equal to the Workman’s Compensation Appeals Board permanent disability rate percentage (if 50% or greater, with a maximum of 90%) times the final compensation. For a CalPERS member not actively employed in this group who became disabled while employed by some other CalPERS employer, the benefit is a return of accumulated member contributions with respect to employment in this group. With the standard or increased benefit, a member may also choose to receive the annuitization of the accumulated member contributions. If a member is eligible for service retirement and if the service retirement benefit is more than the industrial disability retirement benefit, the member may choose to receive the larger benefit.

CalPERS Actuarial Valuation – June 30, 2020 Appendix B Miscellaneous Plan of the City of Anaheim Principal Plan Provisions
B-5
Post-Retirement Death Benefit Standard Lump Sum Payment Upon the death of a retiree, a one-time lump sum payment of $500 will be made to the retiree’s designated survivor(s), or to the retiree’s estate.
Improved Lump Sum Payment Employers have the option of providing an improved lump sum death benefit of $600, $2,000, $3,000, $4,000 or $5,000.
Form of Payment for Retirement Allowance
Standard Form of Payment Generally, the retirement allowance is paid to the retiree in the form of an annuity for as long as he or she is alive. The retiree may choose to provide for a portion of his or her allowance to be paid to any designated beneficiary after the retiree’s death. CalPERS provides for a variety of such benefit options, which the retiree pays for by taking a reduction in his or her retirement allowance. Such reduction takes into account the amount to be provided to the beneficiary and the probable duration of payments (based on the ages of the member and beneficiary) made subsequent to the member’s death.
Improved Form of Payment (Post-Retirement Survivor Allowance) Employers have the option to contract for the post-retirement survivor allowance.
For retirement allowances with respect to service subject to the modified formula, 25% of the retirement allowance will automatically be continued to certain statutory beneficiaries upon the death of the retiree, without a reduction in the retiree’s allowance. For retirement allowances with respect to service subject to the full or supplemental formula, 50% of the retirement allowance will automatically be continued to certain statutory beneficiaries upon the death of the retiree, without a reduction in the retiree’s allowance. This additional benefit is referred to as post-retirement survivor allowance (PRSA) or simply as survivor continuance.
In other words, 25% or 50% of the allowance, the continuance portion, is paid to the retiree for as long as he or she is alive, and that same amount is continued to the retiree’s spouse (or if no eligible spouse, to unmarried child(ren) until they attain age 18; or, if no eligible child(ren), to a qualifying dependent parent) for the rest of his or her lifetime. This benefit will not be discontinued in the event the spouse remarries. The remaining 75% or 50% of the retirement allowance, which may be referred to as the option portion of the benefit, is paid to the retiree as an annuity for as long as he or she is alive. Or, the retiree may choose to provide for some of this option portion to be paid to any designated beneficiary after the retiree’s death. Benefit options applicable to the
option portion are the same as those offered with the standard form. The reduction is calculated in the same manner but is applied only to the option portion.
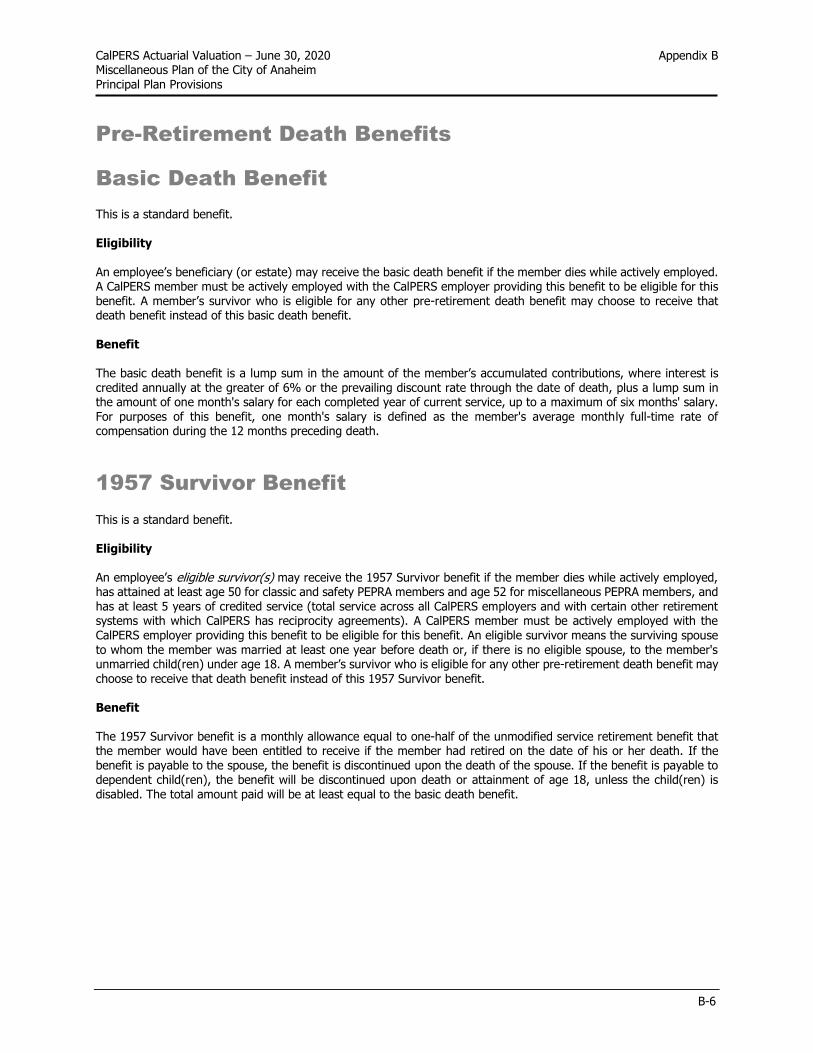
CalPERS Actuarial Valuation – June 30, 2020 Appendix B Miscellaneous Plan of the City of Anaheim Principal Plan Provisions
B-6
Pre-Retirement Death Benefits
Basic Death Benefit This is a standard benefit. Eligibility An employee’s beneficiary (or estate) may receive the basic death benefit if the member dies while actively employed. A CalPERS member must be actively employed with the CalPERS employer providing this benefit to be eligible for this benefit. A member’s survivor who is eligible for any other pre-retirement death benefit may choose to receive that death benefit instead of this basic death benefit.
Benefit The basic death benefit is a lump sum in the amount of the member’s accumulated contributions, where interest is credited annually at the greater of 6% or the prevailing discount rate through the date of death, plus a lump sum in the amount of one month's salary for each completed year of current service, up to a maximum of six months' salary. For purposes of this benefit, one month's salary is defined as the member's average monthly full-time rate of compensation during the 12 months preceding death.
1957 Survivor Benefit This is a standard benefit. Eligibility An employee’s eligible survivor(s) may receive the 1957 Survivor benefit if the member dies while actively employed, has attained at least age 50 for classic and safety PEPRA members and age 52 for miscellaneous PEPRA members, and has at least 5 years of credited service (total service across all CalPERS employers and with certain other retirement systems with which CalPERS has reciprocity agreements). A CalPERS member must be actively employed with the CalPERS employer providing this benefit to be eligible for this benefit. An eligible survivor means the surviving spouse to whom the member was married at least one year before death or, if there is no eligible spouse, to the member's unmarried child(ren) under age 18. A member’s survivor who is eligible for any other pre-retirement death benefit may choose to receive that death benefit instead of this 1957 Survivor benefit. Benefit The 1957 Survivor benefit is a monthly allowance equal to one-half of the unmodified service retirement benefit that the member would have been entitled to receive if the member had retired on the date of his or her death. If the benefit is payable to the spouse, the benefit is discontinued upon the death of the spouse. If the benefit is payable to dependent child(ren), the benefit will be discontinued upon death or attainment of age 18, unless the child(ren) is disabled. The total amount paid will be at least equal to the basic death benefit.
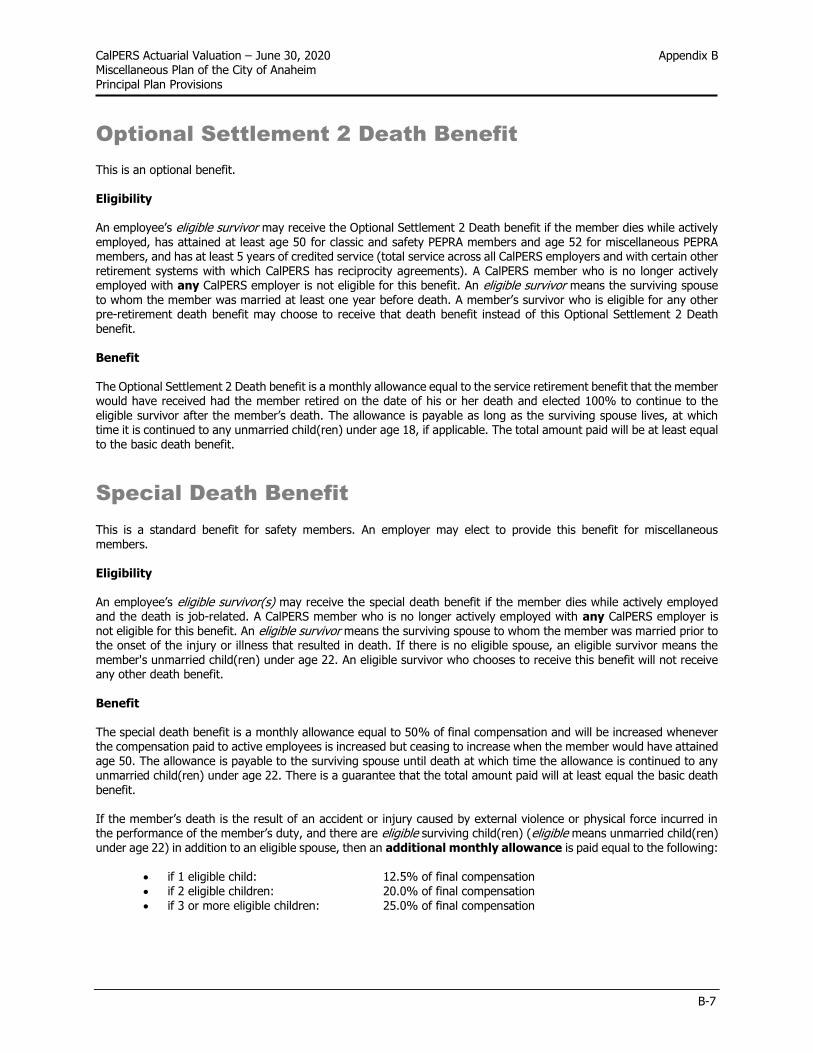
CalPERS Actuarial Valuation – June 30, 2020 Appendix B Miscellaneous Plan of the City of Anaheim Principal Plan Provisions
B-7
Optional Settlement 2 Death Benefit This is an optional benefit. Eligibility An employee’s eligible survivor may receive the Optional Settlement 2 Death benefit if the member dies while actively employed, has attained at least age 50 for classic and safety PEPRA members and age 52 for miscellaneous PEPRA members, and has at least 5 years of credited service (total service across all CalPERS employers and with certain other retirement systems with which CalPERS has reciprocity agreements). A CalPERS member who is no longer actively employed with any CalPERS employer is not eligible for this benefit. An eligible survivor means the surviving spouse to whom the member was married at least one year before death. A member’s survivor who is eligible for any other pre-retirement death benefit may choose to receive that death benefit instead of this Optional Settlement 2 Death benefit. Benefit The Optional Settlement 2 Death benefit is a monthly allowance equal to the service retirement benefit that the member would have received had the member retired on the date of his or her death and elected 100% to continue to the eligible survivor after the member’s death. The allowance is payable as long as the surviving spouse lives, at which time it is continued to any unmarried child(ren) under age 18, if applicable. The total amount paid will be at least equal to the basic death benefit.
Special Death Benefit This is a standard benefit for safety members. An employer may elect to provide this benefit for miscellaneous members. Eligibility An employee’s eligible survivor(s) may receive the special death benefit if the member dies while actively employed and the death is job-related. A CalPERS member who is no longer actively employed with any CalPERS employer is not eligible for this benefit. An eligible survivor means the surviving spouse to whom the member was married prior to the onset of the injury or illness that resulted in death. If there is no eligible spouse, an eligible survivor means the member's unmarried child(ren) under age 22. An eligible survivor who chooses to receive this benefit will not receive any other death benefit. Benefit The special death benefit is a monthly allowance equal to 50% of final compensation and will be increased whenever the compensation paid to active employees is increased but ceasing to increase when the member would have attained age 50. The allowance is payable to the surviving spouse until death at which time the allowance is continued to any unmarried child(ren) under age 22. There is a guarantee that the total amount paid will at least equal the basic death benefit. If the member’s death is the result of an accident or injury caused by external violence or physical force incurred in the performance of the member’s duty, and there are eligible surviving child(ren) (eligible means unmarried child(ren) under age 22) in addition to an eligible spouse, then an additional monthly allowance is paid equal to the following:
• if 1 eligible child: 12.5% of final compensation • if 2 eligible children: 20.0% of final compensation • if 3 or more eligible children: 25.0% of final compensation
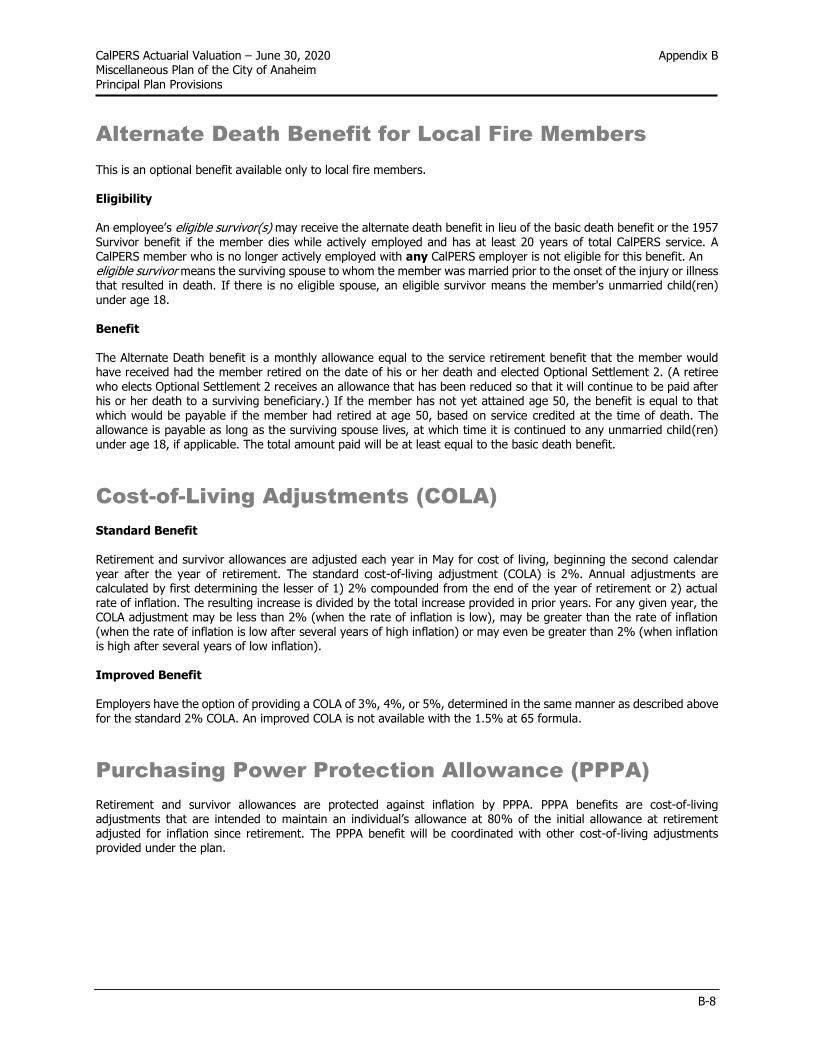
CalPERS Actuarial Valuation – June 30, 2020 Appendix B Miscellaneous Plan of the City of Anaheim Principal Plan Provisions
B-8
Alternate Death Benefit for Local Fire Members This is an optional benefit available only to local fire members. Eligibility An employee’s eligible survivor(s) may receive the alternate death benefit in lieu of the basic death benefit or the 1957 Survivor benefit if the member dies while actively employed and has at least 20 years of total CalPERS service. A CalPERS member who is no longer actively employed with any CalPERS employer is not eligible for this benefit. An eligible survivor means the surviving spouse to whom the member was married prior to the onset of the injury or illness that resulted in death. If there is no eligible spouse, an eligible survivor means the member's unmarried child(ren) under age 18. Benefit The Alternate Death benefit is a monthly allowance equal to the service retirement benefit that the member would have received had the member retired on the date of his or her death and elected Optional Settlement 2. (A retiree who elects Optional Settlement 2 receives an allowance that has been reduced so that it will continue to be paid after his or her death to a surviving beneficiary.) If the member has not yet attained age 50, the benefit is equal to that which would be payable if the member had retired at age 50, based on service credited at the time of death. The allowance is payable as long as the surviving spouse lives, at which time it is continued to any unmarried child(ren) under age 18, if applicable. The total amount paid will be at least equal to the basic death benefit.
Cost-of-Living Adjustments (COLA)
Standard Benefit Retirement and survivor allowances are adjusted each year in May for cost of living, beginning the second calendar year after the year of retirement. The standard cost-of-living adjustment (COLA) is 2%. Annual adjustments are calculated by first determining the lesser of 1) 2% compounded from the end of the year of retirement or 2) actual rate of inflation. The resulting increase is divided by the total increase provided in prior years. For any given year, the COLA adjustment may be less than 2% (when the rate of inflation is low), may be greater than the rate of inflation (when the rate of inflation is low after several years of high inflation) or may even be greater than 2% (when inflation is high after several years of low inflation). Improved Benefit Employers have the option of providing a COLA of 3%, 4%, or 5%, determined in the same manner as described above for the standard 2% COLA. An improved COLA is not available with the 1.5% at 65 formula.
Purchasing Power Protection Allowance (PPPA)
Retirement and survivor allowances are protected against inflation by PPPA. PPPA benefits are cost-of-living adjustments that are intended to maintain an individual’s allowance at 80% of the initial allowance at retirement adjusted for inflation since retirement. The PPPA benefit will be coordinated with other cost-of-living adjustments provided under the plan.
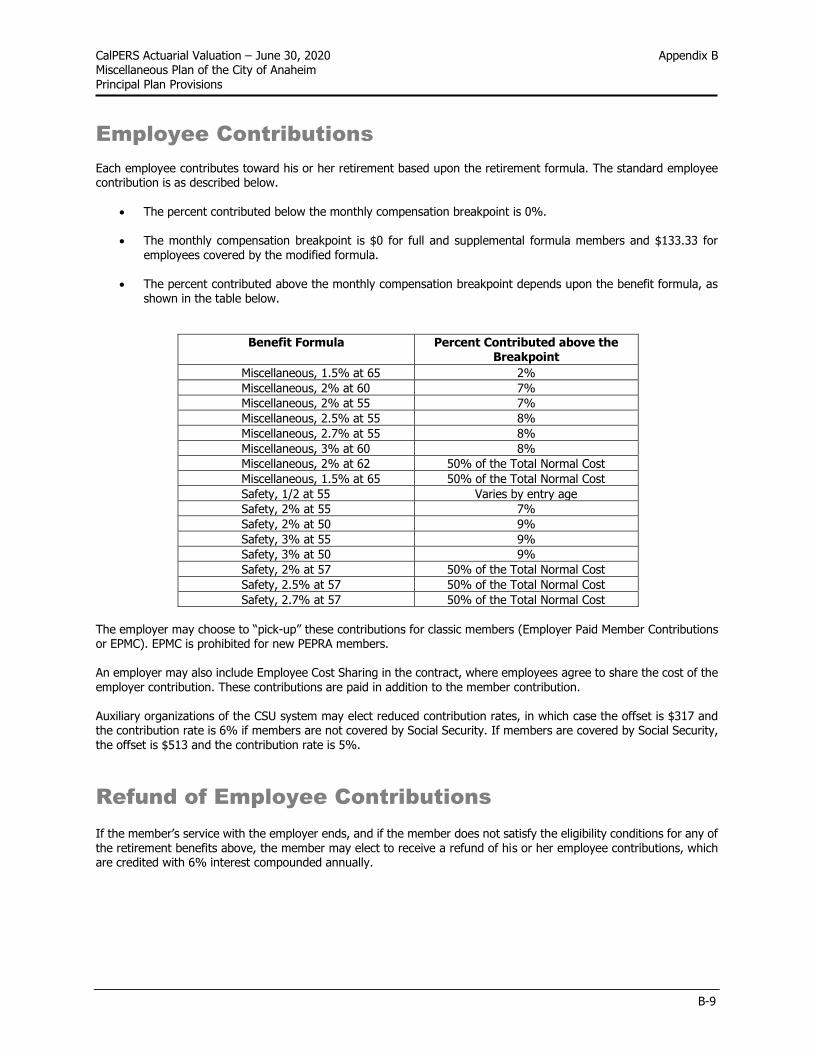
CalPERS Actuarial Valuation – June 30, 2020 Appendix B Miscellaneous Plan of the City of Anaheim Principal Plan Provisions
B-9
Employee Contributions
Each employee contributes toward his or her retirement based upon the retirement formula. The standard employee contribution is as described below.
• The percent contributed below the monthly compensation breakpoint is 0%.
• The monthly compensation breakpoint is $0 for full and supplemental formula members and $133.33 for employees covered by the modified formula.
• The percent contributed above the monthly compensation breakpoint depends upon the benefit formula, as
shown in the table below.
Benefit Formula Percent Contributed above the Breakpoint
Miscellaneous, 1.5% at 65 2%
Miscellaneous, 2% at 60 7%
Miscellaneous, 2% at 55 7%
Miscellaneous, 2.5% at 55 8%
Miscellaneous, 2.7% at 55 8%
Miscellaneous, 3% at 60 8%
Miscellaneous, 2% at 62 50% of the Total Normal Cost
Miscellaneous, 1.5% at 65 50% of the Total Normal Cost
Safety, 1/2 at 55 Varies by entry age
Safety, 2% at 55 7%
Safety, 2% at 50 9%
Safety, 3% at 55 9%
Safety, 3% at 50 9%
Safety, 2% at 57 50% of the Total Normal Cost
Safety, 2.5% at 57 50% of the Total Normal Cost
Safety, 2.7% at 57 50% of the Total Normal Cost
The employer may choose to “pick-up” these contributions for classic members (Employer Paid Member Contributions or EPMC). EPMC is prohibited for new PEPRA members. An employer may also include Employee Cost Sharing in the contract, where employees agree to share the cost of the employer contribution. These contributions are paid in addition to the member contribution. Auxiliary organizations of the CSU system may elect reduced contribution rates, in which case the offset is $317 and the contribution rate is 6% if members are not covered by Social Security. If members are covered by Social Security, the offset is $513 and the contribution rate is 5%.
Refund of Employee Contributions If the member’s service with the employer ends, and if the member does not satisfy the eligibility conditions for any of the retirement benefits above, the member may elect to receive a refund of his or her employee contributions, which are credited with 6% interest compounded annually.

CalPERS Actuarial Valuation – June 30, 2020 Appendix B Miscellaneous Plan of the City of Anaheim Principal Plan Provisions
B-10
1959 Survivor Benefit This is a pre-retirement death benefit available only to members not covered by Social Security. Any agency joining CalPERS subsequent to 1993 is required to provide this benefit if the members are not covered by Social Security. The benefit is optional for agencies joining CalPERS prior to 1994. Levels 1, 2 and 3 are now closed. Any new agency or any agency wishing to add this benefit or increase the current level may only choose the 4th or Indexed Level. This benefit is not included in the results presented in this valuation. More information on this benefit is available on the CalPERS website.

Appendix C
Participant Data
• Summary of Valuation Data
• Active Members
• Transferred and Terminated Members
• Retired Members and Beneficiaries

CalPERS Actuarial Valuation – June 30, 2020 Appendix C Miscellaneous Plan of the City of Anaheim Participant Data
C-1
Summary of Valuation Data
June 30, 2019 June 30, 2020
1. Active Members
a) Counts 1,772 1,716
b) Average Attained Age
44.55 44.64
c) Average Entry Age to Rate Plan 34.01 33.78
d) Average Years of Credited Service 10.00 10.33
e) Average Annual Covered Pay $70,184 $72,669
f) Annual Covered Payroll 124,365,666 124,700,170
g) Projected Annual Payroll for Contribution Year 134,910,574 135,273,441
h) Present Value of Future Payroll 1,036,376,727 1,038,367,218
2. Transferred Members
a) Counts 673 685
b) Average Attained Age 43.51 43.53
c) Average Years of Credited Service 2.97 2.94
d) Average Annual Covered Pay $95,416 $101,134
3. Terminated Members
a) Counts 946 1,044
b) Average Attained Age 45.71 45.95
c) Average Years of Credited Service 2.67 2.68
d) Average Annual Covered Pay $45,991 $46,038
4. Retired Members and Beneficiaries
a) Counts 2,191 2,229
b) Average Attained Age 70.73 70.92
c) Average Annual Benefits $33,718 $34,602
5. Active to Retired Ratio [(1a) / (4a)] 0.81 0.77
Counts of members included in the valuation are counts of the records processed by the valuation. Multiple records may exist for those who have service in more than one valuation group. This does not result in double counting of liabilities. Average Annual Benefits represents benefit amounts payable by this plan only. Some members may have service with another agency and would therefore have a larger total benefit than would be included as part of the average shown here.
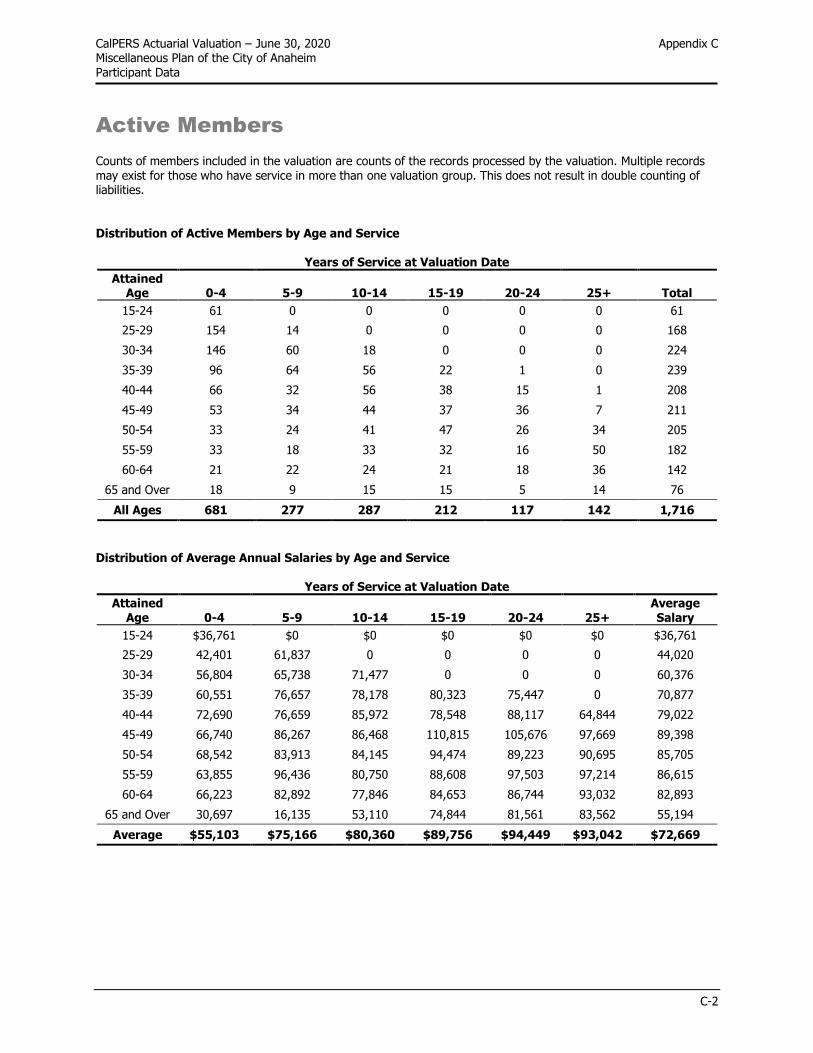
CalPERS Actuarial Valuation – June 30, 2020 Appendix C Miscellaneous Plan of the City of Anaheim Participant Data
C-2
Active Members Counts of members included in the valuation are counts of the records processed by the valuation. Multiple records may exist for those who have service in more than one valuation group. This does not result in double counting of liabilities. Distribution of Active Members by Age and Service
Years of Service at Valuation Date
Attained Age 0-4 5-9 10-14 15-19 20-24 25+ Total
15-24 61 0 0 0 0 0 61
25-29 154 14 0 0 0 0 168
30-34 146 60 18 0 0 0 224
35-39 96 64 56 22 1 0 239
40-44 66 32 56 38 15 1 208
45-49 53 34 44 37 36 7 211
50-54 33 24 41 47 26 34 205
55-59 33 18 33 32 16 50 182
60-64 21 22 24 21 18 36 142
65 and Over 18 9 15 15 5 14 76
All Ages 681 277 287 212 117 142 1,716
Distribution of Average Annual Salaries by Age and Service
Years of Service at Valuation Date
Attained Age 0-4 5-9 10-14 15-19 20-24 25+
Average Salary
15-24 $36,761 $0 $0 $0 $0 $0 $36,761
25-29 42,401 61,837 0 0 0 0 44,020
30-34 56,804 65,738 71,477 0 0 0 60,376
35-39 60,551 76,657 78,178 80,323 75,447 0 70,877
40-44 72,690 76,659 85,972 78,548 88,117 64,844 79,022
45-49 66,740 86,267 86,468 110,815 105,676 97,669 89,398
50-54 68,542 83,913 84,145 94,474 89,223 90,695 85,705
55-59 63,855 96,436 80,750 88,608 97,503 97,214 86,615
60-64 66,223 82,892 77,846 84,653 86,744 93,032 82,893
65 and Over 30,697 16,135 53,110 74,844 81,561 83,562 55,194
Average $55,103 $75,166 $80,360 $89,756 $94,449 $93,042 $72,669
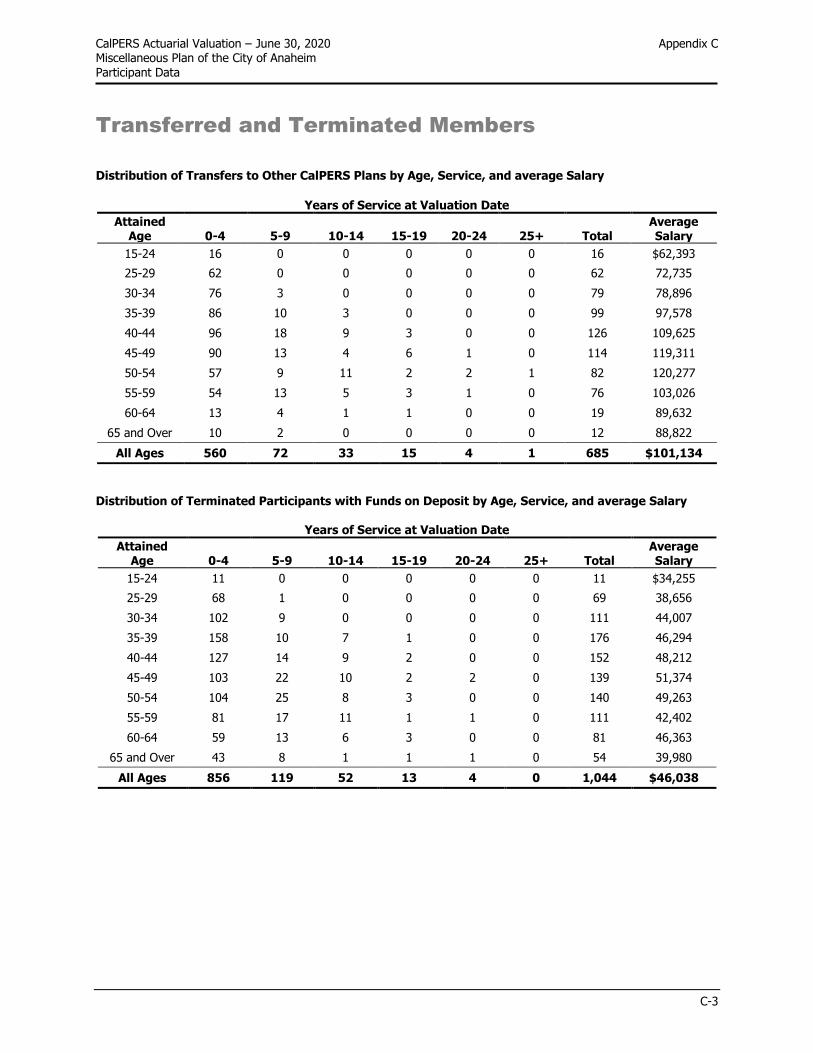
CalPERS Actuarial Valuation – June 30, 2020 Appendix C Miscellaneous Plan of the City of Anaheim Participant Data
C-3
Transferred and Terminated Members Distribution of Transfers to Other CalPERS Plans by Age, Service, and average Salary
Years of Service at Valuation Date
Attained Age 0-4 5-9 10-14 15-19 20-24 25+ Total
Average Salary
15-24 16 0 0 0 0 0 16 $62,393
25-29 62 0 0 0 0 0 62 72,735
30-34 76 3 0 0 0 0 79 78,896
35-39 86 10 3 0 0 0 99 97,578
40-44 96 18 9 3 0 0 126 109,625
45-49 90 13 4 6 1 0 114 119,311
50-54 57 9 11 2 2 1 82 120,277
55-59 54 13 5 3 1 0 76 103,026
60-64 13 4 1 1 0 0 19 89,632
65 and Over 10 2 0 0 0 0 12 88,822
All Ages 560 72 33 15 4 1 685 $101,134
Distribution of Terminated Participants with Funds on Deposit by Age, Service, and average Salary
Years of Service at Valuation Date
Attained Age 0-4 5-9 10-14 15-19 20-24 25+ Total
Average Salary
15-24 11 0 0 0 0 0 11 $34,255
25-29 68 1 0 0 0 0 69 38,656
30-34 102 9 0 0 0 0 111 44,007
35-39 158 10 7 1 0 0 176 46,294
40-44 127 14 9 2 0 0 152 48,212
45-49 103 22 10 2 2 0 139 51,374
50-54 104 25 8 3 0 0 140 49,263
55-59 81 17 11 1 1 0 111 42,402
60-64 59 13 6 3 0 0 81 46,363
65 and Over 43 8 1 1 1 0 54 39,980
All Ages 856 119 52 13 4 0 1,044 $46,038
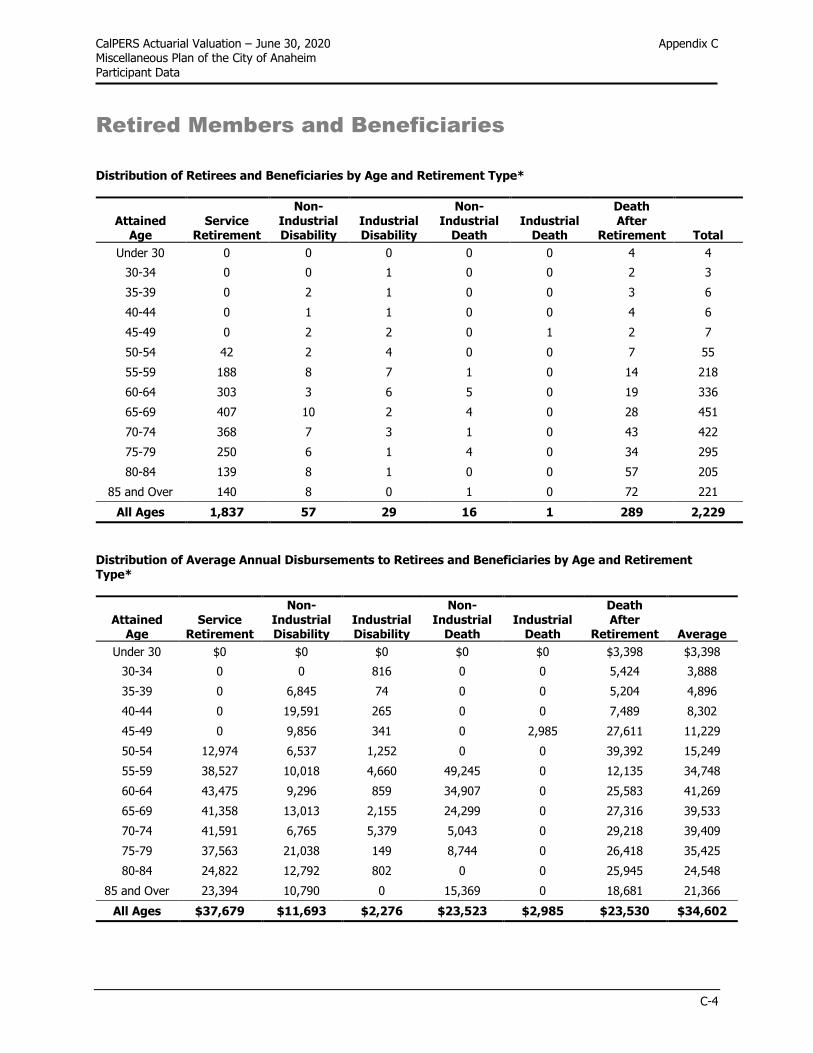
CalPERS Actuarial Valuation – June 30, 2020 Appendix C Miscellaneous Plan of the City of Anaheim Participant Data
C-4
Retired Members and Beneficiaries
Distribution of Retirees and Beneficiaries by Age and Retirement Type*
Attained Age
Service Retirement
Non-Industrial Disability
Industrial Disability
Non-Industrial
Death Industrial
Death
Death After
Retirement Total
Under 30 0 0 0 0 0 4 4
30-34 0 0 1 0 0 2 3
35-39 0 2 1 0 0 3 6
40-44 0 1 1 0 0 4 6
45-49 0 2 2 0 1 2 7
50-54 42 2 4 0 0 7 55
55-59 188 8 7 1 0 14 218
60-64 303 3 6 5 0 19 336
65-69 407 10 2 4 0 28 451
70-74 368 7 3 1 0 43 422
75-79 250 6 1 4 0 34 295
80-84 139 8 1 0 0 57 205
85 and Over 140 8 0 1 0 72 221
All Ages 1,837 57 29 16 1 289 2,229
Distribution of Average Annual Disbursements to Retirees and Beneficiaries by Age and Retirement Type*
Attained Age
Service Retirement
Non-Industrial Disability
Industrial Disability
Non-Industrial
Death Industrial
Death
Death After
Retirement Average
Under 30 $0 $0 $0 $0 $0 $3,398 $3,398
30-34 0 0 816 0 0 5,424 3,888
35-39 0 6,845 74 0 0 5,204 4,896
40-44 0 19,591 265 0 0 7,489 8,302
45-49 0 9,856 341 0 2,985 27,611 11,229
50-54 12,974 6,537 1,252 0 0 39,392 15,249
55-59 38,527 10,018 4,660 49,245 0 12,135 34,748
60-64 43,475 9,296 859 34,907 0 25,583 41,269
65-69 41,358 13,013 2,155 24,299 0 27,316 39,533
70-74 41,591 6,765 5,379 5,043 0 29,218 39,409
75-79 37,563 21,038 149 8,744 0 26,418 35,425
80-84 24,822 12,792 802 0 0 25,945 24,548
85 and Over 23,394 10,790 0 15,369 0 18,681 21,366
All Ages $37,679 $11,693 $2,276 $23,523 $2,985 $23,530 $34,602

CalPERS Actuarial Valuation – June 30, 2020 Appendix C Miscellaneous Plan of the City of Anaheim Participant Data
C-5
Retired Members and Beneficiaries (continued) Distribution of Retirees and Beneficiaries by Years Retired and Retirement Type*
Years Retired
Service Retirement
Non-Industrial Disability
Industrial Disability
Non-Industrial
Death Industrial
Death
Death After
Retirement Total
Under 5 Yrs 479 3 8 3 1 103 597
5-9 455 4 5 3 0 68 535
10-14 393 1 6 6 0 54 460
15-19 251 10 6 4 0 30 301
20-24 109 13 0 0 0 16 138
25-29 78 6 2 0 0 11 97
30 and Over 72 20 2 0 0 7 101
All Years 1,837 57 29 16 1 289 2,229
Distribution of Average Annual Disbursements to Retirees and Beneficiaries by Years Retired and Retirement Type*
Years Retired
Service Retirement
Non-Industrial Disability
Industrial Disability
Non-Industrial
Death Industrial
Death
Death After
Retirement Average
Under 5 Yrs $38,270 $13,417 $4,566 $32,953 $2,985 $30,464 $36,261
5-9 38,147 3,479 398 32,931 0 25,481 35,896
10-14 53,256 12,720 847 24,477 0 18,783 48,062
15-19 29,569 14,147 3,453 7,962 0 13,856 26,683
20-24 18,240 14,513 0 0 0 14,480 17,453
25-29 25,374 9,875 375 0 0 15,363 22,765
30 and Over 16,779 10,510 475 0 0 14,173 15,034
All Years $37,679 $11,693 $2,276 $23,523 $2,985 $23,530 $34,602
* Counts of members do not include alternate payees receiving benefits while the member is still working. Therefore, the total counts may not match information on C-1 of the report. Multiple records may exist for those who have service in more than one coverage group. This does not result in double counting of liabilities.

Appendix D
Glossary of Actuarial Terms
CalPERS Actuarial Valuation – June 30, 2020 Appendix D Miscellaneous Plan of the City of Anaheim Glossary of Actuarial Terms
D-1
Glossary of Actuarial Terms Accrued Liability (also called Actuarial Accrued Liability or Entry Age Actuarial Accrued Liability)
The total dollars needed as of the valuation date to fund all benefits earned in the past for current members. Actuarial Assumptions
Assumptions made about certain events that will affect pension costs. Assumptions generally can be broken down into two categories: demographic and economic. Demographic assumptions include such things as mortality, disability and retirement rates. Economic assumptions include discount rate, salary growth and inflation.
Actuarial Methods
Procedures employed by actuaries to achieve certain funding goals of a pension plan. Actuarial methods include funding method, setting the length of time to fund the Accrued Liability and determining the Value of Assets.
Actuarial Valuation
The determination as of a valuation date of the Normal Cost, Accrued Liability, and related actuarial present values for a pension plan. These valuations are performed annually or when an employer is contemplating a change to their plan provisions.
Amortization Bases
Separate payment schedules for different portions of the Unfunded Liability. The total Unfunded Liability of a Risk Pool or non-pooled plan can be segregated by cause, creating “bases,” and each such base will be separately amortized and paid for over a specific period of time. However, all bases are amortized using investment and payroll assumptions from the current valuation. This can be likened to a home having a first mortgage of 24 years remaining payments and a second mortgage that has 10 years remaining payments. Each base or each mortgage note has its own terms (payment period, principal, etc.).
Generally, in an actuarial valuation, the separate bases consist of changes in unfunded liability due to contract amendments, actuarial assumption changes, method changes, and/or gains and losses.
Amortization Period
The number of years required to pay off an Amortization Base. Classic Member (under PEPRA)
A classic member is a member who joined CalPERS prior to January 1, 2013 and who is not defined as a new member under PEPRA. (See definition of New Member below.)
Discount Rate
The assumed long-term rate of return on plan assets. This is the rate at which projected cash flows are discounted to the valuation date to determine Accrued Liability. This assumption is called “investment return” in earlier CalPERS reports and “actuarial interest rate” in Section 20014 of the California Public Employees’ Retirement Law (PERL).
Entry Age
The earliest age at which a plan member begins to accrue benefits under a defined benefit pension plan. In most cases, this is the age of the member on their date of hire.
Entry Age Actuarial Cost Method
An actuarial cost method designed to fund a member's total plan benefit over the course of his or her career. This method is designed to yield a rate expressed as a level percentage of payroll. (The assumed retirement age less the entry age is the amount of time required to fund a member’s total benefit. Generally, the older a member on the date of hire, the greater the entry age normal cost. This is mainly because there is less time to earn investment income to fund the future benefits.)
CalPERS Actuarial Valuation – June 30, 2020 Appendix D Miscellaneous Plan of the City of Anaheim Glossary of Actuarial Terms
D-2
Fresh Start
A Fresh Start is when multiple amortization bases are collapsed to one base and amortized together over a new funding period.
Funded Status
A measure of how well funded, or how "on track" a plan or risk pool is with respect to assets versus accrued liabilities. A ratio greater than 100% means the plan or risk pool has more assets than liabilities and a ratio less than 100% means liabilities are greater than assets.
GASB 68
Statement No. 68 of the Governmental Accounting Standards Board. The accounting standard governing a state or local governmental employer’s accounting and financial reporting for pensions. GASB 68 replaces GASB 27 effective the first fiscal year beginning after June 15, 2014.
New Member (under PEPRA) A new member includes an individual who becomes a member of a public retirement system for the first time on or after January 1, 2013, and who was not a member of another public retirement system prior to that date, and who is not subject to reciprocity with another public retirement system.
Normal Cost
The annual cost of service accrual for the upcoming fiscal year for active employees. The normal cost should be viewed as the long-term contribution rate.
Pension Actuary
A business professional that is authorized by the Society of Actuaries and the American Academy of Actuaries to perform the calculations necessary to properly fund a pension plan.
PEPRA
The California Public Employees’ Pension Reform Act of 2013 Present Value of Benefits (PVB)
The total dollars needed as of the valuation date to fund all benefits earned in the past or expected to be earned in the future for current members.
Unfunded Accrued Liability (UAL)
When a plan or pool’s value of assets is less than its Accrued Liability, the difference is the plan or pool’s Unfunded Accrued Liability (or unfunded liability). If the unfunded liability is positive, the plan or pool will have to pay contributions exceeding the Normal Cost.