louisiana medicaid ccn program actuarial briefing
TRANSCRIPT
www.mercer.com
Louisiana MedicaidCCN ProgramActuarial Briefing
April 19, 2011
Nicholas J. Simmons, FSA, MAAA
1Mercer
Meeting Agenda
DHH Opening Comments
CCN - P (Prepaid Model) Premium Rates and methodology
CCN – S (Shared savings Model) Savings Reconciliation methodology– Cost benchmarks– Case management fees
Both Models – Risk Adjustment
Questions and Answers after each topic
CCN – P (Prepaid Model)Rate Setting
3Mercer
Comparison to Draft Rates discussed in August 2010
Key Similarities– Underlying Methodology is still Fee-for-Serve (FFS) based– Rate Cell structure and Risk Adjustment Approach– Covered Groups– Covered Benefits
Key Differences– Base years for FFS data (changes many of the adjustments)– Regional Roll out schedule (results in different contract periods)– New FFS rate changes– Treatment of GME– Updated assumptions, notably trends– Competitive bid but rates will not be bid
We have not attempted a reconciliation to prior rates.
4Mercer
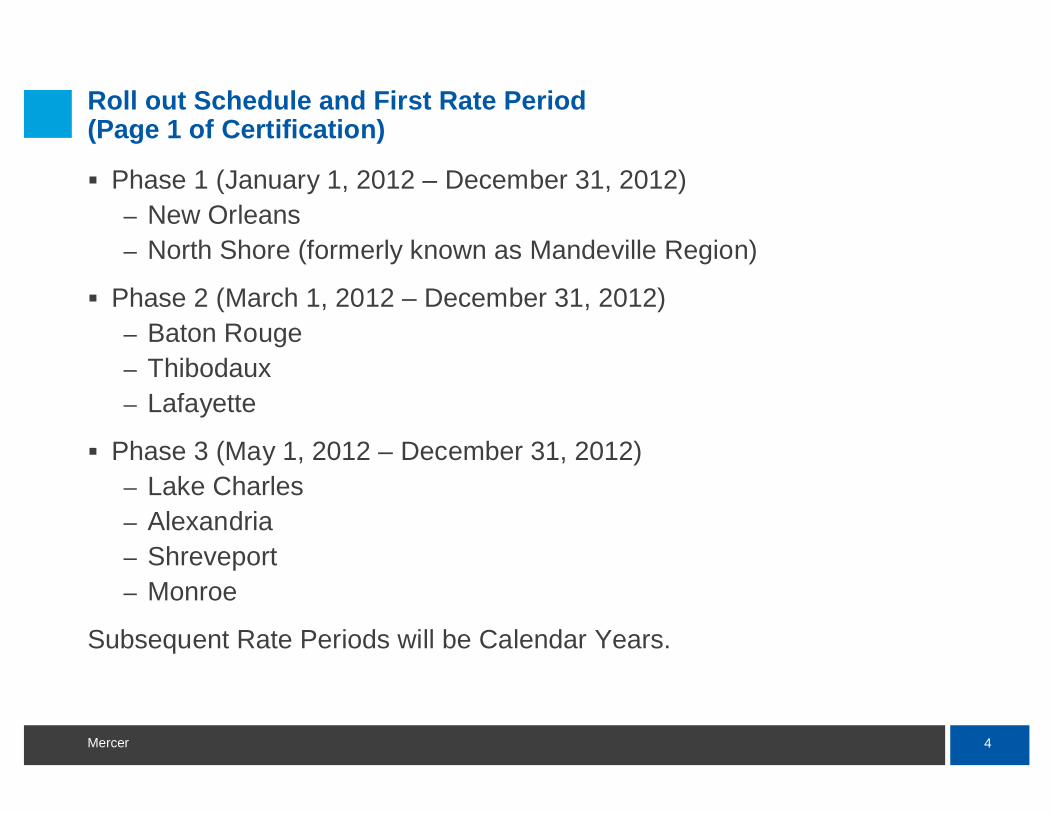
Roll out Schedule and First Rate Period(Page 1 of Certification)
Phase 1 (January 1, 2012 – December 31, 2012)– New Orleans– North Shore (formerly known as Mandeville Region)
Phase 2 (March 1, 2012 – December 31, 2012)– Baton Rouge– Thibodaux– Lafayette
Phase 3 (May 1, 2012 – December 31, 2012)– Lake Charles– Alexandria– Shreveport– Monroe
Subsequent Rate Periods will be Calendar Years.
5Mercer
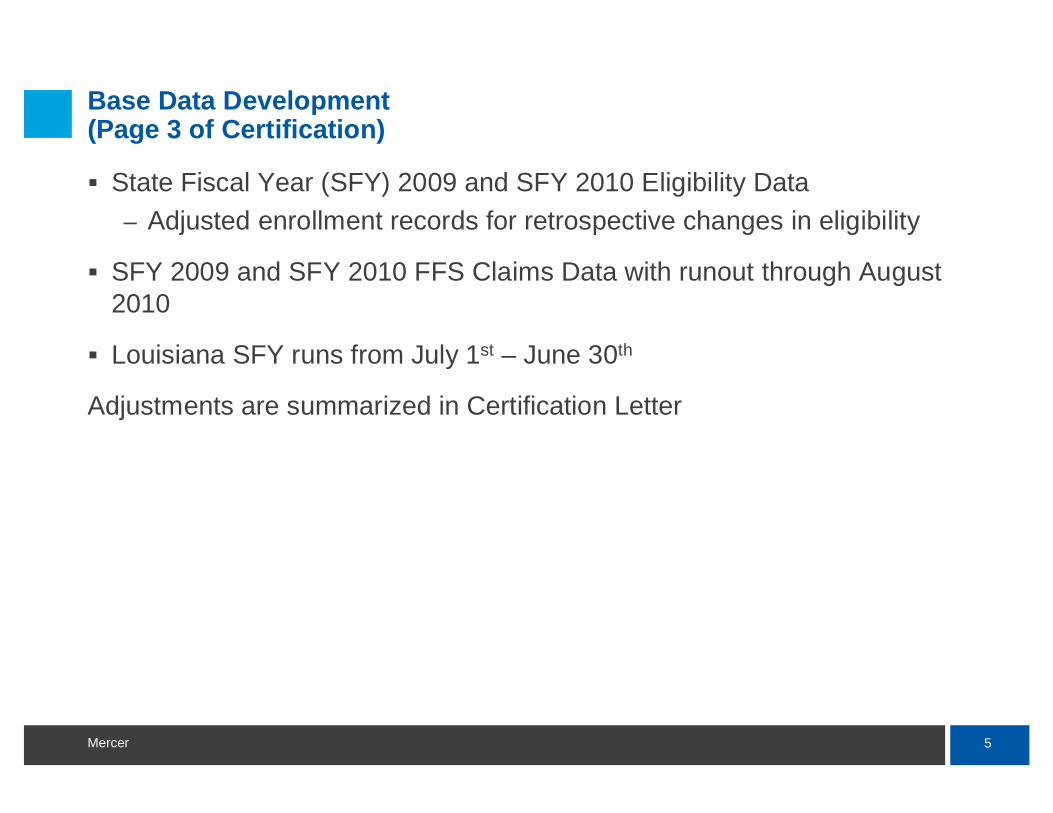
Base Data Development(Page 3 of Certification)
State Fiscal Year (SFY) 2009 and SFY 2010 Eligibility Data– Adjusted enrollment records for retrospective changes in eligibility
SFY 2009 and SFY 2010 FFS Claims Data with runout through August 2010
Louisiana SFY runs from July 1st – June 30th
Adjustments are summarized in Certification Letter
6Mercer
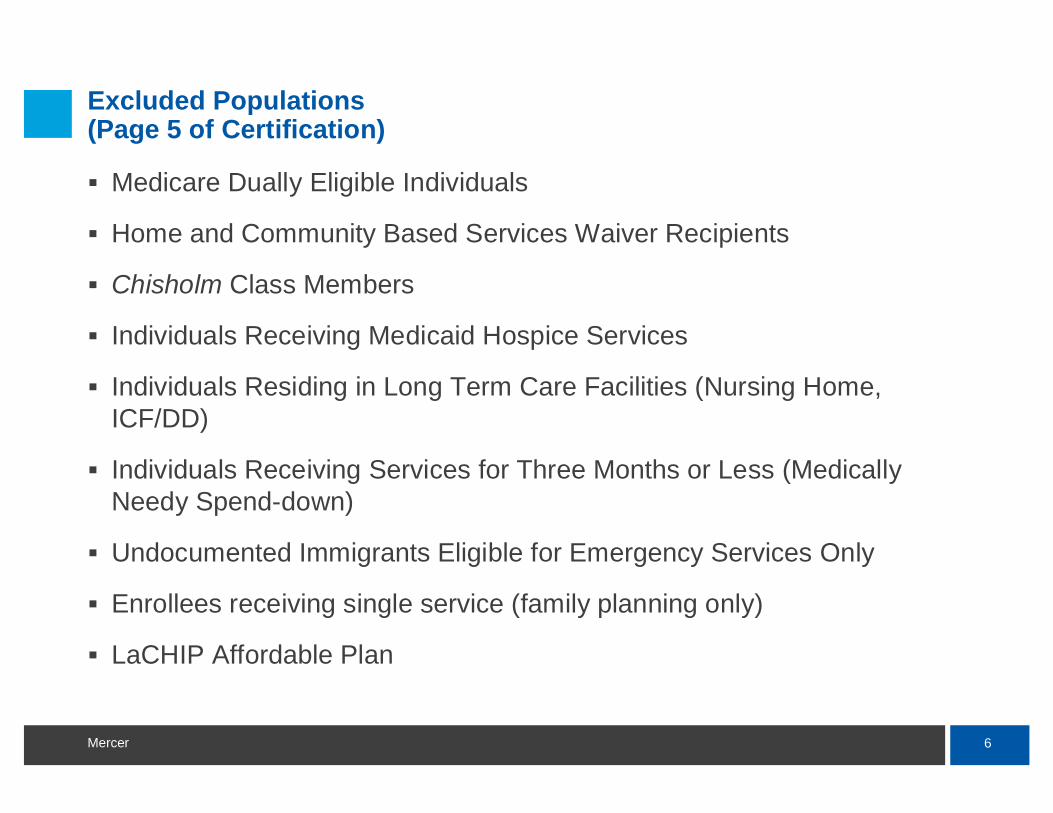
Excluded Populations (Page 5 of Certification)
Medicare Dually Eligible Individuals
Home and Community Based Services Waiver Recipients
Chisholm Class Members
Individuals Receiving Medicaid Hospice Services
Individuals Residing in Long Term Care Facilities (Nursing Home,ICF/DD)
Individuals Receiving Services for Three Months or Less (Medically Needy Spend-down)
Undocumented Immigrants Eligible for Emergency Services Only
Enrollees receiving single service (family planning only)
LaCHIP Affordable Plan

7Mercer
Excluded Services (Certification page 5)
School-based Individualized Education Plan Services provided by a school district and billed through the intermediate school district, or school-based services funded with certified public expenditures
Home and Community-Based Waiver Services
Specialized Behavioral Health
Targeted Case Management Services
Services provided through DHH’sEarly Steps Program
Dental Services
ICF/DD Services
Hospice
Personal Care Services (EPSDT and LT-PCS)
Nursing Facility Services
Pharmacy
Plans are required to provide all medically necessary services except for the following:
8Mercer
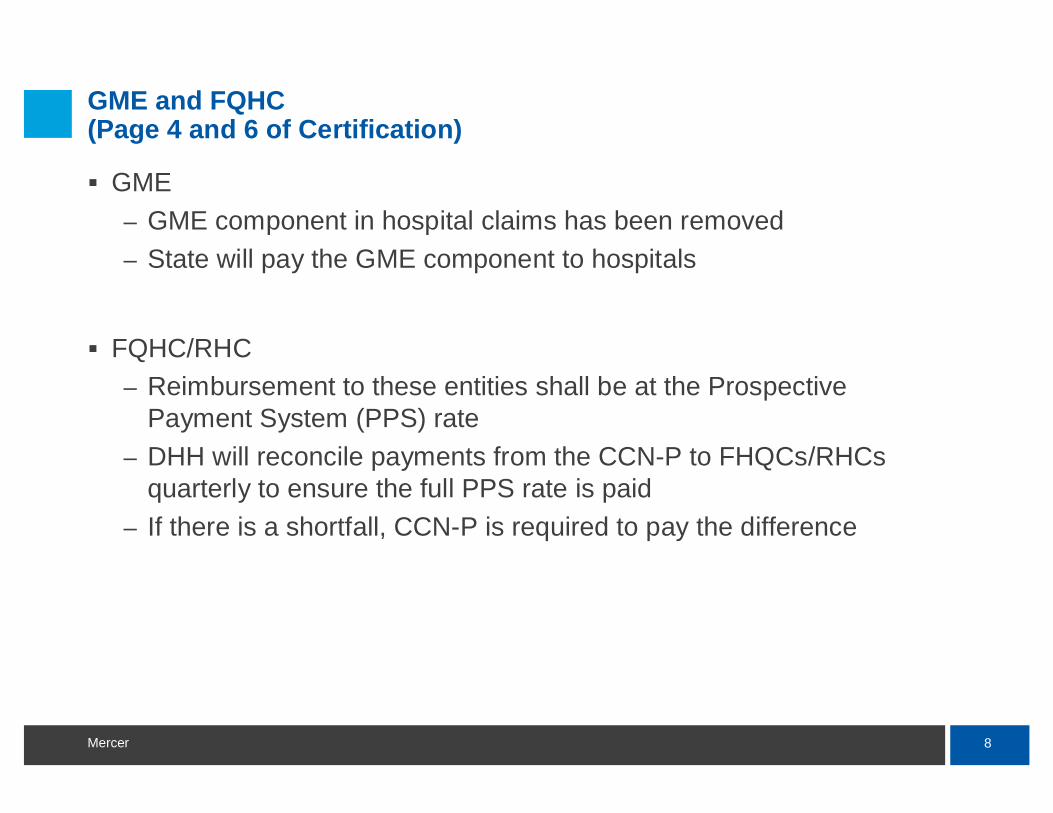
GME and FQHC(Page 4 and 6 of Certification)
GME– GME component in hospital claims has been removed– State will pay the GME component to hospitals
FQHC/RHC– Reimbursement to these entities shall be at the Prospective
Payment System (PPS) rate– DHH will reconcile payments from the CCN-P to FHQCs/RHCs
quarterly to ensure the full PPS rate is paid– If there is a shortfall, CCN-P is required to pay the difference
9Mercer
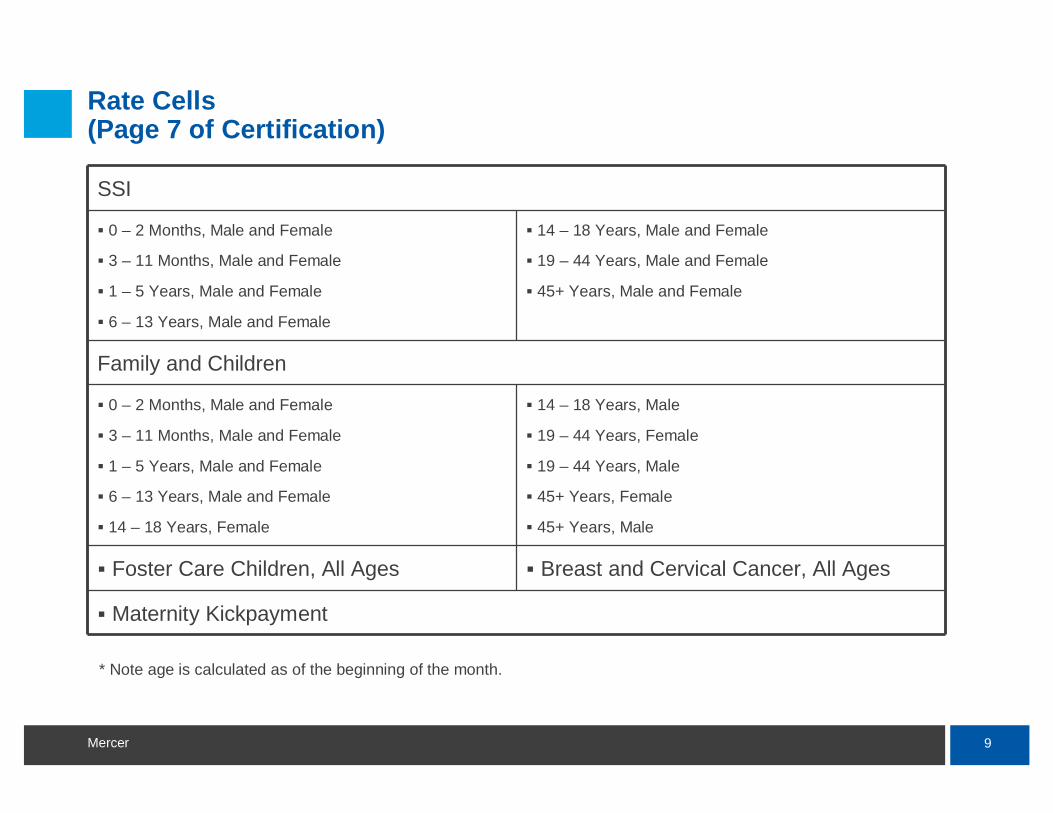
Rate Cells(Page 7 of Certification)
SSI
0 – 2 Months, Male and Female
3 – 11 Months, Male and Female
1 – 5 Years, Male and Female
6 – 13 Years, Male and Female
14 – 18 Years, Male and Female
19 – 44 Years, Male and Female
45+ Years, Male and Female
Family and Children
0 – 2 Months, Male and Female
3 – 11 Months, Male and Female
1 – 5 Years, Male and Female
6 – 13 Years, Male and Female
14 – 18 Years, Female
14 – 18 Years, Male
19 – 44 Years, Female
19 – 44 Years, Male
45+ Years, Female
45+ Years, Male
Foster Care Children, All Ages Breast and Cervical Cancer, All Ages
Maternity Kickpayment
* Note age is calculated as of the beginning of the month.
10Mercer
Trend Factors(Page 7 – 10 of Certification)
Trend factors were updated based on new data and significant actuarial judgment
Detailed tables are included in Certification (pages 8 – 10)
Unit Cost trend is set to zero for many categories where the effect of fee schedule changes is considered a programmatic adjustment
Programmatic changes are discussed in detail on pages 10 – 15 of certification. We also reverse engineered a capitation build up in Attachment B which includes columns for fee schedule changes
Overall annualized trend factor is 3.67%
11Mercer
Data Smoothing(Page 16 of Certification)
40/60 blend of SFY 2009 and SFY 2010 experience
Some blending of regional and statewide data for rate cells withsmaller enrollment. Details can be seen in Attachment B build up.
12Mercer
Managed Care Assumptions(Pages 16 – 20 of Certification)
Detailed assumptions are included in the tables and in the Attachment B build up.
Overall Impact is 14.69%
This reflects our best judgment of what needs to be achieved in context of existing delivery system and recognizes that this is the first year of prepaid networks.
13Mercer
Administration and Planned Underwriting Gain(Page 20 of Certification)
Overall assumed administrative cost of 10.0% of premium and planned underwriting gain of 1.8% of premium.
Applied as a loading of 6.4% to the Maternity Kick Payment and 12.7% to the age/gender cells.
14Mercer
Resulting Rates(Attachment A to Certification)
Rates are set out in Attachment A
A detailed rate build up exhibit has been approximated in Attachment B.
The attachments and all tables and references in the Certification reflect a single “target scenario”. Mercer used rate ranges to assure the actuarial soundness of the target scenario.
Rates will be risk adjusted in an actuarially sound manner to reflect health risk differences between the Prepaid networks and the Shared Savings networks as well as between the individual Prepaid Plans in any region.

15Mercer
Q & A

CCN – S (Shared Savings Model)Benchmarks and Rates
17Mercer
Comparison to discussion in August 2010
Key Similarities– Underlying Savings Reconciliation Methodology– Benchmarks based on a PMPM Cell structure– Risk Adjustment of Benchmarks– Covered Groups– Covered Benefits
Key Differences– Base years for FFS data (changes many of the adjustments)– Regional Roll out schedule (results in different contract periods)– New FFS rate changes– Updated assumptions, notably trends– Competitive bid but financial details will not be bid
We have not attempted a reconciliation to prior PMPMs.
18Mercer
Shared Savings Structure
A Benchmark Cost is developed based on the expected Fee-for-Service (FFS) cost absent the network
The benchmark cost is built up from specified PMPM amounts in age and gender cells
Actual costs, including case management fees, are compared to the benchmark
DHH retains the risk and pays claims on a FFS basis
Savings are shared with 60% going to the network
Savings are shared only if quality benchmarks are met
CMS considers the savings payout to be an incentive and limits to 5%
If there are no savings, plans will be required to pay back up to 50% of the management fee

19Mercer
Roll out Schedule(Page 1 of Benchmark Letter)
Phase 1 (January 1, 2012 – December 31, 2012)– New Orleans– North Shore (formerly known as Mandeville Region)
Phase 2 (March 1, 2012 – December 31, 2012)– Baton Rouge– Thibodaux– Lafayette
Phase 3 (May 1, 2012 – December 31, 2012)– Lake Charles– Alexandria– Shreveport– Monroe
Future benchmarks will be developed on Calendar Year basis
20Mercer
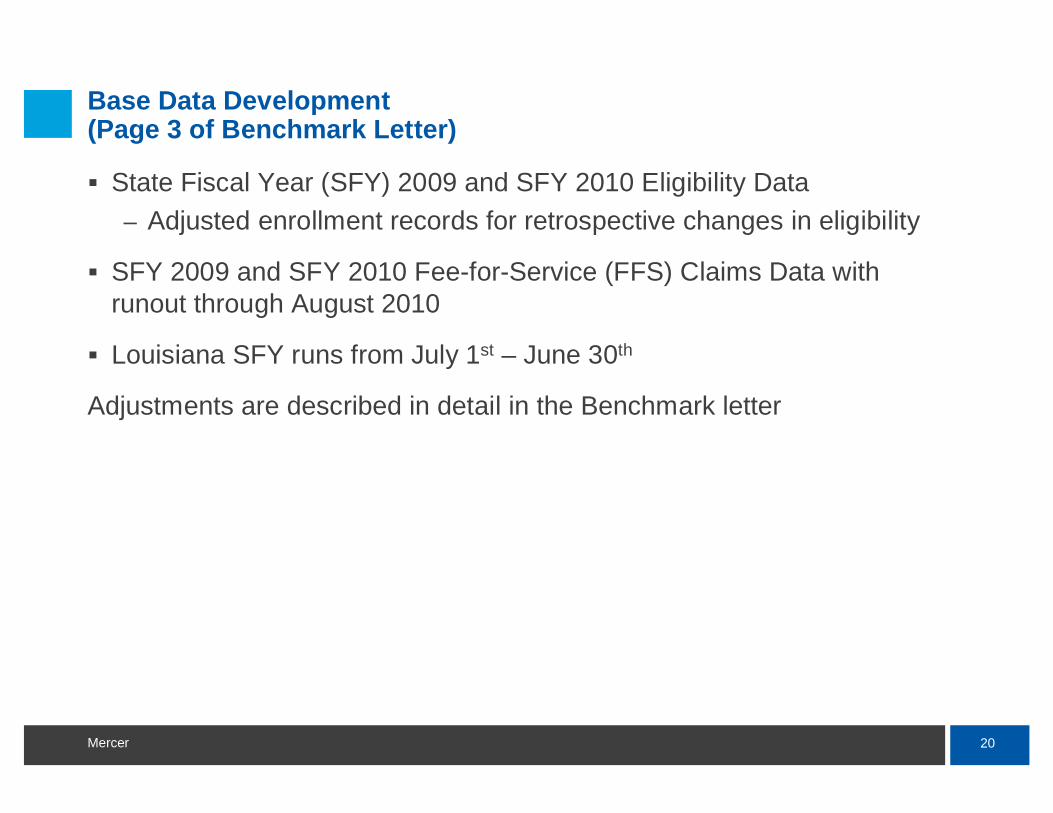
Base Data Development (Page 3 of Benchmark Letter)
State Fiscal Year (SFY) 2009 and SFY 2010 Eligibility Data– Adjusted enrollment records for retrospective changes in eligibility
SFY 2009 and SFY 2010 Fee-for-Service (FFS) Claims Data with runout through August 2010
Louisiana SFY runs from July 1st – June 30th
Adjustments are described in detail in the Benchmark letter
21Mercer
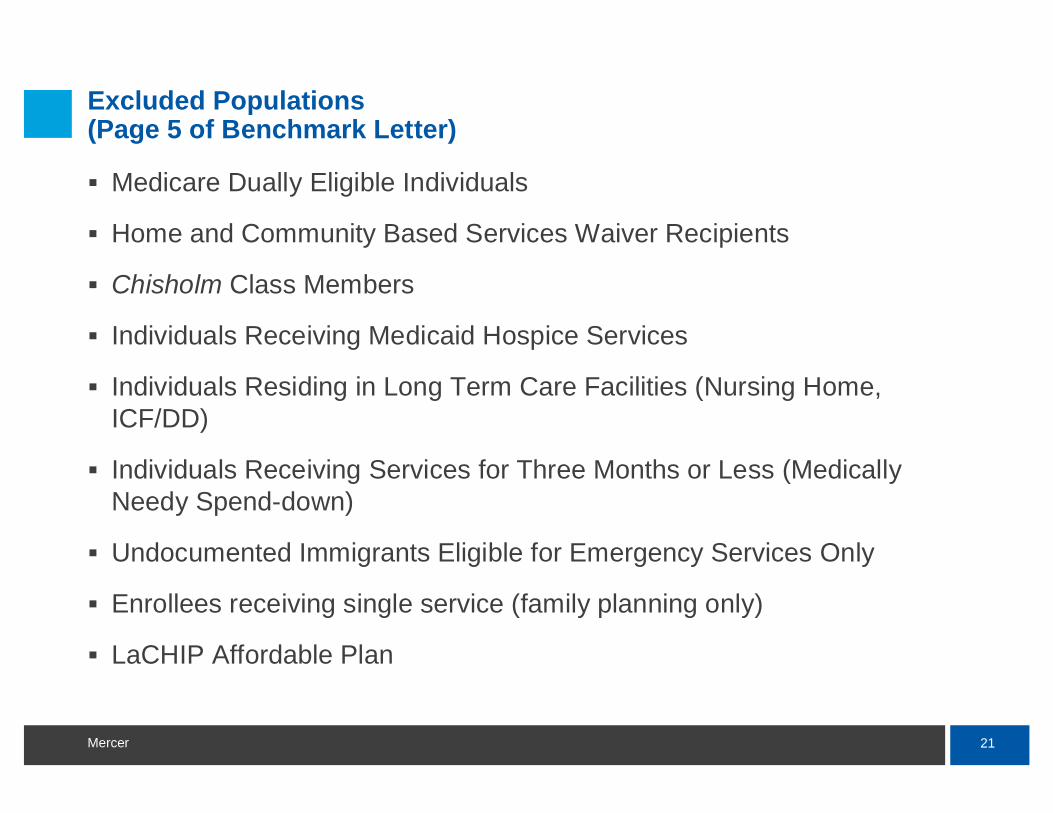
Excluded Populations (Page 5 of Benchmark Letter)
Medicare Dually Eligible Individuals
Home and Community Based Services Waiver Recipients
Chisholm Class Members
Individuals Receiving Medicaid Hospice Services
Individuals Residing in Long Term Care Facilities (Nursing Home,ICF/DD)
Individuals Receiving Services for Three Months or Less (Medically Needy Spend-down)
Undocumented Immigrants Eligible for Emergency Services Only
Enrollees receiving single service (family planning only)
LaCHIP Affordable Plan
22Mercer
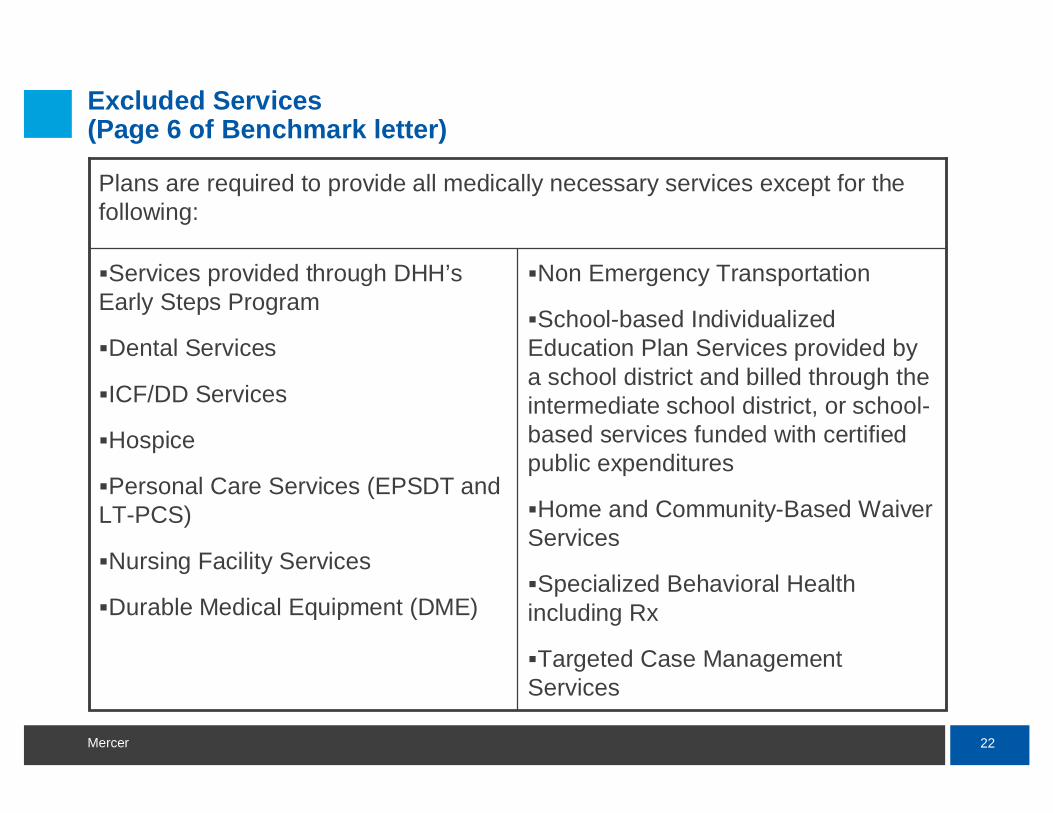
Excluded Services (Page 6 of Benchmark letter)
Non Emergency Transportation
School-based Individualized Education Plan Services provided by a school district and billed through the intermediate school district, or school-based services funded with certified public expenditures
Home and Community-Based Waiver Services
Specialized Behavioral Health including Rx
Targeted Case Management Services
Services provided through DHH’sEarly Steps Program
Dental Services
ICF/DD Services
Hospice
Personal Care Services (EPSDT and LT-PCS)
Nursing Facility Services
Durable Medical Equipment (DME)
Plans are required to provide all medically necessary services except for the following:
23Mercer
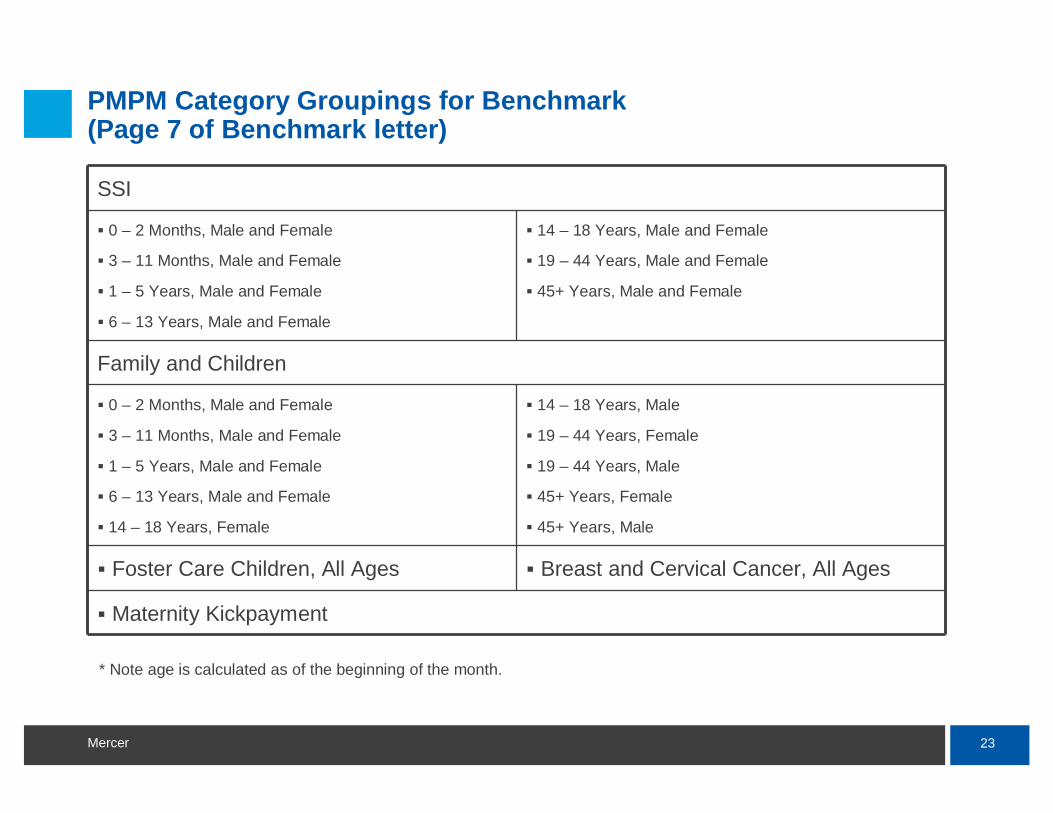
PMPM Category Groupings for Benchmark(Page 7 of Benchmark letter)
SSI
0 – 2 Months, Male and Female
3 – 11 Months, Male and Female
1 – 5 Years, Male and Female
6 – 13 Years, Male and Female
14 – 18 Years, Male and Female
19 – 44 Years, Male and Female
45+ Years, Male and Female
Family and Children
0 – 2 Months, Male and Female
3 – 11 Months, Male and Female
1 – 5 Years, Male and Female
6 – 13 Years, Male and Female
14 – 18 Years, Female
14 – 18 Years, Male
19 – 44 Years, Female
19 – 44 Years, Male
45+ Years, Female
45+ Years, Male
Foster Care Children, All Ages Breast and Cervical Cancer, All Ages
Maternity Kickpayment
* Note age is calculated as of the beginning of the month.
24Mercer
Trend Factors(Page 7 – 10 of Benchmark Letter)
Trend factors were updated based on new data and significant actuarial judgment
Detailed tables are included in Letter (pages 8 – 10)
Unit Cost trend is set to zero for many categories where the effect of fee schedule changes is considered a programmatic adjustment
Programmatic changes are discussed in detail on pages 10 – 13 of Letter. We also showed a PMPM build up in Attachment B which includes columns for fee schedule changes
Overall annualized trend factor is 3.39%
25Mercer
Data Smoothing(Page 13 of Letter)
40/60 blend of SFY 2009 and SFY 2010 experience
Some blending of regional and statewide data for rate cells withsmaller enrollment. Details can be seen in Attachment B build up.
Large claims are smoothed out by excluding amounts over $100,000for any recipient in any year from the reconciliation.

26Mercer
Resulting Benchmark PMPMs(Attachment A to Letter)
Rates are set out in Attachment A
A detailed PMPM build up exhibit has been approximated in Attachment B.
Rates will be risk adjusted in an actuarially sound manner to reflect health risk differences between the Prepaid networks and the Shared Savings networks as well as between the individual Shared Savings networks in any region.
Mercer and DHH will reconsider Benchmarks after Fiscal 2011 claims are available and may adjust if they appear too low or too high.
27Mercer
Case Management Fees(Page 7 of Fee Letter)
Case Management Fees have been established as:– TANF/LaCHIP $13.31 PMPM– SSI-related $19.66 PMPM
$1.50 of these amounts will be paid directly to the PCPs with remainder going to networks
Only the network share ($11.81 or $18.16) will be included in the savings reconciliation.
Build up of the network share by service is shown on page 6 of Fee letter

28Mercer
Q & A
Risk AdjustmentBoth Models
30Mercer
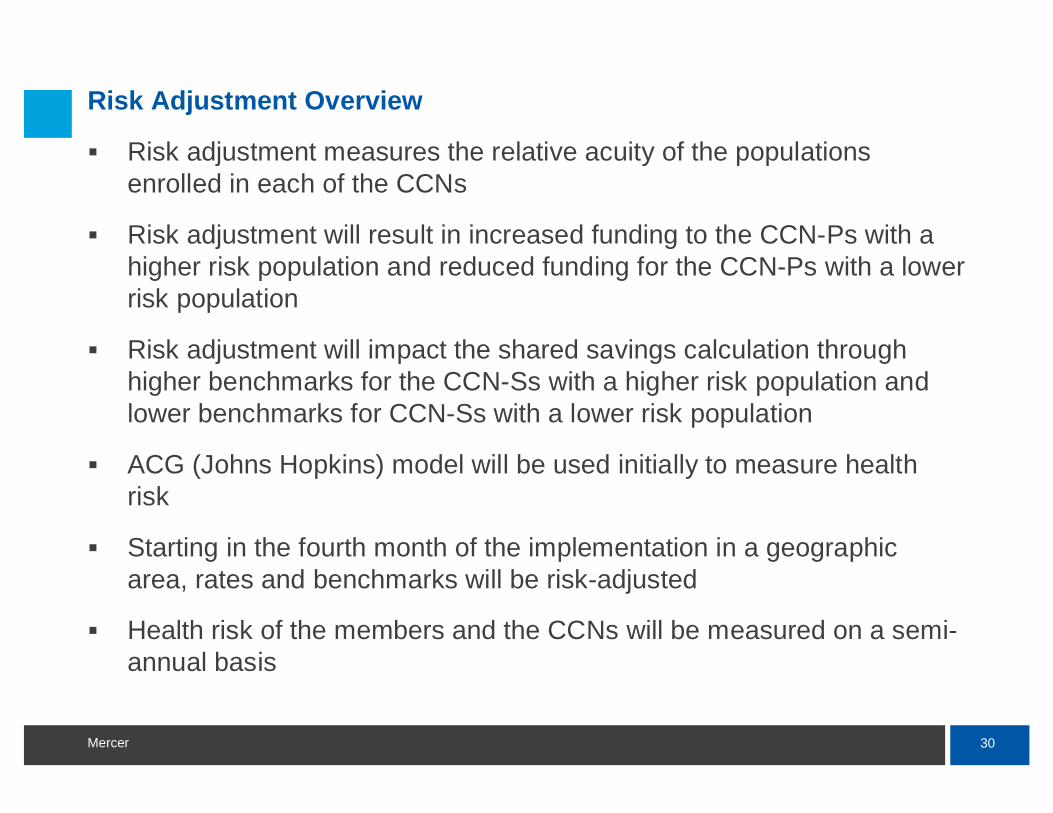
Risk Adjustment Overview
Risk adjustment measures the relative acuity of the populations enrolled in each of the CCNs
Risk adjustment will result in increased funding to the CCN-Ps with a higher risk population and reduced funding for the CCN-Ps with a lower risk population
Risk adjustment will impact the shared savings calculation through higher benchmarks for the CCN-Ss with a higher risk population and lower benchmarks for CCN-Ss with a lower risk population
ACG (Johns Hopkins) model will be used initially to measure health risk
Starting in the fourth month of the implementation in a geographic area, rates and benchmarks will be risk-adjusted
Health risk of the members and the CCNs will be measured on a semi-annual basis

31Mercer
Highlights of ACG Risk Adjustment Model
DHH selected the Adjusted Clinical Groups (ACGs) diagnosis-based system, developed by Johns Hopkins University, to assess the health risk of each Medicaid member
The ACG model uses ICD-9-CM or ICD-10-CM diagnoses codes documented on FFS claims or encounter data to assign members into approximately 100 mutually exclusive ACG categories based on pattern of morbidity, age, and gender
ACG model excludes diagnoses associated with laboratory, radiology services and durable medical equipment from disease classification
In most situations, only one diagnosis code is required to classify a member into a disease condition
A tentative decision has been made to require two or more instances of supporting diagnosis codes to classify select chronic conditions
32Mercer
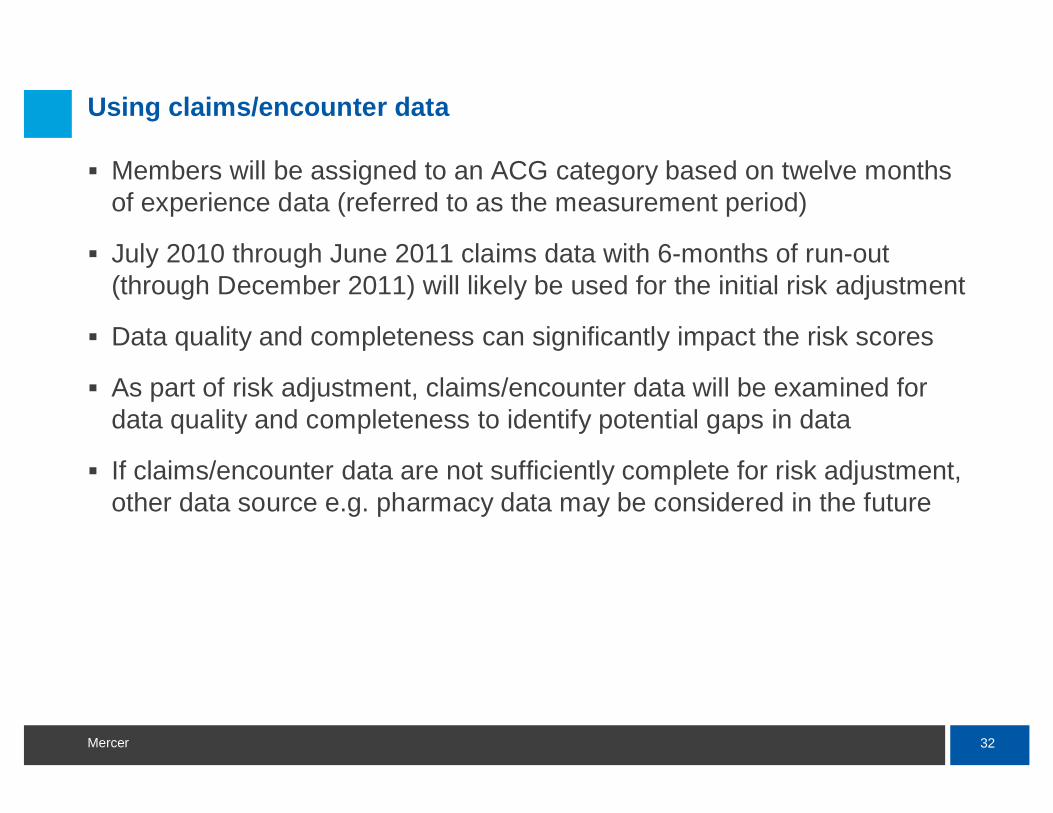
Using claims/encounter data
Members will be assigned to an ACG category based on twelve months of experience data (referred to as the measurement period)
July 2010 through June 2011 claims data with 6-months of run-out (through December 2011) will likely be used for the initial risk adjustment
Data quality and completeness can significantly impact the risk scores
As part of risk adjustment, claims/encounter data will be examined for data quality and completeness to identify potential gaps in data
If claims/encounter data are not sufficiently complete for risk adjustment, other data source e.g. pharmacy data may be considered in the future

33Mercer
Determining individual risk scores
Using the data within the twelve-month measurement period, members will be assigned to an ACG category
The cost weight associated with the assigned ACG category will serve as the individual’s risk score, which represents the expected health care costs to care for the individual member relative to the overall population
Members must have at least six months of eligibility during the twelve-month measurement period to receive a risk score– Six-month criteria does not require continuous eligibility
34Mercer
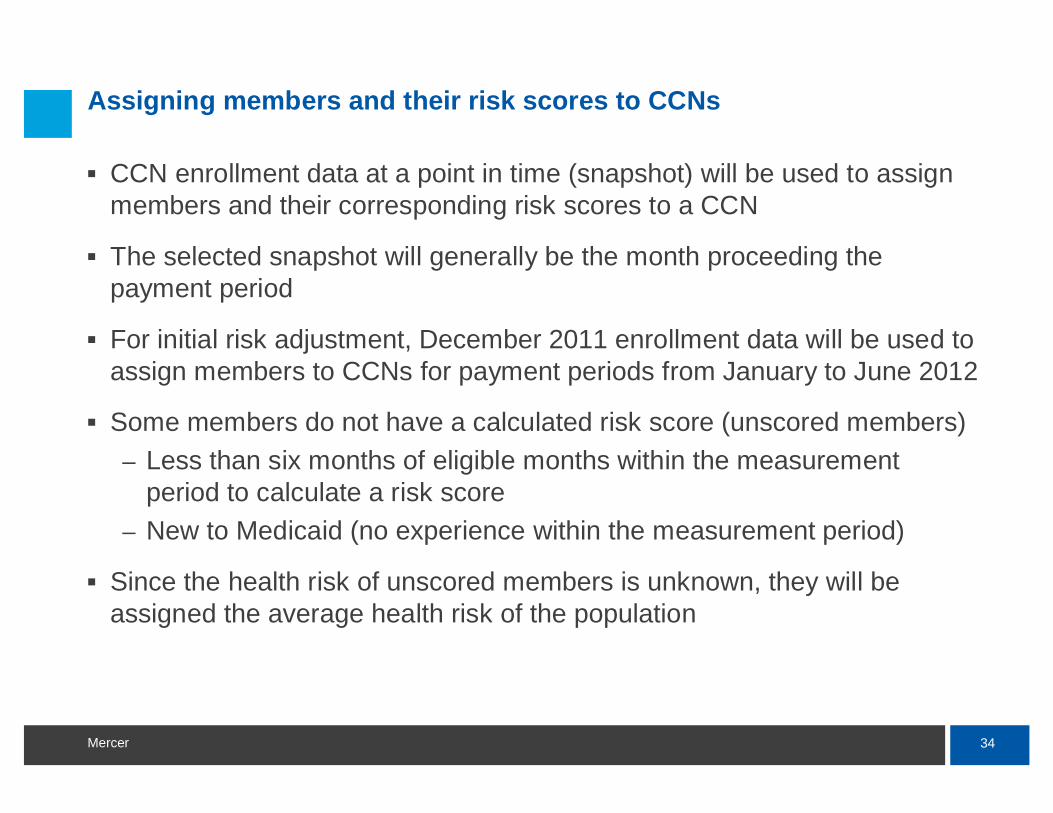
Assigning members and their risk scores to CCNs
CCN enrollment data at a point in time (snapshot) will be used to assign members and their corresponding risk scores to a CCN
The selected snapshot will generally be the month proceeding thepayment period
For initial risk adjustment, December 2011 enrollment data will be used to assign members to CCNs for payment periods from January to June 2012
Some members do not have a calculated risk score (unscored members)– Less than six months of eligible months within the measurement
period to calculate a risk score– New to Medicaid (no experience within the measurement period)
Since the health risk of unscored members is unknown, they will be assigned the average health risk of the population
35Mercer
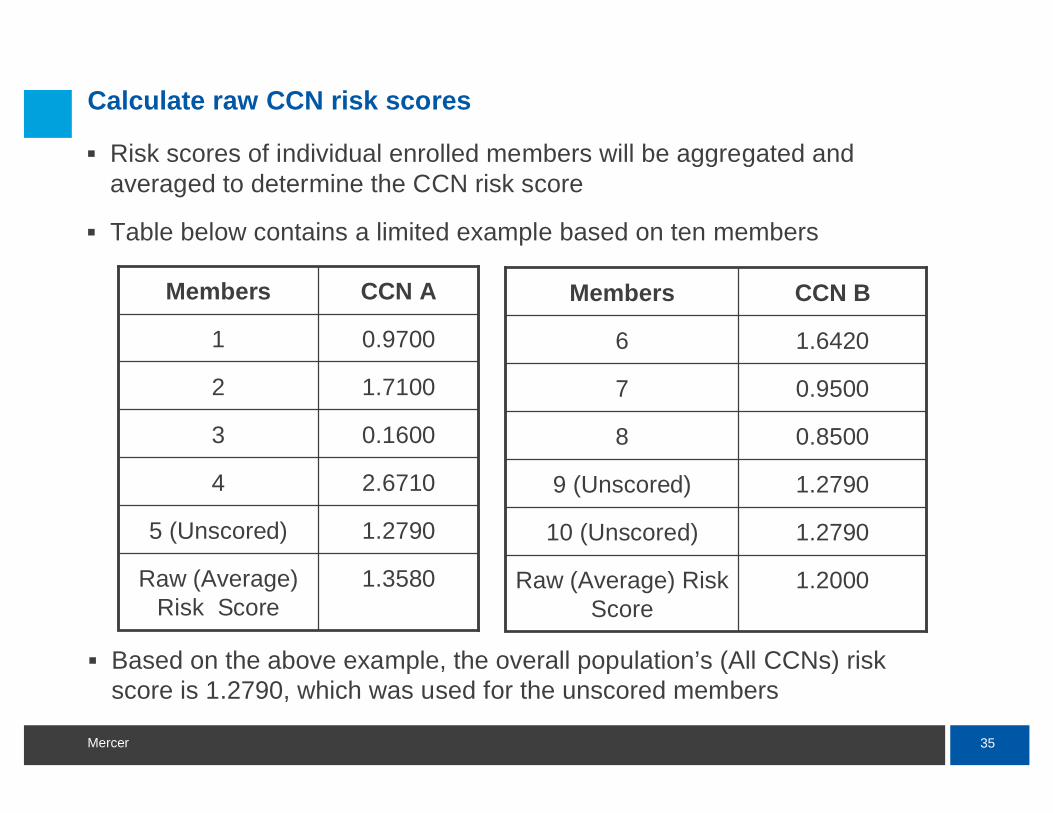
Calculate raw CCN risk scores
Risk scores of individual enrolled members will be aggregated and averaged to determine the CCN risk score
Table below contains a limited example based on ten members
1.3580Raw (Average) Risk Score
1.27905 (Unscored)
2.67104
0.16003
1.71002
0.97001
CCN AMembers
1.2000Raw (Average) Risk Score
1.279010 (Unscored)
1.27909 (Unscored)
0.85008
0.95007
1.64206
CCN BMembers
Based on the above example, the overall population’s (All CCNs) risk score is 1.2790, which was used for the unscored members
36Mercer
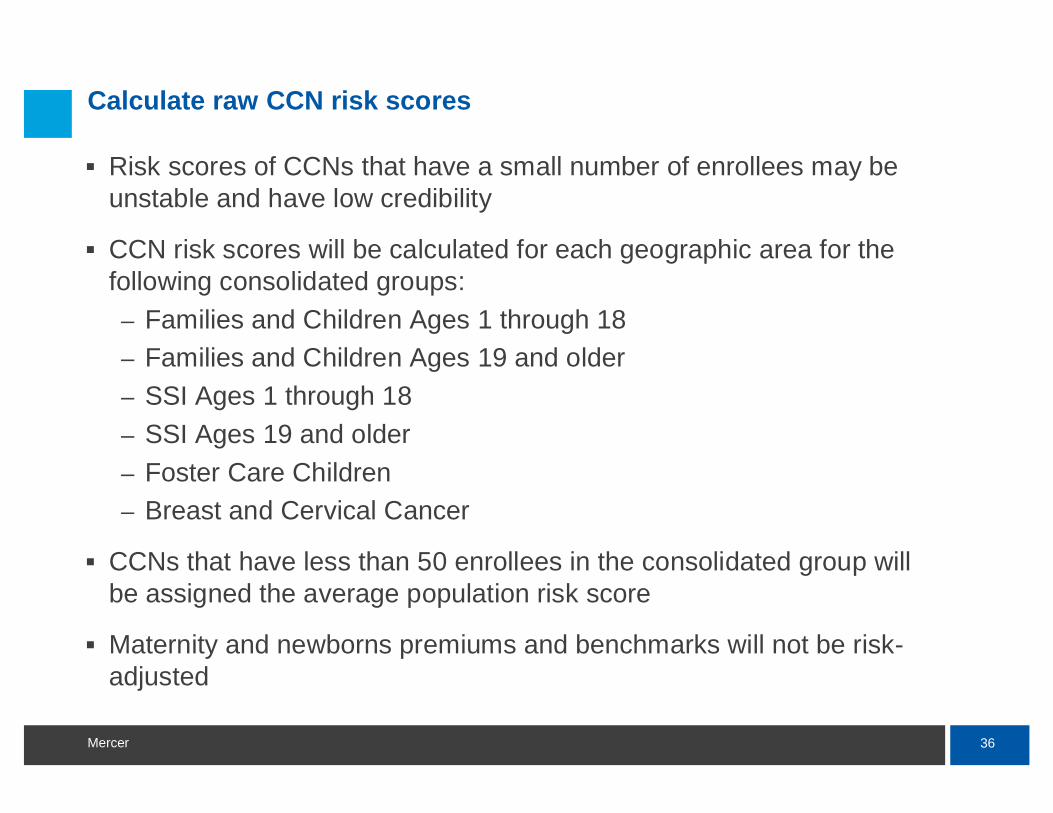
Calculate raw CCN risk scores
Risk scores of CCNs that have a small number of enrollees may beunstable and have low credibility
CCN risk scores will be calculated for each geographic area for the following consolidated groups:– Families and Children Ages 1 through 18– Families and Children Ages 19 and older– SSI Ages 1 through 18– SSI Ages 19 and older– Foster Care Children– Breast and Cervical Cancer
CCNs that have less than 50 enrollees in the consolidated group will be assigned the average population risk score
Maternity and newborns premiums and benchmarks will not be risk-adjusted
37Mercer
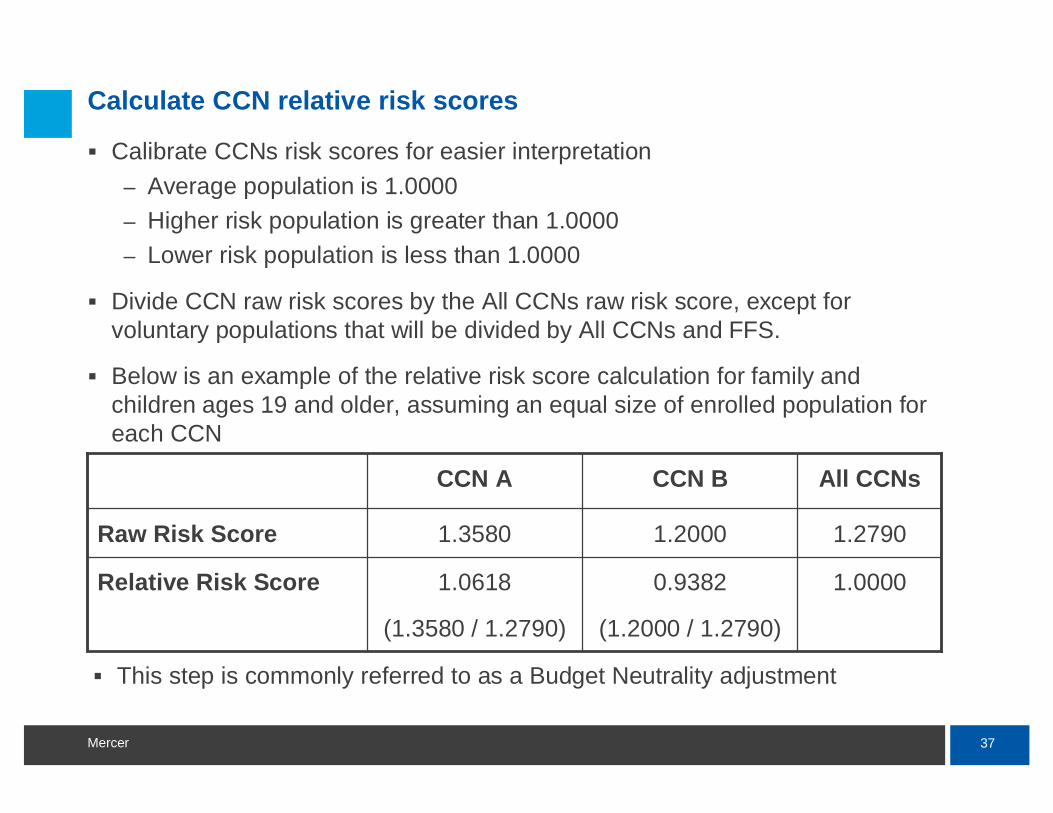
Calculate CCN relative risk scores
Calibrate CCNs risk scores for easier interpretation– Average population is 1.0000– Higher risk population is greater than 1.0000– Lower risk population is less than 1.0000
Divide CCN raw risk scores by the All CCNs raw risk score, except for voluntary populations that will be divided by All CCNs and FFS.
Below is an example of the relative risk score calculation for family and children ages 19 and older, assuming an equal size of enrolled population for each CCN
1.00000.9382
(1.2000 / 1.2790)
1.0618
(1.3580 / 1.2790)
Relative Risk Score
1.27901.20001.3580Raw Risk Score
All CCNsCCN BCCN A
This step is commonly referred to as a Budget Neutrality adjustment
38Mercer
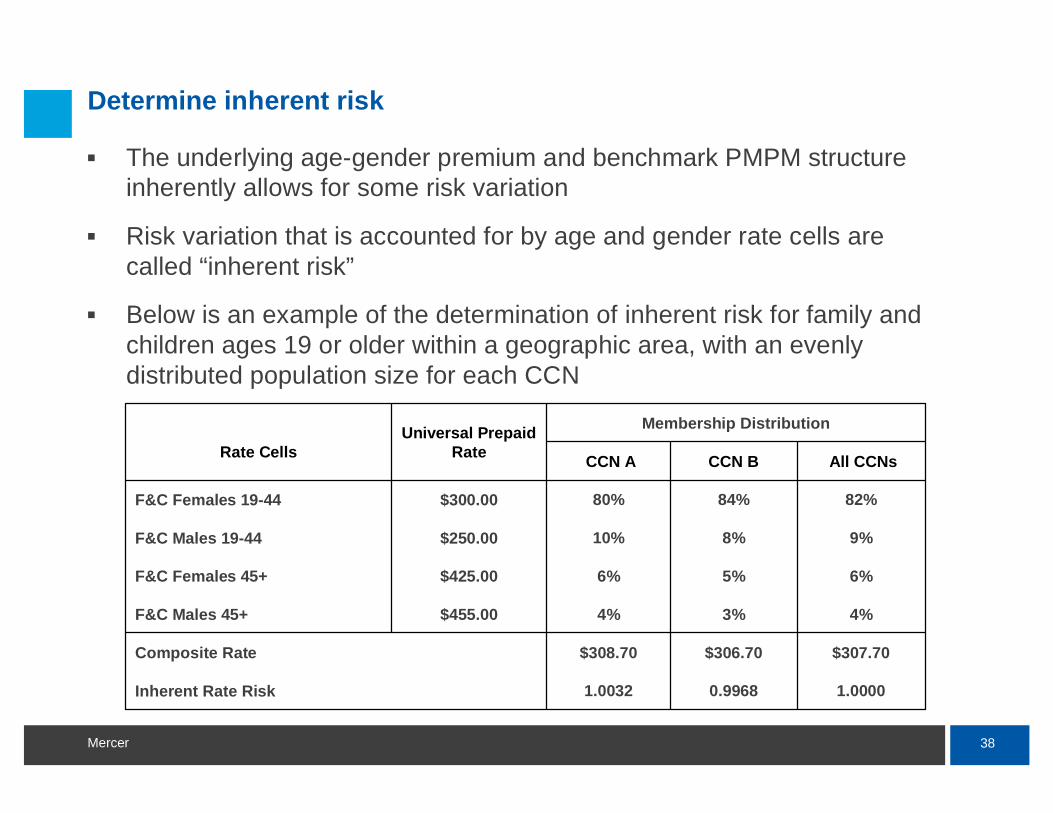
Determine inherent risk
The underlying age-gender premium and benchmark PMPM structure inherently allows for some risk variation
Risk variation that is accounted for by age and gender rate cells are called “inherent risk”
Below is an example of the determination of inherent risk for family and children ages 19 or older within a geographic area, with an evenly distributed population size for each CCN
1.00000.99681.0032Inherent Rate Risk
$307.70$306.70$308.70Composite Rate
4%3%4%$455.00 F&C Males 45+
6%5%6%$425.00 F&C Females 45+
9%8%10%$250.00 F&C Males 19-44
82%84%80%$300.00 F&C Females 19-44
All CCNs CCN BCCN A
Membership DistributionUniversal Prepaid RateRate Cells
39Mercer
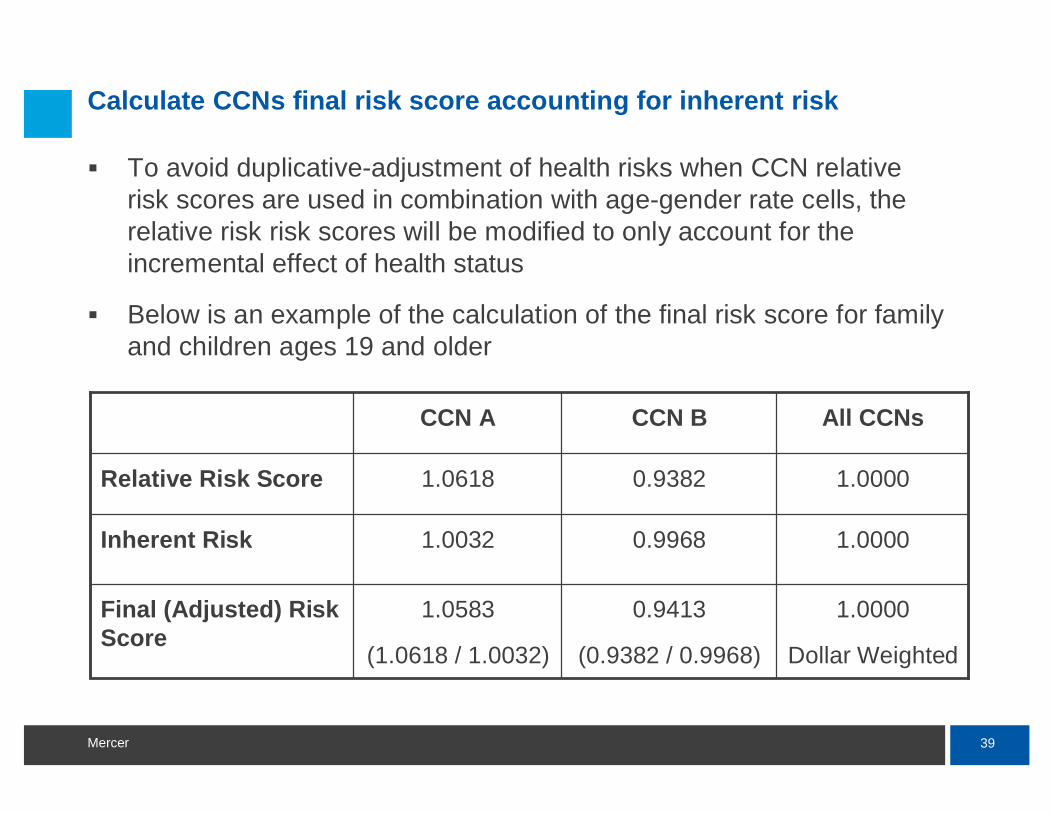
Calculate CCNs final risk score accounting for inherent risk
To avoid duplicative-adjustment of health risks when CCN relative risk scores are used in combination with age-gender rate cells, the relative risk risk scores will be modified to only account for the incremental effect of health status
Below is an example of the calculation of the final risk score for family and children ages 19 and older
1.0000
Dollar Weighted
0.9413
(0.9382 / 0.9968)
1.0583
(1.0618 / 1.0032)
Final (Adjusted) Risk Score
1.00000.99681.0032Inherent Risk
1.00000.93821.0618Relative Risk Score
All CCNsCCN BCCN A
40Mercer
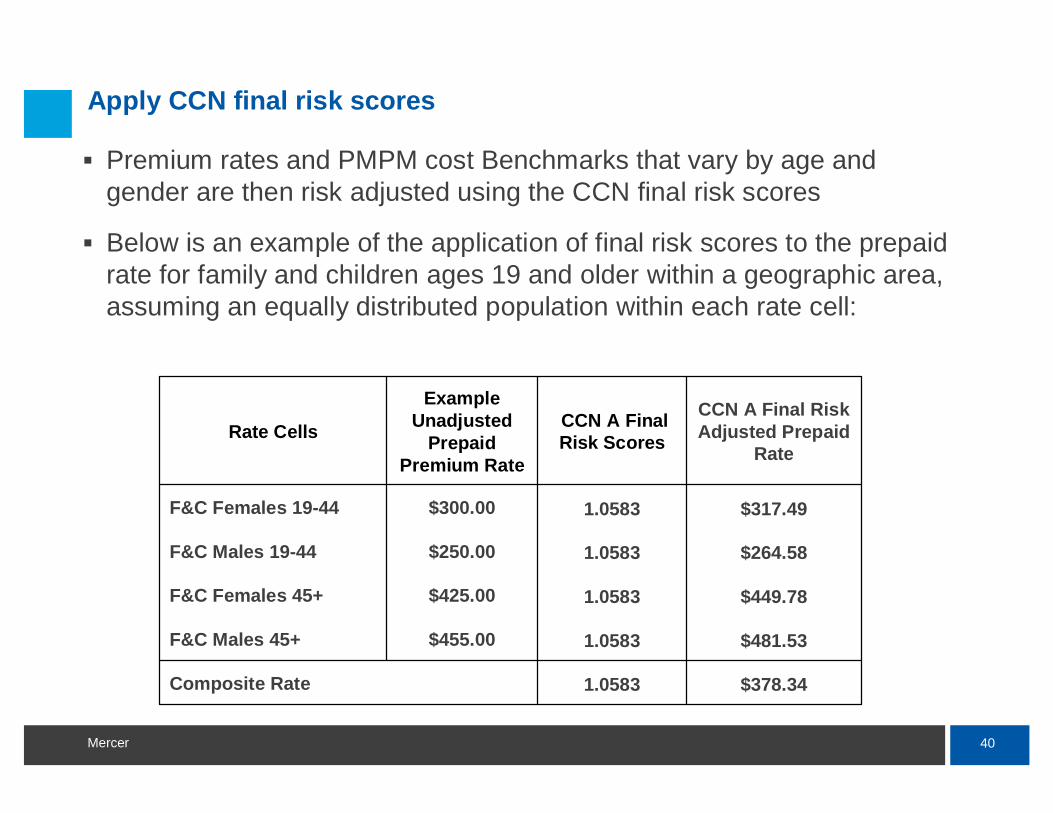
Apply CCN final risk scores
Premium rates and PMPM cost Benchmarks that vary by age and gender are then risk adjusted using the CCN final risk scores
Below is an example of the application of final risk scores to the prepaid rate for family and children ages 19 and older within a geographic area, assuming an equally distributed population within each rate cell:
$378.341.0583Composite Rate
$481.531.0583$455.00 F&C Males 45+
$449.781.0583$425.00 F&C Females 45+
$264.581.0583$250.00 F&C Males 19-44
$317.491.0583$300.00 F&C Females 19-44
CCN A Final Risk Adjusted Prepaid
Rate
CCN A Final Risk Scores
Example Unadjusted
Prepaid Premium Rate
Rate Cells

41Mercer
Q & A

www.mercer.com