19th january 2009 - ppfas
TRANSCRIPT

19th January 2009

Index
Preamble Page 3
Investment Arguments Page 4
Consistent Ownership Page 9
Crisil Page 11
ICRA Page 17
The McGraw Hill Corp. (Standard & Poors) Page 23
Moody’s Corporation Page 27
F. MARC DE LACHARRIÈRE (Fimalac) Group Page 30
Annexures Page 33
Analytics Page 39
Comparative Summary Page 40
Finally... Page 41
Concerns Page10
Opinion Dominion: Credit Rating Industry

Preamble
Opinion Dominion – Its all about Credibility !
The scandalous act of Satyam, aka India's Enron has brought many in the line of fire; the key being independent
directors & auditors. We are more concerned with the auditors – which like the Credit Rating Agencies (CRA) are in the
business of giving opinions. The auditors PWC is in greater trouble as just a few years ago, it was indicted for
fraudulent accounting following the collapse of the Global Trust Bank. PWC lost its banking business post the GTB
episode. We wonder if the share price of Satyam would go the GTB way and PWC India go the Arthur Andersen way,
which had to be dissolved for its complicity in the Enron scam.
We perceive that CRA is one industry, which suffers from what N.Taleb would put it as 'a new kind of Ingratitude'.
...The person who imposed locks on cockpit doors gets no statues in public squares, not so much as a quick
mention of his contribution in his obituary. “Joe Smith, who helped avoid the disaster of 9/11, died of
complications of liver disease.”
- Excerpt from The Black Swan
The business may also be classified as a Negative-Black Swan business. A negative-Black Swan business is one
where the unexpected can hit hard and hurt severely. If you are in the military, in catastrophe insurance, or in homeland
security, you face only downside. Taleb has a simple decision making rule, i.e. to be conservative when it comes to
negative black swans.
Interestingly for CRAs however, there is no real money risk like that of a bank or an insurance company. They just have
to downgrade and nothing else. Instead any such negative instances & circumstances only go towards increasing the
importance of what is needed. Post an accounting scam, the focus on accounts & audit will only increase. Similarly,
every undesired financial market fallout has ~ always created new avenues for credit rating agencies. The importance
of a safety belt does not reduce even if there is a casualty in a specific case. The importance only increases. The 'new
kind of ingratitude' is in our difficulty in realizing that safety belts have saved more lives than probably
anything else. In this current economic environment, we accede to the idea of this positive fallout in an otherwise
negative-black swan business.
The Basel II fallout to rate corporate loans from banks has created an entirely new opportunity for CRAs. While there
may be a few quarters of aberration given the financial turmoil & consequent casualties, outlook for the Indian CRAs
will improve sooner than later. The key trigger being that, the drying up of international liquidity coupled with poor
equity markets and the swiftly declining interest rates will accelerate the INR denominated borrowings, from banks &
other financial institutions. We expect the credit rating agencies to be beneficiaries over a medium term period.
Our investment argument for the key players in this industry is easily explained through this math.
Influential Positioning
+
Excellent Business Economics
+
Entry Barriers
+
Growth Opportunities
+
Cheap Valuations
3
Opinion Dominion: Credit Rating Industry

CRAs have everything to make it to one's Must-Own List. Crisil & ICRA
have evolved to be some of India's most influential corporates with
excellent business economics and strong entry barriers. Importantly,
the companies have growth visibility and are available at very
reasonably valuations.
There are various such businesses.
But these have very limited entry barriers. You have so many of each of
these. For our business, things would have been different if there just a
few brokers or just a few analysts. For investments, we are more
interested in the relatively monopolistic business of Credit Rating
Agencies.
Crisil (subsidiary of Standard & Poor's) & ICRA (associate of Moody's
Investor Service) are the two key rating agencies functional in India
with Fitch & CARE figuring in the also-ran list. However, given the need
for Dual Ratings and more importantly, the Credibility factor, Crisil
enjoys a lion's share making the market better than oligopolistic to
monopolistic.
We ask ourselves two questions here :
1. Do we need CRAs (in spite of any negatives) ?
2. Would there be more players ?
- Maybe. But would be very tough & long process. To establish
independence, scale up & ensure credibility. Also there are no more
very credible foreign players who are yet to come in. S&P chose Crisil
& Moodys chose ICRA. Fitch has been here for long now. There is no
known new-competition likely to come in.
Astrologers, economic forecasters, weathermen
Film critics, Art critics, Food and Car guide
Stock brokers and analysts
Auditors & Solicitors & legal advisors
- Of course we need them. We need Khalid Mohammed & Rashmi
Uday Singh for their opinions. Why won't we need credit rating
agencies?
Investment Arguments
The Edge is the business
itself - Business of giving
opinions!
4
- Of course we need them. We need Khalid Mohammed & Rashmi Uday
Singh for their opinions. Why won't we need credit rating agencies?
Influential Positioning + Excellent Business Economics +
Entry Barriers + Growth Opportunities + Cheap Valuations
Opinion Dominion: Credit Rating Industry
5
Crisil & ICRA have the necessary 'Buffettology' requisites to
characterize it as excellent business entities.
a) The business has an identifiable consumer (financial)
monopoly (oligopoly) – as explained above;
b) Earnings of the company are strong and are showing an
upward trend
Crisil : 48% CAGR Topline & 72% CAGR PAT over FY05-CY08E &
ICRA : 35% CAGR Topline & 45% CAGR PAT over FY05-FY09E;
c) They are conservatively financed – Fixed Asset turnover > 1 &
Low Working Capital requirement;
d) Consistent high rate of return on shareholder's equity
~15% for ICRA & ~30% for Crisil incl. Cash & 50%+ excl. cash &
liquid investments for both;
e) They get to retain their earnings
~75% average retained for Crisil &
~65% average retained for ICRA;
f) Does not need to spend on maintaining current operations –
almost nothing (computers, etc.);
g) Management has done well to judiciously & profitably reinvest
retained earnings in new business opportunities, expansion of
operations, etc.
Demonstrated both organic growth & profitable inorganic
acquisitions;
h) Company enjoys pricing power
Brand credibility & value reflected in relatively premium pricing,
especially for Crisil;
I) Value addition through retained earnings increases the market
value of the company
Crisil share price up 297% or 41% CAGR in last 4 years
Not much for ICRA whose share price up 23% since its IPO at Rs.
330 in March 2007;
More than just
monopolistic – It is truly an
Excellent business.
Opinion Dominion: Credit Rating Industry
6
Early Mover Advantage
Brand Name & Market Share – Crisil is the 4th largest credit rating
agency (CRA) in the world, after S&P, Moody's & Fitch. This is
despite of its functioning only in India versus a global platform at
disposal of the other top 3 players. This say a lot about the strong
brand that Crisil enjoys. One should note that Crisil has
demonstrated a strong organic growth & an iconic success as a
regional CRA, before it became a subsidiary of S&P. Even now,
despite being a S&P subsidiary, management has no plans to
phase out the Crisil brand owing to its obvious strength in its
market. ICRA we can say is a smaller version of Crisil, another
regional agency & now an associate of Moodys.
Comparability across companies and industries – Consistent
ratings help determine equivalent credit spreads and helps trade of
various corporate papers of varied industries. Larger players like
Crisil & ICRA are at an advantage here.
Suspected rating shopping & inferiority perception !!! - This is a
serious disadvantage to the late entrants & the smaller players.
Licensing
CRAs need to get a license from SEBI in India & its equivalent
internationally. Though there is a case & also space to make the
industry more competitive, it the non-bureaucratic moat which is
difficult to break. Infact, the act of regulators to continuously delegate
the responsibility of risk assessment to CRAs has only made the
existing players more influential. A new entrant is either left with a
meaningless profile or become an acquisition target in an alternative
scenario.
Perception of Knowledge
This along with Credibility is the biggest entry barrier.
It helps in terms of pricing power & profitability.
Opens up new business avenues like advisory, etc.
CYA : Cover your a@#
There is little uniformity amidst Efforts, Risks & Rewards, especially
when it comes to the profession of investment management. Also as
Robert Cialdini aptly modified, “ Every day in every way, I'm getting
busier.” In this case, no better remedy than a credible rating in place.
So much for the Investor's influence on the otherwise Issuer pay
model.
Entry Barriers
Opinion Dominion: Credit Rating Industry
7
The People Factor is one of the most critical aspects in the operations
of CRA. We perceive that the managements have done extremely well
in terms of positioning the companies, organic & inorganic growth, exit
decisions, managing conflict of interest and most importantly keeping
up the credibility of the brand even at the cost of business & market
share upon consistent downgrades. The little concern over ESOP
dilutions has been reasonably done away post acquisition of stake by
S&P & Moodys.
The Basel II norms which require borrowers to have a credit rating in
place for every bank loan in excess of Rs. 50 Crs for FY09 and a further
scale down in limit to Rs. 10 Crs for FY10, is likely to bring in a
tremendous increase in ratings volume for the CRAs. Banks would
benefit by making efficient use of capital by assigning risk weights to
loans, based on the credit rating of the lender. A higher rating will allow
the customer to borrow cheap & will lower the capital adequacy
requirement for the bank and vice-versa.
Growth in financial markets and economy
The past suggest a consistent evolution of opportunities for CRAs :
1. Credit rating is mandatory for issuance of debt instruments by listed
companies with maturity/ convertibility of 18 months and above.
2. SEBI along with stock exchanges made ratings mandatory for debt
instruments placed under private placement basis and having a
maturity of one year or more, which are proposed to be listed.
3. Requirement for certain investors to invest not more than a
stipulated part of their portfolio in unrated bonds.
4. RBI has made it mandatory for all commercial banks to make fresh
investment only in rated non-SLR securities.
5. Non-government PFs, Superannuation funds, Gratuity funds can
only invest in bonds issued by public financial institutions,
public/private sector companies, provided they are dual rated. Further,
the said fund houses can only invest in shares of companies, which
have investment grade rating from at least two credit rating agencies.
Offshoring
Crisil through it Global Outsourcing Centre (GAC) does a lot of Credit
research work outsourced by its MNC parent, 'Standard & Poor's'. It
already has almost 500 people on this assignment. This business has
not only increased its importance in the overall functioning of Crisil, but
has also brought in an increased steadiness to the overall entity. ICRA
has about 100 people on the outsourcing task from Moodys. This
Basel II : Thank you Central Bankers of the world & RBI
Management
Growth Visibility
Opinion Dominion: Credit Rating Industry

8
segment also bodes well in terms of growth rates & margins in the
longer run. In the near term there could be some slowdown in the
workflow given the international financial shakeout.
Other areas
This may not materialize in India soon, as India still remains a
market where value added research is provided to clients almost
free of cost. Independent equity research by CRA's may find it
difficult to command a charge in such a scenario.
Nothing much here & not very important for CRAs for the moment.
We expect some improvement in the corporate fixed income
industry with the fall in the interest rates & limited financing options.
Grading of real estate developers. May be in future.
Grading of stockbrokers. May be in future.
Infrastructure advisory & Business research. Non-recurring &
project-based business may see some slowdown.
Industry & Company research: Eg. INFAC reports. Brokers may not
spend much in tough times.
Risk management solution for Banks & Corporates. May continue
as usual as it also helps in protecting profitability.
Mutual Fund Services. Likely to continue as it constitutes a small
portion of the overall costs.
The excellent business economics of the company is on account of the
low capital (fixed + working) intensity of the business coupled with high
margins. While the companies may continue to pursue its dual –
organic + inorganic growth aspirations, we expect the payout ratio to
gradually improve as the company grows in size. While the historical
very high growth rates may or may not sustain, there remains a fairly
reasonable set of growth levers for the company for the coming few
years atleast.
The PE multiples have come down in tandem with the lower expected
growth rates and the subdued financial environment. Our intent is to
acquire monopolistic & quality businesses, when available at
attractive valuations for long holding periods. At ~ 12 times it current
year earnings, both Crisil & ICRA are trading at extremely modest
valuations and make a compelling BUY.
Independent equity research: Thank you Mr. Eliott Spitzer.
Grading of IPOs: Thank you Mr. Damodaran & Mr. Bhave.
Valuation of debt securities: Thank you MFs and Mr. Bhave.
Cheap Valuations
Opinion Dominion: Credit Rating Industry

Consistent Ownership
Crisil
ICRA
More than 1% Holding – Over 80% of the Capitalization
More than 1% Holding – Over 80% of the Capitalization
One can lament over poor liquidity in the two scrips as an excuse. We feel glad that such companies are listed (Not
much capital needed; Recently listed ICRA was through an Offer for Sale). We feel lucky to have an opportunity to
participate in this business. The above tables reflect the sticky holding pattern, but they also reflect how select focused
institutions have been able to garner some share in this opportunity. For e.g. Principal MF & Birla MF have been able
to aggregate some stake in the recent past. Even ACACIA Partners which already has been a key stake holder in
Crisil has manage to garner ICRA. It along with GILC & LIC is now a key holder in both the companies. Popular and
renowned investors like Rakesh Jhunjhunwala and Radhakishan Damani have the credits for identifying such an
opportunity at an early stage.
9
Description as on (% Holding) 31-Dec-08 30-Sep-08 30-Jun-08 31-Mar-08 31-Dec-07 30-Sep-07 30-Jun-07
S and P India LLC 43.2 43.2 43.2 43.2 43.2 43.2 43.3
S and P International LLC 8.3
8.3
8.3
8.3
8.3
8.3
8.3
Jhunjhunwala Rakesh Radheshyam 7.6
7.6
7.6
7.6
7.6
7.6
7.6
Acacia Institutional Partners LP 5.7
5.7
5.7
5.7
5.7
5.7
5.7
GIC of India 4.2
4.2
4.2
4.2
4.2
4.2
4.2
UTI 3.5
3.4
3.3
3.2
3.1
3.1
3.1
State Bank of India 2.8
2.8
2.8
2.8
2.8
2.8
2.8
CLSA Merchant Bankers Ltd 2.1
2.6
2.6
2.6
2.6
2.6
2.4
LIC of India 2.4
2.4
2.4
2.4
2.4
2.4
2.4
Bright Star Investment Pvt Ltd 1.3
1.3
1.3
1.3
1.3
1.3
1.3
Description as on (% Holding) 31-Dec-08 30-Sep-08 30-Jun-08 31-Mar-08 31-Dec-07 30-Sep-07 30-Jun-07
Moodys Investment Company 28.51 28.51 28.51 28.51 28.51 28.51 28.51
State Bank of India 10.00 10.00 10.00 10.00 10.00 10.00 10.00
ICRA Employees Welfare Trust 8.83 8.83 8.96 9.06 9.06 9.06 9.06
LIC of India 7.65 7.65 7.65 7.65 7.65 7.65 7.65
GIC of India 5.23 5.23 5.23 5.23 5.23 5.23 5.23
Punjab National Bank 5.08 5.09 5.25 5.25 5.25 5.25 5.25
Birla Sunlife Trustee Company 5.35 4.88 4.83 4.66 4.51 3.39
Central Bank of India 2.55 2.55 2.55 2.55 2.55 2.55 2.55
Indiabulls Capital Services Ltd 2.45 2.45 2.45 2.45 2.45 1.84
Indiabulls Insurance Advisors 1.81 1.81 1.81 1.81 1.51
Allahabad Bank 1.72 1.72 1.72 1.72 1.72 1.72 1.72
ACACIA Partners LP 1.20 1.20
Birla Sun Life Insurance Co. 1.22 1.19
Principal Trustee Company 1.07 1.07 1.01
Reliance Capital Trustee Co. 1.27 1.27 1.27 1.27
Indian Bank 1.14 1.09 1.03 1.03
Opinion Dominion: Credit Rating Industry

Concerns
The volume of revenues is dependent on the volume and number of debt securities issued in the Indian capital
markets. Nearly 60% of ICRA's revenues & ~40% of Crisil's revenues are on account of the rating services, which
are primarily linked to the issuance of debt securities in the Indian capital markets.
This industry tends to get a little cyclical and can be compared to stock exchange model for the double whammy.
Unlike many international counterparts, Indian bourses earn fees on the value of contracts, rather than number of
contracts. In a dull market, the Indian bourses experience the double whammy of both prices & number of contracts
shrinking simultaneously. Similar is the fate for Credit Rating business, where in a dull market like it is now, not just
the number of debt issuances but the average size of the issuances also shrinks. There is a consequent loss to the
CRAs who generally charge as a percentage (band-wise slabs) of the borrowings.
Any variation in interest rates and credit spreads, volatility in corporate bonds market or interest rate environment,
foreign exchange fluctuations, defaults of significant issuers and other market and economic factors both
domestically and globally may impact CRAs.
The company faces increased pricing pressures from its competitors. The pricing competition will move to a new
league, especially on the bank loans. Our sense is that the larger players have more to loose as compared to the
smaller players. However, the larger firms are also more apt at managing productivity and may be able to maintain
its overall share.
Competition is not limited to the rating business. The other divisions have its own set of competition. For example
Cris Infac competes with CMIE, Dun & Bradstreet for its Industry Research services. For the consulting services
business, Crisil & ICRA competes with various players including investment banks and consulting organizations.
Certain part of the business is non-recurring. The initial rating fees are recognized on assignment but the
maintenance fees is generally amortized over the balance period & there is some recurring element to it. But a
good chunk of its overall business, say consultancy, advisory, etc. is non-recurring in nature.
Clear pockets of de-growth. Securitization, Structured Products, IPO Grading, Project Consultancy, etc. are
witnessing clear signals of a slowdown & de-growth. The outsourcing from S&P and Moody's to Crisil & ICRA is
likely to see a slowdown in the near to medium term following the widespread financial crisis. Crisil's subsidiary
Irevna provides research to a number of international financial institutions. This is one of the largest business
segments for Crisil is likely to see a deceleration in business.
Diversification risks. While the diversifications bring about some growth to these companies and at most times also
complement the business model, these other businesses are not & probably cannot be as profitable as the rating
business. Therefore the overall performance becomes a weighted average of the individual businesses of the
company. This also brings about some non-comparability between the key companies in the rating industry.
Some increase in taxation for Crisil as the STPI benefits to Irevna exhausts in 2010. Although the company is
starting a SEZ in Mumbai, we believe it will take some time for the SEZ facility to offset the increased taxation from
the present STPI unit.
The largest & the most important is the risk of Credibility. We have seen organizations like Arthur Andersen going
down for loss of credibility, but not a CRA. Importantly there are just a few of them & the key ones command a quasi-
government type of authority & weight. But this cannot be taken for granted.
Conflict of Interest. International CRAs experienced some brunt on this aspect post the Enron trouble. The Indian
CRAs have done well in keeping the various businesses separate clearly outlining the methodology & implications
of its ratings. However, there still could be some interest conflict. S&P has a WOS S&P India which rates non INR
debt & promotes S&P. While there is no apparent conflict, we feel there was a case for work to be outsourced to
Crisil.
10
Opinion Dominion: Credit Rating Industry

30
60
90
120
Dec-07 Apr-08 Aug-08 Dec-08
[email protected] | [email protected] Valia - [email protected]
11
Initiating Coverage
BUYCMP Rs. 2345.0
Bloomberg : CRISIL.IN
Reuters : CRSL.BO
BSE Code : 500092
NSE Code : CRISIL
BSE Group : B
Benchmark : BSE500
52 Week H/L : 3885.0/1848.15
Float : 48.5 Mn
Mkt Cap : Rs. 16,943 Mn
Face Value : Rs. 10.0
Promoters
Institutions
Indian Public
Others
51.5%
26.5%
18.9%
3.1%
Crisil
1 Mth
-5.97 -29.68
-27.74 -39.36
-35.13
11.06
3 Mths 6 Mths
BSE500
Stock Data
Stock Codes
Shareholding Pattern (as on Dec ‘08)
Price Comparison
Stock Returns
Crisil
BSE500
Crisil is India's topnotch credit rating agency with an impeccable track
record and has a strong parentage in Standard & Poor's. In ratings
business, there is a clear financial oligopoly. Over the years company
has successfully diversified into related businesses of research &
advisory. Management has done well to judiciously & profitably reinvest
retained earnings in new business opportunities; expansion of
operations, etc. It has demonstrated both organic growth & profitable
inorganic acquisitions. Crisil has an edge over competition on account of
its premium brand credibility.
In terms of financial performance, Crisil has done extremely well & even
better than competition. The company has grown 48% CAGR Topline &
72% CAGR PAT over FY05-CY08E. The business has been
conservatively financed & the positives are reflected in the excellent
return ratios for shareholders. Crisil generates a return of 20-30% incl.
Cash & 50%+ excl. cash & liquid investments for its shareholders.
There are a number of near-term concerns for Crisil, in terms of select
pockets of slowdown & most importantly a possible loss of business in
Irevna, which now constitutes the largest composition of the overall
business. We however perceive, that these concerns are factored in the
current subdued pricing to a reasonable extent.
The medium term offers a substantial opportunity for the Indian Credit
market, which is likely to bolster the outlook for the CRAs. Apart from the
Basel II Bank Loan Rating opportunity, the international liquidity drying
up followed by the continuous falling interest rates & lastly the stimulus
packages announced will bring in significant consequent benefits for
Crisil.
Our advice is to buy quality & monopolistic businesses from a long
holding perspective, particularly when these are trading cheap in an
aberrant business environment. At under 12 times the scrip is trading at
very modest valuations. We recommend BUY.
Summary Financials
Particulars (Rs. Mn.) FY05 9M CY05 CY06 CY07 CY08E
Total Revenues 1,193.2 1,404.7 2,873.3 4,043.3 5,119.5
OPM (%) 29.0% 27.7% 28.1% 29% 38%
EPS (Rs.) 30.4 37.2 89.8 115.8 202.9
P/E (x) 77.1 63.0 26.1 20.3 11.6
ROCE (%) 28.5% 26.3% 41.4% 40.5% 53.6%
RONW (%) 18.4% 18.6% 32.1% 30.3% 38.4%
Dividend Payout (%) 41.1% 26.9% 16.7% 21.6% 24.6%

12
CRISIL is India's leading Ratings, Research, Risk and Policy Advisory Company.
judiciously & profitably reinvest retained earnings in new business opportunities; expansion of operations, etc. It has
demonstrated both organic growth & profitable inorganic acquisitions. Crisil has an edge over competition on account
of its premium brand credibility.
CRISIL's majority shareholder is Standard & Poor's, a division of The McGraw-Hill Companies and the world's
foremost provider of financial market intelligence. Its 3 key business segments explained :
Ratings
CRISIL Ratings is India's largest rating agency, having rated more than 11,026 debt instruments, of more than
Rs.22,51,590 crores, issued by over 5716 companies. CRISIL Ratings has a 70 per cent penetration in the domestic
debt market. CRISIL's Global Analytical Centre (GAC) supports S&P's ratings business through credit research
support.
Research
CRISIL Research provides business research to over 600 domestic and international clients, including 90 per cent of
India's commercial banks. Crisil has more than 17 years of experience in analysing the Indian and global business
environment, the largest analytical pool in India, and the largest primary source network. Through its IPO Grading
initiative, CRISIL Research has also established a presence in the equity research domain.
Irevna, now a division of CRISIL Limited, pioneered the concept of offshore investment research for the world's
leading investment banks and financial institutions. Irevna is the most experienced and diversified provider of
analytical services to the financial services industry, supporting Equity Research, Equity Strategy, Credit Research,
Securitisation Research, and Derivatives IT and Structuring. Irevna has been voted the leader in high-end investment
research and analytics outsourcing, for the second year in a row, by the US-based Brown & Wilson Group.
CRISIL FundServices is the leading provider of fund research, rankings, and ratings to India's mutual funds industry.
Advisory
WoS CRISIL Risk and Infrastructure Solutions Limited (CRIS) is engaged in the areas of infrastructure policy and
transaction advisory services; integrated risk management services and consulting to banks and corporates, through
its divisions CRISIL Infrastructure Advisory and CRISIL Risk Solutions.
This apart Crisil has a 49% stake in India Index Services and Products Limited (JV) in alignment with Parent
S&P's interest in Index business. Besides it has made some minority investments into NCDEX & The
Caribbean Information & Credit Rating Services Limited (CariCRIS). There could some consolidation/value-
unlocking happening in these in future.
In terms of financial performance, Crisil has done extremely well & even better than competition. The company has
grown 48% CAGR Topline & 72% CAGR PAT over FY05-CY08E. The business has been conservatively financed &
the positives are reflected in the excellent return ratios for shareholders. Crisil generates a return of 20-30% incl. Cash
& 50%+ excl. cash & liquid investments for its shareholders.
Management has done well to
Company BackgroundCRISIL
Particulars (Rs. Mn.)Nos of Emp (x) Revenues Rev/Emp EBIT EBIT/EMP
Rating Services 800.0 1,300.8 1.6 550.5 0.7 Advisory Services 100.0
1,067.0
10.7
209.4
2.1
Research Services 850.0
1,675.6
2.0
441.6
0.5
Total 1,750.0
4,043.3
2.3
1,201.5
0.7

13
Quarterly FinancialsCRISIL
282 286 300365
446 464 452259 248 247
312 206272 253
353425 447
520 515516
646
0
400
800
1,200
1,600
Mar 07 Jun 07 Sept 07 Dec 07 Mar 08 Jun 08 Sept 08
Rating Services Advisory Services Research Services
Segmental Revenue Mix (Rs. Mn.)
Segmental Profit Mix (Rs. Mn.)
124 117134 139
223190
242
4322
50
9528 53
66111
96
142129
180214
294
0
150
300
450
600
Mar 07 Jun 07 Sept 07 Dec 07 Mar 08 Jun 08 Sept 08
Rating Services Advisory Services Research Services
Earnings Statement
YE March (Rs. Mn.) Sept 08 Jun 08 Q-Q(%) Sept 07 Y-Y(%) 9MCY08 9MCY07 Y-Y(%)
Net Revenues 1,350.4 1,251.3 7.91% 993.2 35.95% 3,769.1 2,846.1 32.43%
Total Expenditure 782.0 851.4 -8.14% 688.8 13.54% 2,384.7 2,030.1 17.46%
Operating Profit 568.3 400.0 42.10% 304.4 86.68% 1,384.4 815.9 69.68%
Other Income 56.2 71.8 -21.73% 64.3 -12.63% 160.1 87.9 82.22%
EBITDA 624.5 471.7 32.38% 368.7 69.36% 1,544.5 903.8 70.90%
Depreciation 38.1 29.9 27.52% 29.0 31.57% 99.3 124.7 -20.38%
EBIT 586.4 441.9 32.71% 339.8 72.58% 1,445.2 779.1 85.51%
Interest 0.0 0.0 0.00% 0.0 0.00% 0.0 0.0 0.00%
PBT 586.4 441.9 32.71% 339.8 72.58% 1,445.2 779.1 85.51%
Tax 163.2 86.4 88.86% 70.7 130.88% 351.8 167.9 109.48%
PAT before MI 423.2 355.5 19.06% 269.1 57.27% 1,093.5 611.1 78.92%
Minority Interest 0.0 0.0 0.0 0.0 0.0
PAT after MI 423.2 355.5 19.06% 269.1 57.27% 1,093.5 611.1 78.92%
Equity Capital 72.3 72.3 0.00% 72.3 0.00% 72.3 72.3 0.00%
EPS 58.58
49.20
19.07% 37.32
56.97% 151.35
86.39
75.19%
Ratio Analysis
Profitability
YE March (Rs. Mn.) Sept 08 Jun 08 Q-Q(bps) Sept 07 Y-Y(bps) 9MCY08 9MCY07 Y-Y(bps)
OPM (%) 42.09% 31.96% 1,012.4 30.65% 1,143.6 36.73% 28.67% 806.3
EBITDA (%) 46.25% 37.70% 854.8 37.13% 912.2 40.98% 31.76% 922.3
EBIT (%) 43.43% 35.31% 811.4 34.21% 921.6 38.34% 27.37% 1,097.1
PAT (%) 31.34% 28.41% 293.4 27.09% 424.7 29.01% 21.47% 753.8

14
Segment AnalysisCRISIL
Segment Revenues FY05 9M CY05 CY06 CY07
Rating Services 597.6 521.4 904.7 1,300.8
Advisory Services 437.7 478.0 893.9 1,067.0
Research Services 157.8 405.4 1,074.7 1,675.6
Total 1,193.2 1,404.7 2,873.3 4,043.3
Y-Y Revenue Growth 9M CY05 CY06 CY07
Rating Services -12.8% 73.5% 43.8%
Advisory Services 9.2% 87.0% 19.4%
Research Services 156.8% 165.1% 55.9%
Total 17.7% 104.5% 40.7%
Revenue Mix - Geography-wise FY05 9M CY05 CY06 CY07
India UK 69.4% 53.0% 40.7% 35.0%
UK 22.9% 34.8% 41.4% 44.6%
USA 6.0% 9.7% 15.9% 18.1%
Others 1.7% 2.4% 2.1% 2.3%
Total 100.0% 100.0% 100.0% 100.0%
Segment Revenue Mix FY05 9M CY05 CY06 CY07
Rating Services 50.1% 37.1% 31.5% 32.2%
Advisory Services 36.7% 34.0% 31.1% 26.4%
Research Services 13.2% 28.9% 37.4% 41.4%
Total 100.0% 100.0% 100.0% 100.0%
Segment Profit Mix FY05 9M CY05 CY06 CY07
Rating Services 89.9% 67.3% 47.8% 45.8%
Advisory Services 3.0% 8.8% 20.1% 17.4%
Research Services 7.0% 23.9% 32.1% 36.8%
Total 100.0% 100.0% 100.0% 100.0%
Segment Margins FY05 9M CY05 CY06 CY07
Rating Services 61.2% 50.9% 43.2% 42.3%
Advisory Services 2.8% 7.2% 18.4% 19.6%
Research Services 18.0% 23.2% 24.5% 26.4%
Total 34.1% 28.1% 28.5% 29.7%
Ratings is very high margin and the most profitable segment followed by research. It constituted 32% of revenues and
46% of earnings during CY07. The margins for ratings are coming down on account of the increasing share of
outsourcing work from S&P (GAC), which is included in the ratings segment. Also both Advisory & Research
businesses have delivered a continual growth in margins as they have been maturing over the years.

15
FinancialsCRISIL
Earnings Statement
Particulars (Rs. Mn.) FY05 9M CY05 CY06 CY07 CY08E CY09E
Total Revenues 1,193.2 1,404.7 2,873.3 4,043.3 5,119.5 6,194.6
- Growth (%) 17.7% 104.5% 40.7% 26.6% 21.0%
Total Expenditure 846.8 1,015.8 2,067.2 2,871.7 3,170.8 3,807.8
Operating Profit 346.4 389.0 806.0 1,171.7 1,948.6 2,386.7
- Growth (%) 12.3% 107.2% 45.4% 66.3% 22.5%
Other Income 27.4 21.1 67.0 91.6 216.1 193.9
EBITDA 373.8 410.1 873.1 1,263.3 2,164.7 2,580.6
- Growth (%) 9.7% 112.9% 44.7% 71.4% 19.2%
Depreciation 65.2 54.7 78.5 156.9 137.4 200.2
EBIT 308.7 355.4 794.5 1,106.4 2,027.3 2,380.4
Interest 0.0 0.0 0.0 0.0 0.0 0.0
PBT 308.7 355.4 794.5 1,106.4 2,027.3 2,380.4
Tax 115.2 110.3 187.9 269.7 561.3 714.1
PAT Before EI 193.5 245.1 606.6 836.6 1,466.0 1,666.3
- Growth (%) 26.7% 147.5% 37.9% 75.2% 13.7%
Extraordinary Items 5.0 0.0 7.7 0.0 0.0 0.0
Reported PAT 198.49 245.08 614.31 836.64 1466.00 1666.31
Ratio Analysis
Particulars FY05 9M CY05 CY06 CY07 CY08E CY09E
OPM (%) 29.0% 27.7% 28.1% 29% 38% 39%
EBITDA (%) 31.3% 29.2% 30.4% 31% 42% 42%
PAT (%) 16.2% 17.4% 21.1% 21% 29% 27%
Interest Cover (x) n.a. n.a. n.a. n.a. n.a. n.a.
EPS (Rs.) 30.4 37.2 89.8 115.8 202.9 230.6
P/E (x) 77.1 63.0 26.1 20.3 11.6 10.2
P/BV (x) 14.2 11.7 8.4 6.1 4.4 3.4
BVPS (Rs.) 164.9 200.3 279.6 382.6 528.4 696.3
Market Cap (Rs. Mn.) 14,927.1 15,437.1 15,841.5 16,942.6 16,942.6 16,942.6
M Cap/Sales (x) 12.5 11.0 5.5 4.2 3.3 2.7
EV (Rs. Mn.) 14,771.5 15,270.7 15,456.5 16,518.4 16,479.0 16,488.6
EV/EBITDA (x) 39.5 37.2 17.7 13.1 7.6 6.4
EV/Sales (x) 12.4 10.9 5.4 4.1 3.2 2.7
ROCE (%) 28.5% 26.3% 41.4% 40.5% 53.6% 47.6%
RONW (%) 18.4% 18.6% 32.1% 30.3% 38.4% 33.1%
Debt/Equity Ratio (x) 0.0 0.0 0.0 0.0 0.0 0.0
Inventory T/o Days 0.0 0.0 0.0 0.0 0.0 0.0
Debtors T/o Days 68.4 87.6 83.6 79.9 85.0 85.0
Advances T/o Days 22.9 34.1 20.3 36.3 35.0 35.0
Creditors T/o Days 90.5 102.1 87.8 85.4 80.0 80.0
Wrkg Cap T/o Days (Ex.Cash) (35.0) (5.5) (4.8) (3.6) 7.8 7.8
Fixed Assets T/o (Gross) 1.3 1.2 1.8 2.2 2.2 2.2
DPS (Rs.) 12.5 10.0 15.0 25.0 50.0 55.0
Dividend Payout (%) 41.1% 26.9% 16.7% 21.6% 24.6% 23.8%
Dividend Yield (%) 0.5% 0.4% 0.6% 1.1% 2.1% 2.3%
16
FinancialsCRISIL
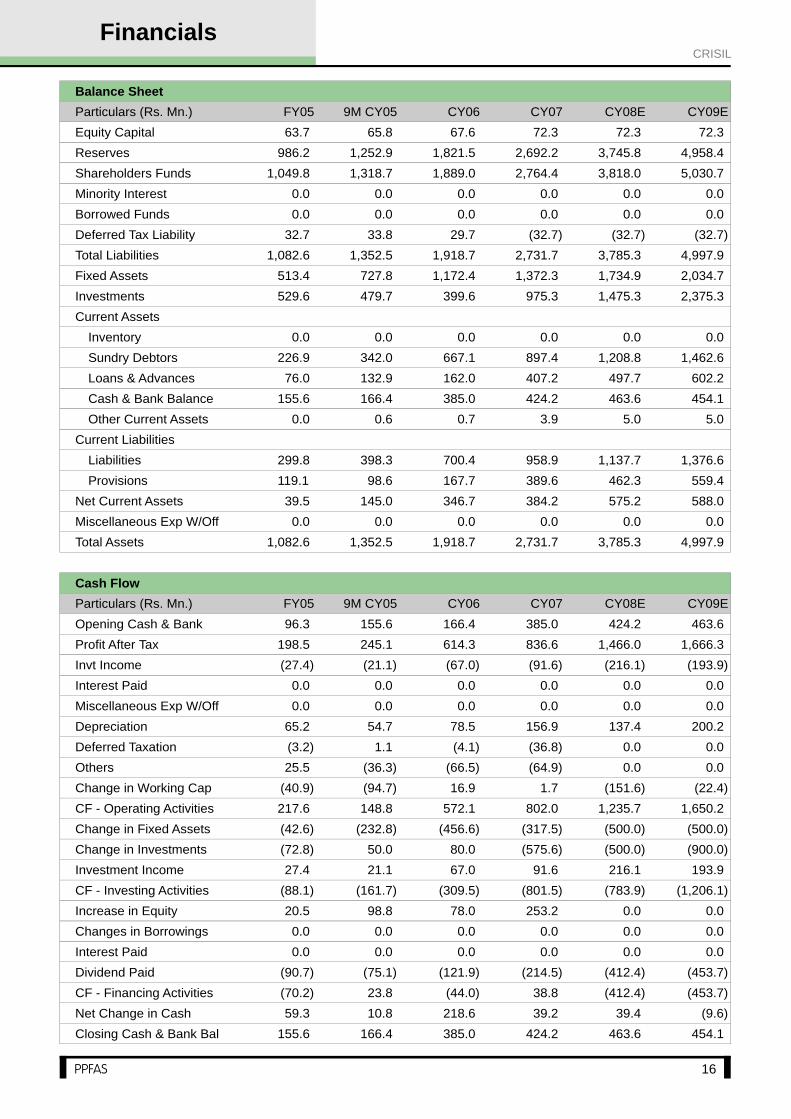
Balance Sheet
Particulars (Rs. Mn.) FY05 9M CY05 CY06 CY07 CY08E CY09E
Equity Capital 63.7 65.8 67.6 72.3 72.3 72.3
Reserves 986.2 1,252.9 1,821.5 2,692.2 3,745.8 4,958.4
Shareholders Funds 1,049.8 1,318.7 1,889.0 2,764.4 3,818.0 5,030.7
Minority Interest 0.0 0.0 0.0 0.0 0.0 0.0
Borrowed Funds 0.0 0.0 0.0 0.0 0.0 0.0
Deferred Tax Liability 32.7 33.8 29.7 (32.7) (32.7) (32.7)
Total Liabilities 1,082.6 1,352.5 1,918.7 2,731.7 3,785.3 4,997.9
Fixed Assets 513.4 727.8 1,172.4 1,372.3 1,734.9 2,034.7
Investments 529.6 479.7 399.6 975.3 1,475.3 2,375.3
Current Assets
Inventory 0.0 0.0 0.0 0.0 0.0 0.0
Sundry Debtors 226.9 342.0 667.1 897.4 1,208.8 1,462.6
Loans & Advances 76.0 132.9 162.0 407.2 497.7 602.2
Cash & Bank Balance 155.6 166.4 385.0 424.2 463.6 454.1
Other Current Assets 0.0 0.6 0.7 3.9 5.0 5.0
Current Liabilities
Liabilities 299.8 398.3 700.4 958.9 1,137.7 1,376.6
Provisions 119.1 98.6 167.7 389.6 462.3 559.4
Net Current Assets 39.5 145.0 346.7 384.2 575.2 588.0
Miscellaneous Exp W/Off 0.0 0.0 0.0 0.0 0.0 0.0
Total Assets 1,082.6 1,352.5 1,918.7 2,731.7 3,785.3 4,997.9
Cash Flow
Particulars (Rs. Mn.) FY05 9M CY05 CY06 CY07 CY08E CY09E
Opening Cash & Bank 96.3 155.6 166.4 385.0 424.2 463.6
Profit After Tax 198.5 245.1 614.3 836.6 1,466.0 1,666.3
Invt Income (27.4) (21.1) (67.0) (91.6) (216.1) (193.9)
Interest Paid 0.0 0.0 0.0 0.0 0.0 0.0
Miscellaneous Exp W/Off 0.0 0.0 0.0 0.0 0.0 0.0
Depreciation 65.2 54.7 78.5 156.9 137.4 200.2
Deferred Taxation (3.2) 1.1 (4.1) (36.8) 0.0 0.0
Others 25.5 (36.3) (66.5) (64.9) 0.0 0.0
Change in Working Cap (40.9) (94.7) 16.9 1.7 (151.6) (22.4)
CF - Operating Activities 217.6 148.8 572.1 802.0 1,235.7 1,650.2
Change in Fixed Assets (42.6) (232.8) (456.6) (317.5) (500.0) (500.0)
Change in Investments (72.8) 50.0 80.0 (575.6) (500.0) (900.0)
Investment Income 27.4 21.1 67.0 91.6 216.1 193.9
CF - Investing Activities (88.1) (161.7) (309.5) (801.5) (783.9) (1,206.1)
Increase in Equity 20.5 98.8 78.0 253.2 0.0 0.0
Changes in Borrowings 0.0 0.0 0.0 0.0 0.0 0.0
Interest Paid 0.0 0.0 0.0 0.0 0.0 0.0
Dividend Paid (90.7) (75.1) (121.9) (214.5) (412.4) (453.7)
CF - Financing Activities (70.2) 23.8 (44.0) 38.8 (412.4) (453.7)
Net Change in Cash 59.3 10.8 218.6 39.2 39.4 (9.6)
Closing Cash & Bank Bal 155.6 166.4 385.0 424.2 463.6 454.1

[email protected] | [email protected] Valia - [email protected]
17
Initiating Coverage
BUYCMP Rs. 399.0
Bloomberg : ICRA.IN
Reuters : ICRA.BO
BSE Code : 532835
NSE Code : ICRA
BSE Group : B
Benchmark : BSESMCAP
52 Week H/L : 970.0/320.0
Float : 71.5 Mn
Mkt Cap : Rs. 3,990Mn
Face Value : Rs. 10.0
Promoters
Institutions
Indian Public
Others
28.5% 46.7%
8.0%
16.8%
ICRA
1 Mth
0.09 -2.02
-24.48 -47.51
-34.74
-1.28
3 Mths 6 Mths
BSESM
Stock Data
Stock Codes
Shareholding Pattern (as on Dec ‘08)
Price Comparison
Stock Returns
25
55
85
115
Jan-08 May-08 Sep-08 Jan-09
ICRA
BSESMCAP
ICRA is now an associate of international Credit Rating Agency Moody's
Investors Service, which own ~29% in the company. In ratings business,
ICRA participates in the clear financial oligopoly. Over the years
company has successfully diversified into related businesses of
research, information, consulting & software. ICRA has an advantage in
terms of its base effect. It is a smaller version of Crisil, where the
opportunity from Moody's increasing its stake to a majority still remains
pending.
In terms of financial performance, ICRA has done reasonably well. The
company has grown 35% CAGR Topline & 45% CAGR PAT over FY05-
FY09E. ICRA generates a return of ~15% incl. Cash & 50%+ excl. cash &
liquid investments for its shareholders.
There are a number of near-term concerns for ICRA, in terms of select
pockets of slowdown & most importantly a relatively higher exposure to
ratings, which still constitutes the largest composition of the overall
business. We however perceive, that these concerns are factored in the
current subdued pricing to a reasonable extent.
The medium term offers a substantial opportunity for the Indian Credit
market, which is likely to bolster the outlook for the CRAs. Apart from the
Basel II Bank Loan Rating opportunity, the international liquidity drying
up followed by the continuous falling interest rates & lastly the stimulus
packages announced will bring in significant consequent benefits for
ICRA. We perceive that ICRA's strategy to go establish a MoU with PSU
banks beforehand will certainly help it in tapping the Basel II Bank Loan
Rating opportunity.
Our advice is to buy quality & monopolistic businesses from a long
holding perspective, particularly when these are trading cheap in an
aberrant business environment. At under 12 times the scrip is trading at
very modest valuations. We recommend BUY.
Summary Financials
Particulars (Rs. Mn.) FY04 FY05 FY06 FY07 FY08
Total Revenues 328.6 371.5 543.2 706.1 994.5
OPM (%) 28.6% 24.4% 31.9% 34.1% 37%
EPS (Rs.) 11.7 9.2 16.2 20.0 28.5
P/E (x) 34.1 43.4 24.7 20.0 14.0
ROCE (%) 18.6% 13.3% 21.2% 18.4% 24.6%
RONW (%) 13.0% 9.6% 15.2% 13.6% 17.4%
Dividend Payout (%) 42.8% 38.1% 24.8% 22.5% 36.0%
18
Company BackgroundICRA
ICRA Limited (formerly Investment Information and Credit Rating Agency of India Limited) was set up in 1991 by
leading institutions and financial services companies as an independent and professional Investment Information and
Credit Rating Agency. Now, the international credit rating agency Moody's Investors Service is ICRA's largest
shareholder with ~29% stake. The participation of Moody's is supported by a Technical Services Agreement, which
entails Moody's providing certain high-value technical services to ICRA. Specifically, the agreement is aimed at
benefiting ICRA's in-house research capabilities, and providing it with access to Moody's global research base. Its key
business segments explained :
Ratings
ICRA rates rupee denominated debt instruments and also rates structured obligations and sector-specific debt
obligations. The other services offered include Corporate Governance Rating, Stakeholder Value and Governance
Rating, Corporate Governance Assessment, Credit Risk Rating of Debt Mutual Funds, Rating of Claims Paying Ability
of Insurance Companies, Project Finance Rating, and Line of Credit Rating. ICRA along with NSIC has also launched
a Performance and Credit Rating Scheme for Small Scale Enterprises in India.
Grading
The Grading Services offered by ICRA employ concepts and methodologies, and include Grading of: Construction
Entities; Real Estate Developers and Projects; Healthcare Entities; Maritime Training Institutes; and Initial Public
Offers (IPOs).
Information Services, Research & Publications
ICRA provides sector/industry-specific studies/publications and mandate-based studies (customized research) to
intermediaries, financial institutions, banks, asset managers, institutional and individual investors, and others.
Consulting Services
ICRA Management Consulting Services Limited (IMaCS), a wholly owned subsidiary offers Consulting Services in
Strategy, Risk Management, Regulatory Economics, Transaction Advisory, and Process Re-engineering to various
clients including multi-lateral agencies. Besides India, IMaCS has consulting experience across 35 countries in South
East Asia, Northern Asia, West Asia, Africa, Western Europe, and North America.
Software Development
ICRA Techno Analytics Limited (ICTEAS), a subsidiary of ICRA offers services like traditional development of client-
server, web-centric and mobile applications and also business analytics. Recently, ICTEAS acquired Kolkota based
software services company, Axiom Technologies Pvt Ltd.
Online Software and Knowledge Process Outsourcing
ICRA Online Limited has two SBUs with a list of reputed global and domestic clients:
a) The Information Services and Technology Solutions Division (MFI Division), and
b) The Knowledge Process Outsourcing Division (KPO Division)
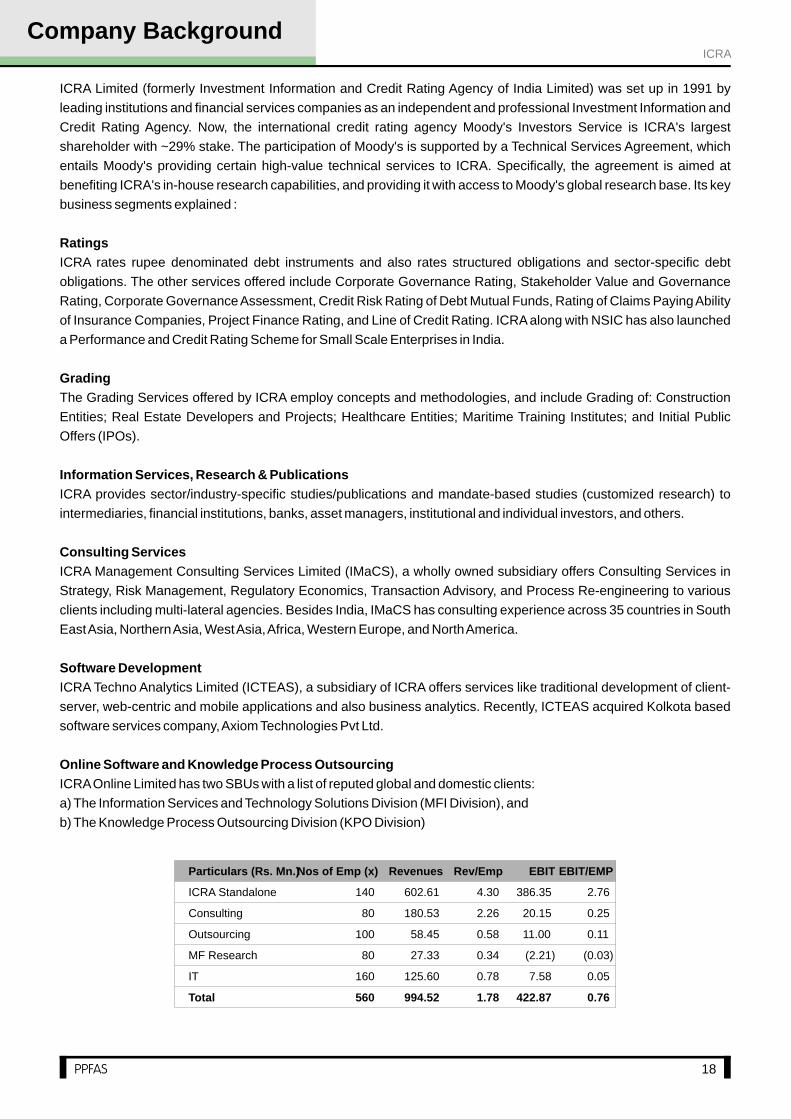
Particulars (Rs. Mn.)Nos of Emp (x) Revenues Rev/Emp EBIT EBIT/EMP
ICRA Standalone 140 602.61 4.30 386.35 2.76
Consulting 80
180.53
2.26
20.15 0.25
Outsourcing 100
58.45
0.58
11.00 0.11
MF Research 80
27.33
0.34
(2.21) (0.03)
IT 160
125.60
0.78
7.58 0.05
Total 560 994.52 1.78 422.87 0.76

19
Quarterly FinancialsICRA
Earnings Statement
YE March (Rs. Mn.) Q209 Q109 Q-Q(%) Q208 Y-Y(%) H109 H108 Y-Y(%)
Net Revenues 343.3 254.2 35.05% 261.6 31.26% 597.6 460.8 29.68%
Total Expenditure 192.7 176.4 9.29% 162.4 18.67% 369.1 303.8 21.48%
Operating Profit 150.6 77.9 93.38% 99.2 51.87% 228.5 157.0 45.54%
Other Income 10.8 34.3 -68.43% 20.6 -47.52% 45.1 35.7 26.41%
EBITDA 161.4 112.1 43.95% 119.8 34.77% 273.6 192.6 42.00%
Depreciation 9.5 9.3 1.60% 9.2 3.01% 18.8 17.1 9.58%
EBIT 152.0 102.8 47.79% 110.6 37.41% 254.8 175.5 45.17%
Interest 0.1 0.1 0.00% 0.0 0.00% 0.1 0.0 0.00%
PBT 151.9 102.8 47.79% 110.6 37.34% 254.6 175.5 45.10%
Tax 53.6 30.3 76.96% 29.0 84.93% 83.9 50.0 67.88%
PAT before MI 98.2 72.5 35.60% 81.6 20.42% 170.7 125.5 36.02%
Minority Interest 0.0 0.0 0.0 0.0 0.0
PAT after MI 98.2 72.5 35.60% 81.6 20.42% 170.7 125.5 36.02%
Equity Capital 100.0 100.0 0.00% 100.0 0.00% 100.0 100.0 0.00%
EPS 9.82
7.25
35.45% 8.16
20.34% 17.07
12.55
36.02%
Ratio Analysis
Profitability
YE March (Rs. Mn.) Q209 Q109 Q-Q(bps) Q208 Y-Y(bps) H109 H108 Y-Y(bps)
OPM (%) 43.86% 30.63% 1,323.2 37.91% 595.4 38.23% 34.07% 416.7
EBITDA (%) 47.01% 44.11% 290.9 45.79% 122.5 45.78% 41.80% 397.2
EBIT (%) 44.26% 40.44% 381.7 42.27% 198.1 42.63% 38.08% 454.9
PAT (%) 28.61% 28.50% 11.6 31.19% (257.6) 28.56% 27.23% 133.1
0
100
200
300
400
Mar 07 Jun 07 Sept 07 Dec 07 Mar 08 Jun 08 Sept 08
Rating Services Fees Consulting Fees Information Services Fees
Outsourced Services Fees Professional Services Fees
Segmental Revenue Mix (Rs. Mn.)
Segmental Profit Mix (Rs. Mn.)
(10)
50
110
170
Mar 07 Jun 07 Sept 07 Dec 07 Mar 08 Jun 08 Sept 08
Rating Services Fees Consulting Fees Information Services Fees
Outsourced Services Fees Professional Services Fees

20
ICRA
Segment Analysis
Segment Revenues FY05 FY06 FY07 FY08
Rating Services Fees 256.2 312.9 389.0 602.6
Consulting Fees 95.1 121.3 150.5 180.5
Information Services Fees 20.3 15.6 19.6 27.3
Outsourced Services Fees 0.0 20.8 42.8 58.5
Professional Services Fees 0.0 72.6 104.2 125.6
Total 371.5 543.2 706.1 994.5
Segment Revenue Mix FY05 FY06 FY07 FY08
Rating Services Fees 68.9% 57.6% 55.1% 60.6%
Consulting Fees 25.6% 22.3% 21.3% 18.2%
Information Services Fees 5.5% 2.9% 2.8% 2.7%
Outsourced Services Fees 0.0% 3.8% 6.1% 5.9%
Professional Services Fees 0.0% 13.4% 14.8% 12.6%
Y-Y Revenue Growth FY06 FY07 FY08
Rating Services Fees 22.2% 24.3% 54.9%
Consulting Fees 27.6% 24.0% 20.0%
Information Services Fees -23.2% 26.1% 39.1%
Segment Profits FY05 FY06 FY07 FY08
Rating Services Fees 162.3 186.9 239.7 386.4
Consulting Fees 5.7 22.2 35.8 20.2
Information Services Fees (25.3) (11.4) (4.7) (2.2)
Outsourced Services Fees 0.0 4.4 12.9 11.0
Professional Services Fees 0.0 8.7 15.2 7.6
Total 142.7 210.9 298.9 422.9
Segment Profit Mix FY05 FY06 FY07 FY08
Rating Services Fees 113.7% 88.6% 80.2% 91.4%
Consulting Fees 4.0% 10.5% 12.0% 4.8%
Information Services Fees -17.7% -5.4% -1.6% -0.5%
Outsourced Services Fees 0.0% 2.1% 4.3% 2.6%
Professional Services Fees 0.0% 4.1% 5.1% 1.8%
Segment Margins FY05 FY06 FY07 FY08
Rating Services Fees 63.4% 59.7% 61.6% 64.1%
Consulting Fees 6.0% 18.3% 23.8% 11.2%
Information Services Fees -124.8% -72.9% -24.0% -8.1%
Outsourced Services Fees n.a. 21.3% 30.0% 18.8%
Professional Services Fees n.a. 12.0% 14.6% 6.0%
Total 38.4% 38.8% 42.3% 42.5%
For ICRA, pure Ratings constitute ~60% of revenues & over 90% of profits. On paper Crisil’s margins for ratings
areblended & lower as it also includes GAC’s business within ratings, whereas ICRA shows Outsourcing Services
separately. However, the other businesses of ICRA are at an early life-cycle stage and are earning relatively lower
margins. We feel that this is where, Crisil makes up & outperforms ICRA in the overall return ratios.
21
FinancialsICRA
Earnings Statement
Particulars (Rs. Mn.) FY04 FY05 FY06 FY07 FY08 FY09 E FY10 E
Total Revenues 328.6 371.5 543.2 706.1 994.5 1,158.1 1,389.7
- Growth (%) 13.1% 46.2% 30.0% 40.9% 16.4% 20.0%
Total Expenditure 234.7 281.1 370.0 465.0 631.1 686.9 835.3
Operating Profit 93.9 90.5 173.2 241.0 363.4 471.2 554.4
- Growth (%) -3.7% 91.4% 39.2% 50.8% 29.7% 17.7%
Other Income 68.1 36.5 49.9 60.0 78.8 65.1 74.8
EBITDA 162.0 127.0 223.1 301.1 442.2 536.2 629.2
- Growth (%) -21.7% 75.7% 34.9% 46.9% 21.3% 17.3%
Depreciation 13.7 14.3 23.2 28.9 38.0 38.8 46.5
EBIT 148.3 112.7 199.9 272.2 404.2 497.5 582.7
Interest 0.0 0.0 1.4 0.5 0.0 0.3 0.4
PBT 148.3 112.7 198.6 271.7 404.1 497.1 582.3
Tax 45.3 31.7 56.3 71.8 119.0 166.4 198.0
PAT Before MI 103.0 81.0 142.3 199.9 285.1 330.7 384.3
Minority Interest 0.0 0.0 0.0 0.0 0.0 0.0 0.0
PAT Before EI 103.0 81.0 142.3 199.9 285.1 330.7 384.3
- Growth (%) -21.4% 75.7% 40.5% 42.6% 16.0% 16.2%
Extraordinary Items (0.6) 0.4 (0.7) (0.1) (0.3) 0.0 0.0
Reported PAT 102.37 81.36 141.60 199.86 284.77 330.73 384.30
Ratio Analysis
Particulars FY04 FY05 FY06 FY07 FY08 FY09 E FY10 E
OPM (%) 28.6% 24.4% 31.9% 34.1% 37% 41% 40%
EBITDA (%) 49.3% 34.2% 41.1% 42.6% 44% 46% 45%
PAT (%) 31.3% 21.8% 26.2% 28.3% 29% 29% 28%
Interest Cover (x) n.a. n.a. 148.0 570.6 44,906.4 1,471.8 1,436.6
EPS (Rs.) 11.7 9.2 16.2 20.0 28.5 33.1 38.4
P/E (x) 34.1 43.4 24.7 20.0 14.0 12.1 10.4
P/BV (x) 4.4 4.2 3.8 2.7 2.4 2.2 1.9
BVPS (Rs.) 90.3 95.6 106.3 147.4 163.9 183.0 205.2
Market Cap (Rs. Mn.) 3,513.2 3,513.2 3,513.2 3,990.0 3,990.0 3,990.0 3,990.0
M Cap/Sales (x) 10.7 9.5 6.5 5.7 4.0 3.4 2.9
EV (Rs. Mn.) 3,480.7 3,475.5 3,450.6 (24,361.7) 3,734.6 3,720.2 3,722.6
EV/EBITDA (x) 21.5 27.4 15.5 (80.9) 8.4 6.9 5.9
EV/Sales (x) 10.6 9.4 6.4 (34.5) 3.8 3.2 2.7
ROCE (%) 18.6% 13.3% 21.2% 18.4% 24.6% 27.1% 28.4%
RONW (%) 13.0% 9.6% 15.2% 13.6% 17.4% 18.1% 18.7%
Debt/Equity Ratio (x) 0.0 0.0 0.0 0.0 0.0 0.0 0.0
Inventory T/o Days 0.0 0.0 0.0 0.0 0.0 0.0 0.0
Debtors T/o Days 80.3 97.7 85.8 99.7 78.7 90.0 90.0
Advances T/o Days 65.1 56.0 59.0 212.1 179.1 130.0 130.0
Creditors T/o Days 56.1 53.5 51.3 14,431.2 86.7 50.0 50.0
Wrkg Cap T/o Days (Ex.Cash) (17.1) 24.1 24.2 (14,193.0) 70.7 112.5 112.2
Fixed Assets T/o (Gross) 1.4 1.3 1.6 1.9 2.5 2.6 2.8
DPS (Rs.) 5.0 3.5 4.0 4.5 10.3 11.9 13.8
Dividend Payout (%) 42.8% 38.1% 24.8% 22.5% 36.0% 36.0% 36.0%
Dividend Yield (%) 1.3% 0.9% 1.0% 1.1% 2.6% 3.0% 3.5%
22
FinancialsICRA
Balance Sheet
Particulars (Rs. Mn.) FY05 FY06 FY07 FY08 FY09 E FY10 E
Equity Capital 88.1 88.1 100.0 100.0 100.0 100.0
Reserves 753.3 848.2 1,373.9 1,538.6 1,730.0 1,952.4
Shareholders Funds 841.4 936.2 1,473.9 1,638.6 1,830.0 2,052.4
Minority Interest 0.0 0.1 0.0 0.0 0.0 0.0
Borrowed Funds 0.0 0.6 0.3 0.0 0.0 0.0
Deferred Tax Liability 3.9 6.5 7.4 2.8 2.8 2.8
Total Liabilities 845.2 943.4 1,481.6 1,641.3 1,832.8 2,055.2
Fixed Assets 185.6 198.8 229.1 237.2 247.8 251.2
Goodwill On Consolidation 0.0 51.4 51.5 51.5 51.5 51.5
Investments 596.6 589.6 685.7 901.9 901.9 1,051.9
Current Assets
Inventory 0.0 0.0 0.0 0.0 0.0 0.0
Sundry Debtors 100.8 129.5 195.6 217.4 289.5 347.4
Loans & Advances 57.8 89.0 415.9 494.8 418.2 501.8
Cash & Bank Balance 37.7 63.3 28,352.0 255.4 269.8 267.4
Other Current Assets 2.3 2.5 2.6 5.5 5.0 5.0
Current Liabilities
Liabilities 55.3 77.3 28,304.2 239.4 160.8 193.0
Provisions 80.8 107.1 146.9 282.9 190.1 228.1
Net Current Assets 62.6 99.9 515.1 450.8 631.6 700.6
Miscellaneous Exp W/Off 0.4 3.6 0.2 0.0 0.0 0.0
Total Assets 845.2 943.4 1,481.6 1,641.3 1,832.8 2,055.2
Cash Flow
Particulars (Rs. Mn.) FY05 FY06 FY07 FY08 FY09 E FY10 E
Opening Cash & Bank 32.5 37.7 63.3 28,352.0 255.4 269.8
Profit After Tax 81.4 141.6 199.9 284.8 330.7 384.3
Invt Income (36.5) (49.9) (60.0) (78.8) (65.1) (74.8)
Interest Paid 0.0 1.4 0.5 0.0 0.3 0.4
Miscellaneous Exp W/Off 0.1 (3.2) 3.4 0.2 0.0 0.0
Depreciation 14.3 23.2 28.9 38.0 38.8 46.5
Deferred Taxation 0.3 2.6 1.0 (4.7) 0.0 0.0
Others (2.6) 7.0 (24.2) (7.2) 0.0 0.0
Change in Working Cap (40.5) (11.7) 27,873.5 (28,032.4) (166.4) (71.4)
CF - Operating Activities 16.4 110.9 28,022.9 (27,800.0) 138.4 285.1
Change in Fixed Assets (59.8) (43.4) (35.0) (39.0) (49.4) (50.0)
Change in Goodwill 0.0 (51.4) (0.1) 0.0 0.0 0.0
Change in Investments 47.3 7.1 (96.1) (216.1) 0.0 (150.0)
Investment Income 36.5 49.9 60.0 78.8 65.1 74.8
CF - Investing Activities 23.9 (37.9) (71.2) (176.3) 15.7 (125.2)
Increase in Equity 0.0 (6.6) 390.4 (0.0) 0.0 0.0
Changes in Borrowings 0.0 0.6 (0.3) (0.3) 0.0 0.0
Interest Paid 0.0 (1.4) (0.5) (0.0) (0.3) (0.4)
Dividend Paid (35.1) (40.2) (52.6) (120.1) (139.3) (161.9)
CF - Financing Activities (35.1) (47.5) 337.0 (120.4) (139.6) (162.3)
Net Change in Cash 5.2 25.6 28,288.7 (28,096.7) 14.4 (2.4)
Closing Cash & Bank Bal 37.7 63.3 28,352.0 255.4 269.8 267.4

Face Value CMP Year End Exchange Ticker
$1 $22.15 December NYSE MHP
23
Standard & Poor's is a leading provider of financial market intelligence. Many
investors know S&P for its respected role as an independent provider of credit
ratings and as the home of the S&P 500 benchmark index. But Standard &
Poor's global organization also:
Provides a wide array of financial data and information,
Is the largest source of independent equity research and a leader in
mutual fund information and analysis
S&P employs approximately 8,500 employees located in 23 countries and
markets.
Standard & Poor's traces its origins to the publication, in 1860, of Henry
Varnum Poor's “History of Railroads and Canals in the United States”, a
precursor of modern stock reporting and analysis.
In 1906, the Standard Statistics Bureau was formed to provide previously
unavailable financial information on U.S. companies and started the ratings
businesses thereafter in 1916. In 1941, Poor's Publishing and Standard
Statistics merged to form the Standard & Poor's Corporation. In 1966, The
McGraw-Hill Companies, Inc. acquired Standard & Poor's. S&P acquired a
majority stake in Crisil in 2005, in which it now owns 51.5%.
Key business services for S&P include Ratings, Indices, Equity Research,
Risk Solutions and Data Services. S&P is an unlisted entity & there is no
specific public financial information available. However, its parent The
McGraw-Hill Companies, Inc. is a listed entity. Divisional breakup of
McGraw Hill provides the financial statistics for S&P business.
Introduction
History
Business
Revenue Mix - $ Mn. CY04 CY05 CY06 CY07
S&P 2,055.0 2,401.0 2,746.0 3,046.0
Total McGraw Hill 5,251.0 6,004.0 6,255.0 6,772.0
S&P as % of Total 39.14% 39.99% 43.90% 44.98%
Profit Mix - $ Mn. CY04 CY05 CY06 CY07
S&P 839.0 1,019.0 1,202.0 1,359.0
Total McGraw Hill 1,298.0 1,490.0 1,581.0 1,822.0
S&P as % of Total 64.64% 68.39% 76.03% 74.59%

24
The McGraw-Hill Companies is driving the financial services, education and
business information markets through leading brands such as Standard &
Poor's, BusinessWeek and McGraw-Hill Education.
The book departments of the two publishing companies, namely "The
McGraw Publishing Company" founded by James H. McGraw & "The Hill
Publishing Company" founded by John A. Hill merged to form the McGraw-
Hill Book Company in 1909. Over the next many decades, the company
expanded organically, inorganically & geographically, especially in the area of
education publishing. The acquisition of Standard & Poor's in 1966 is a
landmark event for McGraw Hill. The group has capitalized of the high growth
prospects in the field of financial services, education & business information
and has established various sub-brands like McGraw Hill Education,
Standard & Poor's, Business Week, Plats, McGraw Hill Construction, Aviation
Week, McGraw Hill Broadcasting & JD Power. Its Broadcasting Group
operates 4 ABC affiliated television stations and 5 Spanish language stations
affiliated with Azteca America.
Overview
The McGraw Hill Corp. Inc.The McGraw Hill Corporation
Revenue Mix - $ Mn. CY04 CY05 CY06 CY07
McGraw Hill Education
- SEG 1,279.0 1,515.0 1,327.0 1,417.0
- HPI 1,117.0 1,157.0 1,197.0 1,289.0
SubTotal 2,396.0 2,672.0 2,524.0 2,706.0
Financial Services (S&P)
- CMS 1,487.5 1,738.0 2,074.0 2,264.0
- IS 567.5 663.0 672.0 782.0
SubTotal 2,055.0 2,401.0 2,746.0 3,046.0
Information & Media
- B2B 686.0 819.0 864.0 917.0
- Broadcasting 114.0 112.0 121.0 103.0
SubTotal 800.0 931.0 985.0 1,020.0
Total 5,251.0 6,004.0 6,255.0 6,772.0
Revenue Mix - % CY04 CY05 CY06 CY07
McGraw Hill Education
- SEG 24.4% 25.2% 21.2% 20.9%
- HPI 21.3% 19.3% 19.1% 19.0%
SubTotal 45.6% 44.5% 40.4% 40.0%
Financial Services (S&P)
- CMS 28.3% 28.9% 33.2% 33.4%
- IS 10.8% 11.0% 10.7% 11.5%
SubTotal 39.1% 40.0% 43.9% 45.0%
Information & Media
- B2B 13.1% 13.6% 13.8% 13.5%
- Broadcasting 2.2% 1.9% 1.9% 1.5%
SubTotal 15.2% 15.5% 15.7% 15.1%
Total 100.0% 100.0% 100.0% 100.0%
SEG: School Education Group
HPI: Higher Education, Professional &
International Group
CMS: Credit Market Services
IS: Investment Services
B2B: Business to Business Group
(Automotive, Aerospace, Defense,
Construction & Energy)

25
Profit Mix - $ Mn. CY04 CY05 CY06 CY07
McGraw Hill Education 340.0 410.0 329.0 400.0
Financial Services (S&P) 839.0 1,019.0 1,202.0 1,359.0
Information & Media 119.0 61.0 50.0 63.0
Total 1,298.0 1,490.0 1,581.0 1,822.0
Profit Mix - % CY04 CY05 CY06 CY07
McGraw Hill Education 26.2% 27.5% 20.8% 22.0%
Financial Services (S&P) 64.6% 68.4% 76.0% 74.6%
Information & Media 9.2% 4.1% 3.2% 3.5%
Total 100.0% 100.0% 100.0% 100.0%
Profit Margin - % CY04 CY05 CY06 CY07
McGraw Hill Education 14.2% 15.3% 13.0% 14.8%
Financial Services (S&P) 40.8% 42.4% 43.8% 44.6%
Information & Media 14.9% 6.6% 5.1% 6.2%
Total 24.7% 24.8% 25.3% 26.9%
Revenue Y-Y Growth CY05 CY06 CY07
McGraw Hill Education
- SEG 18.5% -12.4% 6.8%
- HPI 3.6% 3.5% 7.7%
SubTotal 11.5% -5.5% 7.2%
Financial Services (S&P)
- CMS 16.8% 19.3% 9.2%
- IS 16.8% 1.4% 16.4%
SubTotal 16.8% 14.4% 10.9%
Information & Media
- B2B 19.4% 5.5% 6.1%
- Broadcasting -1.8% 8.0% -14.9%
SubTotal 16.4% 5.8% 3.6%
Total 14.3% 4.2% 8.3%
Profit Y-Y Growth CY05 CY06 CY07
McGraw Hill Education 20.6% -19.8% 21.6%
Financial Services (S&P) 21.5% 18.0% 13.1%
Information & Media -48.7% -18.0% 26.0%
Total 14.8% 6.1% 15.2%
Even here, Financial Services is the most profitable business followed by
Education. It constitutes ~45% of sales & almost 75% of profits. Also it has
delivered better growth in the past 3 years. Sure the Financial Services
business is facing turbulent times, but its importance in the overall MHP
business can certainly not be undermined.
We believe there is a reasonable case for Crisil to follow its parent S&P for its
growth perspective. However we also perceive that, the connection will be
limited to S&P and will not go the McGraw Hill, which is already present in
India through its tie up with Tata Group.
The McGraw Hill Corporation

26
Financials
Earnings Statement Balance Sheet
Particulars (Mn. $) CY05 CY06 CY07 CY08E Particulars (Mn. $) CY05 CY06 CY07 CY08E
Total Revenues 6,003.6 6,255.1 6,772.3 6,542.8 Equity Capital 411.7 411.7 411.7 411.7
- Growth (%) 14.3% 4.2% 8.3% -3.4% Reserves 2,701.4 2,267.9 1,194.9 1,651.3
Total Expenditure 4,488.7 4,674.6 4,965.5 5,145.5 Shareholders Funds 3,113.1 2,679.6 1,606.7 2,063.0
Operating Profit 1,514.9 1,580.6 1,806.8 1,397.3 Minority Interest 0.0 0.0 0.0 0.0
- Growth (%) 16.6% 4.3% 14.3% -22.7% Borrowed Funds 1,057.8 895.3 2,093.8 1,993.8
Other Income 1.2 0.0 17.3 353.4 Deferred Tax Liability (287.4) (244.7) (280.5) (280.5)
EBITDA 1,516.1 1,580.6 1,824.1 1,750.8 Total Liabilities 3,883.6 3,330.2 3,420.0 3,776.3
- Growth (%) 16.7% 4.2% 15.4% -4.0% Fixed Assets 526.8 542.2 660.8 842.0
Depreciation 151.0 161.6 161.0 318.8 PrePublication Costs 454.6 507.8 573.2 573.2
EBIT 1,365.2 1,419.0 1,663.1 1,432.0 Goodwill 2,352.0 2,324.9 2,336.1 2,336.1
Interest 5.2 13.6 40.6 116.3 Investments 471.5 410.0 454.2 454.2
PBT 1,360.0 1,405.4 1,622.5 1,315.7 Current Assets
Tax 515.7 522.6 609.0 497.0 Inventory 335.3 322.2 350.7 345.3
PAT Before EI 844.3 882.8 1,013.6 818.7 Sundry Debtors 1,114.3 1,237.3 1,189.2 1,181.3
- Growth (%) 11.6% 4.6% 14.8% -19.2% Loans & Advances 105.2 100.3 116.5 127.2
Extraordinary Items Cash & Bank Balance 748.8 353.5 396.1 461.3
Reported PAT 844.31 882.77 1013.56 818.67 Current Liabilities
Liabilities 2,224.8 2,468.0 2,656.9 2,544.4
Ratio Analysis Provisions 0.0 0.0 0.0 0.0
Particulars (Mn. $) CY05 CY06 CY07 CY08E Net Current Assets 78.7 (454.8) (604.4) (429.2)
OPM (%) 25.2% 25.3% 26.7% 21% Total Assets 3,883.6 3,330.2 3,420.0 3,776.3
EBITDA (%) 25.3% 25.3% 26.9% 27%
PAT (%) 14.1% 14.1% 15.0% 13% Cash Flow
Interest Cover (x) 262.4 104.1 41.0 12.3 Particulars (Mn. $) CY05 CY06 CY07 CY08E
EPS (Rs.) 2.1 2.1 2.5 2.0 Opening Cash & Bank 680.6 748.8 353.5 396.1
P/E (x) 10.8 10.3 9.0 11.1 Profit After Tax 844.3 882.8 1,013.6 818.7
P/BV (x) 2.9 3.4 5.7 4.4 Invt Income (1.2) 0.0 (17.3) (353.4)
BVPS ($) 7.6 6.5 3.9 5.0 Interest Paid 5.2 13.6 40.6 116.3
Market Cap (Mn.$) 9,119.4 9,119.4 9,119.4 9,119.4 Miscellaneous Exp W/Off 0.0 (53.2) (65.3) 0.0
M Cap/Sales (x) 1.5 1.5 1.3 1.4 Depreciation 151.0 161.6 161.0 318.8
EV (Rs. Mn.) 9,428.4 9,661.1 10,817.1 10,651.9 Deferred Taxation 0.0 0.0 0.0 0.0
EV/EBITDA (x) 6.2 6.1 5.9 6.1 Others (142.3) (36.3) (98.9) (0.0)
EV/Sales (x) 1.6 1.5 1.6 1.6 Change in Working Cap 210.5 138.2 192.2 (109.9)
ROCE (%) 35.0% 42.2% 47.4% 34.8% CF - Operating Activities 1,067.5 1,106.7 1,225.8 790.4
RONW (%) 27.1% 32.9% 63.1% 39.7% Change in Fixed Assets (502.2) (71.0) (227.7) (500.0)
Debt/Equity Ratio (x) 0.3 0.3 1.3 1.0 Change in Investments 48.9 61.6 (44.3) 0.0
Inventory T/o Days 20.1 18.5 18.6 19.0 Investment Income 1.2 0.0 17.3 353.4
Debtors T/o Days 66.8 71.2 63.2 65.0 CF - Investing Activities (452.1) (9.4) (254.7) (146.6)
Advances T/o Days 6.3 5.8 6.2 7.0 Increase in Equity (443.9) (1,017.4) (1,748.9) 0.0
Creditors T/o Days 133.4 142.0 141.2 140.0 Changes in Borrowings 148.0 (162.6) 1,198.6 (100.0)
WCap T/o Days (40.2) (46.5) (53.2) (49.0) Interest Paid (5.2) (13.6) (40.6) (116.3)
Fixed Assets T/o (Gross) 4.6 4.5 4.2 3.1 Dividend Paid (246.0) (298.9) (337.6) (362.3)
DPS ($) 0.7 0.7 0.8 0.9 CF - Financing Activities (547.2) (1,492.5) (928.5) (578.6)
Dividend Payout (%) 32.2% 33.9% 33.3% 44.3% Net Change in Cash 68.2 (395.3) 42.6 65.2
Dividend Yield (%) 3.0% 3.3% 3.7% 4.0% Closing Cash & Bank Bal 748.8 353.5 396.1 461.3
The McGraw Hill Corporation
Face Value CMP Year End Exchange Ticker
$0.10 $23.07 December NYSE MCO
27
Moody's is a provider of (i) credit ratings and related research, data and
analytical tools, (ii) quantitative credit risk measures, risk scoring software
and credit portfolio management solutions and (iii) beginning in January
2008, fixed income pricing data and valuation models.
Founded in 1900, Moody's employs approximately 3,600 people worldwide &
maintains offices in 27 countries. Prior to September 30, 2000, the Company
operated as part of The Dun & Bradstreet Corporation. In November 1996,
The Dun & Bradstreet Corporation separated into three separate public
companies: The Dun & Bradstreet Corporation, ACNielsen Corporation and
Cognizant Corporation (“Cognizant”). In June 1998, The Dun & Bradstreet
Corporation separated into two separate public companies: Old D&B and
R.H. Donnelley Corporation. During 1998, Cognizant separated into two
separate public companies: IMS Health Incorporated (“IMS Health”) and
Nielsen Media Research, Inc. (“NMR”). In September 2000, Old D&B
separated into two separate public companies: New D&B and Moody's.
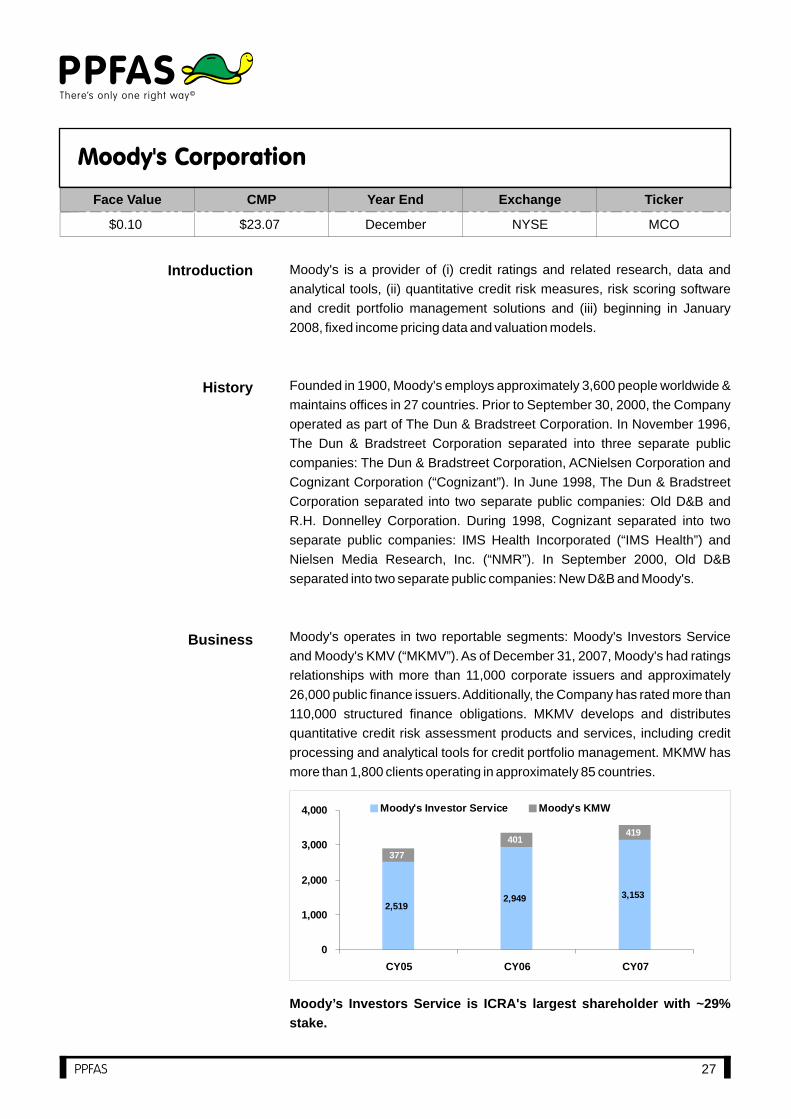
Moody's operates in two reportable segments: Moody's Investors Service
and Moody's KMV (“MKMV”). As of December 31, 2007, Moody's had ratings
relationships with more than 11,000 corporate issuers and approximately
26,000 public finance issuers. Additionally, the Company has rated more than
110,000 structured finance obligations. MKMV develops and distributes
quantitative credit risk assessment products and services, including credit
processing and analytical tools for credit portfolio management. MKMW has
more than 1,800 clients operating in approximately 85 countries.
Moody’s Investors Service is ICRA's largest shareholder with ~29%
stake.
Introduction
History
Business
2,5192,949 3,153
377
401419
0
1,000
2,000
3,000
4,000
CY05 CY06 CY07
Moody's Investor Service Moody's KMW

28
Segment AnalysisMoody's Corporation
Moody is a listed company and ~ a pure play on rating business. In
terms of size it is close 2nd to S&P with slightly better margins.
There is certainly an enormous scope for outsourcing from Moody’s to ICRA
to increase. Crisil (GAC) has ~ 500 people vs. ICRA having ~100 people in
Outsourcing services. This may not happen in the near future as Moodys is
facing extremely tough in the international financial crisis. Also its stake in
ICRA is just 29% vs. 51.5% for S&P in to Crisil. Over the years we expect both
Moody’s stake in ICRA and Moody’s outsourcing to ICRA to increase
substantially.
Moody has gone way ahead in its strive for shareholder value creation.
It has actually borrowed money and has been buying back its shares
from the market. In the interim the company was running on a negative
networth; i.e. technically speaking, its ROE is infinite. Moodys is
majorly owned by institutions (>85%), with Warren Buffett’s Berkshire
Hathway being the largest holder at over 20%.
Segment Revenues CY05 CY06 CY07
Moody's Investor Service 1,425.6 1,685.6 1,835.4
Moody's KMW 346.7 397.3 479.1
Eliminations (40.7) (45.8) (55.5)
Total 1,731.6 2,037.1 2,259.0
Segment Revenue Mix CY05 CY06 CY07
Moody's Investor Service 80.4% 80.9% 79.3%
Moody's KMW 19.6% 19.1% 20.7%
Y-Y Revenue Growth CY06 CY07
Moody's Investor Service 18.2% 8.9%
Moody's KMW 14.6% 20.6%
Total 17.6% 10.9%
Segment Profits CY05 CY06 CY07
Moody's Investor Service 855.7 1,002.2 1,010.7
Moody's KMW 83.9 96.7 120.3
Total 939.6 1,098.9 1,131.0
Segment Profit Mix CY05 CY06 CY07
Moody's Investor Service 91.1% 91.2% 89.4%
Moody's KMW 8.9% 8.8% 10.6%
Segment Margins CY05 CY06 CY07
Moody's Investor Service 60.0% 59.5% 55.1%
Moody's KMW 24.2% 24.3% 25.1%
Total 54.3% 53.9% 50.1%
People CY05 CY06 CY07
Moody's Investor Service 2,519 2,949 3,153
Moody's KMW 377 401 419
Total Resource 2,896 3,350 3,572
S&P ($Mn) CY07
Credit Market Services 2,264.0
Investment Services 782.0
Total Revenues 3,046.0
Total Profit 1,359.0
Moodys ($Mn) CY07
Moody's Investor Service 1,835.4
Moody's KMW 479.1
Total Revenues 2,314.5
Total Profit 1131

Earnings Statement Balance Sheet
Particulars ($ Mn.) CY05 CY06 CY07 CY08E Particulars ($ Mn.) CY05 CY06 CY07 CY08E
Total Revenues 1,731.6 2,037.1 2,259.0 1,802.3 Equity Capital 3.4 3.4 3.4 3.4
- Growth (%) 20.4% 17.6% 10.9% -20.2% Reserves 306.0 164.0 (787.0) (869.3)
Total Expenditure 756.8 898.7 1,085.1 913.3 Shareholders Funds 309.4 167.4 (783.6) (865.9)
Operating Profit 974.8 1,138.4 1,173.9 888.9 Minority Interest 0.0 0.0 0.0 0.0
- Growth (%) 18.8% 16.8% 3.1% -24.3% Borrowed Funds 568.9 630.3 1,149.0 1,339.3
Other Income 5.0 3.0 10.0 20.3 Deferred Tax Liability
EBITDA 979.8 1,141.4 1,183.9 909.2 Total Liabilities 878.3 797.7 365.4 473.4
- Growth (%) 19.3% 16.5% 3.7% -23.2% Fixed Assets 55.4 62.0 214.6 242.1
Depreciation 35.2 39.5 42.9 58.5 Goodwill+Intangibles 222.9 241.8 236.8 266.5
EBIT 944.6 1,101.9 1,141.0 850.7 Current Assets
Interest 9.9 2.0 24.3 48.7 Inventory 0.0 0.0 0.0 0.0
PBT 934.7 1,099.9 1,116.7 802.0 Sundry Debtors 421.8 475.4 443.6 348.7
Tax 373.9 506.6 415.2 310.1 Other Assets 70.7 192.0 274.1 267.9
PAT Before EI 560.8 593.3 701.5 491.9 Cash & Bank Balance 580.5 483.5 441.0 473.7
- Growth (%) 31.9% 5.8% 18.2% -29.9% Other Current Assets 105.9 43.0 104.5 123.3
Extraordinary Items 0.0 160.6 0.0 0.0 Current Liabilities
Reported PAT 560.80 753.90 701.50 491.87 Liabilities 578.9 700.0 1,349.2 1,248.8
Provisions 0.0 0.0 0.0 0.0
Ratio Analysis Net Current Assets 600.0 493.9 (86.0) (35.2)
Particulars CY05 CY06 CY07 CY08E Miscellaneous Exp W/Off 0.0 0.0 0.0 0.0
OPM (%) 56.3% 55.9% 52.0% 49% Total Assets 878.3 797.7 365.4 473.4
EBITDA (%) 56.6% 56.0% 52.4% 50%
PAT (%) 32.4% 29.1% 31.1% 27% Cash Flow
Interest Cover (x) 95.4 551.0 47.0 17.5 Particulars ($ Mn.) CY05 CY06 CY07 CY08E
EPS (Rs.) 1.8 2.0 2.6 2.0 Opening Cash & Bank 613.4 580.5 483.5 441.0
P/E (x) 12.6 11.4 9.0 11.6 Profit After Tax 560.8 753.9 701.5 491.9
P/BV (x) 2.6 4.7 (1.0) (0.9) Invt Income (5.0) (3.0) (10.0) (20.3)
BVPS ($) 9.0 4.9 (22.9) (25.3) Interest Paid 9.9 2.0 24.3 48.7
Market Cap ($ Mn.) 791.1 791.1 791.1 791.1 Miscellaneous Exp W/Off 0.0 0.0 0.0 0.0
M Cap/Sales (x) 0.5 0.4 0.4 0.4 Depreciation 35.2 39.5 42.9 58.5
EV (Rs. Mn.) 779.5 937.9 1,499.1 1,656.7 Deferred Taxation 0.0 0.0 0.0 0.0
EV/EBITDA (x) 0.8 0.8 1.3 1.8 Others (35.2) (39.5) (42.9) (58.5)
EV/Sales (x) 0.5 0.5 0.7 0.9 Change in Working Cap (341.7) 9.1 537.4 (18.1)
ROCE (%) 106.4% 137.9% 305.6% 169.4% CF - Operating Activities 224.0 762.0 1,253.2 502.2
RONW (%) 181.2% 354.4% -89.5% -56.8% Change in Fixed Assets (10.2) (6.6) (152.6) (27.5)
Debt/Equity Ratio (x) 1.8 3.8 (1.5) (1.5) Change in Investments (20.5) (18.9) 5.0 (29.7)
Inventory T/o Days 0.0 0.0 0.0 0.0 Investment Income 5.0 3.0 10.0 20.3
Debtors T/o Days 87.7 84.0 70.7 69.7 CF - Investing Activities (25.7) (22.5) (137.6) (36.9)
Advances T/o Days 14.7 33.9 43.7 53.5 Increase in Equity (560.8) (886.0) (1,640.8) (574.2)
Creditors T/o Days 120.4 123.7 215.0 249.4 Changes in Borrowings 347.6 61.4 518.7 190.3
WCap T/o Days 4.1 1.8 (84.0) (101.7) Interest Paid (9.9) (2.0) (24.3) (48.7)
Fixed Assets T/o (Gross)31.3 32.9 10.5 7.4 Dividend Paid (8.1) (9.9) (11.7) 0.0
DPS ($) 0.2 0.3 0.3 0.2 CF - Financing Activities (231.2) (836.5) (1,158.1) (432.6)
Dividend Payout (%) 12.8% 14.3% 13.2% 11.8% Net Change in Cash (32.9) (97.0) (42.5) 32.7
Dividend Yield (%) 1.0% 1.3% 1.5% 1.0% Closing Cash & Bank Bal 580.5 483.5 441.0 473.7
29
FinancialsMoody's Corporation
30
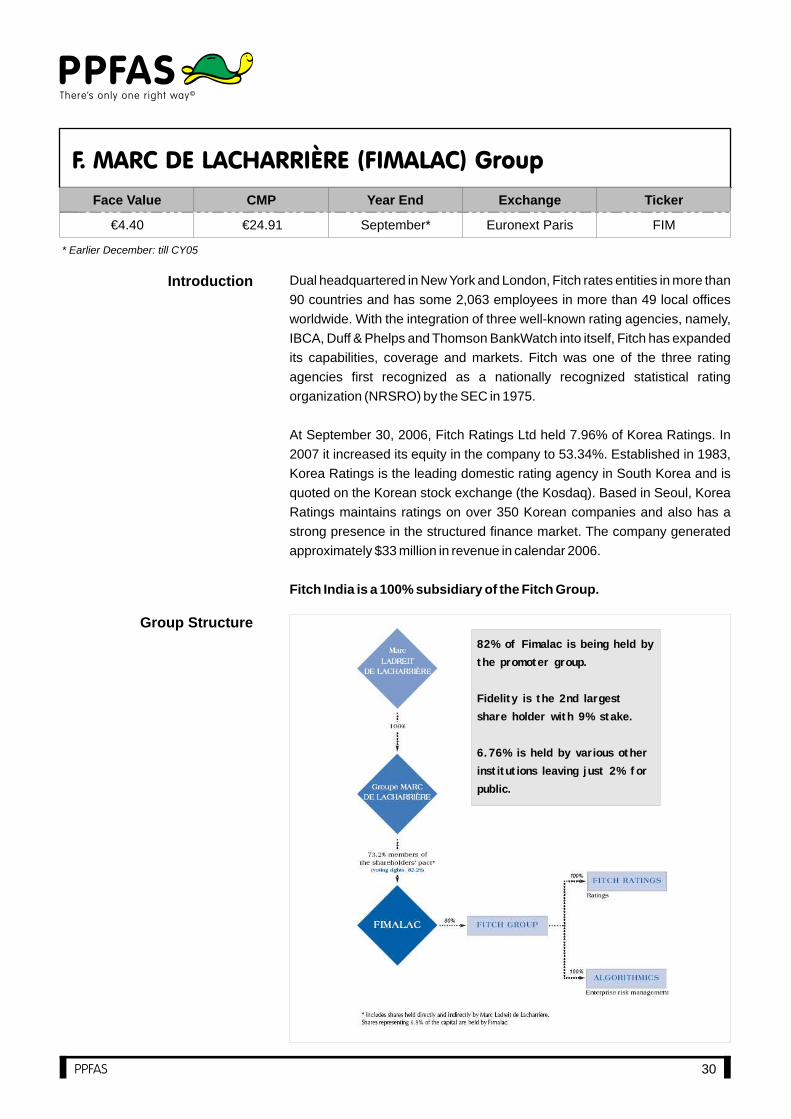
Dual headquartered in New York and London, Fitch rates entities in more than
90 countries and has some 2,063 employees in more than 49 local offices
worldwide. With the integration of three well-known rating agencies, namely,
IBCA, Duff & Phelps and Thomson BankWatch into itself, Fitch has expanded
its capabilities, coverage and markets. Fitch was one of the three rating
agencies first recognized as a nationally recognized statistical rating
organization (NRSRO) by the SEC in 1975.
At September 30, 2006, Fitch Ratings Ltd held 7.96% of Korea Ratings. In
2007 it increased its equity in the company to 53.34%. Established in 1983,
Korea Ratings is the leading domestic rating agency in South Korea and is
quoted on the Korean stock exchange (the Kosdaq). Based in Seoul, Korea
Ratings maintains ratings on over 350 Korean companies and also has a
strong presence in the structured finance market. The company generated
approximately $33 million in revenue in calendar 2006.
Fitch India is a 100% subsidiary of the Fitch Group.
Introduction
Face Value CMP Year End Exchange Ticker
€4.40 €24.91 September* Euronext Paris FIM
* Earlier December: till CY05
Group Structure
82% of Fimalac is being held by
the promoter group.
Fidelity is the 2nd largest
share holder with 9% stake.
6.76% is held by various other
institutions leaving just 2% for
public.

31
Fimalac Group
Fitch Ratings was founded as the Fitch Publishing Company on December
24, 1913 by John Knowles Fitch in New York. It began as a publisher of
financial statistics and soon became popular after the publications of the
"Fitch Bond Book" and the "Fitch Stock and Bond Manual". In 1924, Fitch
introduced the now familiar "AAA" to "D" ratings scale to meet the growing
demand for independent analysis of financial securities.
In 1989, Fitch was recapitalized by a new management team & experienced
dramatic growth since then. In 1997, Fitch merged with IBCA Limited,
headquartered in London and became a part of Fimalac S.A., a holding
company which acquired IBCA in 1992. With the acquisition of Chicago
headquartered, Duff & Phelps Credit Rating Co. in April 2000, Fitch
leapfrogged into global competition.
History
Segment Analysis

32
Financials
Earnings Statement Balance Sheet
Particulars (Euros Mn.) Dec 05Sept 06
(9M)Sept 07 Sept 08 Particulars (Euros Mn.) Dec 05
Sept 06 (9M)
Sept 07 Sept 08E
Total Revenues 557.9 457.4 744.8 586.9 Equity Capital 166.8 151.0 151.0 151.0
- Growth (%) 35.2% -18.0% 62.8% -21.2% Reserves 331.0 568.6 505.0 518.5
Total Expenditure 426.5 356.9 561.7 404.0 Shareholders Funds 497.8 719.7 656.0 669.5
Operating Profit 131.3 100.5 183.1 182.9 Minority Interest 0.7 78.2 102.1 102.1
- Growth (%) 52.7% -23.5% 82.3% -0.1% Borrowed Funds 189.9 130.7 157.5 257.5
Other Income 3.5 9.4 40.1 (35.7) Total Liabilities 688.4 928.6 915.6 1,029.1
EBITDA 134.8 109.9 223.2 147.2 Fixed Assets 48.2 50.4 359.5 409.5
- Growth (%) 58.2% -18.5% 103.1% -34.1% Goodwill & Intangibles 830.7 776.2 718.9 718.9
Depreciation 24.6 20.6 34.7 30.5 Investments in Associates 4.5 5.0 15.8 15.8
EBIT 110.2 89.3 188.5 116.7 Other Investments 40.2 42.8 62.2 62.2
Interest 21.4 9.5 15.4 23.4 Current Assets
PBT 88.8 79.9 173.1 93.3 Other Current Assets 496.7 182.1 136.1 122.3
Tax 40.3 29.1 74.8 62.7 Sundry Debtors 118.7 118.7 118.7 117.4
PAT Before EI 48.4 50.7 98.3 30.7 Loans & Advances 30.9 38.0 42.5 40.2
- Growth (%) -24.3% 4.7% 93.9% -68.8% Cash & Bank Balance 154.3 286.5 242.9 165.5
Extraordinary Items 9.4 450.7 0.0 0.0 Current Liabilities
Reported PAT 57.85 501.43 98.33 30.67 Liabilities 1,148.9 675.7 882.0 723.6
Provisions 0.0 0.0 0.0 0.0
Ratio Analysis Net Current Assets (348.2) (50.4) (341.8) (278.3)
Particulars (Euros Mn.) Dec 05Sept 06
(9M)Sept 07 Sept 08E Deferred Tax Assets 113.0 104.8 101.0 101.0
OPM (%) 23.5% 22.0% 24.6% 31% Total Assets 688.4 928.6 915.6 1,029.1
EBITDA (%) 24.2% 24.0% 30.0% 25%
PAT (%) 8.7% 11.1% 13.2% 5% Cash Flow
Interest Cover (x) 5.1 9.4 12.2 5.0 Particulars (Euros Mn.) Dec 05Sept 06
(9M)Sept 07 Sept 08E
EPS (Rs.) 1.3 1.5 2.9 0.9 Opening Cash & Bank 113.5 154.3 286.5 242.9
P/E (x) 19.5 16.9 8.7 27.9 Profit After Tax 57.9 501.4 98.3 30.7
P/BV (x) 1.9 1.2 1.3 1.3 Invt Income (3.5) (9.4) (40.1) 35.7
BVPS (Rs.) 13.1 21.0 19.1 19.5 Interest Paid 21.4 9.5 15.4 23.4
Market Cap (Rs. Mn.) 944.0 855.0 855.0 855.0 Miscellaneous Exp W/Off 0.0 8.2 3.8 0.0
M Cap/Sales (x) 1.7 1.9 1.1 1.5 Depreciation 24.6 20.6 34.7 30.5
EV (Rs. Mn.) 979.6 699.2 769.5 946.9 Deferred Taxation 0.0 0.0 0.0 0.0
EV/EBITDA (x) 7.3 6.4 3.4 6.4 Others (56.7) 153.0 85.9 (30.5)
EV/Sales (x) 1.8 1.5 1.0 1.6 Change in Working Cap 282.0 (165.6) 247.8 (140.9)
ROCE (%) 12.9% 8.6% 18.9% 9.1% CF - Operating Activities 325.8 517.6 445.9 (51.2)
RONW (%) 9.7% 7.0% 15.0% 4.6% Change in Fixed Assets 52.8 (2.2) (309.2) (50.0)
Debt/Equity Ratio (x) 0.4 0.2 0.2 0.4 Change in Investments (0.4) (0.5) (10.8) 0.0
Other CA T/o Days 320.5 143.3 65.8 75.0 Investment Income 3.5 9.4 40.1 (35.7)
Debtors T/o Days 76.6 93.4 57.4 72.0 CF - Investing Activities 55.8 6.8 (279.9) (85.7)
Advances T/o Days 20.0 29.9 20.6 24.7 Increase in Equity (47.8) (279.5) (162.0) 0.0
Creditors T/o Days 741.4 531.8 426.3 443.8 Changes in Borrowings (234.7) (59.2) 26.8 100.0
Wrkg Cap T/o Days (324.3) (265.2) (282.6) (272.2) Interest Paid (21.4) (9.5) (15.4) (23.4)
Fixed Assets T/o (Gross) 11.6 9.1 2.1 1.4 Dividend Paid (36.9) (44.0) (58.9) (17.2)
DPS (Rs.) 1.3 1.4 1.5 0.5 CF - Financing Activities (340.8) (392.2) (209.5) 59.5
Dividend Payout (%) 97.9% 94.8% 52.4% 56.0% Net Change in Cash 40.8 132.2 (43.6) (77.4)
Dividend Yield (%) 5.0% 5.6% 6.0% 2.0% Closing Cash & Bank Bal 154.3 286.5 242.9 165.5
Fimalac Group

33
Annexures

0
300
600
900
1200
1500
Apr-07 Jul-07 Oct-07 Jan-08 Apr-08 Jul-08 Oct-08
34
High 69.03
Low 6.57
Average 26.43
Current 23.75
Crisil : PE(x)
0
25
50
75
100
Mar-98 Apr-99 May-00 Jun-01 Jul-02 Aug-03 Sep-04 Oct-05 Nov-06 Dec-07 Jan-09
High 27.08
Low 8.30
Average 20.98
Current 8.30
McGraw Hill : PE(x)
0
25
50
75
100
Jun-98 Aug-99 Oct-00 Dec-01 Feb-03 Apr-04 Jun-05 Aug-06 Oct-07 Dec-08
High 35.91
Low 9.85
Average 24.89
Current 9.21
Moodys : PE(x)
0
1250
2500
3750
5000
Mar-03 Oct-03 May-04 Dec-04 Jul-05 Feb-06 Sep-06 Apr-07 Nov-07 Jun-08 Jan-09
High 64.94
Low 12.93 Average 10.86 Current 15.19
ICRA : PE(x)
18x
10x
12x
10x
24x
15x
18x
20x
30x
20x
24x
30x
36x
25x
30x
40x
42x
30x
36x
50x
PE BandsAnnexures
Source: Bloomberg

35
Price/Book Value Bands
0
25
50
75
100
Dec-02 Sep-03 Jun-04 Mar-05 Dec-05 Sep-06 Jun-07 Mar-08 Dec-08
300
700
1100
1500
1900
Apr-07 Jul-07 Oct-07 Jan-08 Apr-08 Jul-08 Oct-08 Jan-09
High 12.21
Low 4.47 Average 6.97 Current 4.39
McGraw Hill : P/BV(x)
3x
3x
5x
4x
7x
5x
9x
6x
11x
7x
0
1500
3000
4500
6000
Jan-02 Jan-03 Jan-04 Jan-05 Jan-06 Jan-07 Jan-08 Jan-09
3x
7x
11x
15xHigh 15.71
Low 1.88 Average 6.66 Current 6.29
Crisil : P/BV(x)
High 6.52
Low 2.19 Average 4.81 Current 2.57
ICRA : P/BV(x)
-5
-3
-1
1
3
5
Sep-
00
Mar-
01
Sep-
01
Mar-
02
Sep-
02
Mar-
03
Sep-
03
Mar-
04
Sep-
04
Mar-
05
Sep-
05
Mar-
06
Sep-
06
Mar-
07
Sep-
07
Mar-
08
Sep-
08
-100
-75
-50
-25
0
25
50
75
100Book Value (LHS)Price (RHS)
Mo
od
y’s
Co
rp.
Annexures
Source: Bloomberg
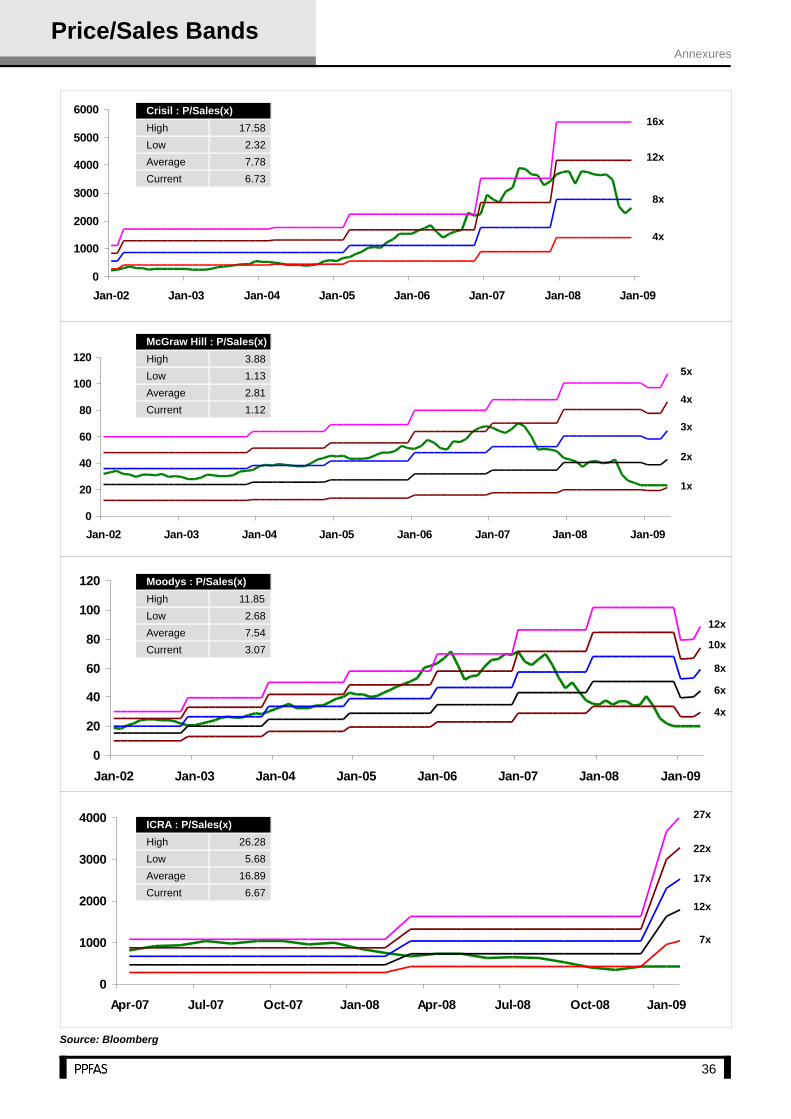
0
1000
2000
3000
4000
5000
6000
Jan-02 Jan-03 Jan-04 Jan-05 Jan-06 Jan-07 Jan-08 Jan-09
High 17.58
Low 2.32 Average 7.78 Current 6.73
Crisil : P/Sales(x)
0
20
40
60
80
100
120
Jan-02 Jan-03 Jan-04 Jan-05 Jan-06 Jan-07 Jan-08 Jan-09
High 3.88
Low 1.13 Average 2.81 Current 1.12
McGraw Hill : P/Sales(x)
0
20
40
60
80
100
120
Jan-02 Jan-03 Jan-04 Jan-05 Jan-06 Jan-07 Jan-08 Jan-09
High 11.85
Low 2.68 Average 7.54 Current 3.07
Moodys : P/Sales(x)
0
1000
2000
3000
4000
Apr-07 Jul-07 Oct-07 Jan-08 Apr-08 Jul-08 Oct-08 Jan-09
High 26.28
Low 5.68 Average 16.89 Current 6.67
ICRA : P/Sales(x)
4x
8x
12x
16x
1x
4x
7x
2x
6x
12x
3x
8x
17x
4x
10x
22x
5x
12x
27x
36
Price/Sales BandsAnnexures
Source: Bloomberg

300
500
700
900
1100
1300
1500
Apr-07 Jun-07 Aug-07 Oct-07 Dec-07 Feb-08 Apr-08 Jun-08 Aug-08 Oct-08 Dec-08
37
0
1000
2000
3000
4000
5000
Dec-02 Aug-03 Apr-04 Dec-04 Aug-05 Apr-06 Dec-06 Aug-07 Apr-08 Dec-08
High 62.46
Low 5.92 Average 27.41 Current 27.01
Crisil : P/CF(x)
High 16.36
Low 5.36 Average 11.74 Current 5.36
McGraw Hill : P/CF(x)
0
25
50
75
100
125
Jan-02 Jul-02 Jan-03 Jul-03 Jan-04 Jul-04 Jan-05 Jul-05 Jan-06 Jul-06 Jan-07 Jul-07 Jan-08
High 30.60
Low 8.12 Average 20.30 Current 9.31
Moodys : P/CF(x)
High 58.03
Low 10.11 Average 35.36 Current 11.87
ICRA : P/CF(x)
11x
6x
10x
20x
19x
9x
15x
25x
27x
12x
20x
30x
34x
15x
25x
35x
43x
18x
30x
40x
0
25
50
75
100
Jan-02 Aug-02 Mar-03 Oct-03 May-04 Dec-04 Jul-05 Feb-06 Sep-06 Apr-07 Nov-07 Jun-08 Jan-09
Price/Cash Flow BandsAnnexures
Source: Bloomberg
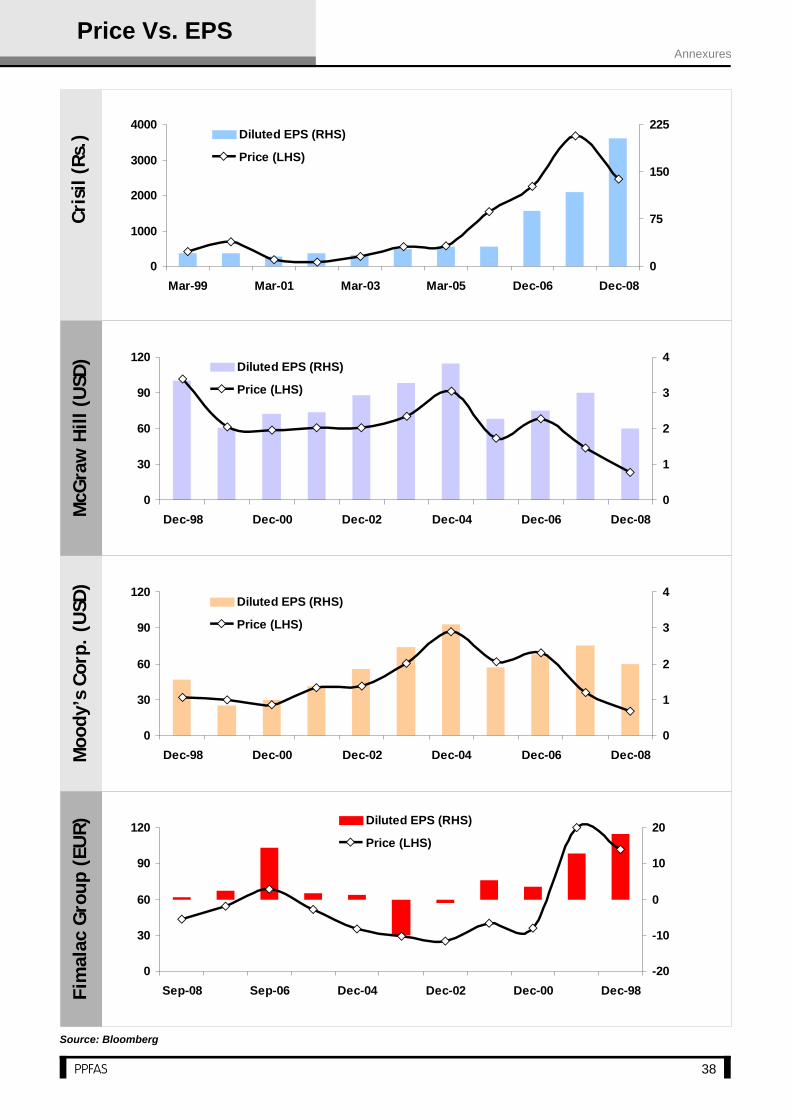
38
0
1000
2000
3000
4000
Mar-99 Mar-01 Mar-03 Mar-05 Dec-06 Dec-08
0
75
150
225Diluted EPS (RHS)
Price (LHS)
0
30
60
90
120
Dec-98 Dec-00 Dec-02 Dec-04 Dec-06 Dec-08
0
1
2
3
4Diluted EPS (RHS)
Price (LHS)
0
30
60
90
120
Dec-98 Dec-00 Dec-02 Dec-04 Dec-06 Dec-08
0
1
2
3
4Diluted EPS (RHS)
Price (LHS)
0
30
60
90
120
Sep-08 Sep-06 Dec-04 Dec-02 Dec-00 Dec-98
-20
-10
0
10
20Diluted EPS (RHS)
Price (LHS)
Cri
sil (R
s.)
McG
raw
Hill (U
SD
)M
oody’s
Corp
. (U
SD
)Fim
ala
c G
roup (
EU
R)
Price Vs. EPSAnnexures
Source: Bloomberg
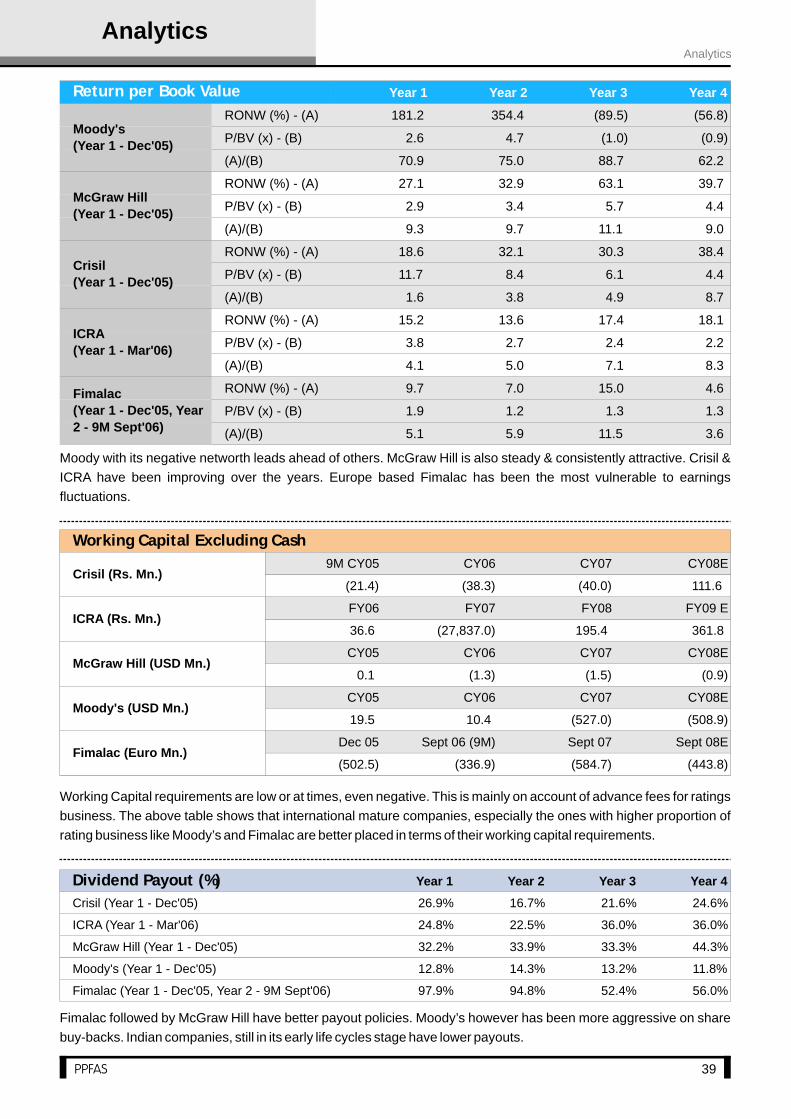
39
Dividend Payout (%) Year 1 Year 2 Year 3 Year 4
Crisil (Year 1 - Dec'05) 26.9% 16.7% 21.6% 24.6%
ICRA (Year 1 - Mar'06) 24.8% 22.5% 36.0% 36.0%
McGraw Hill (Year 1 - Dec'05) 32.2% 33.9% 33.3% 44.3%
Moody's (Year 1 - Dec'05) 12.8% 14.3% 13.2% 11.8%
Fimalac (Year 1 - Dec'05, Year 2 - 9M Sept'06) 97.9% 94.8% 52.4% 56.0%
Working Capital Excluding Cash
9M CY05 CY06 CY07 CY08E
(21.4) (38.3) (40.0) 111.6
FY06 FY07 FY08 FY09 E
36.6 (27,837.0) 195.4 361.8
CY05 CY06 CY07 CY08E
0.1 (1.3) (1.5) (0.9)
CY05 CY06 CY07 CY08E
19.5 10.4 (527.0) (508.9)
Dec 05 Sept 06 (9M) Sept 07 Sept 08E
(502.5) (336.9) (584.7) (443.8)Fimalac (Euro Mn.)
Crisil (Rs. Mn.)
ICRA (Rs. Mn.)
McGraw Hill (USD Mn.)
Moody's (USD Mn.)
Year 1 Year 2 Year 3 Year 4
RONW (%) - (A) 181.2 354.4 (89.5) (56.8)
P/BV (x) - (B) 2.6 4.7 (1.0) (0.9)
(A)/(B) 70.9 75.0 88.7 62.2
RONW (%) - (A) 27.1 32.9 63.1 39.7
P/BV (x) - (B) 2.9 3.4 5.7 4.4
(A)/(B) 9.3 9.7 11.1 9.0
RONW (%) - (A) 18.6 32.1 30.3 38.4
P/BV (x) - (B) 11.7 8.4 6.1 4.4
(A)/(B) 1.6 3.8 4.9 8.7
RONW (%) - (A) 15.2 13.6 17.4 18.1
P/BV (x) - (B) 3.8 2.7 2.4 2.2
(A)/(B) 4.1 5.0 7.1 8.3
RONW (%) - (A) 9.7 7.0 15.0 4.6
P/BV (x) - (B) 1.9 1.2 1.3 1.3
(A)/(B) 5.1 5.9 11.5 3.6
McGraw Hill
(Year 1 - Dec'05)
Moody's
(Year 1 - Dec'05)
Crisil
(Year 1 - Dec'05)
ICRA
(Year 1 - Mar'06)
Fimalac
(Year 1 - Dec'05, Year
2 - 9M Sept'06)
Return per Book Value
Analytics
Fimalac followed by McGraw Hill have better payout policies. Moody’s however has been more aggressive on share
buy-backs. Indian companies, still in its early life cycles stage have lower payouts.
Working Capital requirements are low or at times, even negative. This is mainly on account of advance fees for ratings
business. The above table shows that international mature companies, especially the ones with higher proportion of
rating business like Moody’s and Fimalac are better placed in terms of their working capital requirements.
Moody with its negative networth leads ahead of others. McGraw Hill is also steady & consistently attractive. Crisil &
ICRA have been improving over the years. Europe based Fimalac has been the most vulnerable to earnings
fluctuations.
Analytics

Particulars Crisil ICRA McGraw Hill
Corporation
Moody's
Corporation
Fimalac
Group
Year End Dec 08E Mar 09E Dec 08E Dec 08E Sept 08E
CMP 2,345.00 399.00 22.15 23.07 24.91
FV 10.00 10.00 1.00 0.10 4.40
Exchange BSE, NSE BSE, NSE NYSE NYSE Euronext
Currency Rs. Rs. USD USD EUR
Recommendation Buy Buy N.R. N.R. N.R.
Total Revenues (Mn.) 5,119.47 1,158.09 6,542.80 1,802.27 586.95
EBITDA (Mn.) 2,164.73 536.25 1,750.75 909.20 147.18
PAT (Mn.) 1,466.00 330.73 818.67 491.87 30.67
EBITDA % 42.28% 46.30% 26.76% 50.45% 25.08%
PAT % 28.64% 28.56% 12.51% 27.29% 5.23%
Market Cap (Mn.) 16,942.63 3,990.00 9,119.35 791.08 854.95
M Cap/Sales (x) 3.31 3.45 1.39 0.44 1.46
EPS 202.91
33.07
1.99
1.98
0.89
P/E (x) 11.56
12.06
11.14
11.63
27.88
Networth (Mn.) 3,818.03
1,829.99
2,063.01
(865.90)
669.51
BVPS 528.45
183.00
5.01
(25.25)
19.50
P/BV (x) 4.44
2.18
4.42
(0.91)
1.28
EV (Mn.) 16,479.01
3,720.20
10,651.87
1,656.68
946.94
EV/EBITDA (x) 7.61
6.94
6.08
1.82
6.43
EV/Sales (x) 3.22
3.21
1.63
0.92
1.61
Free CashFlow (Mn.) 735.72
89.00
290.43
474.70
(101.16)
P/FCF (x) 23.03
44.83
31.40
1.67
(8.45)
ROCE (%) 53.56% 27.14% 34.84% 169.41% 9.07%
RONW (%) 38.40% 18.07% 39.68% -56.80% 4.58%
Debt/Equity Ratio (x) -
-
0.97
(1.55)
0.38
Wrkg Cap T/o Days (Ex.Cash) (x) 7.84
112.47
(49.00)
(101.65)
(272.18)
Fixed Assets T/o (Gross) (x) 2.17
2.57
3.09
7.44
1.43
DPS 50.00
11.91
0.88
0.24
0.50
Dividend Payout (%) 24.64% 36.00% 44.26% 11.84% 55.96%
Dividend Yield (%) 2.13% 2.98% 3.97% 1.02% 2.01%
40
Comparative SummaryComparative Summary
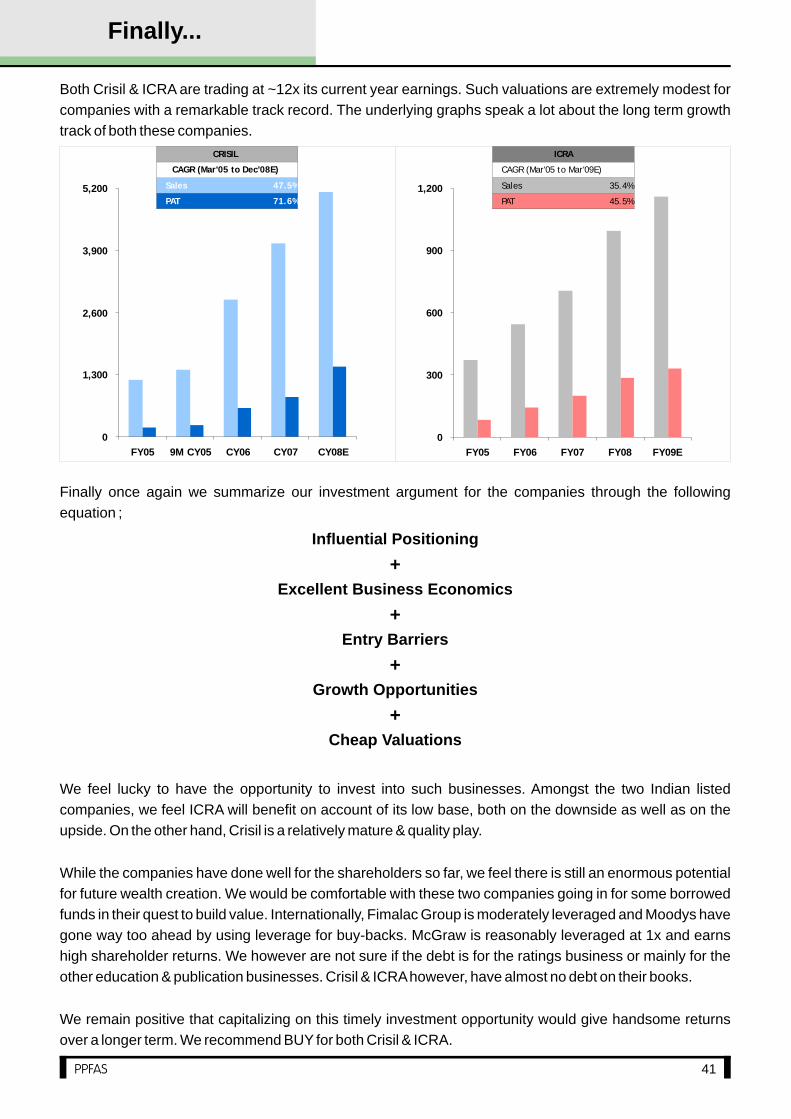
41
Finally...
Both Crisil & ICRA are trading at ~12x its current year earnings. Such valuations are extremely modest for
companies with a remarkable track record. The underlying graphs speak a lot about the long term growth
track of both these companies.
Finally once again we summarize our investment argument for the companies through the following
equation ;
We feel lucky to have the opportunity to invest into such businesses. Amongst the two Indian listed
companies, we feel ICRA will benefit on account of its low base, both on the downside as well as on the
upside. On the other hand, Crisil is a relatively mature & quality play.
While the companies have done well for the shareholders so far, we feel there is still an enormous potential
for future wealth creation. We would be comfortable with these two companies going in for some borrowed
funds in their quest to build value. Internationally, Fimalac Group is moderately leveraged and Moodys have
gone way too ahead by using leverage for buy-backs. McGraw is reasonably leveraged at 1x and earns
high shareholder returns. We however are not sure if the debt is for the ratings business or mainly for the
other education & publication businesses. Crisil & ICRA however, have almost no debt on their books.
We remain positive that capitalizing on this timely investment opportunity would give handsome returns
over a longer term. We recommend BUY for both Crisil & ICRA.
Influential Positioning
+
Excellent Business Economics
+
Entry Barriers
+
Growth Opportunities
+
Cheap Valuations
0
1,300
2,600
3,900
5,200
FY05 9M CY05 CY06 CY07 CY08E
0
300
600
900
1,200
FY05 FY06 FY07 FY08 FY09E
Sales 47.5%
PAT 71.6%
CRISIL
CAGR (Mar'05 to Dec'08E)
Sales 35.4%
PAT 45.5%
ICRA
CAGR (Mar'05 to Mar'09E)

Disclaimer
130/132,Great Western Building,1st Floor, S. B. Marg, Near Lion Gate, Fort, Mumbai - 400 023.
Tel : 91-22-2284 6555 Fax : 91-22-2284 6553,e-mail : [email protected]
Investment Boutique: Shiv Shakti, Gr. Floor, N. S. Rd. No.10, Opp. Haveli, Juhu Scheme, Mumbai - 400 049
Tel :91-22- 2623 6555 Fax : 91-22-2623 6553,e-mail : [email protected]
Disclosure of Interest Statement Crisil ICRA
1. Analyst Ownership of the scrip YES YES
2. PPFAS ownership of the scrip YES YES
3. PMS ownership of the scrip YES YES
This report or any portion hereof may not be reprinted, sold or redistributed without the written consent of Parag Parikh Financial Services Ltd. (PPFAS).
PPFAS is disseminated and available primarily electronically, and, in some cases, in printed form. Additional information on recommended securities is
available on request.
PPFAS is a Stock Broker registered with Securities and Exchange Board of India Limited (SEBI) and so it is regulated by SEBI. This report is not and should
not be construed as an investment advice to any client to acquire, subscribe, purchase, sell, dispose of, retain any securities or an offer to sell or the
solicitation of an offer to purchase or subscribe for any investment or as an official endorsement of any investment.
If 'Buy', 'Sell', or 'Hold' recommendation is made in this report such recommendation or view or opinion expressed on investments in this report is not intended
to constitute investment advice and should not be intended or treated as a substitute for necessary review or validation or any professional advice. The views
expressed in this report are those of the analyst which are subject to change and do not represent to be an authority on the subject. PPFAS may or may not
subscribe to any and/ or all the views expressed herein.
PPFAS makes best endeavour to ensure that the analyst(s) use current, reliable, comprehensive information and obtain such information from sources,
which the analyst(s) believes to be reliable. However, such information has not been independently verified by PPFAS or the analyst(s).
The information, opinions and views contained within this report are based upon publicly available information and rates of taxation at the time of publication,
which are subject to change from time to time without any prior notice. reports may be updated anytime without any prior notice to any and/ or all client(s).
PPFAS makes no guarantee, representation or warranty, express or implied; and accepts no responsibility or liability as to the accuracy or completeness or
currentness of the information in this report.
Please note that past performance is not necessarily a guide to evaluate future performance.
PPFAS and its affiliates and their respective officers directors and employees may hold positions in any securities mentioned in this report (or in any related
investment) and may from time to time add to or dispose of any such securities (or investment).
This report should be read and relied upon at the sole discretion and risk of the client.
The value of any investment made at your discretion based on this report or income therefrom may be affected by changes in economic, financial and/ or
political factors and may go down as well as up and you may not get back the full or the expected amount invested. Some securities and/ or investments
involve substantial risk and are not suitable for all investors.
This report is being supplied to you solely for your information and may not be reproduced, redistributed or passed on, directly or indirectly, to any other person
or published, copied in whole or in part, for any purpose. Neither this report nor any copy of it may be taken or transmitted or distributed, directly or indirectly
within India or into any other countries or to any resident thereof. The distribution of this report in other jurisdictions may be strictly restricted and/ or prohibited
by law, and persons into whose possession this report comes should inform themselves about such restriction and/ or prohibition, and observe any such
restrictions and/ or prohibition.
Neither PPFAS nor its affiliates or their directors, employees, agents or representatives, shall be responsible or liable in any manner, directly or indirectly, for
views or opinions expressed in this report or the contents or any errors or discrepancies herein or for any decisions or actions taken in reliance on the report or
inability to use or access our service or this report or for any loss or damages whether direct or indirect, incidental, special or consequential including without
limitation loss of revenue or profits or any loss or damage that may arise from or in connection with the use of or reliance on this report or inability to use or
access our service or this report.
Contact
Hiten Sampat President - Institutional Sales [email protected] 91 22 2284 6555 Extn 302
Jigar Valia Analyst - Investment Research [email protected] 91 22 2284 6555 Extn 315
Ridhim Thapar Institutional Sales [email protected] 91 22 2284 6555 Extn 312