10 highest yielding utility stocks
TRANSCRIPT

HIGH YIELDING UTILITY STOCKS
10 Highest Yielding Utility Stocks
Copyright © 2015,

P/E: N/A EPS: $-0.02P/S: 0.96 DIV YLD %: 5.62P/B: 1.88 Beta:
CenterPoint Energy IncCNP:NYSE
17.78 USD0.35 2.01%
Open: 17.77Day Range: 17.61 - 17.87
Volume: 6.39 MMarket Cap: $7.65 B
As of 22 Jan
WTD: 2.77% 16.38 - 17.87MTD: 3.16% 16.38 - 18.49QTD: 3.16% 16.38 - 18.49YTD: 3.16% 16.38 - 18.49
52 Wk: 22.32% 16.05 - 23.46
Key Stock Data (TTM)
DescriptionCenterPoint Energy, Inc. is a public utilityholding company. The Company, through itssubsidiaries, conducts activities in electricitytransmission and distribution, natural gasdistribution and sales, interstate pipeline andgathering operations, and power generation.
CNP : 3Y
CenterPoint Energy Inc (NYSE:CNP) opened on Friday at 17.77 USD and increased 2.01%. The intraday pricerange was 17.61 - 17.87 USD and eventually ended the session at 17.78 USD. The stock trade volume was6,390,700 shares. The company's 52-week range is 16.05 - 23.46 USD.
Copyright © 2015,

P/E: 10.66 EPS: $0.86P/S: 0.40 DIV YLD %: 4.36P/B: 1.76 Beta:
The AES CorporationAES:NYSE
9.17 USD0.06 0.66%
Open: 9.28Day Range: 9.08 - 9.39
Volume: 5.39 MMarket Cap: $6.17 B
As of 22 Jan
WTD: 7.38% 8.22 - 9.39MTD: 4.18% 8.22 - 9.59QTD: 4.18% 8.22 - 9.59YTD: 4.18% 8.22 - 9.59
52 Wk: 29.02% 8.22 - 14.02
Key Stock Data (TTM)
DescriptionThe AES Corporation owns a portfolio ofelectricity generation and distributionbusinesses on five continents in 27 countries,with total capacity of approximately 44,200megawatts and distribution networks.The AESCorporation owns a portfolio of electricitygeneration and distribution businesses on fivecontinents in 27 countries, with total capacityof approximately 44,200 megawatts anddistribution networks.
AES : 3Y
The AES Corporation (NYSE:AES) opened on Friday at 9.28 USD and climbed 0.66%. The intraday price rangewas 9.08 - 9.39 USD and eventually ended the session at 9.17 USD. The stock trade volume was 5,393,800shares. The company's 52-week range is 8.22 - 14.02 USD.
Copyright © 2015,

P/E: N/A EPS: $-0.89P/S: 1.04 DIV YLD %: 4.83P/B: 1.34 Beta:
Entergy CorporationETR:NYSE
68.73 USD2.05 3.07%
Open: 67.26Day Range: 66.84 - 68.85
Volume: 1.32 MMarket Cap: $12.35 B
As of 22 Jan
WTD: 0.94% 65.38 - 69.24MTD: 0.54% 65.38 - 69.59QTD: 0.54% 65.38 - 69.59YTD: 0.54% 65.38 - 69.59
52 Wk: 23.14% 61.27 - 90.12
Key Stock Data (TTM)
DescriptionEntergy Corporation is an integrated energycompany that is primarily focused on electricpower production and retail electricdistribution operations. The Company deliverselectricity to utility customers in Arkansas,Louisiana, Mississippi, and Texas.
ETR : 3Y
Entergy Corporation (NYSE:ETR) opened on Friday at 67.26 USD and rose sharply 3.07%. The intraday pricerange was 66.84 - 68.85 USD and eventually ended the session at 68.73 USD. The stock trade volume was1,322,400 shares. The company's 52-week range is 61.27 - 90.12 USD.
Copyright © 2015,

P/E: 18.14 EPS: $2.61P/S: 2.40 DIV YLD %: 4.56P/B: 2.09 Beta:
The Southern CompanySO:NYSE
47.35 USD0.54 1.15%
Open: 46.79Day Range: 46.56 - 47.38
Volume: 6.02 MMarket Cap: $41.42 B
As of 22 Jan
WTD: 0.38% 46.34 - 48.04MTD: 1.20% 46.00 - 48.04QTD: 1.20% 46.00 - 48.04YTD: 1.20% 46.00 - 48.04
52 Wk: 9.17% 41.40 - 53.16
Key Stock Data (TTM)
DescriptionThe Southern Company is a holding company,which owns all of the common stock of thetraditional operating companies, includingAlabama Power Company (Alabama Power),Georgia Power Company (Georgia Power),Gulf Power Company (Gulf Power), andMississippi Power Company (MississippiPower) ,and Southern Power Company(Southern Power), and other direct andindirect subsidiaries (together, the Southern
SO : 3Y
The Southern Company (NYSE:SO) opened on Friday at 46.79 USD and increased 1.15%. The intraday pricerange was 46.56 - 47.38 USD and eventually ended the session at 47.35 USD. The stock trade volume was6,018,900 shares. The company's 52-week range is 41.40 - 53.16 USD.
Copyright © 2015,

P/E: 27.36 EPS: $1.18P/S: 0.91 DIV YLD %: 4.46P/B: 1.08 Beta:
FirstEnergy CorporationFE:NYSE
32.28 USD0.98 3.13%
Open: 31.58Day Range: 31.35 - 32.38
Volume: 3.48 MMarket Cap: $13.66 B
As of 22 Jan
WTD: 1.41% 30.62 - 32.58MTD: 1.73% 30.62 - 32.80QTD: 1.73% 30.62 - 32.80YTD: 1.73% 30.62 - 32.80
52 Wk: 21.04% 28.89 - 41.59
Key Stock Data (TTM)
DescriptionFirstEnergy Corporation is engaged in theholding, directly or indirectly, of itssubsidiaries: Ohio Edison Company (OE), TheCleveland Electric Illuminating Company (CEI),The Toledo Edison Company (TE),Pennsylvania Power Company (Penn),American Transmission Systems, Incorporated(ATSI), Jersey Central Power & Light Company(JCP&L), Metropolitan Edison Company (Met-Ed), Pennsylvania Electric Company (Penelec).
FE : 3Y
FirstEnergy Corporation (NYSE:FE) opened on Friday at 31.58 USD and rose sharply 3.13%. The intraday pricerange was 31.35 - 32.38 USD and eventually ended the session at 32.28 USD. The stock trade volume was3,477,500 shares. The company's 52-week range is 28.89 - 41.59 USD.
Copyright © 2015,

P/E: 28.54 EPS: $0.92P/S: 1.34 DIV YLD %: 4.11P/B: 1.53 Beta:
PEPCO Holdings IncPOM:NYSE
26.26 USD0.01 0.04%
Open: 26.31Day Range: 26.21 - 26.36
Volume: 2.40 MMarket Cap: $6.66 B
As of 22 Jan
WTD: 0.34% 26.07 - 26.40MTD: 0.96% 25.59 - 26.59QTD: 0.96% 25.59 - 26.59YTD: 0.96% 25.59 - 26.59
52 Wk: 4.23% 21.61 - 27.50
Key Stock Data (TTM)
DescriptionPEPCO Holdings Inc is a holding company, that,through regulated public utility subsidiaries, isengaged primarily in the transmission,distribution and default supply of electricityand the distribution and supply of natural gas(Power Delivery): Potomac Electric PowerCompany (Pepco), Delmarva Power & LightCompany (DPL) and Atlantic City ElectricCompany (ACE).
POM : 3Y
PEPCO Holdings Inc (NYSE:POM) opened on Friday at 26.31 USD and rose 0.04%. The intraday price rangewas 26.21 - 26.36 USD and eventually ended the session at 26.26 USD. The stock trade volume was 2,396,900shares. The company's 52-week range is 21.61 - 27.50 USD.
Copyright © 2015,
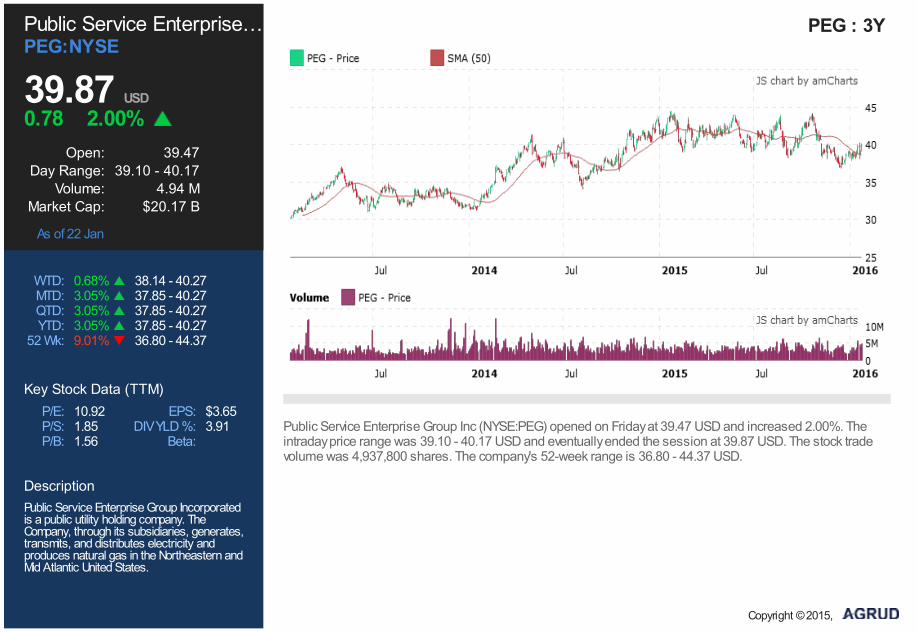
P/E: 10.92 EPS: $3.65P/S: 1.85 DIV YLD %: 3.91P/B: 1.56 Beta:
Public Service Enterprise…PEG:NYSE
39.87 USD0.78 2.00%
Open: 39.47Day Range: 39.10 - 40.17
Volume: 4.94 MMarket Cap: $20.17 B
As of 22 Jan
WTD: 0.68% 38.14 - 40.27MTD: 3.05% 37.85 - 40.27QTD: 3.05% 37.85 - 40.27YTD: 3.05% 37.85 - 40.27
52 Wk: 9.01% 36.80 - 44.37
Key Stock Data (TTM)
DescriptionPublic Service Enterprise Group Incorporatedis a public utility holding company. TheCompany, through its subsidiaries, generates,transmits, and distributes electricity andproduces natural gas in the Northeastern andMid Atlantic United States.
PEG : 3Y
Public Service Enterprise Group Inc (NYSE:PEG) opened on Friday at 39.47 USD and increased 2.00%. Theintraday price range was 39.10 - 40.17 USD and eventually ended the session at 39.87 USD. The stock tradevolume was 4,937,800 shares. The company's 52-week range is 36.80 - 44.37 USD.
Copyright © 2015,
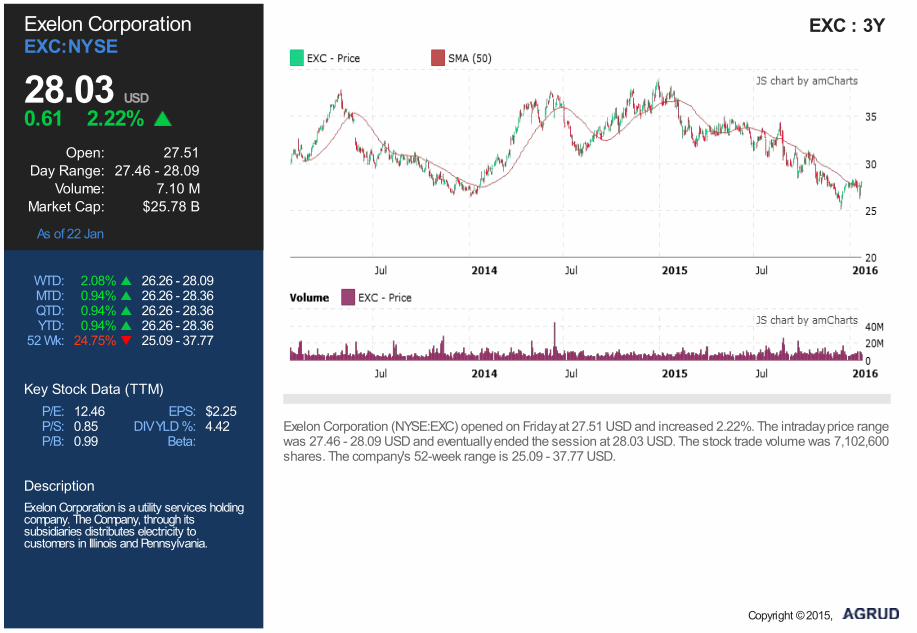
P/E: 12.46 EPS: $2.25P/S: 0.85 DIV YLD %: 4.42P/B: 0.99 Beta:
Exelon CorporationEXC:NYSE
28.03 USD0.61 2.22%
Open: 27.51Day Range: 27.46 - 28.09
Volume: 7.10 MMarket Cap: $25.78 B
As of 22 Jan
WTD: 2.08% 26.26 - 28.09MTD: 0.94% 26.26 - 28.36QTD: 0.94% 26.26 - 28.36YTD: 0.94% 26.26 - 28.36
52 Wk: 24.75% 25.09 - 37.77
Key Stock Data (TTM)
DescriptionExelon Corporation is a utility services holdingcompany. The Company, through itssubsidiaries distributes electricity tocustomers in Illinois and Pennsylvania.
EXC : 3Y
Exelon Corporation (NYSE:EXC) opened on Friday at 27.51 USD and increased 2.22%. The intraday price rangewas 27.46 - 28.09 USD and eventually ended the session at 28.03 USD. The stock trade volume was 7,102,600shares. The company's 52-week range is 25.09 - 37.77 USD.
Copyright © 2015,
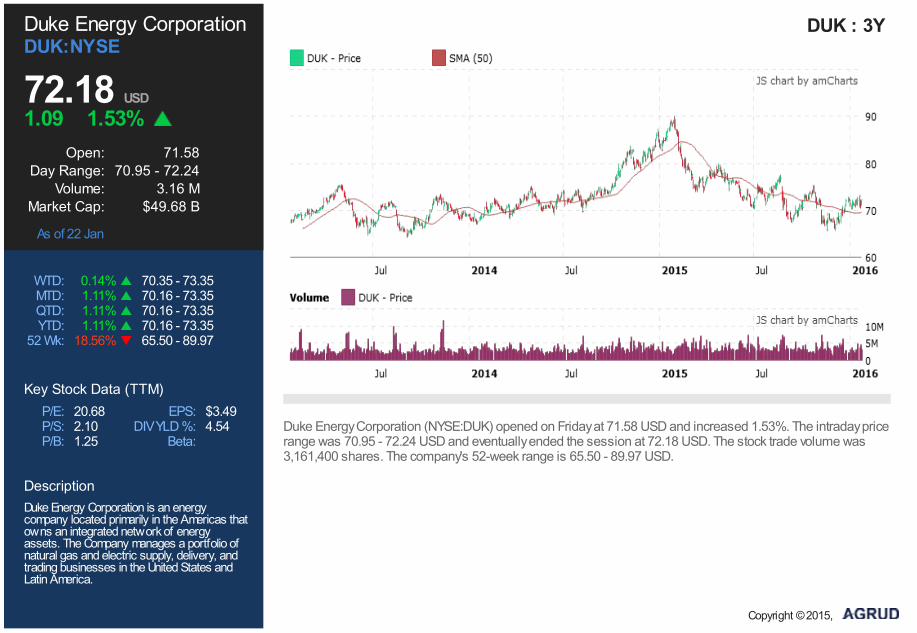
P/E: 20.68 EPS: $3.49P/S: 2.10 DIV YLD %: 4.54P/B: 1.25 Beta:
Duke Energy CorporationDUK:NYSE
72.18 USD1.09 1.53%
Open: 71.58Day Range: 70.95 - 72.24
Volume: 3.16 MMarket Cap: $49.68 B
As of 22 Jan
WTD: 0.14% 70.35 - 73.35MTD: 1.11% 70.16 - 73.35QTD: 1.11% 70.16 - 73.35YTD: 1.11% 70.16 - 73.35
52 Wk: 18.56% 65.50 - 89.97
Key Stock Data (TTM)
DescriptionDuke Energy Corporation is an energycompany located primarily in the Americas thatowns an integrated network of energyassets. The Company manages a portfolio ofnatural gas and electric supply, delivery, andtrading businesses in the United States andLatin America.
DUK : 3Y
Duke Energy Corporation (NYSE:DUK) opened on Friday at 71.58 USD and increased 1.53%. The intraday pricerange was 70.95 - 72.24 USD and eventually ended the session at 72.18 USD. The stock trade volume was3,161,400 shares. The company's 52-week range is 65.50 - 89.97 USD.
Copyright © 2015,

P/E: 12.32 EPS: $2.76P/S: 2.10 DIV YLD %: 4.47P/B: 2.23 Beta:
PPL CorporationPPL:NYSE
34.01 USD0.78 2.35%
Open: 33.46Day Range: 33.24 - 34.10
Volume: 4.79 MMarket Cap: $22.88 B
As of 22 Jan
WTD: 2.16% 32.18 - 34.10MTD: 0.35% 32.18 - 34.41QTD: 0.35% 32.18 - 34.41YTD: 0.35% 32.18 - 34.41
52 Wk: 4.73% 29.18 - 36.74
Key Stock Data (TTM)
DescriptionPPL Corporation is an energy and utility holdingcompany that through its subsidiaries,generates electricity from power plants in thenortheastern and western United States, andmarkets wholesale and retail energy primarilyin the northeastern and western portions ofthe United States, and delivers electricity inPennsylvania and the United Kingdom.
PPL : 3Y
PPL Corporation (NYSE:PPL) opened on Friday at 33.46 USD and increased 2.35%. The intraday price rangewas 33.24 - 34.10 USD and eventually ended the session at 34.01 USD. The stock trade volume was 4,789,700shares. The company's 52-week range is 29.18 - 36.74 USD.
Copyright © 2015,

DisclaimerThe information contained in this website is for general information purposes only. Whilst Agrud.com monitors the quality of the information available onthis website and updates the information regularly, we make no representations or warranties of any kind, express or implied, about the completeness,accuracy, reliability, suitability for a particular purpose or availability with respect to the website or the information, products, services, or related graphicscontained on the website for any purpose.
Before relying on any material contained on this site, users should independently verify its accuracy, currency, completeness and relevance for theirpurposes.
The material contained on this site is not made available for the purpose of rendering professional advice. Users should seek independent professionaladvice in relation to their particular circumstances.
By making any use of this website you agree that in no event will we be liable for any loss or damage including without limitation, indirect orconsequential loss or damage, or any loss or damage whatsoever arising from loss of data or profits arising out of, or in connection with, the use of thiswebsite. Any reliance you place on such information is therefore strictly at your own risk.
Through this website you are able to link to other websites which are not under the control of Agrud.com. We have no control over the nature, contentand availability of those sites. The inclusion of any links does not imply a recommendation or endorse the views expressed within them. Agrud shall notaccept any responsibility for the content of those websites or your use of those websites.
Every effort is made to keep this website up and running smoothly. However, Agrud.com takes no responsibility for, and will not be liable for, this websitebeing unavailable for any period of time due to technical issues.
Acknowledgement information.
Copyright © 2015,