iifl banking sector report: mid-sized pvt. banks to outpace the...
TRANSCRIPT


1 | P a g e
Premia Research
Table of Contents
NSE
Table of Contents Page No.
Sectoral Outlook 2
Key Investment Rationale 3-5
Credit market share of mid-sized Pvt. Banks growing 6
Credit growth for Indian banks reviving from lows 7-8
Retail segment growth to lead the overall loan growth 9-11
Market share – PSU vs. Pvt. Banks 12-14
PCA an opportunity for Pvt. Banks
15-16
RBL Bank Ltd 17-22
Karur Vysya Bank Ltd 23-28
City Union Bank Ltd 29-34
Disclaimer 35

2 | P a g e
Premia Research
Mid-sized Pvt. Banks to outpace the sector
RBL Bank– BUY
CMP Target Upside
627 739 18.0%
Karur Vysya Bank – BUY
CMP Target Upside
94 116 23.0%
City Union Bank – BUY
CMP Target Upside
203 235 16.1%
Prices as on 30/08/2018
Financials (`cr) RBL Bank FY19E FY20E
Total Income 3,834 4,696
PPOP 1,848 2,301
PAT 957 1,182
P/ABV (x) 3.6 3.2
Karur Vysya Bank FY19E FY20E
Total Income 3,699 4,164
PPOP 1,887 2,332
PAT 456 787
P/ABV (x) 1.7 1.5
City Union Bank FY19E FY20E
Total Income 2,174 2,531
PPOP 1,337 1,557
PAT 666 802
P/ABV (x) 2.9 2.5
Source: Company, IIFL Research
Private Banks capitalizing on PSU banks’ waning loan market share
The market share of total private sector banks (largecap + midcap) in
total domestic bank credit has improved over the last 8 years vs. public
sector banks (PSU banks). It has increased from 18.1% in FY10 to 29.8%
in FY18, while that of PSU banks contracted from 77.2% to 64.4% over
the same period. The loss in the market share of PSU banks is
attributed to their weak capital position due to higher stressed assets
& provisions and balance sheet deterioration.
The credit market share of all midcap private sector banks has
increased from 2.27% in FY14 to 3.22% (~`2.9 lakh cr) in FY18.
Moreover, expanding credit growth, better capital position and branch
expansion would aid mid-sized Pvt. banks to further improve their
credit market share to 3.78% (~`4.2 lakh cr) by FY20E. Among the mid-
sized private banks, our preferred picks are RBL Bank, Karur Vysya Bank
and City Union Bank.
We prefer (1) RBL Bank, owing to its improving return profile, due to
better advances & loan mix, higher CASA, lower cost ratios and better
asset quality. The bank’s strategy to lend to quality clients with
prudent cash flows and its C&IB division’s (Corporate & Institutional
Banking) focus on working capital finance (~70% lending to short
term working capital finance) will help it to maintain asset quality;
(2) Karur Vysya Bank (KVB), due to digital banking initiative, asset
quality improvement and advances growth; resolution in NCLT cases
and focus on better rated corporates will lead to asset quality
improvement; (3) City Union Bank (CUB), due to increasing loan book
led by better traction in MSME and retail loan segments. The bank’s
focus on small-ticket secured lending (99% of loan portfolio secured)
has helped maintain sound asset quality. Of its total loan book, ~66%
comprises working-capital loans, which are completely
collateralized. Further, its focus on lower slippages and higher
recovery will lead to declining credit cost over next couple of years.
Analyst – Saurabh Rathi [email protected]
August 30, 2018
3 | P a g e
Premia Research
Key Investments Rationales
RBL Bank
RBL Bank’s strategy of lending to quality clients with prudent cash
flows and its C&IB division’s focus on working capital finance (~70%
lending to short term working capital finance) has helped maintain
asset quality. We expect its slippage ratio to decline from 1.4% in FY18
to 0.7% in FY20E, due to its focus on lending to better rated corporates.
We project the GNPA ratio to decline by 30bps over FY18-20E to 1.1%.
In addition to improving loan book in coming years, it will also see an
improvement in NIMs supported by better product mix and lowering
cost funding profile. We project its NIM to surge by 41bps over FY18-
20E to 4.2%. We project RoA and RoE to increase by 24bps and 317bps
to 1.4% and 14.6% respectively over FY18-20E.
Karur Vysya Bank
Karur Vysya Bank, in H2FY19, will launch all its products and services
on a completely digital platform, which will provide a boost to its loan
book. Further, we believe the bank is in its tail end in terms of
corporate NPAs. We expect its slippage ratio to decline from 4.6% in
FY18 to 1.3% in FY20E (due to declining share of corporate loans in
total loans, which accounts for ~80% of slippages). According to us, the
GNPA ratio would decline by 136bps to 5.2% over FY18-20E due to
lower slippages and higher recoveries owing to resolution in NCLT
cases. Over FY18-20E, lower loan loss provisions and interest reversal
(due to lesser slippages) would drive an improvement in return ratios.
We forecast its RoA & RoE to increase by 48bps and 540bps to 1% and
11.5% respectively over FY18-20E.
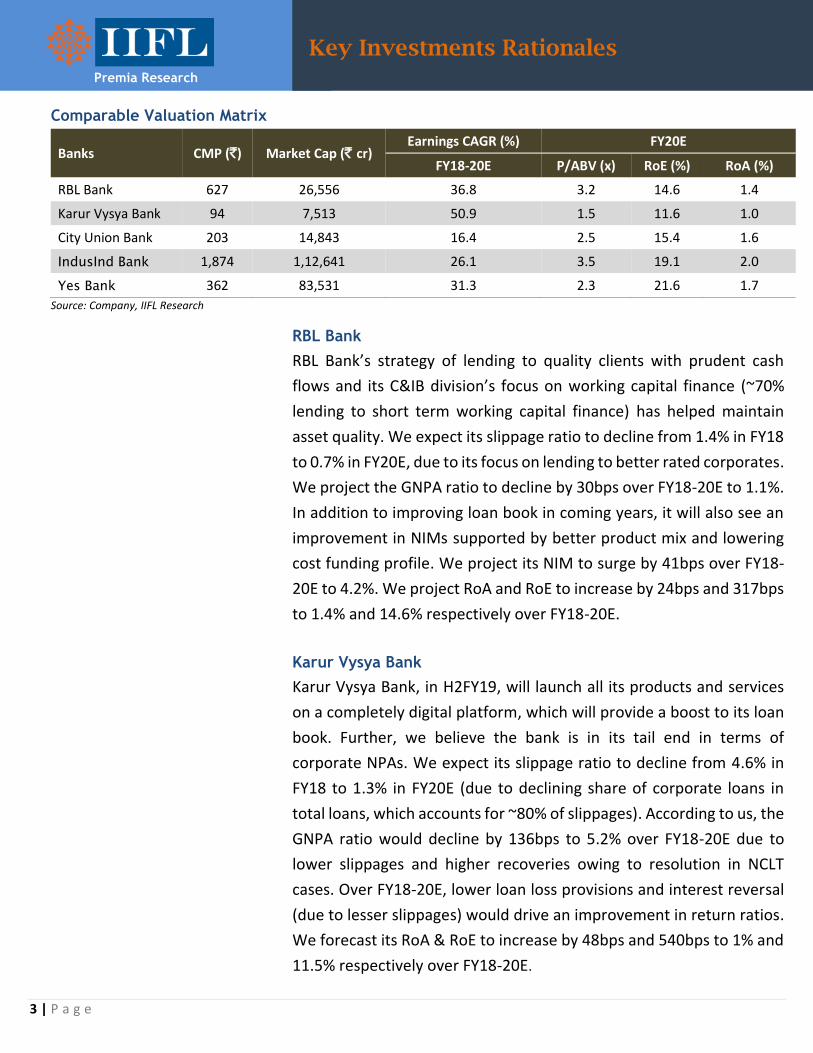
Comparable Valuation Matrix
Banks CMP (`) Market Cap (` cr) Earnings CAGR (%) FY20E
FY18-20E P/ABV (x) RoE (%) RoA (%)
RBL Bank 627 26,556 36.8 3.2 14.6 1.4
Karur Vysya Bank 94 7,513 50.9 1.5 11.6 1.0
City Union Bank 203 14,843 16.4 2.5 15.4 1.6
IndusInd Bank 1,874 1,12,641 26.1 3.5 19.1 2.0
Yes Bank 362 83,531 31.3 2.3 21.6 1.7
Source: Company, IIFL Research

4 | P a g e
Premia Research
Key Investments Rationales
City Union Bank
City Union Bank to benefit from its increasing loan book led by better
traction in MSME and retail segments. The proportion of MSME + retail
in total loan book is expected to increase by 160bps over FY18-20E. Its
focus on small-ticket secured lending has helped to maintain sound
asset quality in the past few years despite the industry being under
severe asset quality stress. Its focus on lower slippages through better
NPA management (99% of its loan book is secured) and higher recovery
will lead to declining credit cost over next couple of years. We expect
slippage ratio to decline from 2.1% in FY18 to 1.4% in FY20E. In
addition, focus on high yielding products, better CASA & CD ratio and
lower cost ratios to support return profile. Its return ratios are likely to
remain superior to that of regional peers, including SFBs over FY18-
20E. We forecast its RoA & RoE to increase by 7bps and 13bps to 1.64%
and 15.4% respectively over FY18-20E.
Improving return metrics to aid valuations RBL Bank
RBL Bank enjoys better asset quality than its peers and has
delivered industry leading loan growth over last few years. The
stock has traded at ~3x P/BV over last 1.5 years. Going ahead, we
believe, earnings growth potential (36.8% CAGR over FY18-20E) &
improving return profile over FY18-20E, makes a case for re–rating
the stock’s multiple. It presently trades at 12-15% discount to its
Exhibit 1: Peer Comparison Charts
Source: RBI, Company, IIFL Research
RBL Bank
Karur Vysya Bank
City Union Bank
Indusind Bank
Yes Bank
1.0
1.5
2.0
2.5
3.0
3.5
4.0
0.8 1.0 1.2 1.4 1.6 1.8 2.0 2.2
P/ABV (x)
RoA (%)
RBL Bank
Karur Vysya Bank
City Union Bank
Indusind Bank
Yes Bank
1
6
11
16
21
26
31
36
0.8 1.0 1.2 1.4 1.6 1.8 2.0 2.2
Loan CAGR
RoA (%)

5 | P a g e
Premia Research
Key Investments Rationales
peers, and we believe that the valuation gap should narrow over next
one year.
Karur Vysya Bank
Karur Vysya Bank, in H1FY18, was trading at attractive valuation i.e.
above 2x P/BV, on the expectation of waning asset quality concerns
and better loan growth. However, on account of demonetization, its
exposure to the SME segment and February 12 circular by RBI, the
bank’s asset quality deteriorated in FY17 and FY18, which resulted in
the stock trading at lesser multiple. However, as things are expected
to improve on asset quality front coupled with better earnings &
improved return ratios over next couple of years, we believe the stock
would fetch above 2x multiple. Karur Vysya Bank is expected to deliver
earnings CAGR of 50.9% over FY18-20E aided by higher NII and asset
quality improvement providing a room for valuation upgrade.
City Union Bank
City Union Bank, over last few years, has witnessed relatively better
and stable valuations owing to consistent return profile vis-à-vis
midsized private bank peers. It is expected to continue with higher
return profile going ahead. It has better grip on asset quality as ~99%
of its portfolio is secured. The stock, over last 1.5 years, has fetched
the valuation multiple in the range of 2.1-2.6x P/BV. We believe, CUB,
as a compounding play with greater bottom-line visibility over the
medium term should continue to fetch higher multiple.

6 | P a g e
Premia Research
Credit market share of mid-sized Pvt. Banks growing
The credit market share of all midcap private sector banks has
increased from 2.27% in FY14 to 3.22% (~`2.9 lakh cr) in FY18.
Moreover, expanding credit growth, better capital position and branch
expansion would aid mid-sized Pvt. banks to further improve their
credit market share to 3.78% (~`4.2 lakh cr) by FY20E. On the other
hand, the total private banks advances market share is expected to
improve from 29.8% in FY18 to 37.1% in FY20E. On the advances
growth front, similar to their large private peers, opportunities
continue to exist for mid-size private banks to gain market share from
PSU banks. Moreover, mid-size banks, due to their branch expansion
spree across India as compared to their regional dominance earlier,
presents them an opportunity to improve advances. Among the mid-
size private banks, we believe RBL Bank, Karur Vysya Bank and City
Union Bank are better placed in terms of their capital adequacy ratio,
which remains strong at 14.6%, 14.1% and 16.1% respectively for
Q1FY19. Adequate capital position will aid them to improve their
advances market share in total banking advances, without any dilution
risk in the medium term. We forecast 21.4% advances CAGR for RBL,
KVB and CUB (together) over FY18-20E to ~`1.7 lakh cr, as against
11.5% advances CAGR to `111 lakh cr for total banking sector over
similar period. The credit market share for RBL, KVB and CUB
(together) is expected to increase from ~1.3% in FY18 to ~1.5% in
FY20E.
The credit market share of all midcap
private sector banks in total bank credit is
expected to increase from 3.22% in FY18 to
3.78% in FY18.
Exhibit 2: Improving advances share of mid-sized private banks over FY18-20E
Source: RBI, Company, IIFL Research
Total Banking Sector loan book size (89
lakh cr)
Total Pvt. Banks
(27 lakh cr)
Midcap Pvt. Banks (2.9 lakh cr)
RBL, KVB, CUB (1.1 lakh cr)
Total Banking Sector loan book size (111
lakh cr)
Total Pvt. Banks
(41 lakh cr)
Midcap Pvt. Banks (4.2 lakh cr)
RBL, KVB, CUB (1.7 lakh cr)
FY18 FY20E

7 | P a g e
Premia Research
Credit growth for Indian banks reviving from lows
Credit growth for Indian banks reviving from lows
Total Scheduled Commercial Banks’ credit growth has consistently
fallen over FY11-17 (declined to 2.8% in FY17 from 22.9% in FY11). The
slower growth is mainly attributed to muted corporate credit offtake,
whose proportion in total loan growth has declined from 37.3% in FY11
to 33% in FY17. The banks were reluctant to fund corporate expansion
plans, since many of them had overleveraged balance sheet and were
incapable of servicing loans. Additionally, poor capital position of PSU
banks due to NPA issues and certain PSU banks under PCA also
contributed to slower credit growth. In FY17, the banks’ loan growth
suffered due to demonetization and GST related disruptions.
Moreover, favorable rates in the bond markets had led to shift in short
term corporate borrowing away from banks. The credit growth for
Indian banks is finally reviving from FY18 onwards. The banks are now
seeing higher capital expenditure loans demand currently (earlier the
demand was of working capital loans). Further, yields in the bond
markets have risen, making bank credit more attractive. We forecast
the total Scheduled Commercial Banks credit growth to be more than
11% for FY19E and FY20E. We believe the government’s PSU banks
recapitalization programme, insolvency and bankruptcy proceedings,
improving commodity cycle, better GDP, increasing private capex &
consumption patterns will lead to double digit credit growth for next
few years.
Exhibit 3: Total Scheduled Commercial Banks credit growth yoy (%)
Source: RBI, Company, IIFL Research
21.1
16.6
22.9
18.1
15.914.5
9.7
6.9
2.8
10.011.3 11.7
0
5
10
15
20
25
FY09 FY10 FY11 FY12 FY13 FY14 FY15 FY16 FY17 FY18 FY19E FY20E
We forecast the total Scheduled
Commercial Banks credit growth to be
more than 11% for FY19E and FY20E
8 | P a g e
Premia Research
Credit growth for Indian banks reviving from lows
The credit uptick in the corporate segment is expected to improve
mainly driven by the capex in consumer driven industries such as
automobiles, auto ancillaries and agro-based industries. Further,
sectors such as cement, roads, textiles, engineering, food processing,
chemical and chemical products renewable energy and oil & gas are
also seeing investments, which will create the demand for corporate
credit. Improving commodity cycle will also help in credit demand
from metal sector. Further, as per RBI, the MSME sector, which was
grappling with GST & demonetization issues has rebounded. During
Q1FY19, bank credit to MSMEs increased by ~8.5% yoy (to pre-
demonetization levels) and we believe the growth momentum in
MSME credit to continue for the coming years. Further, retail lending
which has turned out to be a key profit driver for banks will lead the
overall banking loan growth in years to come.
Total Banks advances expanded at 12.9% CAGR over FY09-18
The total banks advances expanded to ~`89 lakh cr in FY18 from ~`30
lakh cr in FY09, expanding at 12.9% CAGR. The growth was largely
contributed by private sector banks, registering 18.6% advances CAGR
over similar period vs. PSU banks growth of 10.9% CAGR. Retail
advances was the primary contributor to overall banking sector
advances growth, while corporate loan growth was muted. Credit
growth for the total banking system touched 11% yoy in May 2018
(highest growth since September 2016), largely attributed to retail
loans. Retail loans grew ~20% yoy in May2018 and should continue to
drive growth for the sector, with large and mid-sized private banks
increasing focus on unsecured lending (credit cards, personal loans
and business loans), which remains the fastest growing sub-segment
within retail loans (up 27% yoy in May 2018).
The total advances expanded to ~`89 lakh
cr in FY18 from `~30 lakh cr in FY09

9 | P a g e
Premia Research
Retail segment growth to lead the overall loan growth
Retail segment growth to lead the overall loan growth
The retail segment represents more than one-fifth (~23% as of March
2018) of overall banking credit, and in turn, derives a major share from
housing finance (forms ~51% of retail loans in FY18). Banking industry
has registered 18% yoy retail loan growth in FY18 as against 10% loan
growth for the banking industry and less than 1% for the corporates.
In fact, retail loans in FY18 have contributed 49% to total banking
incremental loan growth. Most of the banks are pushing retail loans
due to their high margin and better asset quality benefits. Retail
lending has turned out to be a key profit driver for banks, as there
exists high impairment in corporate loan portfolio. While corporate
loan growth is expected to recover, it is likely to lag the overall loan
growth. Granular retail loans are set to grab a larger share of the pie.
Private banks are well-poised to capture this opportunity led by low
penetration and better capital position.
Exhibit 4: Retail loans contributed 49% of incremental growth (%)
Source: RBI, Company, IIFL Research
RBL Bank, Karur Vysya Bank and City Union Bank are also focusing
towards high margin retail loans. We expect the credit growth of Karur
Vysya Bank and City Union Bank to be driven by Retail and MSME
segments. For RBL Bank, both wholesale and non-wholesale
businesses to contribute towards its loan book growth (~31.5% loan
book CAGR over FY18-20E) above industry average. Karur Vysya
Bank’s strategy is to increase the more granular retail/MSME portion
and its digital banking initiative, which will aid its loan book growth
(~14.2% loan book CAGR over FY18-20E). City Union Bank’s working
capital loans to SME & MSME (52% advances share) and retail loans
would continue to drive loan growth (~17.7% loan book CAGR over
1122 22 20
6
4231
13
-9
3
27 17
24 48
42
19 30 4242
49
-20
0
20
40
60
80
100
120
FY14 FY15 FY16 FY17 FY18
Agri Industry Services Retail
Banking industry has registered 18% yoy
retail loan growth in FY18 as against 10%
loan growth for the banking industry
Retail loans contributed 49% of
incremental growth in FY18

10 | P a g e
Premia Research
Retail segment growth to lead the overall loan growth
FY18-20E). RBL Bank and Karur Vysya Bank’s share of retail loans in
total loans is expected to improve from 22.1% & 16.6% in FY18 to
25.6% & 19.9% respectively in FY20E. Loan book inclination towards
retail will aid them into higher NIMs and better asset quality. City
Union Bank’s secured lending model in the form of small ticket size
loans (mostly working capital loans) provides cushion to asset quality.
Total banks non-food advances have grown at a CAGR of 14.5%
during FY09-14 led by demand from both corporate & retail loans.
However, over FY15-18 it has decelerated to just 8.6% CAGR.
Slower credit growth during the period is attributed to slowdown
that commenced in 2015. Credit to industries, which accounted for
~36% in FY15 has contracted to ~33% in FY18. Within this,
infrastructure sector was a larger hit. The retail loans segment
share expanded from ~16% in FY15 to ~21% in FY18. Within retail
loans, auto loans, consumer durables and credit card loans
witnessed an improvement. We expect the non-food advances to
grow at 11.5% CAGR over FY18-20E, largely led by retail loans.
Private Banks are well-poised to capture this opportunity led by low
penetration levels in retail loans and their strong capital position.
Exhibit 5: Sectoral growth (%) of non-food advances
Source: RBI, Company, IIFL Research
-30
-20
-10
0
10
20
30
40
50
FY09 FY10 FY11 FY12 FY13 FY14 FY15 FY16 FY17 FY18 FY19E FY20E
Agriculture Industry Services Personal loans Priority Sector loans Total Banking

11 | P a g e
Premia Research
Retail segment growth to lead the overall loan growth
The total retail loans have grown at 13.9% CAGR over FY08-18. The
above data suggests that housing and personal loans have been the
biggest contributors with ~51% and ~27% share of retail loans
respectively. These segments have grown at CAGR of 14.1% &
18.1% over FY08-18 respectively. Both these segments are poised
for further growth, backed by demand for housing and personal
finance. The demand for unsecured personal loans/credit cards/
other retail loans has gone up rapidly. This is in-line with the
strategy of banks looking at profitable ventures to drive growth.
Though we expect gradual recovery in corporate loan growth, we
believe retail loans to remain a key driver of total banking sector
loan growth in coming years. We expect retail loans to grow at
16.7% CAGR over FY18-20E. This will be led by steady growth in car
financing, a better CV financing outlook and under penetration in
unsecured lending segments, which would likely expand the pie of
granular retail loans. Besides, better availability and ease of credit
(doorstep financing), cross sell opportunities and digitalization will
drive more consumers to avail credit.
Exhibit 7: Increasing share (%) of Housing & Personal Loans in total retail loans
FY08 FY09 FY10 FY11 FY12 FY13 FY14 FY15 FY16 FY17 FY18
Housing 49.9 49.7 51.4 50.9 50.7 50.9 53.3 53.9 51.1 53.1 51.1
Vehicle 11.2 11.0 10.9 10.6 11.4 12.4 10.5 10.7 10.5 10.5 10.3
Credit Cards 5.1 5.0 3.4 2.6 2.6 2.8 2.5 2.6 2.6 3.2 3.6
Personal Loans 18.5 18.7 17.8 21.2 20.3 19.8 19.8 20.2 24.9 23.2 26.6
Others 15.2 15.6 16.5 14.7 15.0 14.2 13.9 12.6 10.9 10.0 8.4
Source: RBI, Company, IIFL Research
We expect retail loans to grow at 16.7%
CAGR over FY18-20E
Exhibit 6: Total banking non-food advances mix (%)
Source: RBI, Company, IIFL Research
11.1 11.3 11.9 11.2 10.8 10.0 9.9 10.4 11.2 12.2 11.0 12.0 10.0
34.7 35.1 37.5 37.3 38.2 37.9 37.4 36.0 34.6 33.0 33.0 32.0 32.0
22.2 21.5 20.8 20.8 20.2 19.6 19.9 19.1 19.5 22.2 22.0 22.0 22.0
21.1 18.7 16.7 16.0 15.4 15.3 15.0 15.8 17.6 20.0 21.0 22.0 23.0
11.0 13.3 13.1 14.7 15.4 17.2 17.9 18.7 17.1 12.6 13.0 12.0 13.0
0
20
40
60
80
100
120
FY08 FY09 FY10 FY11 FY12 FY13 FY14 FY15 FY16 FY17 FY18 FY19E FY20E
Agriculture Industry Services Personal loans Priority Sector loans

12 | P a g e
Premia Research
Market share – PSU vs. Pvt. Banks
The above table clearly depicts that private banks have performed well
and capitalized on the opportunities by delivering credit growth at
19.5% as against 14.7% for PSU banks over FY06-18. This was achieved
due to better asset quality and higher capital position of private banks
as against PSU banks. Similarly, deposit growth of private banks has
also improved by 17.7% CAGR as against 14.8% CAGR for PSU banks
over FY06-18. Over the similar period, the CD ratio of private banks has
improved by 1,459bps to ~88%.
Deposit base of Pvt. banks growing ahead of industry
The total banks deposits expanded to ~`123 lakh cr in FY18 from ~`22
lakh cr in FY06, expanding at 15.6% CAGR. Pvt. banks were more
successful in raising deposits across all categories as compared to
PSUs. The growth was largely contributed by private sector banks,
registering 17.7% deposits CAGR over similar period as against PSU
banks growth of 14.8% CAGR.
Exhibit 8: Market share of PSU & Private banks in loans and deposits
Rs lakh cr FY06 FY07 FY08 FY09 FY10 FY11 FY12 FY13 FY14 FY15 FY16 FY17 FY18
PSU Banks (incl. SBI group)
Loans 11 14 18 23 27 33 39 45 51 55 56 56 57
Deposits 16 20 25 31 37 44 50 57 66 72 75 81 85
Pvt Banks
Loans 3 4 5 6 6 8 10 11 13 16 19 22 27
Deposits 4 6 7 7 8 10 12 14 16 18 21 26 30
Banking Industry
Loans 15 20 25 30.0 35 43 51 59 67 74 79 81 89
Deposits 22 27 33 41 47 56 65 74 85 94 101 111 123
Loan market share (%)
PSU (incl. SBI group)
72.9 72.7 72.6 75.3 77.2 76.9 76.4 76.1 75.7 74.1 70.8 68.5 64.4
Pvt 20.6 20.9 20.9 19.2 18.1 18.6 19.0 19.4 19.9 21.4 24.6 27.3 29.8
Deposit market share (%)
PSU (incl. SBI group)
75.0 73.9 73.9 76.6 77.8 77.9 77.5 77.3 77.2 76.3 74.2 72.7 68.7
Pvt 19.8 20.5 20.3 18.1 17.3 17.9 18.2 18.8 18.7 19.4 21.3 23.1 24.6 Source: RBI, Company, IIFL Research
The total banks deposits expanded to
~`123 lakh cr in FY18 from ~`22 lakh cr in
FY06, expanding at 15.6% CAGR

13 | P a g e
Premia Research
Market share – PSU vs. Pvt. Banks
Exhibit 9: Deposit growth of PSU and Pvt. banks over FY14-18 (%)
Source: Source: RBI, Company, IIFL Research
Of the deposits, current and savings accounts (CASA) are low cost and
sticky in nature. Certificate of Deposits (CDs) and bulk deposits from
corporate and institutional depositors are typically more volatile than
retail and household deposits. RBL Bank, Karur Vysya Bank and City
Union Bank have higher proportion of retail deposits in the total mix.
The rise in retail deposits has brought about stability in the bank’s
liability franchise, lending stability to earnings, as the cost of these tend
to be less volatile than bulk deposits. RBL Bank is one of the few banks
(in addition to IIB, KMB and YES) that offers differential interest rates
on their saving account deposits. This has led to robust CASA accretion
over the past 8 quarters (from ~18.3% to ~24.4% in Q1FY19). RBL Bank
and Karur Vysya Bank’s CASA share in total deposits is expected to
improve from 24.3% & 29.1% in FY18 to 28.3% & 32.3% in FY20E
respectively. As a consequence, the cost of deposits of RBL Bank and
Karur Vysya Bank are expected to decline from 6.3% & 6.01% in FY18
to 5.55% & 5.62% respectively in FY20E, in turn contributing to NIM
expansion. City Union Bank’s CASA ratio is expected to improve from
28% in FY18 to 32% in FY20E, which will lead to 43bps decline in cost
of deposits to ~5.9% over the same period.
14.7
9.2
4.0
7.9
4.9
14.0 15.3
17.1
19.4 18.5
14.9
10.6
7.0
10.1 11.0
0
5
10
15
20
25
FY14 FY15 FY16 FY17 FY18
PSU Banks (Incl. SBI group) Pvt Banks Banking Industry
Private sector banks, registering 17.6%
deposits CAGR over FY14-18 as against
PSU banks growth of 6.5% CAGR over
similar period

14 | P a g e
Premia Research
Market share – PSU vs. Pvt. Banks
Increasing market share of Pvt. banks due to poor asset quality of PSU banks The loan market share of PSU banks has been decreasing over FY14-18
due to worsening asset quality, while private banks have witnessed an
upward trend in loan market share (refer exhibit 10).
Exhibit 10: Loan market share for PSU vs. Private banks
Source: RBI, Company, IIFL Research
Private sector banks had an almost 100% share in the incremental bank
credit over last one year, whereas public sector banks are plagued with
asset quality issues leading to higher credit costs and losses. The
stressed assets of PSU banks hovered around ~16.6%, while that of
private banks remained lower at 4.4% as of March 2018. The GNPA of
PSU banks stood elevated at 15.6% for FY18 end and as per RBI June
2018 stability report, their GNPA may increase to 16.3% in FY19E. The
stressed assets of the PSU banks, which over last several years has
gone up, has led to jump in provisioning requirement for these banks.
The falling quality of assets has necessitated sizeable provisioning and
deleveraging, thereby eroding profitability and capital position of PSU
banks. The CRAR (Capital Risk Adjusted Ratio) of the PSU banks remains
lower at 11.2% in FY18, as compared to private banks at 15.9%. The
strong capital position of total private banks vis-à-vis total PSU banks
presents an opportunity for private banks to gain market share in total
bank credit in the coming years. The market share of private sector
banks in total banking sector advances is expected to increase to ~37%
by FY20E from ~20% as on March 31, 2014 and ~30% as on March 31,
2018.
76 74 71 6864
20 21 25 27 30
0
10
20
30
40
50
60
70
80
FY14 FY15 FY16 FY17 FY18E
PSU (incl. SBI group) [%] Pvt [%]
The GNPA of PSU banks stood elevated at
15.6% for FY18 end and as per RBI June
2018 stability report, their GNPA may
increase to 16.3% in FY19E

15 | P a g e
Premia Research
PCA an opportunity for Pvt. Banks
Prompt Corrective Action an opportunity for Pvt. Banks
RBI has put in place some points to cut risk weight exposures, reduce
capital consumption, freeze on recruitment and branch expansion,
limit exposure to risky loans & higher provisioning requirements and
control costs, etc. The process or mechanism under which such actions
are taken is known as Prompt Corrective Action, or PCA. The banks
under PCA are losing the market share in advances to total Scheduled
Commercial Banks (SCB; refer exhibit 3) due to the restrictions placed
on them to expand their business beyond a certain level. Given PSU
banks capital constraints and ~30% of PSU bank loans falling under
PCA, private banks have continued to gain market share.
Exhibit 11: Advances of banks under PCA as % of total SCB advances
Source: Company, IIFL Research
The market share of banks under PCA in total SCB credit over FY14-18
has declined by 800bps to 18%. Their market share is expected to
decline further until the restrictions are put in place. The restrictions
are intended to restore the health of the banks. The RBI’s Financial
Stability Report (June 2018) estimates that the 11 PCA banks may
experience a worsening of their GNPA ratio from 21% in March 2018
to 22.3% by March 2019E. Moreover, the report projects that the CRAR
of PCA PSU banks to fall from 10.8% in March 2018 to 6.5% in March
2019, in the absence of capital infusion. Thus, we believe that the mid-
size private banks with better capital adequacy position stand to
benefit from this. Private sector banks’ (PVB) market share is expected
to increase in the foreseeable future. Most of this market share is
likely to be wrested away from PCA public sector banks.
2624
2220
18
0
5
10
15
20
25
30
FY14 FY15 FY16 FY17 FY18
The market share of banks under PCA in
total SCB credit over FY14-18 has declined
by 800bps to 18%

16 | P a g e
Premia Research
PCA an opportunity for Pvt. Banks
These 11 banks under PCA have reported elevated level of NPAs over
FY17-18, which led to higher provisioning requirement. The higher
provisions resulted into deep losses for these banks. The net NPAs of
the five PCA banks were uncomfortably high at the end of March 2018.
These are IDBI Bank (net NPA ratio of 16.69%), United Bank of India
(16.49%), Indian Overseas Bank (15.33%), Dena Bank (11.96%) and
Bank of Maharashtra (11.24%). The 11 stressed banks make up for 30%
of deposits and 30% of advances of all the 21 PSU banks.
These 11 banks together have reported loss of `17,286cr and
`49,237cr in FY17 and FY18 respectively, due to higher provisions on
non-performing assets. This in turn, has deteriorated their capital
adequacy position, restricting them to expand their business. Most of
these banks have CRAR close to the minimum levels prescribed by the
RBI, which is at 9%.
These 11 banks under PCA have reported
elevated level of NPAs over FY17-18, which
led to higher provisioning requirement.
Exhibit 12: List of 11 PSU banks under PCA with widening net loss and poor asset quality
(Prompt Corrective Action)
Figures for FY18 Net Profit (` cr.) NNPA (%)
GNPA (%) NNPA (%) ROA (%) CRAR (%) FY17 FY18 FY17 FY18
Bank of India 16.6 8.3 -0.9 12.9 -1,558 -6,044 6.9 8.26
United Bank 24.1 16.5 -1 12.9 220 -1,445 10.02 16.49
Dena Bank 22 12 -1.6 11.1 -864 -1,923 10.66 11.96
Bank of Maharashtra
19.5 11.2 -0.7 11 -1,373 -1,146 11.76 11.24
UCO Bank 24.6 13.1 -1.9 10.9 -1,851 -4,436 8.94 13.1
Oriental Bank 17.6 10.5 -2.3 10.5 -1,094 -5,872 8.96 10.48
IDBI Bank 28 16.7 -2.5 10.4 -5,158 -8,238 13.21 16.69
I O B 25.3 15.3 -2.3 9.3 -3,417 -6,299 13.99 15.33
Corporation Bank 16.2 11.7 -1.7 9.2 561 -4,054 8.33 11.74
Central Bank 21.5 11.1 -1.6 9 -2,439 -5,105 10.2 11.1
Allahabad Bank 16 8 -2 8.7 -314 -4,674 8.92 8.04 Source: RBI, Companies, IIFL Research

17 | P a g e
Premia Research
RBL Bank Ltd CMP: ` 627; 1-year target: ` 739
Sector Banking
Recommendation BUY
Upside 18%
Stock Data
Sensex 38,690
52 Week h/l (`) 652/433
Market cap (` Cr) 26,637
BSE Code 540065
NSE Code RBLBANK
FV (`) 10
Div yield (%) 0.34
Shareholding Pattern
Dec-17 Mar-18 June-18
Promoters 0.0 0.0 0.0
DII+FII 30.70 32.50 35.38
Individuals 69.30 67.50 64.62
Source: ACE Equity, IIFL Research
Share Price Trend
Prices as on 30/08/2018
RBL Bank (one of the fastest growing private banks) is likely to see
improving return profile over next couple of years, due to improving
advances & loan mix, higher CASA, lower cost ratios and improving
asset quality. We forecast RoA and RoE to increase by 24bps and
317bps to 1.4% and 14.6% respectively over FY18-20E. Considering
the multiple levers, we value the stock at 3.6x FY20E P/ABV to arrive
at the 12-months target price of `739.
Changing loan mix and improving CASA & CD ratio to expand NIMs:
The NIMs of RBL Bank have improved by 70bps to 3.8% over FY16-18
led by rising CASA share, higher CD ratio and improving proportion of
high margin retail segment (+491bps over FY16-18 to ~22%). The retail
businesses had broken even in FY18 and would further scale up, aiding
margins. The proportion of higher yielding assets from the retail
segment (share of credit card & LAP together form ~75% of retail
business) in the entire asset mix is further expected to improve from
~22% in FY18 to ~26% in FY20E. We forecast its CASA share in total
deposits to rise from 24.3% in FY18 to 28.3% in FY20E. Moreover,
higher credit to deposit ratio (from 91.7% to 95.3% over FY18-20E) to
also support margin improvement. Thus, the NIM expansion will be
supported by improving product mix and lowering cost funding profile.
We forecast its NIM to surge by 41bps over FY18-20E to 4.2%.
Outlook & Valuation: We believe the stock deserves higher multiple
given decent earnings growth, steady asset quality, improving business
mix and loan growth above industry average. We expect the bank to
report industry leading loan CAGR of ~31.5% over FY18-20E. We
forecast revenue and PAT CAGR of 27.5% and 36.8% respectively over
FY18-20E.
Financial Summary
Figures in ` Cr FY17 FY18 FY19E FY20E
Net interest income 1,221 1,821 2,594 3,245
Total net operating income 1,977 2,889 3,834 4,696
Pre-provision profit 920 1,341 1,848 2,301
Net profit 447 632 957 1,182
P/E (x) 52.8 41.2 27.3 22.1
P/ABV (x) 5.6 4.0 3.6 3.2
ROE (%) 12.2 11.5 13.5 14.6
ROA (%) 1.0 1.1 1.4 1.4
Source: Company, IIFL Research
31000
33000
35000
37000
39000
450480510540570600630
Aug-17 Dec-17 Apr-18 Aug-18
RBL Bank Ltd Sensex

18 | P a g e
Premia Research
RBL Bank Ltd
Balance Sheet
Figures ` Cr FY17 FY18 FY19E FY20E
Sources of funds
Share Capital 375 420 420 420
Total Reserves 3,961 6,261 7119 8198
Networth 4,336 6,681 7,539 8,618
Minority interest 19
Deposits 34,588 43,883 57073 73053
Borrowings 7,980 9,261 9910 10207
Other Liabilities & Provisions 1,771 2,033 2,237 2,460
Total Liabilities 48,676 61,877 76,758 94,338
APPLICATION OF FUNDS
Goodwill on consolidation 18
Cash balance with RBI 2,948 2,589 2,411 2,848
Balances with banks 1,246 1,721 1807 1897
Investments 13,482 15,397 16475 17628
Advances 29,449 40,268 53959 69607
Gross block 259 340
Net Block 259 340 408 489
Other Assets 1,292 1,544 1,699 1,869
Total Assets 48,676 61,877 76,758 94,338
Source: Company, IIFL Research
Key Ratios
FY17 FY18 FY19E FY20E
Margins (%)
NIM 3.3 3.8 4.1 4.2
Interest Spread 2.4 2.9 3 3.1
Profitability (%)
Cost to Income 53.4 53.6 51.8 51.0
CD Ratio 85.1 91.7 94.5 95.3
CASA 22.0 24.3 27.4 28.3
Assets Quality (%)
Gross NPA 1.20 1.40 1.20 1.03
Net NPA 0.64 0.78 0.50 0.33
Provision Coverage 59.6 57.6 58.0 58.0
Capital Adequacy (%)
CAR 13.7 15.3 14.5 12.8
Source: Company, IIFL Research
We forecast RoA & RoE to increase by
24bps and 317bps respectively over FY18-
20E

19 | P a g e
Premia Research
RBL Bank Ltd
DuPont Analysis
Y/E March FY17 FY18 FY19E FY20E
NII / Assets (%) 2.6 3.0 3.5 3.5
Other Income / Assets (%) 1.6 1.8 1.7 1.6
Total Income / Assets (%) 4.2 4.8 5.1 5.1
Cost / Assets (%) 2.2 2.6 2.7 2.6
PPOP / Assets (%) 2.0 2.2 2.5 2.5
Provisions / Assets (%) 0.5 0.6 0.5 0.5
PBT / Assets (%) 1.4 1.6 2.0 2.0
Tax rate (%) 34.6 34.4 34.4 34.4
ROA (%) 0.9 1.1 1.3 1.3
Leverage (x) 11 9 10 11
RoE (%) 10.3 9.5 12.7 13.7
Source: Company, IIFL Research
Exhibit 1: Improving CASA & CD ratio to aid NIM expansion
Source: Company, IIFL Research
Improving loan mix towards higher yielding assets, rising CASA
proportion in total deposits and improving credit-deposit ratio to help
NIM expansion.
22.024.3
27.4 28.3
3.3 3.8 4.1 4.2
85.1
91.7
94.5 95.3
78
81
84
87
90
93
96
99
0
5
10
15
20
25
30
FY17 FY18 FY19E FY20E
CASA Ratio (%) NIMs (%) CD Ratio (%) [RHS]
The NIM expansion will be supported by
improving product mix and lowering cost
funding profile

20 | P a g e
Premia Research
RBL Bank Ltd
Loan book to grow at 31.5% CAGR over FY18-20E
RBL Bank’s loan book growth to come from across the segments (whole
sale and non-whole sale businesses). Under its DB&FI segment, both
Micro-Banking and MSME advances grew by 65% yoy and 76% yoy
respectively in FY18, aided by distribution expansion and the better
growth momentum. This trend would continue for at least next couple
of years. Retail loan book is expected to register 41.5% CAGR over
FY18-20E, led by LAP and credit card business. Its credit card business
saw ~180% yoy growth ending FY18 with a total of ~8 lakh cards. RBL’s
Credit Card retail spends are among the top 5 in the industry with
revenue as percentage of spends being the highest.
On a relatively smaller base of ̀ 40,267cr advances in FY18, we forecast
31.5% loan book CAGR over FY18-20E. The bank’s capital adequacy
ratio remains strong at 14.6% as at Q1FY19 end. The strong capital
position should allow the bank to grow comfortably without raising
fresh equity for next ~1.5 years. The management expects to gain
market share in corporate space due to muted competitive
environment.
Exhibit 2: Loan growth aided by across the business traction
Source: Company, IIFL Research
RBL Bank is expecting market share improvement in its wholesale book
due to muted competitive environment in corporate segment on the
back of poor capital position of PSU banks. Its non-wholesale business
to grow higher than wholesale business, led by Retail, MSME and
29,449
40,267
53,953
69,607
-
10,000
20,000
30,000
40,000
50,000
60,000
70,000
80,000
FY17 FY18 FY19E FY20E
In R
s C
r
Loan book to grow at 31.5% CAGR over
FY18-20E, its non-wholesale business to
grow higher than wholesale business, led
by higher Retail, MSME and Micro-
Banking segments

21 | P a g e
Premia Research
RBL Bank Ltd
Micro-Banking segments. These factors to contribute towards the
advances growth of the bank.
Improving asset quality to aid profitability
RBL Bank’s strategy of lending to quality clients with prudent cash
flows and C&IB’s (Corporate & Institutional Banking) focus on working
capital finance (~70% lending to short term working capital finance)
has helped maintain its asset quality. GNPA ratio has been on the lower
side despite the stupendous loan growth over the years. Its credit cost
for FY18 stands at 96bps, which is expected to reduce over FY18-20E,
through product and segment diversification. We believe the GNPA
ratio would decline by 30bps over FY18-20E to 1.1%, given the
management’s ability to contain asset quality in the past. Credit cost
(ex-financial inclusion) and DB & FI are trending down and we expect
them to improve further in FY19E. The bank’s commercial banking,
which is SME and mid-market book, used to have higher NPA
historically, which is also declining now. The restructured standard
assets portfolio has decreased to 0.08% as at March 31, 2018 from
0.18% yoy. We expect its credit cost to decline by 26bps to 0.7% over
FY18-20E.
Other income to grow at 16.5% CAGR over FY18-20E
For FY18, core fees grew 41% yoy. As in the past, we continue to see
strong granular growth across distribution, credit card, client Fx
income, and general banking fees. We expect the growth momentum
in core fee income to continue led by cross-sell opportunities and
increasing distribution reach. Increase in CASA deposits from
expansion in retail business is likely to enhance cross-sell
opportunities. We forecast 16.5% CAGR growth in other income over
FY18-20E.
Company Overview
RBL Bank is one of India’s fastest growing private sector banks with a
loan growth of 40.7% CAGR over FY15-18, and presence across the
country. For Q1FY19, its segment wise loan mix is, Corporate &
Institutional Banking (40.6%), Commercial Banking (18.6%), Branch &
Business Banking (~21.9%), Agribusiness Banking (~5%), Development
We expect its credit cost to decline by 26
bps to 0.7% over FY18-20E.

22 | P a g e
Premia Research
RBL Bank Ltd
Banking and Financial Inclusion (~13.9%). It currently services over 45
lakh customers through a network of 462 branches (including banking
outlets) and 388 ATMs spread across 20 Indian states and Union
Territories. For Q1FY19, its loan mix was ~59% wholesale and ~41%
non-wholesale. For Q1FY19, RBL Bank’s loan book stood at ~`42,198cr;
GNPA was at 1.4%; NNPA was at 0.75%; net interest margin was 4.04%,
capital adequacy ratio at 14.6%, cost-to-income ratio at 50.8% and PCR
at 60.4%.
Exhibit 3: Loan Mix (%)
Source: Company, IIFL Research
Exhibit 4: Sector-wise top 10 industry exposures
Industry % of Exposure Q1FY19
Construction 6
Engineering 5
Trade/ Distribution 4.8
Power 3.9
Professional Services 3.7
Pharma 3.6
Real Estate 3.4
Metals 3.3
Financial Services 2.3
Logistics 1.9 Source: Company
Key Risks
If the bank’s asset quality deteriorates significantly, profitability
would be impacted.
If the PSU banks capital position increases significantly then, it
could affect the bank’s advances growth and profitability.
41.9 40.3 39.1 38.2
18.7 18.7 18.7 18.5
18.222.1
23.725.6
7.24.8 4.0 3.4
14.0 14.1 14.4 14.3
0
5
10
15
20
25
30
35
40
45
FY17 FY18 FY19E FY20E
CL & IB CB BBB Agri DB & FI
The proportion of higher yielding assets
from retail in the entire asset mix is further
expected to improve from ~22% in FY18 to
~26% in FY20E

23 | P a g e
Premia Research
Karur Vysya Bank Ltd CMP: ` 94; 1-year target: ` 116
Sector Banking
Recommendation BUY
Upside 23%
Stock Data
Sensex 38,690
52 Week h/l (`) 150/94
Market cap (` Cr) 7,609
BSE code 590003
NSE code KARURVYSYA
FV (`) 2
Div yield (%) 0.57
Shareholding Pattern
Dec-17 Mar-18 Jun-18
Promoters 2.08 2.08 2.08
DII+FII 39.61 40.18 40.10
Individuals 58.30 57.73 57.82
Source: ACE Equity, IIFL Research
Share Price Trend
Prices as on 30/08/2018
Karur Vysya Bank Ltd (KVB; south India based bank) to benefit from
its digital banking initiative, asset quality improvement and advances
growth. Further, improving loan mix, higher CASA, lower cost ratios
to also support its return profile. We forecast its RoA & RoE to
increase by 48bps and 540bps to 1% and 11.5% respectively over
FY18-20E. KVB is currently trading at ~1.5x FY20E P/ABV, which is
attractive from a risk-reward point of view. Considering the multiple
levers, we value the bank at 1.8x FY20E P/ABV, to arrive at the 12-
month target price of `116.
Improving asset quality to drive return ratios
We believe the bank is in its tail end in terms of corporate NPAs. Out
of the ~`1,200cr of watch list in Q2FY18, it has reduced to ~`170cr in
Q1FY19 (already provided for in previous quarters). Corporate GNPA
for FY18 stood at 74% of the total GNPA. Post this, the bank is expected
to return to normalcy in terms of slippages (~`750cr normalized
slippages) and credit costs (~1.5%), which in turn would drive its return
ratios. We expect the GNPA ratio to decline by 136bps to 5.2% over
FY18-20E, due to lower slippages and higher recoveries due to
resolution in NCLT cases. The bank expects majority of the NCLT
exposures to be resolved in FY19E. Over FY18-20E, lower loan loss
provisions/interest reversal due to lesser slippages to drive an
improvement in RoA. We expect its RoA & RoE to increase by 51bps
and 586bps respectively over FY18-20E.
Outlook & Valuation: Reduction in stressed asset formation and
improvement in core profitability would drive the re-rating of stock.
We forecast its revenue and profit to register 14.1% and 50.9% CAGR
over FY18-20E respectively.
Financial Summary
Figures in ` Cr FY17 FY18 FY19E FY20E
Net interest income 2,074 2,298 2,665 2,974
Total net operating income 2,856 3,198 3,699 4,164
Pre-provision profit 1,571 1,777 1,887 2,332
Net profit 606 346 456 787
P/E (x) 10.4 21.7 16.4 9.5
P/ABV (x) 1.6 1.7 1.7 1.5
ROE (%) 12.0 6.1 7.1 11.6
ROA (%) 1.0 0.5 0.6 1.0 Source: Company, IIFL Research
31000
33000
35000
37000
39000
80
100
120
140
Aug-17 Dec-17 Apr-18 Aug-18
Karur Vysya Bank Ltd Sensex

24 | P a g e
Premia Research
Karur Vysya Bank Ltd
Balance Sheet
Figures ` Cr FY17 FY18 FY19E FY20E
Sources of funds
Share Capital 134 160 160 160
Total Reserves 4,901 6,105 6,363 6,897
Net worth 5,035 6,264 6,522 7,056
Deposits 53,700 56,890 63,603 71,108
Borrowings 1,696 2,382 2,453 2,527
Other Liabilities & Provisions 1,376 1,393 1,393 1,393
Total Liabilities 61,807 66,929 73,972 82,085
Application Of Funds
Cash balance with RBI 2,790 2,960 3,923 3,170
Balances with banks 1,555 1,337 1,337 1,337
Investments 14,857 15,803 16,435 17,093
Advances 40,908 44,800 50,028 58,009
Gross block 419 528 628 728
Net Block 419 528 628 728
Other Assets 1,279 1,501 1,651 1,816
Total Assets 61,807 66,929 73,972 82,085
Source: Company, IIFL Research
Key Ratios FY17 FY18 FY19E FY20E
Margins (%)
NIM 3.7 3.9 3.9 3.9
Interest Spread 3.1 3.2 3.3 3.2
Profitability (%)
Cost to Income 45.0 44.4 49.0 44.0
CD Ratio 76.2 78.7 78.7 81.6
CASA 27.7 29.1 30.7 32.3
Assets Quality (%)
Gross NPA 3.6 6.6 6.2 5.2
Net NPA 2.5 4.2 3.8 3.2
Provision Coverage 57.8 56.5 58.0 58.0
Capital Adequacy (%)
CAR 12.5 14.4 14 13.4
Source: Company, IIFL Research
We expect its RoA & RoE to increase by 51bps
and 586bps respectively over FY18-20E

25 | P a g e
Premia Research
Karur Vysya Bank Ltd
DuPont Analysis
Y/E March FY17 FY18 FY19E FY20E
NII / Assets (%) 3.4 3.5 3.7 3.7
Other Income / Assets (%) 1.3 1.4 1.4 1.5
Total Income / Assets (%) 4.8 4.9 5.2 5.2
Cost / Assets (%) 2.1 2.2 2.5 2.3
PPOP / Assets (%) 2.6 2.7 2.6 2.9
Provisions / Assets (%) 1.1 2.0 1.7 1.5
PBT / Assets (%) 1.5 0.8 0.9 1.4
Tax rate (%) 31 31 31 31
ROA (%) 1.0 0.5 0.6 1.0
Leverage (x) 11.9 10.4 11.0 11.3
RoE (%) 12.0 5.5 7.0 11.2
Source: Company, IIFL Research
Exhibit 1: Asset quality improvement to drive return ratios
Source: Company, IIFL Research
The bank’s strategy is to increase the more granular retail/SME portion
and restrict large-ticket corporate exposures to lower corporate
slippages. The management has guided that most of the heavy lifting
in terms of recognition of lumpy corporate accounts has been over by
Q1FY19 and that remainder of the year should see normalized
slippages and credit costs (of 1.5%). Normalization of slippage rate and
credit cost due to efficient risk management practices, better recovery
and lesser focus on corporate segment to reduce provisioning
requirement, and hence would drive its return ratios going ahead.
Notably, the bank’s provisioning in FY18 had increased by ~85% yoy.
3.58
6.56
6.18
5.20
1.0 0.5 0.6 1.0
12.0
6.1
7.1
11.5
2.53
4.16 3.83
3.22
0.0
0.5
1.0
1.5
2.0
2.5
3.0
3.5
4.0
4.5
0
2
4
6
8
10
12
14
FY17 FY18 FY19E FY20E
GNPA (%) RoA (%) RoE (%) [LHS] NNPA (%) [RHS]
The GNPA ratio is expected to decline by
136bps to 5.2% over FY18-20E due to lower
slippages, higher recoveries

26 | P a g e
Premia Research
Karur Vysya Bank Ltd
Digital transformation an enabler of next leg of growth
KVB has migrated to the latest version of “Flexcube’’ Core Banking
platform. This is amongst the first in the industry. This enables a highly
automated underwriting process that relies on third party data (Credit
Bureaus, Banking Data and Tax related data amongst others). It
enables credit decisions to be taken in minutes as against in days, while
tightly managing credit risk with the help of credit scores. During
Q4FY18, the bank launched two new digital products i.e.
algorithmically underwritten home loans (1st in the industry) and
working capital renewal products. One of the core objectives of going
digital has been to quantify risk and improve the ability to underwrite
loans (presently old method of underwriting), which will help to have
good quality assets on the book. As the new systems comes in place, it
will be able to grow business much more quickly. In H2FY19 it will be
launching all its products and services on a completely digital platform,
which will boost the loan book of the bank. We expect the bank’s loan
book to grow at 14.2% CAGR over FY18-20E, that will also aid in
garnering low cost deposits. Expected higher share coming from CASA
owing to digitization will have a positive impact on the NIMs.
Exhibit 2: Digitalization initiative of the bank
Source: Company
We expect the bank’s loan book to grow at
14.2% CAGR over FY18-20E

27 | P a g e
Premia Research
Karur Vysya Bank Ltd
Change in loan mix, improving CASA & CD ratio to support NIMs
The bank is focusing on Retail, Commercial and Agri segments (and has
decided to show moderate growth in Corporate segment). The bank’s
new scored model technology initiative will update the relative
riskiness of the clients, which in turn will restrict the slippages, so there
is a scope for improvement in spreads and NIMs. Further, it will aid the
bank to garner low cost deposit. We expect its CASA ratio to improve
by 320bps to 32.3% over FY18-20E. As the banks loan growth increases,
its CD ratio is likely to improve by 414bps to 82.9% over FY18-20E. The
NIMs to remain steady over FY18-20E due to (1) change in mix towards
higher yielding segments like Commercial & Retail, (2) lower interest
reversals due to lower slippages and (3) declining cost of funds.
Exhibit 3: Rising CASA & CD ratio to drive NIM expansion
Source: Company, IIFL Research
Change in mix towards higher yielding segments like Commercial & Retail, lower interest reversals due to lower slippages and declining cost of funds to also aid NIM expansion in addition to expanding CASA and CD ratio.
Company Overview Karur Vysya Bank is a South India based bank with large geographic
concentration in Tamil Nadu and Andhra Pradesh. Its current market
share in loans and deposits is ~0.6% each as of March 31, 2018. The
loan mix for Q1FY19 is diversified, corporate/commercial/Agriculture
and retail formed 31%/35%/17% and 17% of its loan book. For Q1FY19
end, the bank’s loan book stood at ~`0.48 lakh cr; GNPA was at 7.44%;
27.729.1
30.732.3
3.7 3.9 3.9 3.9
76.2
78.7 78.7
81.6
73
74
75
76
77
78
79
80
81
82
0
5
10
15
20
25
30
35
FY17 FY18 FY19E FY20E
CASA Ratio (%) [LHS] NIMs (%) CD Ratio (%) [RHS]
We expect its CASA ratio to improve by
320bps to 32.3% over FY18-20E
Change in mix towards higher yielding segments like Commercial & Retail, lower slippages and declining cost of funds to aid NIM expansion in addition to expanding CASA and CD ratio
The bank’s strategy is to increase retail/SME
portion and restrict large-ticket corporate
exposures

28 | P a g e
Premia Research
Karur Vysya Bank Ltd
NNPA was at 4.5%; net interest margin was 3.65%; PCR at 56.5%;
capital adequacy ratio was at 14.08%; cost-to-income ratio at 45.18%.
For Q1FY19, the CASA and term deposit ratio stood at 30% and 70%
respectively.
Exhibit 4: Loan Mix (%)
Source: Company, IIFL Research
The size of the corporate book is expected to come down to ~25% in next 4 years from 31% in FY18, as other areas like retail and SME would grow at a faster pace.
Exhibit 5: Sector-wise industry exposures
Advances – Sector Details % of Total Advances (Q1FY19)
Manufacturing sector 28
Trading 17
Jewel loan 15
Personal loans 13
Agri 4
CRE 6
Bills 3
NBFC 3
Others 11
Source: Company
Key Risks
If the bank’s asset quality deteriorates significantly, profitability
would be impacted.
If the PSU banks capital position increases significantly then, it
could affect the bank’s advances growth and profitability.
35 35 35 3633
3129
27
17 17 17 1815 17
1820
0
5
10
15
20
25
30
35
40
FY17 FY18 FY19E FY20E
Commercial Banking Corporate Banking Agri banking Retail (personal banking)
We expect the bank’s loan book to grow at
14.2% CAGR over FY18-20E
Its current market share in loans and
deposits is ~0.6% each as of March 31,
2018

29 | P a g e
Premia Research
City Union Bank Ltd CMP: ` 203; 1-year target: ` 235
Sector Banking
Recommendation BUY
Upside 16.1%
Stock Data
Sensex 38,690
52 Week h/l (`) 185/133
Market cap (` Cr) 14,843
BSE code 532210
NSE code CUB
FV (`) 1
Div yield (%) 0.18
Shareholding Pattern
Dec-17 Mar-18 Jun-18
Promoters 0.0 0.0 0.0
DII+FII 50.55 50.8 51.28
Individuals 49.45 49.2 48.72
Source: ACE Equity, IIFL Research
Share Price Trend
Prices as on 30/08/2018
City Union Bank Ltd (CUB; south India based bank) to benefit from its
increasing loan book led by better traction in MSME and retail loan
book segments. Its focus on lower slippages and higher recovery will
lead to declining credit cost over next couple of years. In addition,
focus on high yielding products, higher CASA & CD ratio and lower
cost ratios to also support its return profile. We forecast its RoA &
RoE to increase by 7bps and 13bps to 1.64% and 15.4% respectively
over FY18-20E. Considering multiple levers, we assign 2.8x on FY20E
P/ABV to arrive at target price of `235.
Retail & MSME to drive loan book growth
We expect high double digit growth in loan book over FY18-20E, largely
driven by MSME and the retail book and a better credit environment
in Tamil Nadu. Its capital position is also sufficient at ~16.2% capital
adequacy (tier-1 15.8%) for FY18. The bank is expected to register
17.7% loan book growth over FY18-20E as a result of the
management’s focus on MSME and retail segments. As of FY18 end, it
had 600 branches and it plans to add 50-75 branches in FY19, which
will also aid loan book growth.
Outlook & Valuation: With its stable asset quality, better capital
position and focused SME & retail lending strategy, we expect
profitability and margins to be strong over FY18-20E. We forecast
16.4% earnings CAGR over FY18-20E. The bank has higher return
profile, with RoA & RoE at ~1.6% and 15.3% for FY18. Further, its
secured lending model in the form of small ticket size loans (mostly
working capital loans) provides cushion to asset quality. It has also
been able to improve its NIMs led by its focus on higher yielding loans.
Financial Summary
Figures in ` Cr FY17 FY18 FY19E FY20E
Net interest income 1,199 1,430 1,589 1,882
Total net operating income 1,683 1,962 2,174 2,531
Pre-provision profit 994 1,208 1,337 1,557
Net profit 503 592 666 802
P/E (x) 24.2 22.8 20.2 16.8
P/ABV (x) 3.5 3.3 2.9 2.5
ROE (%) 15.3 15.3 14.9 15.4
ROA (%) 1.4 1.6 1.6 1.6 Source: Company, IIFL Research
31000
33000
35000
37000
39000
120
150
180
210
Aug-17 Dec-17 Apr-18 Aug-18
City Union Bank Ltd Sensex
30 | P a g e
Premia Research
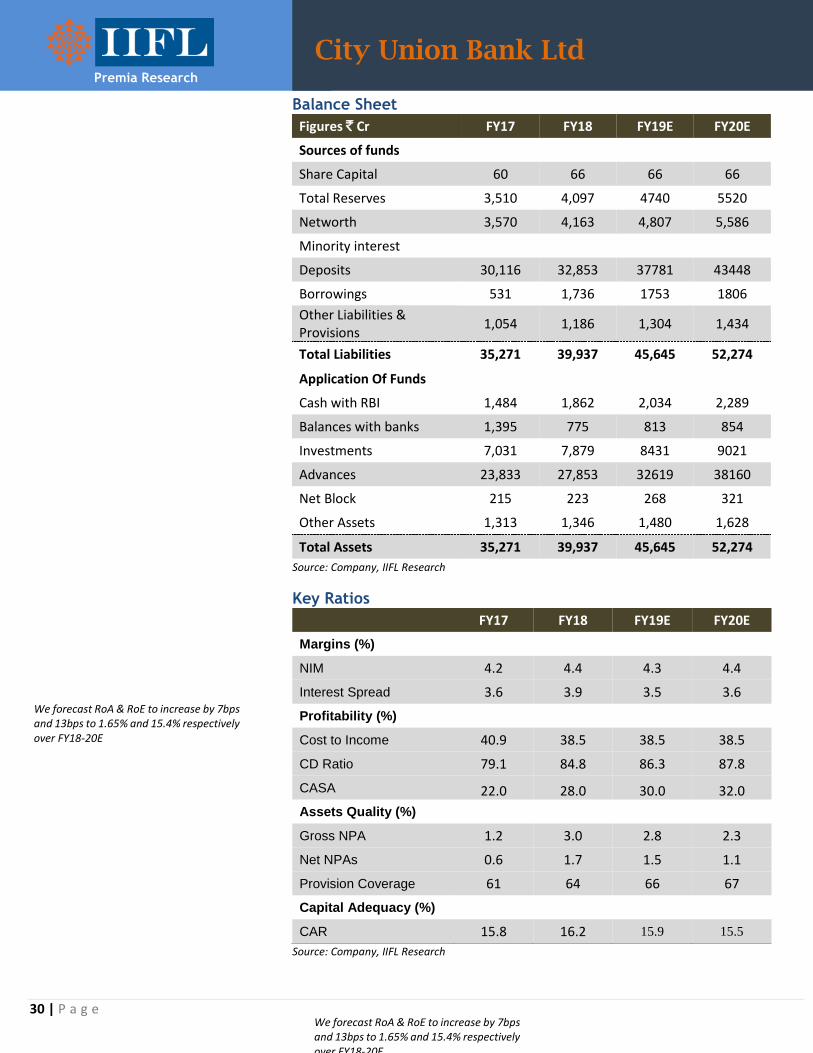
City Union Bank Ltd
Balance Sheet
Figures ` Cr FY17 FY18 FY19E FY20E
Sources of funds
Share Capital 60 66 66 66
Total Reserves 3,510 4,097 4740 5520
Networth 3,570 4,163 4,807 5,586
Minority interest
Deposits 30,116 32,853 37781 43448
Borrowings 531 1,736 1753 1806
Other Liabilities & Provisions
1,054 1,186 1,304 1,434
Total Liabilities 35,271 39,937 45,645 52,274
Application Of Funds
Cash with RBI 1,484 1,862 2,034 2,289
Balances with banks 1,395 775 813 854
Investments 7,031 7,879 8431 9021
Advances 23,833 27,853 32619 38160
Net Block 215 223 268 321
Other Assets 1,313 1,346 1,480 1,628
Total Assets 35,271 39,937 45,645 52,274
Source: Company, IIFL Research
Key Ratios FY17 FY18 FY19E FY20E
Margins (%)
NIM 4.2 4.4 4.3 4.4
Interest Spread 3.6 3.9 3.5 3.6
Profitability (%)
Cost to Income 40.9 38.5 38.5 38.5
CD Ratio 79.1 84.8 86.3 87.8
CASA 22.0 28.0 30.0 32.0
Assets Quality (%)
Gross NPA 1.2 3.0 2.8 2.3
Net NPAs 0.6 1.7 1.5 1.1
Provision Coverage 61 64 66 67
Capital Adequacy (%)
CAR 15.8 16.2 15.9 15.5
Source: Company, IIFL Research
We forecast RoA & RoE to increase by 7bps and 13bps to 1.65% and 15.4% respectively over FY18-20E
We forecast RoA & RoE to increase by 7bps and 13bps to 1.65% and 15.4% respectively over FY18-20E
31 | P a g e
Premia Research
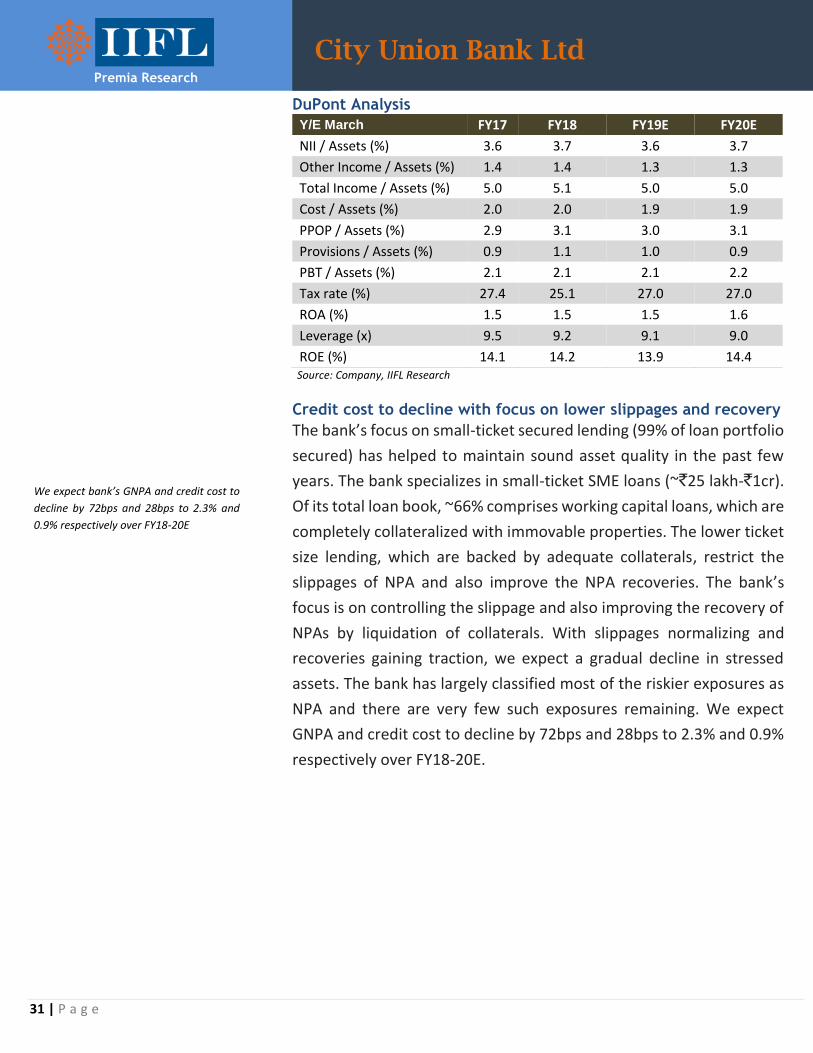
City Union Bank Ltd
DuPont Analysis
Y/E March FY17 FY18 FY19E FY20E
NII / Assets (%) 3.6 3.7 3.6 3.7
Other Income / Assets (%) 1.4 1.4 1.3 1.3
Total Income / Assets (%) 5.0 5.1 5.0 5.0
Cost / Assets (%) 2.0 2.0 1.9 1.9
PPOP / Assets (%) 2.9 3.1 3.0 3.1
Provisions / Assets (%) 0.9 1.1 1.0 0.9
PBT / Assets (%) 2.1 2.1 2.1 2.2
Tax rate (%) 27.4 25.1 27.0 27.0
ROA (%) 1.5 1.5 1.5 1.6
Leverage (x) 9.5 9.2 9.1 9.0
ROE (%) 14.1 14.2 13.9 14.4 Source: Company, IIFL Research Credit cost to decline with focus on lower slippages and recovery
The bank’s focus on small-ticket secured lending (99% of loan portfolio
secured) has helped to maintain sound asset quality in the past few
years. The bank specializes in small-ticket SME loans (~`25 lakh-`1cr).
Of its total loan book, ~66% comprises working capital loans, which are
completely collateralized with immovable properties. The lower ticket
size lending, which are backed by adequate collaterals, restrict the
slippages of NPA and also improve the NPA recoveries. The bank’s
focus is on controlling the slippage and also improving the recovery of
NPAs by liquidation of collaterals. With slippages normalizing and
recoveries gaining traction, we expect a gradual decline in stressed
assets. The bank has largely classified most of the riskier exposures as
NPA and there are very few such exposures remaining. We expect
GNPA and credit cost to decline by 72bps and 28bps to 2.3% and 0.9%
respectively over FY18-20E.
We expect bank’s GNPA and credit cost to
decline by 72bps and 28bps to 2.3% and
0.9% respectively over FY18-20E

32 | P a g e
Premia Research
City Union Bank Ltd
Exhibit 1: Lower slippages & better recovery to aid low credit cost
Source: Company, IIFL Research
The bank’s focus is on controlling the slippage and also improving the
recovery of NPAs by liquidation of collaterals, which will lead to lower
credit cost. High yielding loans and better CD ratio to drive NIMs improvement
The main focus of the bank is on high yielding segments like MSME and
Retail (together formed 72% for FY18). We expect the proportion of
both the segments to go up to 73.6% of total advances by FY20E. Its
Credit Deposit (CD) ratio has also improved by 652bps to 84.8% over
FY16-18 and we expect it to further improve by 305bps to 87.8%. Also,
its share of CASA in total deposits is likely to go up by 400bps to 32%
over FY18-20E. The increasing CASA proportion in total deposits will
lead to decline in cost of deposits, which we forecast would fall by
43bps to ~5.9% over FY18-20E. We expect the bank’s NIM to improve
by 33bps to 4.4% through FY18-20E.
Exhibit 2: Change in product mix & rising CASA to support NIMs
Source: Company, IIFL Research
1.31.2
1.00.9
0.4
0.60.7 0.7
2.0 2.1
1.7 1.4
0.0
0.5
1.0
1.5
2.0
2.5
0.0
0.2
0.4
0.6
0.8
1.0
1.2
1.4
FY17 FY18 FY19E FY20E
Credit Cost (%) Recovery (%) [LHS] Slippages (%) [RHS]
72.0 72.0 72.7 73.6
22.028.0 30.0 32.0
3.9 4.1 4.34.4
79.184.8
86.3
87.8
74
76
78
80
82
84
86
88
90
0
20
40
60
80
FY17 FY18 FY19E FY20E
MSME & Retail segment share (%) CASA Ratio (%)
We expect the bank’s NIM to improve by
33bps to 4.4% through FY18-20E
Its share of CASA in total deposits is likely to
go up by 400bps to 32% over FY18-20E.

33 | P a g e
Premia Research
City Union Bank Ltd
Despite the yields to see pressure over the next couple of years, we
expect NIMs improvement due to continued focus on higher yield
products and expanding CASA share in total deposits.
Company Overview
City Union Bank is a small-sized regional bank based out of
Kumbakonam, Tamil Nadu with a legacy of over 100 years. It had a
network of 600 branches as of FY18 end and 538 branches are located
in South India out of which 415 are in Tamil Nadu. It is primarily a
working capital lender to MSME, retail/wholesale trade and
agricultural sectors. Its operations are mostly concentrated in Tamil
Nadu, followed by Andhra Pradesh and Telangana. CUBK has a high
yielding portfolio, strong SME relationships, well-managed asset
quality, and it has delivered ~1.5% ROA consistently over the last
several years. For Q1FY19, its loan book stood at ~`0.28 lakh cr, GNPA
was at 3.02%; NNPA was at 1.7%; net interest margin was 4.24% and
capital adequacy ratio was at 16.06%, cost-to-income ratio stood at
40.58%.
Exhibit 3: Loan Mix (%)
Source: Company, IIFL Research
14.0 14.0 13.4 12.4
20.0 20.0 20.2 20.4
52.0 52.0 52.5 53.2
14.0 14.0 13.9 14.0
0
10
20
30
40
50
60
FY17 FY18 FY19E FY20E
Agri Retail MSME Corporate
The bank is expected to register 17.7% loan
book growth over FY18-20E, as a result of
management focus on MSME and retail
segments
City Union Bank has delivered ~1.5% ROA
consistently over the last several years.
34 | P a g e
Premia Research
City Union Bank Ltd
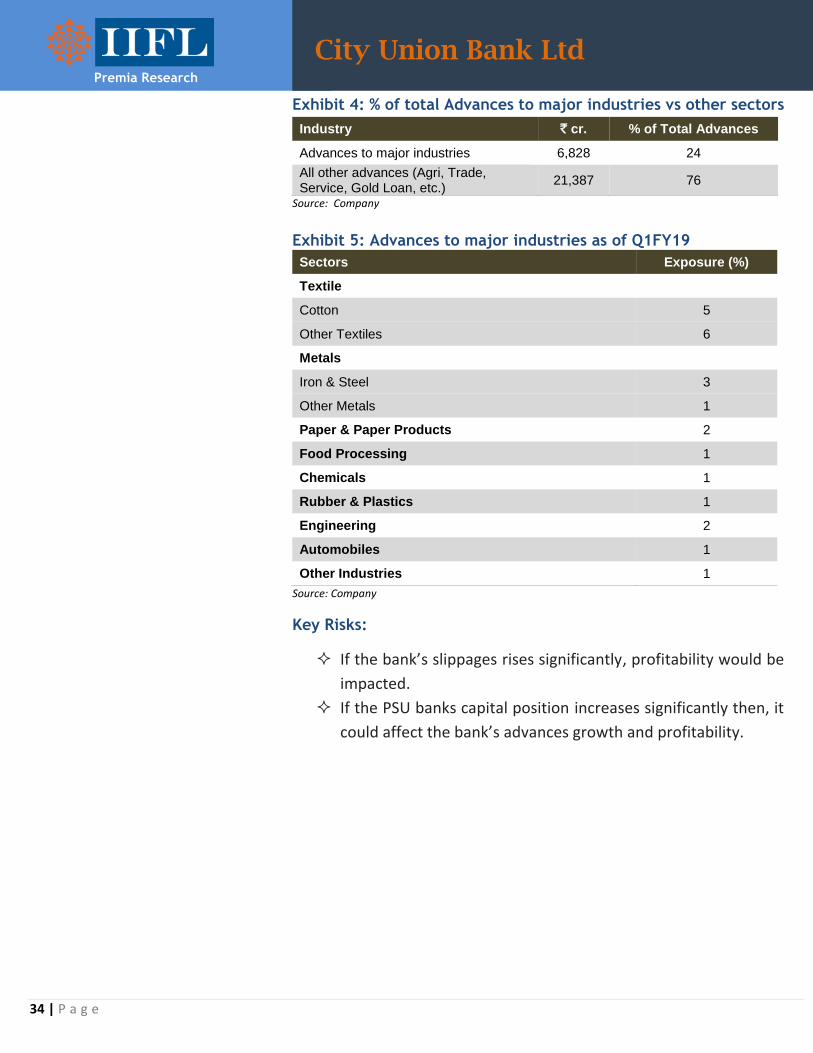
Exhibit 4: % of total Advances to major industries vs other sectors
Industry ` cr. % of Total Advances
Advances to major industries 6,828 24
All other advances (Agri, Trade, Service, Gold Loan, etc.)
21,387 76
Source: Company
Exhibit 5: Advances to major industries as of Q1FY19
Sectors Exposure (%)
Textile
Cotton 5
Other Textiles 6
Metals
Iron & Steel 3
Other Metals 1
Paper & Paper Products 2
Food Processing 1
Chemicals 1
Rubber & Plastics 1
Engineering 2
Automobiles 1
Other Industries 1
Source: Company
Key Risks:
If the bank’s slippages rises significantly, profitability would be
impacted.
If the PSU banks capital position increases significantly then, it
could affect the bank’s advances growth and profitability.

35 | P a g e
Premia Research
Disclaimer
Recommendation Parameters for Fundamental/Technical Reports: Buy – Absolute return of over +10% Accumulate – Absolute return between 0% to +10% Reduce – Absolute return between 0% to -10% Sell – Absolute return below -10% Please refer to http://www.indiainfoline.com/research/disclaimer for recommendation parameter, analyst disclaimer and other disclosures. IIFL Securities Limited (Formerly ‘India Infoline Limited’), CIN No.: U99999MH1996PLC132983, Corporate Office – IIFL Centre, Kamala City, Senapati Bapat Marg, Lower Parel, Mumbai – 400013 Tel: (91-22) 4249 9000. Fax: (91-22) 40609049, Regd. Office – IIFL House, Sun Infotech Park, Road No. 16V, Plot No. B-23, MIDC, Thane Industrial Area, Wagle Estate, Thane – 400604 Tel: (91-22) 25806650. Fax: (91-22) 25806654 E-mail: [email protected] Website: www.indiainfoline.com, Refer www.indiainfoline.com for detail of Associates. Stock Broker SEBI Regn.: INZ000164132, PMS SEBI Regn. No. INP000002213, IA SEBI Regn. No. INA000000623, SEBI RA Regn.:- INH000000248 For Research related queries, write at [email protected] For Sales and Account related information, write to customer care: [email protected] or call on 91-22 4007 1000