03overlay of economic growth, demographic trends, and
TRANSCRIPT

Chapter 3 Overlay of Economic Growth, Demographic Trends, and Physical Characteristics | 29
03 Overlay of Economic Growth, Demographic Trends, and Physical Characteristics

30 | Philippine Development Plan 2017-2022

Chapter 3 Overlay of Economic Growth, Demographic Trends, and Physical Characteristics | 31
Chapter 3
Overlay of Economic Growth, Demographic Trends, and Physical CharacteristicsThe Philippine Development Plan (PDP) 2017-2022, which takes off from the current Administration’s 0+10 Socioeconomic Agenda, pursues the realization of inclusive development, anchored on the Long-Term Vision or AmBisyon Natin 2040: matatag, maginhawa, at panatag na buhay. It defines the desired spatial distribution of human activity in the country based on economic, social, institutional, and environmental conditions.
The Plan espouses a national spatial strategy (NSS) that describes the geographic development challenges and opportunities in population and economic growth. The NSS provides the basis for policies on urban development, infrastructure development, disaster mitigation, and environmental resource protection and conservation. It recommends sustainable human settlements, efficient production, and effective service delivery systems.
The key principles of spatial development are as follows:
• Integration of leading and lagging areas and urban-rural linkages through transportation networks
• Improvement of access to social services• Identification of locations of major infrastructure to maximize their benefits• Improvement of local, national, and international connectivity• Promotion of sustainable development and resiliency
Economic and Demographic TrendsThe spatial distribution of population reflects the structure of the economy, characterized by varying concentrations of production and consumption in cities and municipalities, and in their respective host regions. The notable trends include the following:
The total population continues to increase following a long-term trend.
• The overall growth rate, however, is decreasing, which is a global trend.
• Regions with established and large cities (regional centers) are growing the fastest. Notably, while the regional centers are growing much faster than other cities and municipalities, the National Capital Region’s growth is much slower. Its share of the population is getting smaller even though its contribution to gross domestic product (GDP) remains highest among the regions.
• Regions with the largest populations also have the largest shares to GDP.

32 | Philippine Development Plan 2017-2022
Figure 3.1 Average Regional Share in GDP, 2010-2015
Regional Shares in GDPThe country’s three most populous regions––CALABARZON (Region 4A), National Capital Region (NCR), and Central Luzon (Region 3)––account for nearly two-thirds of the Philippine domestic production (see Figure 3.1). NCR had the largest share to GDP at 37.9 percent in 2015, followed by CALABARZON at 15.5 percent, and Central Luzon at 8.9 percent, for a combined total share of 62.3 percent. The growth of these regions has been due primarily to the location of the central government, which facilitates the expansion of the industry and services sectors.
On the other hand, the regions with the smallest contributions to GDP are the
Autonomous Region in Muslim Mindanao (ARMM) at 0.7 percent, followed by Caraga at 1.3 percent, and Mindoro Occidental, Mindoro Oriental, Marinduque, Romblon, Palawan (MIMAROPA) at 1.6 percent.
The rest of Luzon accounts for 10.3 percent, Visayas for 12.4 percent, and Mindanao for 14.5 percent share to GDP.
In terms of growth rates, six regions expanded faster than the 6.2 percent average GDP growth rate in the past six years. The Caraga region, coming from a low base, is the fastest with an average gross regional domestic product (GRDP) growth rate of 8.8 percent. It is followed by Central Visayas (Region 7) and Central Luzon at 8.2 percent and 7.2 percent, respectively.

Chapter 3 Overlay of Economic Growth, Demographic Trends, and Physical Characteristics | 33
Table 3.1 GRDP Growth Rate and Regional Contribution to GDP Growth, 2010-2015
REGION
GDP GROWTH RATE AVERAGE ANNUAL GROWTH
RATE (2010-2015)
CONTRIBUTION TO GDP GROWTH AVERAGE CONTRIBUTION
TO GDP GROWTH
(2010-2015)2010 2011 2012 2013 2014 2015 2010 2011 2012 2013 2014 2015
PHIL 7.6 3.7 6.7 7.1 6.2 5.9 6.2 7.6 3.7 6.7 7.1 6.2 5.9 6.2
NCR 7.4 3.2 7.0 9.1 5.9 6.6 6.5 2.6 1.1 2.5 3.3 2.2 2.4 2.3
CAR 6.5 1.3 (2.9) 5.4 3.3 3.7 2.9 0.1 0.0 (0.1) 0.1 0.1 0.1 0.1
I 6.8 2.5 7.2 7.0 6.4 5.0 5.8 0.2 0.1 0.2 0.2 0.2 0.2 0.2
II (0.8) 5.7 7.2 6.6 7.2 3.7 4.9 (0.0) 0.1 0.1 0.1 0.1 0.1 0.1
III 10.0 7.1 7.2 4.5 9.3 5.3 7.2 0.9 0.6 0.7 0.4 0.8 0.5 0.7
CALABARZON 11.7 1.6 7.0 6.6 5.1 5.9 6.3 2.0 0.3 1.2 1.2 0.9 1.0 1.1
MIMAROPA (0.3) 3.1 4.1 1.3 8.3 1.7 3.0 (0.0) 0.1 0.1 0.0 0.1 0.0 0.1
V 3.5 1.9 8.8 8.2 4.3 8.4 5.8 0.1 0.0 0.2 0.2 0.1 0.2 0.1
VI 4.5 6.2 7.0 3.4 5.2 8.3 5.8 0.2 0.2 0.3 0.1 0.2 0.3 0.2
VII 12.9 6.8 9.4 7.4 7.8 4.8 8.2 0.7 0.4 0.6 0.5 0.5 0.3 0.5
VIII 3.0 2.1 (6.8) 4.6 (2.4) 3.9 0.7 0.1 0.1 (0.2) 0.1 (0.1) 0.1 0.0
IX 1.4 0.1 12.4 4.2 6.6 7.2 5.3 0.0 0.0 0.2 0.1 0.1 0.1 0.1
X 6.5 5.8 6.5 5.4 7.1 5.5 6.1 0.2 0.2 0.2 0.2 0.3 0.2 0.2
XI 5.6 3.7 7.0 6.7 9.3 7.9 6.7 0.2 0.1 0.3 0.3 0.4 0.3 0.3
XII 2.2 5.3 7.3 8.4 6.2 3.3 5.4 0.1 0.1 0.2 0.2 0.2 0.1 0.1
Caraga 10.7 8.5 11.5 8.2 9.4 4.2 8.8 0.1 0.1 0.1 0.1 0.1 0.1 0.1
ARMM 6.7 (0.3) 0.0 3.8 3.0 (0.8) 2.1 0.1 (0.0) 0.0 0.0 0.0 (0.0) 0.0
Source: Philippine Statistics Authority
Trends in Population GrowthThe population of the Philippines continues to increase. Based on the 2015 census, the country’s population is 100,981,437. It is 8.64 million more than the population in 2010 and 24.47 million more than in 2000. Annual population growth rate, however, has been slowing down––from 1.90 percent in 2000-2010 to 1.72 percent in 2010-2015.1 CALABARZON has the largest population with 14.4 million, followed by NCR with 12.9 million, and Central Luzon with 11.2 million. The least populated regions are
1 Population censuses were conducted in 2000, 2010, and 2015.
MIMAROPA with 3 million, Caraga with 2.6 million, and Cordillera Administrative Region (CAR) with 1.7 million.
By 2045, the population of the Philippines is projected to increase to 142,095,100. CALABARZON is projected to continue to have the highest population. Central Luzon and NCR will have almost equal population levels of 14.5 million. Western Visayas (Region 6) and Central Visayas, the next most populous regions, are each expected to have 9.7 million people by 2030. On the other hand, CAR will continue to be the least populated.

34 | Philippine Development Plan 2017-2022
Figure 3.2 Population by Region, 2015
Source: Philippine Statistics Authority
Population Growth of Major CitiesBased on the 2015 Census of Population, the Philippines has 33 highly-urbanized cities, with four of them having a population of more than one million: Quezon City (2.94 million), Manila City (1.78 million), Davao City (1.63 million), and Caloocan City (1.58 million). Most of these cities are located in the Luzon island. After Davao City, cities with the highest population outside Luzon are Cebu City in the Visayas with 922,611 and Zamboanga City in Mindanao with 861,799.
Figure 3.3 Population of Major Cities
Source: Philippine Statistics Authority
Chapter 3 Overlay of Economic Growth, Demographic Trends, and Physical Characteristics | 35
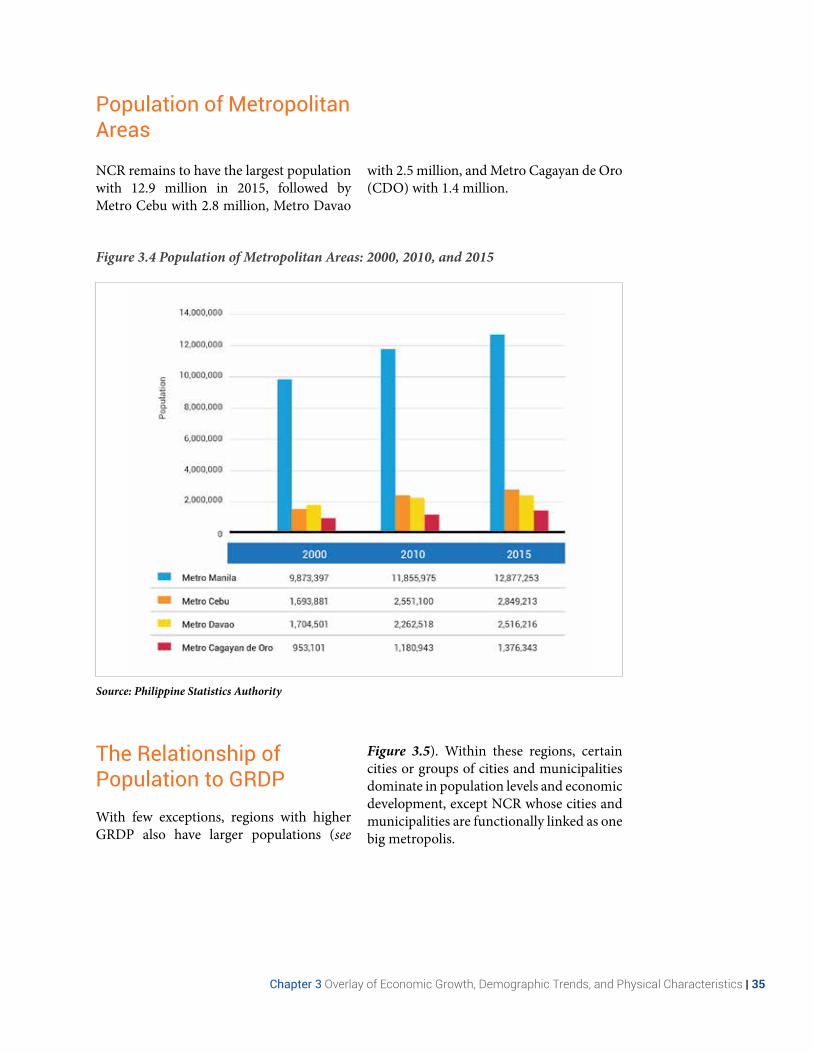
Figure 3.4 Population of Metropolitan Areas: 2000, 2010, and 2015
Source: Philippine Statistics Authority
Population of Metropolitan Areas
NCR remains to have the largest population with 12.9 million in 2015, followed by Metro Cebu with 2.8 million, Metro Davao
with 2.5 million, and Metro Cagayan de Oro (CDO) with 1.4 million.
The Relationship of Population to GRDPWith few exceptions, regions with higher GRDP also have larger populations (see
Figure 3.5). Within these regions, certain cities or groups of cities and municipalities dominate in population levels and economic development, except NCR whose cities and municipalities are functionally linked as one big metropolis.

36 | Philippine Development Plan 2017-2022
Figure 3.5 Population and GRDP, 2015
Source: Philippine Statistics Authority
The Overall Spatial StrategyThe NSS sets the direction of future growth that is consistent with the vision under AmBisyon Natin 2040. It recognizes the role of cities as engines of economic growth and venues of growth and poverty reduction, and infrastructure to provide efficient connective networks of sustainable urban and rural communities.
The NSS aims to decongest NCR and direct growth to key centers throughout the country, where the benefits of agglomeration can have greater potentials of being realized. It recognizes comparative advantages of cities and municipalities and seeks to address spatial and socioeconomic
inequalities by linking lagging regions with leading ones, rather than advocating the uniform dispersal of development, which can create diseconomies and inefficiencies. The NSS thus forms a network of settlements to maximize the benefits of agglomeration.
The NSS consists of the following components: regional agglomeration with growth in key centers, connectivity, and reduction of vulnerability. The spatial strategy provides a basis for identifying more specific projects that can serve the catchment and market or service areas of the various centers. These can be included in the Regional Development Plans.

Chapter 3 Overlay of Economic Growth, Demographic Trends, and Physical Characteristics | 37
Regional Agglomeration The NSS seeks to build on the efficiencies and maximize the benefits of scale and agglomeration economies. The strategy will build on the current trend where NCR growth is slowing down and regional centers, including their peripheral areas, are growing faster and increasing their shares of the country’s population.
The growth of regional centers will be managed so that they function more efficiently. The advantages of their scale and agglomeration economies are to be maximized and spread to outlying areas or regions, as in a hub-and-spokes model, through their relatively large markets, labor force, and innovation opportunities.
Regional development thrust will be supported with suitable physical and human infrastructure (including affordable housing, quality education, and healthcare), other social and economic services, and efficient urban management.
Network of SettlementsBased on population trends, service catchments, and economic activities, the country’s settlements have a three-tiered network: (a) metropolitan centers; (b) regional centers; and (c) sub-regional centers.
a. Metropolitan Centers
These are the economic centers of the country’s three main island groups. They
have distinct functions in innovation and advanced services, culture and tourism, education and research, transportation and trade (e.g., primary international gateway), manufacturing, and technology development.
There are three metropolitan centers in the country: NCR, Metro Cebu, and Metro Davao. NCR is the metropolitan center of Luzon and the Philippines, and is envisioned to remain as the seat of the national government. Metro Cebu is the country’s second largest urban center with extensive domestic and international links. Its central location makes it a natural hub for economic, commercial, and logistics activities in the Visayas. Metro Davao is a major international gateway and Mindanao’s premier commercial hub; center for education, health, and services; and tourist attraction.
By 2025, Metro CDO will become the 4th metropolitan center based on its projected population growth and functional role as a major gateway and trans-shipment hub in Northern Mindanao. It will also remain as a key educational center in Northern Mindanao.
b. Regional Centers
They are regional markets and service centers for several provinces. They have markets that are large enough to support a range of services and investments. Regional centers have the most direct linkages to metropolitan centers. They are regional administrative centers, international gateways, and tourism hubs.

38 | Philippine Development Plan 2017-2022
c. Sub-regional Centers
These large settlements serve as market catchments of regional centers. They also connect to and serve as service centers of smaller provincial and local centers. As they grow, these sub-regional centers tend
to merge with adjacent regional centers to form even larger metropolitan areas as those formed by the NCR, CALABARZON, and Central Luzon.
Table 3.2 Network Settlements
NETWORK REGION/PROVINCE/CITY/MUNICIPALITY
1. Metropolitan Centers
- NCR - Metro Cebu
- Metro Davao - By 2025, Metro CDO (CDO City, Jasaan, Villanueva, Tagoloan, Claveria, Manolo Fortich, Opol, El Salvador, Alubijid, Laguindingan, Gitagum, Libertad, Initao)
2. Regional Centers
- Laoag City - Tuguegarao City - Tabuk City - Santiago City - San Fernando City (La Union) - Baguio City-La Trinidad-Itogon-Sablan-Tuba-Tublay - Cabanatuan City - Tarlac City - Subic-Olongapo City - Balanga City - Angeles City
- Baliuag - Malolos City - Dasmariñas City - Antipolo City - Calamba City - Batangas City - Lucena City - Calapan City - Puerto Princesa City - Legazpi City - Naga City (Camarines Sur) - Iloilo (Iloilo City- Pavia- Oton- Leganes, Santa Barbara- San Miguel)
- Bacolod (Bacolod City-Talisay City-Silay City) - Tagbilaran City - Tacloban City - Ormoc City - Zamboanga City - General Santos City - Butuan City - Cotabato City - Dipolog City - Jolo - Surigao City - Pagadian City - Koronadal City - Tagum City
3. Sub-regional Centers
- Alfonso Lista (Potia) - Banaue - Bangued - Bauko - Besao - Bontoc (Mountain Province) - Danglas - Flora - Kiangan - La Paz (Abra) - Lamut - Langiden - Luna (Apayao) - Peñarrubia - Pidigan - Pudtol - Sadanga - San Isidro (Abra) - Santa Marcela - Tayum - Tubo - Alaminos City - Dagupan City - Cauayan City - Ilagan City - Santa Ana (Cagayan) - Arayat - Capas - Concepcion (Tarlac) - Hagonoy (Bulacan) - Lubao - Mabalacat City - Marilao - Mariveles - Mexico - Meycauayan City - San Fernando City (Pampanga) - San Ildefonso (Bulacan)
- San Jose City - San Jose del Monte City - San Miguel (Bulacan) - Santa Maria (Bulacan) - Bacoor City - Baras (Rizal) - Biñan City - Cabuyao City - Cainta - Gen. Mariano Alvarez - General Trias City - Imus City - Lipa City - Nasugbu - Rodriguez (Montalban) - San Mateo (Rizal) - San Pablo City - San Pedro City - Santa Rosa City - Sariaya - Silang - Tanauan City - Tanza - Taytay (Rizal) - Boac - Romblon (Capital) - San Jose (Occi. Min) - Daet - Iriga City - Ligao City - Masbate City - Matnog - Pili - Sorsogon City - Tabaco City - Virac - Roxas City - Malay - San Carlos City (Negros Occidental)
- Kabankalan City - Estancia - Dumangas - San Jose (Antique) - Miag-ao - Catbalogan City - Calbayog City - Jordan - Kalibo - Dumaguete City - Bogo City - Toledo City - Tubigon - Iligan City - Panabo City - Marawi City - Ozamiz City - Malaybalay City - Valencia City - Digos City - Polomolok - Midsayap - Mati City - Kidapawan City - Gingoog City - Bislig City - Tandag City - Tacurong City - Bongao - Parang (Maguindanao) - San Francisco (Agusan del Sur) - Tubod (Lanao del Norte) - Maramag - Ipil - Glan (Saranggani) - Malita - Laguindingan - Isabela City - Lamitan - Aurora (Zamboanga del Sur)

Chapter 3 Overlay of Economic Growth, Demographic Trends, and Physical Characteristics | 39
Functions of CentersThe metropolitan centers of NCR, Metro Cebu, and Metro Davao provide higher forms of services and facilities that serve domestic and international requirements. Regional and sub-regional centers, on the other hand, have population sizes, services, natural physical features, and strategic locations that enable them to host certain activities or functions.
Regional Centers
• Regional administrative centers: Baguio City, Tuguegarao City, San Fernando City (La Union), Calamba City, Legazpi City, San Fernando City (Pampanga), Calapan City, Tacloban City, Iloilo City, Butuan City, Pagadian City, and Koronadal City
• International gateways examples: Iloilo City, Bacolod City, Angeles City, Zamboanga City, Legazpi City, Laoag City, Puerto Princesa City, and General Santos City
• Tourism hubs: (Examples) Legazpi City, Naga City, Calapan City, Puerto Princesa City, Laoag City, Tagbilaran City, and Surigao City
Sub-regional Centers
• Tourism hub examples: Alaminos City, Matnog, Malay, Kalibo, Jordan, and Tubigon
• Agri-industrial centers examples: Midsayap, Mati, Cauayan City, Polomolok, Kidapawan City, Bislig, Tacurong City, and Calbayog City
• Industrial centers examples: Biñan City, Sta. Rosa City, Lipa City, Tanauan City, San Carlos City, Iligan City, Subic, and Mariveles
• Higher education examples: Marawi City and Dumaguete City
These centers share the same characteristic as some of the existing economic zones identified in the Special Economic Zone Act and tourism circuits identified in tourism plans.
ConnectivityThe strategy of connectivity aims to connect the settlements to form an efficient network. This means improving linkages among settlements and key production areas by connecting rural areas to growth centers or strengthening urban-rural linkages. These linkages will increase people’s access to jobs and services, especially those in smaller settlements. Also, they will direct growth in areas with greatest economic potentials through efficient transport networks.
Connectivity seeks to equalize opportunities across space. This is not only achieved through physical connectivity but also through investments and human development, particularly in areas where economic opportunities are limited. It includes isolated conflict-affected areas where peace and development efforts can be enhanced. Investing in human capital through education, health, and other social services will improve people’s mobility. Moreover, connectivity will provide accessible social services to improve the quality of life in the locality.
The NSS seeks to address socioeconomic inequalities by linking lagging regions with leading ones, rather than forcing uniform dispersal of development, which can create diseconomies and inefficiencies. With a more efficient network of settlements, more opportunities for production and employment are expected to be generated, thus increasing family incomes and savings for investment and growth, and reducing poverty.

40 | Philippine Development Plan 2017-2022
The NSS also recognizes that while cities tend to be engines of growth, they also need appropriate infrastructure, affordable housing, and service systems. These are needed to manage growth and address the challenges of congestion, inadequate social services, and vulnerability to natural disasters.
Connectivity requires strengthening of transportation and telecommunication linkages to provide accessibility and integration of production and settlement areas. It emphasizes the need to connect various centers within a network of settlements through transport infrastructures to improve people’s mobility and accessibility to jobs and services.
Reduction of VulnerabilityThe NSS seeks to make vulnerability reduction an integral part of development. Vulnerability reduction involves instituting prevention and mitigation measures to avoid or reduce the impact of climate change and disasters on the community. These may include redundancy routes to provide access to areas affected by hazards.
The Philippines is prone to both geological and hydrometeorological hazards. The
2 Under the RCP4.5: Stabilization without overshoot pathway to 4.5 W/m² at stabilization after 2100.3 Under the RCP8.5: Rising radiative forcing pathway leading to 8.5 W/m² in 2100.
frequency and severity of these hazards, climate change and its impact are expected to increase. Thus, the Philippines ranks third among the countries with the highest disaster risk in the world, after Vanuatu (1st) and Tonga (2nd), according to the World Risk Report 2016.
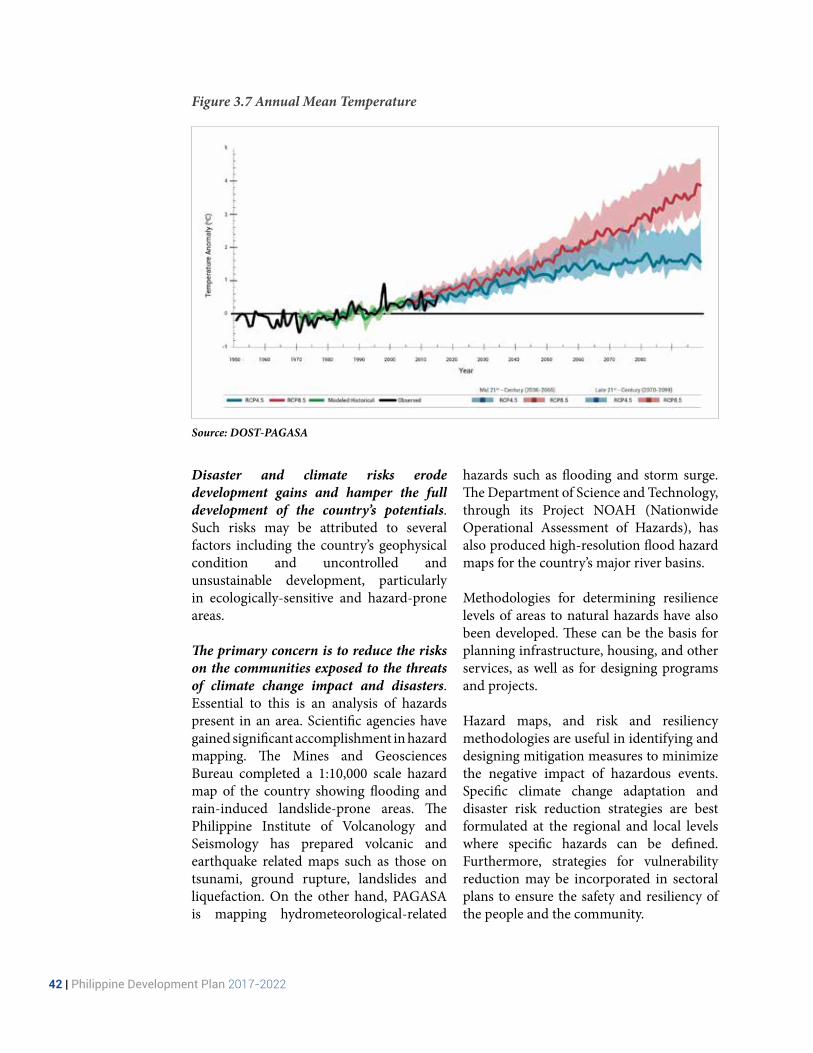
Based on the climate projections in the Fifth Assessment Report of the Intergovernmental Panel on Climate Change, which uses emission scenarios or Representative Concentration Pathways, the Philippine Atmospheric, Geophysical and Astronomical Services Administration (PAGASA) estimates the country’s average temperature to be warmer at 0.9-1.9 °C2 to 1.2-2.3 °C3 by mid-21st century (2036-2065). The projected changes in seasonal rainfall in most parts of the country are expected to be within the range of its natural variability. These changes are strongly influenced by the El Niño Southern Oscillation, except for a highly likely drier future over the central sections of Mindanao. Projections further reveal, although with low confidence, that wetter conditions associated with extreme rainfall events could be experienced over most parts of Luzon and western sections of the Visayas. Sea level rise, faster than the global average, has been observed in some coastal areas in the country, and this condition is projected to continue.

Chapter 3 Overlay of Economic Growth, Demographic Trends, and Physical Characteristics | 41
Figure 3.6 Projected Changes in Seasonal Rainfall in the Mid 21st Century (2036-2065) relative to 1971-2000 under High Emission Scenario (RCP8.5)
Source: DOST-PAGASA
42 | Philippine Development Plan 2017-2022
Figure 3.7 Annual Mean Temperature
Source: DOST-PAGASA
Disaster and climate risks erode development gains and hamper the full development of the country’s potentials. Such risks may be attributed to several factors including the country’s geophysical condition and uncontrolled and unsustainable development, particularly in ecologically-sensitive and hazard-prone areas.
The primary concern is to reduce the risks on the communities exposed to the threats of climate change impact and disasters. Essential to this is an analysis of hazards present in an area. Scientific agencies have gained significant accomplishment in hazard mapping. The Mines and Geosciences Bureau completed a 1:10,000 scale hazard map of the country showing flooding and rain-induced landslide-prone areas. The Philippine Institute of Volcanology and Seismology has prepared volcanic and earthquake related maps such as those on tsunami, ground rupture, landslides and liquefaction. On the other hand, PAGASA is mapping hydrometeorological-related
hazards such as flooding and storm surge. The Department of Science and Technology, through its Project NOAH (Nationwide Operational Assessment of Hazards), has also produced high-resolution flood hazard maps for the country’s major river basins.
Methodologies for determining resilience levels of areas to natural hazards have also been developed. These can be the basis for planning infrastructure, housing, and other services, as well as for designing programs and projects.
Hazard maps, and risk and resiliency methodologies are useful in identifying and designing mitigation measures to minimize the negative impact of hazardous events. Specific climate change adaptation and disaster risk reduction strategies are best formulated at the regional and local levels where specific hazards can be defined. Furthermore, strategies for vulnerability reduction may be incorporated in sectoral plans to ensure the safety and resiliency of the people and the community.