, magnus karlsson , jakob r. winther , pernille rose ... of biology, copenhagen biocenter,...
TRANSCRIPT

Cytosolic [NAD+]/[NADH] tells on metabolic phenotype
1
Non-invasive in-cell determination of free cytosolic [NAD+]/[NADH] ratios using hyperpolarized glucose show large variations in metabolic phenotypes*
Caspar Elo Christensen2,3, Magnus Karlsson1, Jakob R. Winther3, Pernille Rose Jensen1,
and Mathilde H. Lerche1*
1Albeda Research Aps, Gamle Carlsberg Vej 10, 1799 Copenhagen, Denmark. 2Albeda Innovation Aps, Gamle Carlsberg Vej 10, 1799 Copenhagen, Denmark.
3Department of biology, Copenhagen Biocenter, University of Copenhagen, Ole Maaloes Vej 5, DK-2200 Copenhagen N, Denmark.
*Running title: Free cytosolic [NAD+]/[NADH] tells on metabolic phenotype
To whom correspondence should be addressed: Mathilde H. Lerche, Albeda Research Aps, Gamle Carlsberg Vej 10, DK-1799 Copenhagen. Tel.: +45 33275320; Fax: +45 33274708; Email: [email protected] Keywords: Hyperpolarization, 13C6-d7 glucose, [NAD+]/[NADH] ratio, breast and prostate cancer, metabolic phenotype Background: Free cytosolic [NAD+]/[NADH] ratio maintains cellular redox homeostasis and is a cellular metabolic readout. Results: Pyruvate/lactate ratios show distinct metabolic phenotypes and are used to derive free cytosolic [NAD+]/[NADH] ratios. Conclusion: Determination of free cytosolic [NAD+]/[NADH] ratios using hyperpolarized glucose is applicable to a wide selection of cell types. Significance: This metabolic phenotyping may be a crucial tool to understand pathologies, diagnose and measure effects of therapies. Accumulating evidence suggest that the pyridine nucleotide NAD has far wider biological functions than its classical role in energy metabolism. NAD is used by hundreds of enzymes that catalyse substrate oxidation and as such it plays a key role in various biological processes such as aging, cell death and oxidative stress. It has been suggested that changes in the ratio of free cytosolic [NAD+]/[NADH] reflects metabolic alterations leading to, or correlating with, pathological states. We have designed an isotopically labelled metabolic bioprobe of free cytosolic [NAD+]/[NADH] by combining a magnetic enhancement technique (hyperpolarization) with cellular glycolytic activity. The bioprobe reports free cytosolic [NAD+]/[NADH] ratios based on dynamically measured in-cell [pyruvate]/ [lactate]
ratios. We demonstrate its utility in breast and prostate cancer cells. The free cytosolic [NAD+]/[NADH] ratio determined in prostate cancer cells was 4 times higher than in breast cancer cells. This higher ratio reflects a distinct metabolic phenotype of prostate cancer cells consistent with previously reported alterations in the energy metabolism of these cells. As a reporter on free cytosolic [NAD+]/[NADH] ratio, the bioprobe will enable better understanding of the origin of diverse pathological states of the cell as well as monitor cellular consequences of diseases and/or treatments. Dysregulated glycolytic metabolic networks are found in the pathophysiology of diseases such as cancer, inflammation, neurodegenerative diseases, atherosclerosis, obesity, and diabetes (1-3). The fundamental changes in cell energy metabolism offer large potential for intervention and thereby control of entire biochemical networks by identifying and targeting key control points (4). One such control point is nicotinamide adenine dinucleotide (NAD) (5-7), which plays a pivotal role in cellular metabolism, acting as a coenzyme in numerous central housekeeping redox reactions. The concentration ratio between the oxidized and the reduced forms ([NAD+]/[NADH]) is critical to the cell and significant shifts from normal signify profound
http://www.jbc.org/cgi/doi/10.1074/jbc.M113.498626The latest version is at JBC Papers in Press. Published on December 3, 2013 as Manuscript M113.498626
Copyright 2013 by The American Society for Biochemistry and Molecular Biology, Inc.
by guest on May 25, 2018
http://ww
w.jbc.org/
Dow
nloaded from

Cytosolic [NAD+]/[NADH] tells on metabolic phenotype
2
alterations in metabolism that are often linked to pathological states (8).
NAD is either protein bound or free and separate pools are present in the cytosol and in the mitochondria of mammalian cells. Several direct detection methods are commercially available for measurement of the total cellular NAD+ and NADH concentrations. Measurements of whole cell total concentrations of NAD+ and NADH does, however, not distinguish between pools in different compartments or between free and protein bound forms, and so can only provide information about the ratio of the NAD+-NADH couple over all (9). Most NADH present in the mitochondria is protein bound (10) and will not contribute to the cellular redox potential. Whereas the total cellular [NAD+]/[NADH] ratio is typically on the order of 2-4 (11,12) the free cytosolic [NAD+]/[NADH] ratio is usually several orders of magnitude higher (13,14). Thus the importance of the ratio of free cytosolic [NAD+]/[NADH] to the cellular redox potential has lead to a focus on methods capable of estimating this ratio.
To assess the free cytosolic NAD redox potential two main strategies have been reported in the literature. One strategy takes advantage of the proportionality between measured product/substrate ratios of suitable near-equilibrium redox reactions and the concentrations of the involved coenzymes (14). Many studies have successfully estimated the [NAD+]/[NADH] ratio using this indirect metabolic method (15-17), however the use of chemical cellular extraction makes this approach incompatible with dynamic studies in intact cells. Another less invasive strategy directly estimates the [NAD+]/[NADH] ratio with optical imaging (18). In particular, two recent reports use circularly permuted fluorescent protein to create targeted biosensors for binding of NAD+ and NADH (19,20). The biosensor for binding of cytosolic NAD+ and NADH is made as a genetically encoded construct in intact cells, which allow optical estimation of [NAD+]/[NADH] ratios in single intact cells. Inherent to this method, however, it cannot be applied in animal studies.
Ten years ago a technique was reported which dramatically enhances the signal that can be achieved in NMR experiments. This technique allows metabolites that have been hyperpolarized with dynamic nuclear polarisation (DNP) (21), to retain
their hyperpolarization in a short time-window when dissolved (22). This technique opens the way for numerous in vivo and in-cell applications using non-invasive NMR measurements (23). Hyperpolarized 13C-NMR provides detailed chemical information on molecular transformations with sufficient time resolution for the detection of transient metabolic intermediates. The NMR sensitivity enhancement provided by hyperpolarization fades with the spin lattice relaxation rate (1/T1) and the dynamic experiments are best conducted on a time scale of less than 3*T1. Recently, we have developed hyperpolarized markers for visualization of metabolic intermediates in the entire glycolysis (24). Here, we report a further development of hyperpolarized D-Glucose-13C6,1,2,3,4,5,6,6-d7 (fully 13C enriched and deuterated glucose, renamed 13C6-d7) , into a cellular bio-probe for estimation of the free cytosolic ratio of [NAD+]/[NADH], using the dynamic, non-invasive tool, hyperpolarized nuclear magnetic resonance. Hyperpolarized 13C6-d7 glucose is infused to living cancer cells in suspension where it is rapidly metabolized to the glycolytic products pyruvate and lactate. NMR signals from the hyperpolarized 1-13C pyruvate and 1-13C lactate products are followed over 1 minute with a time resolution of 2 s and are used as input data for a kinetic model of the glycolysis. The model applied allows calculation of rate constants and ratios between concentrations of metabolites. It has previously been demonstrated that conversion between pyruvate and lactate according to the reaction Pyruvate + NADH + H+ ↔ Lactate + NAD+ is very fast in vivo and that it is very close to chemical equilibrium (14). Thus, it is in principle possible to use the ratio between pyruvate and lactate, catalysed in vivo by lactate dehydrogenase (LDH), to calculate the free cytosolic [NAD+]/[NADH] ratio (25-28). We find that the [lactate]/[pyruvate] ratio in intact human cells is a robust indicator of free cytosolic [NAD+]/[NADH] ratios. Interestingly, very different free cytosolic [NAD+]/[NADH] ratios were found in intact human prostate and human breast cancer cells. The free cytosolic [NAD+]/[NADH] ratio of the prostate cells was significantly increased relative to that of the breast cancer cells. This observation is likely to be correlated with a preference for fatty acids as cellular energy source as well as an increased de novo fatty acid synthesis of these cells.
by guest on May 25, 2018
http://ww
w.jbc.org/
Dow
nloaded from

Cytosolic [NAD+]/[NADH] tells on metabolic phenotype
3
EXPERIMENTAL PROCEDURES Materials - D-Glucose-13C6,1,2,3,4,5,6,6-d7 was
purchased from Cortecnet; RPMI 1640, FBS, Penicillin/Streptomycin solution, NAD+, L-Lactate Dehydrogenase from bovine heart, hydrazine, 2,4-dinitrophenolhydrazine, Glycine and Trypsin were purchased from Sigma-Aldrich, Germany. 96 well UV transparent microtiter plates from Nunc were purchased from VWR – Bie & Berntsen, Denmark. MCF7 and PC3 cells were obtained from American Tissue Culture Collection (ATCC), Trityl radical Ox063 was obtained from Albeda Research, Gadoteridol was obtained from Bracco Imaging Spa. and Omniscan was obtained from GE healthcare.
Cell culture and harvest - Both cell types were cultured in RPMI 1640, 10% FBS, 100 units/ml Penicillin, 100 µg/ml Streptomycin at 37°C in a 5% CO2 atmosphere. Glucose consumption and lactate formation was measured with standard biochemical methods on both cell types as a function of time in the chosen culture medium. This analysis prevented nutrient depletion under the chosen growth conditions. MCF7 cells were plated in 75 cm2 flasks at 6x10⁶/flask and PC3 cells in 175 cm2 flasks at 5x10⁶/flask and were cultured for 48 h. Cells were harvested by trypsination, resuspended in PBS buffer and assessed for viability by trypan blue exclusion (viability in all experiments >98%). Cells were pelleted and resuspended in an appropriate volume of dissolution buffer (40 mM phosphate buffer pH 7.3) to obtain a cell concentration of 40 mill. cells/ml.
Preparation, polarization and dissolution of Hyperpolarized 13C-NMR - 13C6-d7 glucose (22.8 mg, 0.118 mmol) was dissolved in polarization medium (25.0 mg) prepared from Ox063 radical (19.1 mg, 13.3 µmol) and Gadoteridol (40 mg of 50 µmol / g solution in water) in water (465 mg). The concentration of radical and gadolinium complex in the preparation was 17 mM and 2 mM respectively. A sample of the preparation containing 20 µmol 13C6-d7 glucose was hyperpolarized to equilibrium at 3.3T and approx. 1.2 K with a build-up time constant of 1300 s. in a prototype polarizer (22). The sample was dissolved in 5 ml 40 mM phosphate buffer, pH 7.3. 20 million MCF7 or PC3 cells suspended in 500 µl 40 mM phosphate buffer pH 7.3 was placed in a flat bottom 10 mm NMR tube adjusted in the NMR spinner to cover the active volume (1.5 ml). The NMR tube, with a connected inlet tubing, was placed in a
14.1 T magnet at 310 K. 1 ml of the dissolved hyperpolarized 13C6-d7 glucose was infused to the cells via the tubing resulting in a glucose concentration of 2 mM in the cell suspension. A series of 20 degree pulses every 2 s (30 scans in total) was acquired. The acquisition was started simultaneously with injection of the hyperpolarized 13C6-d7 glucose. Generally, liquid state 13C spin polarizations of 19 ± 2 % were obtained for an average of the 13C labelled positions at the time of substrate infusion. The liquid state T1 at approx. 37 °C and 14.1 T was 14 ± 1 s. for all of the signals originating from the uniformly isotope labelled glucose molecule. The relatively short T1 of 13C6-d7-glucose caused variations in the polarization level of the samples at the time of the experiment due to variations in time from dissolution to injection of the sample. To compensate for this variation the signals in the different experiments were normalized to initial glucose signal.
Determination of Lactate and pyruvate concentrations using conventional NMR methods – Cells were grown, harvested and resuspended following the procedure described for the hyperpolarized experiments. The conditions of a hyperpolarized experiment were mimicked in the bench-top NMR experiments: 167 µl of a 40 million/ml cell suspension (either PC3 cells of MCF7 cells) was placed shaking at 37 °C to which 333 µl of a 2 mM 13C6-d7 glucose solution was added. The cells were incubated with glucose for 70 s after which perchloric acid extractions were made of the entire samples. In short: 200 µl of a 2.2 M perchloric acid was added to the glucose incubated cells on ice. The samples were neutralized with approx. 50 µl 10 M KOH as verified by a pH indicator. To 500 µl extraction 100 µl D2O was added, 10 µl of a 34 mM 13C-urea solution and 15 µl of a 0.5 M omniscan solution. 13C-urea was added as a standard for quantification and omniscan was added to reduce the T1 for faster acquisition. Direct 13C NMR acquisition was acquired for 48 hours per experiment in order to obtain high enough signal on the pyruvate resonances for quantification.
Measurement of lactate and pyruvate using biochemical methods - Lactate export was measured via an NADH coupled lactate dehydrogenase spectrophotometric assay. Briefly, supernatant samples were mixed 1:20 with 16 U/mL L-Lactate
by guest on May 25, 2018
http://ww
w.jbc.org/
Dow
nloaded from
Cytosolic [NAD+]/[NADH] tells on metabolic phenotype
4
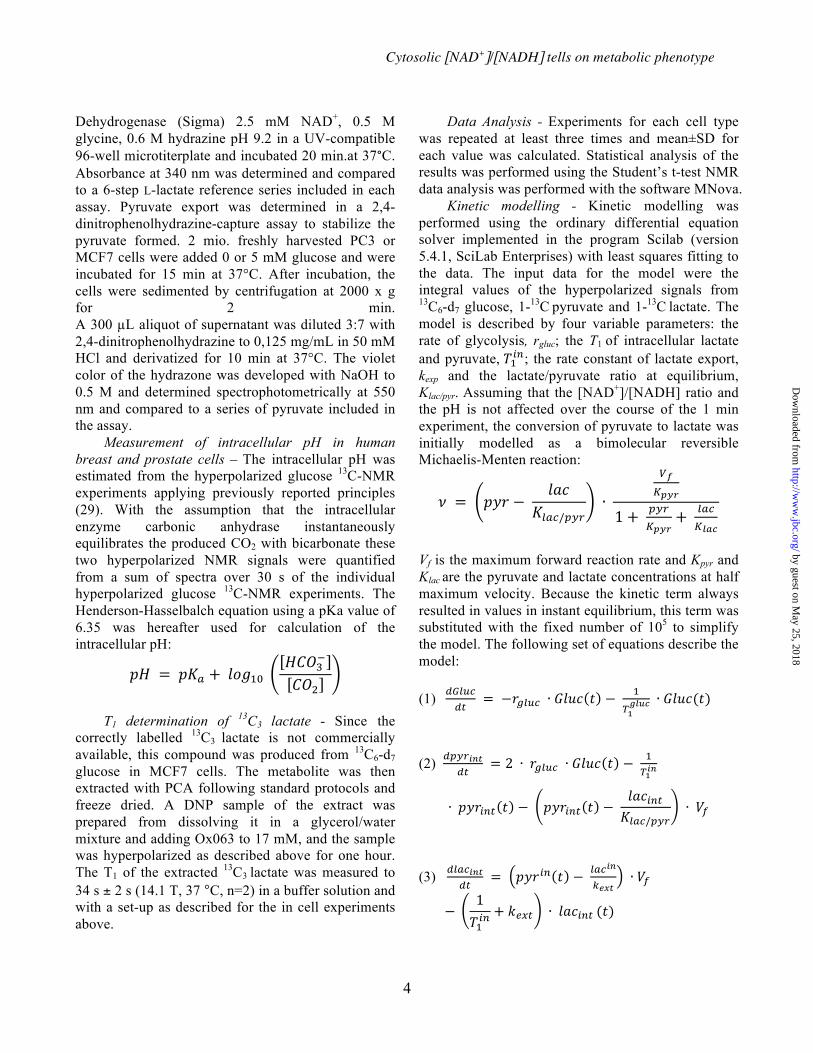
Dehydrogenase (Sigma) 2.5 mM NAD+, 0.5 M glycine, 0.6 M hydrazine pH 9.2 in a UV-compatible 96-well microtiterplate and incubated 20 min.at 37°C. Absorbance at 340 nm was determined and compared to a 6-step L-lactate reference series included in each assay. Pyruvate export was determined in a 2,4-dinitrophenolhydrazine-capture assay to stabilize the pyruvate formed. 2 mio. freshly harvested PC3 or MCF7 cells were added 0 or 5 mM glucose and were incubated for 15 min at 37°C. After incubation, the cells were sedimented by centrifugation at 2000 x g for 2 min. A 300 µL aliquot of supernatant was diluted 3:7 with 2,4-dinitrophenolhydrazine to 0,125 mg/mL in 50 mM HCl and derivatized for 10 min at 37°C. The violet color of the hydrazone was developed with NaOH to 0.5 M and determined spectrophotometrically at 550 nm and compared to a series of pyruvate included in the assay.
Measurement of intracellular pH in human breast and prostate cells – The intracellular pH was estimated from the hyperpolarized glucose 13C-NMR experiments applying previously reported principles (29). With the assumption that the intracellular enzyme carbonic anhydrase instantaneously equilibrates the produced CO2 with bicarbonate these two hyperpolarized NMR signals were quantified from a sum of spectra over 30 s of the individual hyperpolarized glucose 13C-NMR experiments. The Henderson-Hasselbalch equation using a pKa value of 6.35 was hereafter used for calculation of the intracellular pH:
!" = !"! + !"#!" !"#!!
!"!
T1 determination of 13C3 lactate - Since the
correctly labelled 13C3 lactate is not commercially available, this compound was produced from 13C6-d7 glucose in MCF7 cells. The metabolite was then extracted with PCA following standard protocols and freeze dried. A DNP sample of the extract was prepared from dissolving it in a glycerol/water mixture and adding Ox063 to 17 mM, and the sample was hyperpolarized as described above for one hour. The T1 of the extracted 13C3 lactate was measured to 34 s ± 2 s (14.1 T, 37 °C, n=2) in a buffer solution and with a set-up as described for the in cell experiments above.
Data Analysis - Experiments for each cell type was repeated at least three times and mean±SD for each value was calculated. Statistical analysis of the results was performed using the Student’s t-test NMR data analysis was performed with the software MNova.
Kinetic modelling - Kinetic modelling was performed using the ordinary differential equation solver implemented in the program Scilab (version 5.4.1, SciLab Enterprises) with least squares fitting to the data. The input data for the model were the integral values of the hyperpolarized signals from 13C6-d7 glucose, 1-13C pyruvate and 1-13C lactate. The model is described by four variable parameters: the rate of glycolysis, rgluc; the T1 of intracellular lactate and pyruvate, !!!"; the rate constant of lactate export, kexp and the lactate/pyruvate ratio at equilibrium, Klac/pyr. Assuming that the [NAD+]/[NADH] ratio and the pH is not affected over the course of the 1 min experiment, the conversion of pyruvate to lactate was initially modelled as a bimolecular reversible Michaelis-Menten reaction:
! = !"# − !"#
!!"#/!"# ∙
!!!!"#
1+ !"#!!!"
+ !"#!!"#
Vf is the maximum forward reaction rate and Kpyr and Klac are the pyruvate and lactate concentrations at half maximum velocity. Because the kinetic term always resulted in values in instant equilibrium, this term was substituted with the fixed number of 105 to simplify the model. The following set of equations describe the model: (1) !"#$%
!" = −!!"#$ ∙ !"#$ ! − !
!!!"#$ ∙ !"#$(!)
(2) !"#$!"#
!" = 2 ∙ !!"#$ ∙ !"#! ! − !
!!!"
∙ !"#!"# ! − !"#!"# ! − !"#!"#!!"#/!"#
∙ !!
(3) !"#$!"#!"
= !"#!" ! − !"#!"
!!"# ∙ !!
− 1!!!"
+ !!"# ∙ !!"!"# (!)
by guest on May 25, 2018
http://ww
w.jbc.org/
Dow
nloaded from

Cytosolic [NAD+]/[NADH] tells on metabolic phenotype
5
(4) !"#$!"#!"
= !!"# ∙ !"#!"# ! − !!!!"
∙ !"#!"#(!)
Where Gluc = [glucose], here hyperpolarized signal from glucose pyrint = intracellular hyperpolarized pyruvate lacint = intracellular hyperpolarized lactate lacext = extracellular hyperpolarized lactate !!!"#$ = T1 of glucose
!!!"= T1 of intracellular pyruvate and lactate !!!"= T1 of extracellular lactate rgluc = rate constant for glucose to pyruvate Klac/pyr = ratio between lactate and pyruvate at equilibrium with [NAD+]/[NADH] and [H+]. kext = rate constant for lactate export. Prior to fitting, the data was corrected for pulsing with the RF pulse of 20 degrees used to collect the data. The points in the data set were divided with cos(20)(n) = cos(20)(t/TR) where TR is the repetition time of the pulse in the experiment. Due to a fast equilibrium between pyruvate and lactate metabolite pools the intracellular T1 of 1-13C lactate and 1-13C pyruvate are expected to be a mean of the two individual T1’s weighted by the concentrations of the two pools. Therefore these parameters were fitted as one parameter, !!!" . In the experiments with PC3 cells, poor initial mixing rendered the initial data points invalid. In order not to compromise the fit of the rest of the data from the PC3 cell experiments the data points for the first 2 seconds were left out from the fit. The following experimental parameters were either measured in different assays or determined from the in-cell hyperpolarized experiments: Gluc (approx. 75000) = Glucose concentration expressed as the hyperpolarized signal in the first spectrum of the time series. This value was obtained by dividing integrals originating from glucose with 6 to get a signal / mol value. !!
!"#$ (14 s) = T1 of glucose. Less than 10% of the hyperpolarized glucose takes part in the glycolysis (the remaining stays extracellular). !!!" (34 s) = T1 of extracellular lactate is measured in a separate experiment, see above. The model was tested for robustness and overfitting. The robustness of the model was addressed by selecting starting parameters
obtained from fits to datasets from the other cell line. The model resulted in consistent and robust results for datasets from each cell line independent of the starting values. It was assured that overfitting was not being done by fixing parameters at values obtained from the other cell line while allowing all other parameters to float and compensate for the fixed parameter. All cases showed that it was impossible to produce a good fit to the data with any parameter fixed to a value obtained from the other cell line. RESULTS
Hyperpolarized 13C6-d7 glucose as substrate for human breast and prostate cancer cells - We have translated the method previously developed for visualization of glucose metabolism in yeast (24) into a tool to study dynamic glucose metabolism in human cells with the aim to be able to identify and quantify biologically relevant control points for changes in human glucose utilization. To this end hyperpolarized 13C6-d7 glucose was infused to human breast cancer cells (MCF7) or human prostate cancer cells (PC3) in concentrations where glucose uptake was saturated. The choice of a fully 13C labelled and deuterated substrate allowed detection of product signals originating from different carbon positions in the glucose molecule over a total experimental time window of 1 minute. Within this experimental time frame the in-cell conversion of hyperpolarized glucose could be followed through 10 enzyme-catalysed transformations ending in the products pyruvate and lactate, Figure 1. The main glycolytic metabolites observed are dihydroxyacetone phosphate (C2-DHAP, 212.6 ppm), pyruvate (C2, 206.4 ppm, C1, 171.6 ppm), and lactate (C1, 183.5 ppm). In the pentose phosphate pathway 6-phophogluconate (C1-6PG, 179.8 ppm) and 6-phosphogluconolactone (C1-6PGL, 177.0 ppm) can be detected. The singlet at 161.4 ppm is assigned to bicarbonate, which arises from carbonic anhydrase assisted equilibrium with CO2. The CO2 originates either from decarboxylation of pyruvate or of 6-phosphogluconate. The generally higher signals from metabolites in MCF7 cells compared to PC3 cells indicate a higher rate of glucose metabolism per cell in the former. MCF7 cells are smaller than PC3 cells and contain less soluble protein (approx. 25% less) suggesting that MCF7 cells are more glycolytic than PC3 cells also per soluble protein.
by guest on May 25, 2018
http://ww
w.jbc.org/
Dow
nloaded from

Cytosolic [NAD+]/[NADH] tells on metabolic phenotype
6
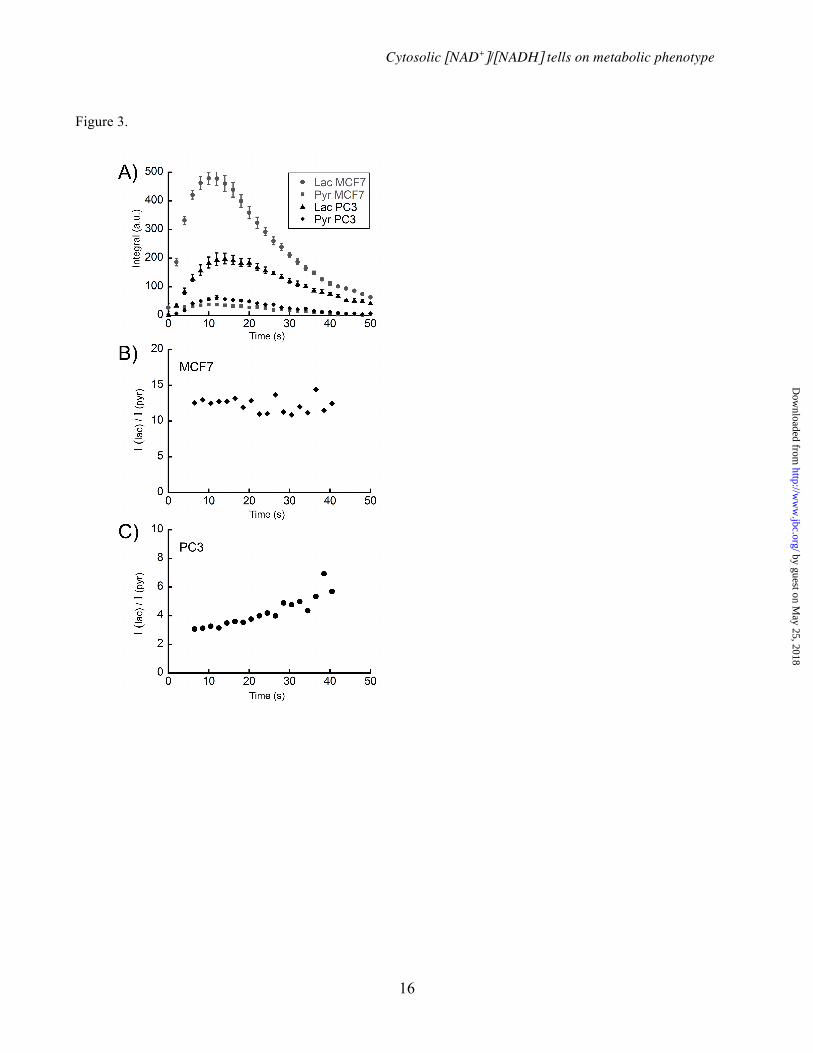
Dynamics of the hyperpolarized glycolytic products, 1-13C pyruvate and 1-13C lactate, in human cancer cells - DNP enhancement of NMR signals permits measurement of in-cell dynamic data. Hyperpolarized glycolytic intermediates and end products were followed with a temporal resolution of 2 s for one minute in MCF7 and PC3 cells, Figure 2A and 2B. A close inspection of the dynamics, Figure 2C, shows the order in which metabolites appear as a function of their transformation in the glycolysis or in the pentose phosphate pathway. During the first seconds signals from metabolites in the pentose phosphate pathway are formed faster than pyruvate and lactate. However, lactate and pyruvate eventually dominate. DHAP upstream in the glycolysis also clearly appears before pyruvate and lactate. In Figure 3A the signal development in the two cell types is shown for hyperpolarized pyruvate and lactate. Maximum signal of hyperpolarized 1-13C lactate and 1-13C pyruvate is obtained approximately 11 s into the experiment. The ratio between hyperpolarized signals from lactate and pyruvate is significantly different (p < 0.0001) between the two cell types with an average ratio of ~ 3.2 for PC3 and of ~ 12.5 for MCF7 cells. This ratio was approximately constant in MCF7 cells over the full time course of the experiment while in the PC3 cells the ratio increased presumably due to a more extensive export of lactate to the extra-cellular media, Figure 3B and 3C.
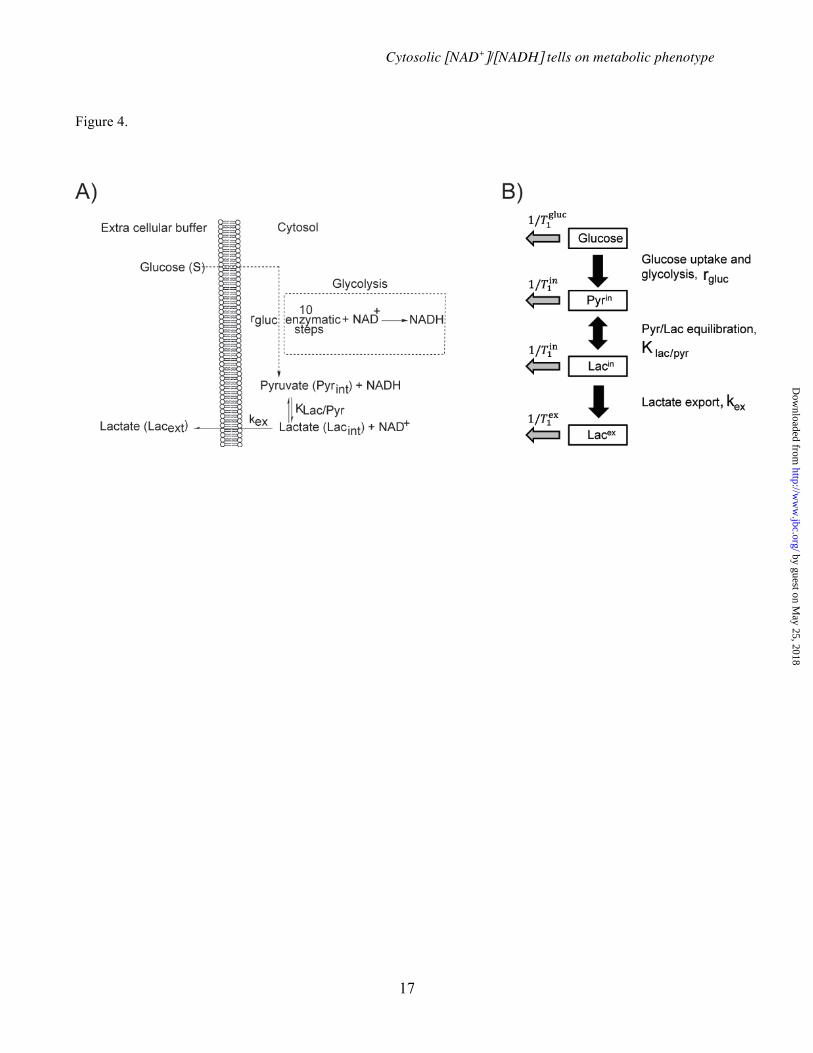
Kinetic model for production of hyperpolarized 1-13C pyruvate and 1-13C lactate from hyperpolarized 13C6-d7 glucose - To be able to quantify the conversion of hyperpolarized glucose and calculate the respective intracellular 13C-labelled proportions of glucose ending up in lactate and pyruvate, a kinetic model was established. Given the available data and the known pathways the simplest kinetic model that describes the biochemical system is shown in Figure 4. The rate and thermodynamic equilibrium ratio of the reversible conversion of pyruvate to lactate depends on the pH and of the NAD+, NADH, pyruvate and lactate concentrations. In the model, it is assumed that the [NAD+]/[NADH] ratio and pH is unchanged over the course of the experiment, leaving the thermodynamic ratio at equilibrium between lactate and pyruvate, Klac/pyr, constant. In a hyperpolarized NMR experiment the parameters intrinsic to the method (longitudinal relaxation time (T1) and radio frequency (RF) pulsing) lead to signal decays that are independent of
metabolic action. Thus, these parameters must be included in the kinetic modelling of metabolite signals (see methods). Applying the kinetic model to the hyperpolarized data obtained for MCF7 and PC3 cells, led to the fits of hyperpolarized 1-13C lactate and 1-13C pyruvate shown in Figure 5. The data fit the kinetic model with high accuracy; R2 values of 0.89 and 0.99 for pyruvate and lactate signals, respectively in MCF7 and R2 values of 0.94 and 0.99 for pyruvate and lactate signals, respectively in PC3. The lower intensity of the pyruvate signal results in a lower R2 for the fit to the signal from pyruvate. The lactate export in PC3 cells is significant already 20 s into the experiment where approximately 40% of the lactate is exported, top panel, Figure 5B. This supports the interpretation that lactate export is the reason for the increasing ratio between lactate and pyruvate noted in the raw data collected in PC3 cells, Figure 3C. MCF7 cells are clearly more glycolytic than PC3 cells. The calculated rate of glycolysis in MCF7 cells is a factor of two higher than in PC3, Table 1. The resulting lactate concentration is more than double as high in MCF7 cells compared to PC3 cells whereas the pyruvate concentration is similar in the two cell types. The export rate of lactate is approx. 4 times higher in PC3 than in MCF7 cells. The fitted !!!" of lactate and pyruvate was approximately half of the measured extracellular T1 of lactate in both cell types. The ratio between lactate and pyruvate differs significantly between the two cell types. It is approximately 4 times higher in the MCF7 cells, suggesting that the free cytosolic [NAD+]/[NADH] redox conditions differ in the two cell lines. The ratios are well defined in the model with standard deviations around 5% of the values.
Calculation of the cytosolic free ratio of [NAD+]/[NADH] in human breast and prostate cancer cells - Based on the ratio between hyperpolarized 1-13C lactate and 1-13C pyruvate extracted from the kinetic model the cytosolic redox status can be calculated. To this end the fitted ratio between 1-13C lactate and 1-13C pyruvate was used as input in the LDH equilibrium equation, where pH is experimentally estimated and KEq = 1.11*10-11 M (14):
[NAD+][NADH]
=[pyr][lac]
∙10!!"
KEq
by guest on May 25, 2018
http://ww
w.jbc.org/
Dow
nloaded from

Cytosolic [NAD+]/[NADH] tells on metabolic phenotype
7
pH was measured from the ratio of quantified hyperpolarized CO2 and hyperpolarized bicarbonate. The pH differed only slightly in the two cell types and was approximately 7.0 ± 0.05 in MCF7 cells and 7.1 ± 0.05 in PC3 cells. The resulting calculated free cytosolic [NAD+]/[NADH] ratios are shown in Figure 6. The calculated ratio concentration of [NAD+]/[NADH] is 2.55*103 ± 346 in PC3 cells and 7.38*102 ± 92 in MCF7 cells.
The obtained glycolytic rates and the measured signal of lactate were evaluated using conventional NMR techniques. The 13C-NMR data on perchloric acid extractions of PC3 and MCF7 cells incubated with 13C6-d7 glucose showed a glycolytic rate of 0.16 ± 0.014 fmoles/s/cell for MCF7 cells and 0.08 ± 0.007 fmoles/s/cell for PC3 cells, showing the glycolytic rate of MCF7 cells to be twice as high as that of PC3 cells. DISCUSSION
As still more studies relate the pathologically perturbed homeostasis of the cell to changes in the free cytosolic [NAD+]/[NADH] ratio (6,13,30), methods that can determine this ratio become increasingly important. Classically, the cytosolic [NAD+]/[NADH] ratio has been determined indirectly based on steady-state metabolite concentrations measured following cell disruption (31). Pool sizes at steady-state conditions are extremely labile and during extraction mixing of compartments and transient shifts in pools are likely to occur. Thus, this method is highly dependent on efficient quenching and effective extraction. To circumvent these challenges genetically encoded sensors, based on Green Fluorescent Protein have been developed that allow determination of [NAD+]/[NADH] ratios directly in living cells. While this technology is exceedingly elegant it does require cells to be genetically transformed and will only be applicable to cells in culture.
In the present study, we describe a very different approach based on glucose, which is magnetically hyperpolarized on 13C nuclei. The hyperpolarized substance, which is chemically indistinguishable from natural glucose, was perifused into living cells and glycolytic metabolite formation was measured directly inside cells. This non-invasive method allowed determination of pyruvate-lactate dynamics and their
ratios. As no genetic modification is needed this tool is potentially also applicable to ex vivo studies in tissue and in vivo animal studies.
To calculate the cytosolic [lactate]/[pyruvate] ratio and subsequently the free [NAD+]/[NADH] ratio we kinetically modelled the data. Obviously, a change in the [NAD+]/[NADH] ratio, or in pH, over the extent of the experiment would be expected to alter the equilibrium ratio between pyruvate and lactate. However, non-steady-state models did not describe the data better than an instant and fixed equilibrium model. Hence, in the model it is assumed that the [NAD+]/[NADH] ratio is not affected over the short duration of the experiment (1 minute) at the given substrate concentrations (a few mM). In summary, the model supports the notion that the LDH-catalyzed reaction is faster than the glycolytic steps leading up to it. This is in accordance with literature, where e.g. in neoplastic cells, the potential LDH activity is 20-200 times higher than hexokinase, phosphofructokinase and transport into mitochondria (32). Thus, it is likely that lactate and pyruvate will also be in equilibrium with the free cytosolic [NAD+]/[NADH] pool in non-cancerous cells with an active TCA cycle allowing the model to be employed in these systems as well. The low NMR signals from metabolites in the pentose phosphate pathway, 6-phophogluconolactone, 6-phophogluconate and bicarbonate (Figure 1) confirm that the flux of glucose through the pentose phosphate pathway is low compared to the flux through glycolysis. The kinetic model assumes the glycolysis within a specific cell type to take place at the same rate during the entire experiment. This assumption was supported by the observation that the rate of lactate generation was constant over more than 10 min after exposure of cells to the external glucose bolus, as measured with standard biochemical techniques. Similarly, standard biochemistry was performed to assure that extracellular pyruvate concentrations were very minor. No pyruvate could be detected within the limit of detection of the applied assay. On this basis pyruvate export was excluded in the kinetic model. On the contrary the export of lactate was significant in both cell types. With extracellular concentrations of 550 and 600 µM after 15 minutes incubation with glucose underlining the importance of including lactate export in the model.
by guest on May 25, 2018
http://ww
w.jbc.org/
Dow
nloaded from
Cytosolic [NAD+]/[NADH] tells on metabolic phenotype
8
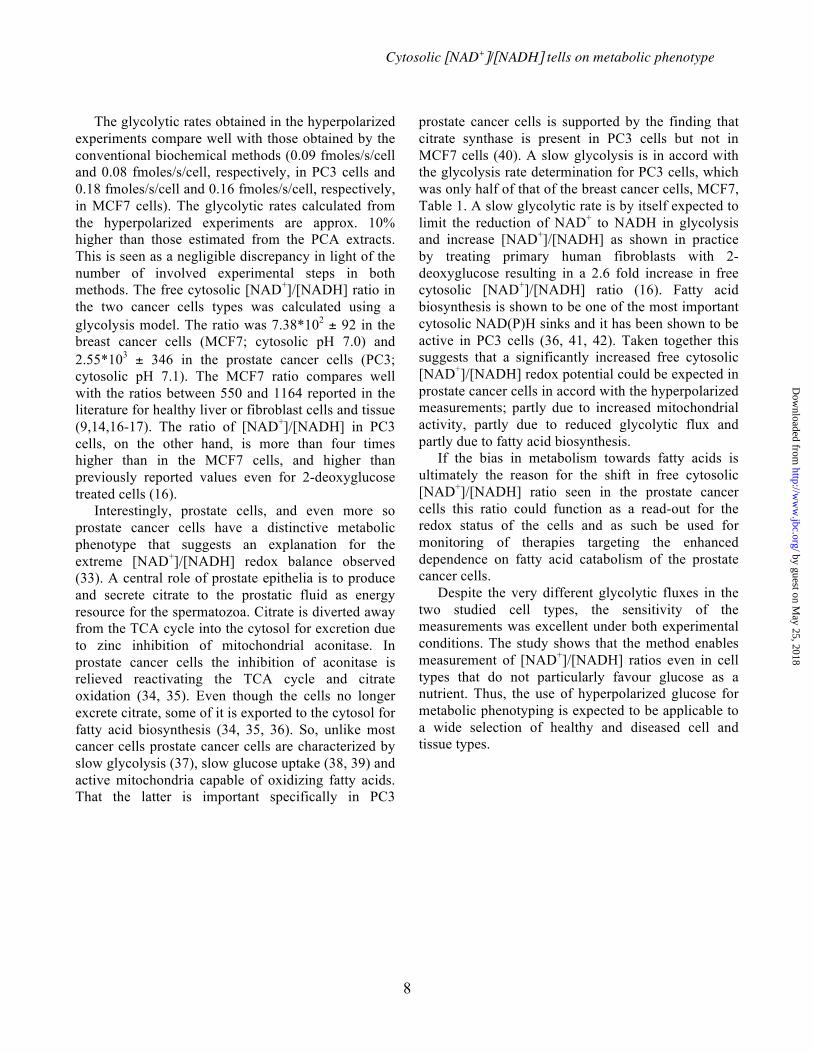
The glycolytic rates obtained in the hyperpolarized experiments compare well with those obtained by the conventional biochemical methods (0.09 fmoles/s/cell and 0.08 fmoles/s/cell, respectively, in PC3 cells and 0.18 fmoles/s/cell and 0.16 fmoles/s/cell, respectively, in MCF7 cells). The glycolytic rates calculated from the hyperpolarized experiments are approx. 10% higher than those estimated from the PCA extracts. This is seen as a negligible discrepancy in light of the number of involved experimental steps in both methods. The free cytosolic [NAD+]/[NADH] ratio in the two cancer cells types was calculated using a glycolysis model. The ratio was 7.38*102 ± 92 in the breast cancer cells (MCF7; cytosolic pH 7.0) and 2.55*103 ± 346 in the prostate cancer cells (PC3; cytosolic pH 7.1). The MCF7 ratio compares well with the ratios between 550 and 1164 reported in the literature for healthy liver or fibroblast cells and tissue (9,14,16-17). The ratio of [NAD+]/[NADH] in PC3 cells, on the other hand, is more than four times higher than in the MCF7 cells, and higher than previously reported values even for 2-deoxyglucose treated cells (16).
Interestingly, prostate cells, and even more so prostate cancer cells have a distinctive metabolic phenotype that suggests an explanation for the extreme [NAD+]/[NADH] redox balance observed (33). A central role of prostate epithelia is to produce and secrete citrate to the prostatic fluid as energy resource for the spermatozoa. Citrate is diverted away from the TCA cycle into the cytosol for excretion due to zinc inhibition of mitochondrial aconitase. In prostate cancer cells the inhibition of aconitase is relieved reactivating the TCA cycle and citrate oxidation (34, 35). Even though the cells no longer excrete citrate, some of it is exported to the cytosol for fatty acid biosynthesis (34, 35, 36). So, unlike most cancer cells prostate cancer cells are characterized by slow glycolysis (37), slow glucose uptake (38, 39) and active mitochondria capable of oxidizing fatty acids. That the latter is important specifically in PC3
prostate cancer cells is supported by the finding that citrate synthase is present in PC3 cells but not in MCF7 cells (40). A slow glycolysis is in accord with the glycolysis rate determination for PC3 cells, which was only half of that of the breast cancer cells, MCF7, Table 1. A slow glycolytic rate is by itself expected to limit the reduction of NAD+ to NADH in glycolysis and increase [NAD+]/[NADH] as shown in practice by treating primary human fibroblasts with 2-deoxyglucose resulting in a 2.6 fold increase in free cytosolic [NAD+]/[NADH] ratio (16). Fatty acid biosynthesis is shown to be one of the most important cytosolic NAD(P)H sinks and it has been shown to be active in PC3 cells (36, 41, 42). Taken together this suggests that a significantly increased free cytosolic [NAD+]/[NADH] redox potential could be expected in prostate cancer cells in accord with the hyperpolarized measurements; partly due to increased mitochondrial activity, partly due to reduced glycolytic flux and partly due to fatty acid biosynthesis.
If the bias in metabolism towards fatty acids is ultimately the reason for the shift in free cytosolic [NAD+]/[NADH] ratio seen in the prostate cancer cells this ratio could function as a read-out for the redox status of the cells and as such be used for monitoring of therapies targeting the enhanced dependence on fatty acid catabolism of the prostate cancer cells.
Despite the very different glycolytic fluxes in the two studied cell types, the sensitivity of the measurements was excellent under both experimental conditions. The study shows that the method enables measurement of [NAD+]/[NADH] ratios even in cell types that do not particularly favour glucose as a nutrient. Thus, the use of hyperpolarized glucose for metabolic phenotyping is expected to be applicable to a wide selection of healthy and diseased cell and tissue types.
by guest on May 25, 2018
http://ww
w.jbc.org/
Dow
nloaded from
Cytosolic [NAD+]/[NADH] tells on metabolic phenotype
9
REFERENCES 1. Zhao, Y., Butler, E. B., and Tan, M. (2013) Targeting cellular metabolism to improve cancer
therapeutics. Cell Death Dis. 4 (e532), 1-10. 2. Cai, H., Cong, W.N., Ji, S., Rothman, S., Maudsley, S., and Martin, B. (2012) Metabolic dysfunction in
Alzheimer's disease and related neurodegenerative disorders. Curr Alzheimer Res. 9(1), 5-17. 3. Bouche, C., Serdy, S., Kahn, C.R., and Goldfine, A.B. (2004) The Cellular Fate of Glucose and Its
Relevance in Type 2 Diabetes. Endocr Rev. 25(5), 807– 830. 4. Medina-Cleghorn, D., and Nomura, D. K. (2013) Chemical approaches to study metabolic networks.
Pflugers Arch. 465(3), 427-40. 5. Ma, Y., Chen, H., He, A., Nie, H., Hong, Y., Sheng, C., Wang, Q., Xia, W., and Ying, W. (2012) NAD+
metabolism and NAD(+)-dependent enzymes: promising therapeutic targets for neurological diseases. Curr Drug Targets 13(2), 222-9.
6. Belenky, P., Bogan, K.L., and Brenner, C. (2007) NAD+ metabolism in health and disease. Trends Biochem Sci. 32(1), 12-19.
7. Bonda, D., Lee, H., Camins, A., Pallàs, M., Casadesus, G., Smith, M., and Zhu, X. (2011) The Critical Role of the Sirtuin Pathway in Aging and Alzheimer Disease: Mechanistic and Therapeutic Considerations. Lancet Neurol. 10(3), 275–279.
8. Teodoro, J. S., Rolo, A. P., and Palmeira, C. M. (2013) The NAD ratio redox paradox: why does too much reductive power cause oxidative stress? Toxicol Mech Methods. 23(5), 297-302.
9. Ying, W. (2008). NAD_/NADH and NADP_/NADPH in Cellular Functions and Cell Death: Regulation and Biological Consequences. Antioxid Redox signal. vol. 10(2), 179-206.
10. Blinova, K., Carroll, S., Bose, S., Smirnov, A.V., Harvey, J.J., Knutson, J.R., and Balaban, R.S. (2005) Distribution of mitochondrial NADH flyorescence lifetimes: steady-state kinetics of matrix NADH interactions. Biochemistry 44(7), 2585-94.
11. Gaikwad, A., Long D.J., Stringer, J.L., and Jaiswal, A.K. (2001) In vivo role of NAD(P)H: quinone oxidoreductase 1 (NQO1) in the regulation of intracellular redox state and accumulation of absominal adipose tissue. J. Biol. Chem. 276(25), 22559-64.
12. Sanni, L.A., Rae, C., Maitland, A., Stocker, R., and Hunt, N.H. (2001) Is Ischemia involved in the pathogenesis of murine cerebral malaria? American J. Pathology 159(3), 1105-12.
13. Ying, W. (2006) NAD+ and NADH in cellular functions and cell death. Front Biosci. 11, 3129–3148. 14. Williamson, D. H., Lund, P., and Krebs, H. A. (1967) The Redox State of Free Nicotinamide-Adenine
Dinucleotide in the Cytoplasm and Mitochondria of Rat Liver. Biochem. J. 103, 514-526. 15. Zhang, Q., Wang, S. Y., Nottke, A. C., Rocheleau, J. V., Piston, D. W., and Goodman, R. H. (2006) Redox
sensor CtBP mediates hypoxia-induced tumor cell migration. Proc Natl Acad Sci. 103(24): 9029-9033. 16. Zhang, Q., Wang, S.Y., Fleuriel, C., Leprince, D., Rocheleau, J.V., Piston, D.W., and Goodman. R.H.
(2007) Metabolic regulation of SIRT transcription via a HIC1: CtBP corepressor complex. Proc Natl Acad Sci. 104(3), 829-833.
17. Burgess, S. C., Lizuka, K., Jeoung, N. H., Harris, R. A., Kashiwaya, Y., Veech, R.L., Kitazume, T., and Uyeda, K. (2008) Carbohydrate-response element-binding protein deletion alters substrate utilization producing energy-deficient liver. J. Biol. Chem. 283(3), 1670-1678.
18. Chance, B., Cohen, P., Jobsis, F., and Schoener, B. (1962) Intracellular oxidation-reduction states in vivo. Science 137(3529), 499-508.
19. Hung, Y. P., Albeck, J. G., Tantama, M., and Yellen, G. (2011) Imaging Cytosolic NADH-NAD+ redox state with a genetically encoded fluorescent biosensor. Cell Metab. 14(4), 545-554.
20. Zhao, Y., Jin, J., Hu, Q., Zhou, H. M., Yi, J., Yu, Z., Xu, L., Wang, X., Yang, Y., and Loscalzo, J. (2011) Genetically encoded fluorescent sensors for intracellular NADH detection. Cell Metab. 14(4), 555-566.
21. Abragam, A., Goldman, M. (1978) Principles of dynamic nuclear polarization. Rep Progr Phys. 41, 395-467.
by guest on May 25, 2018
http://ww
w.jbc.org/
Dow
nloaded from
Cytosolic [NAD+]/[NADH] tells on metabolic phenotype
10
22. Ardenkjær-Larsen, J. H., Fridlund, B., Gram, A., Hansson, G., Hansson, L., Lerche, M. H., Servin, R., Thaning, M., and Golman, K. (2003) Increase in signal-to-noise ratio of >10,000 times in liquid-state NMR. Proc Natl Acad Sci. 100(18), 10158-10163.
23. Kurhanewicz, J., Vigneron, D.B., Brindle, K., Chekmenev, E.Y., Comment, A., Cunningham, C. H., DeBerardinis, R. J., Green, G. G., Leach, M. O., Rajan, S. S., Rizi, R. R., Ross, B. D., Warren, W. S., and Malloy, C. R. (2011) Analysis of cancer metabolism by imaging hyperpolarized nuclei: prospects for translation to clinical research. Neoplasia 13(2), 81-97.
24. Meier, S., Karlsson, M., Jensen, P. R., Lerche, M. H., and Duus, J. Ø. (2011) Metabolic pathway visualization in living yeast by DNP-NMR. Mol. BioSyst. 7, 2834-2836.
25. Ido, Y., Chang, K., and Williamson, J. R. (2004) NADH augments blood flow in physiologically activated retina and visual cortex. Proc Natl Acad Sci. 101(2), 653-658.
26. Vlasssenko, A. G., Rundle, M., Raichle, M. E., and Mintun, M. A. (2006) Regulation of blood flow in activated human brain by cytosolic NADH/NAD+ ratio. Proc Natl Acad Sci. 103(6), 1964-1969.
27. Barron, J. T., Gu, L., and Parrillo, J. E. (2000) NADH/NAD redox state of cytoplasmic glycolytic compartments in vascular smooth muscle. Am J Physiol Heart Circ Physiol. 279, H2872–H2878.
28. Zhang, Q., Piston, D. W., and Goodman, R. H. (2002) Regulation of corepressor function by nuclear NADH. Science 295(5561), 1895-1897.
29. Gallagher, F. A., Kettunnen, M.I., Day, S.E., Hu, D., Ardenkjær-Larsen, J.H., Zandt, R.I., Jensen, P.R., Karlsson, M., Golman, K., Lerche, M.H., and Brindle K.M. (2008) Magnetic resonance imaging of pH in vivo using hyperpolarized 13C-labelled bicarbonate. Nature Letters 453, 940-44
30. Ying W. (2007) NAD+ and NADH in brain functions, brain diseases and brain aging. Front Biosci. 12, 1863–1888.
31. Veech, R. L. (2006) The determination of the redox states and phosphorylation potential in living tissues and their relationship to metabolic control of disease phenotypes. Bioche Mol Biol Educ. 34(3), 168-79.
32. Board, M., Hummt, S., and Newsholme, E. A. (1990) Maximum activities of key enzymes of glycolysis, glutaminolysis, pentose phosphate pathway and tricarboxylic acid cycle in normal, neoplastic and suppressed cells. Biochem. J. 265, 503-509.
33. Mycielska, M. E., Patel, A., Rizaner, N., Mazurek, M. P., Keun, H., Patel, A., Ganapathy, V., and Djamgoz, M. B. A. (2009) Citrate transport and metabolism in mammalian cells. BioEssays 31:10–20.
34. Costello, L. C., Liu, Y., Franklin, R. B., and Kennedy, M. C. (1997) Carbohydrates, lipids and other natural products. JBC 272:28875-28881.
35. Costello, L. C., and Franklin, R. B. (2006) The clinical relevance of the metabolism of prostate cancer; zinc and tumor suppression:connecting the dots. Molecular cancer 5(17):1-13.
36. Little, J. L., Wheeler, F. B., Fels, D. R., Koumenis, C., and Kridel, S. J. (2007) Inhibition of fatty acid synthase induces endoplasmic reticulum stress in tumor cells. Cancer Res 67(3):1262-1269.
37. Schwab, M. (2011) Encyclopedia of cancer, 3rd Ed., Springer Verlag, Berlin, Germany. 38. Effert, P. J., Bares, R., Handt, S., Worff, J. M., Büll, U., and Jakse, G. (1996) Metabolic imaging of
untreated prostate cancer by positron emission tomography with 18fluorine-labeled deoxyglucose. J. Urol. 155(3), 994-8.
39. Hofer, C., Laubenbacher, C., Block, T., Breul, J., Hartung, R., and Schwaiger, M. (1999) Fluorine-18-fluorodeoxyglucose positron emission tomography is useless for the detection of local recurrence after radical prostatectomy. Eur. Urol. 36(1), 31-5.
40. Lin, C-C., Cheng, T-L., Tsai, W-H., Tsai, H-J., Hu, K-H., Chang, H-C., Yeh, C-W., Chen, Y-C., Liao, C-C., and Chang, W-T. (2012) Loss of the respiratory enxyme citrate synthase directly links the Warburg effect to tumor malignancy. Sci Rep. 2 (785):1-12.
41. Veech, R.L., Eggleston, L.V., and Krebs, H.A. (1969) The redox state of free nicotinamide-adening dinucleotide phosphate in the cytoplasm of rat liver. Biochem. J. 115, 609-19. 42. Hochachka, P. W., Rupert, J. L., Goldenberg, L., Gleave, M., and Kozlowski, P. (2002) going malignant: the hypoxiacancer connection in the prostate. BioEssays 24:749–757.
by guest on May 25, 2018
http://ww
w.jbc.org/
Dow
nloaded from

Cytosolic [NAD+]/[NADH] tells on metabolic phenotype
11
Acknowledgements - The authors would like to thank Nathalie Hauge Hvithamar for her skilled technical assistance. The study received financial support from the Danish National Advanced Technology Foundation (Højteknologifonden). FOOTNOTES The abbreviations used are: DNP, dynamic nuclear polarisation; MCF7, human mammary adenocarcinoma; PC3, human prostate adenocarcinoma; RF, radio frequency; LDH, lactate dehydrogenase; FIGURE LEGENDS FIGURE 1. Identified hyperpolarized metabolites in glycolysis and in the pentose phosphate pathway. A sum of 25 13C NMR spectra acquired over 50 s with a 2 s time resolution following infusion of hyperpolarized 13C6-d7 glucose in A) Metabolic products detected in human breast cancer cells (MCF7) and human prostate cancer cells (PC3). B) A vertical zoom of panel A) scaled to the same signal-to-noise for the two cell types. The identified signals correspond to: 2-13C-dihydroxyacetone (212.6 ppm, C2-DHAP), 2-13C pyruvate (206 ppm, C2-Pyruvate), 1-13C-lactate (183.5 ppm, C1-Lactate), 6-phophogluconate (179.8 ppm, C1-6PG), 6-phosphogluconolactone (177 ppm, C1-6PGL), 1-13C-pyruvate (171.6 ppm, C1-pyruvate), bicarbonate (161.4 ppm, HCO3
-). C) The fate of 13C6-d7 glucose in the glycolysis and in the pentose phosphate pathway. In red is highlighted the measured hyperpolarized intermediates. FIGURE 2. Dynamics of metabolites in glycolysis and in the pentose phosphate pathway. The spectra were recorded over 1 minute in the two different cell types A) Human breast cancer cells (MCF7) and B) Human prostate cancer cells (PC3). The identity of the metabolite signals are given by their chemical shift values on the x-axis and the dynamic development over time is given in seconds on the y-axis. t=0 is the time where hyperpolarized 13C6-d7 glucose meets the cells. C) Zoom in on the dynamical development of the main metabolites obtained in the MCF7 experiments. 6PG and DHAP with a maximum signal (indicated by red line) 6 s into the experiment are formed before pyruvate and lactate (maximum signal after approx. 11 s). FIGURE 3. Development of hyperpolarized lactate and pyruvate signal over experimental time frame. A) Dynamics of hyperpolarized 1-13C pyruvate and 1-13C lactate following infusion of hyperpolarized 13C6-d7 glucose to MCF7 and PC3 cells. The shown signal build-up and decay are averages of 4 experiments in both cell types. B) Signal ratio between hyperpolarized 1-13C lactate and 1-13C pyruvate over the length of the dynamic experiment in PC3 cells (first 6 s and last 20 s omitted due to low signal to noise). The time of maximum hyperpolarized signal is indicated with a vertical line. C) as in B) for MCF7 cells. FIGURE 4. Depiction of the kinetic model describing the obtained hyperpolarized 1-13C lactate and 1-13C pyruvate data in MCF7 and PC3 cells. Three parameters are fitted: rgluc which describes the decay of hyperpolarized glucose through transport and 10 enzymatic steps in the glycolysis, Klac/pyr which describes the fast equilibrium between pyruvate and lactate and kexp which describes the first order rate constant for export of lactate out of the cells. See methods for a detailed description of the applied kinetic model. The T1in describing the relaxation of the hyperpolarized 1-13C nuclei on intracellular pyruvate and lactate is also fitted in the model. FIGURE 5. Results of the kinetic modelling of hyperpolarized 1-13C lactate (○/ ─ ·· ─ ·· ─ ·· ) and 1-13C pyruvate (●/───) in A) MCF7 cells and B) PC3 cells. The model also allow for a description of the extracellular ( ─ ─ ─) and intracellular (········) amounts of hyperpolarized 1-13C lactate. An excerp is shown for each cell type of the Tdecay for hyperpolarized 13C6-d7 glucose. Top panels show the development of percentage intracellular lactate signal over time.
by guest on May 25, 2018
http://ww
w.jbc.org/
Dow
nloaded from

Cytosolic [NAD+]/[NADH] tells on metabolic phenotype
12
FIGURE 6. Calculated [NAD+]/[NADH] from fitted [1-13C lactate]/[1-13C pyruvate] ratios. A) [1-13C lactate]/[1-13C pyruvate] ratios obtained from fitted 1-13C lactate and 1-13C pyruvate signals in MCF7 and PC3 cells. Significant ratio values between the two cell types were evaluated with students t-test, indicated by *, P <0.0001. B) Calculated [NAD+]/[NADH] ratios using the LDH equilibrium equation, at pH 7.0 for MCF7 cells and pH 7.1 for PC3 cells and KEq = 1.11*10-11 M10
.
by guest on May 25, 2018
http://ww
w.jbc.org/
Dow
nloaded from

Cytosolic [NAD+]/[NADH] tells on metabolic phenotype
13
TABLE 1. Parameters fitted in the kinetic model: Glucose consumption rate (rgluc), lactate and pyruvate equilibrium (Klac/pyr) , Lactate export (kexp) and intracellular lactate and pyruvate T1 (!!!") in each cell type. The R2 of the fit to the averaged data is included in the table along with the number of each type of experiments, N. * The amount of soluble protein is approx. 0.3 mg/million MCF7 cells and approx. 0.35 mg/million PC3 cells.
MCF7 PC3 Fitted parameters rgluc (fmoles/s/cell)* 0.18 ± 0.02 0.09 ± 0.02 Klac/pyr 12.2 ± 0.6 2.8 ± 0.2 kexp (s.1) 0.009 ± 0.002 0.038 ± 0.004 !!!" (s) 15.5 ± 2.9 17.5 ± 6.1 Fit statistics R2 (Gluc/Pyr/Lac) 1.00/0.89/0.99 1.00/0.94/0.99 N 3 3
by guest on May 25, 2018
http://ww
w.jbc.org/
Dow
nloaded from

Cytosolic [NAD+]/[NADH] tells on metabolic phenotype
14
Figure 1.
by guest on May 25, 2018
http://ww
w.jbc.org/
Dow
nloaded from

Cytosolic [NAD+]/[NADH] tells on metabolic phenotype
15
Figure 2.
by guest on May 25, 2018
http://ww
w.jbc.org/
Dow
nloaded from
Cytosolic [NAD+]/[NADH] tells on metabolic phenotype
16
Figure 3.
by guest on May 25, 2018
http://ww
w.jbc.org/
Dow
nloaded from
Cytosolic [NAD+]/[NADH] tells on metabolic phenotype
17
Figure 4.
by guest on May 25, 2018
http://ww
w.jbc.org/
Dow
nloaded from

Cytosolic [NAD+]/[NADH] tells on metabolic phenotype
18
Figure 5.
by guest on May 25, 2018
http://ww
w.jbc.org/
Dow
nloaded from

Cytosolic [NAD+]/[NADH] tells on metabolic phenotype
19
Figure 6.
by guest on May 25, 2018
http://ww
w.jbc.org/
Dow
nloaded from

Mathilde H. LercheCaspar Elo Christensen, Magnus Karlsson, Jakob R. Winther, Pernille Rose Jensen and
hyperpolarized glucose show large variations in metabolic phenotypesNon-invasive in-cell determination of free cytosolic [NAD+]/[NADH] ratios using
published online December 3, 2013J. Biol. Chem.
10.1074/jbc.M113.498626Access the most updated version of this article at doi:
Alerts:
When a correction for this article is posted•
When this article is cited•
to choose from all of JBC's e-mail alertsClick here
by guest on May 25, 2018
http://ww
w.jbc.org/
Dow
nloaded from