ed260168.tif - eric · for jobs pilled by different race, sesf'and education attainment...
TRANSCRIPT

ED 260 168
AUTHORTITLE
INSTITUTION
SPONS AGENCYPUB DATE:GRANTNOTEPUB TYPE
EDRS PRICEDESCRIPTORS
IDENTIFIERS
DOCUMENT RESUME.
UD 024 389
McPartland, James M.; Dawkins, Russell L.A Comparison of the; Use of School Placement Servicesand Other Employer Recruitment Methods lor JobsFilled by Different Race, Sex, and EducationAttainment Groups.Johns Hopkins Univ., Baltimore, Md. Center for SocialOrganization of Schools.National Inst. of Education (ED), Washington, DC.
NIE-G-83-0002100p.; For the complete document, see UD 024 388.
Reports Research/Technical (143)
MF01/PC04 Plus Postage.Blacks; *Educational Attainment; *Education WorkRelationship; Employment Level; Employment Patterns;High Schools; Job Placement; *Job Se-rch Methods; JobTraining; Outcomes'of Education; *Racial Differences;*Recruitment; SchOOl Role; Secondary Education; *Sex
DifferencesPrivate Sector;.Pub].ic Sector
ABSTRACTEmployer recruitment methods and how their use varies
by race and sex groups, by public and private sector, by educaton
level, and other variables,were studied to develop and examine more
realistic theories of educition's rolein career developmentprocesses and to develop practical ways to help students make a
successful transition from school to work. The job recruitmentacivities4'of employers and tbe job search activities used by
employees (aged 22-25) to fill openings in a nationallyrepresentative sample of jobs were examined from.a survey of 410/1
employers. Major findings include the following: (1) particular
methods are associated with high education level jobs (school
placement, professional organizations, private employment agencies,
and media ads), while other methods are associated with low education
level jobs (use of friends and relatives, public employment services,
and unions); (2) high school placement services are infrequently used
by employers or graduates to fill or get low education level jobs,
but are used occasionally in recruitment for female office jobs; (3)
social networks to which whites are attached are more useful for
access to higher level jobs than are the social networks to which
blacks are attached. Also for blacks, social networks are less useful
for finding private sector jobs, and some higher paying jobs in
desegregated environments; and (4) jobs filled by women make less use
of union referrals and more use of direct applications and media ads.
(KH)
***********************************************************************Reproductions supplied by EDRS are the best that can be made
from the original document.***********************************************************************
o
U

0
oo
k0
rr
A Comparison of the Dse if School PlacementServices and Other Employer RecrUitment Methods.
for Jobs Pilled by Different Race, Sesf'andEducation Attainment Groups.
James. M. McPartlandRussell L. Dawkins
Center for Social Organization of SchoolsThe Johns Hopkins University
U.S. DEPARTMENT OF EDUCATIONNATIONAL INSTITUTE OF EDUCATION
EDUC TIONAL.RESOURCES INFORMATIONCENTER (ERIC)
This document has been reproduced asrimmed from the person or organizationoriginating itMinor changes have been made to improveis:orcouc bon quality
Points witt.v or opinions stated in this document do not net essanly represent official N'EPosition nr policy
"PERMISSION TO REPRODUCE THISMATERIAL HAS BEEN GRANTED BY
JksiS /1446% 614,14-CJ
TO THE EDUCATIONAL RESOURCESINFORMATION CENTER (ERIC)."
2
BEST COPY
Qr

TABLE OF CONTENTS
1. Introduction 1
1.1 Recent theories of-education and work 1
1.2 Some practical issues 3
2. Research design 3
3. A Statistical-Description of Joh Recruitment and Job 'Search
Behaviors 5-
3.1 Comparison of public an d private sectors 6
3.2 Consistency of employer an& employee reports 8
3.3 Frequency of use and importance 11
3.4 Reletiduships between recruitment methods. 12
4. How Job Recruitment and Job Search Methods are Related to
Sex and Education Characteristics of Job and Applicant 15
4.1 Measures and methods 16
4.2 Results on education level of job and applicant in
private sector 18
4.3 Results on sex reposition of job and sex of applicant
in private sector 20
4.4 Public sector results 23
4.5 'Canonical correlation analyses 23
4.6 Summary of sector, sex and education level differences 28
5. Some Characteristics of Firms and Labor Markets Related to
Employer Recruitment Methods 31
5.1 .Size of establishment and labor market 31
5.2 Industry differences 33
5.3 Specific job traits 39
6. How Job Recruitment and Job Search Methods are Related to
Race and Ethnic Characteristics 44
6.1 Race and ethnic effects, controlling for sea and
education level45-
6.2 Race and ethnic effects within education levels 47
6.3 A closer look at black use of social networks 50
6.4 Summary and discussion of race and ethnic effects 54
7. Summary and Discussion56
3

1. latasalutign
Research on how employers recruit new workers is needed
to Alevelopcand examine more realistic theories of educe-
tion's role in career development processes and to develop
practical ways to help students make a successful trafsition
from school to work.-
Yecent theories gl education And icak
Until recently, theories of career development have
emphasized the productivity aspects-of schooling to coincide
with a wat7e competition model of education and work. 'Under
a wage competition framework, individuals seeking jobs would
sell their skills in the labor market by negotiating the
best wage for their talents with employers who had openings
that required such skills. The role of schools in this
model is Co train the human capital that is required for
different jobs. A great deal of research has been devoted to
.estimating the market value of education i'n terms of the
increased earnings that is returned to additional education.
The need for schools to educate and train students in the
skills required for different jobs remains of theoretical
and practical interest. But the recent development of a job
vacancy competition theory has added new questions about the
role of schoold in the economy. Under this theory, individ-
uals do not negotiate wage rates with employers to create a

PAGE 2
hiring occasion. Instead, vacancies occur at fixed wage
leveli due to current employees leaving their position or
due to new jobs being created in firms. TO find employment,
an individual must learn of a vacancy, show up as an appli
cant and be chosen ,.by the employer to fill the position.
The issues that arise about the role of educatinn under this
formulation include questions at each stage of the employ
ment process. At the recruitment stage, how do schools help
.individuals become candidates for certain vacancies? Do
they provide formal placement services that employers can
use to get applicants? Do they provide informal networks of
information'and,contacts that° individuals can use to learn
about particular_ job openings? At the selection stage, low
are credentials and information provided by schools used by
employers to rank candidates? How are appropriate job
skills learned at school measured by employtrs in the pro
cess of selecting new employees? At the job promotion
-stage, what school credentials continue to have meaning, and
how do skills learned at school compare to skills learned on
the job in determining who moves up in a firm?
This paper, will concentrate on the recruitment stage of
the employment process. We will investigate the use and
importance of school placement services ied education cre
dentials in employer recruitment and individual job search
methods.

11 A222 suursirgAl41
PAGE 3
Questions about the role of schools in the recruitment
phase of employment also relate to practical issues of effi-
ciency, effectiveness, and fairness. Can and do schools
provide cost-effective formal mechanisms for matching appli-
cants With vacancies? Can and do employers use information
provided by schools. about individuals employers to accu-
rattly rank and match candidates to new positions? Do all
segments of the population, including racial and ethnic
minorities, have equal acceii:to and equal success in using
the information and processes through which different job
opennings are filled?
a. learAugh &taiga
w will analyze a set of data that was assembled to study
both employer and employee behaviors associated with the
same job position in the same firm at major stages of,, the
employment process. in this paper, we examine the job
recruitment activities of the employers and-the job search
.activities used by employees to fill openings in a nation-
ally representative sample of jcibs filled by young workers
in the approximate age range of 22 to,25.
Our data are from a national survey of 4078 employers.
The information provided by the survey is linked to jobs
held in 1976 or 1979 by.a sample of individual respondents
to the National Longitudinal Survey of the High School Grad-

PAGE 4
uating Class of 1972 (NLS). The National Longitudinal Stir-, (4
vey is a large-scale study conducted .by the National Center
for Education Statistics that collected base year data from
over 20,000 high school seniors in 1972 and follow-up survey
data from them at four subsequent times. The third and
fourth NLS follow-up surveys were used to select a sample of
employers through the information provided by NLS respon-
dents on the name and ideation of their employer in October
1976 and October 1970. The sampling and survey procedures
are described. elsewhere (McPartland and Humphrey, 1984).
Completed survey questionnaires were obtained in 1983 from
approximately 75 percent of the sampled employers for a
total achieved sample size of 4078.
Many questions on the employer survey pert lined to a ape-,/
cific "sample job" title and duties described on the earlier
individual NLS respondent guestiOnnaires as the position
filled by the individual in 1976 or 1979. By merging the
employer surveys with the individual NLS surveys so as to
match information in.# single, record in the same "sample
job" in the same firm, we are able to investigate similar
issues about the job from the perspective of employer and
employee.
The data we have, in essence, describe how the employer
views a job, how it is generally filled, and how it, relates
to the firm. At, the same time, our data des tribe the actual

rd PAGE 5
employee in that job, and the job search procedures that
he/she used to get the job.
From the employee questionnaires, we will use infor ition
on the individuals' race, sex, and educational fattal
as well as the job search, behaviors used to find the job.
From the' employer questionnaires, we will use information on
the demographic characteristics of incumbents of the sample
job (percent male, race distribution, and educational
attainment distribition) as well as the job recruitment
methods used most often by 'the employer to fill openings in
the "sample job.". Wei)will examine jobs from both the pri-
vate and public sectors. The private sector workers were
defined as 'an employee of a PRIVATE company, bank, busi-
ness, school or individual working for wages, salary, or
commissions," and public sector workers were defined as "a
GOVERNMENT employee (Federal, State, county, or local insti-
tution or school) ."
1. AratiaticAl Description RecruitmentAnd algb Snub Behav iors.
The employee questionnaire listed twelve job search meth-
ods, and asked the individual "How did you find this job?
(Circle as many as apply.) " The employer questionnaire
listed eleven corresponding job recruitment methods, and
asked the employer 'How often do you use each of the follow-
ing methods to find applicants from the outside when open-
Nu

V's
. PAGE 6 .
ings occur in the SAMPLE J00?" (Circle one response for
each method: AlWays, Often, Sometimes, .eldom, Never.) The
wording was the same or similar for the caployer and
employee methods, as follows:
Empfoux =Ways&
1. Ask your Current employees,to recommend their friendsand acquaintances.
2. School or college placementservices.
la.lb.
2.
Relatives.Friends.
SAME
3. Professional periodiCals or 3. SAME
organizations.
. 4. Civil Service applications. 4. SAME
5. Public employment services. 5. SAME
6. Private'eMployment agencies 6. 'Private employment
0 or services. agency.
7. CommunitY action or, welfaregroups.
7. SAME
8. Newspaper, TV, or radio ads. 8. SAME
9. Unsolicited applicants("walk-in" applicants)
9. Direct applicationto employers.
10. Referrals from a union. 10. Registration witha union.
11. Other (please specify ) 11. SAME
1.1 Comparison DI public an private Begtors.
Table 1 presents the percent of employers and employees
who reported using each method, with separate tabulations
for private and public sector jobs. (Employer results are
the percent who circled "always" or "often".)
ot

Table 1 about here
PAGE'?V 4
4
We notice from Table 1 that (a) the public and private'
sectors differ in the most frequently used search and
recruitment methods, and (b) there is good agreement between
employer and employee in the relative rankings alpigned to
each method.
_Besides the obvious sectoF difff.erence in use of ,Civil
Service applications, which are exclusively the domain of
public employment,*. there are other sizeable differences
betWeen private and public employment in job recruitment and
job search methods. Public sector jobs are more likely to
be filled by the use of school placement services, community .
action ors welfare gioups, professional organizations, and
public employment services. Private sector jobs are more
likely to be filled by the use of :friends or relatives of .
current employees, private employment agencies, media adver-
. tisements, and unions. In each of thepe comparisons,
empl'Iyer and employee sources agree on the direction of the
sector difference, and at least one source demonitrates a
'statistically signifiCant-difference. The.only method that
does not show a statistically'significant sector difference
from either source is the method that ranks first in fre-
1"rhe' small percent in the' public sector reporting use ofCivil Service applications are probably errors either in thesector classification of the employer or in the respondent'sunderstanding of the question;
ad,
V.)

PAGE 8. .
quencl, of use: 44rect application (Or "walk-in" appli-.
1 ,cants). . /
Except 'for tiii,obirious_seceor,difference in Civil ServiCe.-
applications, it is .not clear froq'these simple tabuldtions-.'
why public and private jobs differ. on other methods, The
reasons may derive from.possible difference:8.1in the distri-V
bution -of job skills and training required in-each sector, ti,
or. from organizational aspects of thi.enteises.such as
size and formalization of operationsi'.or ficm.characteris-.,
tics of the local labor markets in
ties act. locatcd. We .will examine
which thevarious activi-
some of these factors Pin
oir further research with these data.
1.26 Consistency 22112122.2i And =alma zraatta.
While the absolute frequencies reported for each methodO
differ between employer and employee, tbe, relative rank
orderings of methods are ,in good agreement. In the Total
columns, both employer and employee sources'rank"Dfiect
application (walk-in) " abOve,a1/ other methodsvboth rank",
"Friends" as the second ,in- frequency of use, and "media ads"
as thirds. "School placement Services" are about in the mid-.
dle.of the rankings of bOth sources, ranked-fourth by
employees and fifth by employers. The least frequently' used
methods are union sources, community agencies or welfare/
groups, professional periodicals or organizations, Civil
Service applications and private employment services. The-

NAGE
rank-order correlation coeffiCient between employftand
employee values is .812, which is statistically significant,.
In the next sections mf this paper, we will exaraine.ow the ,
use of various methods is related to different types of jobs
and job candidates within each 'sector.
Employers and employees differ in the absolute frequen-
cies of use reported for each method. One reason is that
the question asked employees to "circle as many' as apple
but forced employers to assess, each method individually. A
sum of the percentages down the Total columns of Table 1
across all methods for each group indicites how many differ-,
ent methods were indicated by the average employer and
employee. The average employer had indicated freqbent use
for about two methods (averagi s 2.21), while the average
.employee had only circled about one met:.od (average 1.21).
Apparently many employees did not realize from the wording
.of the question that they could answer more than one method,
or,t4ey did,ria,..conceive that more than. one method could be
used in finding a.hingle job. Another possible methodologi-
cal,.reeion for employer - erwloyee differenct) in response
rates is the difference in the .time of the questionnaires:
employee da?kwere collected in 1976 and 1979 while employer
data were, collected in 1963. There may also be response
errors in the employer understanding of the 'sample job' and.
in the employer or.employee understanding of descriptions of
specific- methods.

.
PAGE 10
Besides methodological sources of response rate/differ-,
ences, there are also possibDt substantive sources of
employer - employee differences. Most specific jobs in a firm
are filled by several different individuals over a period of
time, especially if the establishme6 is large.' Therefore,
an employer response will usually be a generalization'over
the various individual cases who have beer. recruited to the
job, while an employee response will constitute just one
case that may.. or may not reflect the typical way in which
the particular job is filled. Also, when multiple methods
are used by employers and employees for the same position,
each party may have different perceptions of which method
was the most important in filling the r)..
Table 2 is a inter-correlation matri.1 between employee
job search methods and employer job recruitment methods used
for the same job. If employer and employee agree on the
methods used, then the largest positive value in any row or
column of the' matrix should be the value on the diagonal
(which is the position in the matrix of variables where
there is a match between employers and employee methods).
The absolute value of the diagonal, entries indicates the
strength of the agreement between employer and employee
methods.
The diagonal values in Table 2. (underlined) are usually
the largest positive numbers in the relevant row and column
13

PAGE 11
and all are statistically significant. But several of these
values are below .10 in absolute value. This provides ove-
rall evidence of the validity of our measures of the methods
used to link job candidates to job openings, and indicates
which particular methods are measured with lower validity.
The methods showing most agreement (in order.of the size of
the diagonal intercorrelation) are: Civil Service, private
employment agency, union referralp.media ads and school
placement service. The methods with less agreement (in des-
cending Order of size) are: professional organizations,
public employment services, community groups, friends, and
direct application. The three most informal methods demon-
strate the weakest agreement between employer and employee
for the same job.
3,1 Frequency Qf use And Importance
The method that employers use most 'frequently to find
applicants for job openings may not be the same as the
method that they view as most important for Finding the per-
son who is actually hired for the job. For example, one
method may produce many candidates, but a different method
may produce fewer but better candidates. To examine these
possibilities) a subsample of 1945 employers were asked this
question following their answers to questions about fre-
quency of use: 'which THREE of the above. methods have been
most important for finding the persons who are actually

PAGE 12
hired from the outside for the sample job? Which is most
important? Which is skond most important? Which is third
most important?" Table 3 shows that the responses to these
questions for private and public sector employers parallel
the findings from Table 1. The rank order of methods and
the public-private sector differences in Table 3 are essen-
tially the same as previously shown in Table 1. Thus the
frequency with which employers use each job recruitment
method is strongly related to the importance that method has
for locating the person who is actually hired.
Relationships betitun recruitment methods
Table 4 summarizes factor analyses of the 10 items on
employer recruitment methods, examined separately in the
private and public sectors. The table presents the varimax
rota,:ed facator matrix and the final communality estimates
for each item. Three-similar factors emerge in the private
and public sectors. The minor differences between the sec-
tors concern the amount of variance of specific variables
accounted for the factors, and the single variable in each
sector that loads equally. on two factors.
Three factors are clearly defined in Table 4. The first
factor is composed of four items: use of school placement
services, professional periodicals or organizations, private
employment agencies, and newspaper and media ads. Each of
these methods requires more expense or effort on the part of
15.e.

PAGE 13
the employer than do other methods, and, as we shall see
later in this paper, is usually associated with filling jobs
requiring education beyond high school. This factor is pre-
sented in Table 4 as Factor 1 in the Private Sector and Fac-
tor 2 in the Public Sector.
The second factdeis composed of three items: use of
public employment services, community action or welfare
groups, and union referrals. Each of these methods involves
low cost and limited employer effort, and, as will be
revealed in subsequent analyses, is primarily associated
with filling jobs that require high school completion or
less. (In Table 4, see Factor 2 in the Private Sector and
Factor 1 in the Public Sector.) The third factor is com-
posed of two items: use of Current employees for recommen-
dations, and unsolicited or "walk -in" applicants. These are
the informal methods that use of word-of-mouth and social
networks to bring job candidates to the employer.
One item, use of Civil Service applications, is not
included in any factor, because it mainly distinguishes
between the Private and Public sectors and has no clear4
relationships with other methods within either sector.
within the Public Sector, this item has the lowest communal-
ity, indicating that the factors account for the least vari-
ance in this measure. In the Private Sector, this item
loads about equally on two factors and has a relatively low

PAGE 14
communality, indicating unclear and unimportInt meaning. As
suggested earlier, variation on, this item in\tSe Private
Sector is probably dne to invalid measurement or classifica-
tion.
Within the Private Sector, the item with the lowest com-
munality is use of friends of employees., and use of walk-ins
is t4 next lowest. Either these items are poorly associ-
ated with other ,methods of job recruitment used by employ-
ers, or (as suggested by Table 2, discussed earlier) not
reliably measured by the employer reports used .in these
analyses.
In the Public Sector, the item on Civil 'Service As lowest
in estimated communality, suggesting that it accompanies
other methods of recruitment with equal frequency among pub -4
lic employers; and the use of private employment agencies
has the least distinguishing factor loadings, suggesting
that this method is infrequently used as an adjunct to other
methods.
It was not possible to examine possible underlying factor
structures for the individual job search items, since the
average individual selected one method only as having been
used to find tha job.
In defining the three factors for employer recruitment
methods, we followed the convention of selecting an eigenva-
17
do'

PAGE 15
lee of 1 or greater as the cut-offs point, in a principal con-
ponents analysis that preceded the varimax rotation. As
such, a bit less than 50 percent of the variance in the ten
component items is -accounted for by the three-factor solu-
tion in each sector (47.0 percent in the private sector,
49.4 percent in the public sector). We will continue to
study the separate items in the rest of this paw, to dap-
ture as much as possible as the full range of complexity in
job search and job recruitment methods.
Boy alb ingruitment AIUV12h Alsuuta wham'. .
au -Related tQ Au And .Educational illak ima Aaalsamt
°DO employers within each sector use different job
recruitment methods depending upon the type of vacancy to be
filled? For what types of jobs do private and public
employers rely most on school placement services to locate
candidates for job openings? 'Bow is the use of other
recruitment methods related to the type of job opening. and.
type of employer? In this section, we will analyze these
issues for two dimensions of job openings: the education
level of past occupants in the job at the establishment, and
the sex composition of previous incumbents in the particular
job.
We will conduct parallel analyses from the perspective of
job recruitment methods used by employers to fill jobs with
different sex composition and educational distributions, and

PAGE 16
from the perspectiveiof job search methods used by individu-.
ale from different sex and educational attainment subgroups.
Our analyses will be conducted separately within' the private
and public employment sectors.
4.1. luau= sad attiala
Two multiple regression analyses of employer practices to
fill different jobs are summarized in Table 5. For these
analyses, the job is the unit of analysis, and the dependent,
variable is either (a) the percent male of current employees
in the job, or (b) the percent of current job occupants
whose highest educational attainment did not include any
college study (that is, those who graduated from high school
and those who did not finish high school.)
The first regression analysis estimates an equation to
predict the percent male in the job by one single employer
recruitment method (such as use of "friends of employees") ,
controlling for the percent with no college education. Each
employer recruitment method is measured on a five -point
scale with higher values equalling more frequent use. For
example, the first 3 values in the top row of Table 5
(-.0094, -.029, 2.6) are the regression coefficients and
test statistic when the recruitment. method "friends of
employees" is used to predict "percent male in the job", and
"percent with no college in the job" is included as a con-
trol variable in the regression equation.
19

PAGE 17
A second regression analysis estimates an equation to
predict "the percent with no college in the job" by one
method of employer recruitment, controlling for k'the percent
male in the job.° For example, the values in columns 4, 5
and 6 of the first row of Table 5 (.0012, .114, 0.0) are the
regression coefficients and test statistic when the recruit-
ment method "friends of employees" is used to predict "the
percent with no college in the job,. with "percent male'
included as a control. Thus each set of three values (b, B,
P) in Table 5 is from a separate regression analysis.
0Multiple regression analyses of individual job smirch
behaviors are reported in Table 6. In this case, the unit
of analysis is the individual job applicant, and the depen-
dent variable is the job search method used to find the job
(scored as a 1/0 dummy variable). Two independent variables
are used in each analysis: the individuals' sex (scored
Male 1, Female 0) and the individuals' educational
attainment (scoreelligh School 1, Some College = 2, Col-
lege Degree = 3). Thus each row in Table 6 is from ,a sepa-
a
* An alternative analysis would switch the roles of depen-dent and independent variables in the multiple regressionanalyses, using the job recruitment method as the dependentvariable and "percent male in the job" and "percent no col-lege in the job" as independent variables. The values for 8and P shown in Table 5 would be exactly the same under thealternative analysis, only the unstandardized values would
be different. The substantive interpretations provided for
Table 5 would not changurder the alternative approach. We
chose the order of var es used for the Table 5 analysesbecause we believed it to more correctly follow the actual
causal process.
2 0

'PAGE.1.8
rate multiply regression' analysis..?
402. Results 1211 education level al 1st And any isrAzit In =l-ull natal.
The size and consistency of :results in Table 5 and Table
6 show that education level-of the job and the education of
the job applicafit are strongly related to the .job recruit-
ment and job search methods used.
Table 5 and Table 6 about here
The four methods most strongly associated with jobs that
require advanced education are school placement services,
professional periodicals and organizations, private employ-
ment agencies, and media ads. ,The results for these methods
are similar in Table 4 and Table 5: the same methods have
the four largest statistically significant values in the.
same direction for increasing education levels. This simi-
larity of results indicates that employers and, employees
agree that these four methods are'' the most used to recruit
for or search for jobs that require advance education.
The results for methods associated. with filling lower
education jobs are not so clear: the four largest (posi-
tive) values in Table 5 are not statistically significant in
Table 6. Employers (Table 5) report that they use four
methods are used more often when jobs are filled by workers
21
PAGE 19
with low' education public'emplOyment services, cose-
munity action.or welfare groups, direct application
(walk-in) and union regerrals. ,Employees (Table46):report
that individuals with lower levels of education are more ---
likely to use friends and especily relatives to find jobs.
Although none of the statistically significantivalues in
one Table statistically significant in the other Table, ,each
of the six significant value's found in Tables 5 and 6 have
substantive meaning. We previously observed (Table 2)'that
the items with the poorest employer -employee intercorrela-
tions are mediae ads, friends-and relatives, community .
-groups, and public employment services, which are the same
items at issue in Tables 5 and 6 (along with unions). Thus,.
it should be no .surprise that relationships in Tables 5 and
6 do not match in strength. Also, an employee may often be
more aware than the emplioyer when informal social networks
(friends and relatives) are used to match job seekers to job
.vacancies, so that the results with the employee measure may
have more meaning in our studies. On the other hand, the
employer data is likely to be more valid on most other vvth-.
ods, because the question formats required a direct rating
of each method by the employer,but not by thle employee.
Taking the employee results as more meaningful for the
"friends" or "relatives" measure and the employer results as
more merningful on the, other items in question, we conclude

RAGE 20
frbm Tables 5 and 6 that the five methods used especially to
fill jobs with lower educatiorial requirements are: (1)
employees' fiiends or relatively (2) public employmen't ser-. .
Vices, (3) or welfareaction o welfare ,grofpply (4) direc-
tionApplication (walk -in) ,. and (5) unions.
L.1 112/411A 'an. Lit composition 14.il .111211 lial applicant
in 9112.4 =ISLE
The pattern of results in Tables 5 and Table 6 is not as
strong vr consistent for sex of job as foi education level
Rf job. With one exception, job tecruitment and job search
methods are More strongly associated with education level
than with sex, as seen from a comparison of columns 2 and 5
and of columns 3 and 6 for each row.- The excepO.on'is the
use of unIgn1 which is used more for male jobs,in the pri-
vate,sector. .11
This suggetts the need aanalyze sex differences within
fixecr.categoiies of jobs according to their education level.
Before separately examining each education subcategory, it
Is useful to note. the results for sex' composition of job in
Table 5 and sex of job applicant in Table 6 when education
level is held constant statistically.
Employer laports (Table 5), indicatOthat unions are used
more often to fill mostly male jobs, while sctiool placement
.
services, media ads and direct application (walk-ins) are
23
OD.

PAGE' 21
methods used more often to fill mostly glad:; jobs.
l Emplbyee reports (Table 6) agree strongly with the finding
of more use of unions by males and the greater use of ads by
'females. However, employee reports also suggest that imam
use friends and relatives mode to find jobs,. and that
females use private employment services, sore to find jobs.
b
Table 7 shows the relatiorishili between each employer -
recruitment method and percent pale in the job for different
types of jobs categorised -by the educational level of the
current job occuparits.' The following results are of:inter-
ests
Table 7 about here
e.1. When school Placement service' are used for high school
jobs, the method is more often used to ,fill positions held
by females, and these jobs are often clerical and office
work.* For jobs at higher educational levels where school
(college) placement services are used most often (Table 5),
there is.no tendency to use the method more for one sex than
another.
We examined the job titles of female-high school jobsfilled by school placement services compared to otherods.

PAGE 22-
2. When =Intl juniagaint maxim are used fpr ?igh
school, jobs, the method is also more often'used to fill
positions held by females (frequently for office and cleri-
cal work). For higher level jobs where private services are
used most often (Table 5), there are no significant differ-
ences by sex composition of the job.
1. MAdiA DdA are used more to fill jobs held by women at
each separaite educational level of work. Media ads are used
more for higher level jobs (yable 5), and the tendency, ,to
use this method to fill women's jobs was also greater for
positions at the higher educatiOnal levels (comparison of
4b's across row 6 of Table .7).
. L. Direct soplicatioa (walk -ins)' is more often used to
'fill-jobs usually held by women at lower and intermediate
educational levels. This method is not as frequently used
foe, jobs usually held by 'college graduites*(Table 5) and0
there are no :Ignificant sex differencee in the method at
this level.
The only .method with a significant sex difference
that favors jobs usually held by mgleg ieunion ref err)
This method applies mainly to lower level jobs (Table 5)
where the sex difference is greatest.
25

! t PAGE 23
4.4 Publi sector 'results
Public and prfirate emigotprs differ in the frequency with to
. /; which they use Particular recruitment methodi, but when a
given method is used it often is directed ,toward the, yams
educational level and sex type of job regardless of the sec-.
tor. Tables 5 and 6 show the similarities.
Like private firms, public employers more often use
school, placement services, professional organizations and
media ads to recruit for jobs filled by those with advanced
education.. For lower eAuCation jobs, public employers are
more likely tO,use pdblic employment'services,.and community
action or welfare groups, following the same tendencies of
private employers. On the other hand, use of employees'
friends, employment agencies, walkins_and union
referrals are not related to the education level of public'
sector jobs, where these methods are used.significantly leis
frequently than in the private lector where tley are related
to job level. Civil.Service Applications, used exclusively
in the public sector, tend to used more for lower level
positions.
1..1 rdinnenigAl
Cannon:ice/ correlation can be used when there are multi-
ple independent Variables and multiple dependent variables
to estimate an equation that is the -best linear combinatiOn
of the independent variables that has the highest multiple
_correlation with the best linear combination of the depen
. 26

PAIGE 24
dent variables. The coefficients for variables on each side
of the equation Can be interpreted as estimates of the rela-
tive importance and direction of influence of each measure,
in the same manner that standardized regrission coefficients
are interpreted in ordinary multiple regression analyses. A
second cannonical correlation analysis can be performed fol-
lowing the estimation of the initial aviation that is based
on the set of residuals from the first, to estimate the
linear combination of variables that best accounts for the
remairt*ng variation (Cooley and Lohner, 1971; Thompson,
1984; Warwick, 1975.
Our case, with ten job recruitment techniques being used
to predict the percent male in the job and the percent with
no. college in the job, is well suited to cannonical correla-
tion analyses. Wevill report separate cannonical analyses
of both employer recruitment methods and employee search
methods in the private And public sectors. 'Table 8 summa-
rizes six cannonical correlation analyses for different
-methods and sectors.
Each'cannonical analysis shown in Table 8 reports the
cannonical weights for each variable for the first and sec-
ond cannonical equation, together with the eigenvalue that
gives the percent of variance accounted for by the bist fit-
ting equation. 'For example, the first column of values in
27

ti
P
PAGE 25
the top panel of table 8 shows the weights associated with
each of ten emplOyet recruitment methodathat best predict a.
combination of education level and sex composition of job.
This first equation (CANVI) is mainly predicting education
level of jQ (weight = .967) rather than sex composition of
job (weight = .183) and shows that jobs held by a high per-
cent with no college are mainly filled by public employment
service (.4.29) and unions (.196) rather than by the methods
with large negative weights such as-school placement ser-
vices (-.548) professional organizations (-.374) private
employment services (-.194) or media ads (-.253) .. This .
equation explains 20.7 percent of the variance (eigenvalue =
.207). The adjacent column of values in table-8 (CANV2)
gives the second cannonical equation, which explains about 4
percent of the remaining variance (eigenvalue -.041) with an
eq'dation primarily concerned with high percent male jobs
(weight s .987). Other portions of Table 8 report separate
cannonical analyses in the same format.
Table 8 about here
The following conclusions seem warranted from Table 8:
1. Reports of employer methods are much superior to
xployee methods in accounting for variance in job composi-
tion. The eigenvalues indicate that the first cannonical
equation estimated for employer methods accounts for over 20

PAGE 26
percent of the variance, while the use of reports of
employee search methods accounts for about six percent.
2. There is strength and consistency to results about
how methods are related to the education level of jobs. In
both sectors and for both employer and employee reports,
particular methods are associated. with high education level
jobs (school placement, professional organizations, private
employment agencies, and media ads) while other methods are
associated with lower education level jobs (public employ-
ment services and unions). In addition, according to
employee results, friends and relatives seem to be used
especially for lower level jobs. The pattern for direct
applications (walk-ins) is small in size and inconsistent in
direction.
3. Most of the results for sex composition of job are
inconsistent across sector and methods and account for a
small amount of the variance explained by recruitment or
search methods. Table 9. reports a partitioning of variance
explained by employer methods in sex composition and educa-
tion level composition that shows the minor role of sex com-
position in the first prediction equation. The unique por-
tion of variance for sex is the difference between the
squared cannonical correlati ')n for the total equation
(eigenvalue = .20682) and the correlation from a conven-
tional multiple regression of ten employer recruitment meth-
29
,et
4,

ti
PAGE 27A%
olds to predict percent with no college in the job (.29682
-.20130 = .00552). The unique portion for education -level
is the difference between the cannonical correlation and the
R2 from a conventional multiple correlation of percent male
in the job on ten employer recruitment methods C.20682
-.05316 = .15366). The joint portion is the difference
between the squared cannonical correlation and the sum of
the unique portions (.20682 - (.00552 + .15366 ) .04764.
Table 9 shows that most of the variance in job composition
explained by ten employer recruitment methods is uniquely
assigned to education composition (74.3 percent in the pri-
vate sector, and-83.3 percent in the public sector), Almost
none is uniquely assigned to sex composition (2.7 percent in
private sector and 0.1 percent in public sector). Some of
the explained variance cannot be empirically separated into
components for sex composition or education level of job
(joint portion equals 23.0 percent in the private sector and
16.6 percent in the public).
Table 9 about here
Besides this minor role of sex composition in the first
cannonical equation, Table 8 shows the weak ability of the
second cannonical equations to account for the remaining
variance in job sex composition with job recruitment meth-
ods. The very small eigenvalues range from .041 to .01.1.
3u

PAGE 1E
4. The weights that show the most consistent strength
and direction between method and percent male In the job
apply to the use of unions (positive) .
Awry Alatins, AAA And 2.41112Ati2A 11221 differences
A convenient method to summarize our results 11 far is to
pick one subgroup as-a base for all comparisons. Figure 1.
shims the relative frequency that different employer
recruitment methods are used to fill private Sector male
jobs, depending upon whether the job is usually held by high
school graduates or college graduates. The values graphed
in Figure 1 are reported in Table 10, together with sAjust-
ment factors to estimate the use., of each method in the pub-
lic sector and for jobs usually held by females. Its
adjustment factor is an estimate of the amount to be added
or subtracted to the perciatages shown for maleoprivate sec-
tor jobs to obtain the value for public sector and/or female
jobs. These adjustment factors are the unitandardixed
regression coefficients from a multiple regression where the
dependent variable is the percent of employers using each
method and the independent variables are job sector (Public
= 1, Private = 0)and job sex (jobs with 50 percent or more
female = 1, otherwise = 0), wits percent in the job with no
college also included as an independent variable.
Figure 2 and Table 10 about here
31
PAGE 29
Figure 1 illustrates both the comparison between educa-
tion levels and the relative importance within each educa-
tion level of each employer recruitment method. Thus we can
see that while some methods are used more for higher level
jobs (sthool placement, professional organizations, private
employment agencies and media ads) and some are used more
for lower level jobs (public employment services, community
groups, walk-ins and unions), the most frequently used
method at each level is "walk-ins," and "friends of employ-
ees" is near the top in relative use.
Table 10 shows that when we examine public sector jobs,
there would be major adjustments for less frequent use of
friends and walk-ins and more frequent use of civil service
and community groups, with minor adjustments for use of
other methods in the public sector. The adjustment factors
shown for female jobs in Table 10 are not as large as for
sector and do not indicate how sex differences may vary for
separate education levels. Nevertheless, we can observe
that the three largest average adjustment factors for female
jobs inclilde a greater use of walk-ins and media ads and a
lesser use of unions. Our studies of more detailed tables
in the previous section suggested that the sex differences
for walk-ins and unions were mainly for lower level jobs and
the sex differences for media ad use were greater for higher
level jobs.
31)

PAGE 30
The method of "school- placement services is 'of special
concern for our interest in the role of education in career
processes. We learned that use of school placement shows
the largest difference between low education level jobs and
high education level jobs, with school placement services
assisting in recruitment mainly at the college level. For
lower education level jobs, high school placement services
are used occasionally in recruiting for female office jobs.

PAG E 31
1. Chauctiplatirg Wu and Labia =katiItalatad la /Watt Malaita= lialada
We have reported how employer recruitment methods differ
on the ,average for private or public employers. We also
examined how other seiected features of the firm and labor
market are related to the frequency with which different
employer recruitment methods are used for jobs in different
categories of education level and se:: composition. These
features are size of labor market, size of firm, induptry of
firm, and priority worker traits for the job.
Ain sit satabliahmant and lag= aaskat
Table 11 reports the coefficients for firm size and city
size as independent variables in multiple regression Analy-
ses where each employer recruitment method is a dependent
variable (scored 1 to 5 on.a scale corresponding to the
range of use from 'never" to "always") , with "percent male
in the job" and 'percent with no college in the jOb" as
additional independent variables in the equations4 The size
of the firm* is defined by the employer's answer to the
question: "Overall, about how many persons are currently
employed full -time, and ,part -time at this location?' City
size is measured by individual respondents' answers to the
* The paragraph preceding this question made At clear that
the size estimate should apply to a single location for
those organizations that have multiple locations. "Estab.I.
lishment" is the phrase often used to signify this unit of
analysis.
34

PAGE 32
question *Which of the following best describes the location
of the place where you live ?' with categories ranging from
'In a small city or town of fewer than 50,000 people' to 'In
a very large city over 500,000 people.***
Table 11 shows that several employer recruitment methods
vary with firm size and /or city size. In the private sec-
tor, city Size has its largest effects on the use of private
employment agencies, community action or welfare groups and
media ads: the frequency of each is greater in larger
cities. In the private sector, smaller statistically signi-
ficant effects of city size include positive effects on the
_use of friends of employees, professional organizations and
union referrals, and negative effects on the use of pgblic
employment aervices. In the public sector, city size has
only one large effect: civil service applications are used
more in larger cities. A smaller positive statistically
significant effect of city size in the public sector is on
the use of community action or welfare groups..
9.
Table 11 about here
The size of firm has large effects on many job recruit-
lent methods in both sectors. In the private sector, firm
size is significantly related in one direction or another to
** Other measures of city urbanicity based on Census data,
such as whether the location is an SMSA or the percent urban
in the county, show the same results as Table 11.
35

SPAGE 33
all methods except use of professional .organizations, civil
service applications, and media ads. Larger private sector ,
establishments more often use comaunity action or welfare
groups, public employment services, unsolicited applicants,'
school placement services and union referrals. Larger pri-
vate sect..: establishments less often use friends (as,
reported by the employer) and private employment agencies.
The effects of establishment size are much the same in the
public.tector. Establishment size increases the use of
unsolicited applicants, community action or welfare groups,
public employment services, union referrals and civil ser-
vice' applications. A smaller negative effect of establish-
ment size is observed for use of, employee friends.
Industry =limn=Using census codes for the industry within which each
sample establishment is located, we constructed .dichotomous
variables for eight broad industrial categories. Table 12
displays how our sample is distributed across the eight
industrial categories within. the private and public sectors,
and names the most frequent, industry codes that appear in
our sample for each category. Our apple of public sector
jobs is concentrated in the categories of Service, Public
administration, and Communications (postal service), with
all other industrial categories having less than 3 percent
of our public sector sample and less than half the percent

S.
PAGE 34*
for the.same category found for private sector jobs. The
'industrial categories with most jobs.from our private sector
sample are Services, Man4faituring, and Trade (wholesale, and
retail). Other industrial categories that are mainly in the
private sector are Finance, insurance, and real estate:
Transportation, communications andutilities; Construction,
and Agriculture and mining.
Table 12 about here
Table 13 summarizes the relitionship of industry With
employer job recruitment methods within private'and public
sectors. Each recruitment method ti used' as a dependent °
variable in a regression analysis and the independent varia-
bles are one industry dichtomous variable, size of estab-
lishment, city size, percent with no college in the job and
.percent male in the. job. Each set .of three coefficients lb,
B, F) in Table 13 is from a separate, regression equation
using a particular combination of recruitment method and
industry category in the analysis, along with the remaining
four control variables.
Table 13 about here
37

PAGE 35
We will descrike the major.results of Table 13.in two
ways. First, .we will discusi each separate industrial .catei-
gory and examine the recruitment methods that are used more4
than in other sectors and the methods that. are used less by
comparing B and F statistics down the columns of each indus-
trial category. Second, we will examine each recruitment
method separately and highlight the industrial.categories
where it is used especially frequently and.the categories
where is used leatt, by comparing b and F statistic*
across the rows of Table 13. We will focus on the large
statistically significant values in Table 13.
Beginning with the Agriculture and mining category in the
private sector, no method stands out for greater use, but.
several methode`. (especially media ads) are used less to
recruit new workers than in other'industries. The Construc-
tion industry is where union referrals stand out as the
characteristic recruitment method, with all other methods
being used less frequently' than in othsr in,tries. Pri-
vate manufacturing industries use public employment services
and community groups more frequently, and use of friends,
school placement, professional organizations and walk-ins
less frequently. Private Transportation, communications and
utilities use community groups and unions somewhat more;
media ads less. Private wholesale and retail trade indus-
tries use much more walk-ins and much less public employment
services, unions and professional organizations. Three.

PAGE 36 ,;. methods are more frequently used in private:Pinancevinsu-
1
1
rance and real estate industries: private employment agen- .
cies, friends of employees, and community action groups.
The private Service industries, including schools.and hosPi-
tale, make especially heavy use of processional or§aniza-
tons or periodicals, media ads and school or college place-
ment services in their recruitment, and less use of public
employment Cervices and community groups. Industries, clas-
sified as Public adpinistration are not a significant part
of our private sector sample.
In the public sector, ye discuss the three industrial
categories where we have our largest sample. In the Trans-
.. rtation, communication.and utilities categoryAincluding
the .3.Postal Service), compared to other public sector .
industries, somewhat. less use is.made of walk-ins or public
employment services to recruit new workers.
. In the Service and the Public administration categories
of public sector industries, we see opposite patterns in the
use of methods. For-services, Civ4l Service applications
and putii4cLemployment services are used much lees than by.
other ub is employers, while unsolicitied:applicants are
used e ewhat more. A closer examination .of the industrial
.codefunderlying this comparison shows that methods used to
recruit public school teachers largely'accounts for this
contrast among public employers.
33. .

PAGEi37
On the other hand, the Public'adminitration category of
the pubic sector shows a much greater emphasis on using
civil service pplications,. somewhat greater emphasis on °!
using public employment services and somewhat less use-of
unsolicited applicants, compared to other public employers...
Government officials and workers in this, category are the
positions that primarily account for these results.
"Y's.
f
We now go back over the results of Table 13" tojhighlight.:
the industrial.categories whtre each recruitment particu-'
larly stands out. In the private sector:
1. Friends of emOloyees a e.used,more frequently in the
Finance, insurance and repl es ate catgegory. (including
banking), and used less in manufacturing.
School placement.strviceS are used more in Service
industries and in the Finance, insurance and real estate
category, and used less in.construction and manufacturing.
industries. 111114k7t
3. Professional organizations and periodicals are used
more frequently in Service industries and leap in the whole-
sale .and retail, trade category.
4. Public employment services are more often used in
Manufacturing, and less often in Trade and Service catego-
riles.
4

'PAGE 38
5. Private employment agencies stand out in the Finance,
insurance and real estate category, and less often in Ser-
vices and Trade industries..
6. Community ac4on groups are used more to recruit new
. workers in the Finance, Manufacturing, and TrAnsportatioft,
communication and utilities categories, and less in Services
and Constructiol industries.
7. Media ads are more frequently used to recruit in Ser-
vice industries and less often in Transportation, communica-
tion and utilities.
8. Use of unsolicited (walk-in) ap .icants is much more
typical in retail and wholesale trade ustries and some-
what less typical in the Construction, anufacturing and
Transportation categories.a
. 9. Unions stand out in Construction and Transportation
and are leis common to recruit workers in the Trade and
PinanCe categories.
In the public sector, constrasts in the use of reciuit-,
ment methods are mainly between the Service and Public
administration categories, where Civii/Service and public
employment services characterize the latter and unsolicited
applicants characterize the former.
.0
I
'PAGE JV
5.3 Specific lot traits
Our analyses have focused on two aspects of jobs (educa-
tion level and sex composition) to study the use of differ-
ent employer recruitment methods. But it is likely that
other .aspects of the job, such as the need for particular
worker may be related to employer methods
after the education level and sex composition of the job are
taken into account. We will use cannonical correlation
analyses of 17 job, traits that were rated tly employers for
...each sample job in our survey to investigate this issue.
Each employer was asked to rate each of 17 job traits on
a four point scale from `extremely important' to 'not at all .
important,' with they following survey question.4
when you area looking for new workers to fill the SAMPLFjob, how important is it that they....v_le,
...work well at a set routine-schedule; that-is, are
METHODICAL?
...are able to work well with their hands; that is hay.;
MANUAL DEXTERITY?
...are able to learn new things quickly; that is, are
QUICK LZARNERS?
...are able to read materials about as difficult as the
daily newspaper; that is, have BASIC ADULT LITERACY?
...are able to read complex written materials; that is,
are ADVANCED READERS?
...are able to accuratel, add, subtract, multiply anddivide; that is, can PERFORM BASIC ARITHMETIC?
...are able to handle complex numerical calculations;that is, are EXCELLENT AT MATH?
...have prior knowledge of how to perform the specificduties of this job; that is, have SPECIALIZED KNOWLEDGE?
N
BEST COPY42

0
PAGE 40
...are able to,make a good impression' outside the organ-ization with clients or customers; that is, are good atCLIENT RELATIONS?
...are likely to stay with the organization for a longtime; that is, will have PERMANENCE? .
...are likely to move up within the organization tohigher level jobs; that is, have GROWTH POTENTIAL?
...are able,,to get along well with people; that is, areGOOD TEAM MEMBERS?'
...will easily accept supervision; that is, have the?ROPER ATTITODES about work and supervisors?
...can be counted on to come to work regularly and ontime; that is, are DEPENDABLE?
...can deal with new complex situations; that is, haveGOOD JUDGMENT?
...can provide direction and leadership; that is,.CANSUPERVISE?
...have OTHER lualifications? (PLEASE SPECIFY).
Tables 14 and 15 present the results of cannonical corre-
lation analyses using the 17 job trait measures. We will.
investigate how the percent of variance accounted for by the
ten employer recruitment methods changes as we use different
combinations of job traits and job composition measures.
Tables 14 and 15 about here
The first. column of Table 14 gives results for the pri-
vate sector. Row 1 shows that when ten recruitment methods
are used in a cannonical analysis to predict the percent
with no college in the job and the percent male in the job
t'le percent of variance accounted for by the cannovical

PAGE 41
equation equals .20682. Row 2 shows that when the measure
of the single-job trait of "Methodical" is added to percent
no college and percent male in a cannonical analyses with
the same ten recruitment methods as.predictor variables, the
percent of variance accounted for by the cannonical equation
increases slightly to .216183. Each of the remaining rows 2
through 18 show the amount of 'variance accounted for by the
best fitting cannonical equation where a different mesure of
one job trait is added to percent no college and percent
male in the job in a prediction equation with the same ten
employer recruitment methods.
The same analyses are shown for the public iectorin the
second column of Table 14. We also present paralleiwanaly-
ses in Table 15 where "percent in the job. with a college
degree" replaces 'percent in the job with no college' for
every estimated equation. Although these measures are
highly related in a negative direction, we repeat the analy-
ses in Table 15 to check whether the pattern of results
changes when we distinguish the educationally most demanding
jobs from all others rather than distinguishing the least
demanding jobs from all others.
Rows 19 through 23 of Tables 14 and 15 present estimates
of the partitioning of variance explained by recruitment
methods among job composition components and job traits.
(These analyses use the same type of calculations described
44

PAGE 42
earlier for Table 9). Row 19 gives the total variance
accounted for by ten methods predicting both job composition
measures and all 17 job trait measures. Row 20 presents .the
variance accounted for by predicting only the 17 job traits.
Rows 21, 22 and 23 ptesent the unique and joint proportion's
of variance explained.
we draw the following conclusion from Tables 14 and 15:
1. Job composition measures (education level and sex
composition) and job trait measures have some common rela-
tionship to the kinds of recruitment methods used by employ-
ers to fill job vacancies, but some lob traits reveal addi-
tional impact on the recruitment methods.
The 17 job traits are more strongly related than the two
job composition measures to differences in job recruitment
methods (row 20 versus row 1). But the two sets of varia-
bles overlap considerably in their ability to account for
variations in recruitment methods, as seen from the bottOm
three lines. We estimate that the joint contribution of job
composition and job traits in accounting for job recruitment
difference is about half of the total variance explained
(line 23). The unique contribution of job composition meas-
ures it the equations is estimated to be between 12 and 15
percent (line 22), while the unique contribution of job
traits is estimated to be between 30 and 40 percent. In
other words, when we characterize jobs only by their educa-
45

PAGE 43
tion and sex composition, we can account for Oetween AO and
70 percent ofthe variance in job recruitment methods, com-
pared to the predictive power when 17 job traits are also
available with eduaction and sec composition to measure job
differences.
2. The specific job traits which add most to accounting
for recruitment methods beyond what is picked up by job com-
position are client relatiOn s, advanced readings and good
judgment in the priiate sector; and supervisory skills, good
judgment, and basicarithietic in the publii sector.
An inspection of each of the columns of Table 14 and 15
reveals which individual job traits.add most explanatory
power to the equation. we indicate the rank order *song the
-17 traits in parentheses on each line.
3. Our understanding. of the particular recruitment meth-
ods thm. are used more often to target each specific trait
may be helped by a comparison of the cannonical weights
associated with each variable for the first equation esti-
mated for ten methods with two job composition insures
(equation associated with line 1) versus the weights for
equations where one job trait is added to the equation
(lines 2 through 18). In addition, the inspection of
weights for variables in a follow-up cannonical equation on
residual variation may be helpful, if the weight for the job
trait measure stands out from the job composition measures
4b
PAGE 44
in the particular equation. Thep* analyses will be the sub-
ject of further research.
I; R,Q,Y s Recruitment And Inn Alarall lathndaWA Maid tQ Bus and Ethnic ChAtantaxiatina
anlk And inalinAnte
We can also investigate whether the methods used to match
job openings-with job applicants differ for racial or ethnic
minorities, when other characteristics of the job and appli-
cant are taken into account. Do blacks and Hispanics have-
equal access to the information about job vacancies and have
equal opportunities to become candidates for the positions
for which they otherwise qualify?
We address this question with analyses that use race of
job and job applicant to parallel our earlier investigations
of the determinants of sex composition of jobs. First, we
examine relationships in the public and private sectors
controlling for sex and education levels. Table 16 summa-
rites .multiple regression analyses'to estimate how each
employer recruitment method is related to percent black or
percent Hispanic in the job, controlling for percent male in
the job, percent with no college in the job and sector.
Tables 17 and 18 report cannonical correlational results
concerning employer recruitment methods. Table 19 presents
results from multiple regression analyses of employee job
search methods.
47

PAGE 45
Second, we will look at relationships' within fixed cats-.
gories of the .education level of the job. Tables 20 and 21
present these. results.
L.1 lima and atlas =Rata. controlling fasiz i. s ,and
The following conclusions are drawn from Tables 16, 17,C.
and 18:
1. in the private sector, jobs with'higher percent black
composition are strongly related to the use of community
action or welfare groups as an employer recruitment method.
Table 16 shows this finding in in row 8 for the Private Sec-
tor. This,is substantiated in Table 17 where the third can-
nonical equation (CANV3) associated mostly with job race in
the Private sector (row 13) has one recruitment method (row
7) that is much.larger than any others In the same column
and row: use of Community groups. This cannonical correla-
tion result indicates that the use of community groups is a
recruitment method primarily related to the race composition
of the job.
The other method in the private sector with an especially
strong association with job race composition is use of media
ads, which is newitively related zo jobs with larger black
concentrations.
48

J .
4
PAGE 46
2. In the public sector, no method really stands out as
one producing large independent impacts on the race composi-
tion of jobs. There is some indication in Table 16 of a
negative impact of use of media ads or professional organi-
zations-On-produ-cing-tilter-black -r ep-r esentation --in 101:91;-
But, in Table 17, no cannonical equation associated with
race-of job passes conventional levels of statistical signi.
ficance.
3. The Hispanic composition of jobs in the private sec-,.
tor is not'clearly related to recruitment methods that are
independent of other job composition factors. Table 18,
which reports three stages of cannonical analyse's in the
Private Sector, produces no equation with a high weight for
Percent Hispanic in the Job (row 13). The onlyAitatisti-
cally significant value in TAble 16 associated in the Pri-
vate Sector with Hispanic composition is the netagive effect
of use of media ads (row 18).
4. .' In the public sector, the use of community action or
welfake groups has a clear positive relationship to Percent
Hispanic in the Job. This can be observed in Table 16 for
the Public Sector (roW 17) and in Table 18 for the third
equation in tthe Public Sector (CANV3, row 7). There is also
some suggestion from the cahnonical analyses in Table 18
that using friends of employees to fill Public jobs has a
positive impact on Percent Hispanic, and using Civil Service
49

\\
PAGE 47\
applications has a negative iiOact,':but these suggestions
are not substantiated in Table 16 results.
5. Analyses that use employee search iethods have few
silmilarities to the results just reported from analyses of
employer recruitment methods. Table 19 shows the results
from regressions using employee data. For example, in con-
trast to earlier Tables, Table 19 suggests that blacks and
Hispanics use public employment services more than whites to
obtain private sector jobs.
As we concluded earlier, the employee reports may be
especially useful for learning about informal methods of
finding jobs, such as use of friends and relatives or in
direct applications (walk-ins). Table 19 does not indicate
race and ethnic differences in these factors, with the pos-
sible exception of less frequent use by blacks of direct
application in the private sector.
0..2 Race Ana ethnic effects mithin education 122:34
As was true with our study of sex differences, some
interesting race and ethnic patterns emerge when we examine
jobs within fixed categories of education level. Table 20
presents results for percent black in the job and Table 21
presents results for percent Hispanic in the job.
1. with regard to methods associated with higher black
compositions in private sector jobs, Table 20 shows that use

PAGE 48
of community groups (positive) and media ads (negative) halie
impacts at each education level. The strongest method, use
of community groups may even grow..in importance for produc-
ing blacks in jobs as the education level of the position
increases (comparison of b across row-7).
Table 20 also suggests two methods that are only impor-
tant for college degree private sector jobs in relation to
percent black in the position. First, use of friends of
employees as a job recruitment methdd is negatively related
to percent black in this category, suggesting that the
informal networks in operation are mainly useful to whites
at this level. Second, when union, referrals are used to
recruit workers for college degree jobs (which ia"not,
\often), they tend to produce higher black compositions.
2. In the public sector,,there is no method that consis-
tently produces a significantly higher black percentage for
all eduction level categories of jobs.
In the public sector at the college degree level only, we
note that use of friends of employees is negativel related
to percent black in the job, just as .was true int e private
sector at this level. Informal social networks apparently
help whites get college level jobs more than blacks. That
is, the social networks to which white are attached ate more
useful for access to higher level jobs than the social net-,
?
works to which blacks are attached. "We will furthrlexamine
51

PAGE 49
the issue of the °quality" of the social networks used by
blacks to obtain jobs in the next sectipn of this paper. We
will examine the type of /6 obtained by bl'acks who use
segregated black social networks versus blacks who use
desegregated social networks that includi white friends to
find jobs.
w
3. 'In terms of private 'sec or methods that'produce
higher Hispanic concentrations in jobs, no single method has
a conAistent impact across all education levels of jobs
(Table 21).
4. in the public sector, the use ofcommunity groups may
produce a stronger relationship with Percent spanic as the
education level of the job increases (comparison of values
across row 17 of Table 21).. It 'looks as if use 'of copmunity
groups is an especially useful method for Hispanicd to fill
higher level jf4.:, However, thej-ici of community ,groups
is not very strongforjEispakics at any given educa4on%'- - 0level of jobs.
Use of Civil Service,appl cations in the public sector
appears to have a negative impadtin producing high Hispanic
concentrations in high.school level jobs, while the reverse
may be true for college level jabs (row 14, Table 21);
52
. 10

JP
A
PAGE 50.'
6.4 A zlaisz look' at blask um sit aaciAl 1124241.1.
In our discussion of Table,20, we noted some interesting
interactions of racial differences in the use of informal
.. social networks and the educational_ level: of _the__ job: -co -
lege level jobs that age-filled by the use of infOrmil net-C
works are less'likely to have black workers, indicatilwthat
college level jobs that have fewer' black incuabents tend 'to
use white social networks or recruiting applicants, and
these networks are not as accessible to black ob seeker.''
For lower, lei/el jobs, no significant relationship was
observed in Table 20 between an .imployer's of social
networks to fill' the job and percent bla
will now look closer at race effects
networks, by examining the questions,
vidual survey concein)ing the'use of friers
ob. We
of social'
the indi-
d a fob. cio
Il
Table 22-shows the percent of workers who reported uhii,
friends or relatives to find theiirjob, tabulated, by eag.
sex and education level of the worker and sector of the 4.
is a ,clear ordering of percentages according to ed ca-
tion -level of the worker in the private sector: social, net-,
works are used more by workers at lower levels of education6
than at higher levels. There 'is also an interesting ,pattern
of race differences: for the mootpart whites use socialA
networks more frequently than blacks to find jobs in the
privatg sector, but blacks use social networks more than
<

IfI
N7. % PAGE 51
whites to find =laic sector jobs. The.race differences in ,
the private sector favoring whit. use of social networks are
especially pronounced.for maies. The ace differenpes
favoring blacks use of friends or relatives in the public
sector are largest at the college degree-level. (The rever-
sal in the race pattern in the public sector is probably due
to some bias of reports in the category of black males with
some college that fdilsi fit the expected education trend
or otherreasonable patterns of percentages):
The race contrasts in Table 22 can be interpreted like
the patterns notein Table 20: where jobs are more domi-
nated by whites, the social networks used in recruitment
will be white, so that blacks 1411 be more deprived of, -
access. to the useful information and contacts such networks...
provide. In the case of: Table 22, private jobs have a..
higher percentagefof white workers creating wore white chan-
nels of informal job search connections in the private sec-
tor and more black networks in the public sector Th s con-
tributes to theiattern where social networks are mo e
-useful to whites than blacks for finding private sector
jobs, while tie opposite race pattern is usually observed in
the pubilc,secior.
In Table 23, we focus entirely on black workers who are
high school graduates (with no college) to compare the kinda
of iobs obtained by using social networks of different
54

PAGE 52
racial cwapositions. Although we have no direct information
on whether the friendship networks used by blacks to find
jobs are segregated (mostlNblack, riends) or desegregated
(includes white friends) we may he able to get at this dis-
,
Unction indirectly. In Table 23, ,we use combinations of
categories of whether the black worker used friends to find
Ca
the job (column 1) and whether the black worker graduated
from a segregated or desegregated high school (column 2) to
infer the type of informal friendship networks accessible to
each worker and used by each worker. In column 3 of Table
23 we infer different types of social networks from the
variable cross-classifications in column 1 and column 2, to
study the kinds of jobs blacks obtain in each case. Table
23 presents these measures of the type of job: the average
percent white of coworkers in the same job (column 4), the
average percent white of co-workers in the same firm (column
5), the average hourly wage now paid for the job as reported
by the employer in 1983 (column 6), and the average hourly
wage paid earlier in the job as reported by the entry-level
employee in 176 or 1979. There are clear differences of
job type shown in Table 23 depending on whether the black
worker had access to black or white friendship networks and
used them to find the job.
Looking first at the black males, we find that those who
used desegregated social networks (row 4) get the highest
paying positions in firms and jobs with the highest percent
5~

PAGE 53
of white co-workers. Those black male high school graduates
who used segregated black social networks (row 3) on the
average 9,% the lowest paying positions in firms and jobs
with the lowest percentage of white .co-workers. Those black
males who did not use social networks to find their job
(rows 1 and 2), fall in between the other groups in pay
level and desegregation of co-workers. Put another way, the
value of social networks for finding good jobs by blacks
depends upon the kind of social networks being used: black
friendship networks lead to poorer paying more segregated
jobs (it is better to use other job search techniques) and
white friendship networks lead to better paying less segre-'
gated work.
The bottom half of Table 23 (rows 5 through 8) report the
results for female black high'school graduates in private
sector jobs. There are no large consistent differences in
average job pay that depend upon use of social networks for
black females. But the same patterns for racial composition
of co-workers that we observed for black males are also true
for black females. Those who use desegregated networks have
the highest.percent white co-workers, those who use segre-
gated networks have the lowest percent white co-workers, and
those who do not use social networks fall in between.
The wage pattern interpretation is clearest from theemployer data (column 6). The highest paying job on theaverage is consistently found to come from use of desegre-gated networks (columns 6 and 7), but the lowest paying jobinterpretation depends upon the measure being used.
r

PAGE 54
=aux And Alumni= al las And &Julia Ws=
The most important race and ethnic differences in methods
tbroigh which individuals become candi Ites for job openings
may be in the glual,ltv, of the method rather than in the Ins
of method used !in the job recruitment and job search pro-/
ceases.
We found few overall race and ethnic differences in type
of method that were not primarily due, to contrasts in educa-
tional level of different jobs and social groups. Except
for the use of community groups in the private sector as a
method that produces jobs with higher black representations,
and the use of community groups in the public sector as a
method that produces jobs with higher Hispanic concentra-
tions, our analyses do not indicate large consistent race or
ethnic differences in access to jobs through alternative
recruitment methods. Although there were no overall latge
race differences in the use of informal networks of friends,
we did find race differences in how such informal social
networks were use to match workers With particular job
vacancies.
Use. of friends of employees to recruit job applicants was
negatively related to black representation in college level
jobs in both the public and private sectors. T11°,a finding
suggests that the quality of information and contacts within
particular methods that may be more important than the sim-
57

PAGE 55
pie use of a*method. In this case, the social networks used
by whites appear to carry more useful information and con-
tacts for access to college level jobs.than do the social
networks used by most blacks at this education level. Pup-
thermore, we observed opposite racial patterns in private
and public sectors in the level of use of social networks to
find jobs. Whites used friends and relatives more freo.
quently than blacks to find private sector jobs, while
.blacks used these methods more frequently than whites in the
public sector. we interpreted this difference to be the
consequence of the greater concentration of white workers in
the private sector that produce segregated white social net-
works used by white job seekers in this sector, and the con
verse pattern of black concentrations and segregated black
informal job networks used by blacks in the public sector.
Similarly, the racial composition of social networks was
a factor in our further investigation of the types of jobs
filled by black high school clraduates in the private sector.
tack males who used desegregated networks found higher
average paying jobs in less segregated firms, while those
who used segregated (black) networks became employed in
lower paying more racially segregated jobs, and those who
did not use social networks were between the other two
groups.

PAGE 56
Taken together, it appiars from our results that there
are important race and ethnic differences in the first stage
of the employment process that derive from the quality of
recriutment and job search methods to which the different
groups have access.
1. Summary And Discussion
Our investigations of how employers recruit new workers
indicates some general ways that education plays a major
role in career processes and some areas where the school's
role is weak.
First, education level of the job is a major determinant
of what job recruitment methodi and job search methods are
used. Education level is much more important in this regard
than sex, race, or ethnic factors. Education level alone
also picks up a majority (from 60 to 70 percent) of the var-
iance explained in job recruitment methods by various meas-a
ures of job traits.
we find that jobs usually held by individuals with higher
education levels are filled more often by School placement,
Professional organizations, Private employment agencies, and
Media ads. At the other end of the education spectrum,
lower level jobs are more often filled by public employment
services, community groups, walk-ins and unions.
59

PAGE 57
Second, the specific method associated with educational
institution --placement services conducted by schools or
colleges--is often used for matching individuals to higher
level ( college) jobso'but infrequently used otherwise. When
school placement services are used to fill high school level
jobs, it is primarily for office jobs filled by females.
Some evidence exists that females and minorities experi-
ence unequal access to job recruitment methods used by white
males at the same education level,' but we do find differ-
endes in recruitment methods and employment. Black are
proportionally much more likely to work in public sector
jobs and to use community groups to find private sector
jobs. Blacks also seem to have less useful social contacts
to find higher level jobs, for private sector jobs, and for-
some higher payingjobs in desegregated work enviroyments.
Jobs filled by women make less use of union referrals and
more use of'direct applications'and media ads.
4

PAGE 58
References
Becker, H. J.
1977 How Young People 7ind Career Entry Jobs: A
Review of the Literature. Baltimore: Center
for Social Organisation of Schools, Johns Bop-
kins.University.
Berg, I. (Ed.)
1981 Sociological Perspectives on Labor Markets.
New'York: Academic Press.
Black, M.
1980 An Analysis of Youth Job Search and Geographic
Mobility. Washington: D.C.: Mathematics
Policy Research.
Boudon, R.
1974 Education, Opportunity, and Social Inequality,
New York: Wiley.
Cooley, W. & Lohnes, P. R.
1971 Multivariate Data Analysis. New York: Wiley.
England, P.
1918 "Assessing trends in occupational sex segrega-
tion, 1900 - 1976.' Pp, 273-296 in Berg, I.
(Ed.) Sociological Perspectives on Labor Mark-
ets. New York: Academic Press.
61

PAGE 59
Fernandes, J. P.
"981 Racism and Sexism in Corporate Life: Changing
Value* in American Business. Lexington, MA:
Lexington Books,
Friedman, T. & Williams, E. R.
1982., "Current use of tests for employment" Pp.
99-169, in Wigdoz, A. K. & Garner U. R. (Eds.)
Ability Testing: Uses, Consequences and Con-
troversies. Washington, Natirlal Academy
Press.
Granovetter, N.
1974 Getting a Job: A Study of Contacts and
Careers. Cambridge, MA: Harvard University
Press.
Granovetter, M.
1981 *Ttward a sociological theory of income differ-
ences° Pp. 11-48 in Berg, 1. (Ed.) Sociologi-
cal Perspectives on Labor Markets. New York:
Academic Press.
Jencks, Christopher et al.
1979. Who Gets Ahead? New York: Basic Books,
Kalleberg, A. L. & Sorensen, A. B.
1979 The sociology of labor markets. Annual Review
of Sociology, 5, 351-79.
62

MGR 60
Lippman, S. & McCall, J.
1976 'The economics of job search: A survey.".Eco-
nomic Inquiry, 14, 155-189.
Y.Partland, J. N. 41.Crain, R. L.
1980 6RAciai discrimination, segregation, and pro-.
ceases- of social mobility.' Pp. 97-125. In
Covello, V. T. M.) Poverty and Public Policy.
Boston: G. N. Ball.
NcPartland, J. N. & Humphrey, R.
1984 Procedures to Construct a Nationally Represen-
tative Sample of Employers Linked to the Jobs
Held by Respondents to the National Longitudi-
nal Survey. Baltimore: Center for Social
Organization of Schools, Johns Ho;:ans Univer-
sity.
Panel on Secondary School Education for the Changing Work-
place
1984 High Schools and the Changing Workplace: The
Employers' Iiew. Washington, D.C.: National
Academy Press.
Rosenbaum, J. E.
1984 Career Nobility in a Corporate Hierarchy. New
York: Academic Press.
63

PAGE 61
Sheppard, B.' L. & Be Malty, A. It.
1966 The Job giant, Job Seeking Behavior of
Unemployed Workers in a Local Economy. Balti-
more: The JOhns Ropkins Press..
Sorensen, A. G. .A Kalleberg, A; L.
1981 ''An outline of a theory of the matching of per-t
sons to jobs." Pp. 49-74 in Berg, I. (Ed.)
Sociological Perspectives on Labor Markets.
Nev York: Academic Press.
Schmidt, P. L. & Bunter, J. E.
1981 "Employment testing: 014 theories and new
research findings." American Psychologist, 36:
1128-1137.
Sorensen, A. B. & Ealleberg, A. L.
1981 Outline of a theory for the matching of persons
to jobs. In Berg, I. (Ed.) Sociological Per-
specstives on the Labor Market. New York:
Academic Press.
Tenopyr, M. L.
1981 The Realities of Employment Testing,' American
Psychologist, 36: 1120-1127.
114:apson, B.
1984 Cannonical Correlation Analysis: Uses and
Interpretation. Beverly Rills, CA: Sage.
O
Thurow, L. C.
PAGE 62
, 1975 Generating Inequality. New York: Basic Books.
U.S. Department of Labor
1975 Job- seeking Methods-Used by AmericanWorkets
(Bulletin 1886). Washington, D.C.: U.S.
Government Printing Service.
Warwick, P. V.
1975 Cannonical Correlation Analysis. Pp. 515-527k
In Hie, N. H. et al. SPSS (Second Edtion) .
New York: McGraw-Hill.
Wielgorz, J. H. i Carpenter, S.
1984 "The effectivenes of job search' and job finding
methods of young Americans.' Pp. 90-126. In
Baker, P. et al. (Ed.) Pathways to the Future,
Vol. IV. Columbus, OH: Center for Human
Resource Research.
Wigdon, A. K. 4 Garner, W. R. (Eds.)
1982 Ability Testing: Uses Consequences, and Con-
troversies. Part II: Documentation Section.
Washington, D.C.: National Academic Press.
U.S. Department of Labor
1976 Recruitment, Job Search and the Unites States
Employment Service (R & D Monograph 43). Wash-
ington, D.C.: U.S. Government Printing Ser-
vice. 65

ca.
100
90 -
80 -
70 -.
60
50.-1/4
40-
30
20
10
0
63
Figure 1
ployer Recruitment Methods for Private Sector MaleJobs
Sch
r4
Prof CS Pub Fri. . Comm Ads
Education Level of JobHigh School t.Col leg*
Mt.
r
Walk.
Fr - Friends of Employees Fri Private Employment Serv.
Sch School Placement Comm Community Groups
Prof Professional Organizations Ads * Media Ads
CS * Civil Service Walk .0 Walk-ins
Pub * Publi: Employment Serv. Un * Unions
6 6

TAOLL
Percent of Lmplqyers Who Ih u Different Job Recruitment Methods., and
Percent of Employees Who Use Different Job Search Methods,
by Employment Sector
5
QOM
1
Employer
Total Private Public IPah.-Pr.Sector Sector ' t-statistic
(N=3389) (N=530) (N=859)
'1. (Rank) (Rank) % (Rank)
Friends 34.5 (2) 38.6 (2) (b) -8.40***,
Relatives
Fric-ds
School placement service 26.0 (5) 24.5 (5) 30.4 (4) 3.77***
Professional organizations 8.9 (7) 7.7 (7) 12.2 (8) 3.91***
Civil Service 11.1 (8) 2.7 (10) 35.5 (2) 29*21***
Public employMent service 27,8 (4). 27.0 (4) 30.1 (5) 1.48
Private employment service. 5.9 A9) 7.0 (8) 2.4 (10)-4.95**
Community groups 14.0* (6) 11.6 (6) 20.9 (7) 6.78***
Media ads 33.2 (3) 33.6 (3) 11.9 (3) -0.88
Direct application (walk-in) 60.0 60.4 (I) '')6.8 (1) -0.79
Union referral 5.7 (10) '5.9 (9) ,4.6 (8) -1.47 4
/1
*** p<.001
** p <An
A . p 4;05
Sum as 2.271
Employee
Total Private Public 'Pub.-Pri.
Sector Sector t-statistic .
(W-3810) (N42900) (N=910)
6.
(Rank) % (Rank) %,(Rank)
15.8/16.8
19.0 (2) 29.3
8.'3 (4) 7_.37,
1.4 (8.5) a .4
4.9 (6) 0.4
6.9 6.2
3.7 (7): 4.7
0.9 (10). 0.5
11.0'(3) 12.4
3).3 (1') 37.7
1.4 (8.5) 1.7
1.212.
12.8 -2.82**
(2) 27.7 (2) -0.96
(4) 14.0 (4) 6.13***
(8)
(10)
1.5
19.0
(8) 0.28
(3) 24.37***crlorb
(5) 9.0 (5) 2.92**
(6) 0.7 (9) -5.59***
(9) 2.0 (7) 4.16***
(3) 6.8 (6) -4.68***
(1) 36.2 (1) -0.82
(7) 0.4 (10)-2.81**
6?
SIP 1....../...1
1 CI
6011111....

TABLE 2
Correlation between Employee Job Search Methodsand Employer Job Recruitment Methods Used for the Same Job
Employee Methods
Employer Methods
1 2 3 4 5 6 7 8 9 10-11
1. School placement service .133 .085 .044 -.034 .031 -.004 -.011 -.0'...0 -.004 -.024
2. Professional organizations .070 .086 -.001 -.046 .019 -.012 -.002 -.025 .000 .014
3. Civil Service -.032 .^35 .462 .001 ....071 -.074; -.014 -.068 .014 -.125
4. Public employment service -.037 -.016 .025 .074 .005 .015 .005 -.044 -.016 -.034
5. Private employment service .040 .055 -.033 .026 .201 .,022 .045 -.006 -.010 .024 anum
G. Community group -.003 .008 .029 .042 -.007 .064 .025 -.014 .005 -.034
...
7. Media ads .027 .025 -.028 -.013 .053 -.002 .145 .016 -.023 .006
8. Direct application (walk-in) .068 .030 -.040 -.058 -.058 -.006 -.010 .049 -.030 -.014
9. Union referral -.055 -.040 -.043 -.045 -.034 -.046 -.030 -.072 .188 -.022
10. Relatives -.096 -.075 -.024 .014 -.069 .004 -.092 -.020 .039 .003
11. Friends -.040 -.008 -.018 .012 -.053 -.001 -.006 .002 .017 .051

TABLE 3
Percent of Employers Who Rank Each Joh
Recruitment Methods as "Most Important" and as
"One of Three Most Important", by Sector
(N=1945)
Percent:Most Important
Method
Percent:One of Three
Most Important Methods
Total PrivateSector(Na1362)
PublicSector
(583)
Total
(N =1945)
PrivateSector(Ii=1362)
PublicSector(Na583)
T-test(Pri-Pub)
1. Friends of employees 17.1 20.6 8.9 50.4 55.7 33.4 -10.05***
2. School placement service 9.5 8.5 11.7 31.1 30.6 32.1 0.64
3. Professional organizations 1.7 1.8 1.7 14.1 13.5 15.6 1.22 0101
Civil-Service_ 9,2_ 2.9 23.8 16:0 8.0 34.8 15.66i**
5. Public employment service 12.3 12.8 11.1 35.6 35.8 35.0 -0.35
6. Private employment service 2.5 3.5 0.2 9.3 12.0 2.9 -6.41***
7. Community groups 0.9 0.4 1.9 11.0 9.7 14.1 2.83**
8. Media ads 18.4 20.4 13.7 43.0 45.3 37.7 -3.09**
9. Walk-ins 19.6 21.6 15.1 57.1 57.i 56.6 -0.30
10. Union referrals 1.2 1.7 0.2 3.6 4.6 1:4 -3.46**
11. Other 7.5 5.7 11.7 12.6 9.8 19.0 5.65*
a** p 4e .001
a* p ef .01
*gyp .05
72

67
TABLE 4'
Summary of Factor Analysis of Employer
Recruitment Methods, by Employment Sector
Private Sector
Varimax Rotated Factor Matrix
Communality.Factor 1 Factor 2 Factor 3
1. Friends of employees .10036 .00147 .25265 .07391
2. School placement serv. .44576 .14948 .13215 .23851
3. Professional orgs. .74060 .04874 .02908 .55171
4. Civil Service .24336 .26595 -.02051 .13037
5. Public empl. serv. .12555 .48937 .13670 .27394
6. Private empl. serv. .46983 .08306 .03800 . .22909
7. Community groups .08912 .
.83377 .34698 .82351
8. Media ads .33036 -.02724 .24756 .17117
9. Wilk-ins -.00412 .07593 .31801 .10691
10. Unions -.00928 .29258 -.17303 .11563
Public Sector
11. Friends of employees .08519 .17593 .28219 ..11784
12. School placement serv. .12467 .54940 .21605 .36406
13. Professional orgs. .04376 .79359 .10119 .64194
14. Civil Service-.13225 -.22040 .08953
15. Public empl. serv.
..15318.71507 .13582 .03111 .53074
16. Private empl. serv. .22445 .25189 .05523 .11688
17. Community groups .646C? .11722 .05978 .43475
18. Media ads.29861 .36207 .16053 .24603
19. Walk-ins. 112 .05392 .68497 .54707
2U. Unions \
..4'.,d3 .b6044 ..14926 .09554

68
TABLE 5
Summary of Multiple Regression Analyses ofDemographic Characteristics of Job on Employer
Recruitment Methods, with One Control Variable*, by Sector
(b unstandardised regression cooff 6 standardised regression coeff.)
Independent Variable(Job Recruitment Methotl)
Private Sector (N3100)
Dependent Variable
Percent Malein the Job
b 3 I F
Percent with no Collegein the Job
(1) (2) ; (3) (4) (5) (6)
. Friends of employees -.0094 -.029 (2.6) .0012 004 (0.0)
2. School placement serv. -.0256 -.00 (18.1) -.0920 -.299 (303.4)
3. Professional orgs. -.0054 -.013 (0.5) -.1140.. -.295 (298.3)
4. Civil Service .0176 .031 (2.9) -.0239 -.043 (5.91
5. Public empl. serv. -.0054 -.018 (1.0) .0435 .152 ,73.8)!
6% Private empl. serv. -.0079 -.018 , (1.1) -.0726 -.180 (104.8)
7. Community groups -.0110 -.030 (2.9) .0186 .053 (9.1)
8. Media ads -.0269 -.081 (25.3) -.0477 -.168 - (90.2)
9. Walk-ins -.0340 -.103 (33.5) .0179 .056 (9.9)
10. Union referrals .0698 .162 (83.2) .0317 .076 (17.9)
Public Sector (*978)
L. Friendeof employees -.0113 -.038 (1.4.) -.0072 -.023 (0.5)
12. School placement serv. -.0189 -.069 (3.9) -.1160 -.410 (196.8)
13. Professional orgs. .0216 .066 (3.8) -.1192 -.352 (138.6)
14. Civil Service -.0173 -.080 (6.2) .0388 .174 (30.3)
15. Public empl. serv. -.0062 -.024 ,(0.5) .(,372 .138 (19.1)
16. Flrivate empl. serv.
17. Community groups
.;.0269
.0068
-.05,2 (2.2) -.0039
.024 (0.6) .0296
-.007.100
(0.0)
(0.9)
13. Media ads .0077 .029 (0.8) -.0362 -.121 (1;.1)
l. Walk-ins.0. Union referrals
-.0188.0268
-.062.061
(3.8) .0078
(3.6) .0145
.025
.032
(0.6)(0.9)
:Then "Percent Male in the Job" is the dependent variable, "Percent with no College" is the
control variable; when "Percent with no College in the Job" is ti.e dependent variable,
"Percent Male" is the control variable.
7,1

69
TABLE 6
Sumaary of Multiple Regression Analyses ofJob Search Methods on Individual's Sax and Educational
Attainment, by Sector
(b unstandardized regression coeff.; B standardized regression coeff.)
Dependent Variable(Job Search Method)
Private Sectoz (N*3100)
Independent Variables*
Sex Educational Attainment
b(1)
8(2)
F(3)
b(4)
8(5)
F(6)
1. Relatives .0608 .081 (21.0) -.0664 -.135 (38.3)2. Friends .0447 .049 (7.4) -.0256 -.042 (5.7)
3. School placement serv. .0048 .009 (0.2) .0549 .160 (81.0)
4. Professional orgs. .0034 .014 (0.6) .0106- .068 (14.4)
5. Civil Service .0049 .025 (4.1) -.0002 -.000 (0.0)
6. Public empl. serv. -.141 -.029 (2.6) - 135 -.010 (0.3)
7. Private espi. imrv. -.0265 -.062 (12.3) .0180 .063 (13.3)
8. Community groups -.0048 -.003 (3.4) .0020 .021 (1.4)
9. Media ads -.U501 -.076 (18.0) .0207 .047 (7.1)
10. Direct application .0171 .017 (0.9/ .0087 .013 (0.5)
11. Union .0230 .089 (24.9, /-.0001 -.000 (0.0)
1111.1.Public Sector %P978)
12. Relatives .0291 .042 (1.7) -.0307 -.073 (5.3)
13. Friends .0058 .006 (0.0) -.0040 -.007 (0.0)
14. School placement serv. -.005o -.007 (0.0) .0885 .205 (42.8)
15. Pro fissional orgs. -.0022 -.008 (0.0) .0046 .030 (0.8)
16. Civil Service .U182 .002 (0.5) -.0323 -.090 (10.2)
17. Public cool. serv. -.003' -.006 (0.0) -.0323 -.090 (8.2)
IS. Private empt. serv. ..0029 .018 (0.3) .0023 .022 (0.5)
19. Community groups -.0100 -.035 (1.2) -.0072 -.041 (1.6)
20. Media Ala -.021k -.041 (1.7) -.0138 -.04. (1.9)
21. Direct application .0343 .035 (1.2) .0568 .095 (8.9)
22. Union -.0026 -.019 (0.3) .0020 .024 (0.5)
Sex: Male 1; Female 0
Education attainment: 1 . High School, 2 Some College, 3 College Degree
BEST COPY7s

lAnit 1
How kmployr Nerrnitment Mletbrab. ate Rutated to Sex Lompositiun Hi Juba. by Vdocailonai Level .end Sector*
. . . ... . . . .
Private See tar
......-. . ...-..-
pigh_School Iola'.
IS
fM1925)
F
5P4.'.Chl)fie..)9" PI!!!)).. C01411., PIAEVI 1.01.1_0.q58)
I. Friends of employees -.0092 -.027 ( 1.4) -.0149 -.049 ( 1.')) -.0058 -.020 ( 0.2)
1. School placement tlirvice -.d468 -.112 (31.5) -.0116 -.016 ( 1.0) -.0094 '-.034 ( 0.6)
1. Professional rg.nizations -.0111 -.034 (2.1) -.0226 -.058 ( 2.6) -.0036 -.012 ( 0.1)
%. Civil Service .0221 ..036 ( 2.6) .0217 .039 ( 1.2) .0026 .005 ( 0.0)
4
'i. Public employment service -.0042 -.014 ( O.'s) -.0144 -.048 ( 1.8) .0098 .033 ( 0.6)
h. Private *Plu5mnt service -.0112 -.064 ( 8.0) .0010 .003 ( 0.0) .025) .076 ( 3.3)
). community groups .0002 .000 ( 0.0) -.0163 -.107 ( 9.0) -.0148 % -.042 ( 1.0)
A. Media ads -.0208 -.068 ( 9.8) -.0186 -.1 IS (13.9) -.0420 -.156 (13.8)
4. Walk-ins -.0326 -.0)6 (18.0) .:-.0172 -.118 (11.)) -.0145 -.0411 ( 1.3)
10. union Referrals .0863 .206 (136.3) .0189 .085 ( 5.6) .0241 .050 ( 1.4)..Public Sector
_IiighSchool Jobs (N471) Some Collne (Aisle Degree Jobs (N -292)
11. Friends of employees -.0288 -.088 ( 3.7) .0139 .049 ( 0.1)) -.0186 -.073 ( 1.6)
12. School placement service -.0209 -.062 ( 1.8) -.0079 -.029 ( 0.2) -.0153 -.138 ( 5.2)
11. Professional organizations .0385 .081 ( 3.6) .0094 026 ( 0.2) .0069 .034 ( 0.3)
14. Civil Service .0239 .107 ( 5.6) .0401 ..414 f 8.4) .0098 .048 ( 0.1)
15. Public employment aery :ce .0040 .014 ( 0.1) -.0752 -.100 ( 2.5) .0019 .016 ( 0.1)
16. Prlvdte employment service -.0106 -.020 ( 0.2) -.0698 -.127 ( 4.2) -.0222 -.051 ( 0.8)
17. Community groups .0169 .055 ( 1.5) .0145 .053 ( 0.7) .0177 .068 ( 1.4)
18. Media ads .0146 .052 ( 1.3) .0010 .015 ( 0.1) I .0053 .022 ( 0.1)
17. :alk-ins -.0003 -.001 ( 0.0) -.0201 -.070 ( 1.2) -.175 ( 9.1)
'0. Union Referrals .0525 .118 ( 6.8) .0667 .133 ( 4.6) - 0116 -.085 ( 2.1)....
1
High School Jobs are those where SO percent of more of the Job Incumbent.: have no more than a high school diploma; some College Jobs are where 50
percent or more have some college; College Jobs are 50 percent or more have some college; College Degree .lobs are where 50 percent or more have
college degrees. Each set of coefficient, (b, 11, ti is from a separate rgrNsion analysis. where "Percent male I the Job: is the dependent
variable. And one employer recruitment method is the first independent enriable, rend "Percent with High School Education in the Job" ur "Percent
with a College Degree in the Job; is the second independent variable.
7 6
A.
BEST COPY AVAILAbu.

FroployerMethods:
';usineary
.
Private JM. *1100)
(.ANV I t:ANV
1/181.1.. It
rinsonirul Currolntifin Analyseq
1'ublic(N 97A)
(;ANV I ('ANV 2
lntnl
CANV I
(N: 4078)
iANV 2
First Set
1. Friends .086 -.057 .105 -.11A .118 -.036
2. School plAcement -.548 -.098 ..690 -.4nn -.616 -.212
1. Professionil orginisstion -.174 .305 -.145 .670 -.418 .402
4. Civil Service .005 .117 .200 .120 -.055 .004
5. Public)servite .419 -.204 .278 -.222 .399 -.179
6. Private service -.194 .062 .078 -.181 -.088 -.053
7. Community group$. Ado
.050
-.253
-.166-.228
-.201
-.107
.211
.717
.082
-.201
-.085-.149
9. .071 -.478 .110 -.165 .085 -.496
10. Union .196 .701 .020 .411 .156 .750
Second Set.
I. Job 2 uo college .967 -.269 .998
.
-.075 .983 -.201
. 2. inh t male .IR) .987 .024 1.001 . .111 .9Q$
Figonvolue (.201) (.041) (.282) *.041) . (.220) (.014)
P,V1Pre Method *:
First Set
1. Aeluives .578 .077 .401 NS :567 .201
2. Friona. .215 .208 .02i .175 ' .297
1. School papmvnt -.467 .515 568 -.588 .509
4. Professions] organit.etion -.120 .227 -.093 -.11n .256
5. Civil Service -.051 .296 .491 -.027
6. Public service .095 -.370 .308 .121
7. Privnte service -.276 -.041 -.065 -.190 -.031
8. Cosolunity grup -.042 -.125 .018 -.06n
9. Ads -.21C -.151 -.054 -.141 -.125
10. Walk -In -.108 -.013 -*.162 -.112 .074
11. Union .116 .541 .067 .282 .618
Second Set
I. Job 2 no college .858 -.522 .941 .897 -.451
2. lob 2 ogle.444 .90C .292 .368 .434
Eigenvslut (.067) (.019) (.066) toll) (.041) (.014)
7b

72
TABLE 9
F)
Partitioning of Variance Accounted for by
Employer Recruitment Methods
Unique (Sex composition)
Unique (Educ._camposition)
Joint (Sex and Education)
Total
Private Public Total
.00552 (2.7%) .00014 (0.1%) .00228 (1.0%)
.15366 (74.3%) .17236 (83.3%) .17937 (81.3%)
.04764 (23.0%) .03432 (16.6%) .03891 (11.6%)
.20682 (100%) .28194 (100%) .22056 (1001;)
7 9
4.

73 I
Table 10'
PERCENT OF PRIVATE SECTOR EMPLOYERS WHO FREQUENTLY USE
VARIOUS JOB RECRUITMENT METHODS FOR MALE JOBS WITH DIFFERENT EDUCATION LEVELSi
WITH ADJUSTMENT PACTORS#-TOR SECTOR AND JOB SEX
Job Recruitment Method
'Education Level of Job Adjustment Factor for:
High Some College
School'. College 'Degreev:
Sector(Public)
Sob Sex(Female)
Friends of employees' 35 37.: 38 -16 +1
School placement service 14 27,,
44 +2 +3
Profesiional organisations4 8 17
.
+3 -1
Civil service3 4 3
.
+34 -3
Public employment services 32 24_ 16 +4 -1
Private employment services 3 10 16 ..-5 0
Community group 13 12 . 8 +10 -1
Media ads26 34 34 ,-4 +5
Walk -ins59 52 51 -15 +8
Union referrals 10 6..
5 0017444,-4
I
,?

...=
LE 11
Effect of Firs Size and City Size on Yrequencyof Use of Oifferent)mployer Eecruitment Methods, vith
2-Controls*. by Sector
Private Sector Wm3100
Firm Size City Size
Dependent Variable b F b 11,
(Job Search M4thod) (1) (2) (3) (4), (5) (6)
1. Friends of amployeetv , -.1145 -.040 ( 4.8) .0411 .037 ( 4.0)
2. School placement se ,. / .2993 .103 (36.5) -.0026 -.002 ( 0.0)
3. Professional-orig./ ' / .0389 .017 ( 0:9) .0330 .037 ( 4.4)
4. Civil Service V,
.0456 .028 ( 2.4) .008; .013 ( 0.5)
5. Public empl. sere. .5403 .173 (96.8) -.0598 -.049 ( 7.7)
6. Private empl. serv. -.0885 -.040 1 5.1) .0964 .112 (39.0)
7. Community groups .8281 .320 (352.7) .0740 .073 (18.2)
80 Media ads .0315 .010 ( 0.3)' .0927 .076 (17.8)
9. Walk-ins .4735 .168 (89.4) .0121 .011 ( 0.4)
10. Union referrals .1586 .073 (17.1) .0331 .039 ( 4.8)
.inNENTMIL
Public Sector (N.978)
Firm Size Citt Sias
b S F
(1) (2) (3) (4) (5) (6)
11. Friends of employees -.1641 -.062 ( 3.6) .0065 .006 ( 0.0)
12. School placement serv. .0493 .017 ( 0.3) -.0120 -.009 ( 0.1)
'13. Professional orgs. -.0308 -.013 ( 0.2) .0160 .015 ( 0.2)
14. .Civil Service .3821 .104 (10.9) .2317 .144 (20.7)
15. Public empl. serv. .4153 .137 (18.1) -.0521 -.039 ( 1.5)
16. Private empl. serv. .0115 .008 ( 0.0) -.0111 -.016 ( 0.2)
17. Community groups .5192 .188 (34.5) .0788 .065 ( 4.1)
18. Media ads .1612 .055 ( 2.8) -.0335 -.025 ( 0.6)
19. Walk-ins .6061 .212 (52.4) -.0628 -.054 ( 2.9)
20. Union referrals .2594 .146 (20.1) .0826 .010 ( 0.1)
* Control variables are "percent male in the job" and "percent with no college in the job".
14

Table, 12
Distribution of Industries in Sample of Employers and Jobs
IndustrialCategory
1. Agriculture andMining
2. Construction
3. Manufacturing
4. Transportation,.Comm. & Util.
5. Trade
6. Finance, Ins.Real Estate
7. Services
8. PublicAdministration
ti
iPrivate Sector Public Sector
Z in Most frequent Z in Most frequent'Sample industries in sample pools industries in Sample
2.5 Crude oil, Coal,Agriculture
0.6 Forestry
4.3 Construction 2.1
24.2 Motor vehicle,Apparel, Chem., .
Steel, Elec *quits'Printing
'7.8- Telephone, Trucking,Elec. Util.,Railroads
22.7 Eating & DrinkingPlaces; Dept. Stores,Grocery Stores `'
9.5 Banking, Insurance
28.4 ' Hospitals, Schools,Bus. Serv., Hotels
0.6 Justice & Safety,Environment,Quality or HousingAdministration
217
Construction
Paint *fgr.
6.7 U.S. Postal,Sanitary Serv.
2.1. Eating 6 Drinking Ppices
2.6 . Real Estate, Insuiance,Banking
56,1 Schools, CollegesHospitals, Social Serv.,
27.1 Justice and Safety,Geeral Government
111.11M.
c!"
2

Table 13
Effect of InefuntrIal Category on Frequency of Use ofDifferent kmployer leru;iment Methods, with 4 Controls*. by Sector
Deport/int Verieble(Job Recruitment Method) Air. 6 Mining CnnatroLtion
b P.
Manufacturing
6 8
Trans., Comm., 6 Ut11.
Private Sector (6 3100) II P b 8
I.
...111
Friends of employees
}IIIM
.2019 .023 (1.6) -.040 -.009 (0.2) -.1675 -.056 18.8) -.0810 ,-.011 (0.9)
2. School placement service -.2741 -.03; (3.8) -.4417 -.069 (13.6) -.1604 -.051 (8.9) -.0900 -.001 (1.2)
3. Professional ores. -.OM -.006 (0.1) -.400 ...01e 10.4) -.1324 -.055 (9.4) -.02114 -.001 (0.2)
4. Civil Service -.01191 -.020 (1.2) -.0083 -.003 (0.0) -.0468 -.028 (2.2) -.0029 -.001 (0.0)
S. Public epl. eery. -.1624 -.018 (1.1) -.1195 -.OS% (9.41 .504, .135 (11.9) .1911 .011 (4.4)
6. Private empl. e.iv. .0468 .001 (0.2) -.1219 -.026 (1.1) .1110 .031 (2.8) -.0367 -.010 (0.3)
1. Community group. -.2384 -.032 (3.6) -.1471 -.061 (12.2) .178- ----7nes--trwmt-- .2424 .056 (10.8)
S. Media ads -.5485 -.061 (12.0) -.1263 -.018 (1.0) .0831 .025 (1.9) -.5041 -.096 (29.3)
9. Walk-ins .0108 .001 (0. - 1126 J50 (7.1) -.I: . -.053 (8.4) -.1871 -.040 (5.0)
10. Unions -.2129 - ,..5 (1.6) .9280 .194 (119.61 .0614 .011 (2.2) .1928 .054 (9.1)
P 411c Sector (II 978 o
II. Prism's of employees -.51011 -.029 0.81 -.2016 -.023 (0.'1 .2355 .030 (0.8) -.2252 -.043 (1.1)
12. School placement sets. .1294 .007 . 1) -.0552 .MA (0.0) -.0303 -.003 (0.0) -.1608 -.065 (4.8)
il. Professional ergo. -.1439 -.009 .0.1) .1117 .016 (0.3) -.0969 -.013 ;0.2) -.1248 -.026 (0.1)
14. Civil Service -.0411 -.002 (0.0) .3661 .00 (0.9) -.0487 -.004 (0.0) .21411 .033 (1.0)
15. Public oml. serv. 1.1343 .057 (3.2) -.0436 -.W04 (0.0) .7108 .011 (6.0) -.421$ -.012 (4.9)
16. Private env . eery. -.0444 -.004 (0.0) -.0316 -.006 (0.0) .4086 .oes (7.5) -.0282 -.OM (0.1)
1/. C4mmunIty group .160 .009 (0.1) .1649 .018 (0.3) .4601 .055 (3.0) -.0246 (0.0)
18. Media ads -.1111 -.005 (0.1) -.2349 -.021 (0.5) .0021 .000 (0.0) .061 .009 (0.1)
19. Welk-ins .1349 .0011 (0.i) .2189 .025 (0.6) OM .070 (5.0) -.3391 -.066 (4.2)
20. Uniowe .2648 .023 (0.3) .1310 .025 (0.6) .2243 .041 (1.1) -.06114 -.020 (0.4)
tour control variables ere: suss of establishment, city lase. percent with no college in the job. percent male in the job.
b;1BEST COPY Avi-kluiti. 84

.1
Table 11 ((:ontinued)
Dependent Variable(Job Recruitment: Method)
Private Sector (N 1100)
Trade Fin.. Ins., Real rat. ServicesPublic Admin.
I
1. Friends of employees -.0303 -.010 (0.3) ' .4721 .108 (35.1) .0027 .001 (0.0) -.5841 -.034 (3.6)
2. School placement service .0735 .02.4 (1.9) .1829 .041 (5.8) .1438 .050 (7.7) .1914 .011 (0.4)
3. Professional orge. -.1618 -.066 (14.1) .0744 .021 (1.5) .2614 .114 (38.8) 40399 -.003 (0.0)
4. Civil Service .0060 .003 (0.0) -.0119 -.006 (0.1) .0520 .032 (2.9) .1617 .017 (0.9)
5. Public empl. sere. -.2678 -.081 (20.6) .2817 .060 (11.2) -.3172 -.102 (31.0) .3561 .019 (1.2)
6. Private empl. eery....,
-.0946 -.040 (5.0) .4268 .127 (51.0) -.1257 -.057 (9.5) -.4215 -.032 (3.4)
7. Community groups-.1000 -.036 (4.4) .3386 .086 (25.2) -.2386 -.093 (27.2) : .8266 .054 (10.2)
8. Media ads-.0291 -.009 (0.2) .0149 .003 (0.0) .1957 .063 (11.3) .8259 .044 (6.4)
9. Walk-ina.2967 .099 (10.5) .
.0194 .004 (0.1) -.0177 -.306 (0.1) .2124 .013 (0.5)
10. Unions-.1629 -.071 ('5.6) -.2498 -.076 (18.1) -.0362 -.017 (0.8) a
-.0037 -.000 (0.0)
Public Sector (N 978
11. Friends o employee -.0941 -.010 (0.1) -.3331 -.041 (1.6) .1502 .057 (2.8) -.0449 -.015 (0.2)
12. School placement serv..5139 .052 (3.2) .3267 .03 (1.6) .0686 .024 (0.6) -.0674 -.021 , (0.5)
13. Professional or's..0931 .011 (0.1) .2021 .027 (0.8) .0548 .023 (0.5) -.0651 -.024 (0.7)
14. Civil Service-.5118 -.041 (1.8) .2181 .142 (0.4) -1.0054 -.276 (76.2) 1.0256 .254 (72.5)
15. Public empl. serv..3111 .030 (0.9) .0064 .001 (0.0) -.2798 -.094 (7.7) .2853 .086 (7.4)
16. PrIvato empl. serv..0747 .014 (0.2) .1101 .036 (1.2) -.0394 -.026 (0.6) -.0248 -.015 (0.2)
17. Cow .nity groups-.2/75 - 029 (0.9) .1167 .014 (1.2) -.1834 -.n47 (4.n) .1426 .047 (2.2)
18. Media ads.8235 .082 (6.6) .0863 .009 (0.1) -.0036 -.001 (0.0) -.07:* -.022 (0.5)
19. Walk-ins-.1840 -.021 (0.4) -.2133 -.026 0.7) .7492 .096 (8.4) -.2204 -.1)76 (6.0)
20. Unions-.2708 -.045 (2.0) -.0861 -.016 (0.2) .0881 .050 (2.2) 0.6870 -.044 (1.9)
The tour control variables ure: site of establishment.city else. percent with no college in the Job. percent once 1.4 the job.
RFST COPY MAORI

1. TABLE 14
78
Summary of Canonical Correlation Analyses of
Job Recruitment and Job Traits, by Sector
8 7
ate Public
($ -3100) (N -978)
Ran
Ten Job Recruitment Methods withR2 ( k) R2 (Rank)
1. Percent No College and Percent Male In Job .20682 .28194
2. Add: Methodical.21083 (15) .28295 (15)
3.Manual Dexterity
.21522 (14) .28266 (16)
4. Quick Learner.21893 (13) .29439 (12)'
5.Basic Literacy
.23929 (5) .28342 (14)
6.Advanced *seders
.24937 (2) .31391 (6)
7.Basic Arithmetic
.22622 (9) .33301 (3)
8.Excellent Math
.23034 (7) .31182 (7)
9.Specialized Knowledge
.24251 (4) .32086 (4)
10. Client Relations.25093 (1) .30480 (9)
11. Permanence.22273 (12) .30028 (11)
12. Growth. Potential. .22365 (11)
.
.30187 (10)
13. Good Team Members.22426 (10) .30849 (4)
14.Proper Attitudes
0688 (17) .28257 (17)
15. Dependable- .20795 (16) .28481 (13)
16. Good Judgement.24760 (3) .33336 (2)
17. Can Supervise.23990 (6) .35346 (1)
18. Other.22995' (8)
.31587 (5)
19. Add: All 17 Job Traits.32019 .44016
20. Ten Methods with 17 Job Traits .27623 .3840----7
21. UNIQUE (Traits).11337 (35.4%) .15822 (3.9%)
22.'UNIQUE (X no cpll., % male) .04396 (13.7%) .05612 (12.7%)
23. . JOINT.16286 (50.9%) .22582 (51.3%)
8 7

79
TABLE 15
Summary of Cannonical Correlation .Analyses of
Job Recruitment and Job Traits, by Sector
Ten Job Recruitment Methods with
Private(N-3100)
R11LLank-1
Public(N -978)
y2 (Rank),
1. Percent College Dgree and Percent Male in Job .18334 .31588
2. Add: Methodical .18609 (15) .31711 (15)
3. Manual Dexterity .18845 (14) .31596 (16)
4. Quick Learner .20286 (13) .33289 (11)
5. Basic Literacy- .22901 (4) .32164 (13)
6. Advanced Readers .23791 (2) .34023 (6)
7. Basic Arithmetic .21659 (8) .36349 (3)
8. Excellent Math .21907 (7) .34515 (5)
9. Specialized Knowledge . .22399 (5) .33375 (10)
10. Client Relations .24180 (1) .33595 (8)
11. Permanence .20495 (12) .32385 (12)
12. Growth PoLentill .20794 (10) .33539 (9)
13. Good Team Member .20684 (11) .33692 (7)
14. Proper Attitudes .18353 (17) .31592 (17)
15. Dependable .18384 (16) .31828 (14)
16. Good Judgement .23611 (3) .36727 (2)
17. Can Supervise .22165 (6) .37037 (1)
18. Other .21180 (5) .35266 (4)
19. Add: All 17 Traits .31660 .45195
20. Ten Methods with 17 Job Traits .27623 .38404
21. UNIQUE (Traits) .13326 (42.1%) --1.4607 (30.1%)
22. UNIQUE (% college, %male) .04037 (12.8%) .U6791 (15.0%)
23. JOINT .
.14297 (45.2%) .24797 (54.9%)
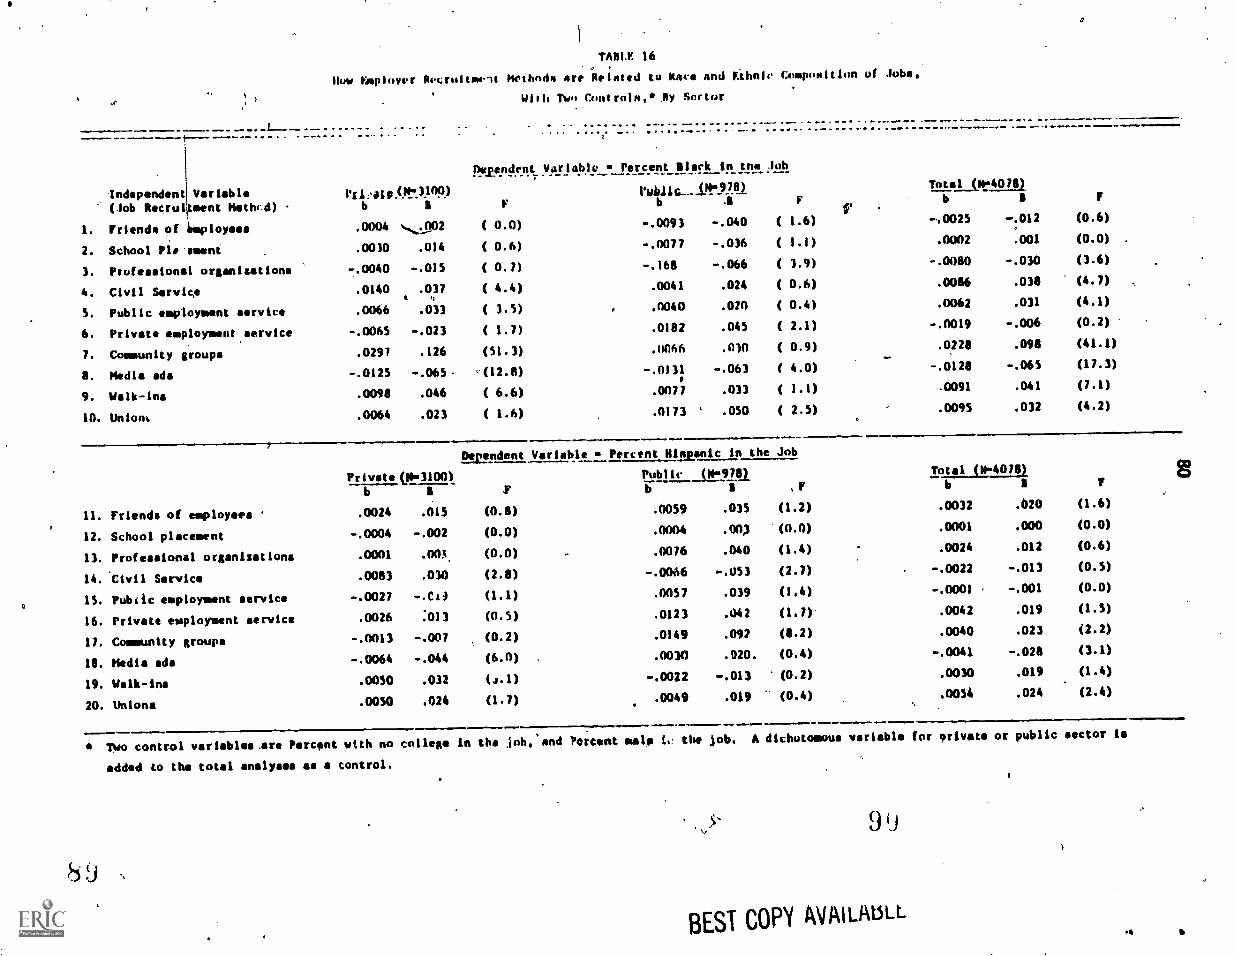
TABLE 16
Iluw Fisplover Recroltmit Nothods sr, itisted to itace and Ethnic Composition of Jobs.
Wilk Two Contrnis,0 Ay Soctor
_.__.-..
Independent(Job Recruitment
VariableMoiled)
111:.ats.0013.119.)b I
Ramp. yerlaylyo Percent Slack ka.troOok
l'ablic.......0t9.7.8/
F b .1 F
Total (04078)Fb $
1. Friends of keployees .0004 .szn02 ( 0.0) -.0093 -.040 ( 1.6) -.0025 -.012 (0.6)
2. School Pl. sment .0010 .014 ( 0.6) -.0077 -.036 ( 1.1) .0002 .001 (0.0)
3. Professional organizations -.0040 -.015 ( 0.7) -.168 -.066 ( 3.9) -.0080 -.030 (3.6)
4. Civil Service .0140 .037. ,
( 4.4) .0041 .024 ( 0.6) .0086 .038 (4.7)
S. Public employment service .0066 .033 ( 3.5) , .0040 .010 ( 0.4) .0062 .031 (4.1)
6. Private employment service -.0065 -.023 ( 1.7) .0182 .045 ( 2.1) -.0019 -.006 (0.2)
7. Community groups .0297 .126 (51.3) .110116 .0)0 ( 0.9) .0228 .098 (41.1)
S. Media ads -.0125 -.065. -(12.8) -.0131p
-.063 f 4.0) -.0128 -.065 (17.3)
9. Walk-ins .0098 .046 ( 6.6) .0077 .033 ( 1.1) .0091 .041 (7.1)
10. Union .0064 .023 ( 1.6) .0173 ' .050 ( 2.5) .0095 .032 (4.2)
7..
Dependent Variable Percent Himenic in the Job
Private (P1.3100) Public (N -978) Total (114078)
b I P b a , r b I F
11. Friends of employees .0024 .015 (0.8) .0059 .035 (1.2) .0032 .020 (1.6)
12. School placement -.0004 -.002 (0.0) .0004 .003 (0.0) .0001 .000 (0.0)
13. Professional organisations .0001 .001. (0.0) .0076 .040 (1.4) .0024 .012 (0.6)
14. 'Civil Service .0083 .030 (2.8) -.0066 -.053 (2.7) -.0022 -.013 (0.5)
15. Public employment service -.0027 -.C19 (1.1) .0057 .039 (1.4) -.0001 -.001 (0.0)
16. Private employment service .0026 :013 (0.5) .0123 .042 (1.7) .0042 .019 (1.5)
17. Community groups -.0013 -.007 (0.2) .0149 .092 (8.2) .0040 .023 (2.2)
18. Media ads -.0064 -.044 (6.0) .00lo .020. (0.4) -.0041 -.028 (3.1)
19. Welk-ins .0050 .032 OM -.0022 -.013 (0.2) .0030 .019 (1.4)
20. Unions .0050 .024 (1.7) .0049 .019 (0.4) .0054 .024 (2.4)
* Two control variables.are Percent with no colleee in the joh,'snd 'Percent male ic the job. A dichotomous variable for 'rivets or public sector is
added to the total analyses as control.
5- 9'J
BEST COPY AVALAbLL

81
Table 17
Summary of Cannonical Correlation Analyses
of Percent Black in the Job
Cannonicil,Variables
Private Sector (N03100) Public Sector (W1978)
CANVI CANV2 CANV3 CANV1 CANV2 CANV3
First Set:
,l. Friends -.083 -.043 -.096 .091 -.054 NS'
2. Sch. placement .541 -.125 .143 -.677 .528
3. Prof. orgs. .372 .282 .155 -.402 .660
4. Civil serv. -.011 .110 .187 .200 .303
5. Publ. serv. -.417 -.142 -.413 .273 -.177
6. Pri. serv. .196 .066 -.033 .093 -.437
7. Community -.086 -.302 .904 .206 .176
8. Ads .267 -.166 -.445 -.124 .3(14
9. Walk-in -.078 -.487 .025 .141 -.J98
10. Unions -.191 .700 .080 .030 .337
Second Set:
11. no collegein job.
-.942 -.202 -.331 .94.1 .015
12. male in -.182 .964 .213 .035 .941
. job0
13. black in -.117 -.209 , *.986 .144 -.258
joh
Eigenvalue .209 .042 4021 .287 .034 .011
9 1

82
Table 18
Summary of Cannonical Correlation Analyses
of Percent Hispanic in the Joti
CannonicalVariables
owasecomm.....410.miyorwIlr.Private Sector Public Sector (N-978)
CANV1. CANV2 CANV3 CAMV1 CAMV2 CANV3
First Set:
1. Friends -.086 .048 -.220 -.107 .107 -.300
2. Sch.,placement .548 .095 ,-.089 .691 .503 :186
3. Prof. orbs. .374 -.304 .022. .394 -.690 -.157
4. Civil serv. -.007 -.15Z :-.371 -.198 -.260 .576
5. Publ serv. -.428 .215 .250 -.278 .223 -.010
6. Pri. serv. .193 -.074 -.116 -.079 .355 -.282
7. Community -.030 .172 .152 -.204 -.297 '- .770..
8. Ads .255 .252 .601 .107 -.214 .137
9. Walk-in .072 .452 -.655 -.129 .401 .313
10. Unions -.197 . -.704 -.024 -.021 -.410 .034
Second Set:
11. : No collegs injob
-.963 .285 .015 -.997 .092 .102 ''
12. % male in job -.183 -.915 .941 -.024 -.995 .112
13. Z Hispanic injob
-.022 -.116 -.258 -.013 -.150 -.994
Eigenvalue .207 .042 .005 .282 .033 .017
.m..mmgmimb...wmmmm..ommlmwso...o.bmo....mmlmm
92
4

a
Depeadest Variable(Job Search Method)
83
Table 19
Nov Rimployee Rice is Related to Job Search Methods.
with Two Controls.* by Sector
4
Race Inds cadent Variable: 81LiyatitielhilLS:511..
Private (N.3100) 1.1191111...
b 11
1. Relatives
2. friends
3. ScAool placement
4. Professional orgs.
5. Civil Service
6. Public empl. sere.
7. Private empl. serv.
S. Community groups
9. Media ads
10. Welk-in
1. Uniono
-.0122 -.016 (0.8) .0224 .033 (1.0)
-.0095 -.010 (0.3) .0206 .023 (0.5)
.0122 .023 (1.6) -.0276 -.040 (1.1'
.0068 .028 (2.5) -.0065 -.026 (0.6,
.0072 .053 (8.7) -.0316 -.040 (1.5)
.0583 .118 (43.5) .0188 .033 (1.0)
.014' 33 (3.4) -.0054° -.033 (1.0)
.036 (4.0) .0027 .096 . (8.9)
.3152 -.023 s(1.6) -.0156 -.031 (0.9)
-.0481 -.048 (7,3) -.493 -.051 (2.4)
.0014 .005 (0.1) -.0016 -.022 (0.5)
Ethnicity Independent iihite
Private (Na3100) (Public ($'175)
b S F b 8. P
12. Relatives .0061 .004 (0.14 .0040 .006 (0.0)
134 Friends .0100 .009 (0.2) .0039 .006 (0.0)
s'.4.4. School placement -.0101 -.016 '.(0.8) -.0073 -:010 (0.1)
15. Professional orgs. -.0036 -.013 (0.5) -.0046 -.017 (0.3)
16. Civil Service .0077 .048 (6.8) -.0755 -.088 (7.3)
17. Public empl. serv. .0478 .081 (20.2) .0588 .093 (8.0)
18. Private amyl. serv. .0106 .021 (1.3) -.0098 -.056 (2.8)
19. Community groups .0027 .016 (J.7) .0373 .124 (14.2)
20. Media ads -.0247 -.031 (2.9) -.0060 -.011 (0.1)
21. Walk -iu -.0344 -.029 (2.6) .0125 .012 (0.1)
22. Unions .0026 .008 (0.2) .0014 .011 (0.1)
Tun control variables individual's educational attainment (1 high school. 2 some college.
3 college degree), individual's-sex (1 male. 0 .5 female).

TABER 20
Now Employer Recruitment Hethotis are Relntrd to Percent Slack in the Jobs, Ry ducation Level and Sector
. Mir MM.... .16.I m ss I...
10111..... AMP
Prtvate Sector
Job Recruitment Hethod
ImpwimmoY
High School _Aubs_11t192ii ,
-(1. friends of employee .0051 .022
2. School placement service .0037 .016 ( 0.4)
3. Professional organization. -.0109 ..033 ( 2.2)
4. Civil Service .0128 .032 ( 1.9)
5. Public employment service .0057 .028 ( /.5)
6. Private employment service -.0046 -.014 ( 0.4)
7. Community groups .0259 .105 (2/.8)
8. Media ads -.0101 -.049 ( 4.7)
9. Welk -ins .0106 .047 ( 4.3)
l0.Union referrals -.0051" -.018 ( 0.6)
*No to *Iwo
- .,P°11151.5:19.WP J9.132.2.790/
Collem Degree Jobe ($'SS$)
S F fi 8
-.009 -.00S ( 0.0),,,4 -.0156 -.088 ( CS)
.00113 .004 ( ) ii) .00119 .052 ( 1.5)
-.0032 -.014 ( 0.1) .0063 .034 ( 0.6)
.0161 .049 ( 1.9) .9124 .042 ( 0.9)
.0073 .042 (1.3) .0163 .090 ( 4.7)
.007(1 .011 ( 0.8) -.0131 -.063 ( .3)
.0343 .172 (23.4) .0367 .171 (17.6)
-.0127 -.074 ( 4.3) -.0124 -.075 ( 3.2)
.0113 .061 ( 2.9) .0096 .052 ( 1.6).
.0118 .044 ( 1.5) .0532 .176 (18.7)
Public Sector
pip 5lill!e CoOnitipbsiOm258),
.......11collier Dupe Jobs Ot2:62
.pcliall...ipbs..1_142.471.)
( 0.0) -.006 ( 0.0)11.criends of employees .6001 --.Doo- -Am/ -.0313 -.151 ( 6.9)
12.Schonl placement service -.0100 -.040 ( 0.7) .0094 .046 ( 0.5) -.0145 -.069 ( 1.3)
1,.).Profeesional Orgonlsationa -.0292 -.088 ( 3.6) -.0100 -.109 ( 3.1) .0045 .021 ( 0.1)
14.Civil Service ..0082 .049 ( 1.1) .0187 .115 ( 3.1) -.0104 -.063 ( 1.2)
15.Public employment service .001Y .015 ( 0.6) .0194 .102 ( 2.7) -.0122 -.063 ( 1.2)
16.PrIvate employment service .0256 .065 ( 2.0) -.0071 -.017 ( 0.1) .0096 .027 ( 0.2)
17.Commonity groups -.0099 .043 ( 0.9) .0177 .087 ( 1.9) -.0051 -1024 ( 0.2)
18.Media ads -.0182 -.086 ( 3.5) -.0086 -.045 ( 0.5) -.0024 -.012 ( 0.0)
19.Walk-ins .0116 .049 ( 1.1) .0187 .086 ( 1.9) -.0029 -.013 ( 0.0)
20.Unlon referrals .0263 .079 ( 2.9) .0)08 .082 ( 1.7) -.0040 -.012 ( 0.0)
..1.11.
Dependent variable Percent Black in the job; Independent variables one Job recrultmerILt method, Percent male in the Job, and either Percent with
no college in the lob or Percent with college degrei In the fob.
94 BEST COPY AVAILABLE

TARL 21'
Vow Employer liktrultmenf Methodc ;Ir Related to Percent Ill*pnnic In the Job, 8y EdoustIon 1.evel and Sector*
lob Recruitment Method
-C
...---..Illzh. Schopl:Iphs..(10.1.92.t)
Private Sector
. . -Snow Colle.se21rha
b 8
.
(N 790),
7-Cc!Ilegc Degree 4obs (N-558)
1. Friends of employees .0036 .021 ( 0.8) -.nnon -.nnn ( 0.0) .0009 .011 ( 0.1)
2. School placement service' .0020 .011 ( n.2) -.0014 -.010 ( 0.1) -.0001 -.001 ( 0.0)
3. Professional organizations .0002 .001 ( 0.0) .nnns .n03 ( 0.n) .0036 .039 ( 0.8)
4. Civil service .0015 .005 ( 0.0) .0178 .075 ( 4.4) .n132 .088 ( 4.3)
5. Publie employment service -.0049 -.031 ( F.9) .0060 .n47 (1.8) .0000 .000 ( 0.0)
6. Private employment service .0026 .010 ( n.2) .0081 .051 ( 2.1) -.0032 -.032 ( 0.6)
7. Community groups -.0062 -%033 ( 2.n) .1)13I .093 ( 6.7) .0015 .014 ( 0.1)
8. Media ads . -.0084 -.053 ( 5.4) 375 -.061 ( 2.9) -.0028 -.0311 ( 0.6)
9. Walk-ins .0016 .010 ( 0.2) .0165 .122 (11.8) -.0019 -.021 ( 0.2)
10. Union referrals .0015 ...002 ( 0.1) .0195 .099 ( 7.8) .0030 .034 ( 0.6)
Public Sector
Hkel School. :lobs (M*4.71) come College Jobs (N ,456)
V
colnr pospee Jobs (N -292)
11. Friends of employees .0125 .062 ( 1.8) .0103 .060 ( 0.9) -.0067 -.055 ( 0.9)
12. School placement service -.0047 -.021 ( 0.2) .0101 .060 ( 0.9) .0078 .064 ( 1.1)
13. Professional organt2stliis .0069 .026 ( 0.3) .03.0 .136 ( CO .0050 .041 ( 0.5)
14. Civil Service -.0216 -.138 (11.8) -.0125 -:092 ( 2.n) .0128 .131 ( 5.0)
15. Public employment service .0027 .013 ( 0.1) .0063 .040 ,.( 0.4) .0114 .100 ( 2.9)
16. Private employment service .0016 .005 ( 0.0) .0176 .C$2 ( 0.7) .0270 .129 ( 4.9)
17. Communit, group* .0064 .014 ( 0.3) .0185 .109 ( 1.1) .0:74 .139 ( 5.7)
18. Media ads .0060 .015 ( 0.61 -.0023 -.014 ( 0.0) .0031 .044 ( 0.6)
19. Walk-ins .0007 .004 ( 0.0) -.0064 -.036 ( 0.3) -.0035 -.026 ( 0.2)
20. Unto* referrals .0095 .035 (0.6) -.0126 -.040 ( 0.4) -.0003 -.001 ( 0.0)
a Dependent variable Percent Hispanic in the Job; independent variables n one lob recruitment method. Percent male in the job, and eith Percent
with no college in the'job or Percent with eollrge degree in the job.
9 6

.1 86
TABLE 22
Percent of Workers Who4Used Friends or Relativeso
to Find Their Job, by Sector and
Worker's Race, Sex and Educational Attainment
(Sample size shown in parentheses)
4.
Private Sector Public Sector
Males
.Blacks Whites Blacks Whites
High School .49(226) .55 (304) .49 (69) .41 (32)
Some College' .44 (147) .47 (242) .24 (63) .41 (61)
Q
College Degree .33 (67) .38 (188) .48 (25) .34 (55)
Females
High School .44 (242) .45 (350) .41 (104) ...35 (51)
Some College .33 (164) .33 (248) .37 (83) .35 (49),
College Degree ,27 (88) .30 (173) .36 (63) .28 (99)
98

.10
J
TARR 23
Job Race Composition and Wags Rate for Slack Nigh School Graduates, By Use of
Segregated and Desegregated Social 4stuorkei Private Sector, Males and Fowles
Se
Slack Male, Nish School Graduates, Private Sector
Use Nigh School Interpretation Percent Percent Hourly Hourly
Friends Race Coop. of (1), and White of Job White of Firm Wage Nov Wage Earlier
(7)
4.67 (100)
4.78 (49)
4.89 (36)
(1) (2) (3)i
(4)..-
(5) (6)
1. NO SEC Not Use Black Friends .534 (91) .636 (84) 6.66 (91)
2. NO OESEG Noi"Ose White Friends .504 (46) .622 (43) 6.42 (46)
3. YES SEG Use Slack Friends .488 (34) .514 (32) 6.03 (35)
4. YES MEG Use Whits Friends .547 (25) .697 (26) 7.73 (23)
Black Female, High School Graduates, Private Sector
S. NO SEC Hot Use Slack-Friends .470 (87) .549 (77) 5.08 (92)
6. NO OESEC Not Use White Friends .507 (53) .580 (48) 4.81 (58)
7. YES SiG Use Black Friends .440 (41) .530 (38) 5.42 (43)
8. YES DESEG Use White Friends .580 (17) .668 (15) 4.82 (18)
99 BEST COPY
5.12 (31)
3.79 (79)
3.62 (56)
3.38 (44)
3.32 (18)
1 W
aD