yukon climate change indicators and key findings 2015 · the yukon climate change indicators and...
TRANSCRIPT
Yukon Climate Change Indicators and Key Findings 2015
This publication may be obtained online at yukoncollege.yk.ca/research.
This publication may be obtained from:
Northern Climate ExChangeYukon Research Centre, Yukon College500 College Drive, PO Box 2799Whitehorse, Yukon Y1A 5K4867.668.8895 or 1.800.661.0504 Recommended citation:
Streicker, J., 2016. Yukon Climate Change Indicators and Key Findings 2015. Northern Climate ExChange, Yukon Research Centre, Yukon College, 84 p.
Front cover photograph: St. Elias Mountain Range, Kluane National Park, YukonPhoto Credit: Martin Fortier/ArcticNet Printed in Whitehorse, Yukon, 2016 by Arctic Star Printing Inc., 204 Strickland St.
With funding support from Government of Yukon's Climate Change Secretariat.
FOREWORD
The Yukon Climate Change Indicators and Key Findings 2015 is the product of an ongoing
collaboration between the Northern Climate ExChange at the Yukon Research Centre, Yukon
College, and the Government of Yukon’s Climate Change Secretariat. Together we recognized a
need for easy-to-access climate change data and resources, which then developed into an
analysis of Yukon climate change indicators and key findings.
This report is a valuable tool for decision-makers, policy advisors, researchers and the general
public in Yukon as we prepare for future change. It includes indicators of temperature,
precipitation, fire history, sea ice melt, ocean oscillation patterns, and greenhouse gas
emissions. To maintain its relevance, we are committed to updating it on a regular basis with
new data and to include Traditional Knowledge wherever possible.
John Streicker has brought his considerable expertise as a climate change researcher and
educator to his work on this report. This analysis of indicators and key findings is the first report
of its kind that brings together regional-specific data on climate change in Yukon. John has been
actively researching climate change in the North for over 20 years and has based this work on
the most up-to-date research documenting the impacts of climate change in the region.
The information in the report came from numerous sources including government reports,
research reports, government and academic datasets, and peer-reviewed literature. In order to
ensure scientific rigour, local scientists, organizations and government agencies reviewed the
report and provided input on the indicators and key findings, including confidence levels. The
expertise and assistance of these technical advisors was invaluable in producing a report that is
accurate and comprehensive. The staff of the Climate Change Secretariat also contributed their
time and expertise to the development and review of the report.
Bronwyn Benkert Manager Northern Climate ExChange Yukon Research Centre, Yukon College February 2016
PROJECT TEAM
Author
John Streicker Northern Climate ExChange, Yukon Research Centre, Yukon College
Technical Advisors
Matthew Ball Agriculture Branch, Energy, Mines and Resources, Government of Yukon
Bronwyn Benkert Northern Climate ExChange, Yukon Research Centre, Yukon College
Bruce Bennett Fish and Wildlife, Department of Environment, Government of Yukon
Fabrice Calmels Northern Climate ExChange, Yukon Research Centre, Yukon College
Neil Comer Senior Climatologist, Risk Sciences International
Jennifer Eakins Climate Change Secretariat, Department of Environment, Government of Yukon
Brian Horton Northern Climate ExChange, Yukon Research Centre, Yukon College
Richard Janowicz Water Resources Branch, Department of Environment, Government of Yukon
Lacia Kinnear Northern Climate ExChange, Yukon Research Centre, Yukon College
Sarah Laxton Yukon Geological Survey, Energy, Mines and Resources, Government of Yukon
Paul Murchison Transportation, Highways and Public Works, Government of Yukon
Aynslie Ogden Science Advisor, Executive Council Office, Government of Yukon
Alison Perrin Northern Climate ExChange, Yukon Research Centre, Yukon College
Rod Savoie, P.Eng. Buildings Engineering, Stantec
Robin Sharples Forestry, Energy, Mines and Resources, Government of Yukon
Michael Smith Wildland Fire Management, Community Services, Government of Yukon
Michael Templeton Emergency Measures Organization, Community Services, Government of Yukon
Bob Van Dijken Circumpolar Relations, Council of Yukon First Nations
Tyler Williams Water Resources Branch, Department of Environment, Government of Yukon
Rebecca World Climate Change Secretariat, Department of Environment, Government of Yukon
Technical Editing and Production
Eva Holland Editor, Whitehorse
Guin Lalena Graphic designer, Whitehorse
ACRONYMS
AAC - Arctic Athabaskan Council ACIA - Arctic Climate Impact Assessment AO - Arctic Oscillation AR4 - Fourth Assessment Report of the IPCC AR5 - Fifth Assessment Report of the IPCC CCS - Climate Change Secretariat CH4 - Methane
CO2 - Carbon dioxide
CYFN - Council of Yukon First Nations GHG - Greenhouse gas IPCC - Intergovernmental Panel on Climate Change NCE - Northern Climate ExChange at YRC
NOAA - National Oceanic and Atmospheric Administration PDO - Pacific Decadal Oscillation RCP - Representative Concentration Pathways SRES - Special Report on Emissions Scenarios TK - Traditional Knowledge YC3 - Yukon Climate Change Consortium YESAB - Yukon Environmental and Socio-economic Assessment Board YRC - Yukon Research Centre

TABLE OF CONTENTS
PROJECT TEAM ....................................................................................... 2
ACRONYMS ............................................................................................ 3
1.0 INTRODUCTION ........................................................................ 1
2.0 EXECUTIVE SUMMARY: INDICATORS ........................................ 2
3.0 EXECUTIVE SUMMARY: KEY FINDINGS ...................................... 9
4.0 METHODOLOGY ...................................................................... 15
4.1 INTRODUCTION ........................................................................................ 15
4.2 INDICATORS ............................................................................................. 15
4.3 KEY FINDINGS ........................................................................................... 16
4.4 FUTURE RESEARCH .................................................................................. 17
4.5 UNCERTAINTY .......................................................................................... 18
5.0 ANNOTATED FINDINGS ........................................................... 18
REFERENCES ......................................................................................... 60
APPENDIX A: INDICATORS IN DETAIL .................................................... 70
YUKON RESEARCH CENTRE
Introduction
1
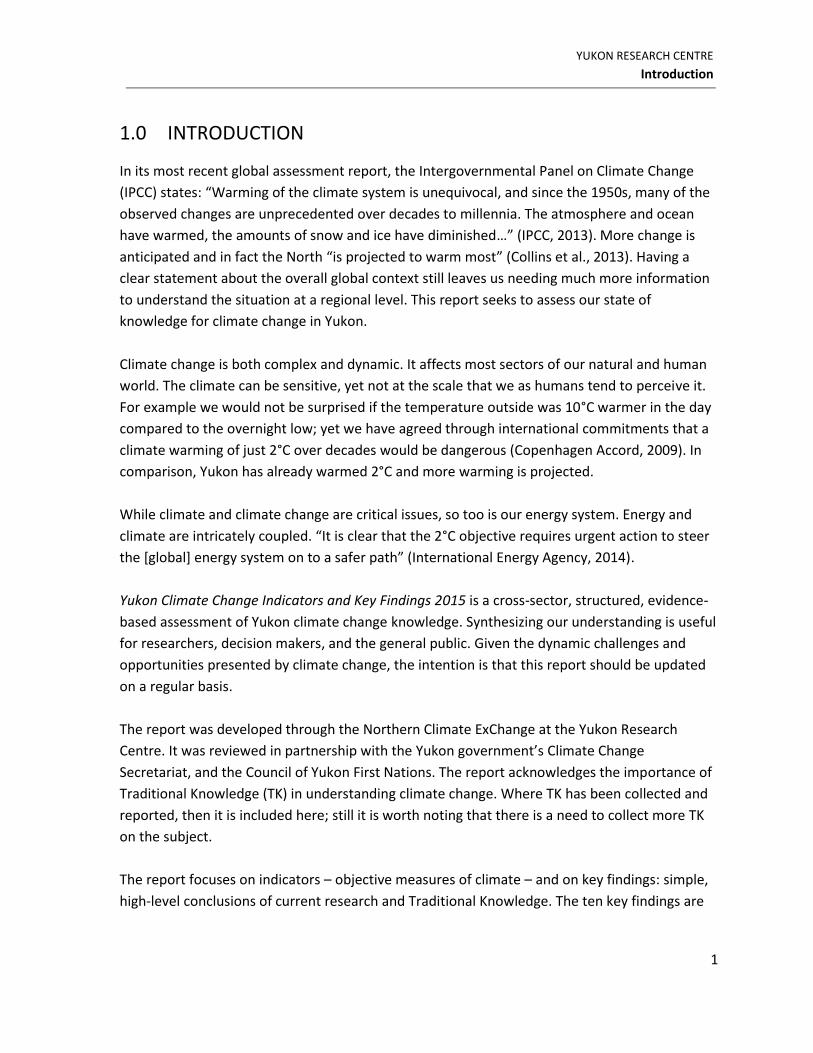
1.0 INTRODUCTION
In its most recent global assessment report, the Intergovernmental Panel on Climate Change
(IPCC) states: “Warming of the climate system is unequivocal, and since the 1950s, many of the
observed changes are unprecedented over decades to millennia. The atmosphere and ocean
have warmed, the amounts of snow and ice have diminished…” (IPCC, 2013). More change is
anticipated and in fact the North “is projected to warm most” (Collins et al., 2013). Having a
clear statement about the overall global context still leaves us needing much more information
to understand the situation at a regional level. This report seeks to assess our state of
knowledge for climate change in Yukon.
Climate change is both complex and dynamic. It affects most sectors of our natural and human
world. The climate can be sensitive, yet not at the scale that we as humans tend to perceive it.
For example we would not be surprised if the temperature outside was 10°C warmer in the day
compared to the overnight low; yet we have agreed through international commitments that a
climate warming of just 2°C over decades would be dangerous (Copenhagen Accord, 2009). In
comparison, Yukon has already warmed 2°C and more warming is projected.
While climate and climate change are critical issues, so too is our energy system. Energy and
climate are intricately coupled. “It is clear that the 2°C objective requires urgent action to steer
the [global] energy system on to a safer path” (International Energy Agency, 2014).
Yukon Climate Change Indicators and Key Findings 2015 is a cross-sector, structured, evidence-
based assessment of Yukon climate change knowledge. Synthesizing our understanding is useful
for researchers, decision makers, and the general public. Given the dynamic challenges and
opportunities presented by climate change, the intention is that this report should be updated
on a regular basis.
The report was developed through the Northern Climate ExChange at the Yukon Research
Centre. It was reviewed in partnership with the Yukon government’s Climate Change
Secretariat, and the Council of Yukon First Nations. The report acknowledges the importance of
Traditional Knowledge (TK) in understanding climate change. Where TK has been collected and
reported, then it is included here; still it is worth noting that there is a need to collect more TK
on the subject.
The report focuses on indicators – objective measures of climate – and on key findings: simple,
high-level conclusions of current research and Traditional Knowledge. The ten key findings are
REPORT
Yukon Climate Change Indicators and Key Findings
2
listed here in the Executive Summary and then expanded upon with supporting evidence in the
annotated findings section of the report.
2.0 EXECUTIVE SUMMARY: INDICATORS
Climate indicators are a measure of a complex system, chosen to provide an objective overview
of the climate system and any potential change. They need to be straightforward, repeatable,
and representative. The indicators are illustrated and described below. For a fuller
understanding of each indicator, see Appendix A: Indicators. For more information, including
the full set of data, please contact the Yukon Research Centre for a copy of the digital library.
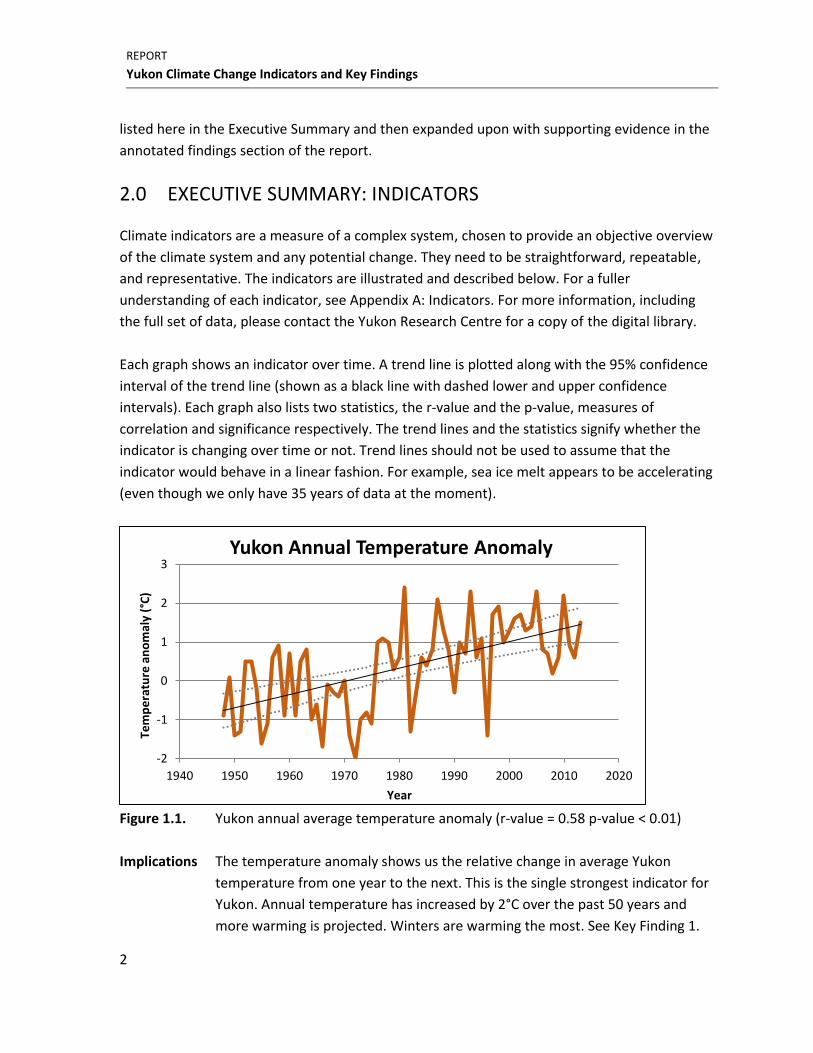
Each graph shows an indicator over time. A trend line is plotted along with the 95% confidence
interval of the trend line (shown as a black line with dashed lower and upper confidence
intervals). Each graph also lists two statistics, the r-value and the p-value, measures of
correlation and significance respectively. The trend lines and the statistics signify whether the
indicator is changing over time or not. Trend lines should not be used to assume that the
indicator would behave in a linear fashion. For example, sea ice melt appears to be accelerating
(even though we only have 35 years of data at the moment).
Figure 1.1. Yukon annual average temperature anomaly (r-value = 0.58 p-value < 0.01)
Implications The temperature anomaly shows us the relative change in average Yukon
temperature from one year to the next. This is the single strongest indicator for
Yukon. Annual temperature has increased by 2°C over the past 50 years and
more warming is projected. Winters are warming the most. See Key Finding 1.
-2
-1
0
1
2
3
1940 1950 1960 1970 1980 1990 2000 2010 2020
Tem
pe
ratu
re a
no
mal
y (°
C)
Year
Yukon Annual Temperature Anomaly
YUKON RESEARCH CENTRE
Executive Summary: Indicators
3
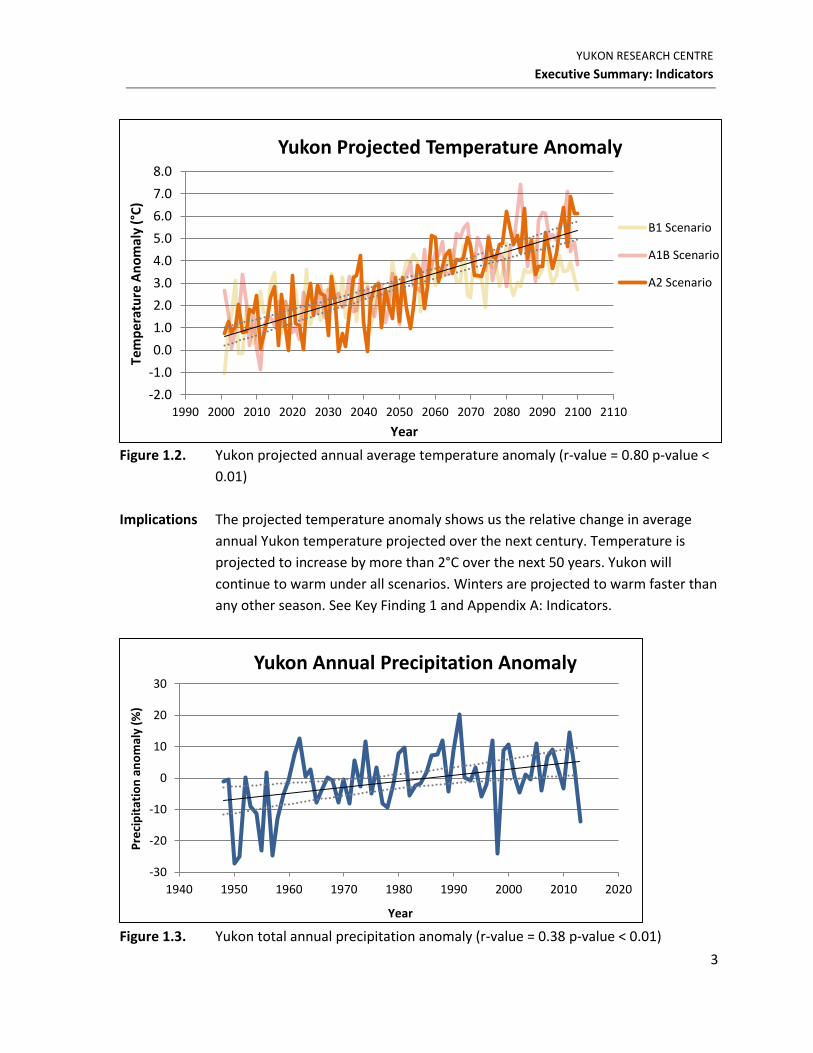
Figure 1.2. Yukon projected annual average temperature anomaly (r-value = 0.80 p-value <
0.01)
Implications The projected temperature anomaly shows us the relative change in average
annual Yukon temperature projected over the next century. Temperature is
projected to increase by more than 2°C over the next 50 years. Yukon will
continue to warm under all scenarios. Winters are projected to warm faster than
any other season. See Key Finding 1 and Appendix A: Indicators.
Figure 1.3. Yukon total annual precipitation anomaly (r-value = 0.38 p-value < 0.01)
-2.0
-1.0
0.0
1.0
2.0
3.0
4.0
5.0
6.0
7.0
8.0
1990 2000 2010 2020 2030 2040 2050 2060 2070 2080 2090 2100 2110
Tem
per
atu
re A
no
mal
y (°
C)
Year
Yukon Projected Temperature Anomaly
B1 Scenario
A1B Scenario
A2 Scenario
-30
-20
-10
0
10
20
30
1940 1950 1960 1970 1980 1990 2000 2010 2020
Pre
cip
itat
ion
an
om
aly
(%)
Year
Yukon Annual Precipitation Anomaly
REPORT
Yukon Climate Change Indicators and Key Findings
4
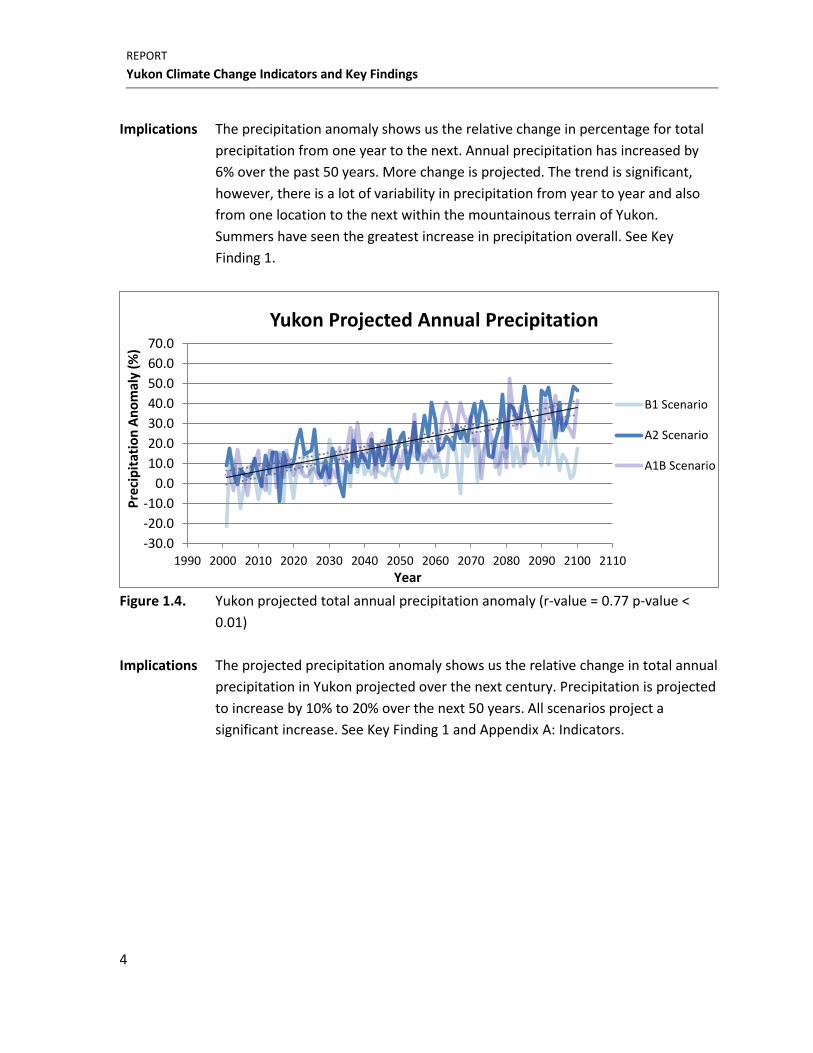
Implications The precipitation anomaly shows us the relative change in percentage for total
precipitation from one year to the next. Annual precipitation has increased by
6% over the past 50 years. More change is projected. The trend is significant,
however, there is a lot of variability in precipitation from year to year and also
from one location to the next within the mountainous terrain of Yukon.
Summers have seen the greatest increase in precipitation overall. See Key
Finding 1.
Figure 1.4. Yukon projected total annual precipitation anomaly (r-value = 0.77 p-value <
0.01)
Implications The projected precipitation anomaly shows us the relative change in total annual
precipitation in Yukon projected over the next century. Precipitation is projected
to increase by 10% to 20% over the next 50 years. All scenarios project a
significant increase. See Key Finding 1 and Appendix A: Indicators.
-30.0
-20.0
-10.0
0.0
10.0
20.0
30.0
40.0
50.0
60.0
70.0
1990 2000 2010 2020 2030 2040 2050 2060 2070 2080 2090 2100 2110
Pre
cip
itat
ion
An
om
aly
(%)
Year
Yukon Projected Annual Precipitation
B1 Scenario
A2 Scenario
A1B Scenario
YUKON RESEARCH CENTRE
Executive Summary: Indicators
5
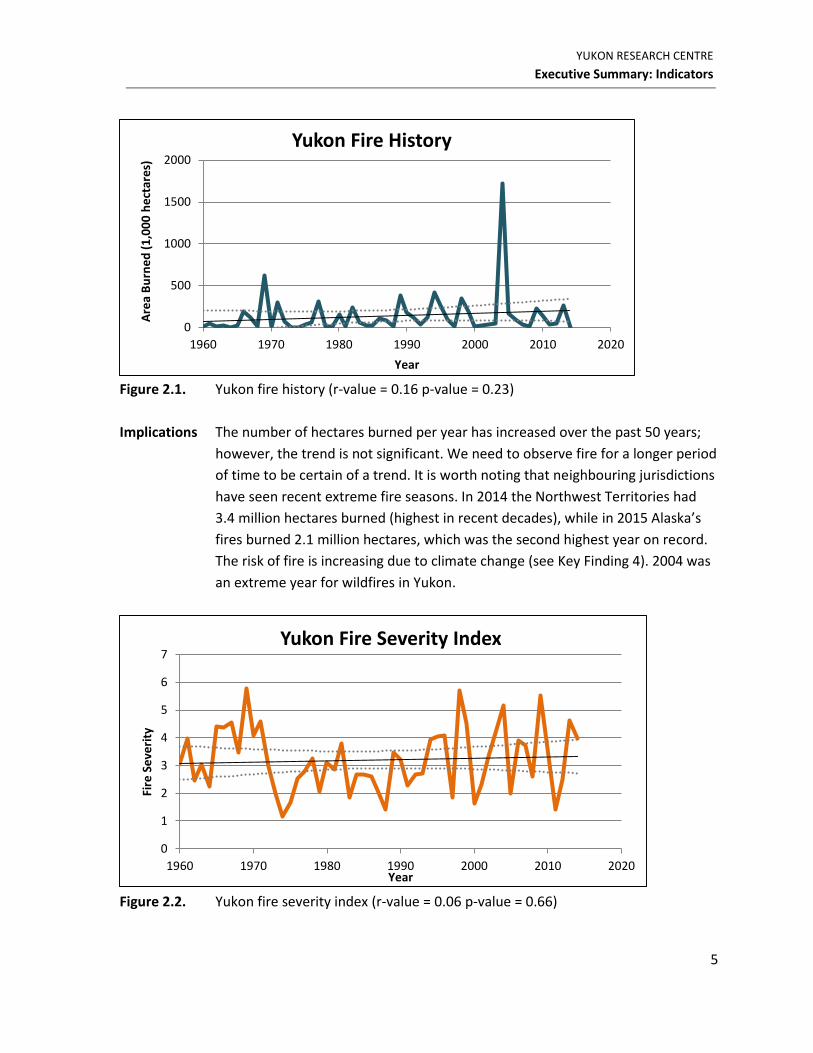
Figure 2.1. Yukon fire history (r-value = 0.16 p-value = 0.23)
Implications The number of hectares burned per year has increased over the past 50 years;
however, the trend is not significant. We need to observe fire for a longer period
of time to be certain of a trend. It is worth noting that neighbouring jurisdictions
have seen recent extreme fire seasons. In 2014 the Northwest Territories had
3.4 million hectares burned (highest in recent decades), while in 2015 Alaska’s
fires burned 2.1 million hectares, which was the second highest year on record.
The risk of fire is increasing due to climate change (see Key Finding 4). 2004 was
an extreme year for wildfires in Yukon.
Figure 2.2. Yukon fire severity index (r-value = 0.06 p-value = 0.66)
0
500
1000
1500
2000
1960 1970 1980 1990 2000 2010 2020
Are
a B
urn
ed
(1
,00
0 h
ect
are
s)
Year
Yukon Fire History
0
1
2
3
4
5
6
7
1960 1970 1980 1990 2000 2010 2020
Fire
Se
veri
ty
Year
Yukon Fire Severity Index
REPORT
Yukon Climate Change Indicators and Key Findings
6
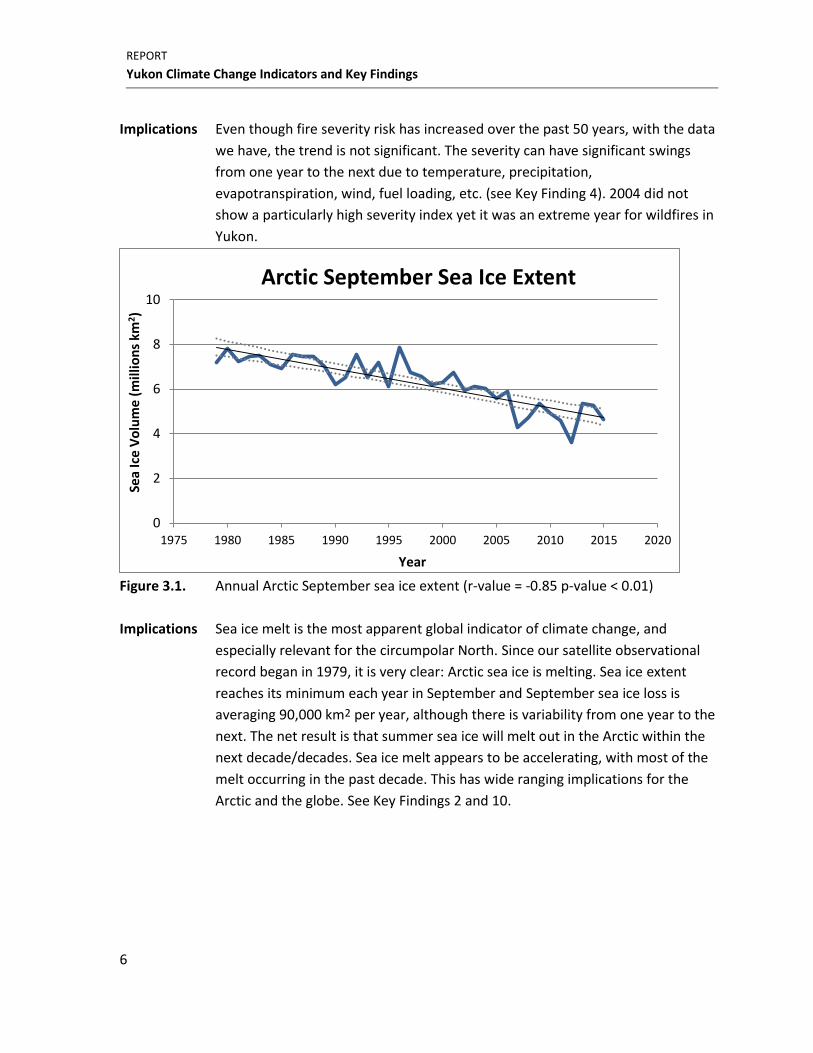
Implications Even though fire severity risk has increased over the past 50 years, with the data
we have, the trend is not significant. The severity can have significant swings
from one year to the next due to temperature, precipitation,
evapotranspiration, wind, fuel loading, etc. (see Key Finding 4). 2004 did not
show a particularly high severity index yet it was an extreme year for wildfires in
Yukon.
Figure 3.1. Annual Arctic September sea ice extent (r-value = -0.85 p-value < 0.01)
Implications Sea ice melt is the most apparent global indicator of climate change, and
especially relevant for the circumpolar North. Since our satellite observational
record began in 1979, it is very clear: Arctic sea ice is melting. Sea ice extent
reaches its minimum each year in September and September sea ice loss is
averaging 90,000 km2 per year, although there is variability from one year to the
next. The net result is that summer sea ice will melt out in the Arctic within the
next decade/decades. Sea ice melt appears to be accelerating, with most of the
melt occurring in the past decade. This has wide ranging implications for the
Arctic and the globe. See Key Findings 2 and 10.
0
2
4
6
8
10
1975 1980 1985 1990 1995 2000 2005 2010 2015 2020
Sea
Ice
Vo
lum
e (
mil
lion
s km
2)
Year
Arctic September Sea Ice Extent
YUKON RESEARCH CENTRE
Executive Summary: Indicators
7
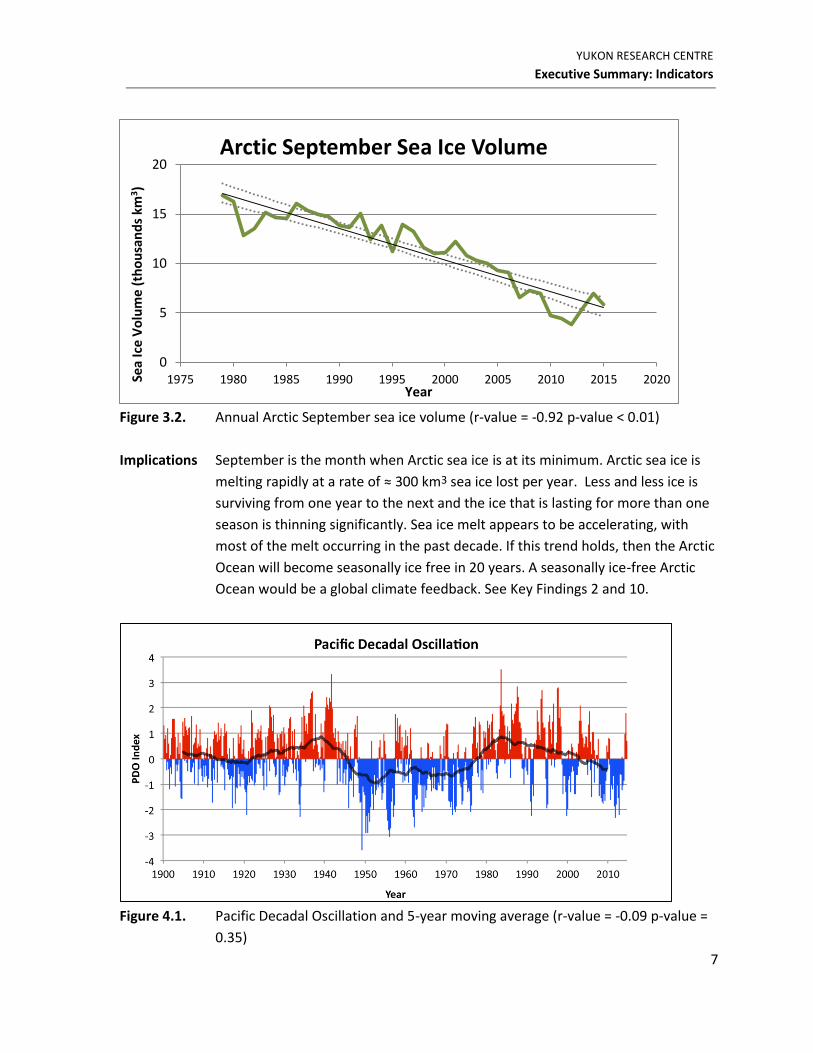
Figure 3.2. Annual Arctic September sea ice volume (r-value = -0.92 p-value < 0.01)
Implications September is the month when Arctic sea ice is at its minimum. Arctic sea ice is
melting rapidly at a rate of ≈ 300 km3 sea ice lost per year. Less and less ice is
surviving from one year to the next and the ice that is lasting for more than one
season is thinning significantly. Sea ice melt appears to be accelerating, with
most of the melt occurring in the past decade. If this trend holds, then the Arctic
Ocean will become seasonally ice free in 20 years. A seasonally ice-free Arctic
Ocean would be a global climate feedback. See Key Findings 2 and 10.
Figure 4.1. Pacific Decadal Oscillation and 5-year moving average (r-value = -0.09 p-value =
0.35)
0
5
10
15
20
1975 1980 1985 1990 1995 2000 2005 2010 2015 2020Sea
Ice
Vo
lum
e (
tho
usa
nd
s km
3)
Year
Arctic September Sea Ice Volume
REPORT
Yukon Climate Change Indicators and Key Findings
8
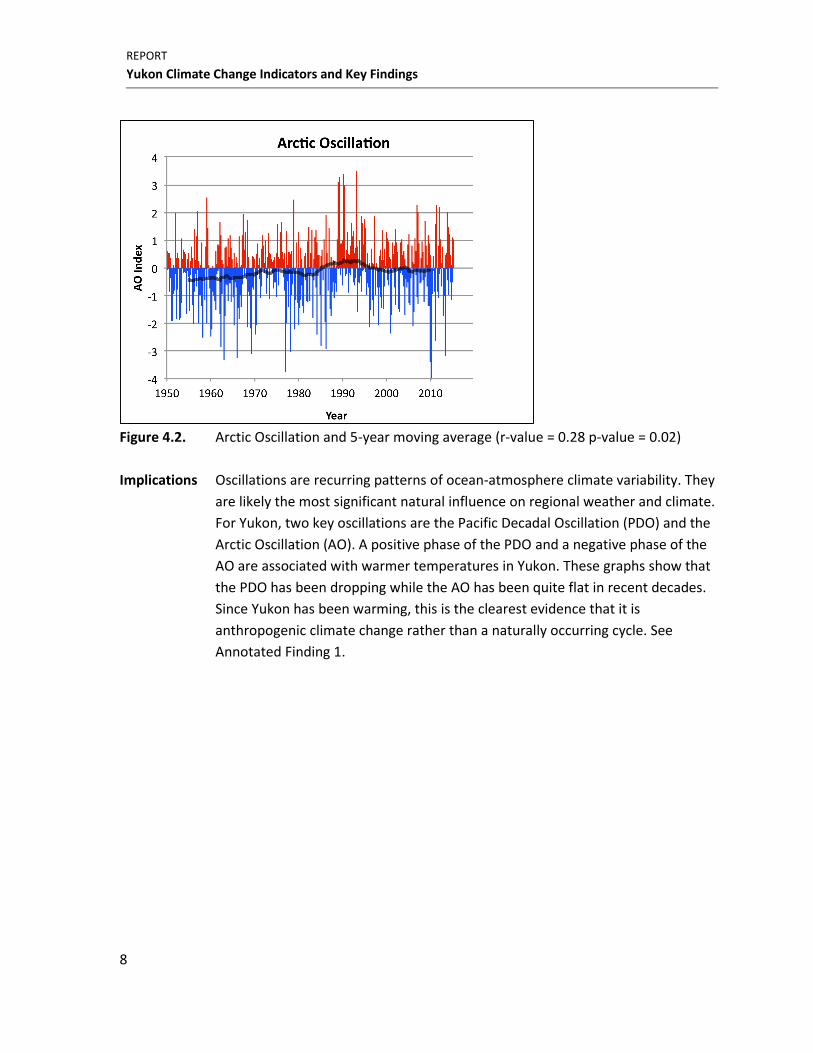
Figure 4.2. Arctic Oscillation and 5-year moving average (r-value = 0.28 p-value = 0.02)
Implications Oscillations are recurring patterns of ocean-atmosphere climate variability. They
are likely the most significant natural influence on regional weather and climate.
For Yukon, two key oscillations are the Pacific Decadal Oscillation (PDO) and the
Arctic Oscillation (AO). A positive phase of the PDO and a negative phase of the
AO are associated with warmer temperatures in Yukon. These graphs show that
the PDO has been dropping while the AO has been quite flat in recent decades.
Since Yukon has been warming, this is the clearest evidence that it is
anthropogenic climate change rather than a naturally occurring cycle. See
Annotated Finding 1.
YUKON RESEARCH CENTRE
Executive Summary: Indicators
9
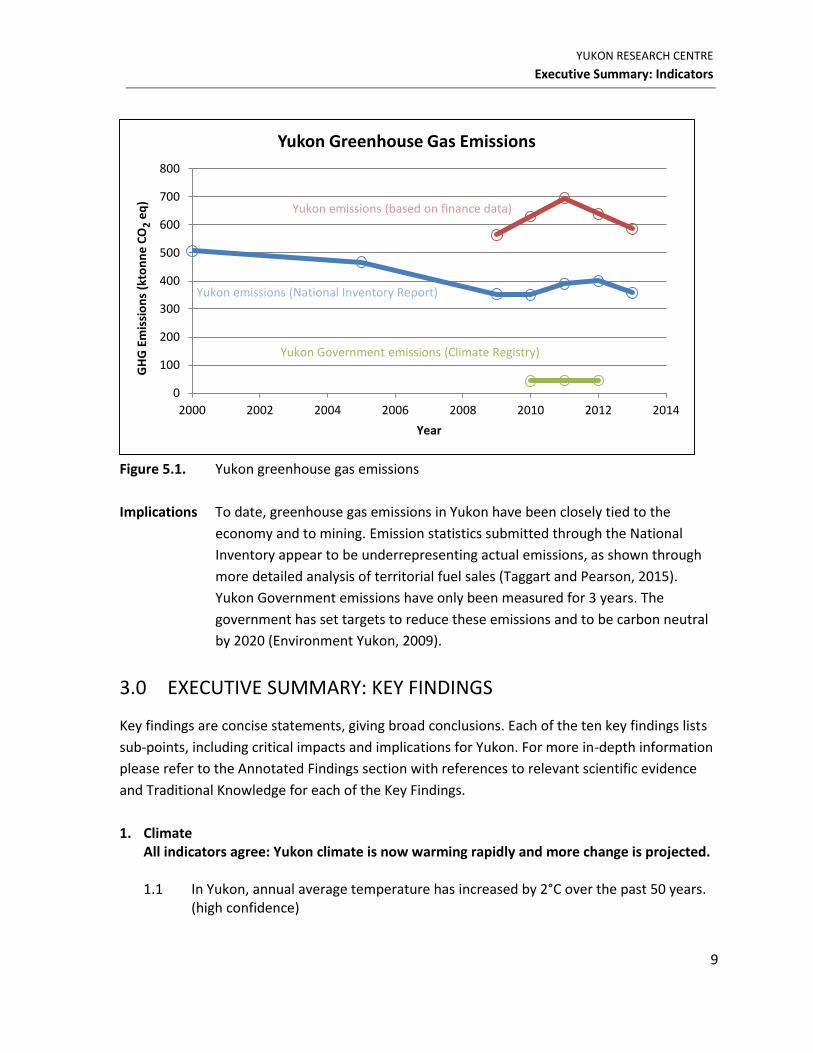
Figure 5.1. Yukon greenhouse gas emissions
Implications To date, greenhouse gas emissions in Yukon have been closely tied to the
economy and to mining. Emission statistics submitted through the National
Inventory appear to be underrepresenting actual emissions, as shown through
more detailed analysis of territorial fuel sales (Taggart and Pearson, 2015).
Yukon Government emissions have only been measured for 3 years. The
government has set targets to reduce these emissions and to be carbon neutral
by 2020 (Environment Yukon, 2009).
3.0 EXECUTIVE SUMMARY: KEY FINDINGS
Key findings are concise statements, giving broad conclusions. Each of the ten key findings lists
sub-points, including critical impacts and implications for Yukon. For more in-depth information
please refer to the Annotated Findings section with references to relevant scientific evidence
and Traditional Knowledge for each of the Key Findings.
1. Climate All indicators agree: Yukon climate is now warming rapidly and more change is projected. 1.1 In Yukon, annual average temperature has increased by 2°C over the past 50 years.
(high confidence)
0
100
200
300
400
500
600
700
800
2000 2002 2004 2006 2008 2010 2012 2014
GH
G E
mis
sio
ns
(kto
nn
e C
O2
eq
)
Year
Yukon Greenhouse Gas Emissions
Yukon Government emissions (Climate Registry)
Yukon emissions (National Inventory Report)
Yukon emissions (based on finance data)
REPORT
Yukon Climate Change Indicators and Key Findings
10
1.2 This increase is twice the rate of Southern Canada and the entire globe. (high confidence)
1.3 Winters are warming more than other seasons: 4°C over the past 50 years. (high confidence)
1.4 Annual precipitation has increased by about 6% over the past 50 years. Summers have seen the largest increase in precipitation. Precipitation has more variability in the data record (both spatially and temporally). Therefore we have less confidence in determining this historic trend. (medium confidence)
1.5 Increasing global concentrations of carbon dioxide and other greenhouse gases are projected to contribute to a continuing increase in annual precipitation and warming across all scenarios. Annual warming is projected to be an additional 2 to 2.5°C in Yukon over the next 50 years. Precipitation is projected to increase 10 to 20% over the next 50 years. (medium confidence)
1.6 Increasing evapotranspiration and a lengthening of the shoulder seasons are among the projected changes that are likely to persist for the foreseeable future. (medium confidence)
1.7 Additional evidence of northern warming comes from widespread melting of glaciers and sea ice, and the degradation of permafrost. (very high confidence)
1.8 Beyond the historic and projected trends, the variability of our climate is expected to increase. This will mean an increase in extreme weather events and greater fluctuations in precipitation. (high confidence)
1.9 Unexpected and even larger shifts in the climate system are possible. (medium confidence)
2. Melt and Thaw Permafrost is thawing; glaciers are receding and sea ice is melting.
2.1 Warmer temperatures have resulted in widespread melting of glaciers and the rate of melt is increasing. The Alaska-Yukon icefields have shown retreat in glacier fronts and volumes, contributing to increased river flow and global sea level rise. Yukon has lost 22% of its glacial cover over the last 50 years. (very high confidence)
2.2 Permafrost is degrading and more thaw is projected. Permafrost thaw typically occurs through an increase in the depth of the active layer. (very high confidence)
2.3 Thawing ground will disrupt transportation, buildings, and other infrastructure. Permafrost degradation has potentially serious implications for those mine dams and tailing ponds which are dependent on permafrost berms. (very high confidence)
2.4 Warming and thaw of permafrost are very likely to alter the release and uptake of greenhouse gases from soils, vegetation, and coastal oceans. (high confidence)
2.5 Arctic sea ice is melting. More than 50% of the summer sea ice volume has been lost in the last decade alone. The Arctic Ocean is projected to be ice-free in summer in the first half of this century. A seasonally ice-free Arctic Ocean can have far reaching consequences for the climate of North America. (high confidence)
2.6 Melting of highly reflective snow, and especially sea ice, reveals darker land and ocean surfaces. This increases absorption of the sun’s energy, and further warms the
YUKON RESEARCH CENTRE
Executive Summary: Key Findings
11
circumpolar North (and the planet). This is the main reason that the North will continue to warm at double the rate compared to the rest of the planet. (high confidence)
3. Water Climate change is affecting and will continue to affect the hydrologic regime. 3.1 Changes in the hydrologic response are driven by changes in temperature and
precipitation. Increasing melt of glaciers, degradation of permafrost, variability in both rain and snow, earlier snowmelt, and late season fluctuations through the freeze-thaw cycle all affect the hydrologic regime. (very high confidence)
3.2 Streamflow and groundwater flow patterns are changing. As permafrost degrades, pathways increase for groundwater, resulting in an increase in winter low flows. (high confidence)
3.3 Flood risk is increasing. Rain and storm events are projected to increase; late season freeze-thaw cycles on rivers are creating ice which is more prone to ice-jam damming; heavy snowpack with warmer springs is leading to freshet flooding. (high confidence)
3.4 Warming, degradation of permafrost, and increased flooding negatively impact water quality through increased turbidity and in some cases through contaminants. (high confidence)
4. Vegetation Vegetation zones are shifting, fire risk is up, forests are more vulnerable to insect infestations.
4.1 Treeline is moving northward and to higher elevations. Elders are saying that the
‘bush’ and the forest are changing. Shrubification is happening rapidly. (high confidence)
4.2 More productive vegetation is likely to increase carbon uptake, although positive feedbacks (e.g. reduced reflectivity, methane release, etc.) are likely to outweigh this, causing further warming. (high confidence)
4.3 The Yukon ecosystem has seen recent significant disturbances, some of which are related to climate change, e.g. invasive species, insect infestations, disease, and biodiversity loss. (high confidence)
4.4 The spruce bark beetle outbreak, intensified by warmer conditions and drought stress, killed half of the mature spruce forest in the southwest Yukon. The mountain pine beetle is close to reaching Yukon. (very high confidence)
4.5 Insect outbreaks, variability in precipitation, warming temperatures, longer shoulder seasons, and increased winds increase the risk of forest fire (in both frequency and severity) and will facilitate invasion by non-native species. (high confidence)
4.6 Widespread proactive adaptation is important in natural resource management where climate change impacts are projected to be significant. (very high confidence)
REPORT
Yukon Climate Change Indicators and Key Findings
12
5. Wildlife Animal species' habitat, ranges, and diversity are changing. 5.1 Foraging mammals, such as woodland and barren ground caribou, and other land
animals are likely to be increasingly stressed as climate change alters the nutrient value in their food sources, access to food, breeding grounds, and historic migration routes. (medium confidence)
5.2 Species ranges are projected to shift northward on both land and sea, bringing new species into the North while severely limiting some species currently present. (high confidence)
5.3 Winter and spring feeding have become more difficult due to deeper snows and increased layers of ice on and in the snow. Spring and summer have seen greater levels of insect harassment. (high confidence)
5.4 While warmer weather will favour survival, it is uncertain what the cumulative effects will be on terrestrial wildlife. (medium confidence)
5.5 As the rivers change in flow, temperature, and sediment load, fish habitat is also changing. There are no current predictions of what the cumulative impact(s) will be other than to note it will put stress on the species. We also know that there are other downstream influences (which are sometimes climate related) especially for long migration species such as salmon. (high confidence)
5.6 Changes in caribou and salmon migration patterns and populations have already been observed in Yukon. (high confidence)
5.7 Impacts of Yukon climate change will have implications for biodiversity around the world because some migratory species (e.g. waterfowl) depend on breeding and feeding grounds in the North. (high confidence)
5.8 Invasive species are expected to increase. (high confidence) 5.9 For Yukon First Nations, the effects of climate change on wildlife and food security
are the two biggest concerns. (very high confidence)
6. Food Climate change negatively impacts First Nations traditional food security. Agriculture is a potential opportunity. 6.1 For Yukon First Nations, the effects of climate change on wildlife and food security
are the two biggest concerns. (very high confidence) 6.2 Many Yukoners, especially First Nations, depend on hunting, fishing, and gathering,
not only for traditional food and to support the local economy, but also as the basis for cultural and social identity. (high confidence)
6.3 Several established climate-related changes in the north have implications for northern food security: hydrological impacts, increased variability of precipitation, and the freeze-thaw cycle have implications for movement of fish and wildlife, foraging, and access to harvesting sites. (high confidence)
YUKON RESEARCH CENTRE
Executive Summary: Key Findings
13
6.4 There is evidence that Yukoners have been consuming fewer traditional foods and more market foods due to the effects of climate change, which may have negative health consequences. (medium confidence)
6.5 First Nations people have the right to access, manage, and harvest fish and wildlife, yet the abundance and health of these resources may be affected by climate change. (medium confidence)
6.6 Where suitable soils are present, agriculture has the potential to expand due to a longer and warmer growing season. Field-based agriculture may be challenged by precipitation variability. (medium confidence)
7. Hazards and Infrastructure The major climate change hazards in Yukon are flood, wildfire, and damage to infrastructure from thawing permafrost and/or extreme precipitation. Roads, buildings, and infrastructure built without the future climate in mind are vulnerable. 7.1 Yukon communities are located along rivers and in forested areas. This makes
flooding and wildfire critical hazards. Climate change is increasing both the likelihood and potential severity of these hazards. (high confidence)
7.2 Permafrost thaw, wildfire, and more intense precipitation events will result in more landslides and subsequent silt runoff. (high confidence)
7.3 Existing infrastructure was designed and built based on historical climate data that may not be appropriate for future conditions. Even small increases in snow load, storm severity and frequency, and thawing permafrost can directly affect the structural integrity of infrastructure. (very high confidence)
7.4 As frozen ground thaws, some existing buildings, roads, airports, and industrial facilities are likely to be destabilized, requiring substantial rebuilding, maintenance, and investment. (very high confidence)
7.5 Future development will require new design elements to account for ongoing warming that may add to construction and maintenance costs. These costs need to be considered against the potential costs of infrastructure failure. (very high confidence)
7.6 Industry, such as mining, is also vulnerable to climate hazards, which can increase downstream risks. (very high confidence)
7.7 As hydrological regimes change so too may our hydro-electric generation capacity. It is important to consider volume of flow, timing of flow, and flooding. (very high confidence)
7.8 New guides and standards are being designed to address hazard risk to infrastructure. (very high confidence)
8. Traditional Knowledge TK is an important way to understand climate change, which complements the scientific approach.
REPORT
Yukon Climate Change Indicators and Key Findings
14
8.1 Indigenous knowledge and observations provide an important source of information about climate change. This knowledge is complementary to information from scientific research, and also indicates that substantial changes have already occurred. (very high confidence)
8.2 People who live close to the land and practice traditional ways see the detailed impacts of climate change in the North. (high confidence)
8.3 People who live close to the land and practice traditional ways are more vulnerable to the impacts of climate change in the North. (medium confidence)
8.4 As the climate changes, it affects the land, the wildlife, access to food, and even the cultural identity of First Nations people. (medium confidence)
8.5 Northern communities are resilient; however, climate change adds stress and strain to community capacity and resilience. (high confidence)
9. Causes and Responses Climate change is human caused. Yukon is responding both to the impacts of climate change and to reduce emissions.
9.1 According to the most recent report from the Intergovernmental Panel on Climate Change, it is unmistakable that the climate is warming and that over the past 50+ years, human activity has been responsible for that warming. (very high confidence)
9.2 Adaptation is how we address the impacts of climate change. Mitigation is how we address the cause of climate change. It is important to always keep in mind both of these challenges and wherever possible to look for solutions which both mitigate and adapt. (very high confidence)
9.3 Integrating climate change considerations into existing planning processes is a method of reducing risk while taking advantage of existing procedures. (high confidence)
9.4 Key areas where climate change considerations can be integrated into existing planning processes include energy planning, emergency preparedness, sustainability planning, resource management, infrastructure development, land-use planning, engineering design, transportation planning, etc. (very high confidence)
9.5 Public education, research, and in particular community-based research remain as critical needs in order to better understand Yukon climate change and how to address it. (very high confidence)
10. Importance of the North
Climate change in the North is a major driver of global change.
10.1 The North has most of the known significant feedback mechanisms for the global climate. In effect this means that what happens across the North will have consequences for the global climate system. (high confidence)
10.2 The biggest change is the loss of Arctic sea ice, which is accelerating due to the albedo reversal from reflective ice to absorptive ocean. As the Arctic Ocean comes ‘on line’ it will have very far-reaching effects. (high confidence)
YUKON RESEARCH CENTRE
Executive Summary: Key Findings
15
10.3 Research is emerging showing that the jet stream is being influenced by the melting Arctic Ocean, creating larger ‘loops,’ which is in turn causing new weather patterns e.g. snowy winters on the North American Eastern seaboard. (high confidence)
10.4 Carbon and methane trapped within and below permafrost may be released into the atmosphere as permafrost thaws. This would lead to an acceleration of climate warming. (high confidence)
10.5 Glacial melt and ocean warming are leading to sea level rise. Glacial melt and diminishing sea ice also affect the global ocean currents. The mechanism which drives most of the ocean circulation is the thermohaline circulation - the sinking of dense cold and salty water - in the polar regions. (high confidence)
10.6 Many Arctic/northern species migrate to other parts of the globe. Changes to these species will affect other parts of the planet and vice versa. (medium confidence)
4.0 METHODOLOGY
4.1 INTRODUCTION
This report was prepared anticipating a wide audience, from researchers to decision makers to
those who are simply curious to understand how climate change is affecting Yukon. This section
is meant to provide insight into how the Yukon Climate Change Indicators and Key Findings
report was developed, and thus to provide the reader with an objective assessment of the
scope and limitations of the report.
4.2 INDICATORS
Climate is long-term weather. Most often temperature increase is cited as a universal indicator.
While temperature remains a critical indicator, it is important to consider a broader range of
data, which provides a fuller look at climate in its many facets, interconnections, and variability.
What makes a good indicator? How were these indicators chosen over others? Following is a set
of criteria/characteristics for the indicators chosen for this report:
Data quality:
o Has the data been collected in a systematic and standardized fashion?
o Is the source of the data reputable?
Accessibility:
o Is the data open and freely accessible?
Coverage:
o Is there sufficient data for Yukon?
o Or is the data regionally influential for Yukon?
o What is the length of the data series (given climate is a long-term average)?
REPORT
Yukon Climate Change Indicators and Key Findings
16
Relevance:
o Is this data set representing a key component(s) of climate?
o Does it cover off one or more of the many sectors/aspects of climate change?
The best indicators are accurate, repeatable, unambiguous, and representative. One of the
biggest challenges in understanding climate change is to differentiate between different signals:
Weather (short-term variability) and climate (long-term trend and variability)
Natural variations (e.g. ocean oscillations) and human-induced change (e.g. anthropogenic
warming)
Impacts due to climate change and impacts exacerbated by other stressors (e.g. habitat
encroachment, fishing by-catch, etc.)
Each of the indicators is presented as a graph with a discussion of how/why the indicator is
relevant. In Appendix A, each indicator is described through a standardized template. The
source data, supporting documentation, and reference material are supplied in a digital library
accompanying the Yukon Climate Change Indicators and Key Findings report. Open data sources
are useful so the indicators can be updated regularly and so the data can be shared and
integrated into other research and analysis.
When considering the indicators, remember that the climate system is complex, meaning that a
range of indicators usually gives a more robust picture than just one indicator. Consider the
trends and also the variability in the data record. It is important to look at the
confidence/uncertainty and any limitations of the data as well. These are all listed in the
templates.
Several indicators which might be useful in characterizing climate change are flagged below
under the Future Research heading for consideration in subsequent updates to the Yukon
Climate Change Indicators and Key Findings report.
4.3 KEY FINDINGS
Key findings are condensed, evidence-based conclusions. The key findings are derived from the
indicators, research, and Traditional Knowledge. The purpose of the key findings is to allow
readers to cross disciplines and to consider a range of conclusions being reached over the
spectrum of knowledge. The key findings are also meant to provide coherent and concise
information for decision makers. The goal is to try and provide findings which are policy-
relevant without being prescriptive.
YUKON RESEARCH CENTRE
Methodology
17
The literature review included peer-reviewed research as well as reputable local reports. Take
for example the Yukon Climate Change Needs Assessment, 2011, which identified priority areas
of concern for First Nations and Yukon communities within the context of climate change. This
report was researched and published by the Council of Yukon First Nations. Several other
reports have also been invaluable and are worth noting here: the Arctic Climate Impact
Assessment, 2004; the “Northern Canada” chapter of From Impacts to Adaptation: Canada in a
Changing Climate, 2007; and the Fifth Assessment Report of the Intergovernmental Panel on
Climate Change (IPCC), 2013. The IPCC is “the scientific body established to collect and
synthesize the world’s best research on climate change” (Environment Yukon, 2009).
Each of these reports synthesizes the science and TK (where available) at their respective levels:
Arctic, pan-territorial, and global. Finally, and most importantly, the 2013 Compendium of Yukon
Climate Change Science collated by the Northern Climate ExChange (NCE) is a tremendous asset
in identifying peer-reviewed research on climate change here in Yukon.
4.4 FUTURE RESEARCH
Below is an initial list of potential future research and/or work, which might be added to
subsequent iterations of this report:
Melt indicators (spatial extent and/or mass/volume loss)
Growing degree days and/or frost-free days indicators
Hydrological indicators, e.g. flooding; rainfall intensity, duration, and frequency curves; etc.
Biome shift indicators
Yukon downscaling of fourth generation global climate model data based on the IPCC Fifth
Assessment Report and the new methodology of representative concentration pathways
(RCPs)
Cataloguing of existing infrastructure at risk due to permafrost degradation, including a first
order approximation at costs within Yukon, and especially looking at any severe risk
infrastructure such as mine tailing ponds which structurally utilize permafrost for retention
Methodology to assess increased risk of wildfire due to climate change, and integration of
those risk models into comprehensive hazard assessment as well as into existing wildland
fire management strategies
Deeper look at agriculture under a changing climate here in Yukon
As noted in the Executive Summary, there is an ongoing need to document TK and
community-relevant local knowledge
REPORT
Yukon Climate Change Indicators and Key Findings
18
4.5 UNCERTAINTY
While uncertainty needs to be assessed and considered, it is important to recognize that there
is also a significant amount of evidence, agreement, and thus confidence in the existing climate
change science and Traditional Knowledge. Some uncertainty will always remain in
understanding climate, climate change, and projecting future climate variability.
How should we manage and address uncertainty? This report follows the approach of the IPCC
based on their Guidance Note for Lead Authors of the IPCC Fifth Assessment Report on
Consistent Treatment of Uncertainties (Mastrandrea et al., 2010). “Generally, evidence is most
robust when there are multiple, consistent independent lines of high-quality evidence.” Each
key finding is assigned a level of confidence on a scale ranging from very low, low, medium, high
through to very high. Subject experts were asked to judge the “validity of findings as
determined through evaluation of evidence and agreement.”
Changes in the climate are occurring alongside many other stresses, including for example
pollution, harvesting pressures, land use change, habitat fragmentation, human population
growth, cultural shifts, and economic change. Complexity can increase uncertainty. “The
physical, biological and socio-economic impacts of climate change in the Arctic have to be seen
in the context of often interconnected factors that include not only environmental changes
caused by drivers other than climate change but also demography, culture and economic
development. Climate change has compounded some of the existing vulnerabilities caused by
these other factors (high confidence)” (Larsen et al., 2013).
Here in Yukon, we already know that climate change has been and is projected to be more
significant than in many other regions. Decision makers need to understand the complexities of
climate change, the risks of impacts (including likelihood, severity, capacity), and how the
challenges and opportunities overlap and/or intersect. Having a consistent treatment of
uncertainties allows the reader to judge and even prioritize actions. For example, where we lack
a clear understanding around a particular critical area, then a typical response might be to call
for baseline monitoring in order to refine our knowledge.
5.0 ANNOTATED FINDINGS
1. Climate All indicators agree: Yukon climate is now warming rapidly and more change is projected.
YUKON RESEARCH CENTRE
Annotated Findings
19
The climate indicators listed in this report – temperature, precipitation, water (e.g. Dawson
Yukon River break up, Log Cabin snowfall, snow water equivalent, etc.), fire history, fire severity
index, Arctic sea ice extent, and Arctic sea ice volume – all indicate a warming trend. The trends
for fire history are not significant, meaning more data is required before we could be certain of
using this information in a stand-alone fashion.
All climate global circulation models (under all scenarios) project further warming for Yukon.
See for example, ACIA, 2004: “Winter increases in Alaska and western Canada have been
around 3-4 ̊C over the past half century. Larger increases are projected this century.”
The Pacific Decadal Oscillation (PDO) and Arctic Oscillation (AO) indicators show two of the
dominant natural influences on Yukon climate. The PDO has been in a cooling phase since about
2007, and on a downward trend since about 1985. At the same time Yukon temperatures have
continued to warm. For the AO, a positive phase is brought about when circumpolar winds
contain polar temperatures in the high north. For the past two decades the AO has been
neutral. The implication is that the anthropogenic influences of global warming are having a
stronger effect than the natural influences of the PDO and/or AO. See Appendix A – 4.1 Ocean
Oscillation Indicators.
1.1 In Yukon, annual average temperature has increased by 2°C over the past 50 years. (high confidence)
See the Climate Trends indicator based on Environment Canada Climate Trends and Variations
Bulletin, 2013. Best fit trend line from 1963 to 2013 shows a +2.0°C increase in temperature.
1.2 This increase is twice the rate of Southern Canada and the entire globe. (high confidence)
See for example National Oceanic and Atmospheric Association (NOAA) monthly global
temperature anomaly index: (http://www.ncdc.noaa.gov/monitoring-
references/faq/anomalies.php). Over the past 50 years the best fit trend line for this dataset
shows a +0.7°C increase in global temperature. There is no strict definition of Southern Canada
so an exact comparison is difficult; however, again using Environment Canada Climate Trends
and Variations Bulletin, 2013, averaging the regions of Atlantic Canada, Great Lakes/St.
Lawrence, Prairies, South B.C. Mountains and Pacific Coast, then, best fit trend line from 1963
to 2013 shows a +1.2°C increase in temperature.
1.3 Winters are warming more than other seasons: 4°C over the past 50 years. (high confidence)
REPORT
Yukon Climate Change Indicators and Key Findings
20
See the Climate Trends indicator based on Environment Canada Climate Trends and Variations
Bulletin, 2013. Best fit trend line from 1963 to 2013 shows a +4.3°C increase in temperature.
“All community experts noted a marked increase in temperatures during their lifetimes, with
greater increases in recent decades (19/20). They observed that they rarely see temperatures
that fall below −45 ̊C anymore. Some of the largest temperature increases were observed to be
occurring during the fall season (5/20). It was noted that winters are generally getting warmer.
One participant noted that ‘it doesn’t stay as cold anymore. We have started seeing rain in
November. It only stays cold for two weeks at a time.’ While temperatures are generally
understood to be increasing, a number of community experts noted that they thought that the
summers were cooler now than in the past (2/20).” (Wilson et al., 2015)
1.4 Annual precipitation has increased by about 6% over the past 50 years. Summers have seen the largest increase in precipitation. Precipitation has more variability in the data record (both spatially and temporally). Therefore we have less confidence in determining this historic trend. (medium confidence)
See the Climate Trends indicator based on Environment Canada Climate Trends and Variations
Bulletin, 2013. Best fit trend line from 1963 to 2013 shows a +6.4% increase in precipitation. The
standard deviation over that time period is ±8.0%. Best fit trend line from 1963 to 2013 shows a
+14.1% increase in summer precipitation.
With respect to TK: “Many community experts perceived changes in precipitation in the form of
rain and snowfall (15/20). While one community expert observed that rainfall was decreasing,
leading to an overall drying of the landscape (1/20), others noted an overall increase in rainfall
(6/20). The same community experts observed changes in the timing of rainfall, which normally
falls in August. Snow arrives later in the fall (2/20), and snowfall has decreased during the fall
and winter months (6/20). One Elder commented as follows: ‘There seems to be a lot of rain, it
is raining off and on, and the snow is unpredictable. Years ago we used to pretty much know
how much we would get. The past 15 years we don’t know what we will get, and this past
winter we didn’t get any.’” (Wilson et al., 2015)
1.5 Increasing global concentrations of carbon dioxide and other greenhouse gases are projected to contribute to a continuing increase in annual precipitation and warming across all scenarios. Annual warming is projected to be an additional 2 to 2.5°C in Yukon over the next 50 years. Precipitation is projected to increase 10 to 20% over the next 50 years. (medium confidence)
YUKON RESEARCH CENTRE
Annotated Findings
21
See the Climate Projection indicators based on Environment Canada Climate models:
CGCM3.1/T63 the third Canadian Global Circulation Model. Best fit trend line from 2001 to 2100
shows a +0.5°C/decade increase in temperature (for the A2 Scenario).
For information on climate modeling, the IPCC Fourth Assessment Report states “there is
considerable confidence that climate models provide credible quantitative estimates of future
climate change, particularly at continental scales and above. This confidence comes from the
foundation of the models in accepted physical principles and from their ability to reproduce
observed features of current climate and past climate changes. Confidence in model estimates
is higher for some climate variables (e.g., temperature) than for others (e.g., precipitation). Over
several decades of development, models have consistently provided a robust and unambiguous
picture of significant climate warming in response to increasing greenhouse gases.” (IPCC,
2007)
From the IPCC’s Fifth Assessment Report: Physical Science, Summary for Policymakers:
“Continued emissions of greenhouse gases will cause further warming and changes in all
components of the climate system. Limiting climate change will require substantial and
sustained reductions of greenhouse gas emissions.” (Stocker et al., 2013)
1.6 Increasing evapotranspiration and a lengthening of the shoulder seasons are among the projected changes that are likely to persist for the foreseeable future. (medium confidence)
Evapotranspiration is possibly increasing even faster than increases in precipitation, meaning
that more rain does not necessarily equate to more ground moisture here in Yukon (SNAP,
2011). Lengthening of the shoulder seasons is a direct consequence of warming spring and
autumn seasons (Environment Canada, 2013). For information on climate projections see for
example Appendix A Indicators - 1.2 Climate Projections.
1.7 Additional evidence of northern warming comes from widespread melting of glaciers and sea ice, and the degradation of permafrost. (very high confidence)
See full references below on Key Finding 2 – Melt and Thaw.
1.8 Beyond the historic and projected trends, the variability of our climate is expected to increase. This will mean an increase in extreme weather events and greater fluctuations in precipitation. (high confidence)
REPORT
Yukon Climate Change Indicators and Key Findings
22
For example, in a special report focused on extreme events, the IPCC states, “it is likely that the
frequency of heavy precipitation or the proportion of total rainfall from heavy falls will increase
in the 21st century over many areas of the globe.“ (IPCC, 2012)
“Our holistic review presents a broad array of evidence that illustrates convincingly; the Arctic is
undergoing a system-wide response to an altered climatic state. New extreme and seasonal
surface climatic conditions are being experienced, a range of biophysical states and processes
influenced by the threshold and phase change of freezing point are being altered, hydrological
and biogeochemical cycles are shifting, and more regularly human sub-systems are being
affected.” (Hinzman et al., 2005)
In particular the North is expected to have more climate variability: “Temperature increases are
projected to be much greater in the Arctic than for the world as a whole. It is also apparent that
the year-to-year variability is greater in the Arctic.” (ACIA, 2004)
1.9 Unexpected and even larger shifts in the climate system are possible. (medium confidence)
The IPCC’s Climate Change 2013: The Physical Science Basis has a section on irreversibility and
abrupt change which states that a “number of components or phenomena within the climate
system have been proposed as potentially exhibiting threshold behaviour. Crossing such
thresholds can lead to an abrupt or irreversible transition into a different state of the climate
system or some of its components.” Examples given of potential irreversibility of the climate
system all have a relationship to the Arctic: i) Atlantic meridional overturning circulation (the
Gulf Stream); ii) changes in permafrost, methane clathrates, and forests; and iii) changes in the
cryosphere. (Stocker et al., 2013)
2. Melt and Thaw Permafrost is thawing; glaciers are receding and sea ice is melting.
The changes to the cryosphere listed in the chapter titled “Northern Canada” of Natural
Resource Canada’s From Impacts to Adaptation can be summarized as follows: warmer
temperatures have resulted in widespread melting of glaciers and sea ice and the rate of melt is
increasing. Thawing of permafrost is projected. The Alaska-Yukon icefields have shown retreat
in glacier fronts and volumes contributing to global sea level rise. The Arctic Ocean is projected
to be summer-ice-free this century. (Furgal and Prowse, 2008)
2.1 Warmer temperatures have resulted in widespread melting of glaciers and the rate of melt is increasing. The Alaska-Yukon icefields have shown retreat in glacier fronts and
YUKON RESEARCH CENTRE
Annotated Findings
23
volumes, contributing to increased river flow and global sea level rise. Yukon has lost 22% of its glacial cover over the last 50 years. (very high confidence)
“Mountain glaciers comprise a small and widely distributed fraction of the world’s terrestrial
ice, yet their rapid losses presently drive a large percentage of the cryosphere’s contribution to
sea level rise. Regional mass balance assessments are challenging over large glacier populations
due to remote and rugged geography, variable response of individual glaciers to climate change,
and episodic calving losses from tidewater glaciers. In Alaska, we use airborne altimetry from
116 glaciers to estimate a regional mass balance of -75 ± 11 Gt yr-1 (1994–2013).” (Larsen et al.,
2015)
“Total mass loss from all glaciers in the world, excluding those on the periphery of the ice
sheets, was very likely 226 ± 135 Gt yr–1 (sea level equivalent, 0.62 ± 0.37 mm yr–1) in the
period 1971–2009, 275 ± 135 Gt yr–1 (0.76 ± 0.37 mm yr–1) in the period 1993–2009, and 301 ±
135 Gt yr–1 (0.83 ± 0.37 mm yr–1) between 2005 and 2009.” (Vaughan et al., 2013)
Derksen et al. (2012) assess that Yukon glaciers “lost 22 % of their surface area (a total loss of
2,541± 189 km2) over the 50 year period, representing a total mass loss of 406±177 Gt
(equivalent to 1.13±0.49 mm of global sea level rise).”
“The subpolar glaciers in Alaska and northwestern Canada, bordering the Gulf of Alaska, […] are
the largest known contributors to global sea level rise of all mountain glacier systems, showing
significant accelerated ice loss and wastage.” (Luthcke et al., 2008)
“[G]laciers in northwestern North America have contributed to about 10% of the rate of global
sea level rise during the last half-century and […] the rate of mass loss has approximately
doubled during the past decade.” (Arendt, 2006)
2.2 Permafrost is degrading and more thaw is projected. Permafrost thaw typically occurs through an increase in the depth of the active layer. (very high confidence)
“Longer-term records show that permafrost is warming at almost all sites across the North
American permafrost region.” (Smith et al., 2010)
“[T]emperatures in the mountain permafrost of the central and southern Yukon are warmer
than would be predicted from local climate stations, so that permafrost is probably both less
extensive and more sensitive to warming.” (Smith et al., 2010)
REPORT
Yukon Climate Change Indicators and Key Findings
24
“Degrading permafrost increases the thickness of the active layer, decreases the overall
thickness of the permafrost and, in certain areas, eliminates the presence of underlying
permafrost entirely. These actions place a greater reliance on the interaction between surface
and subsurface processes.” (Janowicz, 2008)
As part of the Ninth International Conference on Permafrost, researchers from the University of
Ottawa, the Geological Survey of Canada, and the Yukon Geological Survey revisited permafrost
test sites measured along the Alaska Highway in 1964. “More than half of the positively located
sites which had permafrost in the upper 1.5 m in 1964 along the route as a whole no longer
exhibited perennially frozen ground in 2007, and this was true of almost three-quarters of the
sites in the route segment to the south of Fort Nelson, B.C. In addition, where permafrost was
still extant in the upper 1.5 m, active layers on average were deeper than in 1964, even though
the survey was undertaken one month earlier in the thaw season.” (James et al., 2008)
In 2008 work was done in the Yukon Arctic showing that “mean annual temperatures at the top
of permafrost and at 20-m depth have increased by 2.6 and 1.9°C, respectively, since 1899–
1905, and the perturbation in ground temperature has reached about 120-m depth. Active layer
thickness measured in the terrain types studied on Herschel Island is about 55 cm, 15 to 25 cm
greater than field data from these units collected in 1985.” (Burn and Zhang, 2009)
2.3 Thawing ground will disrupt transportation, buildings, and other infrastructure. Permafrost degradation has potentially serious implications for those mine dams and tailing ponds which are dependent on permafrost berms. (very high confidence)
See full references below on Key Finding 8 - Infrastructure.
2.4 Warming and thaw of permafrost are very likely to alter the release and uptake of greenhouse gases from soils, vegetation, and coastal oceans. (high confidence)
“Degrading permafrost can alter ecosystems, damage infrastructure, and release enough
carbon dioxide (CO2) and methane (CH4) to influence global climate. The permafrost carbon
feedback (PCF) is the amplification of surface warming due to CO2 and CH4 emissions from
thawing permafrost. An analysis of available estimates [of the] PCF strength and timing indicate
120 ± 85 Gt of carbon emissions from thawing permafrost by 2100. This is equivalent to 5.7 ±
4.0% of total anthropogenic emissions for the [IPCC] representative concentration pathway
(RCP) 8.5 scenario and would increase global temperatures by 0.29 ± 0.21 °C or 7.8 ± 5.7%. For
RCP4.5, the scenario closest to the 2 °C warming target for the climate change treaty, the range
of cumulative emissions in 2100 from thawing permafrost decreases to between 27 and 100 Gt
C with temperature increases between 0.05 and 0.15 °C, but the relative fraction of permafrost
YUKON RESEARCH CENTRE
Annotated Findings
25
to total emissions increases to between 3% and 11%. Any substantial warming results in a
committed, long-term carbon release from thawing permafrost with 60% of emissions occurring
after 2100, indicating that not accounting for permafrost emissions risks overshooting the 2 °C
warming target.” (Schaefer et al., 2014)
“Permafrost thawing will cause lakes and wetlands to drain in some areas, while creating new
wetlands in other places. […] Over time, replacement of arctic vegetation with more productive
vegetation from the south is likely to increase carbon dioxide uptake. On the other hand,
methane emissions, mainly from warming wetlands and thawing permafrost, are likely to
increase.” (ACIA, 2004)
2.5 Arctic sea ice is melting. More than 50% of the summer sea ice volume has been lost in the last decade alone. The Arctic Ocean is projected to be ice-free in summer in the first half of this century. A seasonally ice-free Arctic Ocean can have far reaching consequences for the climate of North America. (high confidence)
Arctic sea ice has been observed since the late 1970’s. Using 1980 to 2000 as a baseline, and
then comparing the last five years (2010 to 2014), the sea ice minima (comparing each year
when the sea ice is at its annual minimum in September) has decreased significantly. Ice extent
has gone from 7.1 million km2 to 5.6 million km2, or a loss of 19% in the last decade. Ice volume
has gone from 13.9 thousand km3 to 5.1 thousand km3, or a loss of 63% in the last decade. See
the indicators for more information.
“The decline of Arctic sea-ice in summer is occurring at a rate that exceeds most model
projections (high confidence).” (Larsen et al., 2013)
“A nearly ice-free Arctic Ocean (sea ice extent less than 1 × 10⁶ km2 for at least 5 consecutive
years) in September before mid-century is likely under RCP8.5 (medium confidence).” (Collins et
al., 2013).
“Sea ice thickness is a fundamental climate state variable that provides an integrated measure
of changes in the high-latitude energy balance. […] The trend in annual mean ice thickness over
the Arctic Basin is −0.58 ± 0.07 m decade –1 over the period 2000–2012. […] [W]e find that the
annual mean ice thickness has decreased from 3.59 m in 1975 to 1.25 m in 2012, a 65 %
reduction.” (Lindsay and Schweiger, 2015)
“New metrics and evidence are presented that support a linkage between rapid Arctic warming,
relative to Northern Hemisphere mid-latitudes, and more frequent high-amplitude (wavy) jet-
stream configurations that favor persistent weather patterns. We find robust relationships
REPORT
Yukon Climate Change Indicators and Key Findings
26
among seasonal and regional patterns of weaker poleward thickness gradients, weaker zonal
upper-level winds, and a more meridional flow direction. These results suggest that as the Arctic
continues to warm faster than elsewhere in response to rising greenhouse-gas concentrations,
the frequency of extreme weather events caused by persistent jet-stream patterns will
increase.” (Francis and Vavrus, 2015)
2.6 Melting of highly reflective snow, and especially sea ice, reveals darker land and ocean surfaces. This increases absorption of the sun’s energy, and further warms the circumpolar North (and the planet). This is the main reason that the North will continue to warm at double the rate compared to the rest of the planet. (high confidence)
“The Arctic region has warmed more than twice as fast as the global average — a phenomenon
known as Arctic amplification. The rapid Arctic warming has contributed to dramatic melting of
Arctic sea ice and spring snow cover, at a pace greater than that simulated by climate models.
These profound changes to the Arctic system have coincided with a period of ostensibly more
frequent extreme weather events across the Northern Hemisphere mid-latitudes, including
severe winters. The possibility of a link between Arctic change and mid-latitude weather has
spurred research activities that reveal three potential dynamical pathways linking Arctic
amplification to mid-latitude weather: changes in storm tracks, the jet stream, and planetary
waves and their associated energy propagation.” (Cohen et al., 2014)
“Temperature change will not be regionally uniform. There is very high confidence that […] the
Arctic region is projected to warm most.” (Collins et al., 2013)
“Melting of highly reflective arctic snow and ice reveals darker land and ocean surfaces,
increasing absorption of the sun’s heat and further warming the planet.” (ACIA, 2004)
3. Water Climate change is affecting and will continue to affect the hydrologic regime.
In 2011, the Water Resources Branch of Environment Yukon released a thorough assessment
titled Yukon Water: An Assessment of Climate Change Vulnerabilities. Below are excerpts from
the Executive Summary:
“The need to monitor and respond to climate change—including its impacts on water—is an
emerging national and territorial priority. Climate change is already altering, and will continue
to alter, the hydrologic cycle in Yukon, affecting not only water-course flows, volumes, and
timing, but also the quality of the water. These changes will inevitably affect every aspect of
YUKON RESEARCH CENTRE
Annotated Findings
27
Yukon life, from day-to-day household practices to industrial development and energy
generation.” (Environment Yukon, 2011)
“It is clear, however, that Yukon’s climate is changing, and so is its hydrologic regime. Over the
last several decades, winter and summer temperatures have increased in all regions, and the
forecast is for continued warming. Most projections for precipitation suggest increases,
particularly in winter. Snowmelt has been starting earlier, particularly in Yukon’s mountain
streams. The period of snow cover is decreasing, anda continued trend of earlier snowmelt
[including more rapid snowmelt events] and associated earlier peak flows can be expected.”
(Environment Yukon, 2011)
“The cryosphere—snow and ice in all their forms—is important to Yukon water resources. It is
also particularly vulnerable to climate change. Increasing air temperatures are already leading
to permafrost warming and degradation. Yukon has lost 22% of its glacial cover over the last50
years, and continued decline could have a profound influence on glacier-dominated basins. The
timing of break-up on the Yukon River at Dawson has advanced by at least five days a century
since records were first kept in 1896, and a similar trend is noted for the Porcupine Riverat Old
Crow. Changes in break-up and spring freshet timing could lead to new problems with ice-jam
floods.” (Environment Yukon, 2011)
“Observed warming over several decades has been linked to changes in the large-scale
hydrological cycle such as: increasing atmospheric water vapour content; changing precipitation
patterns, intensity, and extremes; reduced snow cover and widespread melting of ice; and
changes in soil moisture and runoff. Precipitation changes show substantial spatial and inter-
decadal variability. Over the 20th century, precipitation has mostly increased over land in high
northern latitudes” (Bates et al., 2008)
3.1 Changes in the hydrologic response are driven by changes in temperature and precipitation. Increasing melt of glaciers, degradation of permafrost, variability in both rain and snow, earlier snowmelt, and late season fluctuations through the freeze-thaw cycle all affect the hydrologic regime. (very high confidence)
From TK collected by community members living on the Yukon River at Ruby, Alaska: “The
majority of community experts observed decreased ice thickness on the Yukon River and
consequently an increase in open leads, or places on the river that remain ice-free throughout
the winter (16/20). The snow covers these open leads and makes it dangerous to travel on the
frozen river.” (Wilson et al., 2015)

REPORT
Yukon Climate Change Indicators and Key Findings
28
“Climate change is intrinsically linked with hydrological changes.” (Environment Yukon, 2011)
“Yukon air temperature trends have been observed to change over the last several decades
with an increase in annual, summer and winter air temperatures, while changes in precipitation
have not been consistent. An assessment of freeze-up and break-up dates indicates that the ice
cover season is becoming shorter with delays in freeze-up and advances in break-up timing.
Mid-winter break-up events and associated flooding have been observed for the first time.
Break-up water level trends suggest that break-up severity is increasing. These changes cannot
be definitely attributed to climate change as there is some evidence suggesting that
teleconnections may be a factor. The observed changes have significant implications pertaining
to public safety, and economic impacts on property and infrastructure, transportation networks
and hydroelectric operations. Ice jams and associated backwater and surges also affect aquatic
ecosystems through impacts on biological and chemical processes.” (Janowicz, 2010)
3.2 Streamflow and groundwater flow patterns are changing. As permafrost degrades, pathways increase for groundwater, resulting in an increase in winter low flows. (high confidence)
“A thicker active layer enhances infiltration and associated groundwater recharge, which results
in greater groundwater contributions to streamflow.” (Environment Yukon, 2011)
“The changes in surface streamflow vary by hydrologic regime and season, with increases in
some times and places and decreases elsewhere. Generally, increased river flow [annual
discharge] is projected for high-latitude rivers, such as the Yukon and Mackenzie, to the end of
the 21st century. How climate change will affect groundwater is not well understood at present.
However, the Yukon River Basin is experiencing significant increases in estimated groundwater
flow. Within Yukon, the largest increases were detected in the Yukon headwaters and the
Porcupine River watershed.” (Environment Yukon, 2011)
“Increasing surface air temperatures from anthropogenic forcing are melting permafrost at high
latitudes and intensifying the hydrological cycle. Long-term streamflow records (≥30 yrs) from
23 stream gauges in the Canadian Northwest Territories (NWT) indicate a general significant
upward trend in winter baseflow of 0.5 – 271.6 %/yr and the beginning of significant increasing
mean annual flow (seen at 39% of studied gauge records), as assessed by the Kendall-t test. The
NWT exports an average discharge of ≥308.6 km3/yr to the Beaufort Sea, of which ≥120.9
km3/yr is baseflow. We propose that the increases in winter baseflow and mean annual
streamflow in the NWT were caused predominately by climate warming via permafrost thawing
that enhances infiltration and deeper flowpaths and hydrological cycle intensification.” (St.
Jacques and Sauchyn, 2009)
YUKON RESEARCH CENTRE
Annotated Findings
29
“As permafrost thaws, surface water-dominated systems will transition towards groundwater-
dominated systems.” (Prowse, 2009)
“Yukon air temperature trends have been observed to change over the last several decades
with an increase in both summer and winter air temperatures. An assessment of streamflow
response was carried out to determine if there are apparent trends in permafrost regions as a
result of the observed temperature changes. Degrading permafrost places a greater reliance on
the interaction between surface and subsurface processes. […] Annual mean flows are observed
to have slight positive trends over the last three decades within continuous and discontinuous
permafrost zones, with variable results within sporadic permafrost regions. These results are
generally in keeping with similar trends in annual precipitation, which has increased slightly.
Though not generally statistically significant, annual peak flows have largely decreased within
continuous permafrost regions, and lesser so within discontinuous regions. Results are variable
within sporadic permafrost zones. These trends are likely associated with increased annual
precipitation; however, it is conceivable that there may be increased infiltration amounts as a
result of degrading permafrost. Winter low flows have experienced significant apparent changes
over the last three decades. The greatest changes in winter low flows appear to be occurring
within the continuous permafrost zone, where flows from the majority of sampled streams have
increased. Winter low flows trends in streams within the discontinuous permafrost zone
generally exhibit positive significant trends, but are more variable. Winter streamflow trends
within the sporadic permafrost zone are not consistent.” (Janowicz, 2008)
3.3 Flood risk is increasing. Rain and storm events are projected to increase; late season freeze-thaw cycles on rivers are creating ice which is more prone to ice-jam damming; heavy snowpack with warmer springs is leading to freshet flooding. (high confidence)
“Dawson experienced the warmest winter of its 110 year record during 2002–3. An unusual
period of warm weather and rain during December 2002 produced low elevation snowmelt
resulting in an early winter break-up event and subsequent formation of an ice jam on the
Klondike River. Though there was only minor flooding, the 3km long jam resulted in unusually
high water for the time of year. The jam subsequently refroze, creating ‘jumble’ ice with
thicknesses up to 3m, which had major spring break-up implications on Klondike River water
levels. During spring break-up at the end of April 2003, the lower Klondike valley experienced
one of the most severe break-up floods on record, with a number of residences, businesses and
the Klondike Highway affected.” (Janowicz, 2010)
“Ice jamming and unusual breakup patterns of river ice trigger serious damage to infrastructure.
In 2009, large blocks of river ice drove into and around structures in [Dawson and Eagle Alaska],
causing extensive damage.” (National Round Table on the Environment and the Economy, 2009)
REPORT
Yukon Climate Change Indicators and Key Findings
30
3.4 Warming, degradation of permafrost, and increased flooding negatively impact water quality through increased turbidity and in some cases through contaminants. (high confidence)
“Water quality is an issue, as well as water quantity. Lower water levels tend to increase
concentrations of ions (e.g., dissolved metals) in water. High flows and flooding flush sediment
and contaminants, both natural and anthropogenic, into the water system. Higher water
temperatures affect ecosystems, human health, and community water systems.” (Environment
Yukon, 2011)
“We measured mercury (Hg) concentrations and calculatedexport and yield from the Yukon
River Basin (YRB) to quantify Hg flux froma large, permafrost-dominated, high-latitude
watershed. Exports of Hgaveraged 4400 kg Hg yr-1. The average annual yield for the YRB during
the study period was 5.17 μg m-2 yr-1, which is 3-32 times more than Hgyields reported for 8
other major Northern Hemisphere river basins. The vastmajority (90%) of Hg export is
associated with particulates. Half of theannual export of Hg occurred during the spring with
about 80% of 34samples exceeding the U.S. EPA Hg standard for adverse chronic effects to
biota. Dissolved and particulate organic carbon exports explained 81% and50%, respectively,
of the variance in Hg exports, and both were significantly (p < 0.001) correlated with water
discharge. Recent measurements indicatethat permafrost contains a substantial reservoir of
Hg. Consequently, climatewarming will likely accelerate the mobilization of Hg from thawing
permafrost increasing the export of organic carbon associated Hg and thus potentially
exacerbating the production of bioavailable methylmercury from permafrost-dominated
northern river basins.” (Schuster et al., 2011)
“Higher water temperatures and changes in extremes, including floods and droughts, are
projected to affect water quality and exacerbate many forms of water pollution – from
sediments, nutrients, dissolved organic carbon, pathogens, pesticides and salt, as well as
thermal pollution, with possible negative impacts on ecosystems, human health.” (Bates et al.,
2008).
4. Vegetation Vegetation zones are shifting, fire risk is up, forests are more vulnerable to insect infestations.
“[The] rapid increase in temperature is expected to have wide-ranging implications for Arctic
ecosystems, including changes in biodiversity, ecosystem functioning, and nutrient cycles. The
future of Arctic ecosystems will depend on three factors: the extent to which individuals can
YUKON RESEARCH CENTRE
Annotated Findings
31
adjust to warmer temperatures through phenotypic plasticity, the rate of immigration of
species from southern latitudes, and the rate at which evolutionary adaptation at the species
level can take place in a rapidly changing environment.” (Aitken et al., 2008; Gienapp et al.,
2008)
“In essence, if species cannot adjust to warmer temperatures in situ (phenotypic plasticity), they
must move, adapt, or die.” (Bjorkman, 2013)
“With a warming climate, northern ecosystems will face significant ecological changes such as
permafrost thaw, increased forest fire frequency, and shifting ecosystem boundaries, including
the spread of tall shrubs into tundra.” (Myers-Smith, 2007)
“The Arctic climate is changing. Permafrost is warming, hydrological processes are changing and
biological and social systems are also evolving in response to these changing conditions.”
(Hinzman et al., 2005)
“Climate change is projected to cause vegetation shifts because rising temperatures favor taller,
denser vegetation, and will thus promote the expansion of forests into the Arctic tundra, and
tundra into the polar deserts. The timeframe of these shifts will vary around the Arctic. Where
suitable soils and other conditions exist, changes are likely to be apparent in this century.”
(ACIA, 2004)
4.1 Treeline is moving northward and to higher elevations. Elders are saying that the ‘bush’ and the forest are changing. Shrubification is happening rapidly. (high confidence)
In the Polar Regions chapter, the IPCC states that “the tree line has moved northward and
upward in many, but not all, Arctic areas (high confidence) and significant increases in tall
shrubs and grasses have been observed in many places (very high confidence).” (Larsen et al.,
2013)
“Widespread changes in the Arctic are already underway. Recent syntheses of plant community
composition data have shown that some functional groups, particularly shrubs and graminoids,
have responded positively to warming, while others, including lichens, have declined (Elmendorf
et al., 2012). This ‘shrubification’ of the Arctic is likely to have important consequences for the
herbivore community and to alter snow distribution, duration, and albedo effects (Myers-Smith
et al., 2011). Individual species have also shown changes in response to warming. Plants in areas
of rapid warming often respond by flowering and senescing earlier, although responses vary
substantially by location and growth form (Oberbauer et al., 2013).” (Bjorkman, 2013)
REPORT
Yukon Climate Change Indicators and Key Findings
32
“Studies indicate that warming temperatures, changes in snow cover, altered disturbance
regimes as a result of permafrost thaw, tundra fires, and anthropogenic activities or changes in
herbivory intensity are all contributing to observed changes in shrub abundance.
A large-scale increase in shrub cover will change the structure of tundra ecosystems and alter
energy fluxes, regional climate, soil-atmosphere exchange of water, carbon and nutrients, and
ecological interactions between species.” (Myers-Smith et al., 2011)
“Increased disturbances, such as pest outbreaks and fire, will locally affect the direction of
treeline response. In general, the treeline will show many different responses depending on the
magnitude of temperature change, as well as changes in precipitation, permafrost conditions,
forest composition and land use.” (Furgal and Prowse, 2008)
“The effects of a changing climate on ecosystems are already evident, having been reported by
elders and other First Nation members. They include such things as altered seasonal river
discharges, insect infestations and changes in forest composition.” (Furgal and Prowse, 2008)
“A growing number of observations show increases in canopy-forming shrubs at sites around
the circumpolar Arctic, which could cause major modifications to the diversity and functioning
of tundra ecosystems.” (Myers-Smith, 2007)
4.2 More-productive vegetation is likely to increase carbon uptake, although positive feedbacks (e.g. reduced reflectivity, methane release, etc.) are likely to outweigh this, causing further warming. (high confidence)
“We conclude that it is important for international mitigation efforts focused on controlling
atmospheric CO2 to consider how climate warming and changes in fire regime may concurrently
affect the CO2 sink strength of boreal forests. It is also important for large-scale biogeochemical
and earth system models to include organic soil dynamics in applications to assess regional
[carbon] dynamics of boreal forests responding to warming and changes in fire regime.” (Yuan
et al., 2012)
“Over time, replacement of Arctic vegetation with more productive vegetation from the south is
likely to increase carbon dioxide uptake. On the other hand, methane emissions, mainly from
warming wetlands and thawing permafrost, are likely to increase.” (ACIA, 2004)
See also Key Finding 10 – Importance of the North.
YUKON RESEARCH CENTRE
Annotated Findings
33
4.3 The Yukon ecosystem has seen recent significant disturbances, some of which are related to climate change, e.g. invasive species, insect infestations, disease, and biodiversity loss. (high confidence)
Major forest health agents identified in the Forest Health Report (Forest Management Branch,
2014) include spruce bark beetle, Northern spruce engraver, Western balsam bark beetle,
budworms, larch sawfly, large aspen tortrix, aspen serpentine leafminer, mountain pine beetle
(all insect disturbances), pine needle cast (a disease), and drought stress. They are each
described briefly according to mortality and defoliant risks. Of these 10 disturbances, the spruce
bark beetle and the mountain pine beetle have been directly linked to climate change, while
others are likely partially related to climate change.
“Our results indicate that in the valleys of southwestern Yukon, post-fire regeneration of
spruce–aspen forests is a slow process and that the growth of both species is strongly moisture-
limited. This often leads to strongly uneven-aged stands in which, for a prolonged period (>40
years) following fire, the vegetation may resemble that of the aspen parkland along the
northern edge of the Canadian prairies. If the climate of the region becomes warmer and drier,
forest cover may be expected to decrease, especially following major fire years such as that in
2004. Furthermore, the forests in southwestern Yukon have a low diversity of tree species, and
are thus especially vulnerable to the impacts of host-specific forest pests such as spruce beetle.”
(Hogg and Wein, 2005)
4.4 The spruce bark beetle outbreak, intensified by warmer conditions and drought stress, killed half of the mature spruce forest in the Southwest Yukon. The mountain pine beetle is close to reaching the Yukon. (very high confidence)
“This bark beetle is the most damaging forest pest of mature spruce (Picea spp.) forests in
Yukon. A spruce bark beetle outbreak in southwest Yukon that began around 1990 has killed
more than half of the mature spruce forest (primarily white spruce [P. glauca]) over
approximately 400,000 hectares (ha).” (Forest Management Branch, 2014)
“Though endemic to North America, the mountain pine beetle is not yet present in Yukon. […]
Monitoring for MPB [mountain pine beetle] is a high priority because of its severe impact on
pine forests during outbreaks.” (Forest Management Branch, 2014)
“The current outbreak in B.C. is responsible for killing over 13 million hectares of pine forest.”
(Forest Management Branch, 2014)
REPORT
Yukon Climate Change Indicators and Key Findings
34
The mountain pine beetle is “now firmly established in Alberta and moving northward in British
Columbia, with confirmed infestations approximately 75 km south of Yukon border.” (Hodge,
2012)
“In the near future, the area of climatic suitability will actually increase in British Columbia and
northwestern Alberta, especially northward toward the Yukon and North West Territories
putting these areas at greater risk to mountain pine beetle.” (Nealis and Peter, 2008)
4.5 Insect outbreaks, variability in precipitation, warming temperatures, longer shoulder seasons, and increased winds increase the risk of forest fire (in both frequency and severity) and will facilitate invasion by non-native species. (high confidence)
“Climate change will increase the vulnerability of terrestrial ecosystems to invasions by non-
indigenous species, the majority likely to arrive through direct human assistance (high
confidence).” (Larsen et al., 2013)
Johnstone et al. (2010) hypothesize that warmer climate is inhibiting spruce regeneration after
fire disturbance, implying a possible transition to a boreal forest with more deciduous trees
(aspen) which would have profound ecological impacts. “Changes in Earth’s environment are
expected to stimulate changes in the composition and structure of ecosystems, but it is still
unclear how the dynamics of these responses will play out over time. In long-lived forest
systems, communities of established individuals may be resistant to respond to directional
climate change, but may be highly sensitive to climate effects during the early life stages that
follow disturbance. This study combined analyses of pre-fire and post-fire tree composition,
environmental data, and tree ring analyses to examine landscape patterns of forest recovery
after fire in the south-central Yukon.”
“The spruce beetle infestation has also increased quantity, flammability and extent of forest
fuels, thereby increasing the fire hazard.” (Furgal and Prowse, 2008)
“Fifty years of measurements indicate the region [Yukon Mountainous Terrain] has become
warmer and windier. Measurements at the upper-air station have shown increases of 2.7 °C for
surface temperature and 1 m s –1 for mid-valley winds over the past 50 years (1956 – 2005).”
(Pinard, 2007)
4.6 Widespread proactive adaptation is important in natural resource management where climate change impacts are projected to be significant. (very high confidence)
YUKON RESEARCH CENTRE
Annotated Findings
35
“Where these stresses affect economically or culturally important species, they will have
significant impacts on people and regional economies. Widespread proactive adaptation to
these changes will be required in natural resource management sectors.” (Furgal and Prowse,
2008)
“There is accumulating evidence that climate change is affecting the Champagne and Aishihik
Traditional Territory of the southwestern Yukon. During the past 40 years, average annual
temperatures have been increasing and winters have had fewer periods of prolonged severe
cold. There has been a decrease in average summer precipitation. One result of these warmer
winters and warmer and drier summers has been a severe outbreak of spruce bark beetle
(Dendroctonus rufipennis), causing widespread mortality of white spruce. This mortality has
also led to the loss of merchantable timber and significant changes to the regional ecology. The
spruce beetle infestation has also increased quantity, flammability and extent of forest fuels,
thereby increasing the fire hazard.” (Furgal and Prowse, 2008)
“In November 2004, the Government of Yukon and the Champagne and Aishihik First Nation
approved the first community-directed forest management plan that identifies reduction of fire
hazard, forest renewal, economic benefits and preservation of wildlife habitat as forest
management and planning priorities. The plan also explicitly incorporates an adaptive
management framework, considered to be an essential response to climate change.” (Furgal
and Prowse, 2008)
5. Wildlife Animal species' habitat, ranges, and diversity are changing.
“As the climate continues to change, there will be consequences for biodiversity shifts and the
ranges and distribution of many species, with resulting impacts on availability, accessibility and
quality of resources upon which human populations rely. This has implications for the
protection and management of wildlife, fisheries and forests.” (Furgal and Prowse, 2008)
“First, the impacts of climate change in northern regions will be shaped by the appearance of
new species at least as much as by the disappearance of current species. Second, seasonally
inactive mammal species (e.g., hibernators), which are largely absent from the Canadian arctic
at present, should undergo substantial increases in abundance and distribution in response to
climate change, probably at the expense of continuously active mammals already present in the
arctic. ” (Humphries et al., 2004)
5.1 Foraging mammals, such as woodland and barren ground caribou, and other land animals are likely to be increasingly stressed as climate change alters the nutrient value
REPORT
Yukon Climate Change Indicators and Key Findings
36
in their food sources, access to food, breeding grounds, and historic migration routes. (medium confidence)
“Projected warming and shifts towards a wetter Arctic are expected to affect the diversity and
accessibility of vegetation critical to several foraging mammals, such as woodland and barren
ground caribou.” (Furgal and Prowse, 2008)
“Climate change will likely alter the distribution and abundance of northern mammals through a
combination of direct, abiotic effects (e.g., changes in temperature and precipitation) and
indirect, biotic effects (e.g., changes in the abundance of resources, competitors, and
predators).” (Humphries et al., 2004)
5.2 Species ranges are projected to shift northward on both land and sea, bringing new species into the North while severely limiting some species currently present. (high confidence)
“Shifts in the timing and magnitude of seasonal biomass production could disrupt matched
phenologies in the food webs, leading to decreased survival of dependent species (medium
confidence). If the timing of primary and secondary production is no longer matched to the
timing of spawning or egg release, survival could be impacted with cascading implications to
higher trophic levels. This impact would be exacerbated if shifts in timing occur rapidly.” (Larsen
et al., 2013)
5.3 Winter and spring feeding have become more difficult due to deeper snows and increased layers of ice on and in the snow. Spring and summer have seen greater levels of insect harassment. (high confidence)
“Some barren ground caribou in the western and central Arctic, including the Bluenose East and
West, Cape Bathurst and Porcupine herds, have experienced significant declines in recent years,
at least partly attributable to changes in climate. Declines have been associated with difficulties
in obtaining appropriate forage and increased harassment by insects that interrupts summer
feeding.” (Furgal and Prowse, 2008)
5.4 While warmer weather will favour survival, it is uncertain what the cumulative effects will be on terrestrial wildlife. (medium confidence)
“In the future, trends in Polar Regions of populations of […] mammals, fish and birds will be a
complex response to multiple stressors and indirect effects (high confidence).” (Larsen et al.,
2013)
YUKON RESEARCH CENTRE
Annotated Findings
37
“We can now use satellites to monitor the timing and rate of new plant growth in the spring.
Over the last 15 years, there has been a significant increase in the amount of food available to
nursing cows […] when their energy demands are highest (during the 3 weeks after giving
birth).” (Russell and McNeil, 2005)
“Adaptations to the cold and to short growing seasons characterize arctic life, but climate in the
Arctic is warming at an unprecedented rate. Will plant and animal populations of the Arctic be
able to cope with these drastic changes in environmental conditions? […] Our conclusion is that
evolution by natural selection is a pertinent force to consider even at the time scale of
contemporary climate changes. However, all species may not be equal in their capacity to
benefit from contemporary evolution.” (Berteaux et al., 2004)
5.5 As the rivers change in flow, temperature, and sediment load, fish habitat is also changing. There are no current predictions of what the cumulative impact(s) will be other than to note it will put stress on the species. We also know that there are other downstream influences (which are sometimes climate related) especially for long migration species such as salmon. (high confidence)
“An interplay of freshwater-marine conditions also affect the timing, growth, run size and
distribution of several Arctic freshwater and anadromous fish. Key examples include: the timing
of marine exit of Yukon River Chinook salmon (Oncorhynchus tshawytscha; 1961-2009) varied
with air and sea temperatures and sea ice cover […] and factors that influence the water level
and freshening of rivers, as well as the strength, duration and directions of prevailing coastal
winds, affect survival of anadromous fishes during coastal migration and their subsequent run
size.” (Larsen et al., 2013)
5.6 Changes in caribou and salmon migration patterns and populations have already been observed in Yukon. (high confidence)
“Within the last two decades, and most intensely within the last 2 or 3 years, residents have
observed changes in the distribution, abundance, and migration patterns [of] fish and game;
many cite observations that match with the anticipated phenology of climate change.”(Loring
and Gerlach, 2009)
“[…] communities are witnessing variable changes in climate that are affecting their traditional
food harvest. New species and changes in migration of species being observed by community
members have the potential to affect the consumption of traditional food. Similarly, changes in
water levels in and around harvesting areas are affecting access to harvest areas, which in turn
affects the traditional food harvest. […] Community members have been required to change
REPORT
Yukon Climate Change Indicators and Key Findings
38
their harvest mechanisms to adapt to changes in climate and ensure an adequate supply of
traditional food. A strong commitment to programs that will ensure the protection of traditional
food systems is necessary.” (Guyot, 2006)
5.7 Impacts of Yukon climate change will have implications for biodiversity around the world because some migratory species (e.g. waterfowl) depend on breeding and feeding grounds in the North. (high confidence)
“The importance of Arctic ecosystems for biodiversity is immense and extends well beyond the
Arctic region. The Arctic, for example, supports many globally significant bird populations from
as far as Australia and New Zealand, Africa, South America, and Antarctica. Declines in Arctic
species, therefore, are felt in other parts of the world.” (Conservation of Arctic Flora and Fauna
Programme, 2010)
“Vegetation changes, along with rising sea levels, are projected to shrink tundra area to its
lowest extent in at least the past 21000 years, greatly reducing the breeding area for many birds
and the grazing areas for land animals that depend on the open landscape of tundra and polar
desert habitats. Not only are some threatened species very likely to become extinct, some
currently widespread species are projected to decline sharply.” (ACIA, 2004)
5.8 Invasive species are expected to increase. (high confidence)
Compared to neighbouring jurisdictions British Columbia and Alaska, Yukon has a lower
incidence and fewer invasive species; however, climate change increases Yukon’s vulnerability
to colonization of invasive species as stresses increase on native species. (Yukon Invasive
Species Council, 2011)
“The northward migration of species, and disruption and competition from invading species, are
already occurring and will continue to alter terrestrial and aquatic communities.” (Furgal and
Prowse, 2008)
5.9 For Yukon First Nations, the effects of climate change on wildlife and food security are the two biggest concerns. (very high confidence)
“Fisheries, seasonal conditions, and wildlife harvest are areas that survey respondents indicated
had the most impact on their lives. Further, climate, wildlife and food security are areas in
which climate change is currently impacting Yukon communities.” (Council of Yukon First
Nations, 2011)
YUKON RESEARCH CENTRE
Annotated Findings
39
6. Food Climate change negatively impacts First Nations traditional food security. Agriculture is a potential opportunity.
“Food insecurity presents a particularly serious and growing challenge in Canada’s northern and
remote Aboriginal communities. Evidence from a variety of sources concludes that food
insecurity among northern Aboriginal peoples is a problem that requires urgent attention to
address and mitigate the serious impacts it has on health and well-being.” (Council of Canadian
Academies, 2014)
“Food security for many indigenous and rural residents in the Arctic is being impacted by
climate change and in combination with globalization and resource development projected to
increase significantly in the future (high confidence).” (Larsen et al., 2013)
“Impacts on the health and well-being of Arctic residents from climate change are significant
and projected to increase – especially for many indigenous peoples […] These are expected to
vary among the diverse settlements, which range from small, remote predominantly indigenous
communities to large cities and industrial settlements (high confidence), especially those
located in highly vulnerable locations along ocean and river shorelines.” (Larsen et al., 2013)
“The northward migration of species, and disruption and competition from invading species, are
already occurring and will continue to alter terrestrial and aquatic communities. Shifting
environmental conditions will likely introduce new animal-transmitted diseases and redistribute
some existing diseases, affecting key economic resources and some human populations.”
(Furgal and Prowse, 2008)
6.1 For Yukon First Nations, the effects of climate change on wildlife and food security are the two biggest concerns. (very high confidence)
“Fisheries, seasonal conditions, and wildlife harvest are areas that survey respondents indicated
had the most impact on their lives. Further, climate, wildlife and food security are areas in
which climate change is currently impacting Yukon communities.” (Council of Yukon First
Nations, 2011)
“Traditional food was regarded as natural and fresh, tasty, healthy and nutritious, inexpensive,
and socially and culturally beneficial. Between 10% and 38% of participants noticed recent
changes in the quality or health of traditional food species, with physical changes and
decreasing availability being reported most often.” (Lambden, 2007)
REPORT
Yukon Climate Change Indicators and Key Findings
40
6.2 Many Yukoners, especially First Nations, depend on hunting, fishing, and gathering, not only for traditional food and to support the local economy, but also as the basis for cultural and social identity. (high confidence)
“When evaluating these impacts [of climate change] in terms of food security, the case further
validates the importance of recognizing that food contributes far more to health than just
calories and nutrition. Food and food culture are linked to health in a great variety of ways, with
many possible social and cultural dimensions of participation at all steps of the food chain,
though the relationships, and the outcomes, may not all be overt or obvious.” (Loring and
Gerlach, 2009)
“Traditional resource practices of hunting, herding, fishing and gathering remain critically
important for local economies, cultures and health of Yukon First Nation members.” (Furgal and
Prowse, 2008)
6.3 Several established climate-related changes in the north have implications for northern food security: hydrological impacts, increased variability of precipitation, and the freeze-thaw cycle have implications for movement of fish and wildlife, foraging, and access to harvesting sites. (high confidence)
“Hydrological effects due to climate change including river ice dynamics and increased
variability in break-up and freeze-up times have many interconnected consequences, including
impacts on food and water security for northern communities. Many Indigenous communities
rely on ice and waterways for transportation and access to traditional/country foods.”
(Friendship, 2010)
“What we use the case of rural Alaska to stress is two-fold: first is the unpredictable nature of
the down-scale impacts of global climate change, and how they can interact […] to significantly
challenge local food production and procurement.” (Loring and Gerlach, 2009)
“Characteristic environmental conditions over centuries have enabled communities and peoples
to develop skills and knowledge and pass these down between generations. Conditions are
changing, and impacts on resource practices are already occurring.” (Furgal and Prowse, 2008)
“With warming, an overall decrease in availability of optimal thermal habitat and in lake trout
potential harvest is predicted in southern Yukon lakes, although considerable lake-specific
variation in direction and magnitude of change exists. For southern Yukon lakes overall, 2, 4,
and 6 °C increases in mean annual air temperature lead to 12%, 35%, and 40% decreases in

YUKON RESEARCH CENTRE
Annotated Findings
41
thermal habitat volume, respectively, and 8%, 19%, and 23% reductions in potential harvest,
respectively.” (Mackenzie-Grieve and Post, 2006)
6.4 There is evidence that Yukoners have been consuming fewer traditional foods and more market foods due to the effects of climate change, which may have negative health consequences. (medium confidence)
“With a greater shift in diet to a more market food based diet, there has been an impact on the
nutritional quality of diet for people in the North.” (Friendship, 2010)
“In the past, [Aboriginal peoples] subsisted by extracting and processing foods from the land
and water using hunting, trapping, fishing, gathering and agriculture in different combinations.
The tremendously diverse diet was, in general, high in animal protein and low in fat and
carbohydrates, and provided adequate amounts of energy and micronutrients for health. The
contemporary diet has, to varying degrees, replaced traditional foods with market foods, many
of which are of low nutritional quality. […] Current dietary practices of some Aboriginal peoples
pose significant health risks and diminish the quality of life.” (Willows, 2005)
6.5 First Nations people have the right to access, manage, and harvest fish and wildlife, yet the abundance and health of these resources may be affected by climate change. (medium confidence)
For example, under Chapter 16, the Umbrella Final Agreement (1993) seeks “to ensure
Conservation in the management of all Fish and Wildlife resources and their habitats; […] to
guarantee the rights of Yukon Indian People to harvest and the rights of Yukon First Nations to
manage renewable resources on Settlement Land; [and…] to honour the Harvesting and Fish
and Wildlife management customs of Yukon Indian People and to provide for the Yukon Indian
People’s ongoing needs for Fish and Wildlife.”
“Access and legal right to harvest fish and wildlife are protected for Yukon First Nations under
existing agreements, yet these institutions may be challenged by changes in climate. Thus, there
are political implications for food security that require better understanding to protect these
resources for First Nations members.” (Furgal and Prowse, 2008)
6.6 Where suitable soils are present, agriculture has the potential to expand due to a longer and warmer growing season. Field-based agriculture may be challenged by precipitation variability. (medium confidence)
REPORT
Yukon Climate Change Indicators and Key Findings
42
“Climate change and rising temperatures may provide new agricultural opportunities in Yukon.
Changes to Yukon’s water regime may provide a positive impact in some areas and negative in
others. Supporting the local production and sale of agricultural products will reduce food
transportation costs and increase local sustainability for Yukoners.” (Environment Yukon, 2009)
“Permafrost is susceptible to climate change’s warming trends. Agricultural development,
infrastructure and production is impacted by changing permafrost conditions such as excessive
wetness, hummocky topography and ground subsidence. Past and present Yukon farmers have
adapted conventional agriculture methods to accommodate for northern specific permafrost
conditions. The warming effects of climate change are expected to increase the rate of
permafrost decay.” (Pan-Territorial Information Notes, 2013)
7. Hazards and Infrastructure The major climate change hazards in the Yukon are flood, wildfire, and damage to infrastructure from thawing permafrost and/or extreme precipitation. Roads, buildings, and infrastructure built without the future climate in mind are vulnerable.
“To understand vulnerabilities within the landscape, we must assess the environmental
conditions that may be affected by climate change and may therefore pose hazards to safe and
sustainable development. Factors to be considered include permafrost and ground ice, surface
water drainage, groundwater dynamics, surficial geology and slope stability. These factors
combine to create landscape hazards that can pose risks to infrastructure, and may be
exacerbated in a changing climate.” (Northern Climate ExChange, 2011)
“The impacts of climate change pose risks to a range of economic sectors and systems that
Northerners value. Chief among them is the region’s infrastructure, including its roads,
buildings, communications towers, energy systems, and waste disposal sites for communities,
and large-scale facilities and waste-containment sites that support the territories’ energy and
mining operations. The risk to infrastructure systems will only intensify as the climate continues
to warm.” (National Round Table on the Environment and the Economy, 2009)
“Forest fires are a significant and natural element of the circumboreal forest. Fire activity is
strongly linked to weather, and increased fire activity due to climate change is anticipated or
arguably has already occurred. Recent studies suggest a doubling of area burned along with a
50% increase in fire occurrence in parts of the circumboreal by the end of this century.”
(Flannigan et al., 2008)
YUKON RESEARCH CENTRE
Annotated Findings
43
“For all forest-fire variables, the projections indicate that the fire regime in central Yukon will
continue to vary from year to year, but that, overall, the occurrence and extent of forest fires
may increase.” (McCoy and Burn, 2005)
7.1 Yukon communities are located along rivers and in forested areas. This makes flooding and wildfire critical hazards. Climate change is increasing both the likelihood and potential severity of these hazards. (high confidence)
Note: of the 26 communities in Yukon, all are situated on or in close proximity to a significant
waterway (i.e. lake or river) and all are within the boreal forest. Furthermore, all communities
are served by a sparse road network, which is also vulnerable to flood and fire (including the fly-
in community of Old Crow as its supply chain is through Whitehorse).
“In permafrost areas, forest fires can have a great impact not only on forest ecosystems and
wildlife but also on the permafrost thermal regime. As vegetation is burned, the organic cover
that insulates the ground can be lost, resulting in the potential deepening of the active layer.”
(Northern Climate ExChange, 2013)
“Whitehorse is already being impacted by climate change and more change is projected in the
near future. The key sectors being impacted are natural hazards (especially fire and flood),
infrastructure, food security, environment and energy security.” (Hennesey and Streicker, 2011)
“An assessment of freeze-up and break-up dates indicates that the ice cover season is becoming
shorter with delays in freeze-up and advances in break-up timing. Mid-winter break-up events
and associated flooding have been observed for the first time. Break-up water level trends
suggest that break-up severity is increasing. These changes cannot be definitely attributed to
climate change as there is some evidence suggesting that teleconnections may be a factor. The
observed changes have significant implications pertaining to public safety, and economic
impacts on property and infrastructure, transportation networks and hydroelectric operations.
Ice jams and associated backwater and surges also affect aquatic ecosystems through impacts
on biological and chemical processes.” (Janowicz, 2010)
“Ice jamming and unusual breakup patterns of river ice trigger serious damage to infrastructure.
In 2009, large blocks of river ice drove into and around structures in the Dawson and Faro areas
(Yukon) and Eagle (Alaska), causing extensive damage.” (National Round Table on the
Environment and the Economy, 2009)
“Impacts on the health and well-being of Arctic residents from climate change are significant
and projected to increase – especially for many indigenous peoples […] These are expected to
REPORT
Yukon Climate Change Indicators and Key Findings
44
vary among the diverse settlements, which range from small, remote predominantly indigenous
communities to large cities and industrial settlements (high confidence), especially those
located in highly vulnerable locations along ocean and river shorelines.” (Larsen et al., 2013)
“[…] as lightning and lightning-caused forest fires will increase; northern latitudes are expected
to experience these changes and their associated impacts to a greater extent.” (Kochtubajda et
al., 2011)
“The potential for increased flooding is a concern for communities located on floodplains.
Washouts can affect highways, as has already been observed along parts of the Dempster
Highway (Yukon). In Yukon, fibre optic cables for communications systems are located along
highways adjacentto rivers, with significant areas susceptible to flooding.” (National Round
Table on the Environment and the Economy, 2009). Note that the majority of Yukon
communities have development on floodplains.
McCoy and Burn (2005) project that “the average annual fire occurrence and area burned may
as much as double by 2069, but there may still be years with few fires. The maximum number of
fires may increase by two-thirds over present levels, and the maximum area burned per
summer may increase to more than three times the present value.”
7.2 Permafrost thaw, wildfire, and more intense precipitation events will result in more landslides and subsequent silt runoff. (high confidence)
“Landslides generally occur on moderate to steep slopes due to a variety of contributing and
triggering factors that include: intense rainfall or snowmelt events, permafrost degradation,
forest fires, river erosion, groundwater flow, and/or earthquakes. […] Variations in climate or
terrain conditions (e.g., environmental changes or human interventions) can both have a great
impact on permafrost stability. Higher surface temperatures, variation in snow cover depth,
active-layer hydrology variations, infrastructure, and fire disturbances are good examples of
changes that can play, at various scales, a major role in permafrost degradation.” (Benkert et al.,
2015)
“[F]orest fires degrade the insulation effect of the vegetation layer above frozen ground and
therefore change the thermal regime of permafrost.” (Blais-Stevens et al., 2011)
“The potential for climate change-induced thaw of permafrost as well as larger and hotter
forest fires raise the possibility of greater active layer detachment failure activity in the future
[i.e. slope failure / landslides].” (Coates and Lewkowicz, 2008)
YUKON RESEARCH CENTRE
Annotated Findings
45
“Numerous active-layer detachments occurred in watersheds surrounding Dawson City
following forest fires that burned the area during the summer of 2004. The distribution of these
shallow landslides was mapped in the Mickey Creek, Steele Creek and Fifty Mile Creek
watersheds. Selected slope failures were surveyed in detail to describe their geometry and
geomorphological settings in order to investigate the mechanisms of failure, and to assess the
effects of the forest fires on local permafrost conditions. The failures generally initiated on
moderate convex slopes at shallow depths (< 65 cm ) in silty colluvium; frost tables were close
to 1 m in depth. Most active-layer detachments were on the order of 5-20 m wide and 10-100 m
long and occurred on slopes with a variety of aspects; however, the detachments occurred only
where permafrost was present. In some cases, they developed on gentle slopes (as low as 10°)
and traveled several hundred metres, depositing sediment directly into creeks, or across access
trails. Their cumulative effects may significantly impact sediment transport within the
watersheds. Potential concerns for fish habitat and implications for placer mining water quality
regulations have consequently been raised.” (Lipovsky et al., 2006)
7.3 Existing infrastructure was designed and built based on historical climate data that may not be appropriate for future conditions. Even small increases in snow load, storm severity and frequency, and thawing permafrost can directly affect the structural integrity of infrastructure. (very high confidence)
“This paper draws upon case studies conducted with mining operations in Canada involving in-
depth interviews with mining professionals and analysis of secondary sources to characterize
the vulnerability of the Canadian mining industry to climate change. Five key findings are
discussed: i) mines in the case studies are affected by climate events that are indicative of
climate change, with examples of negative impacts over the past decade; ii) most mine
infrastructure has been designed assuming that the climate is not changing; iii) most industry
stakeholders interviewed view climate change as a minor concern; iv) limited adaptation
planning for future climate change is underway; v) significant vulnerabilities exist in the post-
operational phase of mines. This paper argues for greater collaboration among mining
companies, regulators, scientists and other industry stakeholders to develop practical
adaptation strategies that can be integrated into existing and new mine operations, including in
the post-operational phase.” (Pearce et al., 2011)
“Rising temperatures and changing precipitation patterns have the potential to affect all
infrastructure types and related services. With rising temperatures, air moisture will increase,
giving rise to higher snow and ice loads, higher humidity (fog) and changes in snow-to-rain
ratios. Fog affects air travel, and higher moisture levels add to deterioration and increased
maintenance costs of airport runways. In parts of Canada’s North, buildings, energy, and
communications infrastructure were designed and built for low snowfall conditions; in other
REPORT
Yukon Climate Change Indicators and Key Findings
46
parts of the region infrastructure is exposed to high snow loads because of snow drifting.
Increased snow and warmer temperatures causing freezing rain events, and rain on existing
snow cover are already resulting in infrastructure failure. Snow is also wetter and therefore
heavier.” (National Round Table on the Environment and the Economy, 2009)
7.4 As frozen ground thaws, some existing buildings, roads, airports, and industrial facilities are likely to be destabilized, requiring substantial rebuilding, maintenance, and investment. (very high confidence)
“Yukon, Alaska and northern British Columbia depend heavily on road transportation to link
communities and connect industrial activities to international markets. The Alaska Highway is
the central transportation corridor in Yukon. It is crucial to maintaining and expanding economic
development, the quality of life of the population and international ties. […] Overall, for the
200-km section between Burwash Landing and the Yukon/Alaska border, 42.7% is highly
vulnerable to permafrost thaw, 38.5% has moderate vulnerability, and 18.8% has low
vulnerability.” (Calmels et al., 2015)
“Depending on the nature of the soil material and the amount of ground ice present, significant
hazards may develop. Permafrost-related hazards represent some of the principal challenges for
planning and development in northern environments.” (Benkert et al., 2015)
“Rising temperatures, leading to the further thawing of permafrost and changing precipitation
patterns have the potential to affect infrastructure and related services in the Arctic (high
confidence). Particular concerns are associated with the damage of residential buildings due to
thawing permafrost, including, Arctic cities; small, rural settlements; and storage facilities for
hazardous materials.” (Larsen et al., 2013)
“The Alaska Highway is the main terrestrial link between Alaska and the contiguous USA. Since
its rehabilitation in the past decades, the road has subsided in response to the degradation of
the underlying ice-rich permafrost. At the study site near Beaver Creek (Yukon), the
embankment material now intersects the natural groundwater table. It is suggested that water
flow under the road proceeds along preferential flow paths essentially located within thawed
embankment material. Measurements of water temperature indicate that the water is
progressively losing heat as it flows under the road. We propose that this energy transfer to the
surrounding ground contributes to the degradation of the underlying permafrost through
various processes of convective and conductive heat transfer.” (de Grandpré et al., 2010).
YUKON RESEARCH CENTRE
Annotated Findings
47
7.5 Future development will require new design elements to account for ongoing warming that may add to construction and maintenance costs. These costs need to be considered against the potential costs of infrastructure failure. (very high confidence)
“It is fundamentally clear that climate change represents a profound risk to the safety of
engineered systems and to public safety in Canada and around the world. As such, professional
engineers must address climate change adaptation as part of our primary mandate – protection
of the public interest, which includes life, health, property, economic interest and the
environment. Climate change results in significant changes in statistical weather patterns
resulting in a shifting foundation of fundamental design data. Physical infrastructure systems
designed using this inadequate data are vulnerable to failure, compromising public safety.
Engineering vulnerability/risk assessment forms the bridge to ensure climate change is
considered in engineering design, operations and maintenance of civil infrastructure. Identifying
the highly vulnerable components of the infrastructure to climate change impacts enables cost-
effective engineering/operations solutions to be developed.” (Engineers Canada, 2013)
“Permafrost conditions under roads must be known prior to evaluating the efficiency of
mitigation measures, and to avoid costly and overly conservative measures. In a warming
climate, the understanding of ground ice distribution in permafrost has important engineering
and economic implications.” (Stephani et al., 2010)
“The presence and proper classification of permafrost is essential to mine planning, operation,
and abandonment in the Yukon Territory. This paper discusses the current state of practice
regarding permafrost delineation and classification, presents information regarding design and
monitoring of structures on permafrost (with particular reference to mining), and includes
examples of Yukon and other northern mines where permafrost has affected operations.
“Permafrost in the Yukon is particularly sensitive to disturbance, as it is generally ‘warm’ and
discontinuous. It is therefore extremely critical that planning for new mines include provisions
for the proper classification of permafrost on the mine property, as it will directly affect
operations and abandonment of the site, with corresponding financial implications.” (EBA,
2004)
7.6 Industry, such as mining, is also vulnerable to climate hazards, which can increase downstream risks. (very high confidence)
“Climate is an important component of the operating environment for the Canadian mining
sector. However, in recent years mines across Canada have been affected by significant climatic
REPORT
Yukon Climate Change Indicators and Key Findings
48
hazards, several which are regarded to be symptomatic of climate change. For the mining
sector, climate change is a pressing environmental threat and a significant business risk. The
extent to which the mining sector is able to mitigate its own impact and adapt to climate
change will affect its long-term success and prosperity, and have profound economic
consequences for host communities.” (Pearce et al., 2011)
“In the Yukon, torrential rains in August 2008 forced Sherwood Copper Corporation, which
operates the high-grade copper-gold Minto mine located 240 km north of Whitehorse, to
release untreated water into the Yukon River system. Some 350,000 cubic meters of water had
to be siphoned out of the mine’s water treatment plant and discharged. The waste discharge
(.05 mg per litre) was higher than Yukon licence standards (.01 mg per litre). Ironically the water
storage pond was designed to assure water availability throughout the year, given an
expectation of occasional seasonal summer drought. The same rainfall also washed out a four
kilometer section of the mine haul road leading to Minto Landing (Sherwood Copper
Corporation 2008). The mine faced a similar situation in 2009 and again discharged untreated
water into the Yukon River system higher than its Yukon license standards.” (Pearce et al., 2011)
7.7 As hydrological regimes change so too may our hydro-electric generation capacity. It is important to consider volume of flow, timing of flow, and flooding. (very high confidence)
“Finally, by simulation and by estimation of the present volume distribution [of] glaciers, results
showed that glacier wastage contributions to the flow of the Yukon River (which represent a
‘surplus’ flow derived from the loss of long-term stored glacier ice) will continue to enhance
runoff for many decades into the future, even under sustained terminal retreat and areal
shrinkage of glaciers in this basin. Taken together, it was inferred that the most likely future
response of the flow of the Yukon River is for an average tendency towards increasing annual
runoff with an extension of higher flows across the ‘shoulder’ seasons (i.e., early spring and late
fall). These higher flows during the shoulder seasons will be of benefit to [Yukon Energy
Corporation], since this will extend the period of viable hydro-power production.” (Northern
Climate ExChange, 2014)
“A trend analysis reveals a recent (1989-2007) 15.5% increase in the annual flows owing to
much-above average values recorded over the past decade. […] For the period of interest, 46%
and 30% of the available gauged area and river discharge, respectively, experienced detectable
increases in variability. This provides observational evidence of an intensifying hydrological cycle
in northern Canada, consistent with other regions of the pan-Arctic domain.” (Dery et al., 2009)
YUKON RESEARCH CENTRE
Annotated Findings
49
7.8 New guides and standards are being designed to address hazard risk to infrastructure. (very high confidence)
The Northern Infrastructure Standardization Initiative was jointly undertaken by the Standards
Council of Canada and Aboriginal Affairs and Northern Development Canada to develop new
standards for northern infrastructure, which is highly vulnerable to climate change impacts and
must contend with issues such as permafrost degradation, and changing snow loads and
precipitation patterns. Four new standards were introduced by the Standards Council of
Canada, and published by the Canadian Standards Association: i) Thermosyphon foundations
for buildings in permafrost regions; ii) Managing changing snow load risks for buildings in
Canada’s North; iii) Moderating the effects of permafrost degradation on existing building
foundations; and iv) Community drainage system planning, design, and maintenance in
northern communities. (Canadian Standards Association, 2014 and 2015)
The Yukon Environmental and Socio-economic Assessment Board (YESAB) recently produced a
geohazards guide. “These guidelines summarize the general processes related to geohazard and
risk assessments for linear infrastructure in Yukon. Section 1 (overview section), identifies the
objectives and scope of these guidelines, and explains the role of YESAB and the regulatory
framework. It also introduces relevant geohazard and risk definitions. Section 2 of this
document deals with the implications of geohazards and risk for environmental assessments.
Valued Environmental and Socio-economic Components and their relationship with geohazards
and risk assessment are briefly addressed. Section 3, the Geohazards and Risk Framework,
provides the fundamental background required to undergo geohazards assessment for the
development of linear infrastructure in Yukon. A review of the existing guidelines and best
practices has been included in this section to assist proponents in the identification of further
resources that can be used in conjunction with this document. Finally, section 4 explains the
general requirements for a proponent to assess the potential geohazards and risk of building
linear infrastructure in Yukon.” (Guthrie and Cuervo, 2015)
The Transportation Association of Canada (2010) produced the Primer on Developing and
Managing Transportation Infrastructure in Permafrost Regions in 2010 which provides
guidelines for the northern transportation sector.
8. Traditional Knowledge TK is an important way to understand climate change, which complements the scientific approach.
“Climate change […] decisions should be based on knowledge, where science should play a
prominent (but not exclusive) role. […] The scientific base for adaptation options should always
REPORT
Yukon Climate Change Indicators and Key Findings
50
be balanced with and respect traditional and indigenous knowledge forms. The way forward is
to combine different knowledge forms for climate change adaptation in a complementary
manner, in order to ensure that knowledge production and application is not an exclusionary
process.
Scientific information should further be made accessible and understandable to community
members and local decision-makers. Indigenous peoples’ and Arctic communities’ perspectives
on the links between environmental observations and climate change must also be made
accessible and understandable to those outside the communities, so that long-term experiences
and accumulated knowledge, based on the indigenous peoples’ permanent residency in the
Arctic, are factored into [climate change decision making].” (Arctic Monitoring and Assessment
Program, 2013)
“Scientific research, traditional knowledge and personal experience all point in the same
direction: our climate is changing and Yukon’s land, wildlife, and people are directly affected.”
(Environment Yukon, 2012)
“The value of bringing forward indigenous views and knowledge and of including local
knowledge of climate change is a significant issue.” (Newton et al., 2005)
8.1 Indigenous knowledge and observations provide an important source of information about climate change. This knowledge is complementary to information from scientific research, and also indicates that substantial changes have already occurred. (very high confidence)
“[…] scientific, traditional and experience-based knowledge in combination are recognized as
key factors for a sustainable Arctic future. Generating grassroots support is the most important
condition for sustainability.” (Arctic Monitoring and Assessment Program, 2013)
In the community-based report Yukon Climate Change Needs Assessment (Council of Yukon First
Nations, 2011), First Nation respondents were asked, “Can Traditional/Local Knowledge Play a
Role in Finding Solutions to Climate Change?” The response was 86% yes, 8% no. When asked
“Is Traditional/Local Knowledge Being Used to Understand/Adapt to Climate Change?” The
response was 50% yes, 38% no. This indicates that First Nations believe that Traditional
Knowledge is not being used to its full potential. Respondents noted that this was primarily due
to a lack of resources.
8.2 People who live close to the land and practice traditional ways see the detailed impacts of climate change in the North. (high confidence)
YUKON RESEARCH CENTRE
Annotated Findings
51
“‘People need to get out on the land more,’ was a statement repeated throughout the
workshop. Participants recommended getting youth and families out more frequently to learn
traditional activities from elders throughout the year. Many recommended holding more
frequent culture camps. […] ‘The past ways of our people are the key to us adapting,’ one
participant said. Another stated, ‘We need to really listen to the stories of our ancestors.’”
(Champagne and Aishihik First Nations and Alsek Renewable Resource Council, 2009)
8.3 People who live close to the land and practice traditional ways are more vulnerable to the impacts of climate change in the North. (medium confidence)
“While maintaining and protecting aspects of traditional and subsistence ways of life in many
Arctic Aboriginal communities may become more difficult in a changing climate, new
opportunities will also be presented. Young and elderly Aboriginal residents, in particular those
pursuing aspects of traditional and subsistence-based ways of life in more remote communities,
are the most vulnerable to the impacts of climate change in the North. An erosion of their
adaptive capacity via the social, cultural, political and economic changes taking place in many
communities today will further challenge their abilities to adapt to changing environmental
conditions. However, enhanced economic opportunities may provide significant benefits to
communities, making the net impacts on human and institutional vulnerability difficult to
predict.” (Furgal and Prowse, 2008)
8.4 As the climate changes, it affects the land, the wildlife, access to food, and even the cultural identity of First Nations people. (medium confidence)
“When evaluating these impacts [of climate change] in terms of food security, the case further
validates the importance of recognizing that food contributes far more to health than just
calories and nutrition. Food and food culture are linked to health in a great variety of ways, with
many possible social and cultural dimensions of participation at all steps of the food chain,
though the relationships, and the outcomes, may not all be overt or obvious.” (Loring and
Gerlach, 2009)
“Characteristic environmental conditions over centuries have enabled communities and peoples
to develop skills and knowledge and pass these down between generations. Conditions are
changing, and impacts on resource practices are already occurring.” (Furgal and Prowse, 2008)
8.5 Northern communities are resilient; however, climate change adds stress and strain to community capacity and resilience. (high confidence)

REPORT
Yukon Climate Change Indicators and Key Findings
52
Communities “have proven resilient in the face of climate change; however the rapid and
stressful rates of change have placed further strain on this resilience." (Arctic Monitoring and
Assessment Programme, 2013)
“The Arctic has experienced significant climate change in the past. The archeological record,
ethnohistorical accounts and memories of Aboriginal elders provide detailed accounts of how
periodic, irregular and often dramatic ecosystem changes, triggered by periods of warming or
cooling and extreme weather events, have been a dominating influence on human life in the
Arctic. The successful long-term habitation of the Arctic by Aboriginal peoples has been possible
because of the capacity of their social, economic and cultural practices to adjust to climate
variation and change.” (Furgal and Prowse, 2008)
9. Causes and Responses Climate change is human caused. Yukon is responding both to the impacts of climate change and to reduce emissions.
“Globally, human dependency on fossil fuels, increasing industrial activities, and clearing of
forests for development and agriculture have resulted in elevated levels of greenhouse gasses
in the atmosphere. These gasses trap in heat which in turn shift global temperature, wind and
precipitation patterns.” (Environment Yukon, 2012)
“The Yukon government recognizes that climate change is happening, that human behavior is a
major contributor, and that a coordinated response is needed.” (Environment Yukon, 2012)
The Yukon Government Climate Change Action Plan – Progress Report (Environment Yukon,
2012) details the government’s response to climate change and the goals that were originally
identified in 2009: “The Action Plan is built on the Government of Yukon Climate Change
Strategy which outlines the government’s role and the four goals for its response to climate
change: #1 - enhancing knowledge and understanding of Climate Change, #2 - adapting to
climate change, #3 - reducing greenhouse gas emissions, and #4 - leading Yukon action in
response to climate change.”
9.1 According to the most recent report from the Intergovernmental Panel on Climate Change, it is unmistakable that the climate is warming and that over the past 50+ years, human activity has been responsible for that warming. (very high confidence)
“Human influence has been detected in warming of the atmosphere and the ocean, in changes
in the global water cycle, in reductions in snow and ice, in global mean sea level rise, and in
changes in some climate extremes. This evidence for human influence has grown since AR4. It is
YUKON RESEARCH CENTRE
Annotated Findings
53
extremely likely that human influence has been the dominant cause of the observed warming
since the mid-20th century.” (IPCC, 2013)
“Warming of the climate system is unequivocal, and since the 1950s, many of the observed
changes are unprecedented over decades to millennia. The atmosphere and ocean have
warmed, the amounts of snow and ice have diminished, sea level has risen, and the
concentrations of greenhouse gases have increased.” (IPCC, 2013)
9.2 Adaptation is how we address the impacts of climate change. Mitigation is how we address the cause of climate change. It is important to always keep in mind both of these challenges and wherever possible to look for solutions which both mitigate and adapt. (very high confidence)
“Managing the risks of climate change involves adaptation and mitigation decisions with
implications for future generations, economies, and environments.” (IPCC, 2014)
“Climate-resilient pathways are sustainable-development trajectories that combine adaptation
and mitigation to reduce climate change and its impacts. They include iterative processes to
ensure that effective risk management can be implemented and sustained.” (IPCC, 2014)
“Climate change is a global challenge where all jurisdictions, including Yukon, have an important
role to play. […] The Climate Change Action Plan will help us coordinate and improve our efforts
to adapt to, understand, and lessen our contributions to climate change.” (Environment Yukon,
2009)
“Canada’s North is on the frontline of climate change. Nowhere else are the effects and stakes
of failing to adapt to climate change so high. An already unique and vulnerable environment
faces new and different risks associated with melting sea ice, degrading permafrost, and shifting
weather patterns. Securing Canada’s Arctic environment in the face of looming climate change
is fast becoming a national and an international priority.
Adaptation is an essential policy response to climate change. It deals with the ’here and now’ to
reduce the effects of carbon already in the atmosphere that are projected to cause serious
climate impacts in the North in the years ahead. Infrastructure must become a core focus of
Canadian adaptation policy. From buildings to roads, from airports to pipelines — infrastructure
is essential to modern, secure communities. It is at risk from a changing climate and needs new,
forward policy responses to make it more resilient and less vulnerable.” (National Round Table
on the Environment and the Economy, 2009)
REPORT
Yukon Climate Change Indicators and Key Findings
54
9.3 Integrating climate change considerations into existing planning processes is a method of reducing risk while taking advantage of existing procedures. (high confidence)
“Climate change impacts and the responses to those impacts are complex. One way of
responding to these complex changes is to mainstream climate change adaptation.
Mainstreaming adaptation means to strategically integrate climate change considerations into
ongoing planning, policy and other decision-making processes at the local level […] The City of
Whitehorse, through their Strategic Sustainability Plan and Official Community Plan, has already
developed a long-term environmental basis that influences policy development and
implementation. This emphasis on sustainable development parallels adaptation, especially at
the local level where conscious land-use regulations, energy management and infrastructure
improvements will increase local resilience to climate change. Mainstreaming could also
support Yukon government’s regional commitments to the management of roads, agriculture
and land-use planning in the Whitehorse area.” (Hennesey and Streicker, 2011)
9.4 Key areas where climate change considerations can be integrated into existing planning processes include energy planning, emergency preparedness, sustainability planning, resource management, infrastructure development, land-use planning, engineering design, transportation planning, etc. (very high confidence)
In their 2009 report, the National Round Table on the Environment and the Economy “highlights
the risks to northern infrastructure posed by climate change and the opportunities in
adaptation. It casts a light on one of the most critical aspects of adaptation – ensuring the
infrastructure is resilient over its lifespan in the face of climate change. Our report shows clearly
how we can use existing risk management tools to reduce infrastructure vulnerabilities and
adapt more effectively to climate change in Canada’s North.
To do so, we need to do two things: first, make climate change adaptation more of a
‘mainstream’ issue than ever before and, second, build northern capacity to adapt to climate
change. We can help achieve this by undertaking four priorities:
1. Integrate climate risks into existing government policies, processes, and mechanisms;
2. Ensure northern interests are represented and implicated in the development of climate
change adaptation solutions;
3. Strengthen the science capacity and information use in the North to support long-term
adaptation efforts;
4. Build community capacity to address climate risk to northern infrastructure and take
advantage of opportunities.”
YUKON RESEARCH CENTRE
Annotated Findings
55
9.5 Public education, research, and in particular community-based research remain as critical needs in order to better understand Yukon climate change and how to address it. (very high confidence)
For an example of demonstrated need for community-based research: “Recommendations for
future research that incorporates Indigenous knowledge of water to gain insight into hydrologic
changes in the watershed include combining multiple case studies that are distributed
geographically. Our findings suggest 1) that using participatory research approaches to research
will help ensure that it benefits the communities whose livelihoods are affected by hydrologic
changes, and 2) that a multidisciplinary approach that combines qualitative and quantitative
methods from the social and biophysical sciences would be most effective to help us
understand and respond to hydrologic changes.” (Wilson et al., 2015)
“The polar regions are displaying the consequences of climatic warming more acutely than
elsewhere in the world. This distinction makes northern Canada a prime location for the study
of global warming and its implications for the planet. It also brings a degree of urgency to
Canada’s northern climate-related research so that the ecosystemic consequences of a warming
North can be understood in time to develop and implement the appropriate adaptive
responses. Canadian researchers at the federal, territorial, regional and university levels are
providing leadership in this critical area while working cooperatively with other nations.”
(Canadian Polar Commission, 2014)
“Additional work in future is needed to support public education and training. […] Yukoners
have proven experience in research, public education, and energy solution programs.
Traditional knowledge is also important in helping to understand climate change impacts and
developing adaptation strategies. We can and will build on these strengths and resources.”
(Environment Yukon, 2009)
10. Importance of the North Climate change in the North is a major driver of global change.
“The cryosphere, comprising snow, river and lake ice, sea ice, glaciers, ice shelves and ice
sheets, and frozen ground, plays a major role in the Earth’s climate system through its impact
on the surface energy budget, the water cycle, primary productivity, surface gas exchange and
sea level. The cryosphere is thus a fundamental control on the physical, biological and social
environment over a large part of the Earth’s surface. Given that all of its components are
inherently sensitive to temperature change over a wide range of time scales, the cryosphere is a
natural integrator of climate variability and provides some of the most visible signatures of
climate change.“ (Vaughan et al., 2013)
REPORT
Yukon Climate Change Indicators and Key Findings
56
10.1 The North has most of the known significant feedback mechanisms for the global climate. In effect this means that what happens across the North will have consequences for the global climate system. (high confidence)
The Technical Summary of the IPCC’s report Climate Change 2013: The Physical Science Basis
lists snow-ice albedo and permafrost as positive feedbacks (where positive feedback refers to a
mechanism which accelerates climate change). “Feedbacks will also play an important role in
determining future climate change […] Snow and ice albedo feedbacks are known to be positive.
[…] Reservoirs of carbon in hydrates and permafrost are very large, and thus could potentially
act as very powerful feedbacks.” (Stocker et al., 2013)
From the same chapter, in a discussion of abrupt climate change, the IPCC lists potential drivers
many of which relate to the Arctic. “Examples of components susceptible to such abrupt change
are the strength of the Atlantic Meridional Overturning Circulation (AMOC), clathrate methane
release, tropical and boreal forest dieback, disappearance of summer sea ice in the Arctic
Ocean.” (Stocker et al., 2013)
10.2 The biggest change is the loss of Arctic sea ice, which is accelerating due to the albedo reversal from reflective ice to absorptive ocean. As the Arctic Ocean comes ‘on line’ it will have very far-reaching effects. (high confidence)
“A sea ice cover on the ocean changes the surface albedo, insulates the ocean from heat loss,
and provides a barrier to the exchange of momentum and gases such as water vapour and CO2
between the ocean and atmosphere. Salt ejected by growing sea ice alters the density structure
and modifies the circulation of the ocean. Regional climate changes affect the sea ice
characteristics and these changes can feed back on the climate system, both regionally and
globally.” (Vaughan et al., 2013)
“The observed rapid loss of thick multiyear sea ice over the last 7 years and the September 2012
Arctic sea ice extent reduction of 49% relative to the 1979–2000 climatology are inconsistent
with projections of a nearly sea ice-free summer Arctic from model estimates of 2070 and
beyond made just a few years ago. Three recent approaches to predictions in the scientific
literature are as follows: (1) extrapolation of sea ice volume data, (2) assuming several more
rapid loss events such as 2007 and 2012, and (3) climate model projections. Time horizons for a
nearly sea ice-free summer for these three approaches are roughly 2020 or earlier,
2030 ± 10 years, and 2040 or later […with] the very likely timing for future sea ice loss to the
first half of the 21st century, with a possibility of major loss within a decade or two.” (Overland
and Wang, 2013)
YUKON RESEARCH CENTRE
Annotated Findings
57
“Recent Arctic changes are likely due to coupled Arctic amplification mechanisms with increased
linkage between Arctic climate and sub-Arctic weather. Historically, sea ice grew rapidly in
autumn, a strong negative radiative feedback. But increased sea-ice mobility, loss of multi-year
sea ice, enhanced heat storage in newly sea ice-free ocean areas, and modified wind fields form
connected positive feedback processes. One-way shifts in the Arctic system are sensitive to the
combination of episodic intrinsic atmospheric and ocean variability and persistent increasing
greenhouse gases.” (Overland et al., 2012)
“Melting of highly reflective arctic snow and ice reveals darker land and ocean surfaces,
increasing absorption of the sun’s heat and further warming the planet.” (ACIA, 2004)
10.3 Research is emerging showing that the jet stream is being influenced by the melting Arctic Ocean, creating larger ‘loops,’ which is in turn causing new weather patterns e.g. snowy winters on the North American Eastern seaboard. (high confidence)
“New metrics and evidence are presented that support a linkage between rapid Arctic warming,
relative to Northern Hemisphere mid-latitudes, and more frequent high-amplitude (wavy) jet-
stream configurations that favor persistent weather patterns. We find robust relationships
among seasonal and regional patterns of weaker poleward thickness gradients, weaker zonal
upper-level winds, and a more meridional flow direction. These results suggest that as the Arctic
continues to warm faster than elsewhere in response to rising greenhouse-gas concentrations,
the frequency of extreme weather events caused by persistent jet-stream patterns will
increase.” (Francis and Vavrus, 2015)
10.4 Carbon and methane trapped within and below permafrost may be released into the atmosphere as permafrost thaws. This would lead to an acceleration of climate warming. (high confidence)
“Arctic and alpine air temperatures are expected to increase at roughly twice the global rate
and climate projections indicate substantial loss of permafrost by 2100. A global temperature
increase of 3°C means a 6°C increase in the Arctic, resulting in anywhere between 30 to 85%
loss of near-surface permafrost. Such widespread permafrost degradation will permanently
change local hydrology, increasing the frequency of fire and erosion disturbances. The number
of wetlands and lakes will increase in continuous permafrost zones and decrease in
discontinuous zones, but will decrease overall as the continuous permafrost zone shrinks,
impacting critical habitat, particularly for migratory birds. Risks associated with rock fall and
erosion will increase, particularly in cold mountain areas. Damage to critical infrastructure, such
as buildings and roads, will incur significant social and economic costs.
REPORT
Yukon Climate Change Indicators and Key Findings
58
“Carbon dioxide (CO2) and methane emissions from thawing permafrost could amplify warming
due to anthropogenic greenhouse gas emissions. This amplification is called the permafrost
carbon feedback. Permafrost contains ~1700 gigatonnes (Gt) of carbon in the form of frozen
organic matter, almost twice as much carbon as currently in the atmosphere. If the permafrost
thaws, the organic matter will thaw and decay, potentially releasing large amounts of CO2 and
methane into the atmosphere. This organic material was buried and frozen thousands of years
ago and its release into the atmosphere is irreversible on human time scales. Thawing
permafrost could emit 43 to 135 Gt of CO2 equivalent by 2100 and 246 to 415 Gt of CO2
equivalent by 2200. Uncertainties are large, but emissions from thawing permafrost could start
within the next few decades and continue for several centuries, influencing both short-term
climate (before 2100) and long-term climate (after 2100).” (United Nations Environmental
Programme, 2012)
10.5 Glacial melt and ocean warming are leading to sea level rise. Glacial melt and diminishing sea ice also affect the global ocean currents. The mechanism which drives most of the ocean circulation is the thermohaline circulation - the sinking of dense cold and salty water - in the polar regions. (high confidence)
“Since the early 1970s, glacier mass loss and ocean thermal expansion from warming together
explain about 75% of the observed global mean sea level rise (high confidence). Over the period
1993 to 2010, global mean sea level rise is, with high confidence, consistent with the sum of the
observed contributions from ocean thermal expansion due to warming (1.1 [0.8 to 1.4] mm yr–
1), from changes in glaciers (0.76 [0.39 to 1.13] mm yr–1), Greenland ice sheet (0.33 [0.25 to
0.41] mm yr–1), Antarctic ice sheet (0.27 [0.16 to 0.38] mm yr–1), and land water storage (0.38
[0.26 to 0.49] mm yr–1). The sum of these contributions is 2.8 [2.3 to 3.4] mm yr–1.” (IPCC,
2013)
“Increases in glacial melt and river runoff add more freshwater to the ocean, raising global sea
level and possibly slowing the ocean circulation that brings heat from the tropics to the poles,
affecting global and regional climate.” (ACIA, 2004)
10.6 Many Arctic/northern species migrate to other parts of the globe. Changes to these species will affect other parts of the planet and vice versa. (medium confidence)
“The importance of Arctic ecosystems for biodiversity is immense and extends well beyond the
Arctic region. The Arctic, for example, supports many globally significant bird populations from
as far as Australia and New Zealand, Africa, South America, and Antarctica. Declines in Arctic
species, therefore, are felt in other parts of the world.” (Conservation of Arctic Flora and Fauna
Programme, 2010)

YUKON RESEARCH CENTRE
Annotated Findings
59
“Impacts of arctic climate change will have implications for biodiversity around the world
because migratory species depend on breeding and feeding grounds in the Arctic.” (ACIA, 2004)
REPORT
Yukon Climate Change Indicators and Key Findings
60
REFERENCES
ACIA (Arctic Climate Impact Assessment), 2004. Impacts of a Warming Climate – Arctic Climate
Impact Assessment. Cambridge University Press, New York, NY, 140 p.
Arctic Monitoring and Assessment Programme, 2013. Adaptation Actions for a Changing Arctic:
Synthesis report, 33 p.
Arendt, A.A., 2006. Volume changes of Alaska glaciers: Contributions to rising sea level and links
to changing climate. PhD dissertation, University of Alaska Fairbanks, 143 p.
Barrand, N.E. and M.J. Sharp, 2010. Sustained rapid shrinkage of Yukon glaciers since the 1957–
1958 International Geophysical Year. Geophysical Research Letters, vol. 37(7), L07501,
doi:10.1029/2009GL042030.
Bates, B.C., Z.W. Kundzewicz, S. Wu and J.P. Palutikof (eds.), 2008. Climate Change and Water.
Technical paper of the Intergovernmental Panel on Climate Change, IPCC Secretariat,
Geneva, 210 pp.
Benkert, B.E., K. Kennedy, D. Fortier, A. Lewkowicz, L.P. Roy, K. Grandmont, I. de Grandpré, S.
Laxton, K. McKenna, and K. Moote, 2015. Dawson City Landscape Hazards: Geoscience
Mapping for Climate Change Adaptation Planning. Northern Climate ExChange, Yukon
Research Centre, Yukon College. 166 p. and 2 maps.
Berteaux, D., D. Réale, A.G. McAdam and S. Boutin, 2004. Keeping pace with fast climate
change: Can Arctic life count on evolution? Integrative and Comparative Biology, vol. 44,
p. 140-151, doi:10.1093/icb/44.2.140.
Bjorkman, A.D., 2013. Ecological and evolutionary consequences of experimental warming in a
high Arctic tundra ecosystem. Arctic, vol. 66 no. 4, p. 512-515.
Blais-Stevens, A., M. Kremer, A. Page, and R. Couture, 2011. Regional landslide susceptibility
mapping along the Yukon Alaska Highway Corridor: A qualitative heuristic approach;
Geological Survey of Canada, Open File 6946, 1 CD-ROM. doi: 10.4095/288986
Burn, C.R. and Y. Zhang, 2009. Permafrost and climate change at Herschel Island (Qikiqtaruq),
Yukon Territory, Canada. Journal of Geophysical Research, vol. 114, p. F02001,
doi:10.1029/2008JF001087.
Calmels, F., L.-P. Roy, C. Laurent, M. Pelletier, L. Kinnear, B. Benkert, B. Horton and J. Pumple,
2015. Vulnerability of the North Alaska Highway to Permafrost Thaw: A Field Guide and
Data Synthesis. Whitehorse, Yukon: Northern Climate ExChange, Yukon Research
Centre.
Canadian Polar Commission, 2014. The State of Northern Knowledge in Canada. 42 p.
Canadian Standards Association, 2015. Community Drainage System Planning, Design, and
Maintenance in Northern Communities. Canadian Standards Association, CAN/CSA-
S503-15, ICS 91.140.80, ISBN 978-1-77139-879-4.
YUKON RESEARCH CENTRE
References
61
Canadian Standards Association, 2014. Managing Changing Snow Load Risks for Buildings in
Canada’s North. Canadian Standards Association, CAN/CSA-S502-14, ICS 91.040.01, ISBN
978-1-77139-766-7.
Canadian Standards Association, 2014. Moderating the Effects of Permafrost Degradation on
Existing Building Foundations. Canadian Standards Association, CAN/CSA-S501-14, ICS
91.040.01, ISBN 978-1-77139-726-1.
Canadian Standards Association, August 2014, Thermosyphon Foundations for Buildings in
Permafrost Regions. Canadian Standards Association, CAN/CSA-S500-14, ICS 91.120.99,
ISBN 978-1-77139-604-2.
Champagne and Aishihik First Nations and Alsek Renewable Resource Council, 2009. Climate
Change in our Backyard II Conference Report. Haines Junction, Yukon, 29 p.
Champalle, C., E. Sparling, P. Tudge, R. Riedlsperger, J. Ford, and T. Bell, 2013. Adapting the built
environment in a changing northern climate: A review of climate hazard-related
mapping and vulnerability assessments of the built environment in Canada’s North to
inform climate change adaptation. Report for Natural Resources Canada, Climate
Change Impacts and Adaptation, Ottawa, Canada.
Climate Registry, 2015. Government of Yukon Emissions Year 2010, 2011, 2012.
http://ftp.tcrreports.org/reportingpage/%28S%28io4noybceuk01zni1bop0dne%29%29/f
rmLILogin.aspx [accessed November, 2015].
Coates, J. and A.G. Lewkowicz, 2008. Landsliding following forest fire on permafrost slopes,
Klondike Area, Yukon, Canada. In: Ninth International Conference on Permafrost,
Extended Abstracts, D.L. Kane and K.M. Hinkel (eds.), Fairbanks, Alaska, June 29-July 3,
2008, p. 49-50.
Cohen, J., J.A. Screen, J.C. Furtado, M. Barlow, D. Whittleston, D. Coumou, J. Francis, K. Dethloff,
D. Entekhabi, J. Overland, and J. Jones, 2014. Recent Arctic amplification and extreme
mid-latitude weather. Nature Geoscience, 7(9), 627–637, doi: 10.1038/ngeo2234.
Collins, M., R. Knutti, J. Arblaster, J.L. Dufresne, T. Fichefet, P. Friedlingstein, X. Gao, W.J.
Gutowski, T. Johns, G. Krinner, M. Shongwe, C. Tebaldi, A.J. Weaver and M. Wehner,
2013. Long-term climate change: Projections, commitments and irreversibility. In:
Climate Change 2013: The Physical Science Basis. Contribution of Working Group I to the
Fifth Assessment Report of the Intergovernmental Panel on Climate Change [Stocker,
T.F., D. Qin, G.-K. Plattner, M. Tignor, S.K. Allen, J. Boschung, A. Nauels, Y. Xia, V. Bex and
P.M. Midgley (eds.)]. Cambridge University Press, Cambridge, United Kingdom and New
York, NY, USA.
Conservation of Arctic Flora and Fauna Programme, 2010. Arctic Biodiversity Trends 2010:
Selected indicators of change. CAFF International Secretariat, Akureyri, Iceland.121 p.
Copenhagen Accord, 2009. U.N. Framework Convention on Climate Change. United Nations.
REPORT
Yukon Climate Change Indicators and Key Findings
62
Council of Canadian Academies, 2014. Aboriginal Food Security in Northern Canada: An
Assessment of the State of Knowledge. ISBN 978-1-926558-73-8 (pbk.), ISBN 978-1-
926558-74-5 (pdf).
Council of Yukon First Nations, 2011. Yukon Climate Change Needs Assessment. Whitehorse,
Yukon, 67 p.
de Grandpré, I., D. Fortier, and E. Stephani, 2010. Impact of groundwater flow on permafrost
degradation: Implications for transportation infrastructures. In: 63rd Canadian
Geotechnical Conference & 6th Canadian Permafrost Conference, September 12-16,
2010, Calgary, Alberta, p. 534-540.
Derksen, C., and Coauthors, 2012. Variability and change in the Canadian cryosphere. Climate
Change, 115, 59–88, doi:10.1007/s10584-012-0470-0.
Déry, S.J. M.A. Hernández-Henríquez, J.E. Burford and E.F. Wood, 2009. Observational evidence
of an intensifying hydrological cycle in northern Canada. Geophysical Research Letters,
vol. 36, L13402, doi:10.1029/2009GL038852.
EBA Engineering Consultants Ltd., 2004. Permafrost considerations for effective mine site
development in the Yukon Territory. Mining and Environment Research Group,
Whitehorse, Yukon Territory, 33 p.
Engineers Canada, 2013. Infrastructure Climate Risk Assessment Backgrounder. 7 p.
Environment Canada, 2015. National Inventory Report 1990-2013 Part 3: Greenhouse Gas
Sources and Sinks in Canada. The Canadian Government’s Submission to the UN
Framework Convention on Climate Change. 85 p.
Environment Canada, 2013. Climate Trends and Variations Bulletin: Annual for 2013.
Environment Canada, http://www.ec.gc.ca/adsc-cmda/, [accessed January, 2015].
Environment Yukon, 2012. Yukon Government Climate Change Action Plan – Progress Report,
21 p.
Environment Yukon, 2011. Yukon Water: An Assessment of Climate Change Vulnerabilities.
Whitehorse, Yukon, 98 p.
Environment Yukon, 2009. Yukon Government Climate Change Action Plan, Whitehorse, Yukon,
45 p.
Fetterer, F., K. Knowles, W. Meier, and M. Savoie., 2002 (updated daily). Sea Ice Index: Daily and
monthly Arctic sea ice extent from 1979 to present. National Snow and Ice Data Center,
Boulder, Colorado USA, http://dx.doi.org/10.7265/N5QJ7F7W.
Forest Management Branch, 2014. 2013 Yukon Forest Health Report. Forest Management
Branch, Energy Mines and Resources. Whitehorse, Yukon, 38 p.
Flannigan, M., B. Stocks, M. Turetsky, and M. Wotton, 2008. Impacts of climate change on fire
activity and fire management in the circumboreal forest. Global Change Biology, vol. 14,
p. 1–12, doi:10.1111/j.1365-2486.2008.01660.x.
YUKON RESEARCH CENTRE
References
63
Francis, J.A., and J.E. Overland, 2014. Implications of rapid Arctic change for weather patterns in
northern mid-latitudes. CLIVAR Variations, vol. 12(3), p. 10–13.
Francis J.A., and S.J. Vavrus, 2015. Evidence for a wavier jet stream in response to rapid Arctic
warming. Environmental Research Letters, vol. 10.
Francis J.A., and S.J. Vavrus, 2012. Evidence linking Arctic amplification to extreme weather in
mid-latitudes. Geophysical Research Letters, vol. 39, doi:10.1029/2012GL051000.
Friendship, K., 2010. Climate Change and Food Security in the North: A literature review 2010.
Arctic Health Research Network-YT, Whitehorse, Yukon, 16 p.
Furgal, C., and T.D. Prowse, 2008. Northern Canada. In: From Impacts to Adaptation: Canada in
a Changing Climate 2007, D.S. Lemmen, F.J. Warren, J. Lacroix and E. Bush (eds.).
Natural Resources Canada, Government of Canada, Ottawa, ON, p. 57-118.
Guyot, M., C. Dickson, C. Paci, C. Furgal, and H.M. Chan, 2006. Local observations of climate
change and impacts on traditional food security in two northern aboriginal
communities. International Journal of Circumpolar Health, vol. 65(5), p. 403-415.
Hennessey, R. and J. Streicker, 2011. Whitehorse Climate Change Adaptation Plan. Northern
Climate ExChange, Yukon Research Centre, Yukon College, Whitehorse, Yukon, 84 p.
Hinzman , L., N. Bettez, W. Bolton, F. Chapin, M. Dyurgerov, C. Fastie, B. Griffith, R. Hollister,
A. Hope, H. Huntington, et al., 2005. Evidence and implications of recent climate change
in northern Alaska and other Arctic regions. Climatic Change, vol. 72, p. 251-298.
Hodge, J., 2012. Mountain Pine Beetle Pest Risk Analysis for Yukon Lodgepole Pine Forests.
RPBio JCH Forest Pest Management, Coldstream, British Columbia. 84 p.
Hogg, E.H., and R.W. Wein, 2005. Impacts of drought on forest growth and regeneration
following fire in southwestern Yukon, Canada. Canadian Journal of Forest Research, vol.
35, p. 2141–2150 (2005), doi:10.1139/X05-120.
Humphries, M.M., J. Umbanhowar and K.S. McCann, 2004. Bioenergetic prediction of climate
change impacts on northern mammals. Integrative and Comparative Biology, vol. 44, p.
152-162, doi:10.1093/icb/44.2.152.
International Energy Agency, 2014. World Energy Outlook, 2014, Executive Summary. IEA
Publications, Paris, France, p. 7.
IPCC (International Panel on Climate Change), 2014. Summary for policymakers. In: Climate
Change 2014: Impacts, Adaptation, and Vulnerability, Part A: Global and Sectoral
Aspects. Contribution of Working Group II to the Fifth Assessment Report of the
Intergovernmental Panel on Climate Change [Field, C.B., V.R. Barros, D.J. Dokken, K.J.
Mach, M.D. Mastrandrea, T.E. Bilir, M. Chatterjee, K.L. Ebi, Y.O. Estrada, R.C. Genova, B.
Girma, E.S. Kissel, A.N. Levy, S. MacCracken,P.R. Mastrandrea, and L.L. White (eds.)].
Cambridge University Press, Cambridge, United Kingdom and New York, NY, USA, p. 1-
32.
REPORT
Yukon Climate Change Indicators and Key Findings
64
IPCC, 2013. Summary for Policymakers. In: Climate Change 2013: The Physical Science Basis.
Contribution of Working Group I to the Fifth Assessment Report of the
Intergovernmental Panel on Climate Change [Stocker, T.F., D. Qin, G.K. Plattner, M.
Tignor, S. K. Allen, J. Boschung, A. Nauels, Y. Xia, V. Bex and P.M. Midgley (eds.)].
Cambridge University Press, Cambridge, United Kingdom and New York, NY, USA, p. 3-
29.
IPCC, 2012. Summary for Policymakers. In: Managing the Risks of Extreme Events and Disasters
to Advance Climate Change Adaptation [Field, C.B., V. Barros, T.F. Stocker, D. Qin, D.J.
Dokken, K.L. Ebi, M.D. Mastrandrea, K.J. Mach, G.-K. Plattner, S.K. Allen, M. Tignor, and
P.M. Midgley (eds.)]. A Special Report of Working Groups I and II of the
Intergovernmental Panel on Climate Change. Cambridge University Press, Cambridge,
UK, and New York, NY, USA, p. 1-19.
IPCC, 2007. Climate Change 2007: The Physical Science Basis. Contribution of Working Group I
to the Fourth Assessment Report of the Intergovernmental Panel on Climate Change
[Solomon, S., D. Qin, M. Manning, Z. Chen, M. Marquis, K.B. Averyt, M.Tignor and H.L.
Miller (eds.)]. Cambridge University Press, Cambridge, United Kingdom and New York,
NY, USA, 996 p.
James, M., A. Lewkowicz, S. Smith, and P. Lipovsky, 2008. Historic change in permafrost
distribution in northern British Columbia and southern Yukon. In: Ninth International
Conference on Permafrost, Extended Abstracts, D.L. Kane and K.M. Hinkel (eds.),
Fairbanks, Alaska, June 29-July 3, 2008, p. 115-116.
Janowicz, R.J., 2010. Observed trends in the river ice regimes of northwest Canada. Hydrology
Research, vol. 41(6), p. 462-470.
Janowicz, R.J., 2008. Apparent recent trends in hydrologic response in permafrost regions of
northwest Canada. Hydrology Research, vol. 39(4), p. 267-275.
Johnstone, J.F., E.J.B. McIntire, E.J. Pedersen, G. King and M.J.F. Pisaric, 2010. A sensitive slope:
Estimating landscape patterns of forest resilience in a changing climate. Ecosphere, vol.
1(6), p. 14, doi:10.1890/ES10-00102.1.
Kochtubajda, B., W.R. Burrows, D. Green, A. Liu, K.R. Anderson and D. McLennan, 2011.
Exceptional cloud-to-ground lightning during an unusually warm summer in Yukon,
Canada. Journal of Geophysical Research, vol. 116, D21206, doi:10.1029/2011JD016080.
Lambden, J., O. Receveur and H.V. Kuhnlein, 2007. Traditional food attributes must be included
in studies of food security in the Canadian Arctic. International Journal of Circumpolar
Health, vol. 66(4), p. 308-319.
Larsen, C., E. Burgess, A. Arendt, S. O’Neel, A. Johnson, and C. Kienholz, 2015. Surface melt
dominates Alaska glacier mass balance. Geophysical Research Letters, vol. 42, p. 5902–
5908, doi:10.1002/2015GL064349.
YUKON RESEARCH CENTRE
References
65
Larsen, J.N., O.A. Anisimov, A. Constable, A.B. Hollowed, N. Maynard, P. Prestrud, T.D. Prowse,
and J.M.R. Stone, 2014. Polar regions. In: Climate Change 2014: Impacts, Adaptation,
and Vulnerability, Part B: Regional Aspects. Contribution of Working Group II to the Fifth
Assessment Report of the Intergovernmental Panel on Climate Change [Barros, V.R., C.B.
Field, D.J. Dokken, M.D. Mastrandrea, K.J. Mach, T.E. Bilir, M. Chatterjee, K.L. Ebi, Y.O.
Estrada, R.C. Genova,B. Girma, E.S. Kissel, A.N. Levy, S. MacCracken, P.R. Mastrandrea,
and L.L. White (eds.)]. Cambridge University Press, Cambridge, United Kingdom and New
York, NY, USA, p. 1567-1612.
Lindsay, R., and A. Schweiger, 2015. Arctic sea ice thickness loss determined using subsurface,
aircraft, and satellite observations. The Cryosphere, vol. 9, p. 269–283.
Lipovsky, P.S., J. Coates, A.G. Lewkowicz, and E. Trochim, 2006. Active-layer detachments
following the summer 2004 forest fires near Dawson City, Yukon. In: Yukon Exploration
and Geology 2005, D.S. Emond, G.D. Bradshaw, L.L. Lewis and L.H. Weston (eds.), Yukon
Geological Survey, p. 175-194.
Loring, P. and S.C. Gerlach, 2009. Food, culture, and human health in Alaska: An integrative
health approach to food security. Environmental Science & Policy, vol. 12 issue 4, p. 466-
478.
Luthcke, S.B., A.A. Arendt, D.D. Rowlands, J.J. McCarthy and C.F. Larsen, 2008. Recent glacier
mass changes in the Gulf of Alaska region from GRACE mascon solutions. Journal of
Glaciology, vol. 54, p. 767-777, doi:10.3189/002214308787779933.
Mackenzie-Grieve, J.L. and J.R. Post, 2006. Projected impacts of climate warming on production
of lake trout (Salvelinus namaycush) in southern Yukon lakes. Canadian Journal of
Fisheries and Aquatic Sciences, vol. 63, p. 788-797, doi:10.1139/F05-257.
Mantua, N.J., S.R. Hare, Y. Zhang, J.M. Wallace, and R.C. Francis, 1997. A Pacific interdecadal
climate oscillation with impacts on salmon production. Bulletin of the American
Meteorological Society, vol. 78, p. 1069-1079.
McCoy, V.M. and C.R. Burn, 2005. Potential alteration by climate change of the forest-fire
regime in the boreal forest of central Yukon Territory. Arctic, vol. 58(3), p. 276-285.
Mastrandrea, M.D., C.B. Field, T.F. Stocker, O. Edenhofer, K.L. Ebi, D.J. Frame, H. Held, E.
Kriegler, K.J. Mach, P.R. Matschoss, G.K. Plattner, G.W. Yohe, and F.W. Zwiers, 2010.
Guidance Note for Lead Authors of the IPCC Fifth Assessment Report on Consistent
Treatment of Uncertainties. Intergovernmental Panel on Climate Change (IPCC).
Moore, R.D., S.W. Fleming, B. Menounos, R. Wheate, A. Fountain, K. Stahl, K. Holm, and M.
Jakob, 2009. Glacier change in western North America: Influences on hydrology,
geomorphic hazards and water quality. Hydrological Processes, vol. 23(1) p. 42-61,
doi:10.1002/hyp.7162.
Myers-Smith I.H., B.C. Forbes, M. Wilmking, M. Hallinger, T. Lantz, D. Blok, K.D. Tape, M. Macias-
Fauria, U. Sass-Klaassen, E. Levesque, S. Boudreau, P. Ropars, L. Hermanutz, A. Trant, L.
REPORT
Yukon Climate Change Indicators and Key Findings
66
Siegwart-Collier, S. Wijers, J. Rozema, S.A. Rayback, N.M. Schmidt, G. Schaepman-Strub,
S. Wipf, C. Rixen, C.B. Menard, S. Venn, S. Goetz, L. Andreu-Hayles, S. Elmendorf, V.
Ravolainen, J. Welker, P. Grogan, H.E. Epstein, and D.S. Hik, 2011. Shrub expansion in
tundra eco-systems: Dynamics, impacts and research priorities. Environmental Research
Letters, vol. 6(4), 045509, 15 p.
Myers-Smith, I., 2007. Shrub line advance in alpine tundra of the Kluane region: Mechanisms of
expansion and ecosystem impacts. Arctic, vol. 60(4), p. 447-451.
National Round Table on the Environment and the Economy (NRTEE), 2009. True North:
Adapting Infrastructure to Climate Change in Northern Canada. Ottawa, ON, 146 p.
Nealis, V. and B. Peter, 2008. Risk assessment of the threat of mountain pine beetle to Canada’s
boreal and eastern pine forests. Canadian Forest Service, Pacific Forestry Centre,
Victoria, 31 p., ISSN 0830-0453, ISBN 978-1-100-10342-6, BC-X-417.
Newton, J., C.D.J. Paci, and A. Ogden, 2005. Climate change and natural hazards in northern
Canada: Integrating indigenous perspectives with government policy. Mitigation and
Adaptation Strategies for Global Change, vol. 10, p. 541-571, doi:10.1007/1-4020-4514-
X_11.
Northern Climate ExChange, 2014. Projected Future Changes in Glaciers and their Contribution
to Discharge of the Yukon River at Whitehorse. Northern Climate ExChange, Yukon
Research Centre, Yukon College, Whitehorse, Yukon, 44 p.
Northern Climate ExChange, 2013. Burwash Landing and Destruction Bay Landscape Hazards:
Geological Mapping for Climate Change Adaptation Planning. Yukon Research Centre,
Yukon College, Whitehorse, Yukon, 111 p. and 2 maps.
Northern Climate ExChange, 2013. Compendium of Yukon Climate Change Science 2003-2013.
Northern Climate ExChange, Yukon Research Centre, Yukon College, Whitehorse, Yukon,
240 p.
Northern Climate Exchange, 2011. Pelly Crossing Landscape Hazards: Geological Mapping for
Climate Change Adaptation Planning. Northern Climate ExChange, Yukon Research
Centre, Yukon College, Whitehorse, Yukon, 56 p.
Overland, J.E., and M. Wang, 2013. When will the summer Arctic be nearly sea ice free?
Geophysical Research Letters, vol. 40(10), p. 2097–2101, doi:10.1002/grl.50316.
Overland, J.E., K.R. Wood, and M. Wang, 2011. Warm Arctic - cold continents: Climate impacts
of the newly open Arctic Sea. Polar Research, vol. 30, 14 p., 15787,
doi:10.3402/polar.v30i0.15787.
Pan-Territorial Information Notes, 2013. Effects of changing permafrost conditions on
agriculture and agriculture capability classification in Yukon. Pan-Territorial Adaptation
Partnership, ISSN: 2291-3904.
YUKON RESEARCH CENTRE
References
67
Pearce, T.D., J.D. Ford, J. Prno, F. Duerden, J. Pittman, M. Beaumier, L. Berrang-Ford and B. Smit,
2011. Climate change and mining in Canada. Mitigation and Adaptation Strategies for
Global Change, vol. 16, p. 347-368, doi:10.1007/s11027-010-9269-3.
Pinard, J.P., 2007. Wind Climate of the Whitehorse area. Journal Arctic, vol. 60(3), p. 227–237.
Prowse, T.D., 2009. Introduction: hydrological effects of a shrinking cryosphere. Hydrological
Processes, vol. 23, p. 1-6.
Purves, M., 2006. Climate Change in the Yukon, Some Observations. Yukon Weather Centre
Internal report YWC-06-109, 57 p. Private correspondence from the author.
Russell, D.E. and P. McNeil, 2005. Summer Ecology of the Porcupine Caribou Herd. Porcupine
Caribou Management Board, Whitehorse, Yukon, 14 p.
Schaefer, K., H. Lantuit, V.E. Romanovsky, E.A. Schuur and R. Witt, 2014. The impact of the
permafrost carbon feedback on global climate. Environmental Research Letters, vol. 9
085003, 9 p.
Schuster, P., R. Striegl, G. Aiken, D. Krabbenhoft, J. Dewild, K. Butler, B. Kamark, and M.
Dornblaser, 2011. Mercury export from the Yukon River Basin and potential response to
a changing climate. Journal of Environmental Science & Technology, vol. 45(21), p. 9262-
9267.
Schweiger, A., R. Lindsay, J. Zhang, M. Steele, H. Stern and R. Kwok, 2011. Uncertainty in
modeled Arctic sea ice volume. Journal of Geophysical Research, vol. 116(C8), C00D06,
doi:10.1029/2011JC007084.
Smith, S.L., V.E. Romanovsky, A.G. Lewkowicz, C.R. Burn, M. Allard, G.D. Clow, K. Yoshikawa and
J. Throop, 2010. Thermal state of permafrost in North America: A contribution to the
International Polar Year. In: Permafrost and Periglacial Processes, vol. 21, p. 117–135,
doi:10.1002/ppp.690.
SNAP, 2009. Climate Change Impacts on Water Availability in Alaska. Scenarios Network for
Alaska Planning, University of Alaska Fairbanks,
http://www.snap.uaf.edu/projects/climate-change-impacts-water-availability-alaska,
[accessed March, 2011].
St. Jacques, J.-M. and D. J. Sauchyn, 2009. Increasing winter baseflow and mean annual
streamflow from possible permafrost thawing in the Northwest Territories, Canada.
Geophysical Research Letters, vol. 36, 6 p., L01401, doi:10.1029/2008GL035822.
Stephani, E., D. Fortier, and Y. Shur, 2010. Applications of cryofacies approach to frozen ground
engineering – Case study of a road test site along the Alaska Highway (Beaver Creek,
Yukon, Canada). In: GEO2010: 63rd Canadian Geotechnical Conference and 6th
Canadian Permafrost Conference, Calgary, Canada.
Stocker, T.F., D. Qin, G.-K. Plattner, L.V. Alexander, S.K. Allen, N.L. Bindoff, F.M. Bréon, J.A.
Church, U. Cubasch, S. Emori, P. Forster, P. Friedlingstein, N. Gillett, J.M. Gregory, D.L.
Hartmann, E. Jansen, B. Kirtman, R. Knutti, K. Krishna Kumar, P. Lemke, J. Marotzke, V.
REPORT
Yukon Climate Change Indicators and Key Findings
68
Masson-Delmotte, G.A. Meehl, I.I. Mokhov, S. Piao, V. Ramaswamy, D. Randall, M.
Rhein, M. Rojas, C. Sabine, D. Shindell, L.D. Talley, D.G. Vaughan and S.P. Xie, 2013.
Technical Summary. In: Climate Change 2013: The Physical Science Basis. Contribution of
Working Group I to the Fifth Assessment Report of the Intergovernmental Panel on
Climate Change [Stocker, T.F., D. Qin, G.-K. Plattner, M. Tignor, S.K. Allen, J. Boschung, A.
Nauels, Y. Xia, V. Bex and P.M. Midgley (eds.)]. Cambridge University Press, Cambridge,
United Kingdom and New York, NY, USA, p. 33-115.
Taggart, M. and F. Pearson, 2015. Yukon Greenhouse Gas Emissions: The Transportation Sector.
Government of Yukon, Whitehorse, Yukon. 35 p.
Transportation Association of Canada, 2010. Primer on Developing and Managing
Transportation Infrastructure in Permafrost Regions. Transportation Association of
Canada, Ottawa, ON, 8 p.
Umbrella Final Agreement, 1993. Umbrella Final Agreement between the Government of
Canada, the Council for Yukon Indians and the Government of the Yukon. 292 p.
United Nations Environmental Programme, 2012. Policy Implications of Warming Permafrost.
United Nations Environment Programme, Nairobi, Kenya, 30 p., ISBN: 978-92-807-3308-
2.
Vaughan, D.G., J.C. Comiso, I. Allison, J. Carrasco, G. Kaser, R. Kwok, P. Mote, T. Murray, F. Paul,
J. Ren, E. Rignot, O. Solomina, K. Steffen and T. Zhang, 2013. Observations: Cryosphere.
In: Climate Change 2013: The Physical Science Basis. Contribution of Working Group I to
the Fifth Assessment Report of the Intergovernmental Panel on Climate Change
[Stocker, T.F., D. Qin, G.-K. Plattner, M. Tignor, S.K. Allen, J. Boschung, A. Nauels, Y. Xia,
V. Bex and P.M. Midgley (eds.)]. Cambridge University Press, Cambridge, United
Kingdom and New York, NY, USA, p. 317-382.
Willows, N., 2005. Determinants of healthy eating in Aboriginal Peoples in Canada: The current
state of knowledge and research gaps. Canadian Journal of Public Health, vol. 96(3), p.
32-36.
Wilson, N.J., M. T. Walter and J. Waterhouse, 2015. Indigenous knowledge of hydrologic change
in the Yukon River Basin: A case study of Ruby, Alaska. Arctic, vol. 68(1), p. 93-106,
http://dx.doi.org/10.14430/arctic4459.
Guthrie, R.H. and V. Cuervo, 2015. Geohazards and Risk: A Proponent's Guide to Linear
Infrastructure. Yukon Environmental and Socio-economic Assessment Board,
Whitehorse, Yukon, 50 p.
Yuan, F.M., S.H. Yi, A.D. McGuire, K.F. Johnson, J.W. Harden, E.S. Kasischke, and W.A. Kurz,
2012. Assessment of boreal forest historical C dynamics in the Yukon River Basin:
Relative roles of warming and fire regime change. Ecological Applications, vol. 22, p.
2091-2109, doi:10.1890/11-1957.1.
YUKON RESEARCH CENTRE
References
69
Yukon Invasive Species Council, 2011. The Effects of Climate Change on Invasive Species and
Their Potential Impacts in Whitehorse. Industrial Forest Service Ltd., Prince George,
British Columbia, 83 p.
Zhang, J and D. Rothrock, 2001. A thickness and enthalpy distribution sea-ice model. Journal of
Physical Oceanography, vol. 31, p. 2986-3001.
Zhang, Y., J.M. Wallace, and D.S. Battisti, 1997. ENSO-like interdecadal variability: 1900-93.
Journal of Climate, vol. 10, p. 1004-1020.
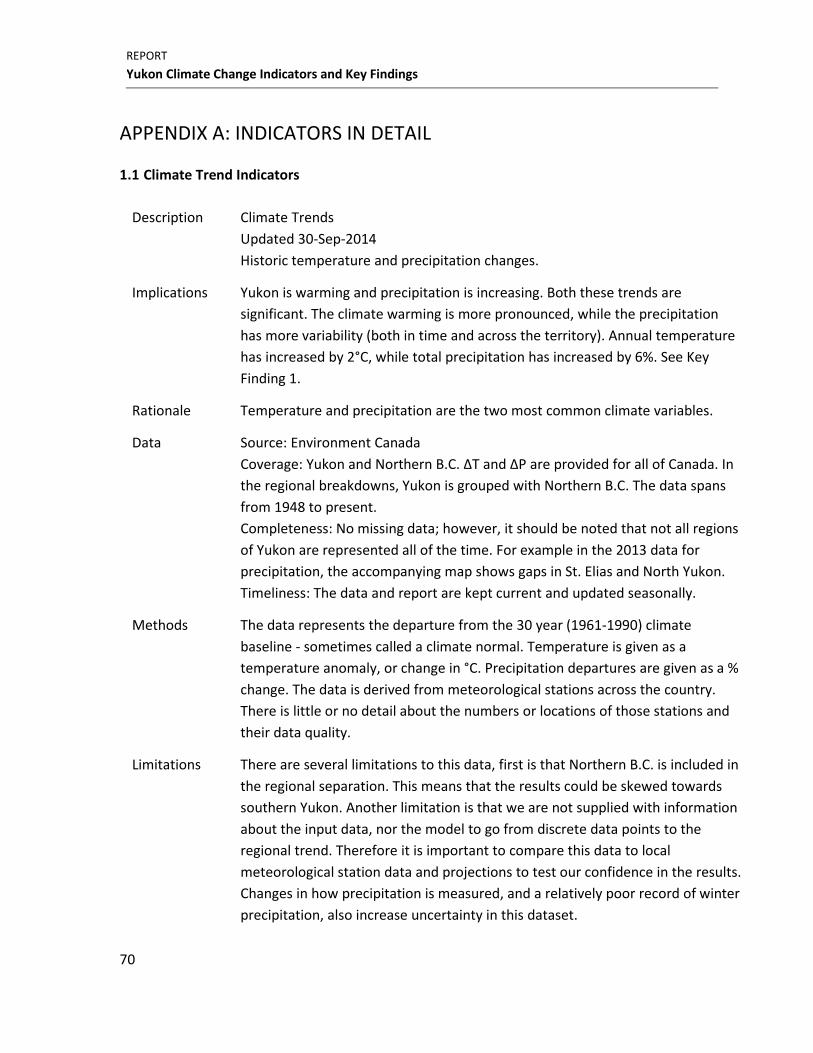
REPORT
Yukon Climate Change Indicators and Key Findings
70
APPENDIX A: INDICATORS IN DETAIL
1.1 Climate Trend Indicators
Description Climate Trends
Updated 30-Sep-2014
Historic temperature and precipitation changes.
Implications Yukon is warming and precipitation is increasing. Both these trends are
significant. The climate warming is more pronounced, while the precipitation
has more variability (both in time and across the territory). Annual temperature
has increased by 2°C, while total precipitation has increased by 6%. See Key
Finding 1.
Rationale Temperature and precipitation are the two most common climate variables.
Data Source: Environment Canada
Coverage: Yukon and Northern B.C. ∆T and ∆P are provided for all of Canada. In
the regional breakdowns, Yukon is grouped with Northern B.C. The data spans
from 1948 to present.
Completeness: No missing data; however, it should be noted that not all regions
of Yukon are represented all of the time. For example in the 2013 data for
precipitation, the accompanying map shows gaps in St. Elias and North Yukon.
Timeliness: The data and report are kept current and updated seasonally.
Methods The data represents the departure from the 30 year (1961-1990) climate
baseline - sometimes called a climate normal. Temperature is given as a
temperature anomaly, or change in °C. Precipitation departures are given as a %
change. The data is derived from meteorological stations across the country.
There is little or no detail about the numbers or locations of those stations and
their data quality.
Limitations There are several limitations to this data, first is that Northern B.C. is included in
the regional separation. This means that the results could be skewed towards
southern Yukon. Another limitation is that we are not supplied with information
about the input data, nor the model to go from discrete data points to the
regional trend. Therefore it is important to compare this data to local
meteorological station data and projections to test our confidence in the results.
Changes in how precipitation is measured, and a relatively poor record of winter
precipitation, also increase uncertainty in this dataset.
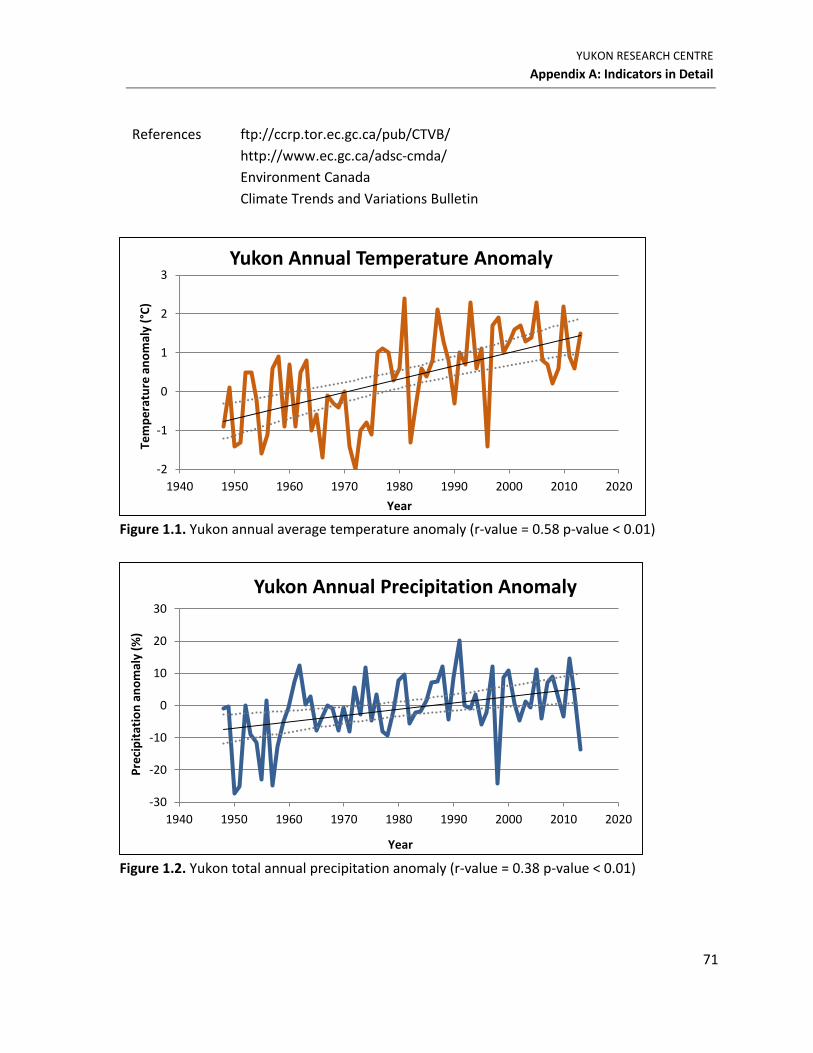
YUKON RESEARCH CENTRE
Appendix A: Indicators in Detail
71
References ftp://ccrp.tor.ec.gc.ca/pub/CTVB/
http://www.ec.gc.ca/adsc-cmda/
Environment Canada
Climate Trends and Variations Bulletin
Figure 1.1. Yukon annual average temperature anomaly (r-value = 0.58 p-value < 0.01)
Figure 1.2. Yukon total annual precipitation anomaly (r-value = 0.38 p-value < 0.01)
-2
-1
0
1
2
3
1940 1950 1960 1970 1980 1990 2000 2010 2020
Tem
pe
ratu
re a
no
mal
y (°
C)
Year
Yukon Annual Temperature Anomaly
-30
-20
-10
0
10
20
30
1940 1950 1960 1970 1980 1990 2000 2010 2020
Pre
cip
itat
ion
an
om
aly
(%)
Year
Yukon Annual Precipitation Anomaly
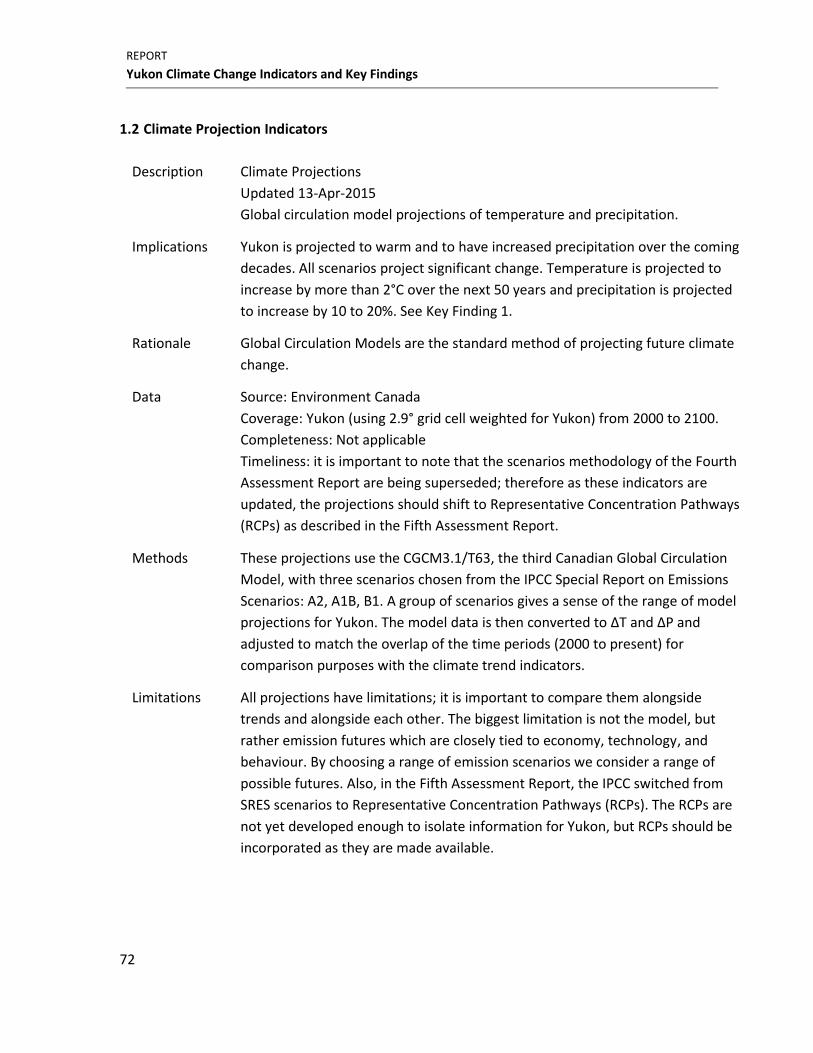
REPORT
Yukon Climate Change Indicators and Key Findings
72
1.2 Climate Projection Indicators
Description Climate Projections
Updated 13-Apr-2015
Global circulation model projections of temperature and precipitation.
Implications Yukon is projected to warm and to have increased precipitation over the coming
decades. All scenarios project significant change. Temperature is projected to
increase by more than 2°C over the next 50 years and precipitation is projected
to increase by 10 to 20%. See Key Finding 1.
Rationale Global Circulation Models are the standard method of projecting future climate
change.
Data Source: Environment Canada
Coverage: Yukon (using 2.9° grid cell weighted for Yukon) from 2000 to 2100.
Completeness: Not applicable
Timeliness: it is important to note that the scenarios methodology of the Fourth
Assessment Report are being superseded; therefore as these indicators are
updated, the projections should shift to Representative Concentration Pathways
(RCPs) as described in the Fifth Assessment Report.
Methods These projections use the CGCM3.1/T63, the third Canadian Global Circulation
Model, with three scenarios chosen from the IPCC Special Report on Emissions
Scenarios: A2, A1B, B1. A group of scenarios gives a sense of the range of model
projections for Yukon. The model data is then converted to ∆T and ∆P and
adjusted to match the overlap of the time periods (2000 to present) for
comparison purposes with the climate trend indicators.
Limitations All projections have limitations; it is important to compare them alongside
trends and alongside each other. The biggest limitation is not the model, but
rather emission futures which are closely tied to economy, technology, and
behaviour. By choosing a range of emission scenarios we consider a range of
possible futures. Also, in the Fifth Assessment Report, the IPCC switched from
SRES scenarios to Representative Concentration Pathways (RCPs). The RCPs are
not yet developed enough to isolate information for Yukon, but RCPs should be
incorporated as they are made available.
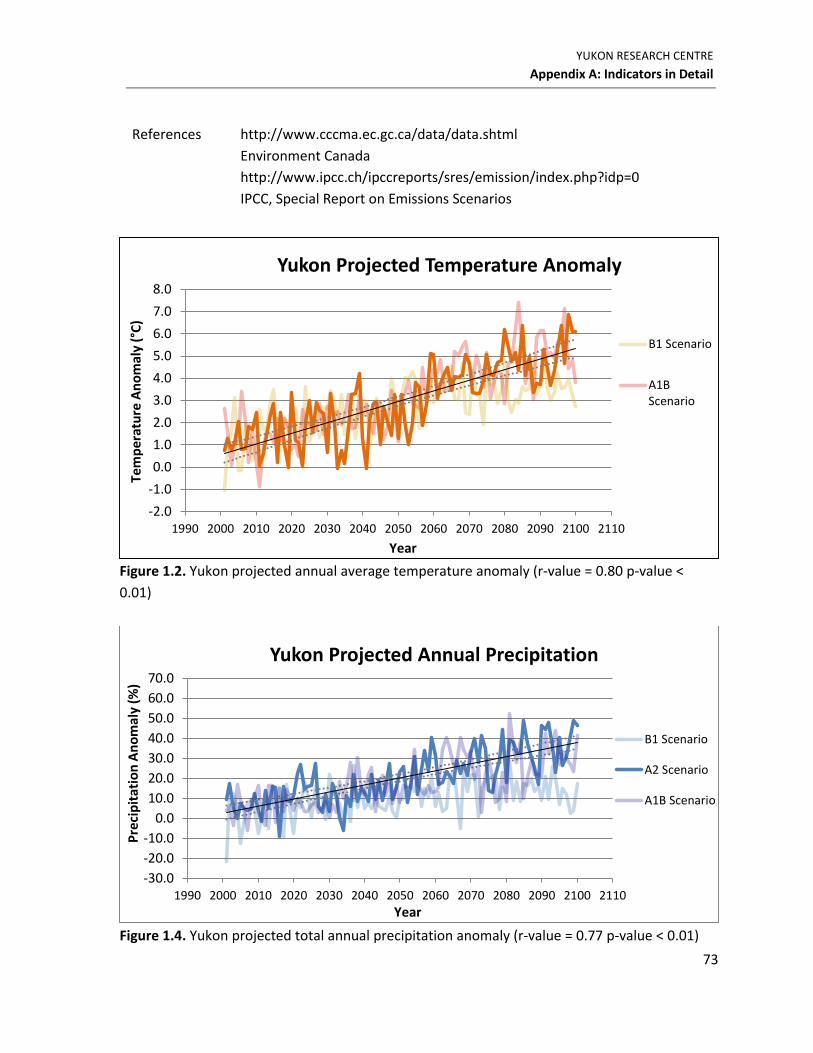
YUKON RESEARCH CENTRE
Appendix A: Indicators in Detail
73
References http://www.cccma.ec.gc.ca/data/data.shtml
Environment Canada
http://www.ipcc.ch/ipccreports/sres/emission/index.php?idp=0
IPCC, Special Report on Emissions Scenarios
Figure 1.2. Yukon projected annual average temperature anomaly (r-value = 0.80 p-value <
0.01)
Figure 1.4. Yukon projected total annual precipitation anomaly (r-value = 0.77 p-value < 0.01)
-2.0
-1.0
0.0
1.0
2.0
3.0
4.0
5.0
6.0
7.0
8.0
1990 2000 2010 2020 2030 2040 2050 2060 2070 2080 2090 2100 2110
Tem
per
atu
re A
no
mal
y (°
C)
Year
Yukon Projected Temperature Anomaly
B1 Scenario
A1BScenario
-30.0
-20.0
-10.0
0.0
10.0
20.0
30.0
40.0
50.0
60.0
70.0
1990 2000 2010 2020 2030 2040 2050 2060 2070 2080 2090 2100 2110
Pre
cip
itat
ion
An
om
aly
(%)
Year
Yukon Projected Annual Precipitation
B1 Scenario
A2 Scenario
A1B Scenario
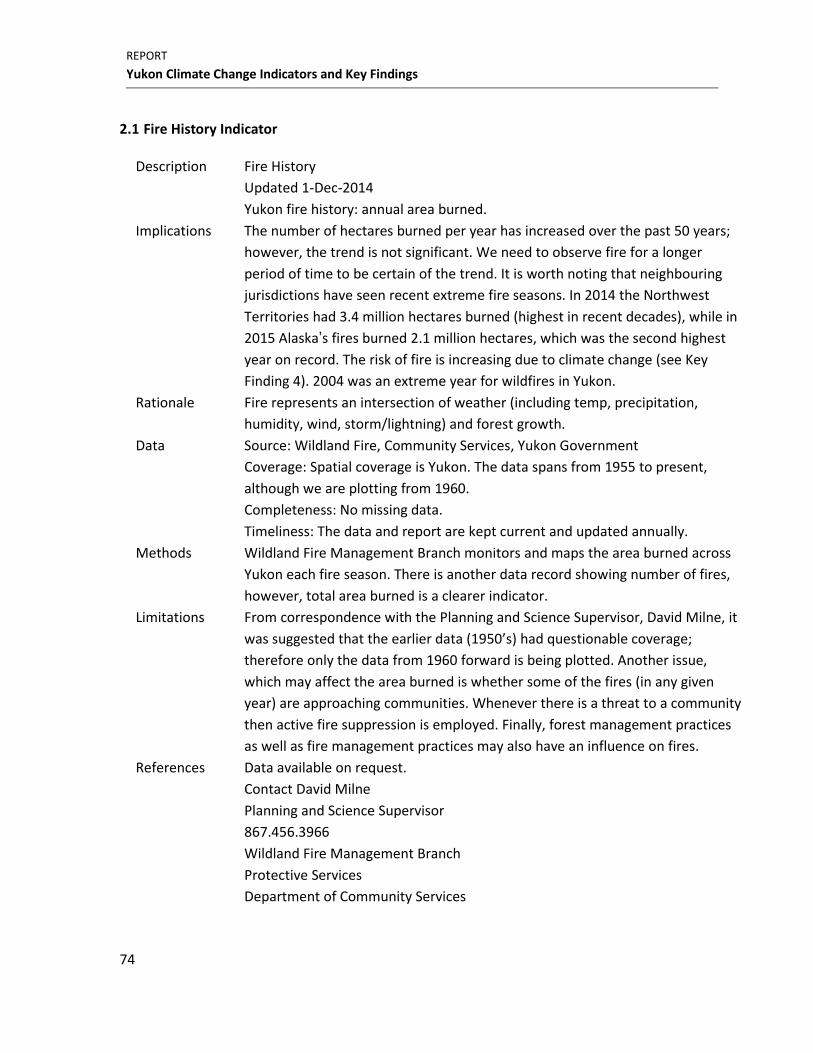
REPORT
Yukon Climate Change Indicators and Key Findings
74
2.1 Fire History Indicator
Description Fire History
Updated 1-Dec-2014
Yukon fire history: annual area burned.
Implications The number of hectares burned per year has increased over the past 50 years;
however, the trend is not significant. We need to observe fire for a longer
period of time to be certain of the trend. It is worth noting that neighbouring
jurisdictions have seen recent extreme fire seasons. In 2014 the Northwest
Territories had 3.4 million hectares burned (highest in recent decades), while in
2015 Alaska’s fires burned 2.1 million hectares, which was the second highest
year on record. The risk of fire is increasing due to climate change (see Key
Finding 4). 2004 was an extreme year for wildfires in Yukon.
Rationale Fire represents an intersection of weather (including temp, precipitation,
humidity, wind, storm/lightning) and forest growth.
Data Source: Wildland Fire, Community Services, Yukon Government
Coverage: Spatial coverage is Yukon. The data spans from 1955 to present,
although we are plotting from 1960.
Completeness: No missing data.
Timeliness: The data and report are kept current and updated annually.
Methods Wildland Fire Management Branch monitors and maps the area burned across
Yukon each fire season. There is another data record showing number of fires,
however, total area burned is a clearer indicator.
Limitations From correspondence with the Planning and Science Supervisor, David Milne, it
was suggested that the earlier data (1950’s) had questionable coverage;
therefore only the data from 1960 forward is being plotted. Another issue,
which may affect the area burned is whether some of the fires (in any given
year) are approaching communities. Whenever there is a threat to a community
then active fire suppression is employed. Finally, forest management practices
as well as fire management practices may also have an influence on fires.
References Data available on request.
Contact David Milne
Planning and Science Supervisor
867.456.3966
Wildland Fire Management Branch
Protective Services
Department of Community Services
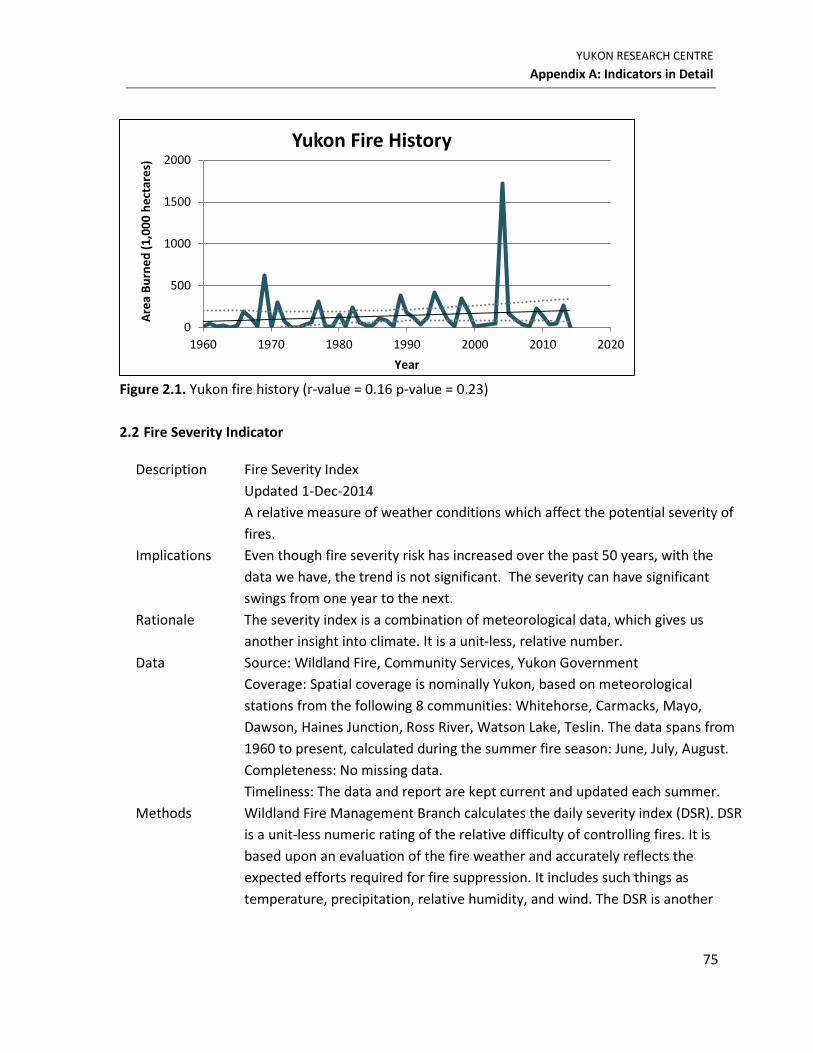
YUKON RESEARCH CENTRE
Appendix A: Indicators in Detail
75
Figure 2.1. Yukon fire history (r-value = 0.16 p-value = 0.23)
2.2 Fire Severity Indicator
Description Fire Severity Index
Updated 1-Dec-2014
A relative measure of weather conditions which affect the potential severity of
fires.
Implications Even though fire severity risk has increased over the past 50 years, with the
data we have, the trend is not significant. The severity can have significant
swings from one year to the next.
Rationale The severity index is a combination of meteorological data, which gives us
another insight into climate. It is a unit-less, relative number.
Data Source: Wildland Fire, Community Services, Yukon Government
Coverage: Spatial coverage is nominally Yukon, based on meteorological
stations from the following 8 communities: Whitehorse, Carmacks, Mayo,
Dawson, Haines Junction, Ross River, Watson Lake, Teslin. The data spans from
1960 to present, calculated during the summer fire season: June, July, August.
Completeness: No missing data.
Timeliness: The data and report are kept current and updated each summer.
Methods Wildland Fire Management Branch calculates the daily severity index (DSR). DSR
is a unit-less numeric rating of the relative difficulty of controlling fires. It is
based upon an evaluation of the fire weather and accurately reflects the
expected efforts required for fire suppression. It includes such things as
temperature, precipitation, relative humidity, and wind. The DSR is another
0
500
1000
1500
2000
1960 1970 1980 1990 2000 2010 2020
Are
a B
urn
ed
(1
,00
0 h
ect
are
s)
Year
Yukon Fire History
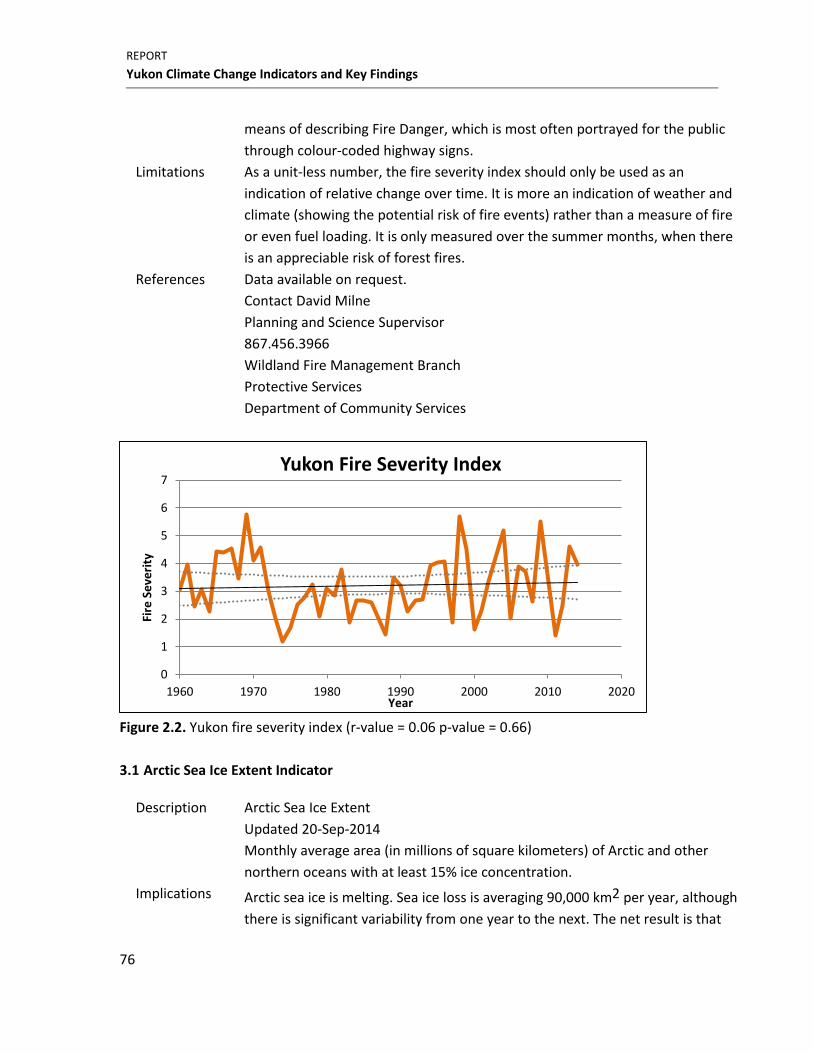
REPORT
Yukon Climate Change Indicators and Key Findings
76
means of describing Fire Danger, which is most often portrayed for the public
through colour-coded highway signs.
Limitations As a unit-less number, the fire severity index should only be used as an
indication of relative change over time. It is more an indication of weather and
climate (showing the potential risk of fire events) rather than a measure of fire
or even fuel loading. It is only measured over the summer months, when there
is an appreciable risk of forest fires.
References Data available on request.
Contact David Milne
Planning and Science Supervisor
867.456.3966
Wildland Fire Management Branch
Protective Services
Department of Community Services
Figure 2.2. Yukon fire severity index (r-value = 0.06 p-value = 0.66)
3.1 Arctic Sea Ice Extent Indicator
Description Arctic Sea Ice Extent
Updated 20-Sep-2014
Monthly average area (in millions of square kilometers) of Arctic and other
northern oceans with at least 15% ice concentration.
Implications Arctic sea ice is melting. Sea ice loss is averaging 90,000 km2 per year, although
there is significant variability from one year to the next. The net result is that
0
1
2
3
4
5
6
7
1960 1970 1980 1990 2000 2010 2020
Fire
Se
veri
ty
Year
Yukon Fire Severity Index
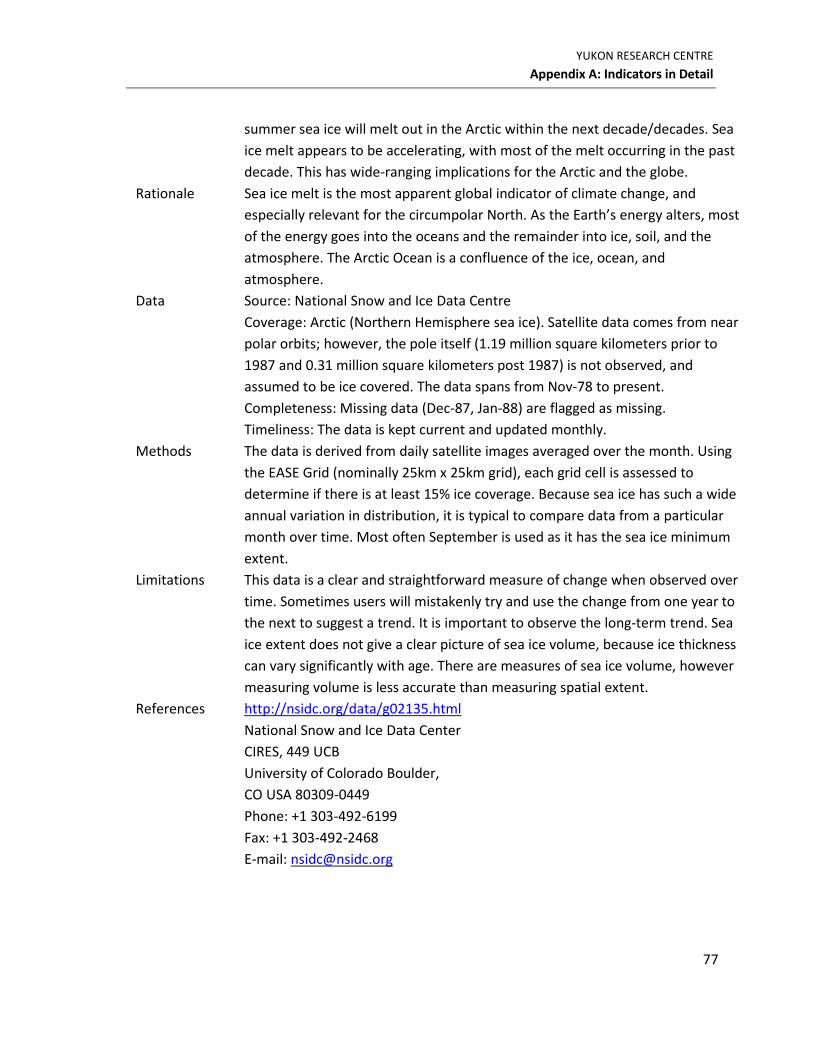
YUKON RESEARCH CENTRE
Appendix A: Indicators in Detail
77
summer sea ice will melt out in the Arctic within the next decade/decades. Sea
ice melt appears to be accelerating, with most of the melt occurring in the past
decade. This has wide-ranging implications for the Arctic and the globe.
Rationale Sea ice melt is the most apparent global indicator of climate change, and
especially relevant for the circumpolar North. As the Earth’s energy alters, most
of the energy goes into the oceans and the remainder into ice, soil, and the
atmosphere. The Arctic Ocean is a confluence of the ice, ocean, and
atmosphere.
Data Source: National Snow and Ice Data Centre
Coverage: Arctic (Northern Hemisphere sea ice). Satellite data comes from near
polar orbits; however, the pole itself (1.19 million square kilometers prior to
1987 and 0.31 million square kilometers post 1987) is not observed, and
assumed to be ice covered. The data spans from Nov-78 to present.
Completeness: Missing data (Dec-87, Jan-88) are flagged as missing.
Timeliness: The data is kept current and updated monthly.
Methods The data is derived from daily satellite images averaged over the month. Using
the EASE Grid (nominally 25km x 25km grid), each grid cell is assessed to
determine if there is at least 15% ice coverage. Because sea ice has such a wide
annual variation in distribution, it is typical to compare data from a particular
month over time. Most often September is used as it has the sea ice minimum
extent.
Limitations This data is a clear and straightforward measure of change when observed over
time. Sometimes users will mistakenly try and use the change from one year to
the next to suggest a trend. It is important to observe the long-term trend. Sea
ice extent does not give a clear picture of sea ice volume, because ice thickness
can vary significantly with age. There are measures of sea ice volume, however
measuring volume is less accurate than measuring spatial extent.
References http://nsidc.org/data/g02135.html
National Snow and Ice Data Center
CIRES, 449 UCB
University of Colorado Boulder,
CO USA 80309-0449
Phone: +1 303-492-6199
Fax: +1 303-492-2468
E-mail: [email protected]
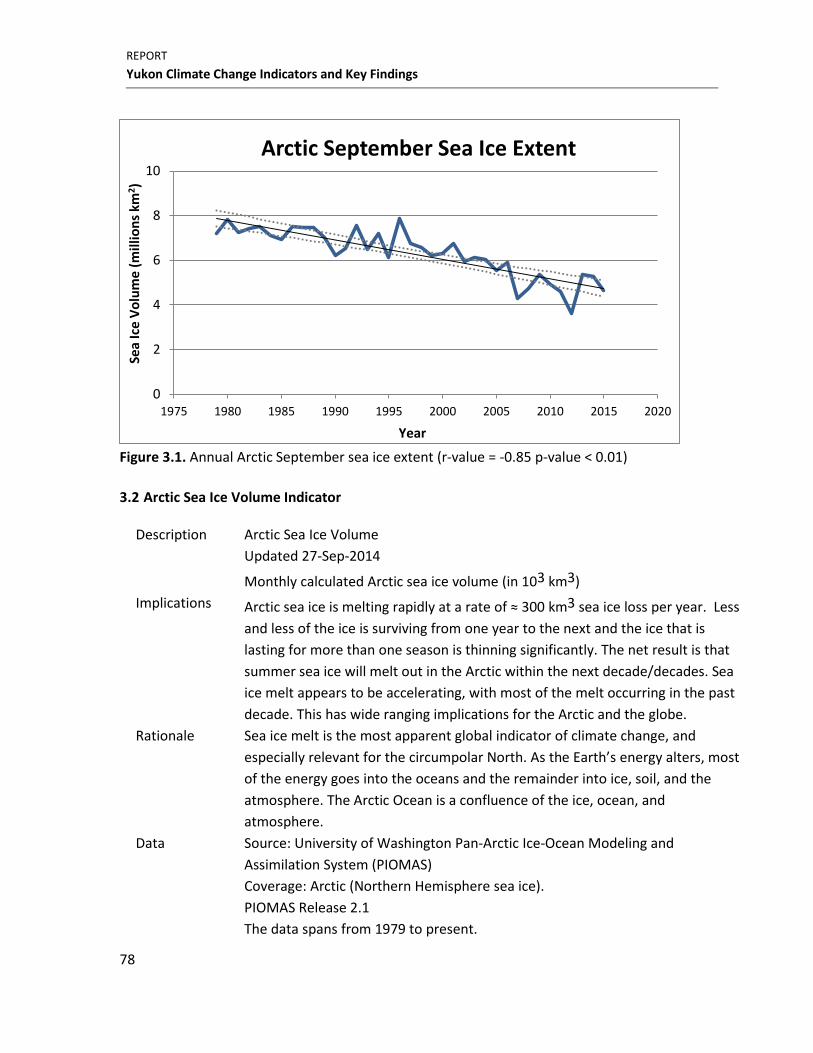
REPORT
Yukon Climate Change Indicators and Key Findings
78
Figure 3.1. Annual Arctic September sea ice extent (r-value = -0.85 p-value < 0.01)
3.2 Arctic Sea Ice Volume Indicator
Description Arctic Sea Ice Volume
Updated 27-Sep-2014
Monthly calculated Arctic sea ice volume (in 103 km3)
Implications Arctic sea ice is melting rapidly at a rate of ≈ 300 km3 sea ice loss per year. Less
and less of the ice is surviving from one year to the next and the ice that is
lasting for more than one season is thinning significantly. The net result is that
summer sea ice will melt out in the Arctic within the next decade/decades. Sea
ice melt appears to be accelerating, with most of the melt occurring in the past
decade. This has wide ranging implications for the Arctic and the globe.
Rationale Sea ice melt is the most apparent global indicator of climate change, and
especially relevant for the circumpolar North. As the Earth’s energy alters, most
of the energy goes into the oceans and the remainder into ice, soil, and the
atmosphere. The Arctic Ocean is a confluence of the ice, ocean, and
atmosphere.
Data Source: University of Washington Pan-Arctic Ice-Ocean Modeling and
Assimilation System (PIOMAS)
Coverage: Arctic (Northern Hemisphere sea ice).
PIOMAS Release 2.1
The data spans from 1979 to present.
0
2
4
6
8
10
1975 1980 1985 1990 1995 2000 2005 2010 2015 2020
Sea
Ice
Vo
lum
e (
mill
ion
s km
2)
Year
Arctic September Sea Ice Extent
YUKON RESEARCH CENTRE
Appendix A: Indicators in Detail
79
Completeness: No missing data.
Timeliness: The data is kept current and outputted monthly.
Methods Based on satellite data combined with a Thickness and Total Energy Distribution
(TED) Sea-Ice Model. The model is complex, and users should note that these
are calculated values rather than direct observations. Because sea ice has such
a wide annual variation in distribution, it is typical to compare data from a
particular month over time. Most often September is used as it has the sea ice
minimum extent.
Limitations This model output gives a strong indication of climate change over time.
Sometimes users will mistakenly try and use the change from one year to the
next to suggest a trend. It is important to observe the longer term trend.
Sea ice volume calculations are inherently less certain than ice extent
observations; however volume provides a clearer indication of sea ice change.
In general terms there is more certainty in recent calculations and less in older
calculations. The reason for this is that there has been more ground truthing
with ice transects in recent years. From a paper published by Schweiger in
August 2011, uncertainty is ±24% in volume and ±36% in the trend.
References http://psc.apl.uw.edu/research/projects/arctic-sea-ice-volume-anomaly/data/
Polar Science Center, Applied Physics Laboratory, University of Washington
1013 NE 40th Street, Box 355640, Seattle, WA 98105-6698
Phone: +1 206-543-6613
Fax: +1 206-616-3142
E-mail: [email protected]
Zhang, J and D. Rothrock, 2001. A thickness and enthalpy distribution sea-ice
model. Journal of Physical Oceanography, vol. 31, p. 2986-3001.
Schweiger, A., R. Lindsay, J. Zhang, M. Steele, H. Stern and R. Kwok, 2011.
Uncertainty in modeled Arctic sea ice volume. Journal of Geophysical Research,
vol. 116(C8), C00D06, doi:10.1029/2011JC007084.
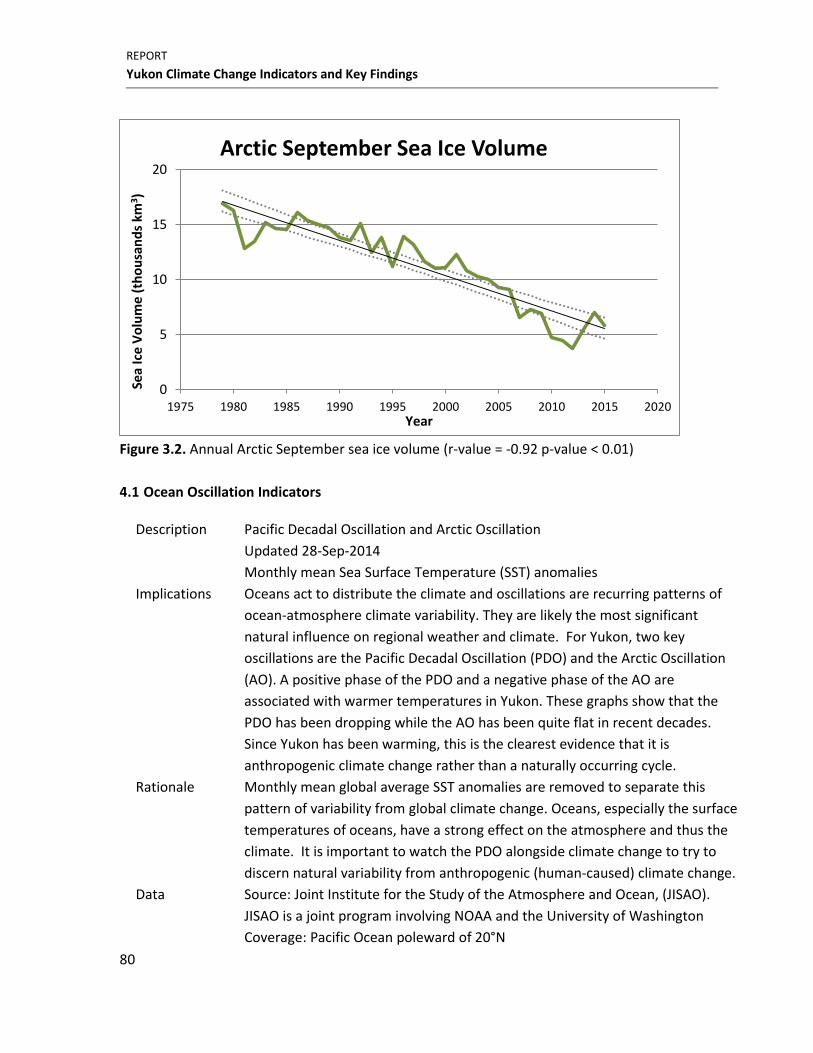
REPORT
Yukon Climate Change Indicators and Key Findings
80
Figure 3.2. Annual Arctic September sea ice volume (r-value = -0.92 p-value < 0.01)
4.1 Ocean Oscillation Indicators
Description Pacific Decadal Oscillation and Arctic Oscillation
Updated 28-Sep-2014
Monthly mean Sea Surface Temperature (SST) anomalies
Implications Oceans act to distribute the climate and oscillations are recurring patterns of
ocean-atmosphere climate variability. They are likely the most significant
natural influence on regional weather and climate. For Yukon, two key
oscillations are the Pacific Decadal Oscillation (PDO) and the Arctic Oscillation
(AO). A positive phase of the PDO and a negative phase of the AO are
associated with warmer temperatures in Yukon. These graphs show that the
PDO has been dropping while the AO has been quite flat in recent decades.
Since Yukon has been warming, this is the clearest evidence that it is
anthropogenic climate change rather than a naturally occurring cycle.
Rationale Monthly mean global average SST anomalies are removed to separate this
pattern of variability from global climate change. Oceans, especially the surface
temperatures of oceans, have a strong effect on the atmosphere and thus the
climate. It is important to watch the PDO alongside climate change to try to
discern natural variability from anthropogenic (human-caused) climate change.
Data Source: Joint Institute for the Study of the Atmosphere and Ocean, (JISAO).
JISAO is a joint program involving NOAA and the University of Washington
Coverage: Pacific Ocean poleward of 20°N
0
5
10
15
20
1975 1980 1985 1990 1995 2000 2005 2010 2015 2020
Sea
Ice
Vo
lum
e (
tho
usa
nd
s km
3)
Year
Arctic September Sea Ice Volume
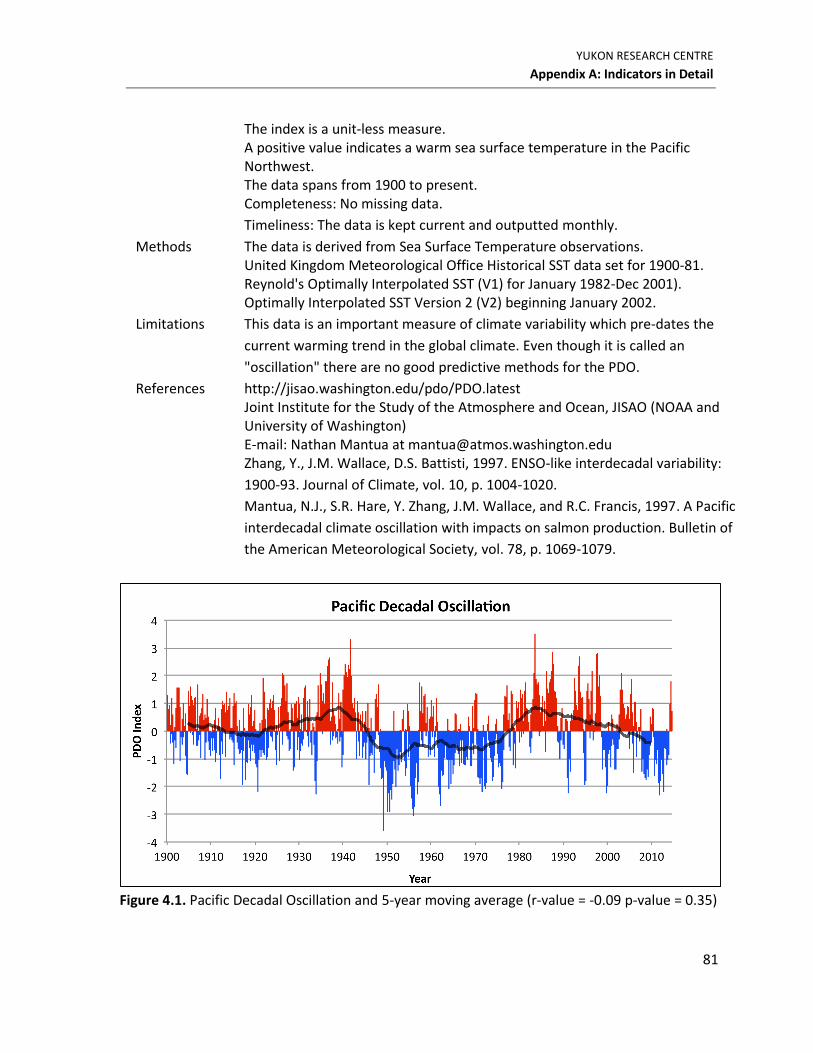
YUKON RESEARCH CENTRE
Appendix A: Indicators in Detail
81
The index is a unit-less measure. A positive value indicates a warm sea surface temperature in the Pacific Northwest. The data spans from 1900 to present. Completeness: No missing data.
Timeliness: The data is kept current and outputted monthly.
Methods The data is derived from Sea Surface Temperature observations. United Kingdom Meteorological Office Historical SST data set for 1900-81. Reynold's Optimally Interpolated SST (V1) for January 1982-Dec 2001). Optimally Interpolated SST Version 2 (V2) beginning January 2002.
Limitations This data is an important measure of climate variability which pre-dates the
current warming trend in the global climate. Even though it is called an
"oscillation" there are no good predictive methods for the PDO.
References http://jisao.washington.edu/pdo/PDO.latest Joint Institute for the Study of the Atmosphere and Ocean, JISAO (NOAA and University of Washington) E-mail: Nathan Mantua at [email protected]
Zhang, Y., J.M. Wallace, D.S. Battisti, 1997. ENSO-like interdecadal variability:
1900-93. Journal of Climate, vol. 10, p. 1004-1020.
Mantua, N.J., S.R. Hare, Y. Zhang, J.M. Wallace, and R.C. Francis, 1997. A Pacific
interdecadal climate oscillation with impacts on salmon production. Bulletin of
the American Meteorological Society, vol. 78, p. 1069-1079.
Figure 4.1. Pacific Decadal Oscillation and 5-year moving average (r-value = -0.09 p-value = 0.35)
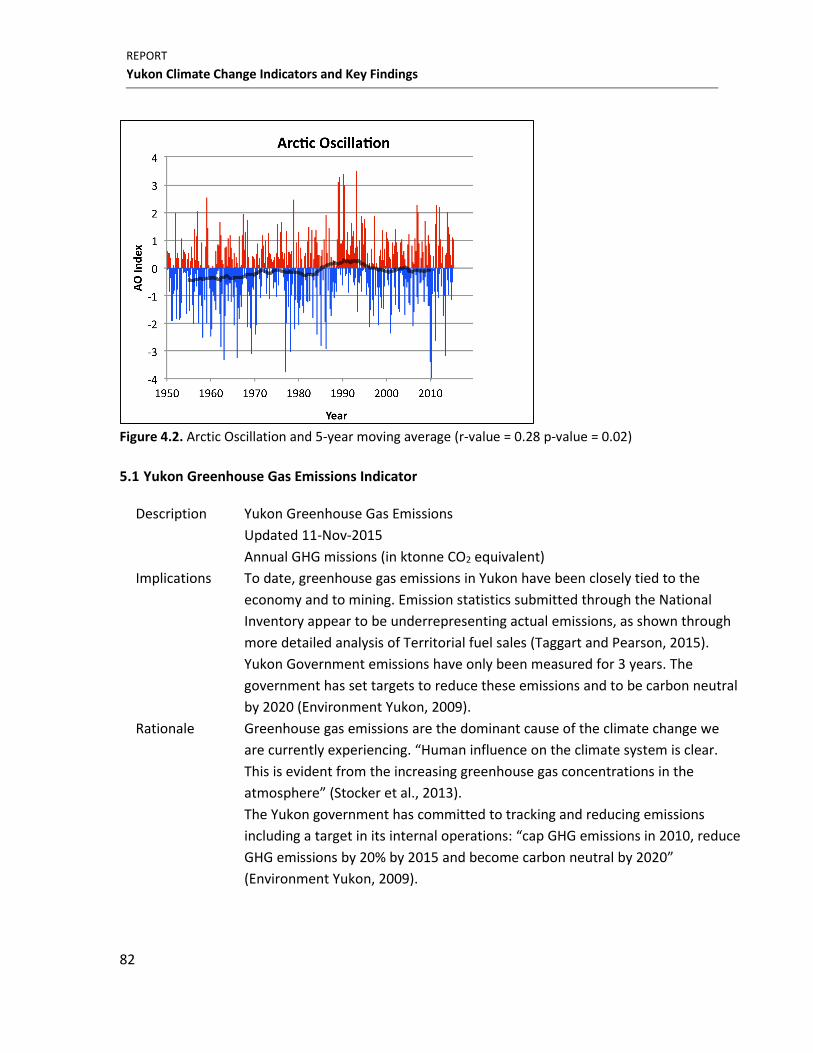
REPORT
Yukon Climate Change Indicators and Key Findings
82
Figure 4.2. Arctic Oscillation and 5-year moving average (r-value = 0.28 p-value = 0.02)
5.1 Yukon Greenhouse Gas Emissions Indicator
Description Yukon Greenhouse Gas Emissions
Updated 11-Nov-2015
Annual GHG missions (in ktonne CO2 equivalent)
Implications To date, greenhouse gas emissions in Yukon have been closely tied to the
economy and to mining. Emission statistics submitted through the National
Inventory appear to be underrepresenting actual emissions, as shown through
more detailed analysis of Territorial fuel sales (Taggart and Pearson, 2015).
Yukon Government emissions have only been measured for 3 years. The
government has set targets to reduce these emissions and to be carbon neutral
by 2020 (Environment Yukon, 2009).
Rationale Greenhouse gas emissions are the dominant cause of the climate change we
are currently experiencing. “Human influence on the climate system is clear.
This is evident from the increasing greenhouse gas concentrations in the
atmosphere” (Stocker et al., 2013).
The Yukon government has committed to tracking and reducing emissions
including a target in its internal operations: “cap GHG emissions in 2010, reduce
GHG emissions by 20% by 2015 and become carbon neutral by 2020”
(Environment Yukon, 2009).
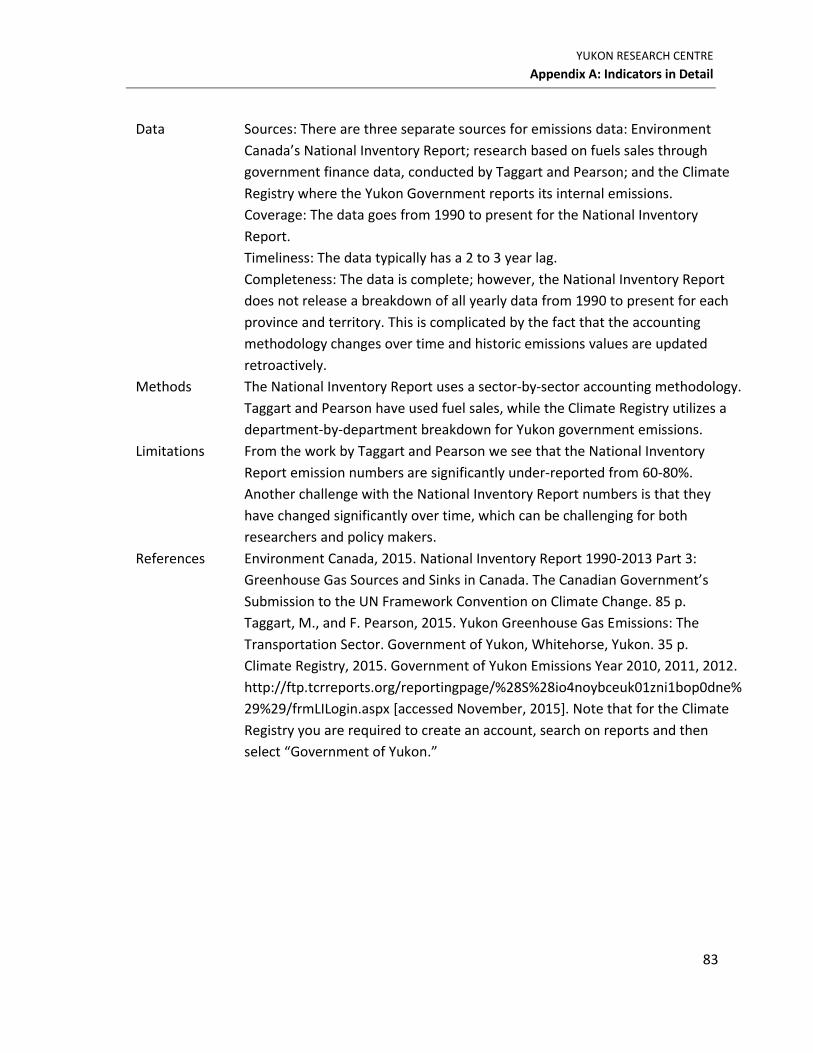
YUKON RESEARCH CENTRE
Appendix A: Indicators in Detail
83
Data Sources: There are three separate sources for emissions data: Environment
Canada’s National Inventory Report; research based on fuels sales through
government finance data, conducted by Taggart and Pearson; and the Climate
Registry where the Yukon Government reports its internal emissions.
Coverage: The data goes from 1990 to present for the National Inventory
Report.
Timeliness: The data typically has a 2 to 3 year lag.
Completeness: The data is complete; however, the National Inventory Report
does not release a breakdown of all yearly data from 1990 to present for each
province and territory. This is complicated by the fact that the accounting
methodology changes over time and historic emissions values are updated
retroactively.
Methods The National Inventory Report uses a sector-by-sector accounting methodology.
Taggart and Pearson have used fuel sales, while the Climate Registry utilizes a
department-by-department breakdown for Yukon government emissions.
Limitations From the work by Taggart and Pearson we see that the National Inventory
Report emission numbers are significantly under-reported from 60-80%.
Another challenge with the National Inventory Report numbers is that they
have changed significantly over time, which can be challenging for both
researchers and policy makers.
References Environment Canada, 2015. National Inventory Report 1990-2013 Part 3:
Greenhouse Gas Sources and Sinks in Canada. The Canadian Government’s
Submission to the UN Framework Convention on Climate Change. 85 p.
Taggart, M., and F. Pearson, 2015. Yukon Greenhouse Gas Emissions: The
Transportation Sector. Government of Yukon, Whitehorse, Yukon. 35 p.
Climate Registry, 2015. Government of Yukon Emissions Year 2010, 2011, 2012.
http://ftp.tcrreports.org/reportingpage/%28S%28io4noybceuk01zni1bop0dne%
29%29/frmLILogin.aspx [accessed November, 2015]. Note that for the Climate
Registry you are required to create an account, search on reports and then
select “Government of Yukon.”
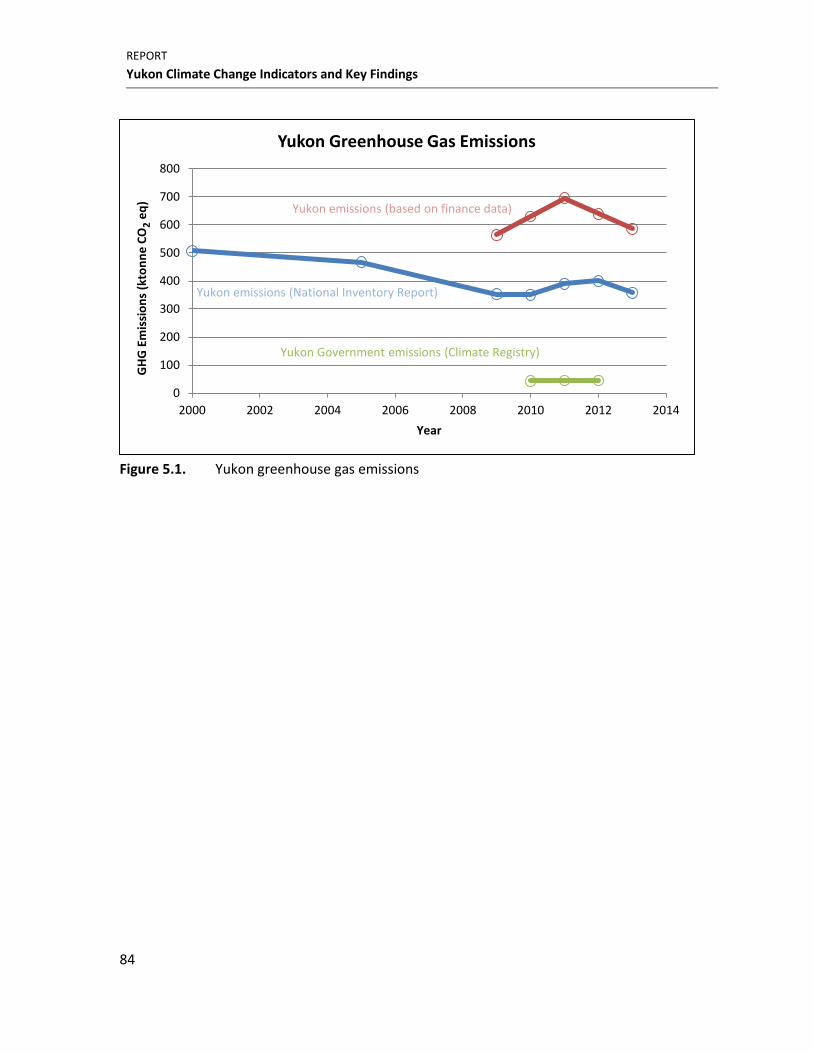
REPORT
Yukon Climate Change Indicators and Key Findings
84
Figure 5.1. Yukon greenhouse gas emissions
0
100
200
300
400
500
600
700
800
2000 2002 2004 2006 2008 2010 2012 2014
GH
G E
mis
sio
ns
(kto
nn
e C
O2
eq
)
Year
Yukon Greenhouse Gas Emissions
Yukon Government emissions (Climate Registry)
Yukon emissions (National Inventory Report)
Yukon emissions (based on finance data)