socioeconomic indicators for fisheries: a case study of the yukon
TRANSCRIPT
Socioeconomic Indicators for Fisheries: A Case Study of the Yukon River
Salmon Fishery
by
Sarah A. Kruse 61193 Tall Timber Court
Bend, OR 97702, USA [email protected]
(Corresponding author)
May 2012
www.e3network.org
Socioeconomic Indicators for Fisheries: A Case Study of the Yukon River Salmon Fishery
1
Abstract Sustainable fisheries, by definition, should include environmental, economic and social considerations, yet the use of economic and social indicators to date has been limited, both from a management and consumer perspective. While a number of studies to date have focused on the development of these types of indicators, fewer have tested their application. This study seeks to describe broadly relevant social and economic indicators, specifically focused on human communities associated with fisheries resources. It also seeks to assess whether the indicators proposed can readily be populated using existing, publically available, data sources. To that end, we conduct a case study analysis of the Yukon River commercial salmon fishery. Our findings suggest that the majority of the indicators proposed can be populated with existing data, often already collected on an annual basis. Recognizing the case study nature of this paper, we also assess the availability of relevant data for commercial salmonoid fisheries in other regions. Moving from individual indicators to the idea of how these indicators could be used to create a method for assessing the sustainability of a fishery more broadly (so as to include economic and social considerations), we suggest a two part assessment, including both required and voluntary standards associated with various socioeconomic indicators. From a management perspective, integration and tracking of such indicators along with environmental/biological ones will likely improve ecosystem-based management in which humans are also a key factor.
Socioeconomic Indicators for Fisheries: A Case Study of the Yukon River Salmon Fishery
2
The Food and Agriculture Organization (FAO) Technical Guidelines for Responsible Fisheries (1999) recognize the need for and promote the use of sustainable development indicators for marine capture fisheries across four dimensions: ecological, economic, governance and social. The guidelines suggest that indicators should “provide a practicable and cost-effective means of a) tracking progress toward sustainable development, b) predicting or warning about potential problems in the future, c) learning by comparing performance between fisheries, and d) informing policies aimed at advancing progress or avoiding problems.” From a management perspective, there is also growing consensus around the idea of ecosystem based management for fisheries, with a focus on sustaining healthy fish stocks and the fisheries they support. Due in large part to scientific research, fisheries management tools, and frameworks like the Marine Stewardship Council (MSC) certification process, environmental sustainability indicators for fisheries, such as biological analyses/stock assessments, are reasonably well established (at least for commercial fisheries) and their use in many regions of the world has become commonplace (e.g., Federal Register 2009, FAO 2008). Without indicators to measure and assess the human communities that depend them; however, it is difficult to manage these fisheries from an ecosystem perspective. In addition to the FAO guidelines, a number of other recent studies have focused on the development of socioeconomic indicators for fisheries (e.g., Bozon 2000, Garcia et al. 2000; Sabatella and Franquesa 2004; Rice and Rochet 2005; Accadia and Spagnolo 2006; Boyd and Charles 2006; Unal 2006); however, many of them, like the FAO guidelines, focus primarily on the development and relevancy of the indicators and less on their application (i.e., how to populate the indicators using real-world data). Those studies that do attempt to apply the indicators tend to focus more on the fishery itself (e.g., effort, productivity and profitability) and less on fishery-dependent human populations. Commercial fisheries globally vary significantly both in size and scope, as do the human populations who depend on them (FAO 2008). Any indicators developed to assess community level sustainability would ideally be sufficiently flexible so as to deal with this variation and still provide for inter-regional/fishery comparison through the use of common metrics. As Garcia (1996) noted, sustainability indicators are meant to serve as measurements of progress over time; regular assessment of the indicators can reveal current conditions of the fishery as well as trends over time. The application of socioeconomic indicators to date has been limited, making it difficult to assess whether data currently collected by fisheries managers and industry would be sufficient to assess the socioeconomic sustainability of fisheries. Given the number of published studies on relevant criteria and indicators for fisheries (FAO 1999; Pelletier and Tyedmers 2008; etc.), the intent of this study is not to outline methods for economic and social indicator development, suggest new indicators or propose definitive standards for existing indicators. Rather, the intent is to apply socioeconomic indicators to a case study commercial fishery, the Yukon River Pacific salmon Oncorhynchus spp.fishery fishery, in an effort to understand better the viability of populating tracking these indicators using existing and the opportunities/constraints to filling data gaps.
Socioeconomic Indicators for Fisheries: A Case Study of the Yukon River Salmon Fishery
3
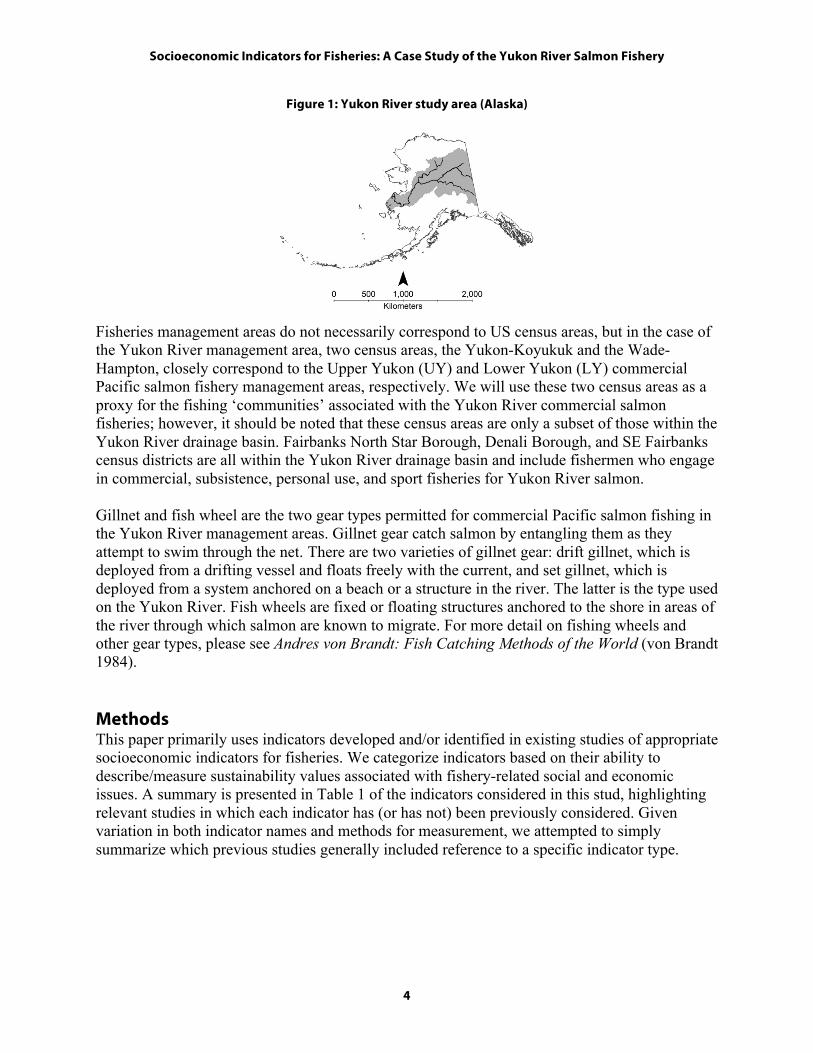
This paper was produced in the context of a broader assessment of the life cycle impacts of salmon production systems. Life Cycle Assessment (LCA) is the only internationally standardized environmental assessment method (ISO 2006a, 2006b) that provides for a cradle-to-grave assessment of a product or process. To date, LCA has focused primarily on environmental and human health impacts related to the biophysical flows associated with the provision of a process or product, but there have been increasing efforts to integrate economic and social considerations into the methodology (Dreyer et al. 2006; Kruse et al. 2009). To date, there have been only limited applications of socioeconomic indicators in an LCA context; however, we believe there is potential to use this type of thinking as one way to support a consistent approach to consideration of social, economic, and environmental impacts related to fisheries and fisheries management. We additionally decided to conduct this “case study” to explore possible socioeconomic indicators that are both relevant at a fishery/community level and are compatible with life cycle thinking. We pursued this because we believe the results will be of interest to decision makers, fisheries managers, and LCA researchers, given that fisheries are the primary point of production for seafood life cycles. The data described in subsequent sections of this paper flow from our larger project—providing a unique opportunity to explore the extent to which they are relevant and applicable. The overarching objectives of this case study are two-fold: 1) to determine the degree to which existing data can be used to populate socioeconomic indicators for fisheries; and 2) provide a first-cut description of how these indicators might be used to assess the socioeconomic sustainability of a fishery. Study site Our case study focuses on the commercial Pacific salmon fishery on the Alaska portion of the Yukon River, a 3,700-kilometer (km) river located in northwestern Canada and central Alaska (see Figure 1). Chinook Oncorhynchus tshawytscha, chum Oncorhynchus keta, and coho Oncorhynchus kisutch salmon are the three species targeted by the Yukon River commercial fishery, and these species are also targeted by subsistence and personal use fisheries. Commercial fishing is allowed along the entire 1,970 km of the Yukon River in Alaska as well as along the lower 362 km of the Tanana River, a tributary of the Yukon. Aboriginal, commercial, domestic and sport salmon fisheries also occur on the Canadian portion of the Yukon River upstream of the Alaskan fisheries and are highly dependent on Alaskan fishery management decisions because these species are anadromous.
Socioeconomic Indicators for Fisheries: A Case Study of the Yukon River Salmon Fishery
4
Figure 1: Yukon River study area (Alaska)
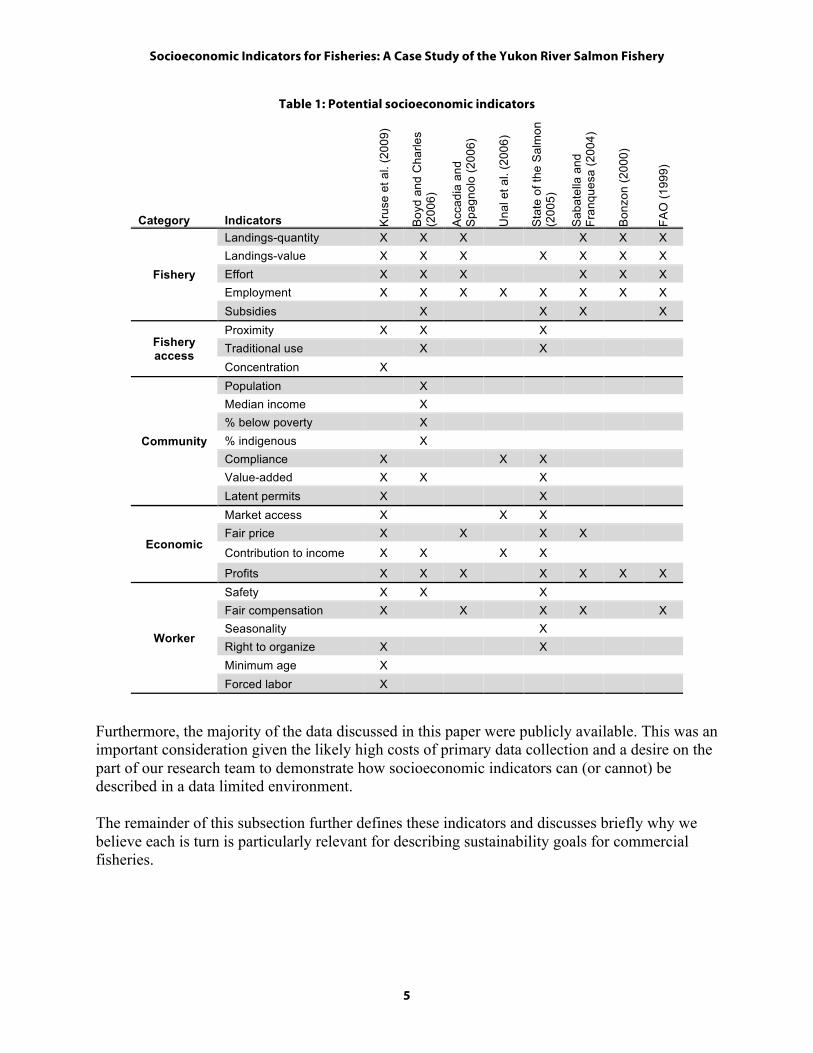
Fisheries management areas do not necessarily correspond to US census areas, but in the case of the Yukon River management area, two census areas, the Yukon-Koyukuk and the Wade-Hampton, closely correspond to the Upper Yukon (UY) and Lower Yukon (LY) commercial Pacific salmon fishery management areas, respectively. We will use these two census areas as a proxy for the fishing ‘communities’ associated with the Yukon River commercial salmon fisheries; however, it should be noted that these census areas are only a subset of those within the Yukon River drainage basin. Fairbanks North Star Borough, Denali Borough, and SE Fairbanks census districts are all within the Yukon River drainage basin and include fishermen who engage in commercial, subsistence, personal use, and sport fisheries for Yukon River salmon. Gillnet and fish wheel are the two gear types permitted for commercial Pacific salmon fishing in the Yukon River management areas. Gillnet gear catch salmon by entangling them as they attempt to swim through the net. There are two varieties of gillnet gear: drift gillnet, which is deployed from a drifting vessel and floats freely with the current, and set gillnet, which is deployed from a system anchored on a beach or a structure in the river. The latter is the type used on the Yukon River. Fish wheels are fixed or floating structures anchored to the shore in areas of the river through which salmon are known to migrate. For more detail on fishing wheels and other gear types, please see Andres von Brandt: Fish Catching Methods of the World (von Brandt 1984). Methods This paper primarily uses indicators developed and/or identified in existing studies of appropriate socioeconomic indicators for fisheries. We categorize indicators based on their ability to describe/measure sustainability values associated with fishery-related social and economic issues. A summary is presented in Table 1 of the indicators considered in this stud, highlighting relevant studies in which each indicator has (or has not) been previously considered. Given variation in both indicator names and methods for measurement, we attempted to simply summarize which previous studies generally included reference to a specific indicator type.
Socioeconomic Indicators for Fisheries: A Case Study of the Yukon River Salmon Fishery
5
Table 1: Potential socioeconomic indicators
Category Indicators Kru
se e
t al.
(200
9)
Boy
d an
d C
harle
s (2
006)
Acc
adia
and
S
pagn
olo
(200
6)
Una
l et a
l. (2
006)
Sta
te o
f the
Sal
mon
(2
005)
Sab
atel
la a
nd
Fran
ques
a (2
004)
Bon
zon
(200
0)
FAO
(199
9)
Fishery
Landings-quantity X X X X X X Landings-value X X X X X X X Effort X X X X X X Employment X X X X X X X X Subsidies X X X X
Fishery access
Proximity X X X Traditional use X X Concentration X
Community
Population X Median income X % below poverty X % indigenous X Compliance X X X Value-added X X X Latent permits X X
Economic
Market access X X X Fair price X X X X Contribution to income X X X X Profits X X X X X X X
Worker
Safety X X X Fair compensation X X X X X Seasonality X Right to organize X X Minimum age X Forced labor X
Furthermore, the majority of the data discussed in this paper were publicly available. This was an important consideration given the likely high costs of primary data collection and a desire on the part of our research team to demonstrate how socioeconomic indicators can (or cannot) be described in a data limited environment. The remainder of this subsection further defines these indicators and discusses briefly why we believe each is turn is particularly relevant for describing sustainability goals for commercial fisheries.
Socioeconomic Indicators for Fisheries: A Case Study of the Yukon River Salmon Fishery
6
Fishery Indicators The first set of indicators relate specifically to the fishery. While not specifically socioeconomic in nature, these indicators provide context for subsequent indicator categories (i.e., indicators can be assessed relative to fishery performance). The landings (quantity) indicator simply measures the quantity landed annually in the fishery—while the focus here is on commercial fisheries, this value could also include recreational, personal use and/or subsistence harvests in the appropriate context. Similarly, the landings (value) indicator measures the annual monetary value of commercial harvests. The effort indicator describes average production per unit of effort in terms of landings (typically quantity). Effort has the potential to be defined in multiple ways—landings relative to the number of employees, number of trips, number of days, number of vessels, or as Accadia and Spagnolo (2006) define it—gross tonnage multiplied by days divided by the number of vessels. As Garcia (2006) notes, “Total catches, for instance, while generally available, give little clue as to whether the fishery is sustainable or not in the absence of complementary data on fishing effort…” In addition, tracking production per unit effort may serve as a proxy for changes in stock sustainability and/or the efficiency of management practices, which both indirectly point to environmental and socioeconomic sustainability (e.g., Hospido and Tyedmers 2005). The employment indicator focuses on describing the number of jobs within a fishery—whether this is more effectively measured as full-time equivalents (FTEs) or number of jobs per month throughout the year will likely be fishery specific; however, the use of FTEs would allow for easy cross-fishery comparison and calculation of quantity landed, value landed or effort per FTE. A subsidy indicator is included to describe financial payments or other types of compensation received by the commercial fishing industry from public entities. What can be categorized as a subsidy; however, is not always clearly defined. A recent report (Sumaila and Pauly 2006) describes at least 12 different types of fisheries subsidies ranging from tax exemption programs to port construction programs to rural community development programs. Furthermore, as the Organisation for Economic Co-operation and Development (OECD) notes, the effect of a particular subsidy is likely dependent on both the current management practices and the status of the fishery itself (OECD 2006). That said, numerous studies in recent years have documented the relationship between subsidies and overexploitation (e.g., FFITF 1999; UNEP 2004) and overcapacity of fleets (e.g., USCOP 2004; Sumaila et al. 2008). Access Indicators The ‘access’ category focuses on fishery access rights for individuals and small-scale fishing communities who live close to and/or historically have depended on a given fishery. Pauly (2006) argues that the increasing marginalization of small-scale fisheries is one result of a trend of “increased competition between small-scale and large-scale fisheries.” At the same time, he notes that many small-scale fisheries “meet most of the criteria required for an enlightened fisheries policy.” Matthew (2005) goes so far as to say that small-scale fisheries “should be proposed as the ideal fishing model…within a sustainable and responsible fisheries framework” (i.e., they have both socioeconomic and local environmental advantages from a sustainability perspective). This is not to say that small-scale fisheries are always the most sustainable (e.g.,
Socioeconomic Indicators for Fisheries: A Case Study of the Yukon River Salmon Fishery
7
seine fisheries are large-scale, yet still considered more environmentally efficient than some other gear types due to their advantages of fuel usage and gear type) (Thrane 2004). Furthermore, it should be noted, that issues with sufficient capacity for both management and enforcement often exist in small-scale fisheries. Berke et al. (2010) note that, “Small-scale fisheries with large numbers of fishers widely dispersed in inaccessible places are particularly resistant to top-down enforcement,” so access indicators should be considered in the appropriate context. Three indicators can potentially describe access (either individually or in combination). The first indicator relates to proximity, that is, how close a fisher’s residence is relative to the fishery in which he/she owns a permit. Given that in the USA, permit ownership for many fisheries is considered public knowledge, this indicator could likely be measured using a simple geographic information system (GIS) analysis to assess distance between the residence and fishing grounds of each permit holder. The second indicator relates to traditional use and access of tribes and/or indigenous communities to a given fishery for subsistence, ceremonial and/or traditional use. One way to measure such an indicator might be through a qualitative evaluation of the institutions that exist to support traditional use access. The third potential indicator of access relates to the level of concentration in a fishery. As suggested by Boyd and Charles (2006) and others, one way of measuring concentration is to compare total annual landings and the number of active licenses each year over time. Community Indicators The goal of community indicators is to describe villages or towns located in close proximity to specific fishing grounds. These indicators may not always be as relevant for ocean-based fisheries (e.g., Alaskan pollock Theragra chalcogramma) as for nearshore or shore-based fisheries (e.g., salmon) where villages or towns (and their economics and demographics) are more closely linked to specific fisheries. The purpose is not only to make comparisons across fisheries (or communities), but also employ indicators that provide useful information through comparison of the indicator to itself over time. This is the case with many of the community indicators, including the following: the population of the community, the mean or median age of community residents the median household income of community residents, the percentage of community residents whose household income is below the national poverty level and the percentage of community residents who are Native American, Alaska Native or have other indigenous membership. “Community compliance” assesses the degree to which fishers follow existing regulations for the fishery in which they participate. Assuming that the goal of fisheries managers is sustainable fisheries, compliance is important because it allows mangers to make decisions and policy with minimal uncertainty as to how fishers will behave. It also prevents misuse of fisheries resources by providing an incentive for all individuals to follow the rules (knowing that others do as well). That being said, this indicator does require uniformity of enforcement efforts across fisheries—in which case, if possible, a more reasonable measure of this indicator might compare annual enforcement effort (in terms of money expended or person days of effort) relative to the annual number of violations.
Socioeconomic Indicators for Fisheries: A Case Study of the Yukon River Salmon Fishery
8
Another possible community indicator is ‘value-added in the community’. One measure, and perhaps the most straightforward, is simply the number of processing plants or fish processing jobs in the region. If possible, the latter would both a) differentiate between employment of local and non-local residents; and b) consider seasonality (if applicable) of the jobs. A second measure could be the total quantity of fish (e.g., metric tonnes) processed in the community or region annually. This measure may be more appropriate for communities in which small-scale personal use or subsistence processing occurs. Finally, the economic value of the fishery to a particular community could be calculated using an input-output model or some other method with the capacity to account for the multiplier effect, a common economic term for the idea that an increase in spending produces an overall contribution to the economy that is greater than the initial amount spent. This last measure requires substantially more data, however, as well as a complex series of calculations, and may be difficult to achieve in small communities and/or developing countries where input-output multipliers are not readily available at the necessary scale. The last community indicator relates to latent quota/permits and focuses on the non-use rate of permits or quota for a particular fishery. While latency easily can be calculated as the percentage of total permits issued in a given year not actively being fished, it is important to assess whether other exogenous variables are affecting fishers’ choices. For example, while in some cases an increasing trend for this indicator might be viewed as positive (e.g., individuals are employed in other areas of work and are sufficiently well off so as not to need to fish), it may also indicate problems within the fishery (e.g., the fishery cannot adequately support the number of fishers with permits). Given this possible dual interpretation, this indicator may best be considered in conjunction with additional information, such as the transferability of permits, the health of the fishery, additional job opportunities within the community, and/or ex-vessel values. Economic Indicators From an economic perspective, access to a fishery, particularly a commercial fishery, is more valuable when coupled with access to subsequent steps in the value chain (e.g., processors or markets). In other words, a sustainable commercial fishery does not necessarily guarantee socioeconomic sustainability. An indicator of “market access” can be used to assess what options fishers have to sell their harvests. There are multiple ways this indicator could be measured including: the number of buyers; the number of local buyers; the percentage of total annual harvests sold to local buyers; or the ratio local purchasing capacity to total annual harvests. This final measure would allow for differentiation between lack of market access because of lack of local buyers versus some other access issue, such as greater demand or ex-vessel prices paid from processors outside the region. The fair price indicator measures whether a fishery (or fishing region) receives per unit prices that are similar to the prices received in similar fisheries. This indicator could be measured as the average price per kilogram of a particular fishery received dockside or as the ratio of one fishery’s payments relative to another’s. When considering this indicator; however, it is necessary to consider whether differences in price are a result of market power (monopsony) or
Socioeconomic Indicators for Fisheries: A Case Study of the Yukon River Salmon Fishery
9
differences in the fishery/processing operations (e.g., operating costs, quality of fish harvested, etc.) The contribution to personal income indicator describes the percentage of personal (or household) income received by a fisher from a specific fishery. From a sustainability perspective, this indicator is important in that it tracks the value of the fishery to individual fishers. If there are changes over time, the combination of this indicator with other indicators, such as fair price and landings, may provide an indication of whether the change is supply or demand driven. A universal standard for this indicator may not be realistic (e.g., the fishery must contribute at least a set percentage, on average, to those participating) for a variety of reasons including, among others: variation in the length of fishing seasons, historical contribution to income and biological sustainability of different fisheries, among others. The creation of a standard specific to each fishery that is based on current and historic data (where available), against which the indicator can be compared moving forward, may be more appropriate. Another suggested market indicator is profits, which could be measured as the average gross earnings in the fishery minus average costs. Again, a universal standard for this indicator may not be appropriate, but tracking of this indicator across time for a specific fishery could help to assess whether profits are changing and if so, whether the change is being caused by changes in costs, ex-vessel prices, fishery stocks or something else. Worker Indicators Indicators related to workers are one category where steps already have been taken to translate broadly recognized societal values into benchmark standards (e.g., United Nations Global Compact, International Labour Organization); however, at present, for some of the indicators, the ‘standard’ is not related to an established metric or measurement method and there are not always existing data to calculate the indicators. One indicator often considered is worker safety (typically measured as accidents/deaths), which has been applied to seafood production systems by Ellingsen (2004) and by Thrane (2004). This indicator can be measured in at least three ways including: as the number of job-related accidents/deaths that occur per year in the fishery; as the number of job-related accidents/deaths per unit output (i.e., per metric tonne of salmon landed); or as the number of job-related accidents/deaths per unit income/profit. The latter two options allow for greater comparability across fisheries and regions by normalizing the unit of measurement to account for differences in harvest levels or in incomes/profits earned. Another potential worker indicator relates to payment of fair compensation. More specifically, this indicator could assess whether fishers receive sufficient compensation to live an adequate life given the cost of living in their region/country. This indicator could be measured quantitatively as the average wage received; however, given the frequent differences between vessel owners (i.e., skippers) and hired crew wages, it may be useful to differentiate wages for categories of workers. One baseline standard for this indicator could be an average wage higher than the living wage, which is generally defined as a wage adequate for a worker to survive (meeting basic needs) in the country or region in which he/she lives.
Socioeconomic Indicators for Fisheries: A Case Study of the Yukon River Salmon Fishery
10
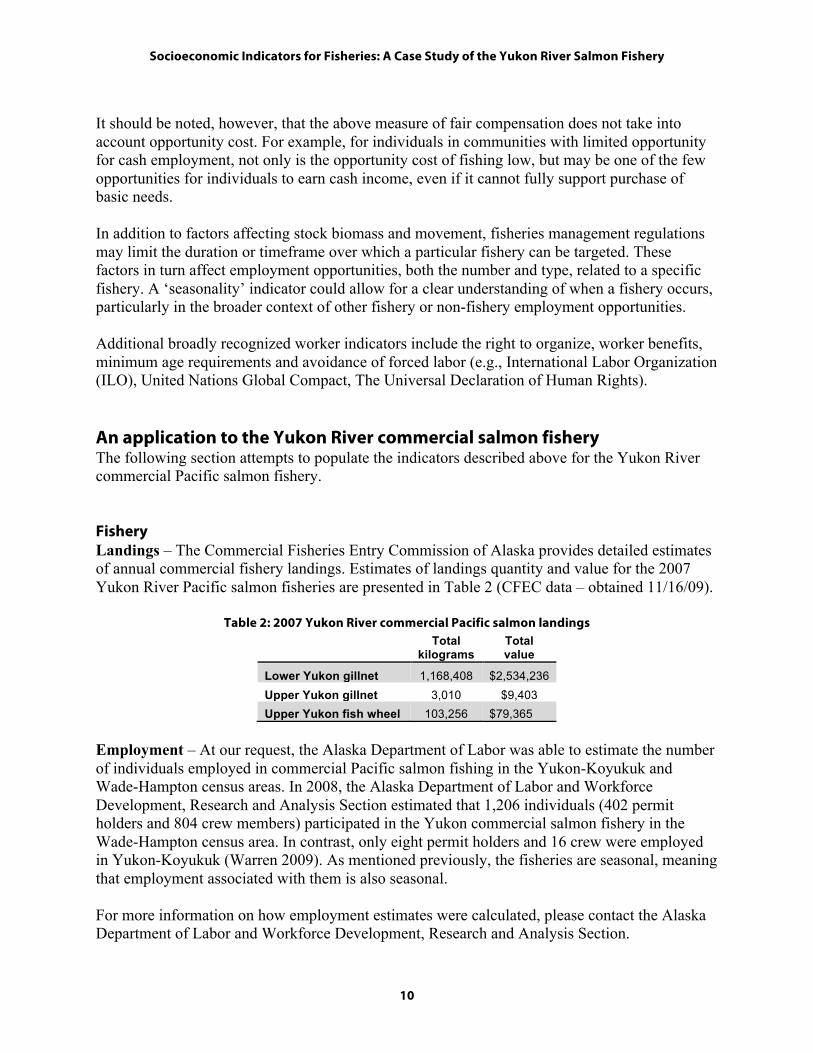
It should be noted, however, that the above measure of fair compensation does not take into account opportunity cost. For example, for individuals in communities with limited opportunity for cash employment, not only is the opportunity cost of fishing low, but may be one of the few opportunities for individuals to earn cash income, even if it cannot fully support purchase of basic needs. In addition to factors affecting stock biomass and movement, fisheries management regulations may limit the duration or timeframe over which a particular fishery can be targeted. These factors in turn affect employment opportunities, both the number and type, related to a specific fishery. A ‘seasonality’ indicator could allow for a clear understanding of when a fishery occurs, particularly in the broader context of other fishery or non-fishery employment opportunities. Additional broadly recognized worker indicators include the right to organize, worker benefits, minimum age requirements and avoidance of forced labor (e.g., International Labor Organization (ILO), United Nations Global Compact, The Universal Declaration of Human Rights). An application to the Yukon River commercial salmon fishery The following section attempts to populate the indicators described above for the Yukon River commercial Pacific salmon fishery. Fishery Landings – The Commercial Fisheries Entry Commission of Alaska provides detailed estimates of annual commercial fishery landings. Estimates of landings quantity and value for the 2007 Yukon River Pacific salmon fisheries are presented in Table 2 (CFEC data – obtained 11/16/09).
Table 2: 2007 Yukon River commercial Pacific salmon landings
Total
kilograms Total value
Lower Yukon gillnet 1,168,408 $2,534,236 Upper Yukon gillnet 3,010 $9,403 Upper Yukon fish wheel 103,256 $79,365
Employment – At our request, the Alaska Department of Labor was able to estimate the number of individuals employed in commercial Pacific salmon fishing in the Yukon-Koyukuk and Wade-Hampton census areas. In 2008, the Alaska Department of Labor and Workforce Development, Research and Analysis Section estimated that 1,206 individuals (402 permit holders and 804 crew members) participated in the Yukon commercial salmon fishery in the Wade-Hampton census area. In contrast, only eight permit holders and 16 crew were employed in Yukon-Koyukuk (Warren 2009). As mentioned previously, the fisheries are seasonal, meaning that employment associated with them is also seasonal. For more information on how employment estimates were calculated, please contact the Alaska Department of Labor and Workforce Development, Research and Analysis Section.
Socioeconomic Indicators for Fisheries: A Case Study of the Yukon River Salmon Fishery
11
Effort –While Alaska does not appear to publically report hours or days of effort, it does keep annual records on the number of permit holders who deliver fish for a given fishery, season and sub-district. Data are collected for the summer season and the fall season and are reported back to at least 1971. For 2007, a total of 901 permit holders (864 in the Lower Yukon and 27 in the Upper Yukon) delivered Pacific salmon across these two seasons. The ten year average (1998–2007), in contrast, is 768 (736 in the Lower Yukon and 32 in the Upper Yukon), suggesting increasing effort over the last few years. That being said, the Alaska Department of Fish and Game reports in the 2008 Yukon River Fall Season Summary (ADFG 2009) that “even though effort appears high, participation is concentrated around a few buying stations rather than spread throughout the drainage as it was prior to 1997.” Subsidies – According to Sharp and Sumaila (2009), approximately 28% of the US$6.4 billion (US 2007$) in subsidies (excluding management costs) provided by state and federal governments to the U.S. fishing industry from 1996 to 2004 can be associated with a specific geographic region (the remaining 72% consisted of federal fuel and research subsidies.) Out of the seven regions Sharp and Sumaila identify, the western Pacific region (28%) and Alaska (23%) received the largest share of subsidies (2009). That said, we were not able to parse out whether any of these subsidies are directly related to the Yukon River commercial Pacific salmon fishery. While not necessarily a direct subsidy, we were able to determine that $5 million was provided in 2010 in federal disaster relief “to assist with the recovery of fishing communities and fisheries from a commercial fishery failure in the Yukon River Chinook salmon fishery” (United States Department of Commerce 2010). Access Proximity – The Commercial Fisheries Entry Commission (CFEC) of Alaska does identify Alaska salmon permit holders by census area, allowing the proximity indicator to be quantitatively measured at this scale using existing, annually tracked data. Before discussing the results, however, it should be noted that addresses used to identify permit holders by census area are self-reported. In places like Alaska, where anecdotal evidence suggests that many individuals live part-time in multiple places (e.g. between a traditional community and a larger city), reported addresses may or may not be sufficient for describing this indicator. We calculate the indicator as the percentage of Yukon River salmon permit holders who are residents of the two census areas considered in this study—the Yukon-Koyukuk and the Wade-Hampton. In 2007, the percentages of permits owned by individuals from these two census areas for the Upper Yukon gillnet, Upper Yukon fish wheel and Lower Yukon gillnet fisheries were 41%, 68% and 83%, respectively. Considering only active permits fished during the 2007 season, these percentages change to 33%, 75%, and 92%, respectively. It is interesting to note that for all three fisheries; however, over 97% of 2007 permit holders were Alaska residents. As a means of comparison, according to the CFEC, the percentage of 2007 permit holders for the Bristol Bay drift gillnet fishery who were Alaska residents was only 47%.
Socioeconomic Indicators for Fisheries: A Case Study of the Yukon River Salmon Fishery
12
Presumably, this indicator could also be measured against a benchmark standard set at the regional or international level (e.g., 75% of permit holders/fishers must reside in the same state/region as the fishery). If and when such a standard were to be established, the indicator would serve as a marker of progress toward or away from the standard. Traditional Use – There is a large population of Native Americans/Alaska Natives living in the Yukon River management area, making the traditional use indicator relevant for this case study. Current management practices for the Yukon River state: “subsistence fishing has the highest priority among all uses of the resource in the State of Alaska and occurs throughout most of the Yukon River Area” (Bue and Hayes 2009). An example is provided in Table 3 of how this prioritization occurs by summarizing the management plan for Yukon River summer chum salmon. This prioritization of subsistence fisheries on the Yukon River, and in the State of Alaska more generally, suggests a benchmark toward which other fisheries could aspire, that is, a management strategy that provides first access to a fishery for use by tribal/indigenous communities.
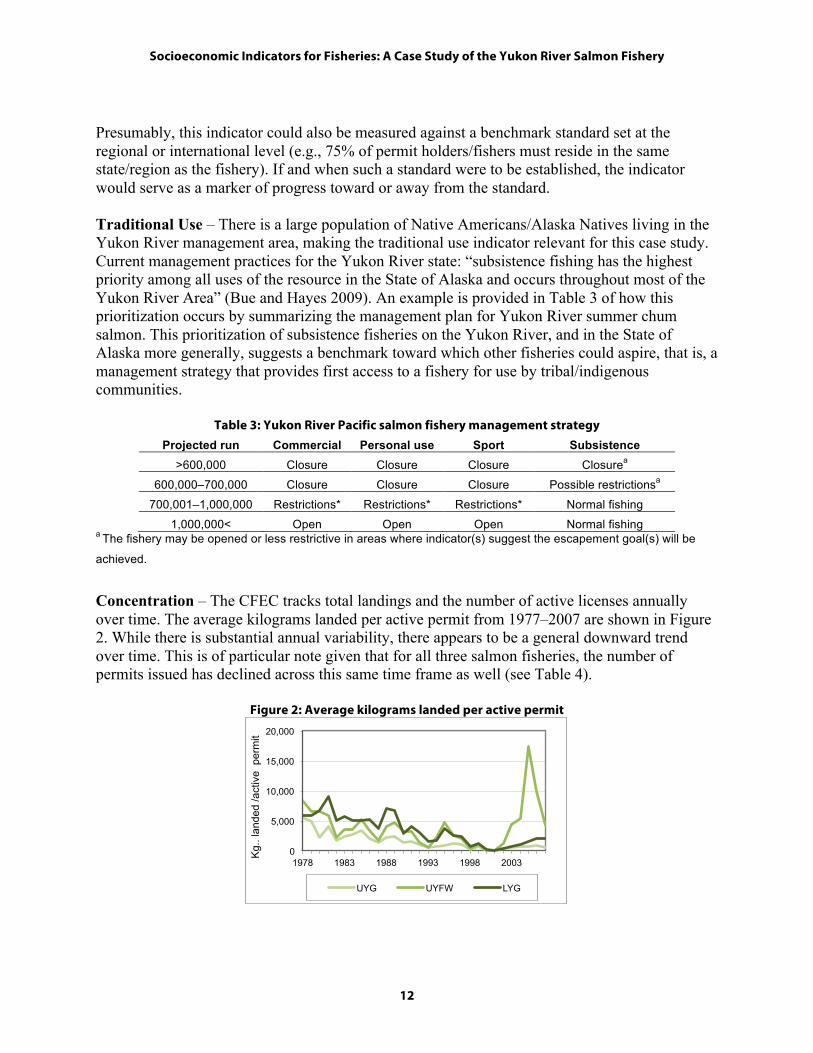
Table 3: Yukon River Pacific salmon fishery management strategy Projected run Commercial Personal use Sport Subsistence
>600,000 Closure Closure Closure Closurea
600,000–700,000 Closure Closure Closure Possible restrictionsa
700,001–1,000,000 Restrictions* Restrictions* Restrictions* Normal fishing
1,000,000< Open Open Open Normal fishing a The fishery may be opened or less restrictive in areas where indicator(s) suggest the escapement goal(s) will be
achieved.
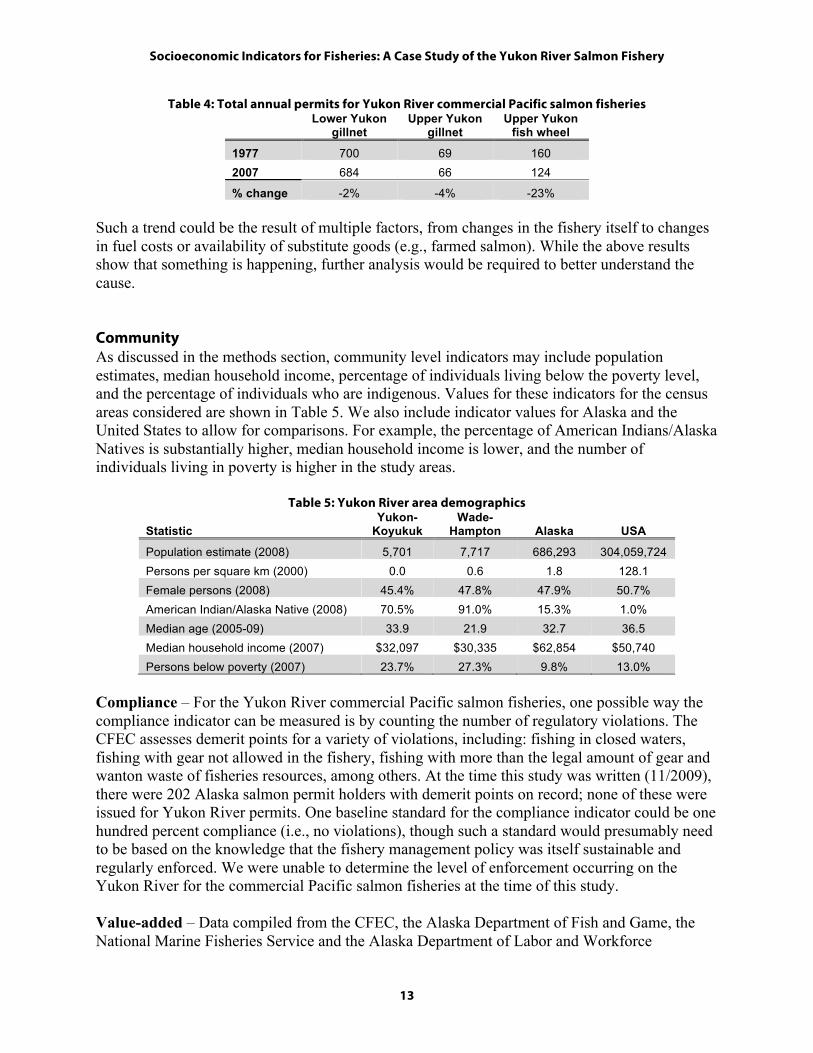
Concentration – The CFEC tracks total landings and the number of active licenses annually over time. The average kilograms landed per active permit from 1977–2007 are shown in Figure 2. While there is substantial annual variability, there appears to be a general downward trend over time. This is of particular note given that for all three salmon fisheries, the number of permits issued has declined across this same time frame as well (see Table 4).
Figure 2: Average kilograms landed per active permit
0
5,000
10,000
15,000
20,000
1978 1983 1988 1993 1998 2003
Kg.
. lan
ded
/act
ive
per
mit
UYG UYFW LYG
Socioeconomic Indicators for Fisheries: A Case Study of the Yukon River Salmon Fishery
13
Table 4: Total annual permits for Yukon River commercial Pacific salmon fisheries Lower Yukon
gillnet Upper Yukon
gillnet Upper Yukon
fish wheel
1977 700 69 160 2007 684 66 124
% change -2% -4% -23% Such a trend could be the result of multiple factors, from changes in the fishery itself to changes in fuel costs or availability of substitute goods (e.g., farmed salmon). While the above results show that something is happening, further analysis would be required to better understand the cause. Community As discussed in the methods section, community level indicators may include population estimates, median household income, percentage of individuals living below the poverty level, and the percentage of individuals who are indigenous. Values for these indicators for the census areas considered are shown in Table 5. We also include indicator values for Alaska and the United States to allow for comparisons. For example, the percentage of American Indians/Alaska Natives is substantially higher, median household income is lower, and the number of individuals living in poverty is higher in the study areas.
Table 5: Yukon River area demographics
Statistic Yukon-
Koyukuk Wade-
Hampton Alaska USA
Population estimate (2008) 5,701 7,717 686,293 304,059,724 Persons per square km (2000) 0.0 0.6 1.8 128.1 Female persons (2008) 45.4% 47.8% 47.9% 50.7% American Indian/Alaska Native (2008) 70.5% 91.0% 15.3% 1.0% Median age (2005-09) 33.9 21.9 32.7 36.5 Median household income (2007) $32,097 $30,335 $62,854 $50,740 Persons below poverty (2007) 23.7% 27.3% 9.8% 13.0%
Compliance – For the Yukon River commercial Pacific salmon fisheries, one possible way the compliance indicator can be measured is by counting the number of regulatory violations. The CFEC assesses demerit points for a variety of violations, including: fishing in closed waters, fishing with gear not allowed in the fishery, fishing with more than the legal amount of gear and wanton waste of fisheries resources, among others. At the time this study was written (11/2009), there were 202 Alaska salmon permit holders with demerit points on record; none of these were issued for Yukon River permits. One baseline standard for the compliance indicator could be one hundred percent compliance (i.e., no violations), though such a standard would presumably need to be based on the knowledge that the fishery management policy was itself sustainable and regularly enforced. We were unable to determine the level of enforcement occurring on the Yukon River for the commercial Pacific salmon fisheries at the time of this study. Value-added – Data compiled from the CFEC, the Alaska Department of Fish and Game, the National Marine Fisheries Service and the Alaska Department of Labor and Workforce
Socioeconomic Indicators for Fisheries: A Case Study of the Yukon River Salmon Fishery
14
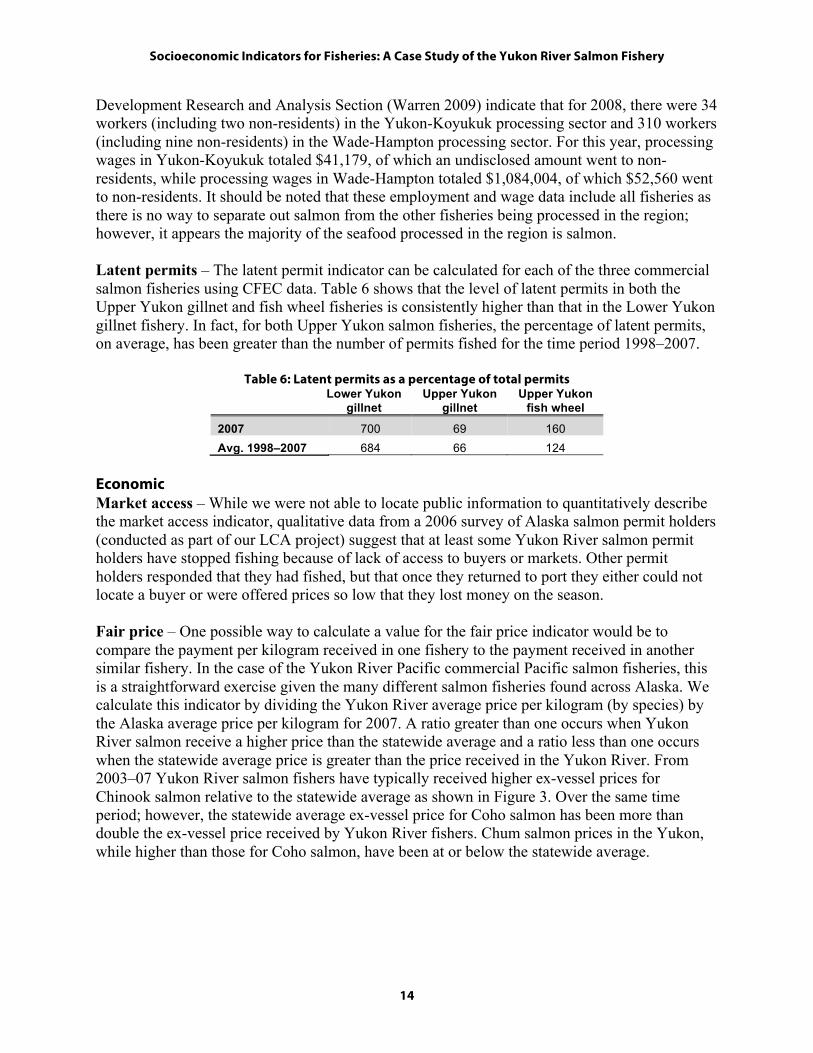
Development Research and Analysis Section (Warren 2009) indicate that for 2008, there were 34 workers (including two non-residents) in the Yukon-Koyukuk processing sector and 310 workers (including nine non-residents) in the Wade-Hampton processing sector. For this year, processing wages in Yukon-Koyukuk totaled $41,179, of which an undisclosed amount went to non-residents, while processing wages in Wade-Hampton totaled $1,084,004, of which $52,560 went to non-residents. It should be noted that these employment and wage data include all fisheries as there is no way to separate out salmon from the other fisheries being processed in the region; however, it appears the majority of the seafood processed in the region is salmon. Latent permits – The latent permit indicator can be calculated for each of the three commercial salmon fisheries using CFEC data. Table 6 shows that the level of latent permits in both the Upper Yukon gillnet and fish wheel fisheries is consistently higher than that in the Lower Yukon gillnet fishery. In fact, for both Upper Yukon salmon fisheries, the percentage of latent permits, on average, has been greater than the number of permits fished for the time period 1998–2007.
Table 6: Latent permits as a percentage of total permits Lower Yukon
gillnet Upper Yukon
gillnet Upper Yukon
fish wheel
2007 700 69 160 Avg. 1998–2007 684 66 124
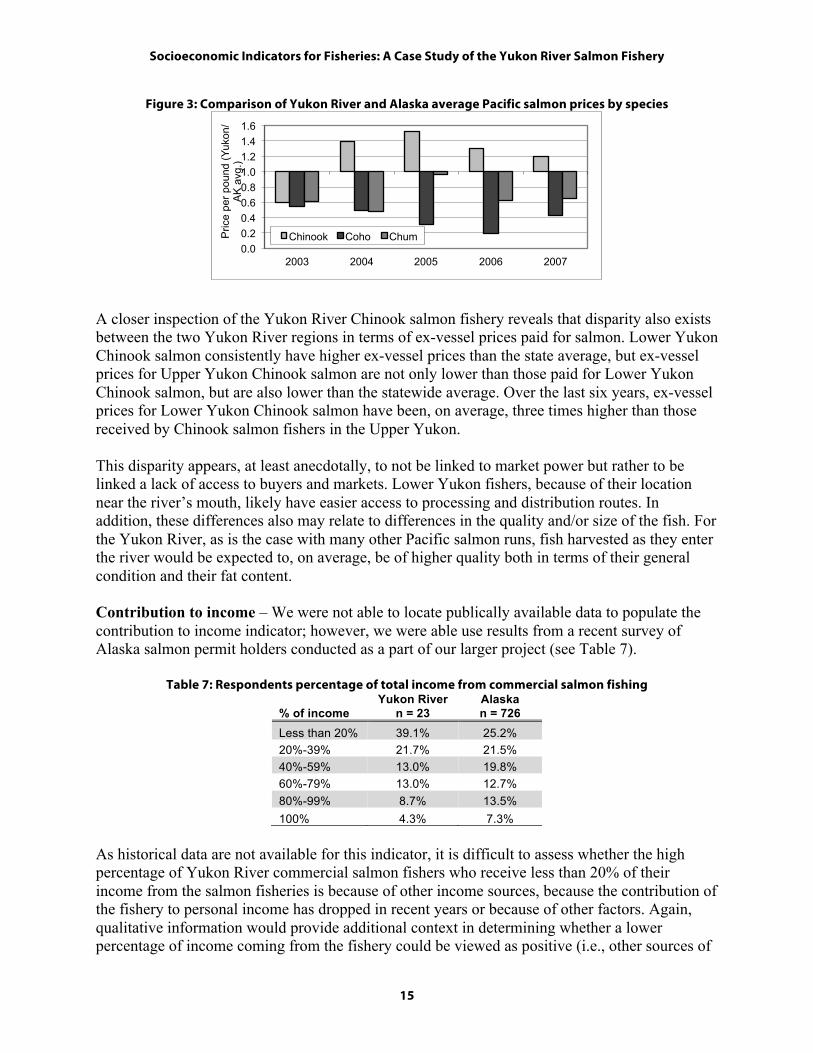
Economic Market access – While we were not able to locate public information to quantitatively describe the market access indicator, qualitative data from a 2006 survey of Alaska salmon permit holders (conducted as part of our LCA project) suggest that at least some Yukon River salmon permit holders have stopped fishing because of lack of access to buyers or markets. Other permit holders responded that they had fished, but that once they returned to port they either could not locate a buyer or were offered prices so low that they lost money on the season. Fair price – One possible way to calculate a value for the fair price indicator would be to compare the payment per kilogram received in one fishery to the payment received in another similar fishery. In the case of the Yukon River Pacific commercial Pacific salmon fisheries, this is a straightforward exercise given the many different salmon fisheries found across Alaska. We calculate this indicator by dividing the Yukon River average price per kilogram (by species) by the Alaska average price per kilogram for 2007. A ratio greater than one occurs when Yukon River salmon receive a higher price than the statewide average and a ratio less than one occurs when the statewide average price is greater than the price received in the Yukon River. From 2003–07 Yukon River salmon fishers have typically received higher ex-vessel prices for Chinook salmon relative to the statewide average as shown in Figure 3. Over the same time period; however, the statewide average ex-vessel price for Coho salmon has been more than double the ex-vessel price received by Yukon River fishers. Chum salmon prices in the Yukon, while higher than those for Coho salmon, have been at or below the statewide average.
Socioeconomic Indicators for Fisheries: A Case Study of the Yukon River Salmon Fishery
15
Figure 3: Comparison of Yukon River and Alaska average Pacific salmon prices by species
A closer inspection of the Yukon River Chinook salmon fishery reveals that disparity also exists between the two Yukon River regions in terms of ex-vessel prices paid for salmon. Lower Yukon Chinook salmon consistently have higher ex-vessel prices than the state average, but ex-vessel prices for Upper Yukon Chinook salmon are not only lower than those paid for Lower Yukon Chinook salmon, but are also lower than the statewide average. Over the last six years, ex-vessel prices for Lower Yukon Chinook salmon have been, on average, three times higher than those received by Chinook salmon fishers in the Upper Yukon. This disparity appears, at least anecdotally, to not be linked to market power but rather to be linked a lack of access to buyers and markets. Lower Yukon fishers, because of their location near the river’s mouth, likely have easier access to processing and distribution routes. In addition, these differences also may relate to differences in the quality and/or size of the fish. For the Yukon River, as is the case with many other Pacific salmon runs, fish harvested as they enter the river would be expected to, on average, be of higher quality both in terms of their general condition and their fat content. Contribution to income – We were not able to locate publically available data to populate the contribution to income indicator; however, we were able use results from a recent survey of Alaska salmon permit holders conducted as a part of our larger project (see Table 7).
Table 7: Respondents percentage of total income from commercial salmon fishing
% of income Yukon River
n = 23 Alaska n = 726
Less than 20% 39.1% 25.2% 20%-39% 21.7% 21.5% 40%-59% 13.0% 19.8% 60%-79% 13.0% 12.7% 80%-99% 8.7% 13.5% 100% 4.3% 7.3%
As historical data are not available for this indicator, it is difficult to assess whether the high percentage of Yukon River commercial salmon fishers who receive less than 20% of their income from the salmon fisheries is because of other income sources, because the contribution of the fishery to personal income has dropped in recent years or because of other factors. Again, qualitative information would provide additional context in determining whether a lower percentage of income coming from the fishery could be viewed as positive (i.e., other sources of
0.0 0.2 0.4 0.6 0.8 1.0 1.2 1.4 1.6
2003 2004 2005 2006 2007
Pric
e pe
r pou
nd (Y
ukon
/A
K a
vg.)
Chinook Coho Chum
Socioeconomic Indicators for Fisheries: A Case Study of the Yukon River Salmon Fishery
16
income make the fishers less dependent on the natural variations of the fishery) or negative (i.e., a declining fishery cannot support historical levels). Profits – We were not able to locate publically available data describing fishers’ profits for the Yukon River commercial Pacific salmon fisheries. Qualitative data from a recent survey of Alaska salmon permit holders; however, suggest that increasing fuel costs combined with decreasing ex-vessel prices are making salmon fishing a losing proposition for more and more fishers. Worker Worker safety – Alaska statistics on worker safety combine agriculture, forestry, fishing and hunting, so we were unable to use these to estimate worker safety specifically in the Yukon River commercial salmon fisheries. Results from a 2006 survey of Alaska salmon permit holders, including Yukon River permit holders; however, found that for the previous year (2005) both the mean and median number of accidents/deaths occurring in the set gillnet salmon fishery in Alaska was zero. The benchmark standard for this indicator could be established as zero accidents/deaths per year in a fishery. Again, even if such a standard is not achievable by some fisheries, a trend toward this standard (as opposed to a trend away) would indicate improvement in worker safety. Fair compensation – While Alaska has minimum wage laws, these do not apply to crew member jobs in the seafood industry (see http://labor.alaska.gov/esd_alaska_jobs/seafood.htm). Furthermore, as stated by the Alaska Department of Labor and Workforce Development on the same website,
“Wages are often based on a share or percentage of harvest earnings. Newcomer deckhand earnings range from 1.5% to 10% of the adjusted gross catch, depending on location and type of fishery and the skills the worker possesses. Some vessels offer a daily rate from $50 to $100 instead of a percentage of the catch. Recent market conditions have caused some share rates to decline.”
In order to estimate fair compensation associated with a percentage of the share or a daily rate compensation structure, additional information would be needed (e.g., total value of share landed, hours worked per day) that was not available at the time of this study. Because of this, we were not able to assess typical wages for individuals working in the Yukon River commercial Pacific salmon fishery. Seasonality – The Yukon River commercial Pacific salmon fisheries are seasonal in nature, due to both the timing of salmon runs and management plans (for an example, please see Bue and Hayes 2009). There are summer runs of Chinook and chum salmon and fall runs of chum and coho salmon. The duration of the fishing season is then further limited by management actions and preferences for other fisheries (i.e. subsistence, personal use and recreational). As mentioned previously, there are a number of broadly recognized worker indicators including the right to organize, worker benefits, minimum age requirements and avoidance of forced labor. Alaska has the Division of Labor Standards and Safety, and an Alaska Child Labor Law. In addition, union members’ rights and interests are protected in the U.S. by the Labor-Management Reporting and Disclosure Act (LMRDA) of 1959.
Socioeconomic Indicators for Fisheries: A Case Study of the Yukon River Salmon Fishery
17
Discussion Having described a number of specific indicators, we would like to discuss briefly what the findings of this case study suggest more broadly. First, it appears that, at least in the context of the case study, the majority of indicators (19 of 25) proposed can be measured using existing, publically available data. In most cases, the information needed is tracked on an annual basis, suggesting that tracking of trends (relative to a baseline) would also be a relatively straightforward exercise. Several others we were able to describe in this article due to additional primary data collection, but do not appear to otherwise be regularly tracked. Second, what do these indicators, in combination, broadly suggest about the sustainability of the Yukon River commercial salmon fishery from a socioeconomic perspective? Given that a) many of the indicators described are best understood as comparisons across time; and b) different individuals/stakeholders are likely to weight indicators differently, it is difficult to summarize the indicators into a simple statement such as, “The fishery is highly sustainable,” or “The fishery is highly unsustainable.” Nonetheless, the first-cut metrics captured in this study do provide several telling insights about the Yukon River commercial Pacific salmon fishery. As mentioned previously, subsistence fishing receives the first allocation of Pacific salmon not only on the Yukon River, but across Alaska. From a socioeconomic perspective, this is an important metric, demonstrating that even for a highly commercial fishery, such as Pacific salmon in Alaska, traditional/indigenous use is the highest priority from a management perspective. This prioritization of subsistence fisheries suggests a benchmark toward which other fisheries could aspire. At the same time, however, this metric may be less relevant in regions where traditional/indigenous use does not occur. The prioritization of subsistence fisheries; however, also directly impacts the commercial component of the fishery, where in recent years, small projected run sizes have led to fishery closures. While this direct relationship between the fishery and socioeconomic well-being is expected, a surprising finding of this study was the substantial effect of downstream market forces on socioeconomic indicators, more specifically, the number, location and concentration of buying stations on the Yukon River. Anecdotal evidence suggests that these factors are possible contributors to the high number of latent permits on the Upper Yukon, the disparity in ex-vessel values received by Upper and Lower Yukon fishermen, and concentration of effort, among others. This suggests that it is not sufficient to assume that a healthy fishery will result in socioeconomic well-being for fishery dependent individuals and communities and that simply having access, “local” ownership, etc. may necessary, but not sufficient indicators of well-being. While this is only a first attempt for a single case study fishery, these findings do suggest that additional emphasis be put on market indicators. Multiple indicators appear to be linked to the seasonality and season length of the fishery, such as contribution to income, effort, employment, etc. While increases in fishery run size or improvements in market access would likely improve these metrics, all are likely constrained by the seasonal nature of the commercial Pacific salmon fishery. As such, is it possible that these
Socioeconomic Indicators for Fisheries: A Case Study of the Yukon River Salmon Fishery
18
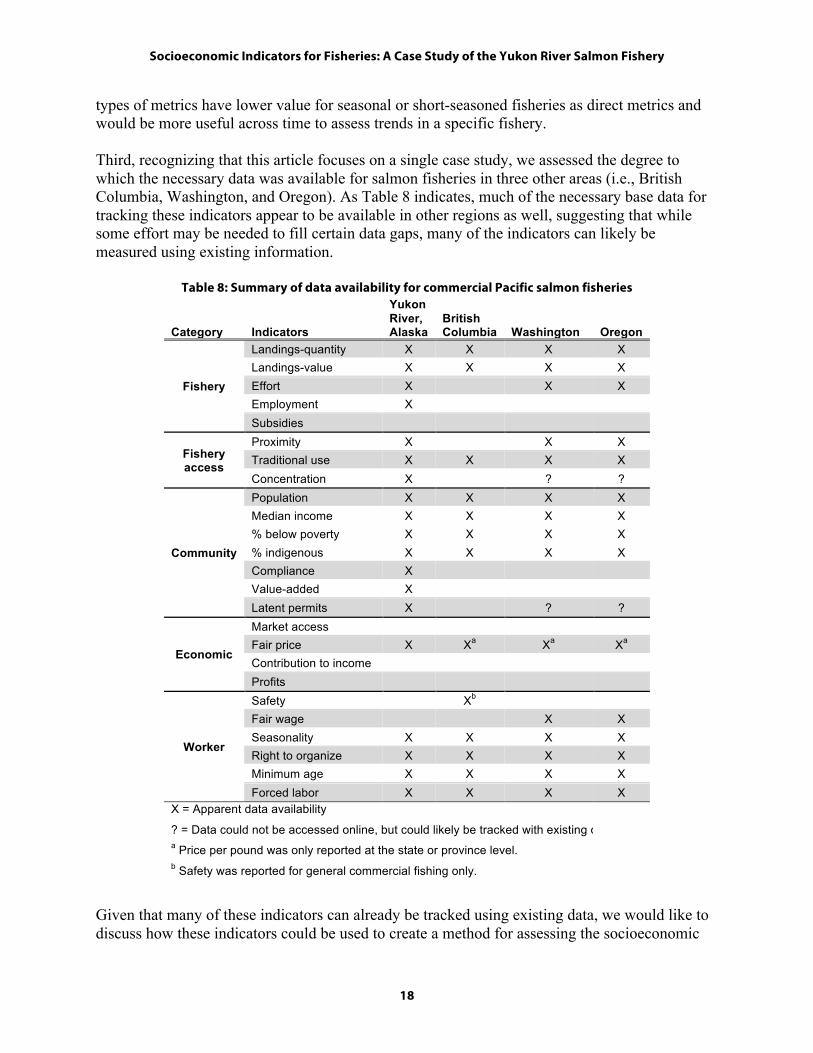
types of metrics have lower value for seasonal or short-seasoned fisheries as direct metrics and would be more useful across time to assess trends in a specific fishery. Third, recognizing that this article focuses on a single case study, we assessed the degree to which the necessary data was available for salmon fisheries in three other areas (i.e., British Columbia, Washington, and Oregon). As Table 8 indicates, much of the necessary base data for tracking these indicators appear to be available in other regions as well, suggesting that while some effort may be needed to fill certain data gaps, many of the indicators can likely be measured using existing information.
Table 8: Summary of data availability for commercial Pacific salmon fisheries
Category Indicators
Yukon River, Alaska
British Columbia Washington Oregon
Fishery
Landings-quantity X X X X Landings-value X X X X Effort X X X Employment X Subsidies
Fishery access
Proximity X X X Traditional use X X X X Concentration X ? ?
Community
Population X X X X Median income X X X X % below poverty X X X X % indigenous X X X X Compliance X Value-added X Latent permits X ? ?
Economic
Market access Fair price X Xa Xa Xa Contribution to income Profits
Worker
Safety Xb Fair wage X X Seasonality X X X X Right to organize X X X X Minimum age X X X X Forced labor X X X X
X = Apparent data availability
? = Data could not be accessed online, but could likely be tracked with existing data a Price per pound was only reported at the state or province level. b Safety was reported for general commercial fishing only.
Given that many of these indicators can already be tracked using existing data, we would like to discuss how these indicators could be used to create a method for assessing the socioeconomic
Socioeconomic Indicators for Fisheries: A Case Study of the Yukon River Salmon Fishery
19
sustainability of a fishery. We suggest a two part assessment. The first part would encompass the identification of minimum requirements for a fishery to be considered sustainable from a socioeconomic perspective. Indicators could serve as measures of progress toward those minimum standards, and be measured in ways that are comparable across regional and/or international boundaries. The second part of the assessment would include supplementary or voluntary requirements. These additional indicators could be community or fishery specific and could be used to measure trends over time against a baseline standard specific to the community or fishery. With respect to establishing a baseline standard, it is important to distinguish between absolute and relative standards. For example, the indicator for worker safety is one for which an obvious absolute standard across all fisheries exists (i.e., zero accidents/deaths). Another indicator that can be measured using an absolute standard is “fair wage”, where the standard in all cases requires that the average wage of workers is at least equal to the “living wage” for the region/county in which the fishery is located; however, in this case, an absolute standard across all fisheries does not suffice because the wage necessary to attain the same standard of living is not equal across regions/countries. Instead, an absolute value specific to each region/country would perhaps be more appropriate. For indicators where the establishment of an absolute standard is difficult, the use of a relative standard can still provide a meaningful measure relative to similar fisheries or to itself over time. As an example, consider the indicator designed to measure the percentage of personal income derived from a fishery. It seems unreasonable to create an absolute standard that all fisheries should and/or could provide the same level of personal income (e.g., all fishermen should derive 100% of their personal annual income from a single fishery) but that it is reasonable to assess performance relative to benchmarks. For example, if fishermen, on average, derive 75% of their personal income from a fishery, then a trend away from a measure of 75% could be an indication of changes in the socioeconomic structure of the fishery. Table 8 shows which indicators described in this article might best be categorized as minimum requirement indicators. Increasing awareness around the need for sustainable commercial fisheries has led to reasonably well established environmental/biological sustainability indicators; however, there has been only minimal development of complimentary social and economic indicators. The diversity of commercial fisheries and the substantial variation in the communities that depend on these fisheries imply a need for indicators that are both adaptable and comparable within and across fisheries. The goal of this paper is not to produce a finalized set of socioeconomic indicators, but rather to put forward suggestions of the types of indicators that might be relevant and attempt to attach real world data to them. This paper describes a number of indicators and examines them in the context of a case study, the Yukon River salmon fishery. Such an effort allows us to assess not only the issues around the development of socioeconomic indicators but also assesses our ability to populate in a data limited environment. Moving from individual indicators to the idea of how these indicators could be used to create a method for assessing the socioeconomic sustainability of a fishery, we suggest a two part assessment, including both required and voluntary standards

Socioeconomic Indicators for Fisheries: A Case Study of the Yukon River Salmon Fishery
20
associated with various socioeconomic indicators. From a management perspective, integration and tracking of such indicators along with environmental/biological ones supports improved ecosystem based management in which humans are also a factor.
Socioeconomic Indicators for Fisheries: A Case Study of the Yukon River Salmon Fishery
21
References Accadia, P., and M. Spagnolo. 2006. Socio-economic indicators for the Adriatic Sea demersal
fisheries. International Institute of Fisheries Economics and Trade Portsmouth Proceedings.
Alaska Department of Labor and Workforce Development (ADOLWD). 2009. Summary of Alaska Child Labor Law. Available: labor.alaska.gov/lss/childlaw.htm. (February 2010).
Alaska Department of Fish and Game (ADFG). 2009. 2008 Yukon River Fall Season Summary. ADFG, Fairbanks.
Berkes, F, R. Mahon, P. McConney, R.Pollnac, and R. Pomeroy. 2001. Managing Small-scale Fisheries. International Development Research Centre. Ottawa.
Bue, F. J., and S. J. Hayes. 2009. 2009 Yukon Area subsistence, personal use, and commercial salmon fisheries outlook and management strategies. Alaska Department of Fish and Game, Regional Information Report 3A09-02, Anchorage.
Boyd, H., and A. Charles. 2006. Creating community-based indicators to monitor sustainability of local fisheries. Ocean & Coastal Management 49: 237–258.
Bozon, A. 2000. Development of economic and social indicators for the management of Mediterranean fisheries. Marine Freshwater Research 51:493–500.
Dreyer, L., M. Hauschild, and J. Schierbeck. 2006. A framework for social life cycle impact assessment. International Journal of Lifecycle Assessment 11: 88–97.
Ellingsen, H. 2004. Working Environment and Life Cycle Assessment. Pages 35-38 in B. Mattsson and F. Ziegler, editors. Environmental Assessment of Seafood Products through LCA: Final report of a Nordic Network project. Nordic Council of Ministers, Copenhagen.
Federal Fisheries Investment Task Force (FFITF). 1999. Report to Congress. National Oceanic and Atmospheric Administration, Washington, D.C.
Federal Register. 2009. “Magnuson-Stevens Act Provisions; Annual Catch Limits; National Standard Guidelines; Final Rule.” Federal Register 74:11 (January 16, 2009) Accessed: 1/27/10.
Food and Agriculture Organization (FAO). 1999. Indicators for sustainable development of marine capture fisheries, FAO Technical Guidelines for Responsible Fisheries 8. Rome.
FAO. 2008. The state of world fisheries and aquaculture. Rome.
Garcia, S. 1996. Indicators for Sustainable Development of Fisheries. Paper presented at the 2nd World Fisheries Congress. Workshop on Fisheries Sustainability Indicators, Brisbane, Australia, August, 1996.
Garcia, S. M., D. J. Staples, and J. Chesson. 2000. The FAO guidelines for the development and use of indicators for sustainable development of marine capture fisheries and an Australian example of their application. Ocean & Coastal Management 43: 537–556.
Hospido, A. and P. Tyedmers. 2005. Life cycle environmental impacts of Spanish tuna fisheries. Fisheries Research 76: 174–186.
Socioeconomic Indicators for Fisheries: A Case Study of the Yukon River Salmon Fishery
22
International Organization for Standardization (ISO). 2006a. ISO 14040:2006. ISO, Geneva. ISO. 2006b. ISO 14044:2006. ISO, Geneva.
Kruse, S. A., A. Flysjö, N. Kasperczyk, and A. J. Scholz. 2009. Socioeconomic indicators as a complement to life cycle assessment—An application to salmon production systems. International Journal of Life Cycle Assessment 14: 8–18.
Matthew, S. 2005. The role of fisheries, including aquaculture, as a source of employment. Discussion Panel A: Fisheries and their contribution to sustainable development. United Nations Open-ended Informal Consultative Process on Oceans and the Law of the Sea.
Organisation for Economic Cooperation and Development (OECD). 2006. Financial support to fisheries: implications for sustainable development. OECD, Paris.
Pauly, D. 2006. Major trends in small-scale marine fisheries, with emphasis on developing countries, and some implications for the social sciences. Maritime Studies (MAST) 4(2): 7–22.
Pelletier, N. and P. Tyedmers. 2008. Life cycle considerations for improving sustainability assessments in seafood awareness campaigns. Environmental Management 42:918–41.
Rice, J. C., and M.-J. Rochet. 2005. A framework for selecting a suite of indicators for fisheries management. ICES Journal of Marine Science 62(3): 516–527.
Sabatella, E., and R. Franquesa. 2004. Manual of fisheries sampling surveys: methodologies for estimations of socio-economic indicators in the Mediterranean Sea. General Fisheries Commission for the Mediterranean, Food and Agriculture Organization Studies and Reviews 73, Rome.
Sharp, R. and U.R. Sumaila. 2009. Quantification of U.S. marine fisheries subsidies. North American Journal of Fisheries Management 29:18–32.
State of the Salmon. 2005. Crafting socio-economic indicators (SEI) for salmon sustainability. Workshop Report, Portland, OR.
Sumaila, U.R. and D. Pauly, editors. 2006. Catching more bait: A bottom-up re-estimation of global fisheries subsidies. Fisheries Centre Research Reports 14–6, Vancouver.
Sumaila, U. R., L. Teh, R. Watson, P. Tyedmers, and D. Pauly. 2008. Fuel price increase, subsidies, overcapacity, and resource sustainability. – ICES Journal of Marine Science, 65: 832–840.
Thrane, M. 2004. Environmental impacts from Danish fish products: Hot spots and environmental policies. Doctoral dissertation. Aalborg University, Aalborg.
Unal, V. 2006. Profile of fishery cooperatives and estimate of socio-economic indicators in marine small-scale fisheries; Case studies in Turkey. Master’s thesis. University of Barcelona, Barcelona.
United Nations Environment Program (UNEP). 2004. Analyzing the resource impact of fisheries subsidies: matrix approach.
United States Commission on Ocean Policy. 2004. An ocean blueprint for the 21st century. U.S Commission on Ocean Policy, Final Report, Washington, DC.
Socioeconomic Indicators for Fisheries: A Case Study of the Yukon River Salmon Fishery
23
United States Department of Commerce. 2010. U.S. Commerce Secretary Gary Locke Announces $5 Million for Yukon River Chinook Fishery Disaster Assistance. Press release on September 17, 2010. Downloaded from http://www.commerce.gov/news/press-releases/2010/09/17/us-commerce-secretary-gary-locke-announces-5-million-yukon-river-chin
von Brandt, A. 1984. Andres von Brandt: Fish Catching Methods of the World. Third Edition. Farnham, Surrey: Fishing News Books Ltd.
Warren, J. 2009. Bristol Bay first wholesale value and payments to workers. Fishing data information request by S. Kruse. Commercial Fisheries Entry Commission, Alaska Department of Fish and Game, National Marine Fisheries Service, and Alaska Department of Labor and Workforce Development, Research and Analysis Section.