year 7 geography deep learning booklet fill in the …
TRANSCRIPT

YEAR 7 GEOGRAPHY
DEEP LEARNING BOOKLET
Name: Class:
FILL IN THE GAPS,
IMPROVE YOUR VOCAB _________ is a controversial notion because it is so subjective; one person's preferences might be anathema to another. But that is a good thing – _______ provides a fertile space for debate. For the purpose of this exercise, liveability is defined as "the general quality of a ______ which makes it agreeable for people to reside in". The __________ in the CBD, a district that has leapt in the liveability ________, has doubled since the turn of the century. Back in 2008, as many as half the new ________ being built were on the city's fringes. Today that figure has fallen to less than 30 per cent, buttressing the _______ that people are seeking a wider range of _______ options. In particular, there is a need to significantly increase the number of medium-density dwellings in the suburbs within 20 _______ of the city's centre. While the spread of the ______ has eased, it is in our view still too _________. It is certainly outpacing infrastructure _________. Many of the things that make inner Melbourne so internationally feted are scandalously scarce in the outer suburbs – particularly public transport, schools, community ________, parks, services, shops and jobs. One trend emerging is that Melbourne's west and north are becoming increasingly _______, a welcome challenge to the long-established real-estate _________ of the suburbs to the south and the east. Access to _________ is one of the most fundamental elements of liveability in any major city. The lack of it in many outer parts of Melbourne is one of our biggest public _______ problems. There are clear indications of the solution, though: the rise of the west and the north has in part been driven by better bus services. Elsewhere, _________ caused by inadequate public transport has dragged suburbs down the list. A big, ongoing _________ in public transport is required to underpin and fuel Melbourne ________ and socially. attractive congestion development diversity dominance
dwellings economically evidence facilities fringes
housing investment kilometres liveability place
policy population public transport rankings substantial
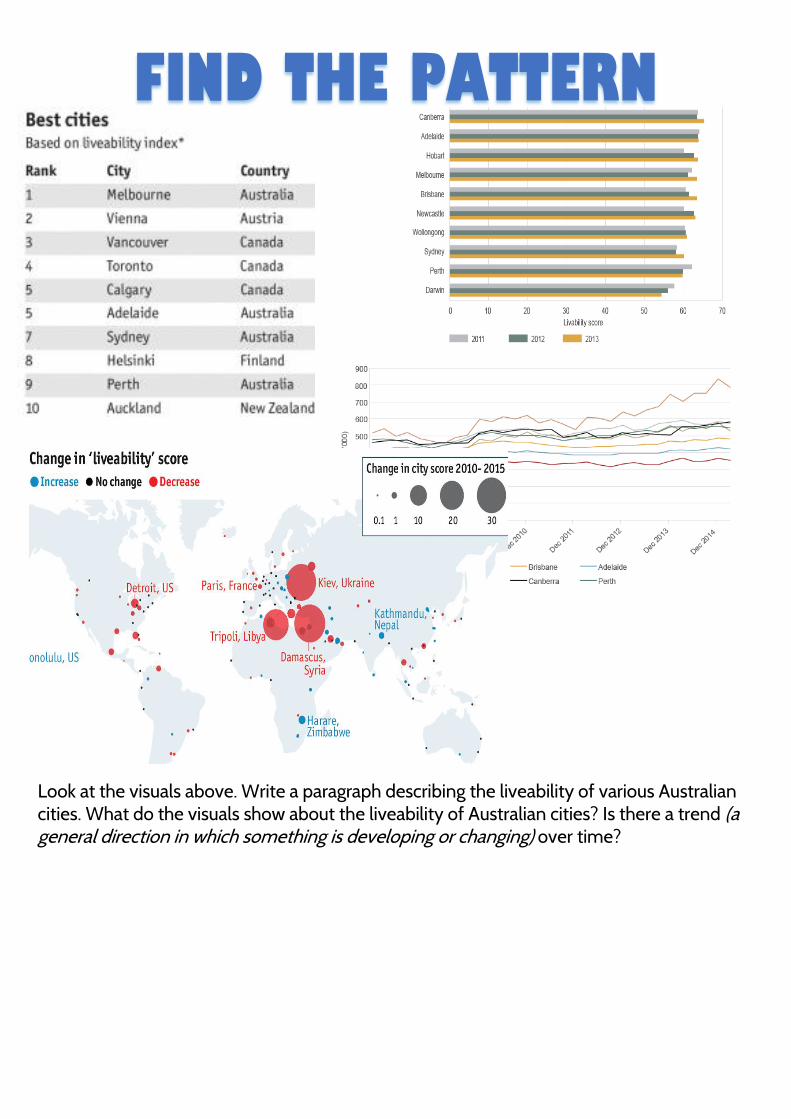
FIND THE PATTERN Look at the visuals above. Write a paragraph describing the liveability of various Australian cities. What do the visuals show about the liveability of Australian cities? Is there a trend (a general direction in which something is developing or changing) over time?

UNSOLVED MYSTERIES… To a certain extent, it is still mysterious why people live where they do. Some people have more choice than others when planning where to live. But everyone operates under constraints – and there are both push and pull factors that play into the reasons why a person lives in a certain place.
Find two different theories online about why people live where they do. Record them below:
Theory #1 about why people live where they do:
Where I read about this theory:
Theory #2 about why people live where they do:
Where I read about this theory:

WHAT’S THE MORAL OF
THIS STORY? Melbourne is often ranked the world’s most ‘liveable’ cities by organisations like the Economist’s Intelligence Unit (The Economist is a business and politics magazine). Yet Melbourne has a high rate of homelessness. Read the text below and decide what you think the “moral” of this story is. Homelessness has been in the news this week following a Herald Sun report that claimed
“aggressive beggars” are “jeopardising Melbourne’s reputation”.
In Melbourne’s City Square, a group of homeless people has created a makeshift shelter in
response to rising hostility from the public. The temporary campsite is built underneath a tree
using crates, tarps and cardboard boxes. It is decorated with peace signs and placards saying
‘Dry Zone – no drugs, no alcohol, no disrespect’ and ‘the homeless are people too’.
These surveys obsessed with finding the world’s “best” place to live never seem to consider
what it’s like in all these cities for people who don’t have very much money, and by buying into
their schtick, we come out with pretty warped priorities around what makes a truly great city.
The latest one is a good example. While the criteria the EIU uses to determine “livability”
mentions indicators like public healthcare and education, it’s very quiet on things like public
housing, social welfare and inequality.
I doubt the judges that keep putting Melbourne on top of their list pay much attention to the
city’s record number of homeless people, or the fact that begging is illegal there.
What does this tell you about how the world works?

MAKE AN INFOGRAPHIC! Infographics are a great way to represent data in a way that is engaging to the viewer. Using the data given, make an infographic that displays the data in an interesting way. To get an idea of what an infographic is, google “infographic” and view the images. You can make an infographic by hand or use piktochart or canva or something similar. Either draw it on this page or do it electronically, print it out and stick it to this page… Melbourne data

HISTORY OF… Early attempts at combating urban sprawl
Starting in the early 20th century, environmentalist opposition to urban sprawl
began to come together, with roots in the garden city movement, as well as
pressure from campaign groups such as the Campaign to Protect Rural
England (CPRE). Under Herbert Morrison's 1934 leadership of the London
County Council, the first formal proposal was made by the Greater London
Regional Planning Committee "to provide a reserve supply of public open
spaces and of recreational areas and to establish a green belt or girdle of open
space". The Town and Country Planning Act of 1947 expressly incorporated
green belts into all further national urban developments. New provisions for
compensation in the 1947 Town and Country Planning Act allowed local
authorities around the country to incorporate green belt proposals in their
first development plans. The codification of Green Belt policy and its extension to areas other than London
came with the historic Circular 42/55 inviting local planning authorities to consider the establishment of Green
Belts. The first urban growth boundary in the U.S. was in Fayette County, Kentucky in 1958.
Read the text above. What does the history of trying to deal with urban sprawl tell you about it? How does it affect liveability? What lessons can we learn about how people have tried to deal with urban sprawl in the past? (write a short paragraph answering these three questions)
The Metropolitan Green Belt first proposed by the London County Council in 1935.

HUMAN VS. PHYSICAL
GEOGRAPHY Geography can be split into two parts: Human Geography and physical Geography. In the table below, find the human or physical Geography links within each subtopic, by filling in the table below. Some cells have been done to give you an example.
Topic Human geography aspect Physical geography aspect
Melbourne is the world’s most liveable city
Lots of wealthy people might flock to Melbourne after hearing about this, but it is liveable for everyone?
Melbourne is located on a river, in a temperate climate, on a large bay with lots of clean beaches. This probably helps it to be more liveable.
Lots of cities have “urban sprawl”
People want to move to cities because there are more jobs, cultural opportunities and fun in them, it makes sense for cities to be growing.
Nobody wants to live in places with lots of crime
We might be able to graph where crime hotspots are in a city and see if there is any physical geographical link to it – e.g. is there more crime near industrial areas? Near parks?
Some people live in dangerous places
Your opinion about liveability changes as you age
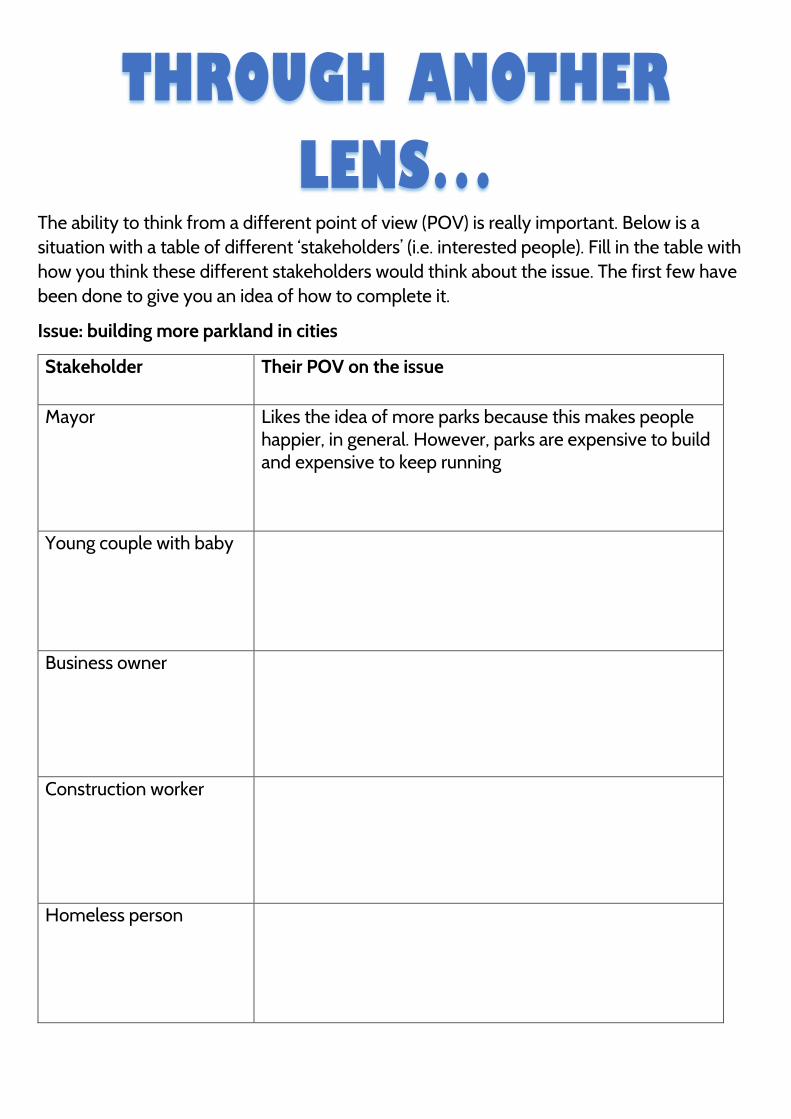
THROUGH ANOTHER
LENS… The ability to think from a different point of view (POV) is really important. Below is a situation with a table of different ‘stakeholders’ (i.e. interested people). Fill in the table with how you think these different stakeholders would think about the issue. The first few have been done to give you an idea of how to complete it.
Issue: building more parkland in cities
Stakeholder Their POV on the issue
Mayor Likes the idea of more parks because this makes people happier, in general. However, parks are expensive to build and expensive to keep running
Young couple with baby
Business owner
Construction worker
Homeless person