www.scotland.gov.uk/simd scottish index of multiple deprivation (simd) scotpho training course –...
TRANSCRIPT
www.scotland.gov.uk/simd
Scottish Index of Multiple Deprivation (SIMD)
ScotPHO training course – day 4
Andrew WhiteOffice of the Chief Statistician,
Scottish Government

www.scotland.gov.uk/simd
A run through of…
• What is the SIMD?– The history– The methodology
• Some things you should know…
• Headline findings
• Finding more info. on SIMD 2009

www.scotland.gov.uk/simd
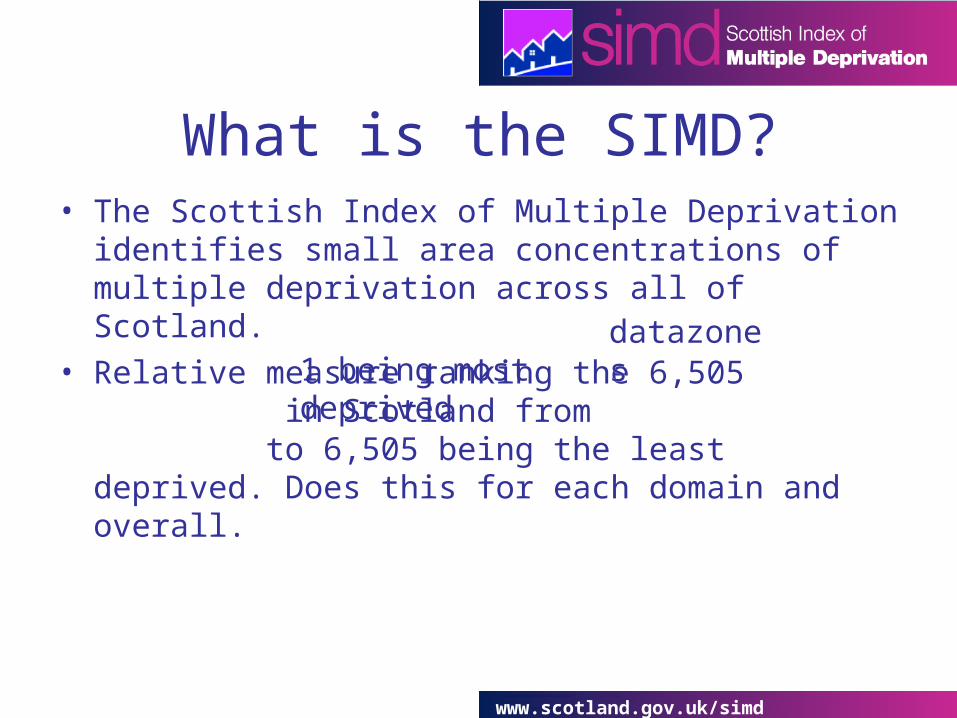
What is the SIMD?• The Scottish Index of Multiple Deprivation identifies small
area concentrations of multiple deprivation across all of Scotland.small area concentrations multiple deprivation

www.scotland.gov.uk/simd
Multiple deprivation
• Multiple aspects of deprivation called ‘domains’– Income– Employment– Health– Education– Access to Services– Housing– Crime
www.scotland.gov.uk/simd
What is the SIMD?• The Scottish Index of Multiple Deprivation identifies small
area concentrations of multiple deprivation across all of Scotland.
• Relative measure ranking the 6,505 datazones in Scotland from 1 being most deprived to 6,505 being the least deprived. Does this for each domain and overall.
datazones1 being most deprived
datazones

www.scotland.gov.uk/simd
What are datazones?
• Statistical geography
• Average population of 750 people
• 6,505 datazones in Scotland
• No names, but codes like S01000001

www.scotland.gov.uk/simd
What is the SIMD?• The Scottish Index of Multiple Deprivation identifies small
area concentrations of multiple deprivation across all of Scotland.
• Relative measure ranking the 6,505 datazones in Scotland from 1 being most deprived to 6,505 being the least deprived. Does this for each domain and overall.
• Analysis often focuses on the 15% most deprived. There are 976 datazones in the 15% most deprived (and 1,301 in the 20%).
15%

www.scotland.gov.uk/simd
What is the SIMD?• The Scottish Index of Multiple Deprivation identifies small
area concentrations of multiple deprivation across all of Scotland.
• Relative measure ranking the 6,505 datazones in Scotland from 1 being most deprived to 6,505 being the least deprived. Does this for each domain and overall.
• Analysis often focuses on the 15% most deprived. There are 976 datazones in the 15% most deprived (and 1,301 in the 20%).
• SIMD is one measure of deprivation, not the only one.• Similar indices produced across the UK.

www.scotland.gov.uk/simd
What is it used for?
• as a statistical classification
• as an indicator to target resources and policies at small areas
• feeds into work looking at Health inequalities across Scotland
• individual domains and indicators also used. E.g. some Local Authorities use levels of income and employment deprivation to assess and monitor need.

www.scotland.gov.uk/simd

www.scotland.gov.uk/simd
The history
www.scotland.gov.uk/simd
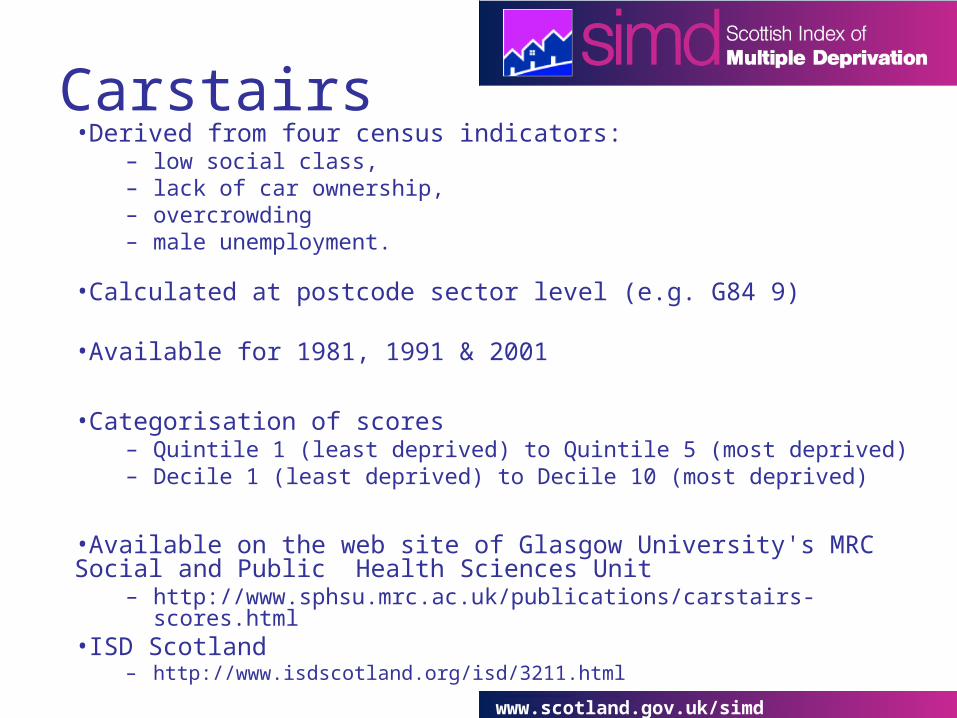
Carstairs•Derived from four census indicators:
– low social class,– lack of car ownership,– overcrowding– male unemployment.
•Calculated at postcode sector level (e.g. G84 9)
•Available for 1981, 1991 & 2001
•Categorisation of scores – Quintile 1 (least deprived) to Quintile 5 (most deprived)– Decile 1 (least deprived) to Decile 10 (most deprived)
•Available on the web site of Glasgow University's MRC Social and Public Health Sciences Unit
– http://www.sphsu.mrc.ac.uk/publications/carstairs-scores.html•ISD Scotland
– http://www.isdscotland.org/isd/3211.html

www.scotland.gov.uk/simd
SIMD 2004• Work done in house • Datazone geography• 6 aspects of deprivation (domains)
– Income – Employment– Health– Education– Access– Housing
• Data from 2001 and 2002

www.scotland.gov.uk/simd
SIMD 2006• 7 domains
– New crime domain added
• Public transport times included in access domain as sub-domain
• 37 indicators
• Data (mostly) from 2004 and 2005
• Published October 2006

www.scotland.gov.uk/simd
SIMD 2009• 7 domains
– Income– Employment– Health– Education– Access– Crime– Housing
• 38 indicators• Data (mostly) from 2007 and 2008

www.scotland.gov.uk/simd
Trend Analyses – which measure?• Trend Analyses from 1999 onwards
– SIMD 2009
• Trend Analyses back to 1991– Carstairs 2001
• Trend Analyses back to before 1991– Carstairs 1991
http://www.isdscotland.org/isd/3211.html
• Consistent Areas Through Time (CATTs)http://www.lscs.ac.uk/sls/SLSresourses.htm

www.scotland.gov.uk/simd
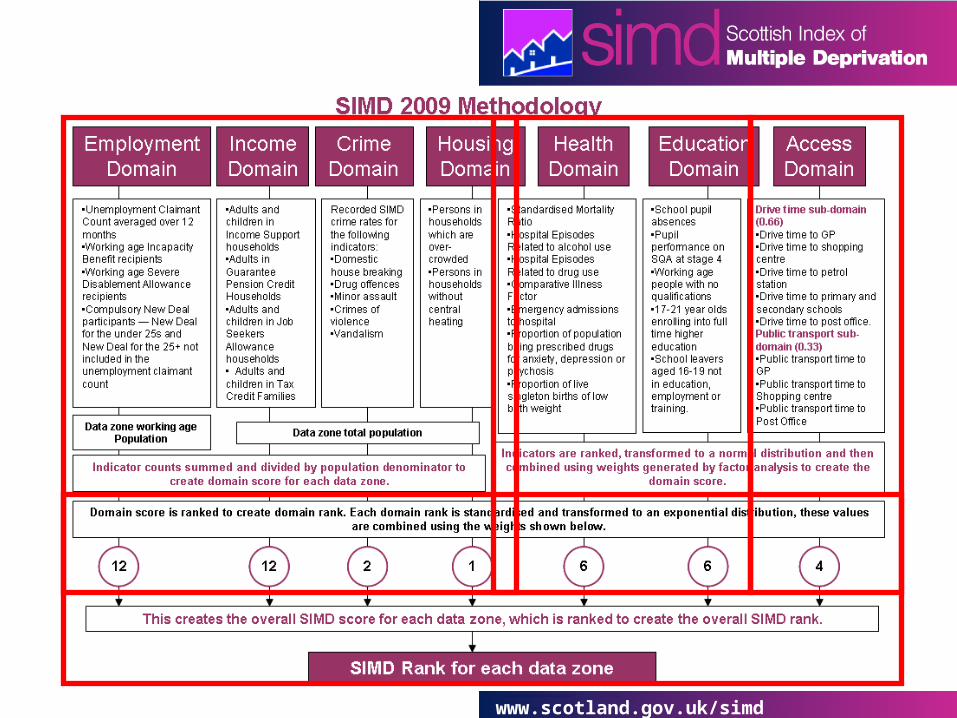
The methodology
www.scotland.gov.uk/simd
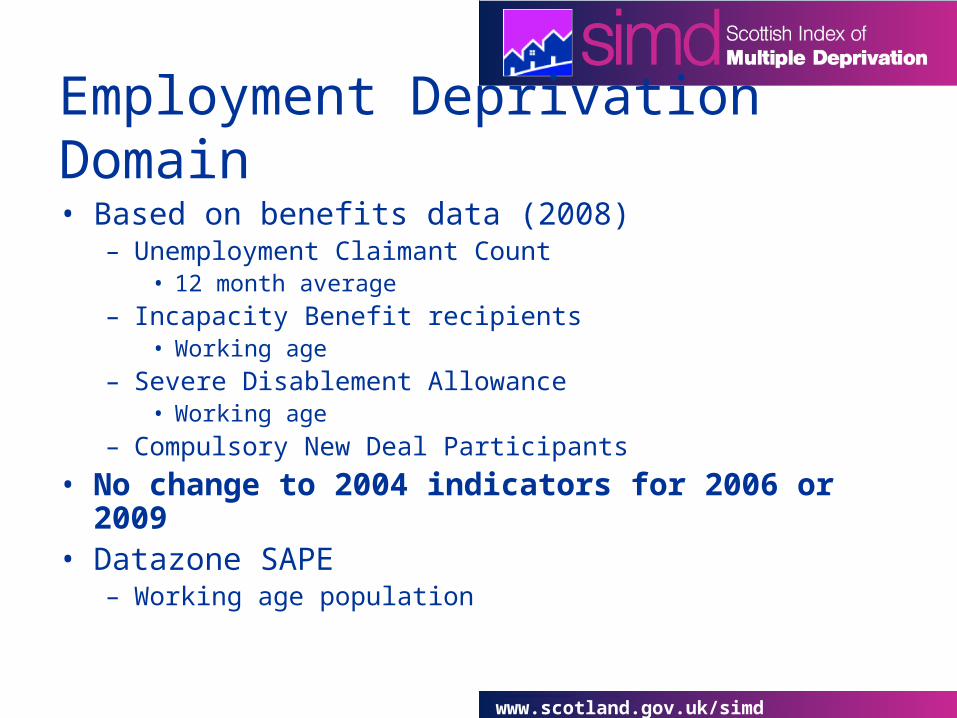
Employment Deprivation Domain
• Based on benefits data (2008)– Unemployment Claimant Count
• 12 month average
– Incapacity Benefit recipients• Working age
– Severe Disablement Allowance• Working age
– Compulsory New Deal Participants
• No change to 2004 indicators for 2006 or 2009• Datazone SAPE
– Working age population

www.scotland.gov.uk/simd
Income Deprivation Domain• Not measuring income• Based on benefits data (2008)
– Income support• adults and children
– Guarantee Pension Credit• adults
– Job Seekers Allowance• adults and children
– Child and Working Family Tax Credits• Adults and children in TC families on low incomes
• 2004 used WFTC and DTC data• 2006 did not include tax credits• Datazone SAPE
– Total population

www.scotland.gov.uk/simd
Health Deprivation Domain• Indicators used:
– Standardised Mortality Ratio*– Hospital Episodes related to alcohol use*– Hospital Episodes related to drug use*– Comparative Illness Factor*– Emergency Admissions to Hospital*– Proportion of population being prescribed drugs for anxiety,
depression or psychosis– Proportion of live singleton births of low birth weight
• *Age – Sex Standardisation• Methodological changes since 2004
– Removal of Shrinkage• Minor changes for 2009• Normalised and combined using factor analysis
Weights0.080.140.060.320.330.05
0.02
www.scotland.gov.uk/simd

www.scotland.gov.uk/simd
Some things you should know…
• The Index is relative i.e. it shows whether an area is more or less deprived than another one but not how much more or less deprived.
• The least deprived area is not the most affluent, it just lacks deprivation.
• Not everyone living in a deprived area is deprived. Nor do all deprived people live in the most deprived areas.
• There will always be 976 datazones in the 15% most deprived – if a datazone moves out another will move in.
• Changes to methodology so care is needed when comparing over time e.g. crime domain, tax credit data.
www.scotland.gov.uk/simd
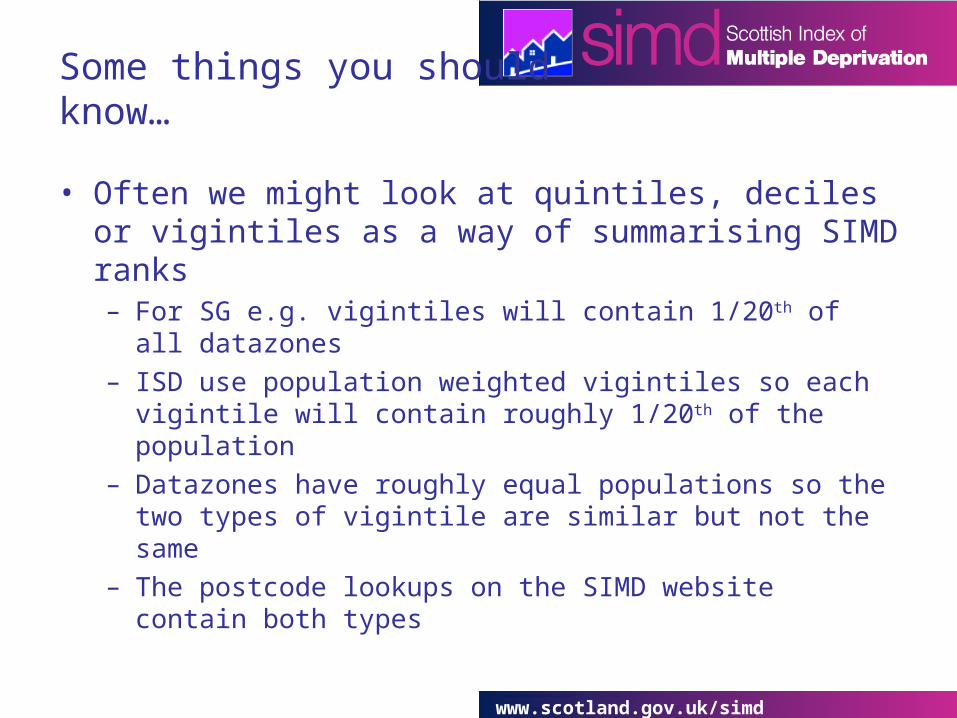
Some things you should know…
• Often we might look at quintiles, deciles or vigintiles as a way of summarising SIMD ranks– For SG e.g. vigintiles will contain 1/20th of all datazones– ISD use population weighted vigintiles so each vigintile will
contain roughly 1/20th of the population– Datazones have roughly equal populations so the two types of
vigintile are similar but not the same– The postcode lookups on the SIMD website contain both types

www.scotland.gov.uk/simd
Some CHP results
www.scotland.gov.uk/simd
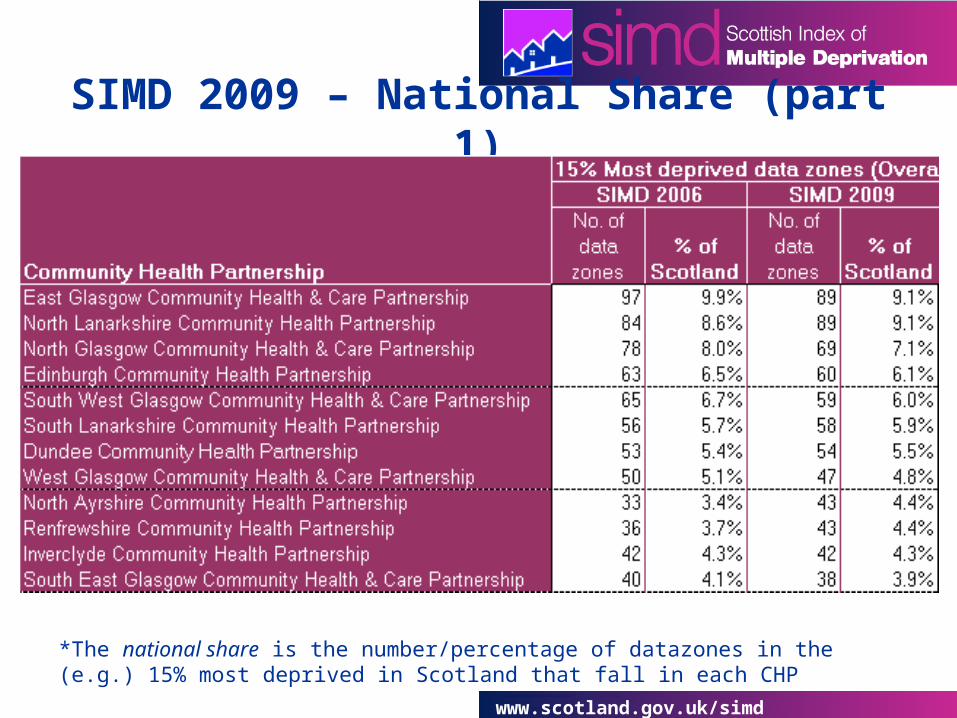
SIMD 2009 – National Share (part 1)
*The national share is the number/percentage of datazones in the (e.g.) 15% most deprived in Scotland that fall in each CHP

www.scotland.gov.uk/simd
SIMD 2009 – Local Share (part 1)
*The local share is the percentage of datazones within a CHP that fall within the (e.g.) 15% most deprived in Scotland

www.scotland.gov.uk/simd
SIMD 2009 – Income and Employment deprivation

www.scotland.gov.uk/simd
Using SIMD 2009 - SIMD website
www.scotland.gov.uk/SIMD

www.scotland.gov.uk/simd

www.scotland.gov.uk/simd
For example
• Interactive mapping
• Postcode lookup
• Datazone profiler
• Background data
• Annual updates…

www.scotland.gov.uk/simd

www.scotland.gov.uk/simd

www.scotland.gov.uk/simd
Scottish Government contactsAdvice for SG staff is available from the Small Area Statistics team on these topics:
SIMD: Andrew [email protected]
SNS: Euan Smith
General enquiries: [email protected]

www.scotland.gov.uk/simd
Geography Analysis SupportAdvice for NSS staff is available from the GAS team on these topics:
Deprivation: Richard [email protected]
Geography: Alison Burlison
Population/SNS*: Andy Gasiorowski [email protected]
*Scottish Neighbourhood Statistics

www.scotland.gov.uk/simd
ANY QUESTIONS?