www.scotland.gov.uk/simd scottish index of multiple deprivation (simd) 2009 dumfries & galloway...
TRANSCRIPT

www.scotland.gov.uk/simd
Scottish Index of Multiple Deprivation (SIMD) 2009
Dumfries & Galloway
Andrew WhiteOffice of the Chief Statistician
05th February 2010
www.scotland.gov.uk/simd
SIMD 2009
• Background to SIMD• Points to watch• Results
• Overall• Dumfries & Galloway
• Interactive mapping• Where to go for more information
www.scotland.gov.uk/simd
What is the SIMD?• The Scottish Index of Multiple Deprivation
identifies small area concentrations of multiple deprivation across all of Scotland
• Relative measure ranking the 6,505 datazones in Scotland from 1 being most deprived to 6,505 being the least deprived
www.scotland.gov.uk/simd
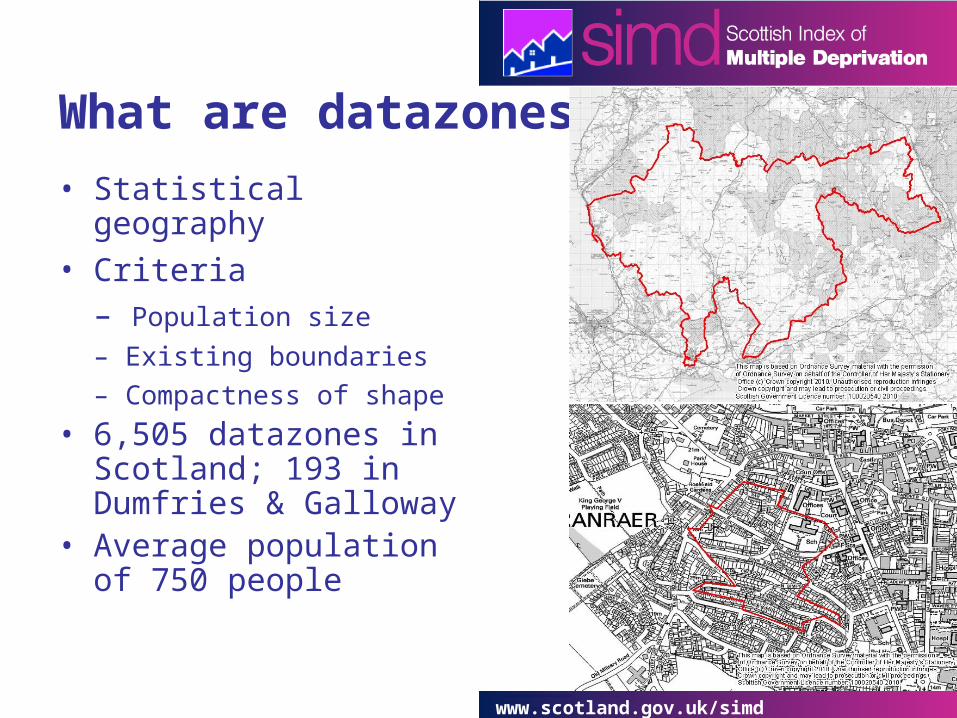
What are datazones?
• Statistical geography
• Criteria
– Population size
– Existing boundaries
– Compactness of shape
• 6,505 datazones in Scotland; 193 in Dumfries & Galloway
• Average population of 750 people
www.scotland.gov.uk/simd
What is the SIMD?• The Scottish Index of Multiple Deprivation
identifies small area concentrations of multiple deprivation across all of Scotland
• Relative measure ranking the 6,505 datazones in Scotland from 1 being most deprived to 6,505 being the least deprived
• Uses include– Allocation of Fairer Scotland Fund– Targeting of resources by Local Authorities
www.scotland.gov.uk/simd
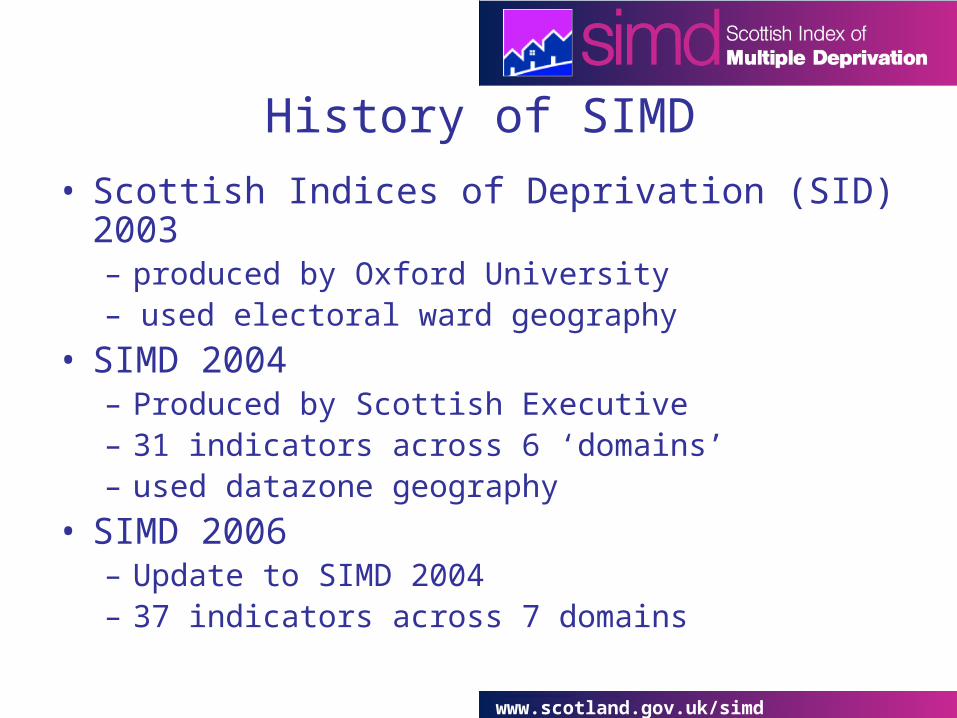
History of SIMD
• Scottish Indices of Deprivation (SID) 2003– produced by Oxford University – used electoral ward geography
• SIMD 2004 – Produced by Scottish Executive– 31 indicators across 6 ‘domains’– used datazone geography
• SIMD 2006– Update to SIMD 2004– 37 indicators across 7 domains
www.scotland.gov.uk/simd
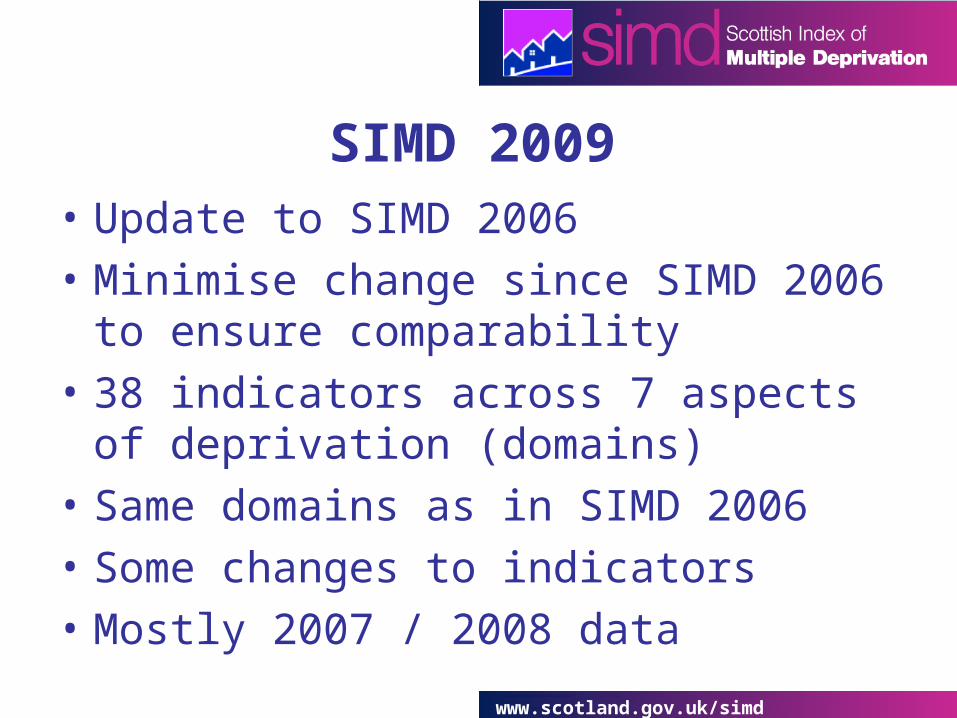
SIMD 2009• Update to SIMD 2006
• Minimise change since SIMD 2006 to ensure comparability
• 38 indicators across 7 aspects of deprivation (domains)
• Same domains as in SIMD 2006
• Some changes to indicators
• Mostly 2007 / 2008 data
www.scotland.gov.uk/simd
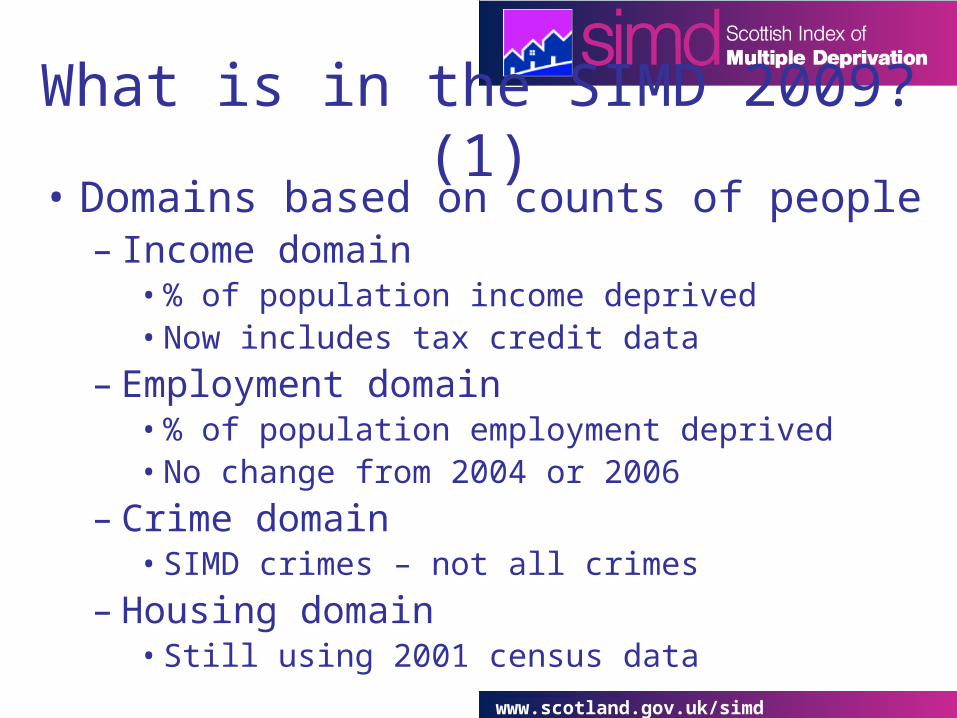
What is in the SIMD 2009? (1)• Domains based on counts of people
– Income domain• % of population income deprived• Now includes tax credit data
– Employment domain • % of population employment deprived• No change from 2004 or 2006
– Crime domain• SIMD crimes – not all crimes
– Housing domain• Still using 2001 census data
www.scotland.gov.uk/simd
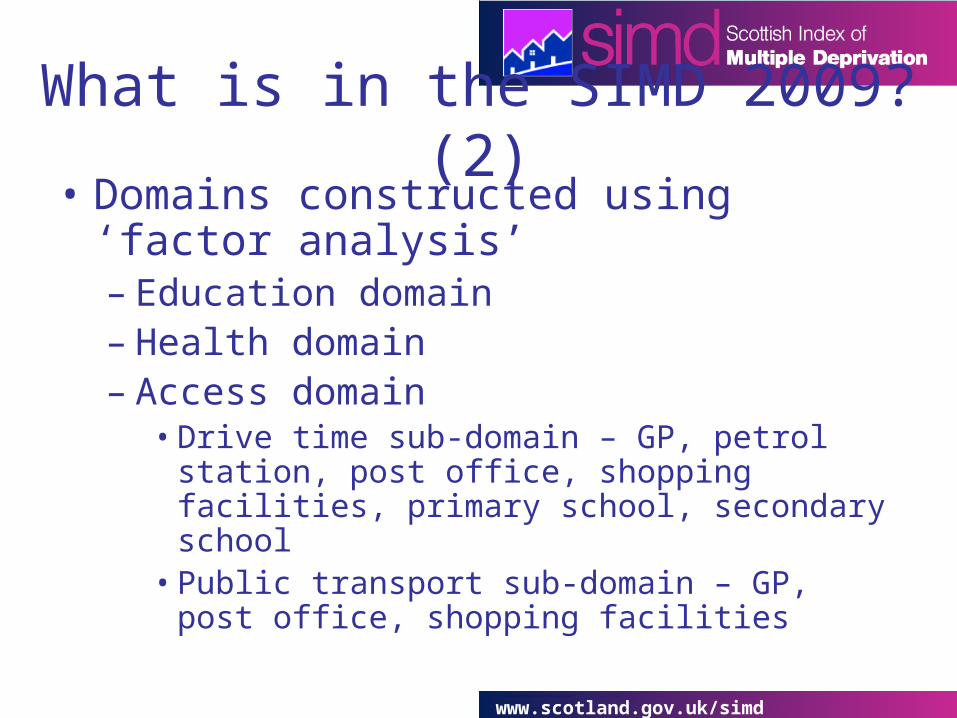
• Domains constructed using ‘factor analysis’– Education domain– Health domain – Access domain
• Drive time sub-domain – GP, petrol station, post office, shopping facilities, primary school, secondary school
• Public transport sub-domain – GP, post office, shopping facilities
What is in the SIMD 2009? (2)

www.scotland.gov.uk/simd
How is the SIMD constructed?• Combine the rankings in each domain
using the weightings:– Income 28%– Employment 28%– Health 14%– Education 14%– Access 9%– Crime 5%– Housing 2%
www.scotland.gov.uk/simd
Points to watch• The Index is relative i.e. shows an area is more
or less deprived than another one but not how much more or less deprived.
• There will always be 976 datazones in the 15% most deprived – if a datazone moves out another will move in.
• The least deprived area is not the most affluent, it just lacks deprivation e.g. in the income domain there is a lack of benefit claimants.
• Not everyone living in a deprived area is deprived, and not all deprived people live in the most deprived areas.
www.scotland.gov.uk/simd
More points to watch• Data from 2007 and 2008 means the recent economic
downturn not picked up but it is unlikely to have a large effect on the relative differences across Scotland.
• Changes to methodology so care is needed when comparing over time e.g. crime domain, tax credit data.
• No datazones in the 15% most deprived does not mean no deprivation, just no concentrations of multiple deprivation
• Index identifies deprived datazones in both urban and rural areas - just fewer concentrations of multiple deprivation and more mixed populations.

www.scotland.gov.uk/simd
Headline findings• Improvements in Glasgow
www.scotland.gov.uk/simd
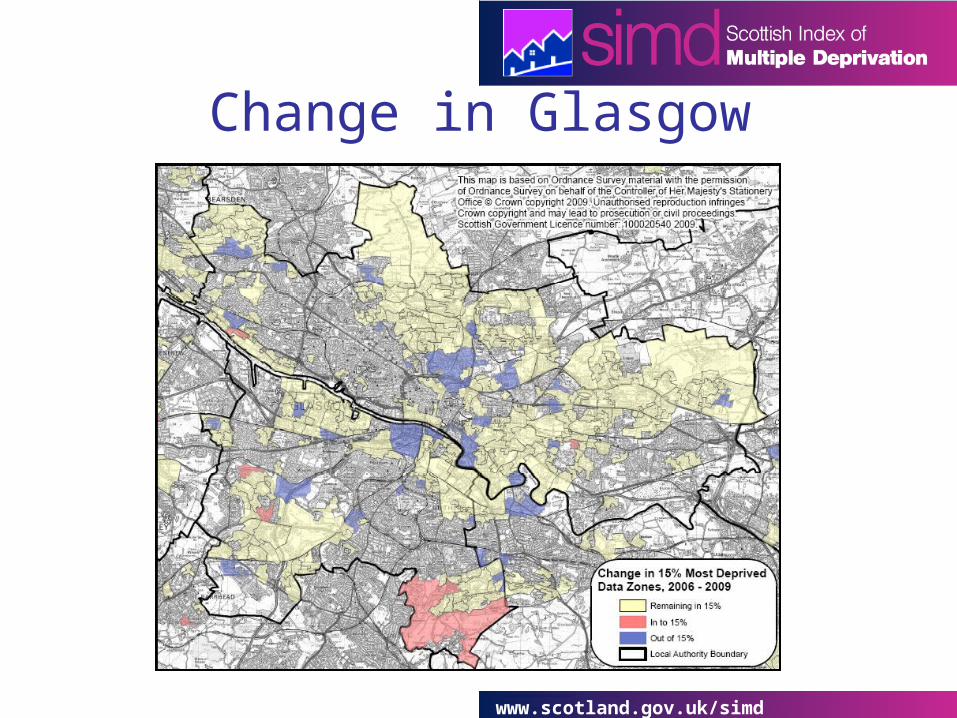
Change in Glasgow
www.scotland.gov.uk/simd
Headline findings• Improvements in Glasgow• Concentrations of multiple deprivation becoming
more spread out geographically• Concentrations of deprivation in most deprived
datazones reduced slightly• 101 datazones moved into 15% MD and 101
moved out - Movement between 10-15% and 15-20% bands.
• 4 in 5 datazones that moved out between 04 and 06 stayed out.
• 4 in 5 datazones in 15% in SIMD 09 have been in on both SIMD 04 and SIMD 06
www.scotland.gov.uk/simd
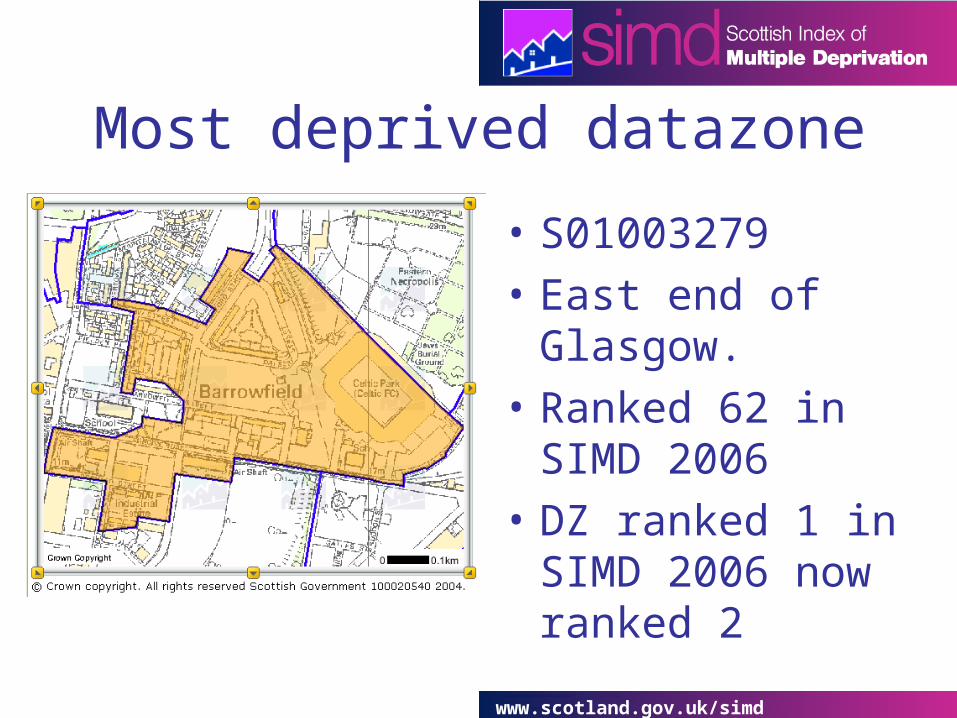
Most deprived datazone
• S01003279
• East end of Glasgow.
• Ranked 62 in SIMD 2006
• DZ ranked 1 in SIMD 2006 now ranked 2
www.scotland.gov.uk/simd
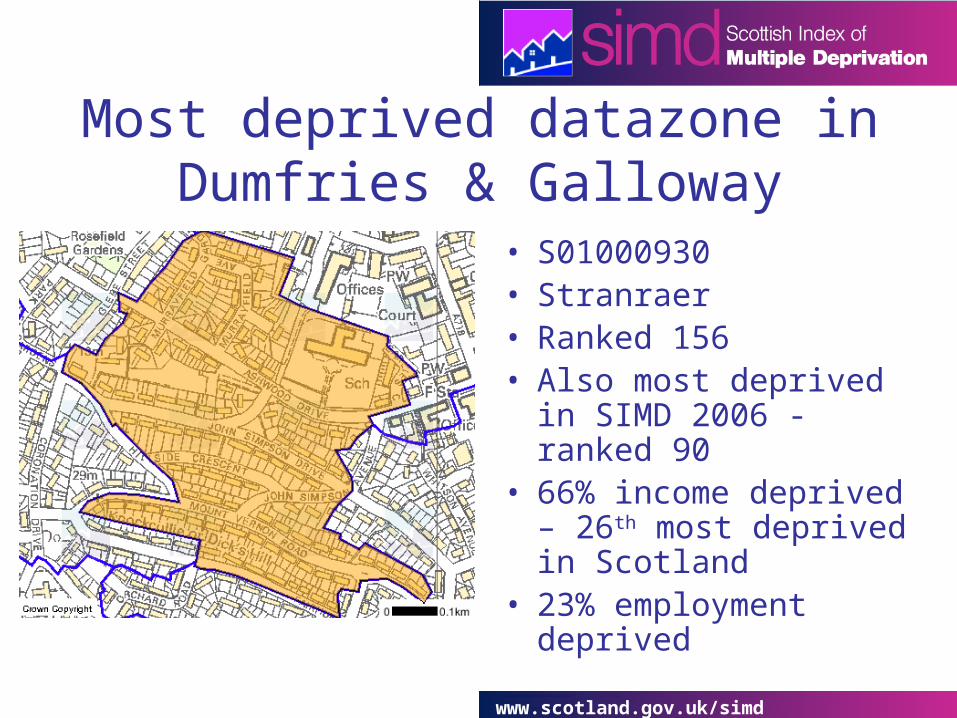
Most deprived datazone in Dumfries & Galloway
• S01000930• Stranraer• Ranked 156• Also most deprived in
SIMD 2006 - ranked 90 • 66% income deprived –
26th most deprived in Scotland
• 23% employment deprived
www.scotland.gov.uk/simd
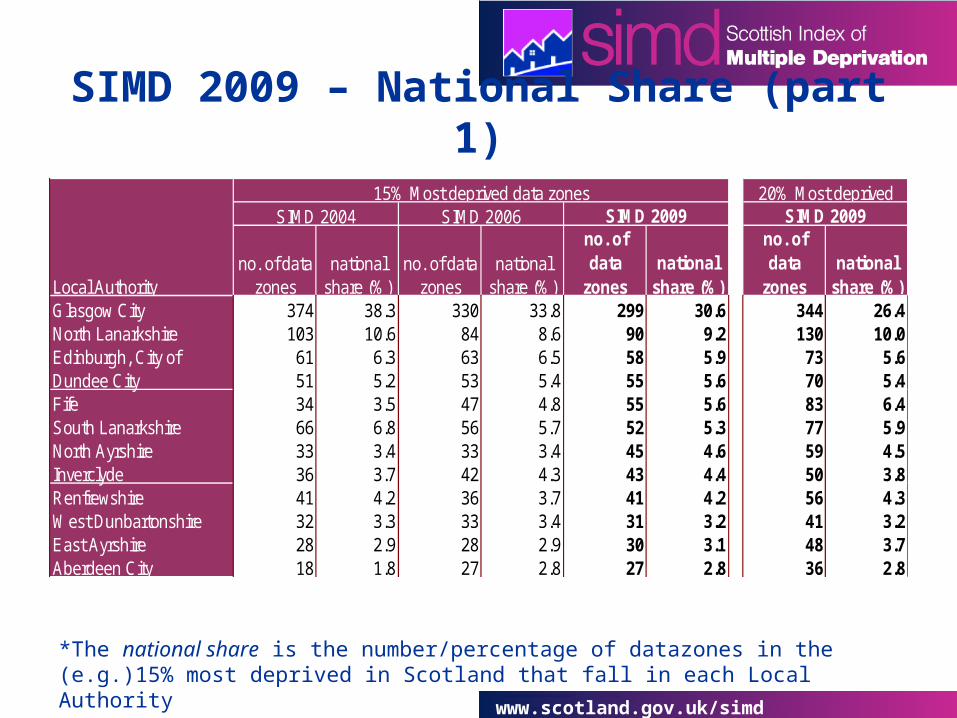
SIMD 2009 – National Share (part 1)
*The national share is the number/percentage of datazones in the (e.g.)15% most deprived in Scotland that fall in each Local Authority
no. of data zones
national share (%)
no. of data zones
national share (%)
no. of data
zonesnational
share (%)
no. of data
zonesnational
share (%)Glasgow City 374 38.3 330 33.8 299 30.6 344 26.4North Lanarkshire 103 10.6 84 8.6 90 9.2 130 10.0Edinburgh, City of 61 6.3 63 6.5 58 5.9 73 5.6Dundee City 51 5.2 53 5.4 55 5.6 70 5.4Fife 34 3.5 47 4.8 55 5.6 83 6.4South Lanarkshire 66 6.8 56 5.7 52 5.3 77 5.9North Ayrshire 33 3.4 33 3.4 45 4.6 59 4.5Inverclyde 36 3.7 42 4.3 43 4.4 50 3.8Renfrewshire 41 4.2 36 3.7 41 4.2 56 4.3West Dunbartonshire 32 3.3 33 3.4 31 3.2 41 3.2East Ayrshire 28 2.9 28 2.9 30 3.1 48 3.7Aberdeen City 18 1.8 27 2.8 27 2.8 36 2.8
20% Most deprived SIMD 2009
Local Authority
15% Most deprived data zonesSIMD 2004 SIMD 2006 SIMD 2009
www.scotland.gov.uk/simd
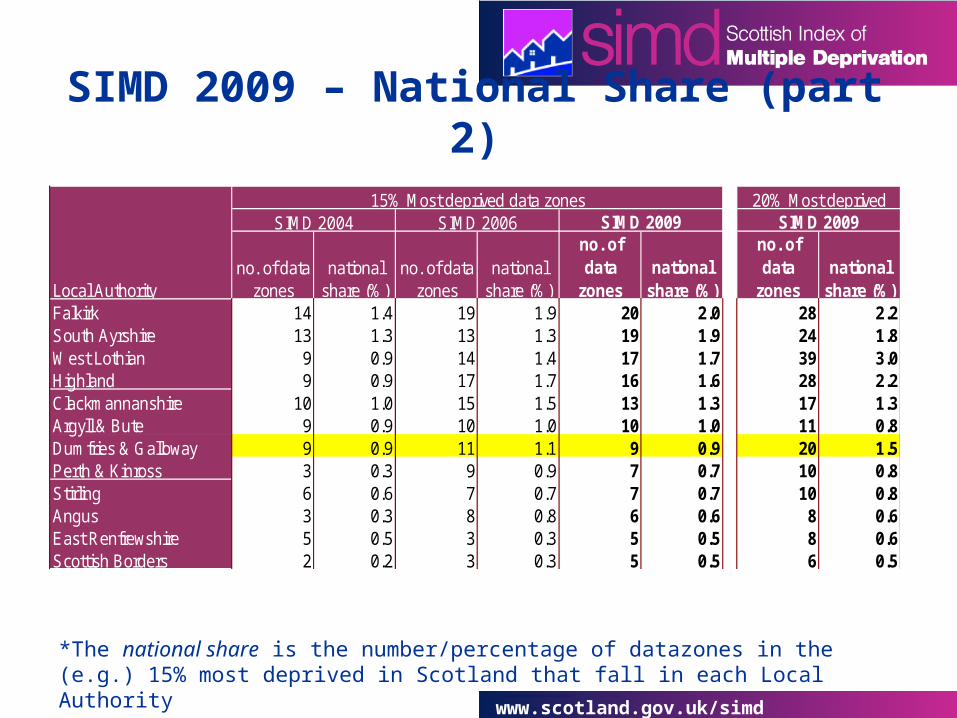
SIMD 2009 – National Share (part 2)
*The national share is the number/percentage of datazones in the (e.g.) 15% most deprived in Scotland that fall in each Local Authority
no. of data zones
national share (%)
no. of data zones
national share (%)
no. of data
zonesnational
share (%)
no. of data
zonesnational
share (%)Falkirk 14 1.4 19 1.9 20 2.0 28 2.2South Ayrshire 13 1.3 13 1.3 19 1.9 24 1.8West Lothian 9 0.9 14 1.4 17 1.7 39 3.0Highland 9 0.9 17 1.7 16 1.6 28 2.2Clackmannanshire 10 1.0 15 1.5 13 1.3 17 1.3Argyll & Bute 9 0.9 10 1.0 10 1.0 11 0.8Dumfries & Galloway 9 0.9 11 1.1 9 0.9 20 1.5Perth & Kinross 3 0.3 9 0.9 7 0.7 10 0.8Stirling 6 0.6 7 0.7 7 0.7 10 0.8Angus 3 0.3 8 0.8 6 0.6 8 0.6East Renfrewshire 5 0.5 3 0.3 5 0.5 8 0.6Scottish Borders 2 0.2 3 0.3 5 0.5 6 0.5
20% Most deprived SIMD 2009
Local Authority
15% Most deprived data zonesSIMD 2004 SIMD 2006 SIMD 2009
www.scotland.gov.uk/simd
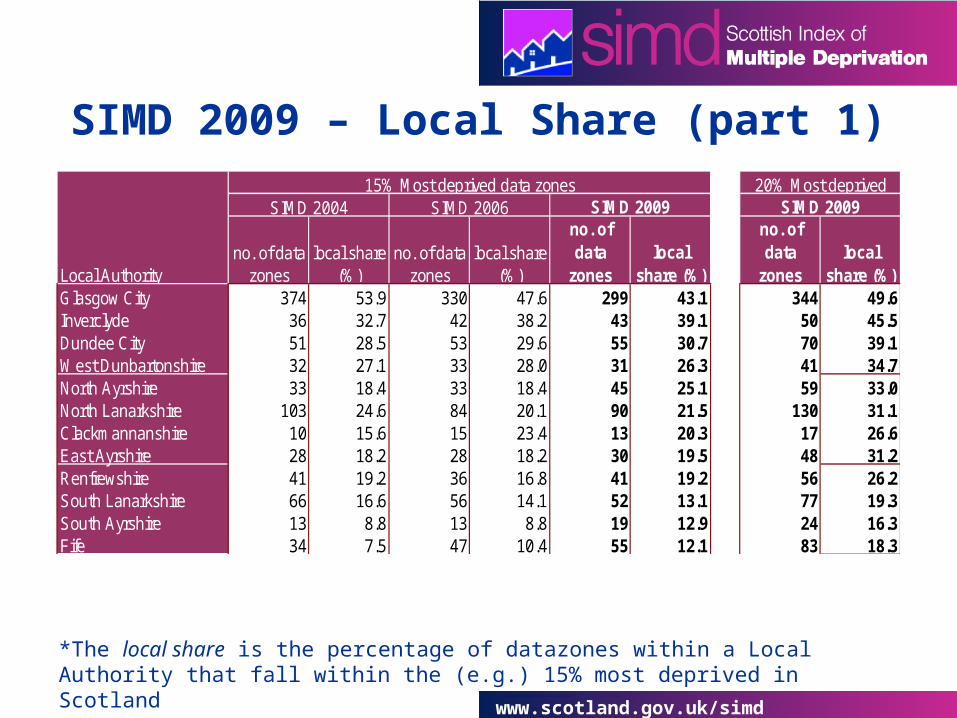
SIMD 2009 – Local Share (part 1)
*The local share is the percentage of datazones within a Local Authority that fall within the (e.g.) 15% most deprived in Scotland
no. of data zones
local share (%)
no. of data zones
local share (%)
no. of data
zoneslocal
share (%)
no. of data
zoneslocal
share (%)Glasgow City 374 53.9 330 47.6 299 43.1 344 49.6Inverclyde 36 32.7 42 38.2 43 39.1 50 45.5Dundee City 51 28.5 53 29.6 55 30.7 70 39.1West Dunbartonshire 32 27.1 33 28.0 31 26.3 41 34.7North Ayrshire 33 18.4 33 18.4 45 25.1 59 33.0North Lanarkshire 103 24.6 84 20.1 90 21.5 130 31.1Clackmannanshire 10 15.6 15 23.4 13 20.3 17 26.6East Ayrshire 28 18.2 28 18.2 30 19.5 48 31.2Renfrewshire 41 19.2 36 16.8 41 19.2 56 26.2South Lanarkshire 66 16.6 56 14.1 52 13.1 77 19.3South Ayrshire 13 8.8 13 8.8 19 12.9 24 16.3Fife 34 7.5 47 10.4 55 12.1 83 18.3
20% Most deprived SIMD 2009
Local Authority
15% Most deprived data zonesSIMD 2004 SIMD 2006 SIMD 2009
www.scotland.gov.uk/simd
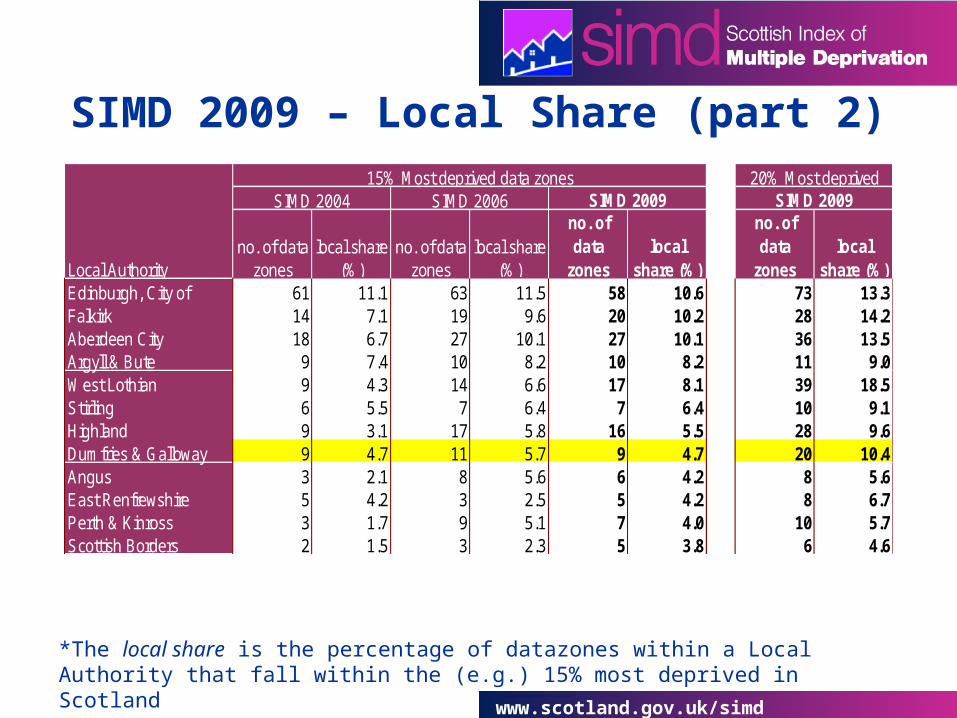
SIMD 2009 – Local Share (part 2)
*The local share is the percentage of datazones within a Local Authority that fall within the (e.g.) 15% most deprived in Scotland
no. of data zones
local share (%)
no. of data zones
local share (%)
no. of data
zoneslocal
share (%)
no. of data
zoneslocal
share (%)Edinburgh, City of 61 11.1 63 11.5 58 10.6 73 13.3Falkirk 14 7.1 19 9.6 20 10.2 28 14.2Aberdeen City 18 6.7 27 10.1 27 10.1 36 13.5Argyll & Bute 9 7.4 10 8.2 10 8.2 11 9.0West Lothian 9 4.3 14 6.6 17 8.1 39 18.5Stirling 6 5.5 7 6.4 7 6.4 10 9.1Highland 9 3.1 17 5.8 16 5.5 28 9.6Dumfries & Galloway 9 4.7 11 5.7 9 4.7 20 10.4Angus 3 2.1 8 5.6 6 4.2 8 5.6East Renfrewshire 5 4.2 3 2.5 5 4.2 8 6.7Perth & Kinross 3 1.7 9 5.1 7 4.0 10 5.7Scottish Borders 2 1.5 3 2.3 5 3.8 6 4.6
20% Most deprived SIMD 2009
Local Authority
15% Most deprived data zonesSIMD 2004 SIMD 2006 SIMD 2009
www.scotland.gov.uk/simd
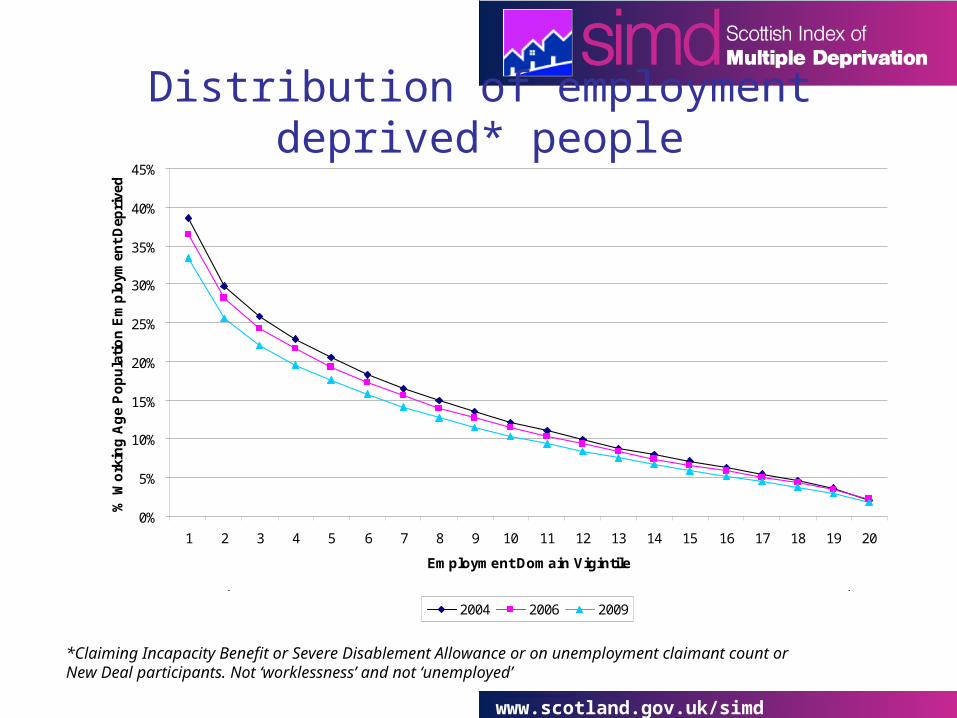
Distribution of employment deprived* people
0%
5%
10%
15%
20%
25%
30%
35%
40%
45%
1 2 3 4 5 6 7 8 9 10 11 12 13 14 15 16 17 18 19 20
Employment Domain Vigintile
% W
ork
ing
Ag
e P
op
ula
tio
n E
mp
loym
ent
Dep
rive
d
2004 2006 2009
Most Deprived Least Deprived
*Claiming Incapacity Benefit or Severe Disablement Allowance or on unemployment claimant count orNew Deal participants. Not ‘worklessness’ and not ‘unemployed’

www.scotland.gov.uk/simd
Results for Dumfries & Galloway
www.scotland.gov.uk/simd
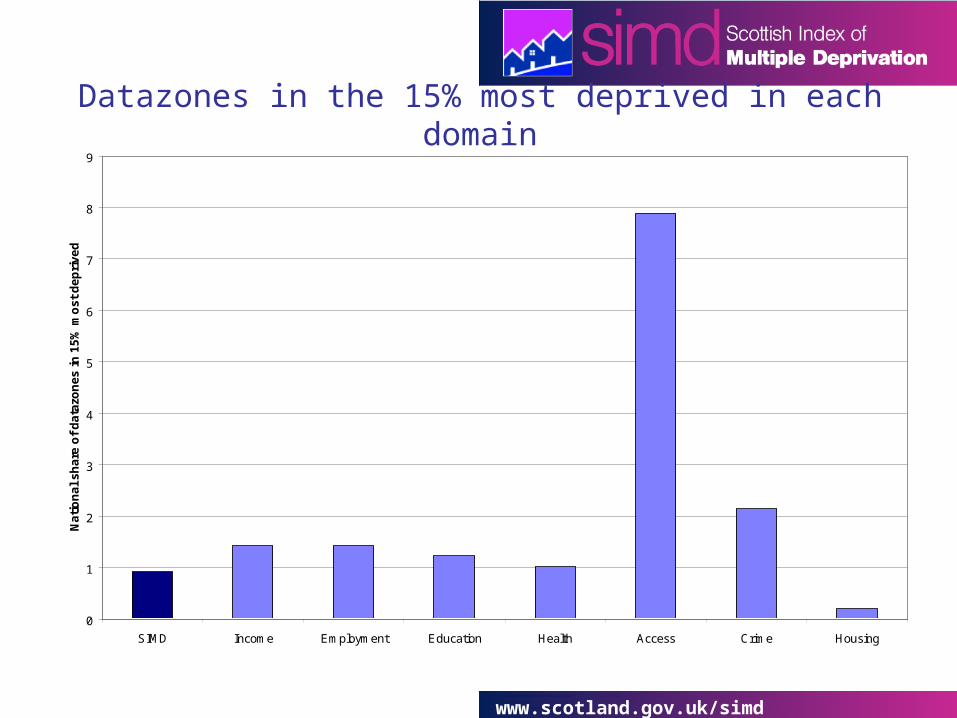
Key Points• 9 Dumfries & Galloway datazones in the 15% most
deprived, 20 in the 20% most deprived.
www.scotland.gov.uk/simd
Datazones in the 15% most deprived in each domain
0
1
2
3
4
5
6
7
8
9
SIMD Income Employment Education Health Access Crime Housing
Na
tio
na
l s
ha
re o
f d
ata
zon
es
in
15
% m
os
t d
ep
riv
ed
www.scotland.gov.uk/simd
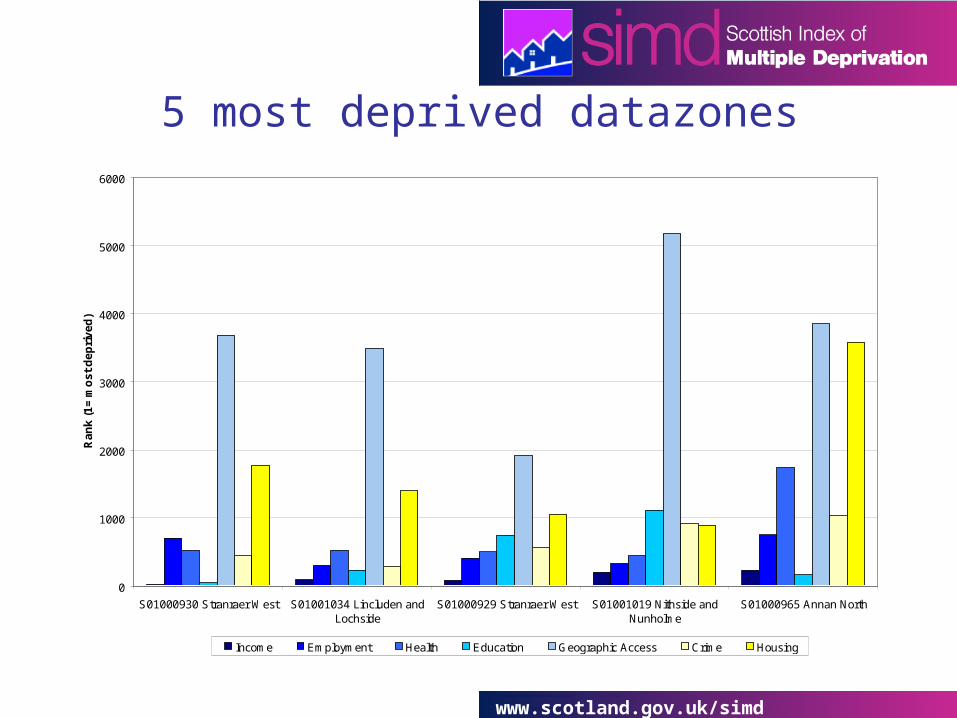
5 most deprived datazones
0
1000
2000
3000
4000
5000
6000
S01000930 Stranraer West S01001034 Lincluden andLochside
S01000929 Stranraer West S01001019 Nithside andNunholme
S01000965 Annan North
Ra
nk
(1
= m
os
t d
ep
riv
ed
)
Income Employment Health Education Geographic Access Crime Housing
www.scotland.gov.uk/simd
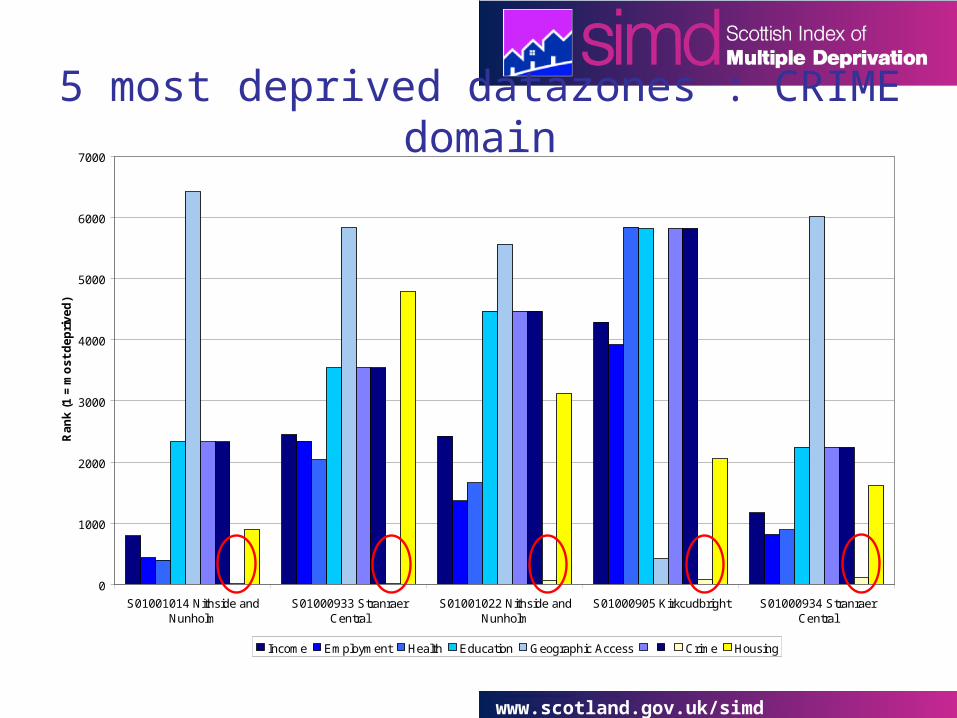
5 most deprived datazones : CRIME domain
0
1000
2000
3000
4000
5000
6000
7000
S01001014 Nithside andNunholm
S01000933 StranraerCentral
S01001022 Nithside andNunholm
S01000905 Kirkcudbright S01000934 StranraerCentral
Ra
nk
(1
= m
os
t d
ep
riv
ed
)
Income Employment Health Education Geographic Access Crime Housing
www.scotland.gov.uk/simd
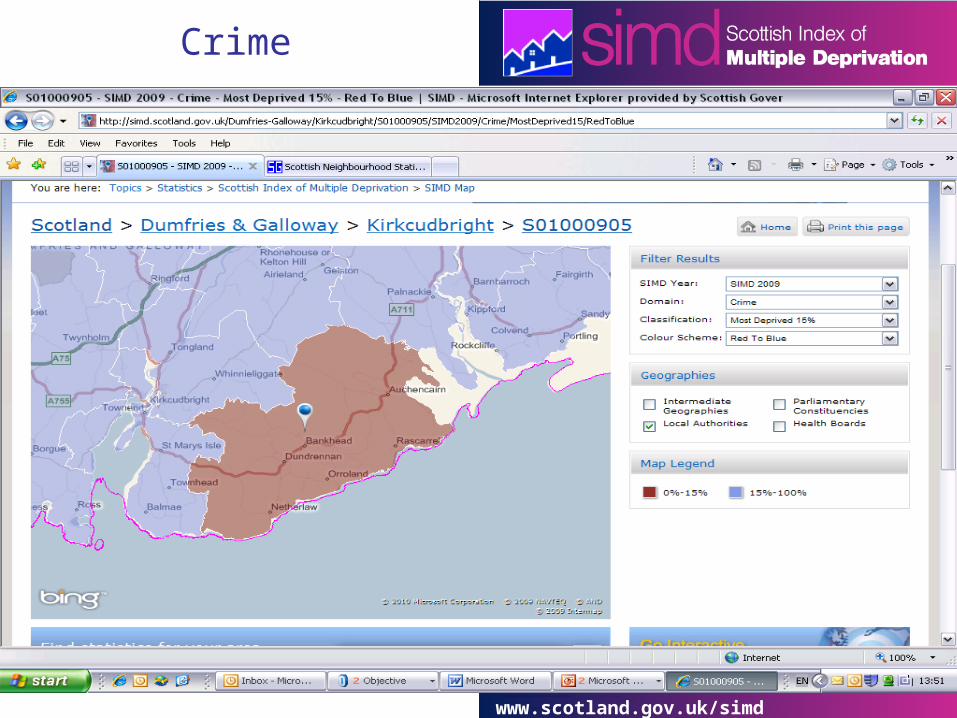
Crime
www.scotland.gov.uk/simd
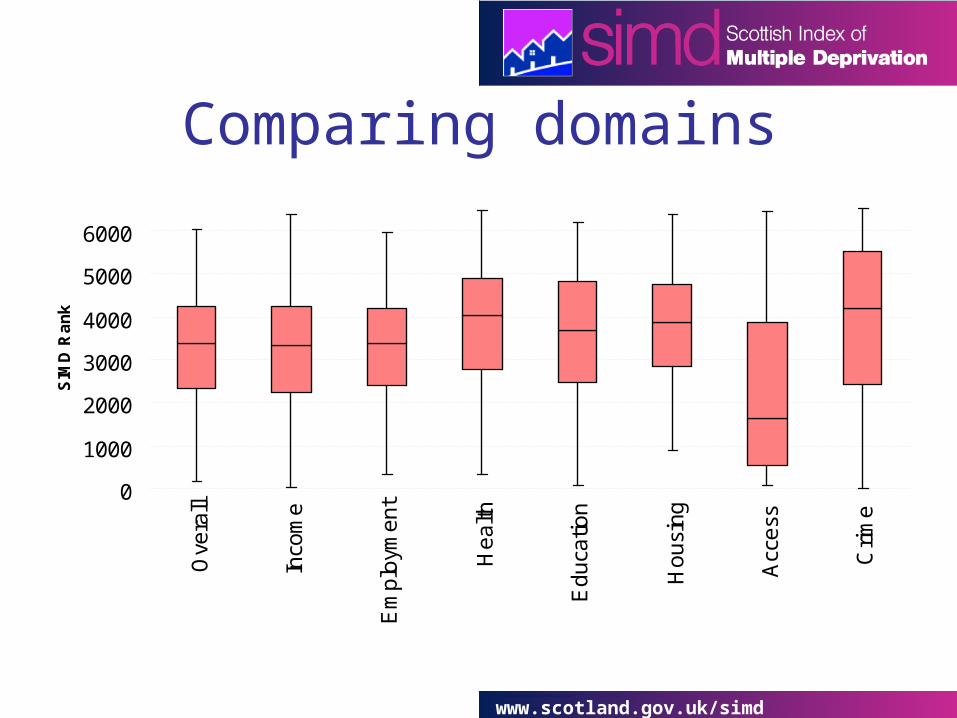
Comparing domains
0
1000
2000
3000
4000
5000
6000
Ove
rall
Inco
me
Em
plo
yme
nt
He
alth
Ed
uca
tion
Ho
usi
ng
Acc
ess
Cri
me
SIM
D R
an
k
www.scotland.gov.uk/simd
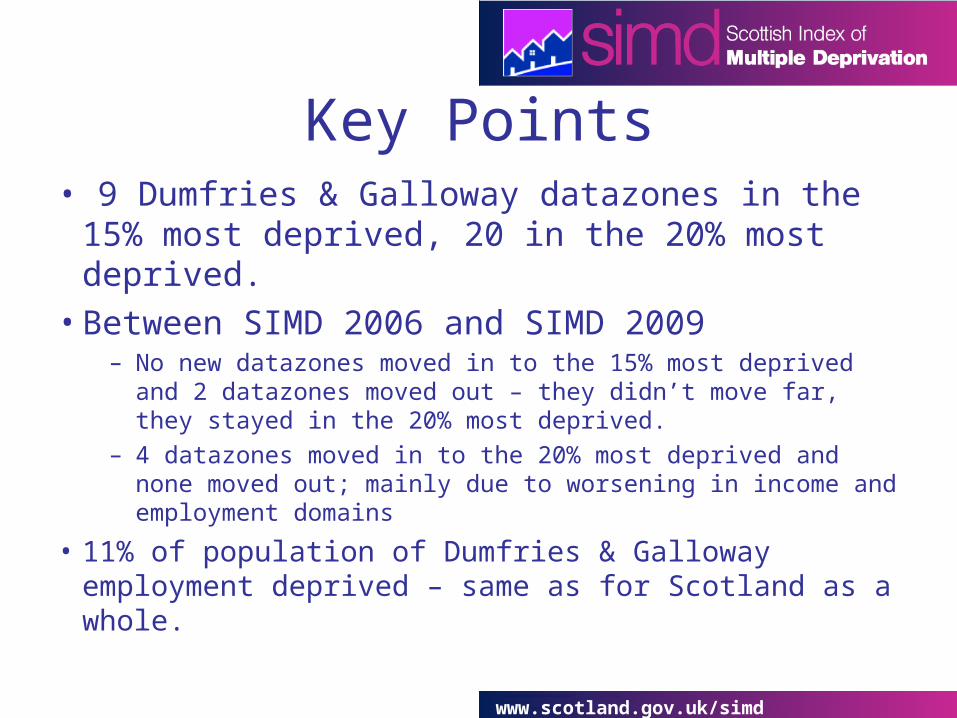
Key Points• 9 Dumfries & Galloway datazones in the 15%
most deprived, 20 in the 20% most deprived.• Between SIMD 2006 and SIMD 2009
– No new datazones moved in to the 15% most deprived and 2 datazones moved out between SIMD 2006 and SIMD 2009 – they didn’t move far, they stayed in the 20% most deprived.
www.scotland.gov.uk/simd
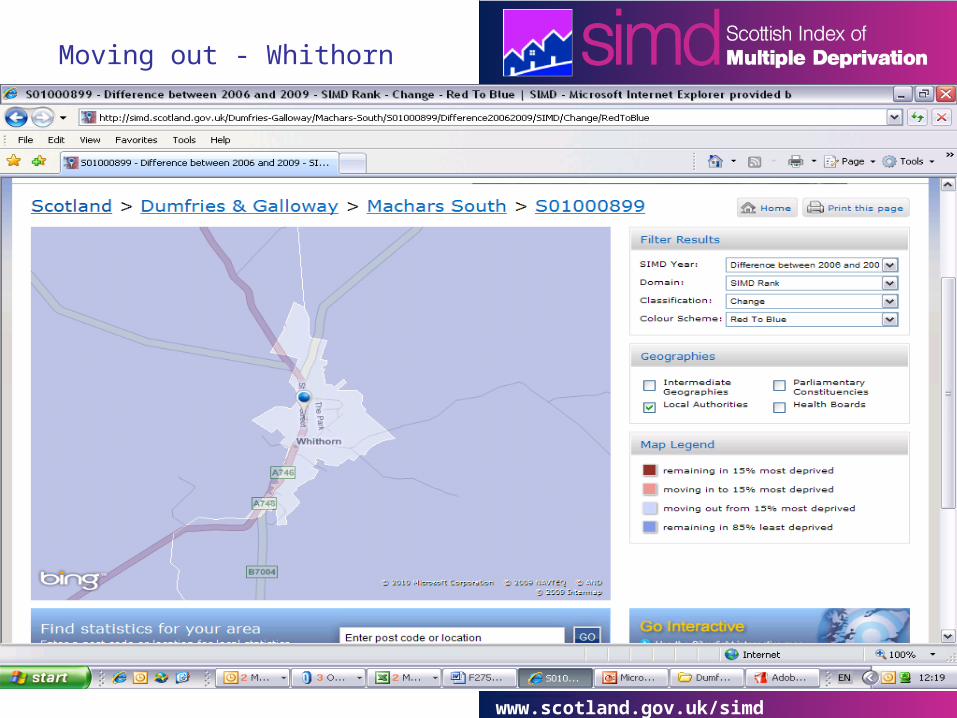
Moving out - Whithorn
www.scotland.gov.uk/simd
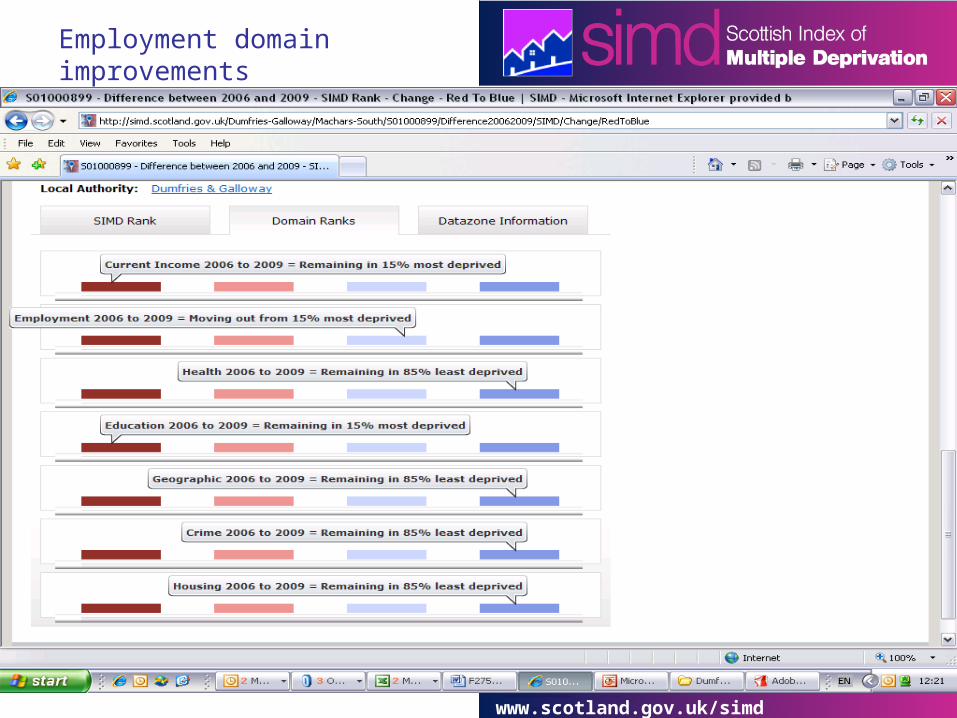
Employment domain improvements
www.scotland.gov.uk/simd
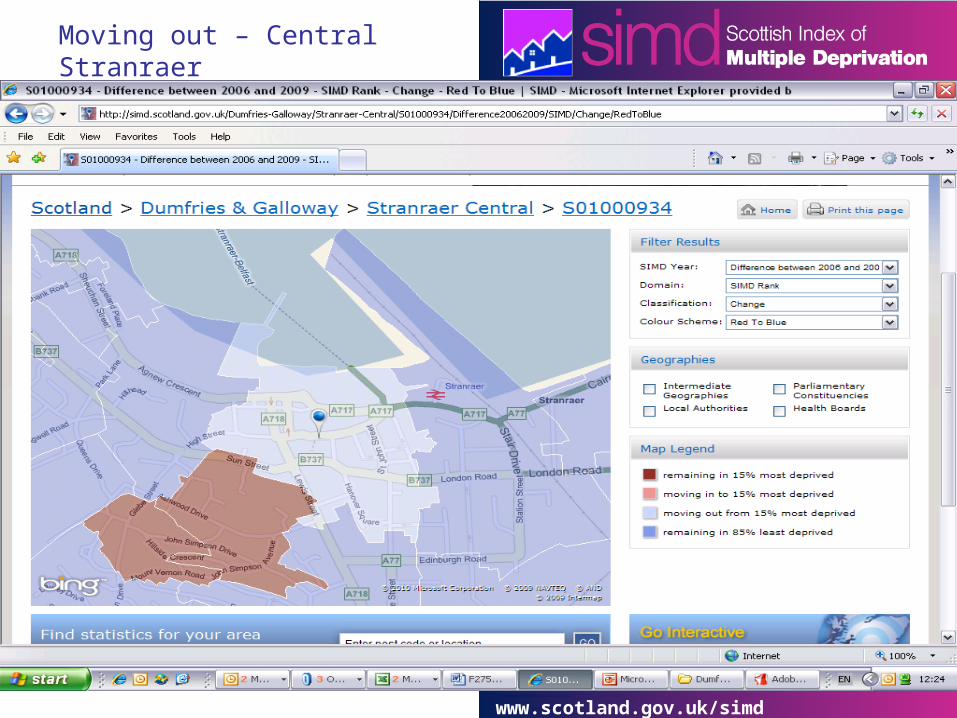
Moving out – Central Stranraer
www.scotland.gov.uk/simd
Key Points• 9 Dumfries & Galloway datazones in the 15%
most deprived, 20 in the 20% most deprived.• Between SIMD 2006 and SIMD 2009
– No new datazones moved in to the 15% most deprived and 2 datazones moved out – they didn’t move far, they stayed in the 20% most deprived.
– 4 datazones moved in to the 20% most deprived and none moved out; mainly due to worsening in income and employment domains
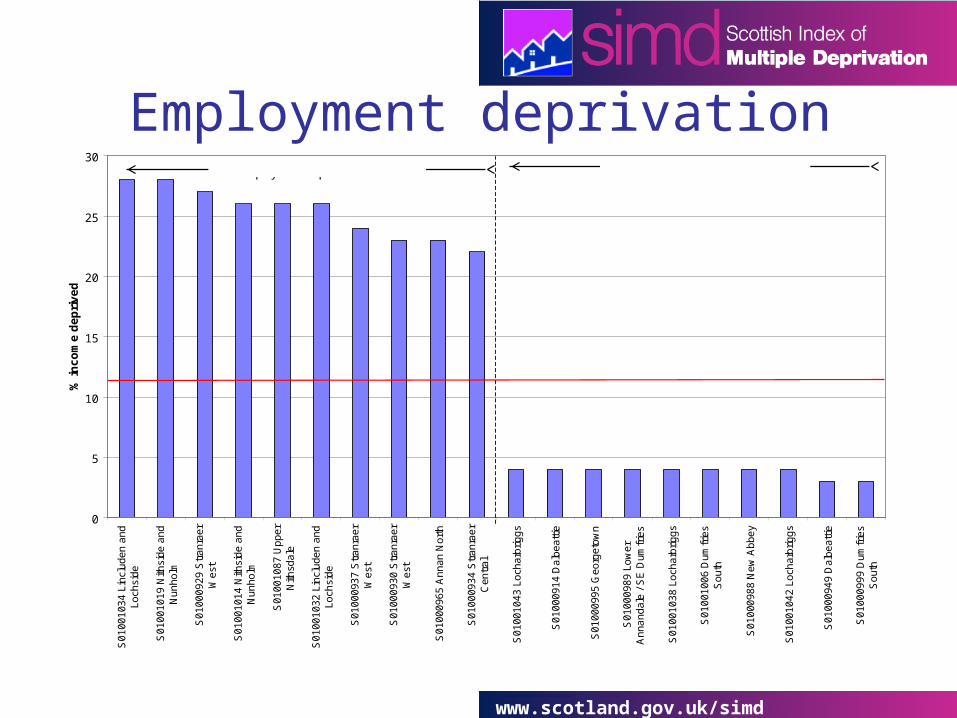
• 11% of population of Dumfries & Galloway employment deprived – same as for Scotland as a whole.
www.scotland.gov.uk/simd
Employment deprivation
0
5
10
15
20
25
30
S0
10
01
03
4 L
incl
ud
en
an
dL
och
sid
e
S0
10
01
01
9 N
ithsi
de
an
dN
un
ho
lm
S0
10
00
92
9 S
tra
nra
er
We
st
S0
10
01
01
4 N
ithsi
de
an
dN
un
ho
lm
S0
10
01
08
7 U
pp
er
Nith
sda
le
S0
10
01
03
2 L
incl
ud
en
an
dL
och
sid
e
S0
10
00
93
7 S
tra
nra
er
We
st
S0
10
00
93
0 S
tra
nra
er
We
st
S0
10
00
96
5 A
nn
an
No
rth
S0
10
00
93
4 S
tra
nra
er
Ce
ntr
al
S0
10
01
04
3 L
och
arb
rig
gs
S0
10
00
91
4 D
alb
ea
ttie
S0
10
00
99
5 G
eo
rge
tow
n
S0
10
00
98
9 L
ow
er
An
na
nd
ale
/ S
E D
um
frie
s
S0
10
01
03
8 L
och
arb
rig
gs
S0
10
01
00
6 D
um
frie
sS
ou
th
S0
10
00
98
8 N
ew
Ab
be
y
S0
10
01
04
2 L
och
arb
rig
gs
S0
10
00
94
9 D
alb
ea
ttie
S0
10
00
99
9 D
um
frie
sS
ou
th
% i
nc
om
e d
ep
riv
ed
Most employment deprived datazones Least employment deprived datazones
www.scotland.gov.uk/simd
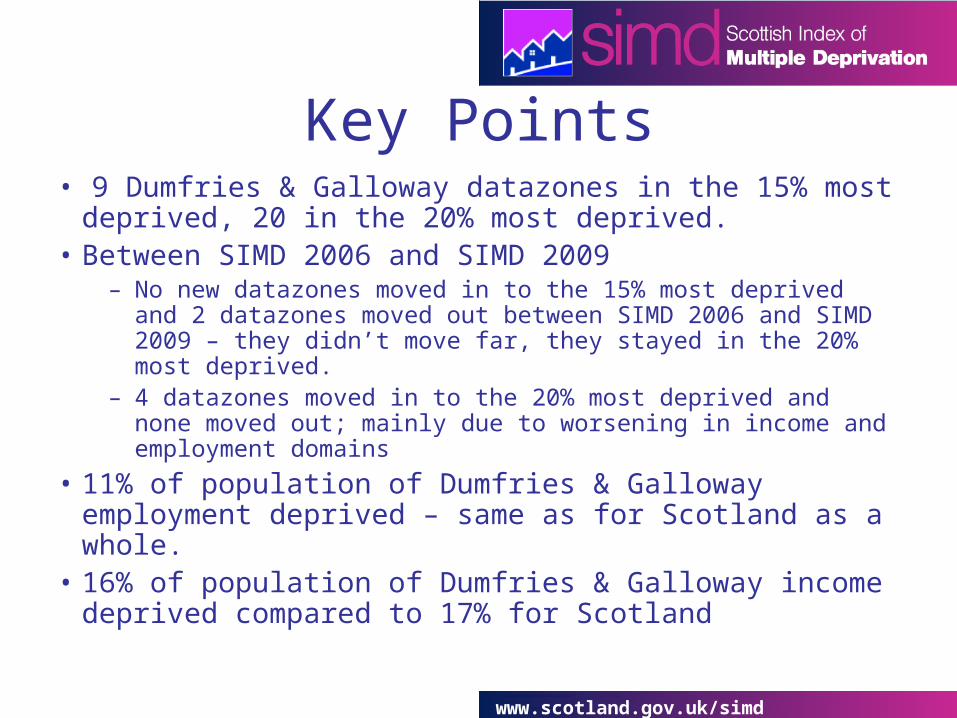
Key Points• 9 Dumfries & Galloway datazones in the 15% most
deprived, 20 in the 20% most deprived.• Between SIMD 2006 and SIMD 2009
– No new datazones moved in to the 15% most deprived and 2 datazones moved out between SIMD 2006 and SIMD 2009 – they didn’t move far, they stayed in the 20% most deprived.
– 4 datazones moved in to the 20% most deprived and none moved out; mainly due to worsening in income and employment domains
• 11% of population of Dumfries & Galloway employment deprived – same as for Scotland as a whole.
• 16% of population of Dumfries & Galloway income deprived compared to 17% for Scotland
www.scotland.gov.uk/simd
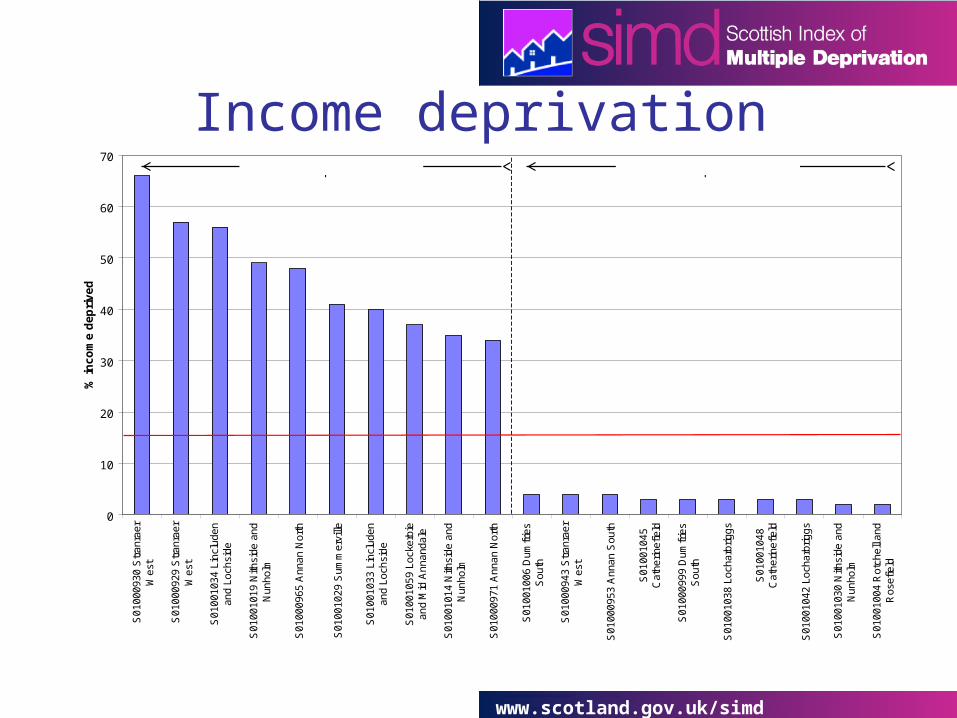
Income deprivation
0
10
20
30
40
50
60
70
S0
10
00
93
0 S
tra
nra
er
We
st
S0
10
00
92
9 S
tra
nra
er
We
st
S0
10
01
03
4 L
incl
ud
en
an
d L
och
sid
e
S0
10
01
01
9 N
ithsi
de
an
dN
un
ho
lm
S0
10
00
96
5 A
nn
an
No
rth
S0
10
01
02
9 S
um
me
rvill
e
S0
10
01
03
3 L
incl
ud
en
an
d L
och
sid
e
S0
10
01
05
9 L
ock
erb
iea
nd
Mid
An
na
nd
ale
S0
10
01
01
4 N
ithsi
de
an
dN
un
ho
lm
S0
10
00
97
1 A
nn
an
No
rth
S0
10
01
00
6 D
um
frie
sS
ou
th
S0
10
00
94
3 S
tra
nra
er
We
st
S0
10
00
95
3 A
nn
an
So
uth
S0
10
01
04
5C
ath
eri
ne
field
S0
10
00
99
9 D
um
frie
sS
ou
th
S0
10
01
03
8 L
och
arb
rig
gs
S0
10
01
04
8C
ath
eri
ne
field
S0
10
01
04
2 L
och
arb
rig
gs
S0
10
01
03
0 N
ithsi
de
an
dN
un
ho
lm
S0
10
01
00
4 R
otc
he
ll a
nd
Ro
sefie
ld
% i
nc
om
e d
ep
riv
ed
Most income deprived datazones Least income deprived datazones
www.scotland.gov.uk/simd
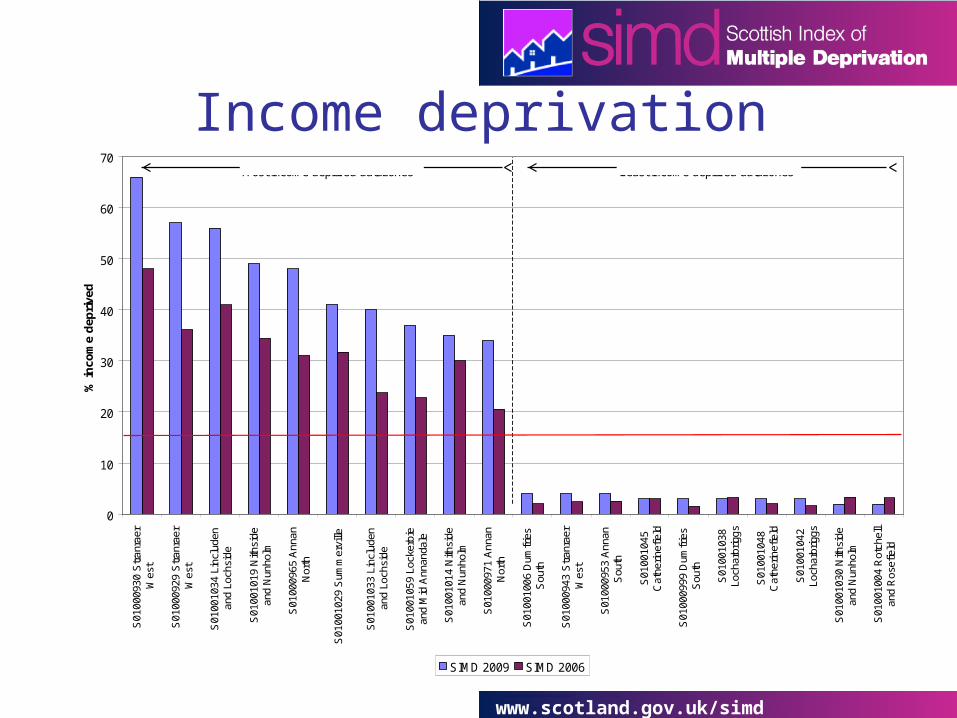
Income deprivation
0
10
20
30
40
50
60
70
S01
0009
30 S
tran
raer
Wes
t
S01
0009
29 S
tran
raer
Wes
t
S01
0010
34 L
incl
uden
and
Loch
side
S01
0010
19 N
ithsi
dean
d N
unho
lm
S01
0009
65 A
nnan
Nor
th
S01
0010
29 S
umm
ervi
lle
S01
0010
33 L
incl
uden
and
Loch
side
S01
0010
59 L
ocke
rbie
and
Mid
Ann
anda
le
S01
0010
14 N
ithsi
dean
d N
unho
lm
S01
0009
71 A
nnan
Nor
th
S01
0010
06 D
umfr
ies
Sou
th
S01
0009
43 S
tran
raer
Wes
t
S01
0009
53 A
nnan
Sou
th
S01
0010
45C
athe
rinef
ield
S01
0009
99 D
umfr
ies
Sou
th
S01
0010
38Lo
char
brig
gs
S01
0010
48C
athe
rinef
ield
S01
0010
42Lo
char
brig
gs
S01
0010
30 N
ithsi
dean
d N
unho
lm
S01
0010
04 R
otch
ell
and
Ros
efie
ld
% in
com
e d
epri
ved
SIMD 2009 SIMD 2006
Most income deprived datazones Least income deprived datazones

www.scotland.gov.uk/simd
Interactive mapping website

www.scotland.gov.uk/simd
Interactive mapping
www.scotland.gov.uk/simd
Where to find more..• General report with initial analysis • Technical report• Guidance leaflet• Interactive mapping website• Statistical Compendium
– tables, charts & maps • Background data for SIMD 2006• www.scotland.gov.uk/simd• More to come…
www.scotland.gov.uk/simd
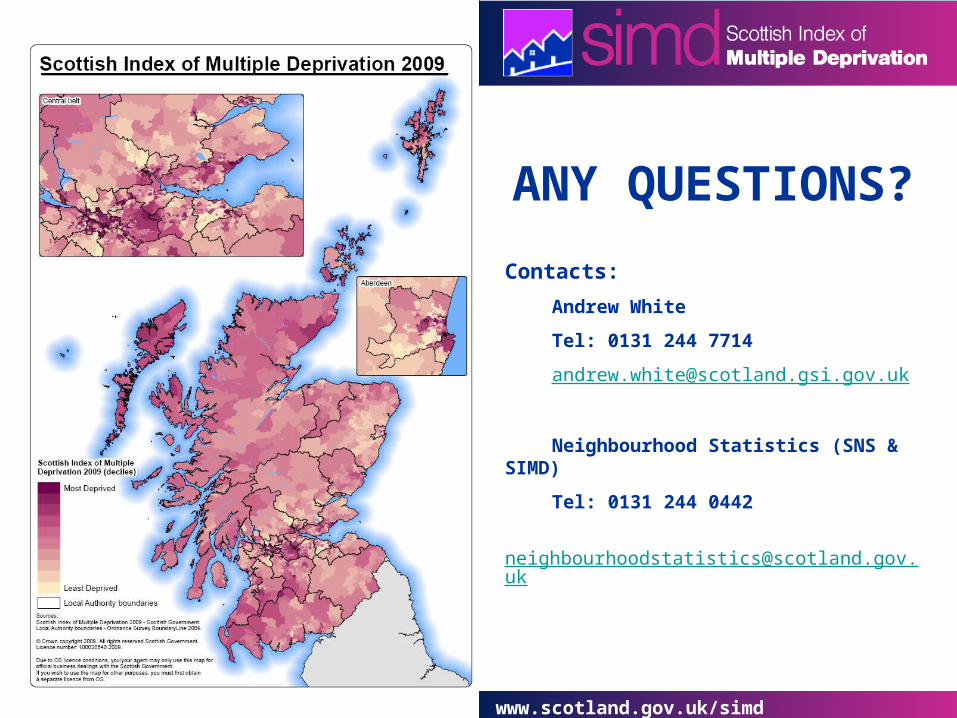
ANY QUESTIONS?
Contacts:
Andrew White
Tel: 0131 244 7714
Neighbourhood Statistics (SNS & SIMD)
Tel: 0131 244 0442
www.scotland.gov.uk/simd
Part 2 – Rural indicators
www.scotland.gov.uk/simd
SIMD and rural areas• Index identifies deprived datazones in both
urban and rural areas.• Identifies small area concentrations of multiple
deprivation.• The indicators which make up the SIMD are
chosen because they are measures of deprivation regardless of where a person lives.
• However deprivation more spatially dispersed in rural areas.
• Other factors, such as population decline, may also pose particular challenges for rural areas.
www.scotland.gov.uk/simd
Rural indicators• SG looked into creating new ‘population’ domain
and combining it with existing income, employment and access domains
• Possible population indicators included:– Population density– Population change– Change in population aged 0-15– Change in population of pension age– Change in ratio of population aged 0-15 to working
age population– Change in ratio of population of pension age to
working age population
www.scotland.gov.uk/simd
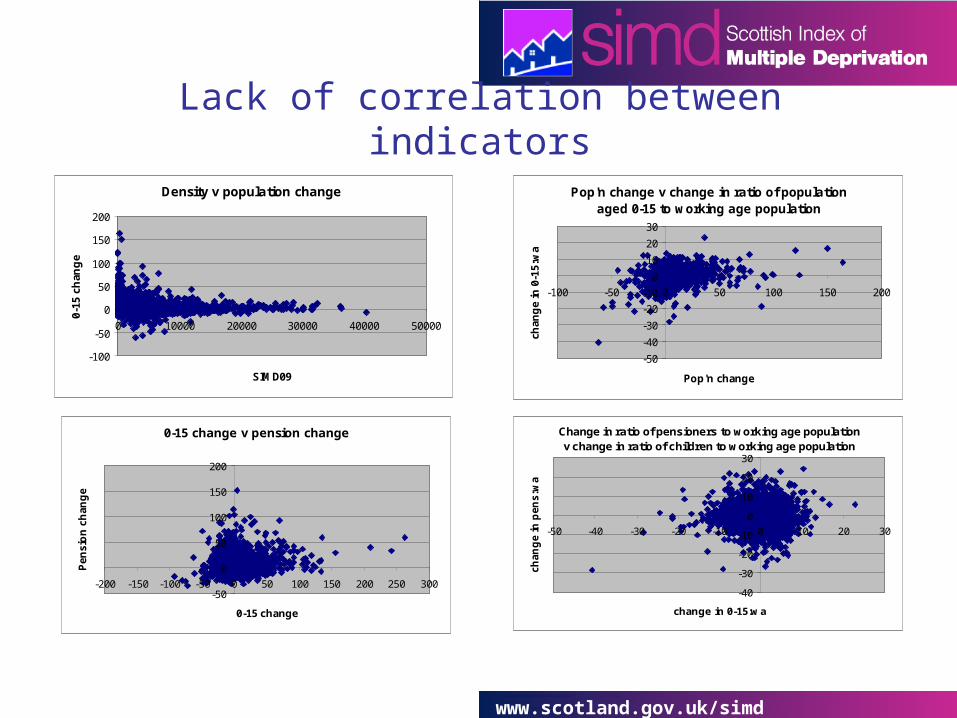
Population domain• Investigation suggested that these indicators weren’t
sufficiently correlated with each other to allow creation of a population domain
www.scotland.gov.uk/simd
Lack of correlation between indicators
Density v population change
-100
-50
0
50
100
150
200
0 10000 20000 30000 40000 50000
SIMD09
0-15
ch
ang
e
Pop'n change v change in ratio of population aged 0-15 to working age population
-50
-40
-30
-20
-10
0
10
20
30
-100 -50 0 50 100 150 200
Pop'n change
chan
ge
in 0
-15:
wa
0-15 change v pension change
-50
0
50
100
150
200
-200 -150 -100 -50 0 50 100 150 200 250 300
0-15 change
Pen
sio
n c
han
ge
Change in ratio of pensioners to working age population v change in ratio of children to working age population
-40
-30
-20
-10
0
10
20
30
-50 -40 -30 -20 -10 0 10 20 30
change in 0-15:wa
ch
an
ge in
pen
s:w
a
www.scotland.gov.uk/simd
Population domain• Investigation suggested that these indicators
weren’t sufficiently correlated with each other to allow creation of a population domain
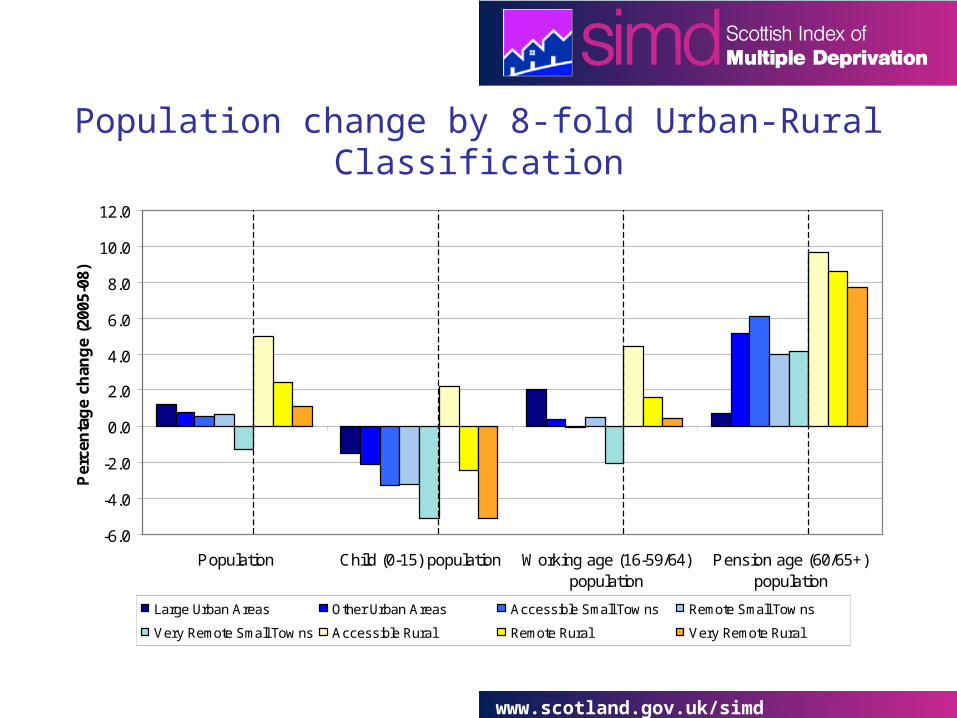
• Also showed that, in general, population decline not worse in more rural areas
• Likely that there are particular rural areas experiencing problems but that these problems are not necessarily an issue for all rural areas.
• Also possible that population decline in a rural area poses a more significant problem than a similar level of population decline in an urban area.
www.scotland.gov.uk/simd
Population change by 8-fold Urban-Rural Classification
-6.0
-4.0
-2.0
0.0
2.0
4.0
6.0
8.0
10.0
12.0
Population Child (0-15) population Working age (16-59/64)population
Pension age (60/65+)population
Per
cen
tag
e ch
ang
e (2
005-
08)
Large Urban Areas Other Urban Areas Accessible Small Tow ns Remote Small Tow ns
Very Remote Small Tow ns Accessible Rural Remote Rural Very Remote Rural
www.scotland.gov.uk/simd
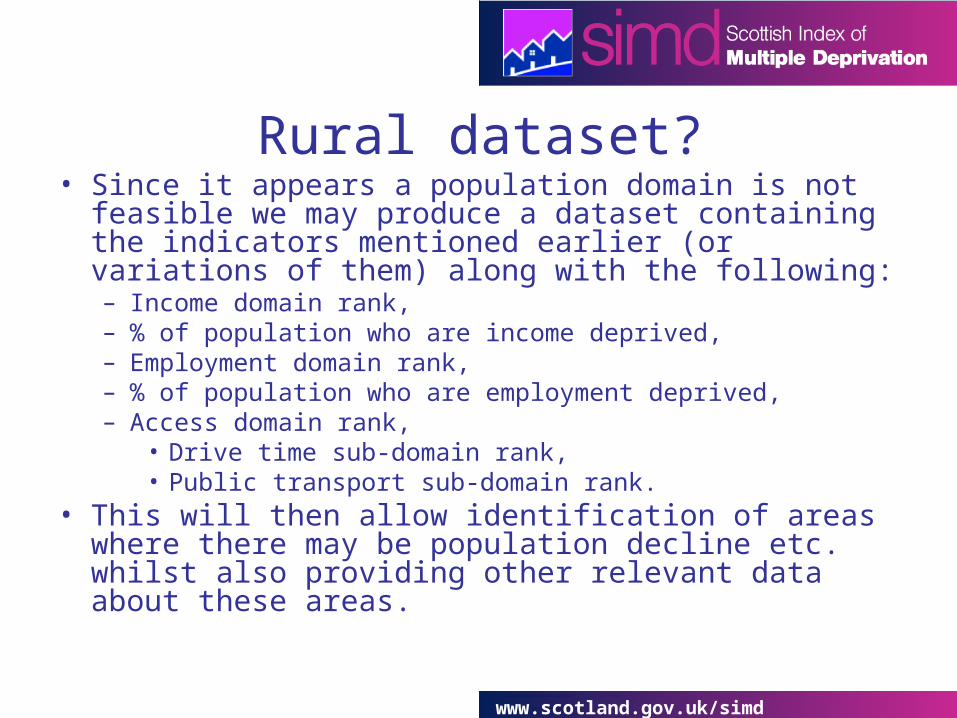
Rural dataset?• Since it appears a population domain is not feasible we
may produce a dataset containing the indicators mentioned earlier (or variations of them) along with the following:– Income domain rank,– % of population who are income deprived,– Employment domain rank,– % of population who are employment deprived,– Access domain rank,
• Drive time sub-domain rank,• Public transport sub-domain rank.
• This will then allow identification of areas where there may be population decline etc. whilst also providing other relevant data about these areas.

www.scotland.gov.uk/simd
Additional slides
www.scotland.gov.uk/simd
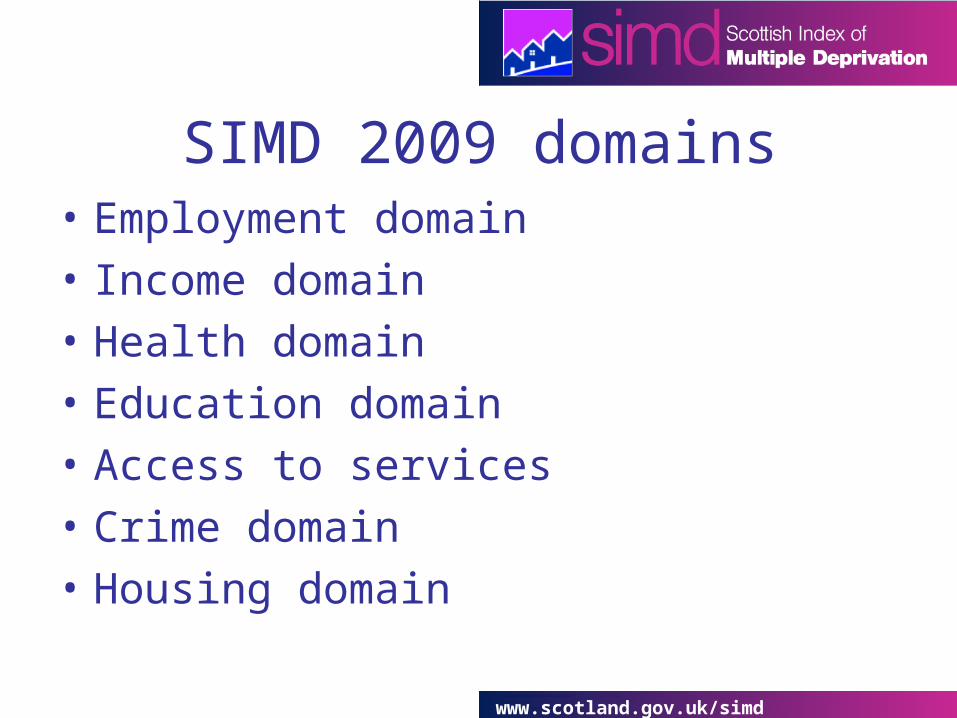
• Employment domain
• Income domain
• Health domain
• Education domain
• Access to services
• Crime domain
• Housing domain
SIMD 2009 domains
www.scotland.gov.uk/simd
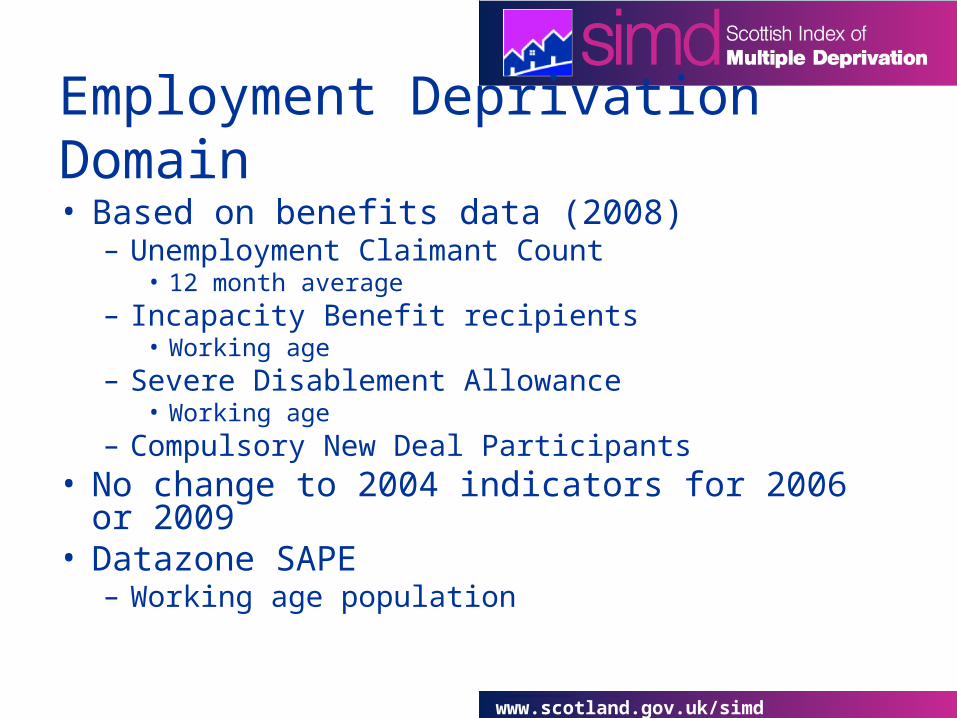
Employment Deprivation Domain
• Based on benefits data (2008)– Unemployment Claimant Count
• 12 month average– Incapacity Benefit recipients
• Working age– Severe Disablement Allowance
• Working age– Compulsory New Deal Participants
• No change to 2004 indicators for 2006 or 2009• Datazone SAPE
– Working age population

www.scotland.gov.uk/simd
Income Deprivation Domain
• Not measuring income• Based on benefits data (2008 and 2007)
– Income support• adults and children
– Guarantee Pension Credit• adults
– Job Seekers Allowance• adults and children
• 2004 used WFTC and DTC data• 2009 – WTC and CTC (2006 data)• Datazone SAPE
– Total population
www.scotland.gov.uk/simd
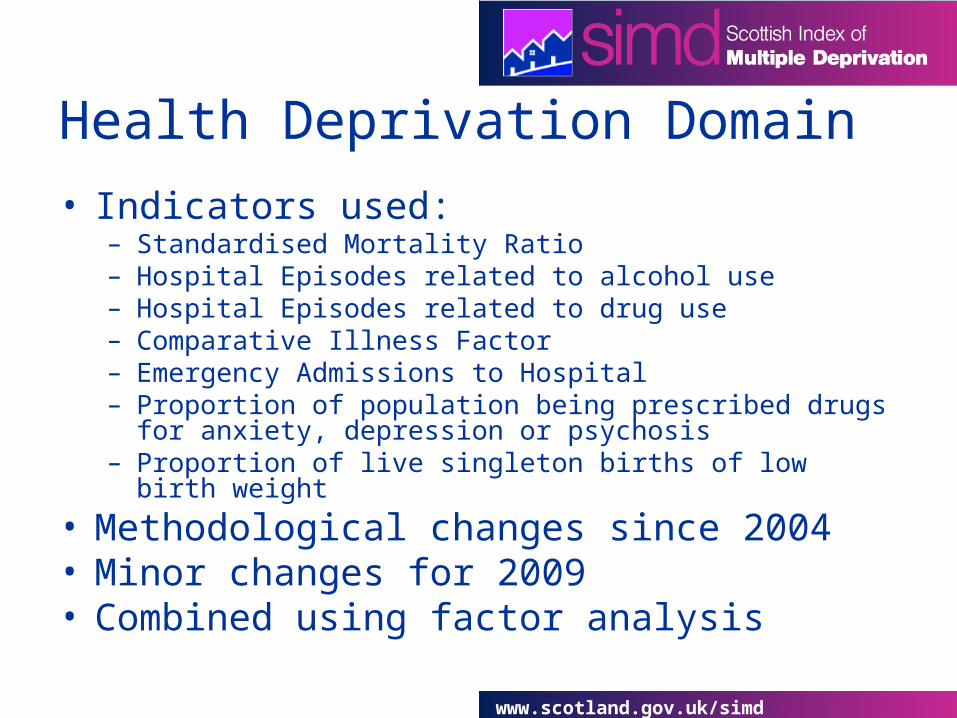
Health Deprivation Domain
• Indicators used:– Standardised Mortality Ratio– Hospital Episodes related to alcohol use– Hospital Episodes related to drug use– Comparative Illness Factor– Emergency Admissions to Hospital– Proportion of population being prescribed drugs for anxiety,
depression or psychosis– Proportion of live singleton births of low birth weight
• Methodological changes since 2004• Minor changes for 2009• Combined using factor analysis
www.scotland.gov.uk/simd
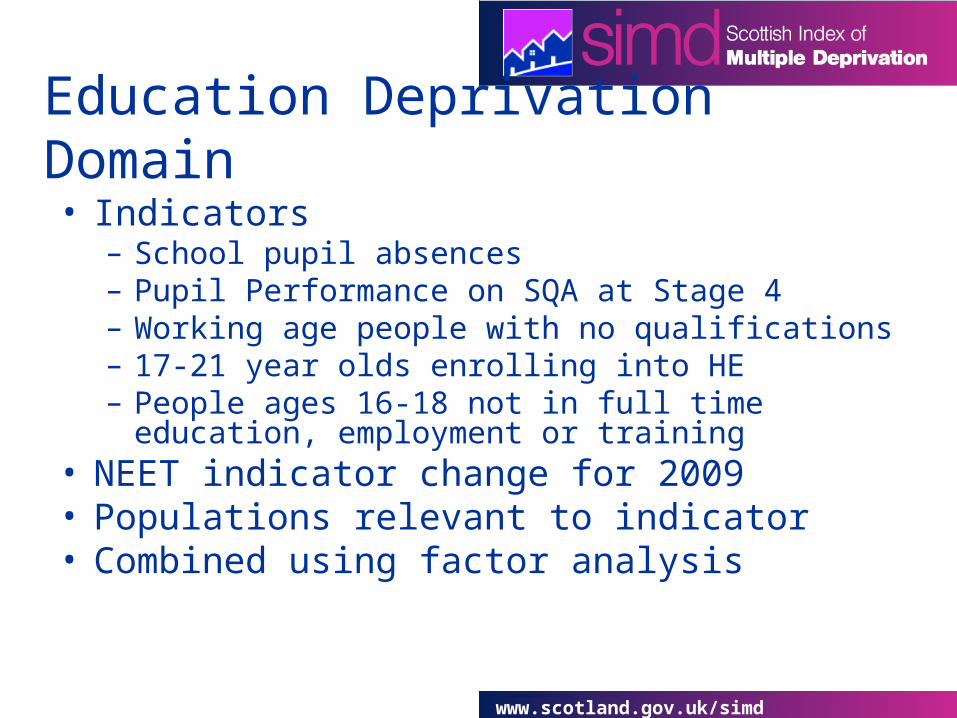
Education Deprivation Domain
• Indicators– School pupil absences– Pupil Performance on SQA at Stage 4– Working age people with no qualifications– 17-21 year olds enrolling into HE– People ages 16-18 not in full time education,
employment or training• NEET indicator change for 2009• Populations relevant to indicator• Combined using factor analysis
www.scotland.gov.uk/simd
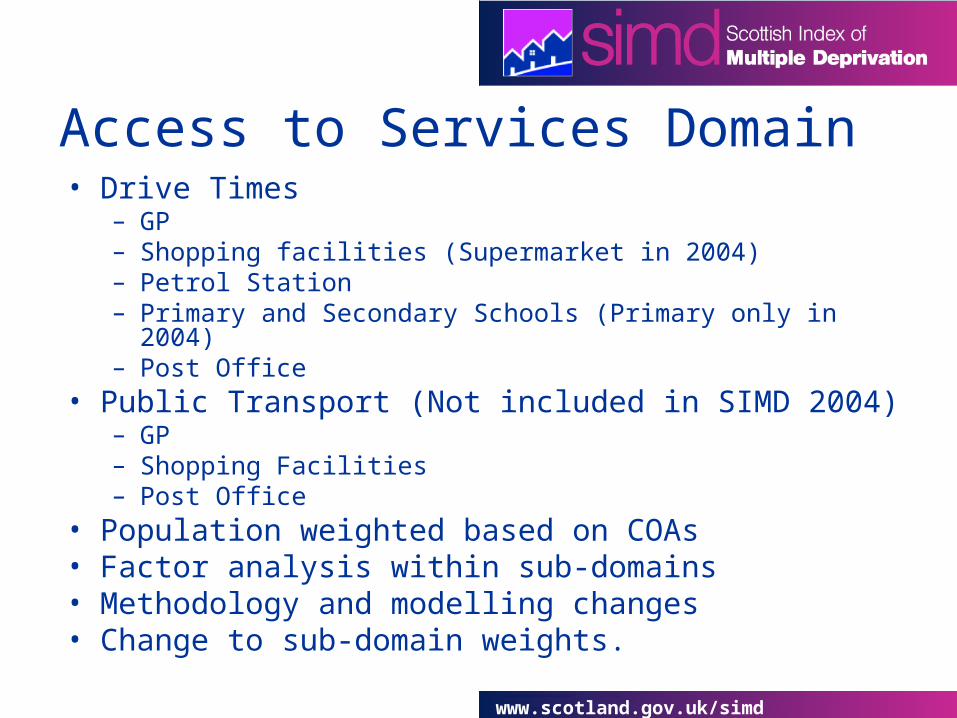
Access to Services Domain• Drive Times
– GP– Shopping facilities (Supermarket in 2004)– Petrol Station– Primary and Secondary Schools (Primary only in 2004)– Post Office
• Public Transport (Not included in SIMD 2004)– GP– Shopping Facilities– Post Office
• Population weighted based on COAs• Factor analysis within sub-domains• Methodology and modelling changes• Change to sub-domain weights.

www.scotland.gov.uk/simd
Crime Domain• Relevant to Neighbourhood Deprivation• ‘SIMD crime’ not ‘Total Crime’
– Crimes of violence– Drug Offences– Domestic Housebreaking– Minor Assault– Vandalism
• Does not include crimes in/near police station• First included in 2006• Total populations – rate per 10,000• Move to financial year for SIMD 2009
www.scotland.gov.uk/simd
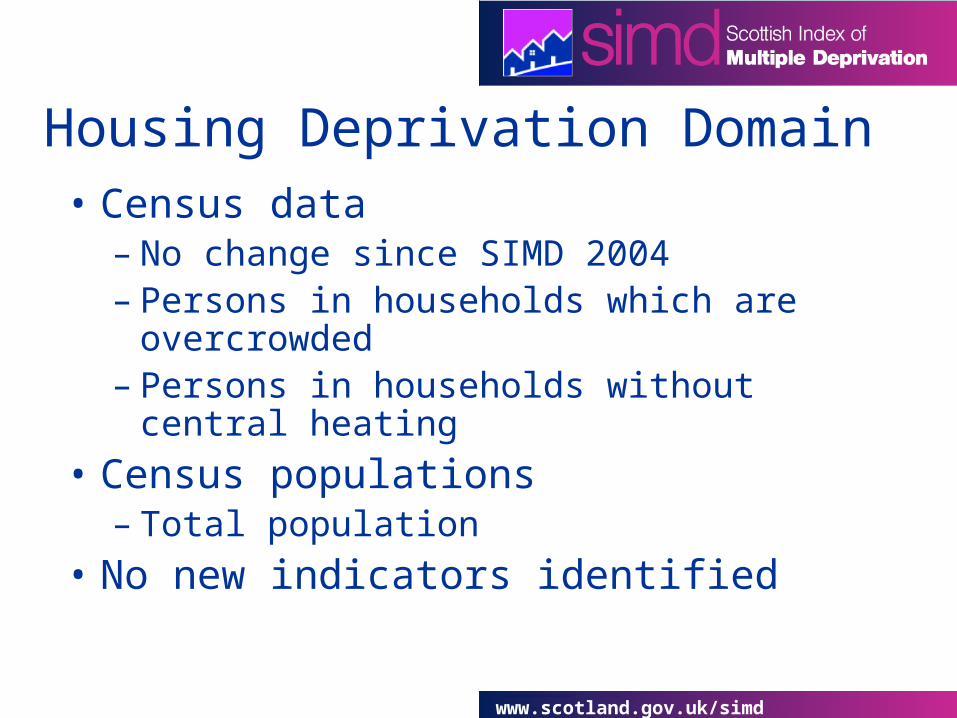
Housing Deprivation Domain• Census data
– No change since SIMD 2004– Persons in households which are
overcrowded– Persons in households without central heating
• Census populations– Total population
• No new indicators identified
www.scotland.gov.uk/simd
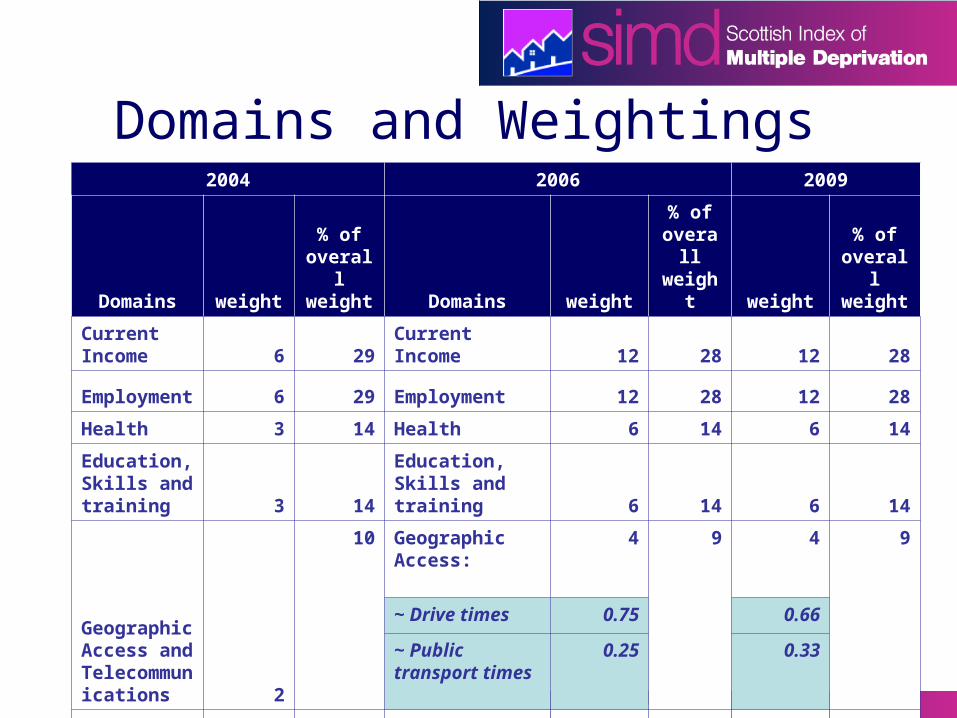
Domains and Weightings2004 2006 2009
Domains weight
% of overall weight Domains weight
% of overall weight weight
% of overall weight
Current Income 6 29 Current Income 12 28 12 28
Employment 6 29 Employment 12 28 12 28
Health 3 14 Health 6 14 6 14
Education, Skills and training 3 14
Education, Skills and training 6 14 6 14
Geographic Access and Telecommunications 2
10 Geographic Access:
4 9 4 9
~ Drive times 0.75 0.66
~ Public transport times
0.25 0.33
Housing 1 5 Housing 1 2 1 2
- - - Crime 2 5 2 5