www.made-by.org evaluating the case for new business models in the clothing sector dr martin buttle...
TRANSCRIPT

www.made-by.org
Evaluating the case for new business models in the clothing sector
Dr Martin Buttle
Senior Supply Chain Consultant, MADE-BY
08/05/13
Introduction
A study of alternative business models in the fashion industry, with an aim to:
•Assess their commercial viability for take up by a large scale retailer
•Assess their potential to reduce resource impacts, particularly waste, water and carbon

UK Waste Footprint
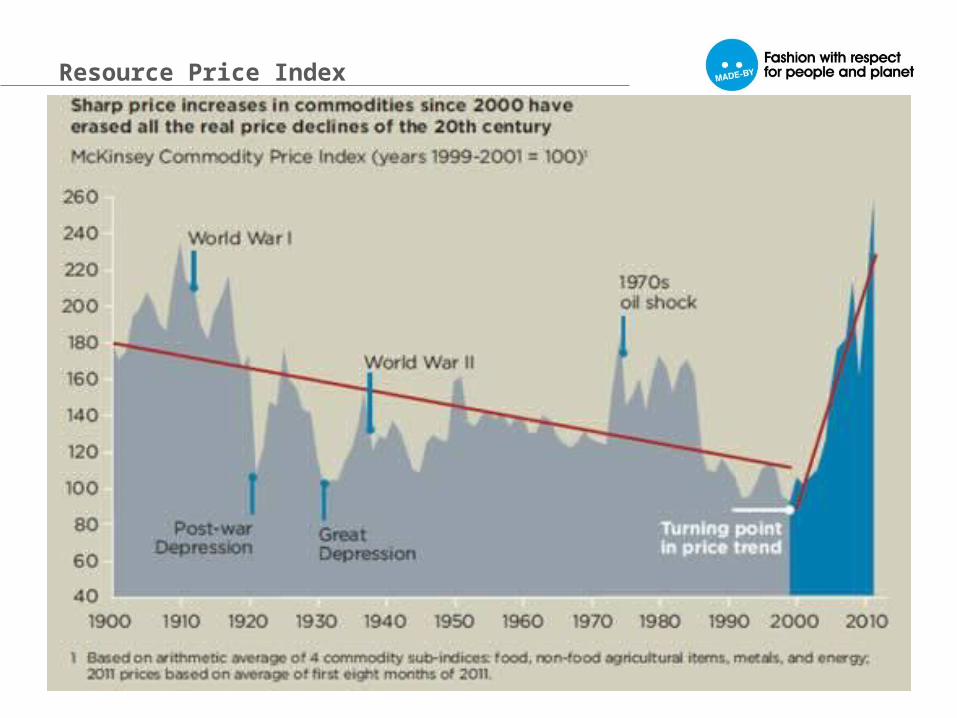
Resource Price Index

The Business Models
Model 1 – Retailers providing repair and upgrading services and repair workshops for their own garments
Model 2 - Retailers providing large-scale leasing services (e.g. for baby clothes)
Model 3 - Retailers providing large-scale services for one-off hire
Model 4 – Retailers offering a reuse section for own-brand garments within their store
Model 5 – Peer to peer exchange
Model 1: Retailers offering in-store repair services
Model 2: Baby Clothes Leasing
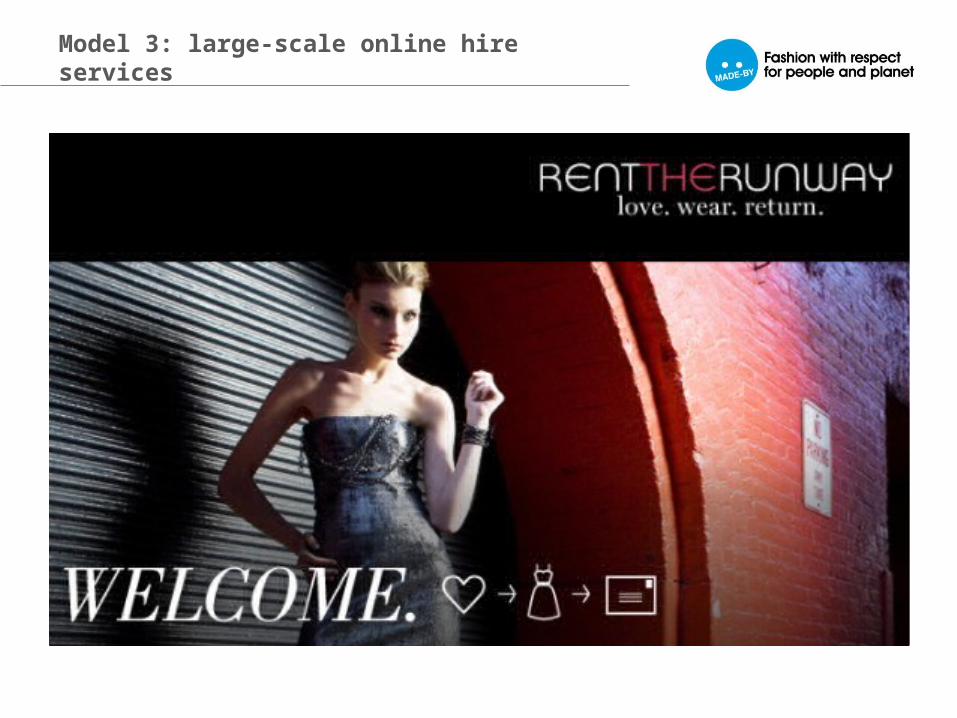
Model 3: large-scale online hire services
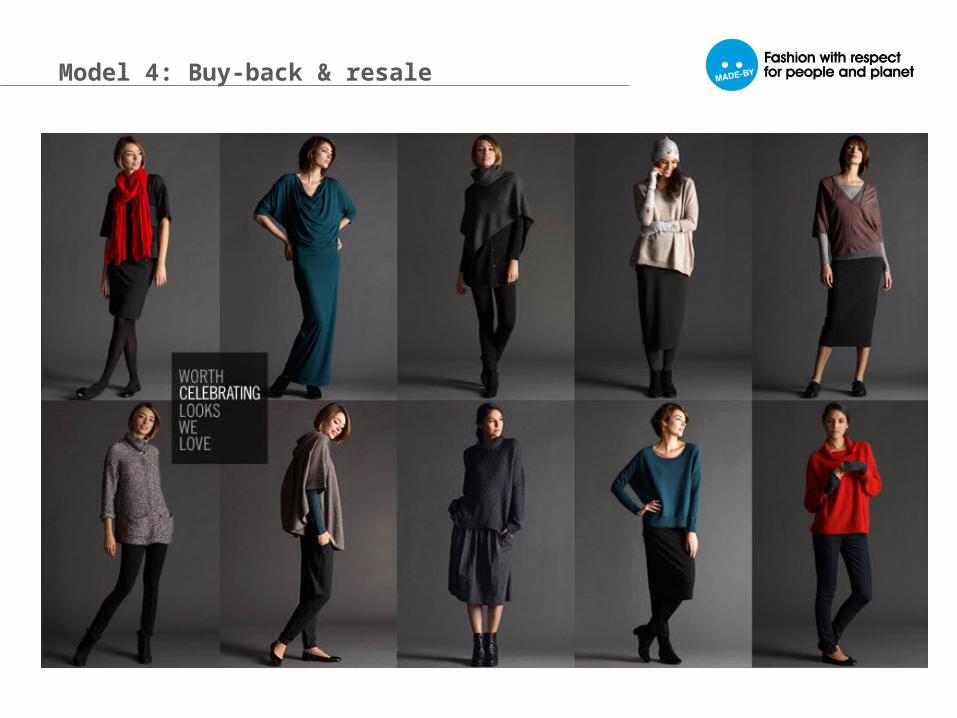
Model 4: Buy-back & resale

Model 5: peer to peer exchange
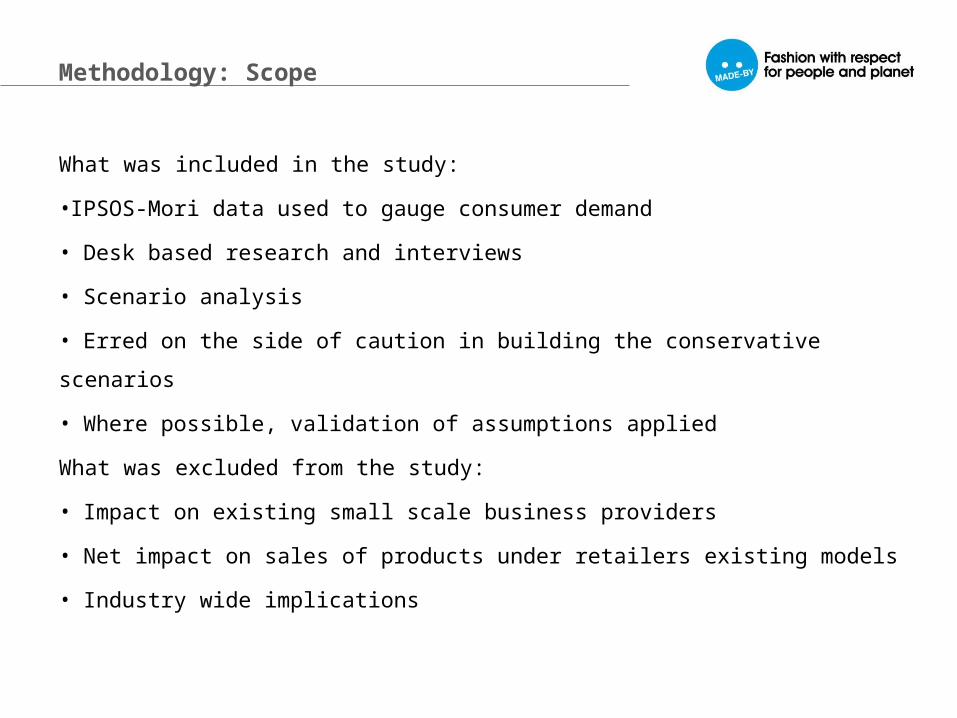
Methodology: Scope
What was included in the study:
•IPSOS-Mori data used to gauge consumer demand
• Desk based research and interviews
• Scenario analysis
• Erred on the side of caution in building the conservative scenarios
• Where possible, validation of assumptions applied
What was excluded from the study:
• Impact on existing small scale business providers
• Net impact on sales of products under retailers existing models
• Industry wide implications
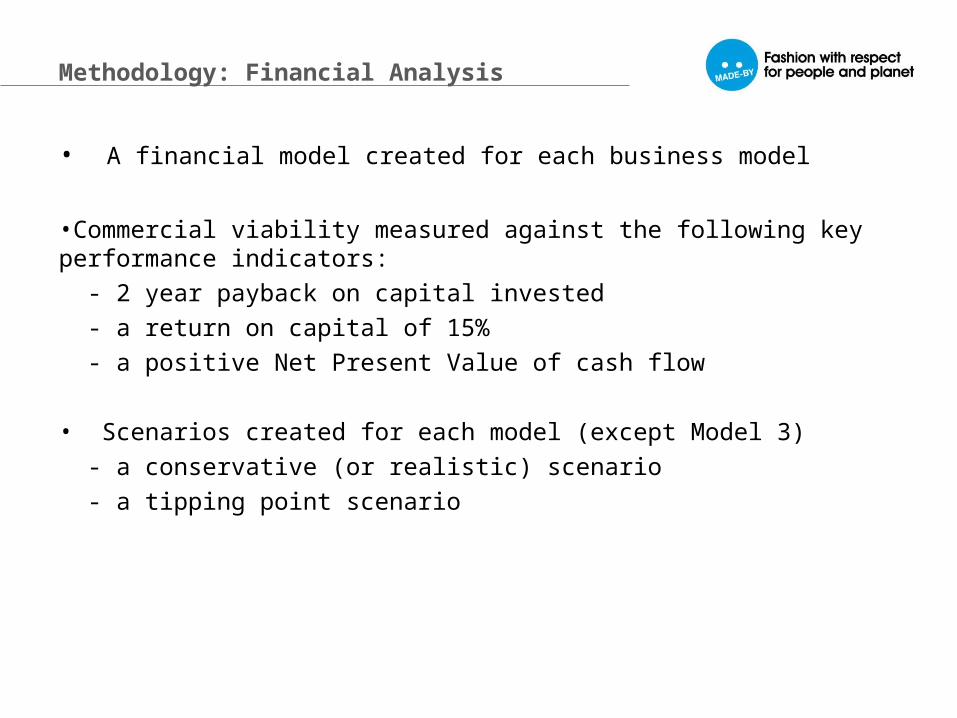
Methodology: Financial Analysis
• A financial model created for each business model
•Commercial viability measured against the following key performance indicators:
- 2 year payback on capital invested
- a return on capital of 15%
- a positive Net Present Value of cash flow
• Scenarios created for each model (except Model 3)
- a conservative (or realistic) scenario
- a tipping point scenario
Methodology: Resource Impacts
Calculations:
• Cotton t-shirt used as basis to calculate resource savings
• Resource saving of a garment saved or displaced based on weight. 0.33 kg/adult garment & 0.07kg / baby garment
Carbon and water saving based on displacement effect applied to each model:
• Carbon - 21 tonnes of CO2e saved per garment displaced
• Water - 4695 litres of water saved per garment displaced
Waste savings is a combination of garments displaced and saved from going to landfill
Displacement effect varied across models
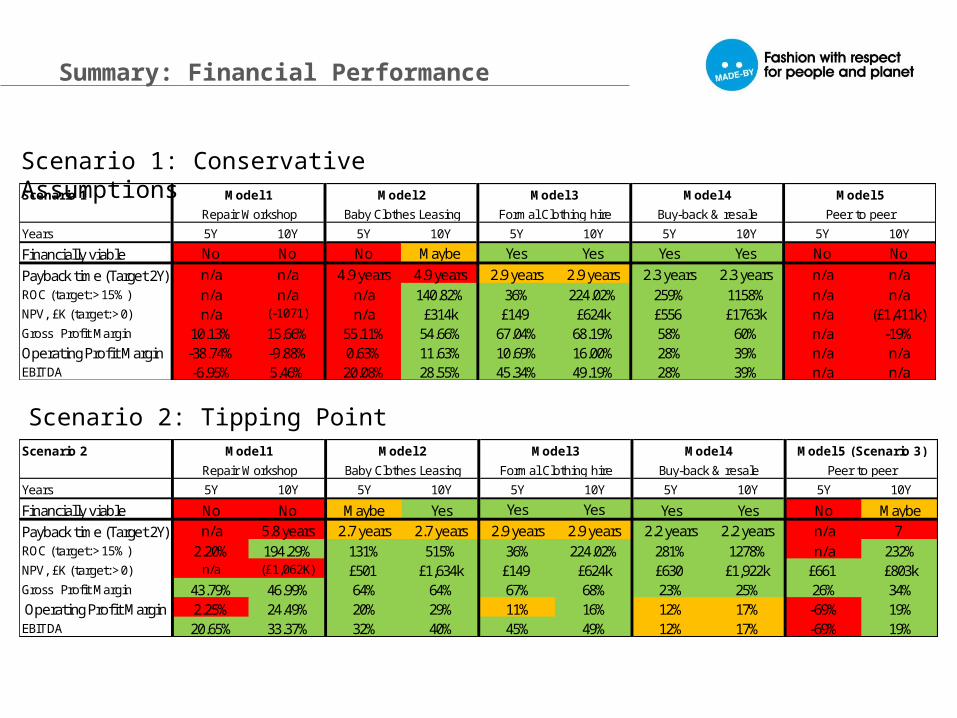
Scenario 1
Years 5Y 10Y 5Y 10Y 5Y 10Y 5Y 10Y 5Y 10Y
Financially viable No No No Maybe Yes Yes Yes Yes No No
Payback time (Target 2Y) n/a n/a 4.9 years 4.9 years 2.9 years 2.9 years 2.3 years 2.3 years n/a n/aROC (target:>15%) n/a n/a n/a 140.82% 36% 224.02% 259% 1158% n/a n/aNPV, £K (target:>0) n/a (-1071) n/a £314k £149 £624k £556 £1763k n/a (£1,411k)Gross Profit Margin 10.13% 15.66% 55.11% 54.66% 67.04% 68.19% 58% 60% n/a -19%Operating Profit Margin -38.74% -9.88% 0.63% 11.63% 10.69% 16.00% 28% 39% n/a n/aEBITDA -6.95% 5.46% 20.08% 28.55% 45.34% 49.19% 28% 39% n/a n/a
Repair Workshop Baby Clothes Leasing Formal Clothing hire Buy-back & resale Peer to peer
Model 1 Model 2 Model 3 Model 4 Model 5
Scenario 2
Years 5Y 10Y 5Y 10Y 5Y 10Y 5Y 10Y 5Y 10Y
Financially viable No No Maybe Yes Yes Yes Yes Yes No MaybePayback time (Target 2Y) n/a 5.8 years 2.7 years 2.7 years 2.9 years 2.9 years 2.2 years 2.2 years n/a 7ROC (target:>15%) 2.20% 194.29% 131% 515% 36% 224.02% 281% 1278% n/a 232%NPV, £K (target:>0) n/a (£1,062K) £501 £1,634k £149 £624k £630 £1,922k £661 £803kGross Profit Margin 43.79% 46.99% 64% 64% 67% 68% 23% 25% 26% 34% Operating Profit Margin 2.25% 24.49% 20% 29% 11% 16% 12% 17% -69% 19%EBITDA 20.65% 33.37% 32% 40% 45% 49% 12% 17% -69% 19%
Repair Workshop Baby Clothes Leasing Formal Clothing hire Buy-back & resale Peer to peer
Model 1 Model 2 Model 3 Model 4 Model 5 (Scenario 3)
Scenario 1: Conservative Assumptions
Scenario 2: Tipping Point
Summary: Financial Performance
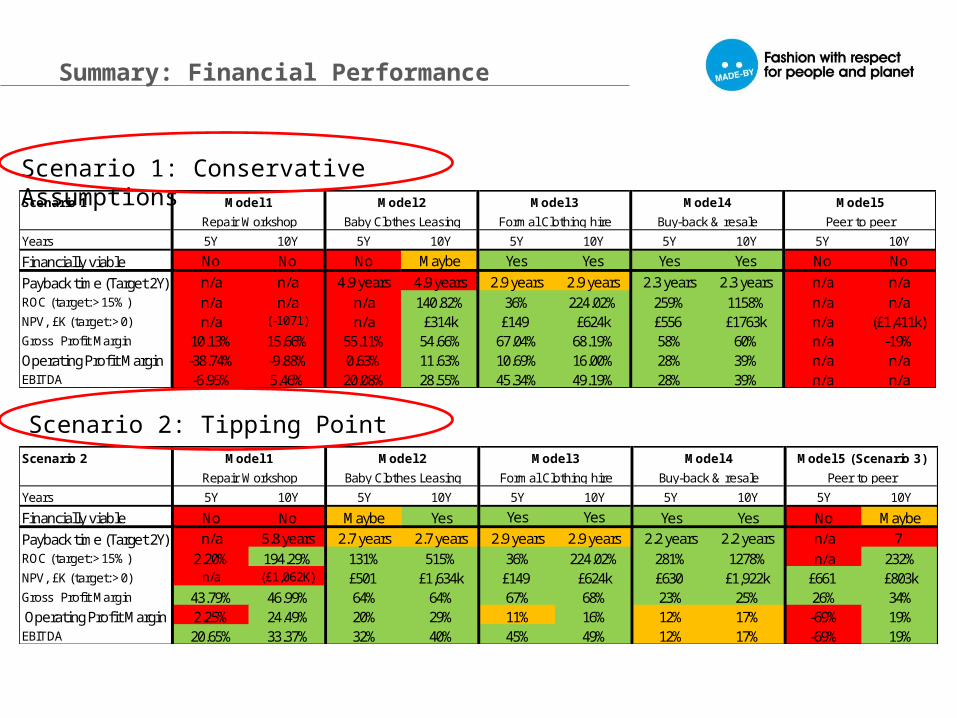

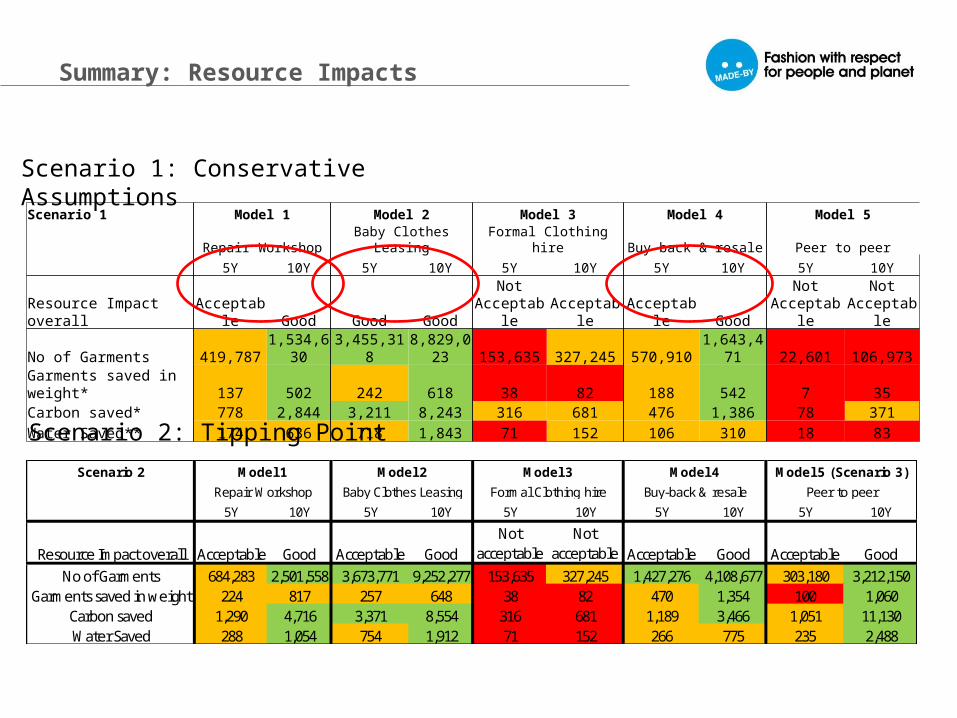
Summary: Resource Impacts
Scenario 1 Model 1 Model 2 Model 3 Model 4 Model 5
Repair WorkshopBaby Clothes
Leasing Formal Clothing hire Buy-back & resale Peer to peer 5Y 10Y 5Y 10Y 5Y 10Y 5Y 10Y 5Y 10Y
Resource Impact overall Acceptable Good Good GoodNot
Acceptable Acceptable Acceptable GoodNot
AcceptableNot
AcceptableNo of Garments 419,787 1,534,630 3,455,318 8,829,023 153,635 327,245 570,910 1,643,471 22,601 106,973Garments saved in weight* 137 502 242 618 38 82 188 542 7 35Carbon saved* 778 2,844 3,211 8,243 316 681 476 1,386 78 371Water Saved** 174 636 718 1,843 71 152 106 310 18 83
Scenario 2
5Y 10Y 5Y 10Y 5Y 10Y 5Y 10Y 5Y 10Y
Resource Impact overall Acceptable Good Acceptable GoodNot
acceptableNot
acceptable Acceptable Good Acceptable GoodNo of Garments 684,283 2,501,558 3,673,771 9,252,277 153,635 327,245 1,427,276 4,108,677 303,180 3,212,150
Garments saved in weight 224 817 257 648 38 82 470 1,354 100 1,060Carbon saved 1,290 4,716 3,371 8,554 316 681 1,189 3,466 1,051 11,130Water Saved 288 1,054 754 1,912 71 152 266 775 235 2,488
Model 5 (Scenario 3)Model 4Model 3Model 2Model 1
Peer to peerBuy-back & resaleFormal Clothing hireBaby Clothes LeasingRepair Workshop
Scenario 1: Conservative Assumptions
Scenario 2: Tipping Point
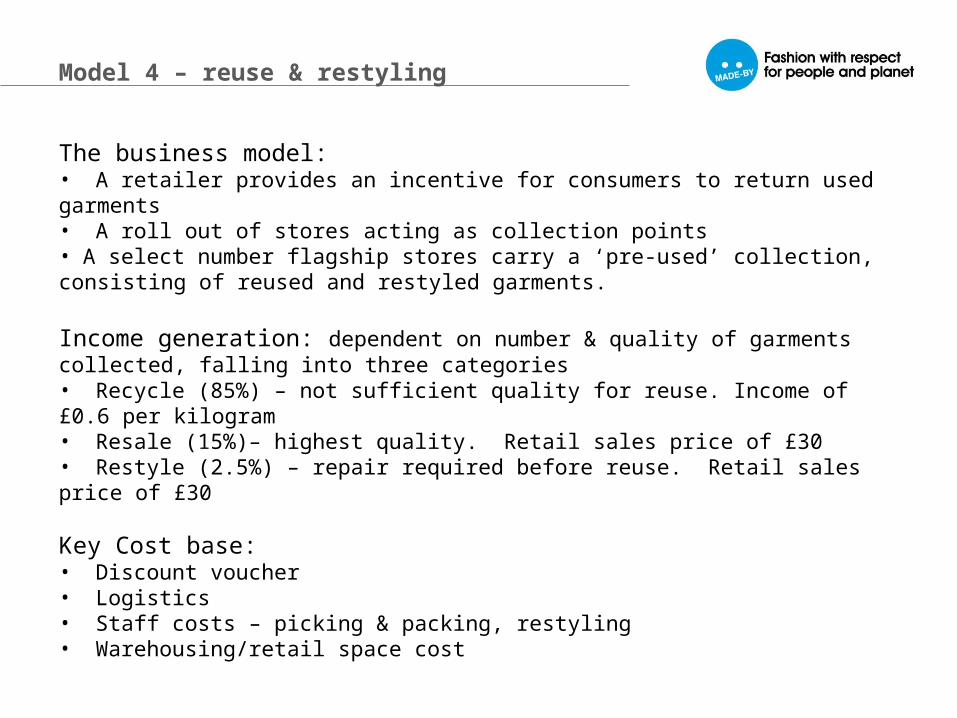
Model 4 – reuse & restyling
The business model: • A retailer provides an incentive for consumers to return used garments • A roll out of stores acting as collection points • A select number flagship stores carry a ‘pre-used’ collection, consisting of reused and restyled garments.
Income generation: dependent on number & quality of garments collected, falling into three categories• Recycle (85%) – not sufficient quality for reuse. Income of £0.6 per kilogram• Resale (15%)– highest quality. Retail sales price of £30 • Restyle (2.5%) – repair required before reuse. Retail sales price of £30
Key Cost base:• Discount voucher• Logistics • Staff costs – picking & packing, restyling • Warehousing/retail space cost
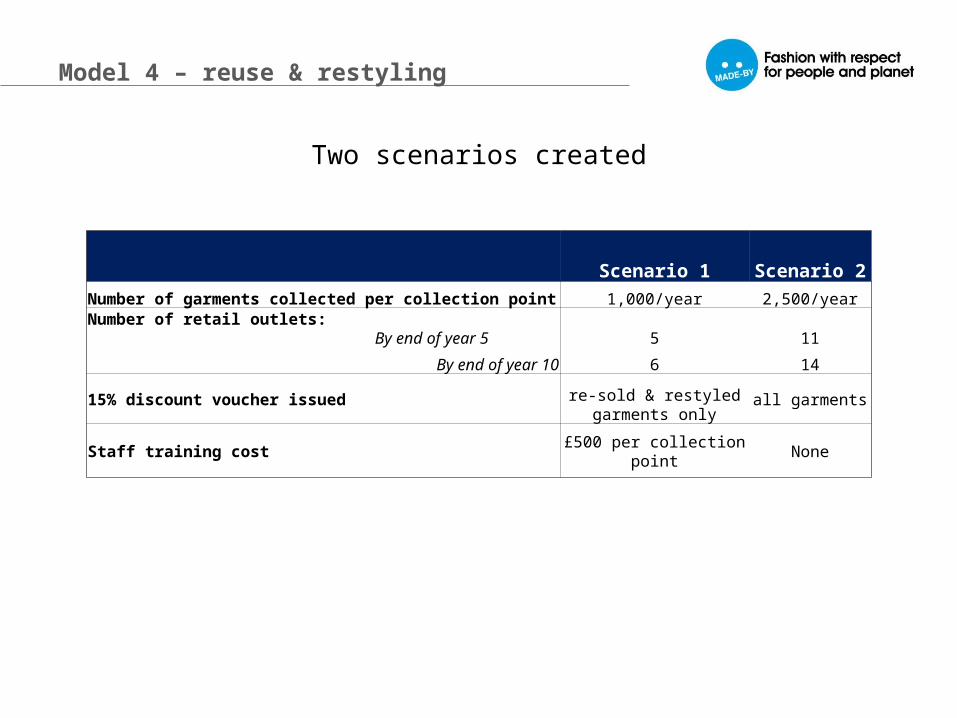
Model 4 – reuse & restyling
Two scenarios created
Scenario 1 Scenario 2Number of garments collected per collection point 1,000/year 2,500/year
Number of retail outlets: By end of year 5 5 11
By end of year 10 6 14
15% discount voucher issued re-sold & restyled garments only
all garments
Staff training cost £500 per collection point None
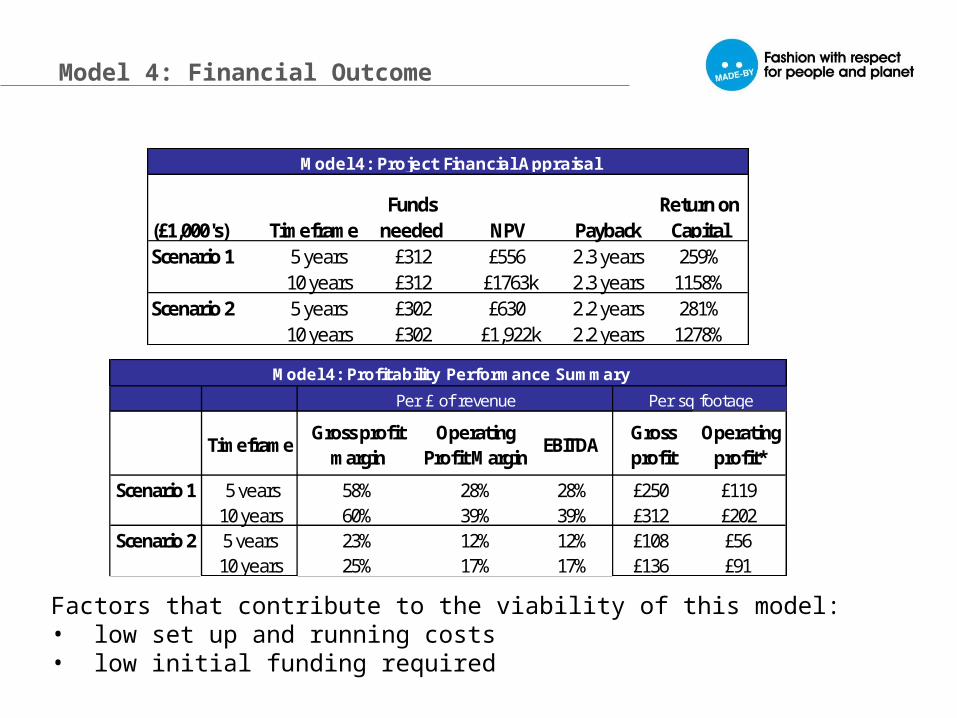
(£1,000's) TimeframeFunds
needed NPV PaybackReturn on
CapitalScenario 1 5 years £312 £556 2.3 years 259%
10 years £312 £1763k 2.3 years 1158%Scenario 2 5 years £302 £630 2.2 years 281%
10 years £302 £1,922k 2.2 years 1278%
Model 4: Project Financial Appraisal
TimeframeGross profit
margin Operating
Profit MarginEBITDA
Gross profit
Operating profit*
Scenario 1 5 years 58% 28% 28% £250 £11910 years 60% 39% 39% £312 £202
Scenario 2 5 years 23% 12% 12% £108 £5610 years 25% 17% 17% £136 £91
Model 4: Profitability Performance Summary
Per £ of revenue Per sq footage
Factors that contribute to the viability of this model:• low set up and running costs • low initial funding required
Model 4: Financial Outcome

Garments saved: for every garment collected, 0.7 of a garment is saved from going to waste Garments displaced: for every garment re-sold, including re-styled garments, 0.6 of a garment is displaced
Timeframe# of
garments saved***
Garments saved in weight*
Carbon Saved*
Water saved**
# of garments saved***
Garments saved in weight*
Carbon Saved*
Water saved**
5 years 570,910 188 476 106 1,427,276 470 1,189 26610 years 1,643,471 542 1,386 310 4,108,677 1,354 3,466 775
Model 4 Appraisal - Resource Impact
Scenario 1 Scenario 2
• Scenario 1 - generates acceptable level of resource savings •Scenario 2 - higher volume of clothing collection/sale leads to a good level of resource savings
*weight in tonnes** in cubic metres***includes garments displaced
Model 4: Resource Impacts
Thank You
MADE BY BeneluxPrins Hendrikkade 25 1012 TM Amsterdam The Netherlands
tel: +31 (0)20 5230666 fax: +31 (0)20 [email protected]
MADE BY GermanyKönigsallee 6140215 Düsseldorf Germany
tel: +49 (0)211 3878 9054 [email protected]
MADE BY UK3-4 Bywell PlaceLondon. W1T 3DNUnited Kingdom
tel: +44 (0)20 7636 3910fax: +44 (0)20 7323 [email protected]