evaluating the financial viability and resource ... rebm final report … · evaluating the...
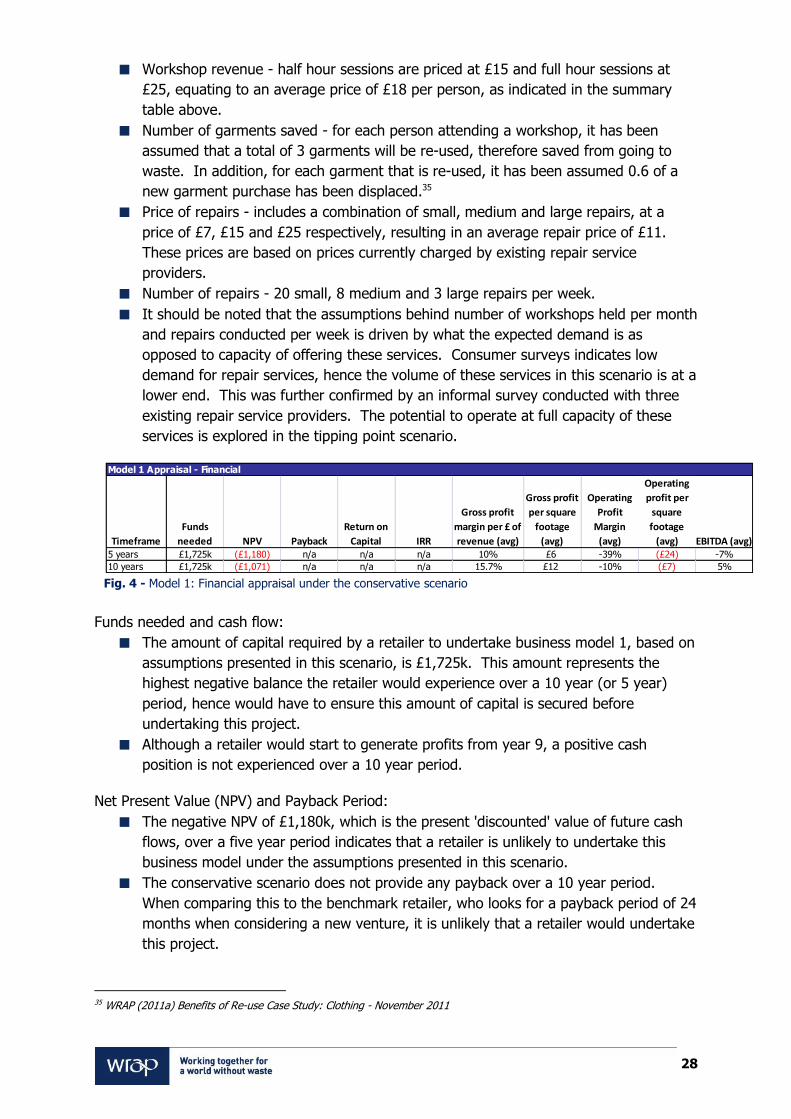
TRANSCRIPT

Evaluating the financial viability and
resource implications for new business
models in the clothing sector
Project code: RNF100-005
Research date: December 2011 – April 2012 Date: Feb 2013

WRAP’s vision is a world without waste,
where resources are used sustainably.
We work with businesses, individuals and
communities to help them reap the
benefits of reducing waste, developing
sustainable products and using resources
in an efficient way.
Find out more at www.wrap.org.uk
Document reference: [e.g. WRAP, 2006, Report Name (WRAP Project TYR009-19. Report prepared by…..Banbury, WRAP]
Written by: Martin Buttle, Deeti Vyas & Christopher Spinks
Front cover photography: [Clothes on rail – Thing Three cc.]
While we have tried to make sure this report is accurate, we cannot accept responsibility or be held legally responsible for any loss or damage arising out of or in
connection with this information being inaccurate, incomplete or misleading. This material is copyrighted. You can copy it free of charge as long as the material is
accurate and not used in a misleading context. You must identify the source of the material and acknowledge our copyright. You must not use material to endorse or
suggest we have endorsed a commercial product or service. For more details please see our terms and conditions on our website at www.wrap.org.uk
Error! No text of specified style in document. 1
Executive summary
Over 1.1 million tonnes of clothes are consumed and disposed of each year. Of this 31%
ends up in landfill (while 48% is re-used, 14% recycled & 7% incinerated)1. .A number of
reports published in recent years have pointed to the need for economies and businesses to
develop sustainable strategies on resource use. In January 2012, the Ellen MacArthur
Foundation published Towards the Circular Economy: Economic and business rationale for an
accelerated transition2, making the case for a faster adoption of a circular economy,
quantifying the economic benefits of circular business models and laying out pathways for
action. Furthermore a McKinsey report Resource Revolution: Meeting the World’s Energy
Materials, Foods and Water Needs suggests that businesses are facing a paradigm shift in
resource price and volatility3. The need for innovative thinking has been underlined by recent
price volatility of raw materials such as cotton, concerns over supply instability, extreme
weather events, and wage inflation in South East Asia.
With this context in mind, this report explores new, innovative business models of clothing
retailing which may be better suited to an economy where businesses and consumers are
facing the impact of resource constraints and higher raw material costs – models which
extend the life of clothes and increase the proportion of garments which are re-used instead
of being discarded prematurely.
The business models addressed in this report highlight a fraction of the options available to
the clothing industry. It is hoped the report will provide a starting point to raise interest and
begin discussion about alternative business models. The report does not represent a
comprehensive list of all the business models applicable to the clothing industry, nor does it
represent the top five options that businesses should explore. Other options or variations on
the models in this report, such as collaborations between stakeholders from different parts of
the clothing supply chain, may in practice provide greater benefit or be more suitable for
implementation.
The aim of the research was to assess the commercial viability of five alternative business
models, quantify the opportunities to build turnover and deliver a commercially attractive
margin and return on investment. The following business models were looked at:
1. Retailers or manufacturers providing repair and upgrading services for their own
garments;
2. Retailers providing radical new large-scale leasing services;
3. Retailers providing radical new large-scale services for one-off hire;
4. Retailers offering a re-sale section for pre-owned own-brand garments within their
store; and
5. Peer to peer exchange.
For each model a first scenario has been developed based on conservative growth
assumptions, and a second tipping point scenario, exploring assumptions designed to
1 WRAP ‘Valuing our Clothes’ 2012 2 Ellen MacArthur Foundation (2012) Towards the Circular Economy: Economic and Business Rationale for an accelerated transition 3 McKinsey (2011), “Resource Revolution: Meeting the World’s Energy Materials, Foods and Water Needs

Error! No text of specified style in document. 2
generate sufficient financial performance for the model to be taken up by a retailer. For each
scenario, the analysis includes an examination of break-even points where the business
model moves into profit and can grow.
The following criteria are identified as being key financial measures of success:
2 year pay-back period on capital invested;
a positive Return on Capital (RoC), ideally around 15%; and
a positive Net Present Value (NPV) of cash flow over a 5 and 10 year period – no
minimum threshold established.
Each business model included in this study has been assessed on its own merit, seeking to
show what would be required for it to generate financial performance that would be
commercially acceptable to a large-scale retailer. For this purpose, the key financial
performance indicators are assessed against the 5 year average profitability performance of
a leading high-street clothing retailer and the investment hurdles that they look to achieve
when considering investing in a new project.
In Model 1, a national retail store offers repair and upgrading service as well as workshops
designed to equip, educate and inspire people to take care of their clothes through activities
such as repair, and make them last longer. Model 1 has a relatively high cost base and
generates low amounts of revenue. Under the conservative scenario it does not provide any
payback over a 10 year period. In the tipping point scenario it provides payback in 5.8
years. Due to a low demand for this type of service, it saves relatively few garments from
going to waste. Model 1, as described in this study, is deemed unlikely to be taken up at a
large scale by a retailer. However, in recent years, there has been an increase in the
number of repair service providers, usually based in local communities, and a potential way
forward for a retailer would be to form partnerships with local providers.
Model 2 provides large-scale leasing of baby clothes. The initial projections suggest that
there is limited consumer demand for leasing of baby clothes. There are advantages,
however, to leasing as babies outgrow clothes faster than the clothes wear out. There are
also disadvantages – babies will dirty and damage clothes in a relatively short space of time.
The business model, although marginal from a financial perspective under the conservative
scenario, is the most effective from a resource impact perspective with the largest amount of
saving of garments going to waste. The assessment suggests that whilst the sustainability
and financial case (under the tipping point scenario) can be made for this model, finding the
appropriate price points for leasing and lease lifecycle are key to success for a retailer to
take this model forward.
There are already a number of existing businesses which provide a hiring service for clothes,
so it is unsurprising that the financial case stacks up under the achievable assumptions for
Model 3. As this model is focused on a small segment of clothing (formal and evening wear)
and it has a relatively low displacement ratio when compared with other models, it does not
generate the same level of resource savings when compared with the other models. On the
basis that the model can succeed financially and it does generate waste, carbon and
emissions savings relative to the status quo, Model 3 could be trialled further with willing
retailers.

Error! No text of specified style in document. 3
In Model 4, a fashion retailer offers an incentive for their customers to return their used
garments (bought from that retailer) to a store. The garments are then sent to a central
warehouse for sorting, cleaning and re-styling and distributed back to flagship stores
carrying the 'pre-owned' collection. Model 4 provides the quickest payback period under
both scenarios and is one of the most commercially viable models over the long and short
term. This is mainly due to a low cost base and generating resonable profits. It is also one of
the most effective at generating waste savings over the long term in both a conservative and
tipping point scenario. On the basis of this research, any fashion brand at the forefront of
addressing sustainability issues and driving fashion trends, such as the recent increase in
anything vintage, would be an ideal candidate for uptake of this model.
Model 5, creating an online platform for peer to peer exchange of garments, suffers from
the challenge that the business does not own the product being transacted, therefore only
received a fraction of the transaction value as income. Whilst Model 5 has a relatively low
cost base (maintaining an online platform), the revenue generated from each transaction is
very small and therefore would require a significantly high volume of trades in order to make
a profit. A further challenge is converting the number of users to active users. The
resource savings generated by Model 5 under tipping point scenarios are significant after ten
years. The analysis suggests that Model 5 would not stack up as a standalone large scale
business and would need to be set up as a non-profit initiative with external sources of
funding in order to succeed.
Financial Appraisal
Fig. I - Financial summary table for the conservative scenario
Model 4 provides the quickest payback period, which is not surprising given the relatively
low set up costs involved for this model.
Model 3's payback period of 2.9 years is also considered acceptable given the higher
Return on Capital a retailer would benefit from, in exchange for a slightly longer payback
period.
Model 2's payback under the conservative scenario is relatively long, at 4.9 years;
however a retailer does stand to achieve 140% return on capital. The tipping point
scenario provides an acceptable payback period of 2.7 years and a very healthy return on
capital of 515%. Given the low level of demand for leasing garments, the key factors that
would make this model viable are the price point at which garments can be leased and
the number of times a garment can be leased.
Models 1 and 5 do not provide any payback under the conservative scenario and the payback period under the tipping point scenario is considered to be relatively long. They are also the least attractive models from a return on capital perspective.
5Y 10Y 5Y 10Y 5Y 10Y 5Y 10Y 5Y 10Y
Financially viable No No No Maybe Yes Yes Yes Yes No No
Payback time (Target 2Y) n/a n/a 4.9 years 4.9 years 2.9 years 2.9 years 2.3 years 2.3 years n/a n/a
ROC (target:>15%) n/a n/a n/a 140.82% 36% 224.02% 259% 1158% n/a n/a
NPV, £K (target:>0) n/a (-1071) n/a £314k £149 £624k £556 £1763k n/a (£1,411k)
Gross Profit Margin 10.13% 15.66% 55.11% 54.66% 67.04% 68.19% 58% 60% n/a -19%
Operating Profit Margin -38.74% -9.88% 0.63% 11.63% 10.69% 16.00% 28% 39% n/a n/a
EBITDA -6.95% 5.46% 20.08% 28.55% 45.34% 49.19% 28% 39% n/a n/a
Conservative Scenario Repair Workshop Baby Clothes Leasing Formal Clothing hire Buy-back & resale Peer to peer
Model 1 Model 2 Model 3 Model 4 Model 5

Error! No text of specified style in document. 4
Resource Impacts
Fig. ii: Resource Impact summary under the conservative scenario
Models 1, 2 and 4 generate good or acceptable resource savings under the conservative
scenario. However, models 1 and 4 require up to ten years to generate relatively good
resource savings.
Under the conservative scenario, models 3 and 5 fail to generate acceptable
environmental savings after 10 years.
The majority of the models included in this study operate on a relatively lower cost base
compared to conventional models, and if sufficient demand can be created, they have the
potential to be even more commercially viable at a large scale and generate significant
resource savings. Given the influencing power of leading fashion brand retailers, they can
play a role in creating demand for these alternative business models and become part of the
solution.

Error! No text of specified style in document. 5
Contents
1.0 Introduction ......................................................................................................... 8
2.0 Market projections and context............................................................................ 10
3.0 Methodology ...................................................................................................... 13
4.0 Business Models ................................................................................................. 21
5.0 Business Model 1: Retailers offering repair & upgrading services of own garments ... 24
6.0 Business Model 2: Retailers providing large-scale leasing services .......................... 33
7.0 Business Model 3: Retailers providing large-scale one-off hire services.................... 42
8.0 Model 4: Retailers offering re-sale section for own-brand garments and restyling services ............................................................................................................. 49
9.0 Business Model 5: Peer to peer exchange ............................................................. 59
10.0 Conclusions: Is there a business case for alternative business models in the clothing industry? ........................................................................................................... 66
11.0 Recommendations and Next Steps ....................................................................... 77
Appendix I ................................................................................................................... 78
Error! No text of specified style in document. 6
Glossary
The study refers to a number of different business models, technical concepts and business
evaluation techniques. In this section we provide definitions of the concepts used in the
report.
Buy-Back – the act of retailers rebuying or taking-back something that was once previously
sold.
Circular Economy – a circular economy is an industrial system that is restorative or
regenerative by intention and design. It replaces the ‘end-of-life’ concept with restoration,
shifts towards the use of renewable energy, eliminates the use of toxic chemicals which
impair re-use, and aims for the elimination of waste through the superior design of
materials, products, systems, and, within this, business models4.
Collaborative Consumption – a term used to describe a collection of business models
based on sharing, swapping, bartering, trading or renting access to products as opposed to
ownership. Technology and peer communities are enabling these old market behaviours to
be reinvented in ways and on a scale never possible before. From enormous marketplaces
such as eBay and Craigslist, to peer-to-peer marketplaces such as Tradepal5 emerging
sectors such as peer-to-peer travel and car sharing (Zipcar or RelayRides), Collaborative
Consumption is said to be disrupting outdated modes of business and reinventing not just
what people consume but how they consume it.
Displacement effect – the extent of avoiding the purchase of new clothing as a result of
re-use. As detailed in a WRAP (2011) study6, according to current estimates, the re-use of
one garment displaces 0.6 new garment purchases on average, and delivers savings
estimated at 13 tonnes of C02 equivalent per tonne of clothing re-used (relative to landfill).
(Note that WRAP’s data on displacement effects are estimates as there are many contextual
factors that can affect this behaviour.)
Leasing – is the provision of a service allowing a user to pay to use an item for a fixed
period of time. In contrast to renting, leasing tends to allow a user to use the item over a
longer period of time.
Renting – is an agreement where a payment is made for the temporary use of a good,
service or property owned by another.
Re-use – any operation by which products or components that are no longer wanted are
used again for the same purpose for which they were conceived. Within the methodology
used in this report, re-use includes re-use and preparation for re-use (in line with Defra’s
guidance on these terms). 4 Ellen MacArthur Foundation (2012) Towards the Circular Economy: Economic and Business Rationale for an accelerated transition 5 Rachel Botsman, Roo Rogers, What's Mine Is Yours: The Rise of Collaborative Consumption, HarperBusiness, 2010 6 WRAP (2011) Benefits of re-use case study: Clothing

Error! No text of specified style in document. 7
Acknowledgements
This report has been developed in consultation with a wide range of individuals and
organisations involved in sustainability and clothing. The authors wish to thank:
Anna Hesse, Here today, Here tomorrow
Emma Rigby, Here today, Here tomorrow
Kal Di Paola, Buymywardrobe
Maren Winter, Lutte Leihen
Leigh McAlea, TRAID
Lyla Patel, TRAID
Suruchi Bhargava, Wishwantwear
Suruchi Saxena, Wishwantwear
Stef Lewandowski, Stef.io
Jennifer Decker WRAP
Dr David Moon, WRAP
Kimberley Pratt, Zero Waste Scotland
Simon Reid, WRAP
Sophie Richard, WRAP
Allanna McAspurn, MADE-BY
Burak Cakmak, MADE-BY
Catherine Watkins, ASDA George

Error! No text of specified style in document. 8
1.0 Introduction
Clothing represents 5-10% of environmental impacts across the EU25, and is the next most
significant category after food and drink, housing and transport7. Over 1.1 million tonnes of
clothes are consumed and disposed of each year. Of this 31% ends up in landfill (while 48%
is re-used, 14% recycled & 7% incinerated)8.
A number of reports published in recent years have pointed to the need for economies and
businesses to develop sustainable strategies on resource use. In 2010, Forum for the Future
published the results of a scenario visioning study on “Fashion Futures 2025”. The study
identified a series of factors shaping the future (e.g. demographics, growing impacts of
climate change and rising costs of key resources), and assessed how consumers and industry
might respond under different socio-economic and global policy conditions. The scenarios
point to greater use of business models which re-use garments and raw materials.
In January 2012, the Ellen MacArthur Foundation published “Towards the Circular Economy:
Economic and Business Rationale for an Accelerated Transition”9, a report making the case
for a faster adoption of a circular economy, quantifying the economic benefits of circular
business models and laying out pathways for action. The circular economy is defined as the
evolution of the economy from an increasingly resource-constrained ‘take-make-dispose’
model towards one that is circular and re- generative by intention. Using product case
studies and economy-wide analysis, the report details the potential for significant benefits
across the EU. It argues that a subset of the EU manufacturing sector could realise net
materials cost savings worth up to $630 billion p.a. towards 2025—stimulating economic
activity in the areas of product development, remanufacturing and refurbishment. The
report argues that market conditions and tighter environmental standards are now
combining to give the circular economy its large-scale potential.
The rise of ‘collaborative consumption’ business models, where businesses generate sales
from resources which are shared between multiple consumers represents an opportunity for
the clothing industry. Other business sectors have started to experiment with these
innovative business models. For instance, B&Q started experimenting with leasing hand drills
in 2012. Ian Cheshire, CEO of Kingfisher Group has stated: “Infinite high resource intensity
growth is simply not possible, and we are already living off our future capital. It may be
gradual but most businesses will have to adjust to a very different reality.... we as retailers
are examining how we might shift from selling items such as a power drills to selling the use
of it, perhaps through leasing or fractional ownership10.”
The need for innovative thinking has been underlined by recent price volatility of raw
materials such as cotton, concerns over supply instability, extreme weather events, and
wage inflation in South East Asia. Furthermore, a report published by McKinsey in November
2011 – “Resource Revolution: Meeting the World’s Energy Materials, Foods and Water
7 Environmental impacts of products (EIPRO) report, EC JRC (2006) 8 WRAP ‘Valuing our Clothes’ 2012 9 Ellen MacArthur Foundation (2012) Towards the Circular Economy: Economic and Business Rationale for an accelerated transition 10 http://www.guardian.co.uk/sustainable-business/blog/kingfisher-ceo-ian-cheshire-sustainable-capitalism (accessed 23/03/12)
Error! No text of specified style in document. 9
Needs”11 – argues that recent commodity price volatility is likely to continue into the long
term and that the world economy is undertaking a paradigm shift in relation to commodity
prices. The cost of raw materials, which fell throughout the 20th century have increased in
the past decade erasing the falls, and factors linked to changing global power centres,
sustainability and resource scarcity are likely to drive price volatility over the long term.
Another report published by Deloitte Tohmatsu for the World Economic Forum12 points to the
fact that many retail and consumer-facing brands’ traditional business models are vulnerable
to rising input costs and particularly raw material costs. Without a re-evaluation of these
business models in the light of rising raw material costs, waste impacts, and developing
legislation, businesses face a challenging future.
With this context in mind, this report explores new, innovative business models which may
be better suited to an economy where businesses and consumers are facing the impact of
resource constraints and higher raw material costs, by extending the life of clothes and
reducing the amount of garments going to waste. It has the following aims:
To undertake financial modelling of alternative business models which reduce overall
demand for resource inputs (raw materials, and associated carbon, water and waste
impacts);
To assess market projections for factors which will affect resource use in the clothing
sector (such as cotton prices/supply, government targets for carbon reduction, global
demand for resources), and the consequences for costs, business risk/resilience and
investor assessments; and
To estimate the tipping points at which alternative business models may become
commercially attractive (including input prices, technological change and changes in
consumer behaviour).
The research focuses on assessing the commercial viability of alternative business models,
quantifying the opportunities to build turnover and reduce business risks in the face of
market drivers such as changes in raw material costs. In this research, the following
business models are assessed:
1. Retailers or manufacturers providing repair and upgrading services for their own
garments;
2. Retailers providing radical new large-scale leasing services (e.g. for baby clothes);
3. Retailers providing radical new large-scale services for one-off hire;
4. Retailers offering a re-sale section for pre-owed own-brand garments within their store
and
5. Peer to peer exchange through an online platform.
11 McKinsey (2011), “Resource Revolution: Meeting the World’s Energy Materials, Foods and Water Needs 12 Deloitte Touche Tohmatsu (2009) Sustainability for Tomorrow’s Consumer, World Economic Forum
Error! No text of specified style in document. 10
2.0 Market projections and context
In this section we explore the changing market context for retailers and the implications for
traditional retail models based on a resource-intensive ‘take-make-dispose’ style model.
2.1 Resource cost and constraints
Since 2000, the prices of raw resources have risen dramatically, erasing a century worth of
real price declines13. In the report, Resource Revolution: Meeting the World’s Energy
Materials, Foods and Water Needs, McKinsey analysed a Commodity Price Index based on 4
commodity sub-indices (food, non-food agricultural items, metal and energy). The Index
clearly points to a change in the price trend for commodities starting at the turn of the
century. Since then, McKinsey estimates there has been a 147% increase in real commodity
prices.
Alongside the rise in prices the commodity markets are beset with increased volatility.
McKinsey estimated that the volatility in prices was higher in the first decade of the 21st
century than in any single decade through the 20th century. The clothing industry has
recently experienced rapid increases in the price for cotton: in 2010-11, floods in the major
cotton-producing areas of Pakistan and India, droughts in Australia, increases in Chinese
and Indian demand and raw commodity speculation combined to create a cotton price
bubble. Raw material prices for cotton spiked to a 150 year high in June 201114.
Rising prices have been driven by increased demand for resources brought about by
population growth and rapid economic development of emerging economies. McKinsey
projects that these trends are likely to continue into the foreseeable future as there are
estimated to be another 3 billion more middle income consumers in the world in the next 20
years. Resource price volatility has been driven by degradation in the environment reducing
the earth’s capacity to support the growing population and their resource needs, difficulties
in extracting remaining reserves of fossil fuels, political instability in oil-producing regions as
well as greater integration of global markets.
Furthermore, consumer goods businesses like those in the clothing sector are vulnerable to
rising input costs. Consumer goods businesses have developed business models that are
predicated on cheap raw materials and labour costs. Fashion businesses have globalised
sourcing raw materials and labour from low-cost countries in order to make a profit.
In a study conducted for the World Economic Forum, Deloitte states that most consumer
companies use 40% of their net sales revenue to cover the costs of resource-based inputs –
typically yielding gross profit margins of 10%, other things being equal, and with no pass-
through of costs to consumers, a company can find that an increase of raw material costs
can squeeze profit margins relatively quickly. For a typical company with profit margins of
13 McKinsey (2011), “Resource Revolution: Meeting the World’s Energy Materials, Foods and Water Needs 14 ibid

Error! No text of specified style in document. 11
10%, the year-on-year impact of a 3.5% increase in the price of resource-dependent inputs
could erode a company’s profit margins within a decade15.
Often when garments are produced in low cost labour countries, the true costs of production
have not been completely factored in. For example, in many countries from where cotton is
sourced, such as India and Pakistan, water use is rarely monitored. Furthermore, the price
paid for water by factories producing garments is not always reflective of the (social and
environmental) cost of consuming water, thereby generating a negative externality.
Resource constraints present significant challenges to businesses in the clothing sector and
present opportunities for businesses to extend the life of clothes and develop business
models based around product re-use.
2.2 Legislation and third party activities which strengthen the case for alternative
business models
Along with changes in the economic case for less resource-intensive business models, in
recent years there have been a number of business-led initiatives and changes in legislation
aiming to account for environmental externalities which are not currently included in
businesses’ accounting. These initiatives are making the environmental costs of the
conventional manufacture and retail business model clearer and as they develop further the
relative environmental benefits of extending the life of, making better use and encouraging
the re-use of clothes will become clearer.
Carbon has been rising up the agenda in boardrooms around the world. The Carbon Trust
estimates that 93% of multinationals are now addressing their own carbon emissions in
order to exploit reputational and efficiency gains16. There has been significant progress made
in measurement and reporting of carbon footprints (the amount of greenhouse gases
emitted during the product’s lifecycle). However the missing piece of the puzzle is carbon
emissions in the supply chain. These ‘Scope 3’ emissions can be the most emissions-
intensive phase of the carbon life cycle for many products. For example, the PUMA
Environment Profit and Loss (EPL) account shows that while the direct ecological impact of
its operations equates to £6.2m, an additional £74.7m falls upon its entire supply chain17.
The biggest impact was found at the point where raw materials are derived from natural
resources, such as the cultivation and harvesting of cotton and cattle ranching. This part of
the supply chain accounts for 35% of the total GHG (£14.3m) and 43% of water
consumption (£21.2m); indicating that the most water-intensive activity in the production of
a garment occurs at the initial step (ibid). If retailers were forced to take some accountability
for these carbon emissions it would change the relative attractiveness of carbon saving
business models.
Standards to drive down indirect carbon emissions are also evolving. The World Resources
Institute (WRI) and the World Business Council for Sustainable Development (WBCSD)
recently announced two new international standards for measuring and reporting indirect
15 Deloitte Touche Tohmatsu (2009) Sustainability for Tomorrow’s Consumer, World Economic Forum
16 Jones (2012) Cutting Carbon from the supply chain: a business critical mission, Environment Times, January 2012 17 http://www.guardian.co.uk/sustainable-business/jochen-zeitz-puma-online-q-a (accessed 07/03/2012)

Error! No text of specified style in document. 12
carbon emissions – the GHG Protocol Product Lifecycle Standard and Corporate Value Chain
Standard. These standards are starting to establish norms around the measurement and
reporting of indirect carbon emissions and mean that accounting for these carbon emissions
is one step closer.
Governments are beginning to legislate to ensure that environmental impacts are accounted
for in consumer choices. In the UK, in April 2012 the Energy and Climate Change report on
consumption-based emissions concluded “DECC should explore the options for incorporating
consumption-based emissions data into their policy-making process, alongside data on
territorial emissions. Considering both sets of data together will give a more complete picture
of the UK’s impact on the climate, and can be used to inform people of the impacts of their
own behaviour on global emissions.18”
In France, legislation under ‘Grenelle II’, a law on the national commitment to the
environment, creates a five year plan to achieve nationwide sustainability targets set to
202019. One element of this plan aims to increase consumers’ awareness of their carbon
footprint. The bill makes environmental labels mandatory on all consumer products sold in
France. A national experiment has been undertaken on the label with 168 companies
participating and 1000 products being tested. One of the indicators is the greenhouse gas
emissions (CO2e) based on a life cycle analysis methodology. Other indicators vary
per product category (like the level of toxic ingredients for a detergent). In addition to the
direct challenge of providing consumers with information in order to change their behaviour,
labelling also offers companies a means to achieve a competitive edge. It will provide them
with an incentive to reduce their consumption of natural resources and carbon, to decrease
their environmental impact and therefore facilitate a more robust response to fluctuations
and increases in the cost of energy and raw materials resulting from the growing pressure
placed on natural resources. As part of a raft of European and international initiatives, this
measure also incorporates a very strong challenge in the area of standardisation: what
universal measurement criteria can be used in the future and what information will therefore
be provided to consumers which will be likely to influence their choices?
Taken together, increasing resource constraints and a change in the legislative environment
for carbon and other environmental externalities put the traditional retail model of
production and retail without further responsibility through the lifecycle of products under
threat. This context pushes the market conditions further along a path to the point where
the tipping point scenarios are more likely to occur.
18 http://www.publications.parliament.uk/pa/cm201012/cmselect/cmenergy/1646/1646.pdf 19 http://www.developpement-durable.gouv.fr/National-experimentation-for-the#1 (accessed 07/03/2012)

Error! No text of specified style in document. 13
3.0 Methodology
This study focuses on the viability of different alternative business models which extend the
life of clothes, reduce the amount of clothes being sent to waste and create a displacement
effect in reducing the amount of new garments produced. In undertaking this study we used
a phased approach to understand how these alternative businesses may function, grow and
reduce resource consumption.
3.1 Phased approach
The phased approach included the following steps:
Desk-based research and interviews with existing providers of alternative business
models in the fashion industry: The team met with representatives from existing businesses
which map onto each of the business models in scope for the research (see section 4.0). The
interviews were designed to understand how the businesses operated, the market for their
activities, their core customers, the challenges the businesses face and the opportunities for
the businesses to grow and become more mainstream.
Financial modelling: Following the interviews, the authors developed two-page summaries
of each business model to be taken forward for financial analysis. In addition to the core
components of the financial models, which include revenue forecasts, profit and loss
statements, cash flow forecasts and fully integrated balance sheets, the models include
features that enable:
Quantification of the opportunities to build turnover and reduce raw material input costs
for each model.
Sensitivity and scenario analysis to assess:
how revenue can be impacted by changes in consumer demand; and
any other relevant risks, which could materially impact the projected returns.
Where appropriate, cost/benefit of lease, hire, take back and re-sale options.
Price sensitivities to consumer demand of hiring and leasing options.
Ability to identify timescales for achieving varied levels of return on investments for each
business model.
Cost/benefit of identified alternate business models vs. incumbent models.
The models were built from the perspective of retailers who may trial the models in the
future. Each financial model was constructed in line with industry modelling best practices
and developed to a high calibre so that they can be easily used and interpreted. The model
layout and structure is described in Appendix I.
Analysis and Evaluation: following the development of the financial models, the
implications for resource use and market impact were evaluated. Within each model there
are a variety of material assumptions which have significant impacts on its viability. The
authors have created multiple scenarios for each model changing the material assumptions
depending on the appraisal of each model. The first scenario aims to be a conservative
model based on current market conditions. Furthermore, the assumptions may be realistic
Error! No text of specified style in document. 14
based on the size of the potential market, but one would still need to be able to attract the
customers in the first instance for the potential demand to become actual demand.
Subsequent scenarios have been created to understand how the businesses might operate in
market conditions which allow a viability and payback time tipping point for the businesses.
In some cases it was necessary to create more than one tipping point scenario as there were
multiple variables in the models that could change.
3.2 Limits on Scope of Study and Assumptions Applied
The scope of this study is the examination of commercial viability of alternative business
models. Thus the financial modelling of each business model is based on its viability as a
standalone business and does not take into account the impact to sales of existing business
models. The resulting resource impacts are then examined from the alternative business
perspective to understand the likely benefits that could be achieved, should these business
models be taken up.
This study does not take into account the impact of the wide-scale adoption by large
retailers of these business models on existing small scale service providers such as high-
street repair services and charity shops.
It also does not take into account the impact on sales of products under retailers’ existing
business models. It is difficult to assess the net impact on sales of existing retailers without
analysing adoption rates of these new business models. Each business model is analysed
from an individual business perspective and does not provide an industry-wide analysis, nor
does it comment on how many retailers may adopt the new business model.
Many assumptions had to be made to build the scenarios in the financial models for each
alternative business model. Given the level of detail required in financial modelling and the
number of parameters per scenario per model, not all assumptions are set out in detail.
However, the work has endeavoured to source reliable estimates throughout, either from
information gathered from interviews with businesses or through research and published
data (e.g. inflation, wage inflation, etc.). Where assumptions were ‘material’ in that a small
change in the value of the figure assumed had a disproportionate effect on the model
outcomes they were validated with third party data.
As these are new models, there is relatively limited data to inform the assessment of the
assumptions, for instance on the likely take-up of services by consumers. At all times we
have aimed to be prudent in the assumptions underlying each model particularly in the case
of the conservative scenario. The result is that each model errs on the side of caution and
may be a conservative estimate of the business potential. In the subsequent scenarios only
a limited number of variables such as demand, volume or price for services were changed,
so the other variables remained under the prudent assumptions established when creating
the conservative scenario.
The potential demand for the business models was extrapolated from data from a survey of
consumer attitudes20 to alternative business models and combined with data from average
20 WRAP - Ipsos Mori & Nottingham Trent University (2012) Clothing Behaviour Research, January 2012

Error! No text of specified style in document. 15
market share of top 20 UK retailers21. In all cases, the demand potential, even when it is
deemed to be high, needs to be tapped into appropriately so that it materialises into take-up
of the service.
A 3% inflation rate is built into all models to reflect long-term price changes and applies to
all prices and costs (including labour costs).
3.3 Financial appraisal of each business model
There are several ways to financially appraise a business model or investment. In
undertaking the financial appraisal of each model, we used standard financial analysis
techniques and used the following key performance indicators:
‘Funds Needed’:
This statistic shows the maximum negative position at bank, which itself represents the
amount of funds an investor would need to invest in the project in order to deliver the
calculated returns. This is also referred to as the amount of ‘capital’ needed.
‘Return on Capital’:
Return on Capital (RoC) gives a sense of how well the model is using invested capital to
generate returns. Within the equation used to calculate the result, the amount of ‘returns’ is
the sum of the profit after tax anticipated to be generated within the forecast period
(ignoring the impact of any perpetuity calculations). These returns are then divided by the
amount of funds needed in order to show RoC.
In a situation where the option being modelled results in negative returns (i.e. projected
losses after tax for the entire forecast period) then the RoC is stated as ‘n/a’ as no capital
has been returned.
‘Cost of Capital’:
The Weighted Average Cost of Capital (WACC) is the sum of the cost of each funding
component (e.g. Bank Debt, Equity Investor, etc.) multiplied by each component’s assumed
proportional weight of the total funding employed, plus or minus an adjustment for a
perceived risk factor specific to a scenario – i.e. a blended cost of capital employed on a
project. Therefore, should the RoC be greater than the estimated WACC, it indicates that any
invested capital would been used effectively.
A WACC of 12% has been used in all the business models. The average WACC for a retailer
is 8.3%22, which is also the cost of capital for the leading high-street retailer used as a
benchmark in this modelling. Given that all the models are forecasting new business
concepts, an element of risk exists in the forecasts, hence for prudency an additional risk
element of 3.7% has been added onto the WACC applied.
21 Bloomsberg Data 22 http://people.stern.nyu.edu/adamodar/New_Home_Page/datafile/wacc.htm - Retail store Cost of Capital
Error! No text of specified style in document. 16
‘Payback’:
The payback period provides an indication of the length of time it will take to recoup the
amount of capital invested into the project. Naturally the shorter the payback period, the
quicker the capital has been returned to an investor. Payback is calculated as the number of
months until the projected bank balance returns to positive for the remainder of the forecast
period, divided by twelve in order to express the statistic in years.
Much like RoC, in a situation where the option being modelled results in negative returns
(i.e. the bank balance is never positive due to there being poor projected performance), then
the payback statistic is stated as ‘n/a’ as the invested capital is never paid back.
'Net Present Value’:
The Net Present Value (‘NPV’) is the sum of the future discounted cash flows of a project, so
essentially the difference between the present value of cash inflows and the present value of
cash outflows. NPV is used in capital budgeting to analyse the profitability of an investment
or project.
The projected cash flows are discounted using the WACC to arrive at a present value of
those future cash flows, therefore adjusting for the time value of money.
A positive NPV indicates the projected performance delivers a return greater than the cost of
capital employed, therefore a positive activity to carry out, and vice versa.
The NPV calculation can also be adjusted to illustrate the effect of continuing each business
model's operational activities into perpetuity, but for the purposes of this study, all business
models have been assessed on a 5 and 10 year period.
Internal Rate of Return’:
An Internal Rate of Return (‘IRR’) can be considered as the rate of compound growth a
project is expected to generate. Adjusting for the time value of money, the sum of Capital
Invested (aka Funds Needed) will grow by this IRR each year (compounded) until the end of
the forecast period.
In a situation where there is a negative NPV, more often than not an IRR cannot be
calculated for the project, as the capital invested has not ‘grown’ across the forecast period,
but rather contracted.
3.3.1 Profitability Appraisal:
In addition to the project valuation appraisal techniques described above, it is also prudent
to conduct an appraisal of the profitability of each business model. In understanding the
profitability of each model, the following performance indicators have been considered:
'Variable costs'
Variable costs of a business are those that are directly tied to the production or service
activity of a business. They include costs such as direct material or direct labour costs that
are incurred in order to deliver a product or service. Variable costs change in line with
volume of sales.

Error! No text of specified style in document. 17
'Fixed costs'
Fixed costs are those that do not change in line with the level of goods produced or services
provided, therefore are incurred regardless of sales volumes. Examples of fixed costs
include administrative and support staff and property rental costs.
'Gross profit margin'
The gross profit of a business is the amount of money left over from sales after paying for
cost of sales. Gross profit margin per £ of revenue provides a measure of how much money
is left, from each £ of revenue generated, to cover operational expenses, and therefore is an
indication of the financial liquidity of a company and its ability to cover fixed costs. The
higher the gross margin, the better positioned it is to cover operational expenses or handle
any surprise expenses.
Retailers also measure gross profit per square footage of selling space, as it provides an
indication of how much profit an item generates for each square foot of selling space it
occupies. Since availability of retail space can be limited and also expensive, measuring the
gross profit margin of an item per square footage helps a retailer make the best use of retail
space from a profitability perspective.
'Operating profit margin'
Operating profit refers to profit generated after paying for general operating expenses, such
as manufacturing, distribution and administration, but before interest and taxes (EBIT).
Operating profit margin provides a measurement of how much profit a company makes
(before interest and taxes) per £ of revenue.
Similar to gross profit margin per square footage, operating profit margin per square footage
provides a retailer with an indication of the amount of profit generated (before interest and
taxes) per square foot of retail space.
'Earnings Before Interest, Depreciation & Amortisation' (EBITDA)
The key difference between operating profit and EBITDA is that 'non cash' expenses such as
depreciation and amortisation are added back to the EBITDA figure. EBITDA provides a
better indication of to what extent expenses that require cash payments are covered by the
revenue generated and hence is preferred over Net Income in assessing the financial
strength of a company.
3.4 Resource impact appraisal of each business model
Wherever possible we have used WRAP data to calculate the non-financial performance of
the alternative business models. We have based all calculations on cotton T-shirts. Although,
cotton is one of the most environmentally damaging fibres, with a particularly large water
footprint, it is also the most commonly used fibre, representing over 50% of a brand’s
garment collection.23 Hence, cotton has been used in various studies as a generic item of
clothing to calculate resource impacts. Due to the lack of availability of data on other fibres
by garment type, data on cotton T-shirts has been used to estimate resource impacts in this
23 Based on MADE-BY data

Error! No text of specified style in document. 18
study. T-shirts are a relatively light garment so if other garments had been chosen the
weight impacts would be greater. WRAP has commissioned a series of reports on re-use of
garments24, the carbon footprint of clothing and the embodied water. These studies have
been used to measure the carbon, waste and water savings that can be achieved by each
model. The following provides a description of the data used and how it has been applied:
Carbon: 1 tonne of T-shirts for direct re-use can result in a net GHG saving of 13 tonnes
CO2-eq. This is approximately 3kg of CO2-eq savings per T-shirt re-used. This is
assuming 1 re-used garment displaces 0.6 new purchases. However if the displacement
effect was 1 to 1 (the extent of avoiding the purchase of new T-shirts as a result of re-
use) the net GHG savings would increase to 21 tonnes CO2-eq25.
Water: One tonne of cotton T-shirts has an embodied water footprint of 3,100 m3, of
which around 85% is contributed by raw materials and 15% in the production of
garments26. The water footprint study estimates that over the lifecycle of a garment the
water consumption in the ‘in-use’ phase is relatively insignificant, as the water used
during this phase is returned to the same catchment, and therefore does not “count” as
net consumption according to the method for calculating a water footprint.
Waste: The amount of waste reduced is a combination of the garments saved from going
to waste plus the garments displaced.
Carbon and water savings are only attributed to the displaced garments and not to the
garments saved from going to waste. For waste, as stated above, savings are achieved
through a combination of garments saved and displaced.
The amount of resource savings that can be achieved is based on the weight of the garment
being displaced and saved, when calculating waste. An average weight of 0.33kg/garment
has been applied for adult garments and 0.07kg/garment for baby garments.
The displacement effect varies for each model, and the resource savings are dependent on
the displacement effect applied and are explained further within the Estimation of potential
to reduce resource impacts section of each model. Carbon and water savings are calculated
by applying the displacement effect as a multiplier to carbon and water, assuming a baseline
of 21 tonnes of carbon saved per tonne of garment displaced and 4,695 m3 of water saved
per tonne of garment displaced27. The amount of waste saved is derived by multiplying the
number of garments saved and displaced, by the weight of a garment.
‘Total Garments Saved’ (Waste Reduced):
All models are built to track the number of garments saved as a result of re-use/repair,
multi-lease or hire, take back and recycling.
24 WRAP (2011a) Benefits of Re-use Case Study: Clothing - November 2011 25 ERM (2012) Quantifying the carbon footprint of clothing and the potential savings 26 URS (2011) Embodied Water in Clothing and Opportunities for Savings 27 This was an interim estimate of the water footprint of clothing supply per tonne of clothes, averaged across the main fibre
types, available when this report was prepared. Revised estimates were included in a report on the water footprint of clothing
published by WRAP in July 2012, which would increase the value to 5485 m3/tonne. Therefore this report provides a
conservative estimate of the potential water footprint reduction in the supply chain as a result of the displacement effect.
Error! No text of specified style in document. 19
In the non-financial approaches to appraisal, based upon specific assumptions for each
option, the calculation tracks the number of garments that the alternative business models
may displace from typical retail operations.
As retailers sell multiple types and styles of garments, tracking the mix of garments is out of
scope within these calculations. Instead an average garment type is assumed across all of
the models, also with the same average garment weight assumption28.
The total weight of garments saved (and material saved as a consequence) is calculated in
relation to the total weight of material not consumed by the typical retailers, due to the
reduction in their new product sales following the displacement of garments mentioned
above. Each model also subtracts (from the amount of material saved) the weight of
garments/materials consumed specific to the trading methods employed by each option (e.g.
material used in garment repairs), delivering a ‘net weight saved’ statistic.
‘Total Carbon Saved’:
Using the net weight saved, the model calculates an approximate sum of carbon saved
expressed in kilograms of carbon-dioxide saved per tonne of net weight saved throughout
the projected model period. The same ratio of material weight to carbon saving is employed
across all of the options being calculated.
‘Total Water Saved’:
Very similar to the method employed to calculate Total Carbon Saved, the number of litres of
water that would have been consumed by the garments being produced and sold via a retail
outlet are also tracked. Again using the Net Weight Saved, the appropriate amount of water
saved across the projected period is shown.
3.5 Analysis of market size for each business model
In December 2011, WRAP commissioned a consumer survey of 7950 adults (aged 16+) from
across the UK on attitudes to clothing29. Where possible, this consumer survey was used
when estimating the market size for each business model. The headline findings from this
research show many people buy second-hand clothing from charity shops and online, but
few hire or lease clothing. There is considerable interest amongst consumers for hiring of
clothes particularly for designer dresses, formal wear and clothes for socialising. Further
detail and analysis is presented within the analysis of each model.
3.6 Comparison with mainstream retail models
The aim of this report is to assess the commercial viability for clothing retailers to take up
the alternative business models identified. With this is mind, each model has been compared
against a conventional retailer’s operations from a financial perspective. For the purposes of
this work, the financial requirements of a leading high-street clothing retailer (referred to as
the benchmark retailer throughout this report) have been selected to provide the baseline to
assess the commercial viability of the models in this study (except for model 5).
28 Weight per garment 0.33kg based on MADE-BY data 29 WRAP - Ipsos Mori & Nottingham Trent University (2012) Clothing Behaviour Research, January 2012

Error! No text of specified style in document. 20
The benchmark retailer in question was selected for a range of different reasons:
They are a mid-market clothing retailer, with over 500 stores in the UK. Lessons drawn
from this retailer may be applicable to retailers operating at both higher and lower price
points.
There is a wealth of data in the public domain about the business as it is a public limited
company. Many clothing retailers are either privately owned or subsidiaries of other
companies. The supermarket retailers whilst also being public limited companies sell a
broad range of groceries and non-clothing products, meaning that it is difficult to use
public data to analyse the clothing areas of their business.
The company has already conducted studies on their customers’ price point sensitivities
and elasticity of demand.
They have a product range that lends itself well to cover the models represented.
Model 1: Their garments are typically of a quality and price point higher than
disposable ‘fast fashion’ and in the future consumers are more likely to repair rather
than discard their product.
Model 2: Their product ranges includes baby/children’s clothes and accessories,
which can potentially be leased.
Model 3: The consumer behaviour survey indicates hiring of clothes is likely to be
considered for special occasions and formal wear, which form a part of the retailer’s
product line
Model 4: The relatively higher quality of the retailer’s products means that they are
likely to retain their attractiveness for re-use and /or restyling
It is already taking steps to adopt sustainable business models and be positioned as a
market leader and ‘role model’ for the fashion industry.
When considering store expansions, the benchmark retailer aims to achieve the financial
hurdles of a 24 month payback period and 15% return on capital invested. Hence, in each
scenario appraisal we have aimed to understand what would be required to achieve similar
results, so that the model may be taken up by a large scale retailer.

Error! No text of specified style in document. 21
4.0 Business Models
There are already a number of sustainable fashion brands experimenting with business
models such as re-use and refashioning clothes, which are indicators of the potential for the
market. We researched these businesses to provide indicators of how the models developed
for this study might work. Key elements gathered in this phase included: revenue streams,
prices charged and key business costs.
Business Model 1: retailers or manufacturers providing repair and upgrading services for
their own garments:
‘Here today, Here Tomorrow’ is a design and make studio/retail space in Dalston,
London which specialises in sustainable fashion. The graduates from London College of
Fashion run regular workshops focused on repairing clothes and making bespoke
clothing alterations including trims and materials. Participants just need to bring along
something old they want to turn into something new. In the workshops, participants
learn how to hand sew on studs, ribbons and lace, creating a new bespoke garment.
Business Model 2: retailers providing radical new large-scale leasing services (e.g. for baby
clothes);
In Germany, Lűtte Leihen provides a leasing service for baby clothes for the first six
months. All the baby clothes are 100% organic clothes and are delivered to the house
laundered.
Business Model 3: retailers providing radical new large-scale services for one-off hire;
Wishwantwear is an online hiring service for women’s dresses. They have an archive of
1000 designer dresses (r.r.p. £250 to £2000) which are available to hire at 10-15% of
the retail price. Included in the hire price is the cost of insurance and postage. Women
can select the dresses they wish to wear on a website and the dresses are shipped to
the customer with packaging for shipping back after 4 days. A dress which might be
bought and worn once might be used up to 50 times in a year using the hire model.
Business Model 4: retailers offering a re-sale section for own-brand garments within their
store (e.g. in conjunction with a buy-back offering):
The American outdoor brand Patagonia has a “Common Threads” take-back and
recycling scheme which has been running since 2005.
Christopher Ræburn has become known for his utilisation of re-appropriated military
fabrics to create garments that are functional, intelligent and meticulously crafted. All
Raeburn garments are proudly ‘Remade in England’ and produced in East London.
TRAID is a UK registered charity which is ‘helping the nation give up its unwanted
clothes for good’. TRAID takes donations of unwanted clothes from around the
country, sorts them for re-use and resale. TRAID currently operate a network of 1,400
clothing banks around the country and 10 retail units around London where garments
are resold. The clothes are taken to a depot in Wembley where they are sorted based
on the quality of the garment. Of the donated clothing: 14-16% is sorted for resale,
2.5% is selected to be restyled and then resold, 8% is ruined or (contaminated), 72-
74% is sent to merchants for commercial recycling. TRAID remade is a brand of
restyled garments developed by TRAID.

Error! No text of specified style in document. 22
Orsola de Castro, creative director of eco-pioneer label From Somewhere and Reclaim
To Wear is collaborating with students at Central Saint Martin’s to present a collection
at Esthetica. Reclaim to Wear’s method is to produce clothes using the fashion
industry's surplus such as stock, remnants and off-cuts.
Business Model 5: peer to peer exchange of clothes:
Buymywardrobe organises events where women can buy and sell upmarket fashion.
Events are held in exclusive London Members Clubs. Sellers are invited to sell their
wardrobe and 100-300 women attend to buy. Buymywardrobe charges an exclusive
VIP hour rate where buyers get first access to the clothes and dresses.
Buymywardrobe will be launching an online exchange in May 2012. The marketplace
will be exclusive through an invitation and peer-only invite model. The events will
continue with the online marketplace in 2012. Buymywardrobe envisages a future
where the events are licensed in other cities in the UK.
Ecomodo is a not-for-profit peer-to-peer website which allows people to post and hire
items from people in their local community. Items can be exchanged for free, lenders
can charge a small fee or ask for a donation to charity. Lenders can also get their
items insured. Based on the concept of ‘collaborative consumption’ Ecomodo allows
people to make better use of items they own and build their community at the same
time. At the time of writing the website has 2,200 members and 1347 items available
to hire. The majority of items are practical tools (drills, ladders etc.) rather than clothes
and fashion; however the model could work for clothes.
Of these businesses, five including Here today, Here tomorrow, Buymywardrobe, Lutte
Leihen, TRAID and Wishwantwear were interviewed as part of the initial research for this
project.
Many of the businesses outlined above are small scale sole operators or start-ups with
limited scalability. In moving to the financial modelling stage of the research, the aspects of
these business models that limited the scalability were removed or downplayed, such as
price points and distribution channels.
4.1 Alternative Model Descriptions
The five business models developed in this study cover a range of different ways to extend
the use of clothing and reduce the clothing going to waste.
Business Model 1: retailers or manufacturers providing repair and upgrading services
for their own garments (with implications for design for durability, and new types of
warranty and service support);
Business Model 2: retailers providing radical new large-scale leasing services (e.g. for
baby clothes);
Business Model 3: retailers providing radical new large-scale services for one-off hire;
Business Model 4: retailers offering a re-sale/restyled section for own-brand garments
within their store
Business Model 5: peer to peer exchange of clothes
Some of the business models (models 2 & 3) are services provided by retailers which are
designed to be more resource efficient than the traditional buying and selling of garments. It

Error! No text of specified style in document. 23
is envisaged that these models will be implemented alongside more traditional retail of
garments. Others (models 1 & 5) are about consumers learning to take better care of their
clothes or making better use of their wardrobes through lending and exchange through
social media websites. These may be facilitated by retailers in the case of Model 1 or
completely independent of retailers in the case of Model 5.

Error! No text of specified style in document. 24
5.0 Business Model 1: Retailers offering repair & upgrading services of
own garments
Model 1 is based around the idea that many garments could be repaired rather than sent to
waste. However, many consumers do not have the skills to repair their own garments and
existing repair services are not located in convenient locations to serve their needs30.
Furthermore clothing repair services should be accessible to consumers and located in
convenient locales. It should be borne in mind another barrier to consumers repairing their
own clothes is the price of repairs versus the original price of the garment and versus the
perceived value of the worn garment in a context of fast fashion.
Analysis of related factors / market projections
The consumer survey provided weak signals for consumer demand for repairing garments or
wanting to learn how to repair their garments.
50% of consumers stated that they already bought clothes to last and 16% admitted
to having items in their wardrobe that were worn out (beyond repair).
There is little evidence, based on survey findings, to suggest that repairing garments
would lead to a significant reduction in purchase of new garments. When directly
asked how many unworn garments (over 12 month period) would be worn upon
repairing, the majority said none (32%) or only a few (34%) (Figure 1 below).
Around 30% of consumers said that they would wear more than 50% of their unworn
garments again if they could be repaired.
36% said that would use an independent tailor to alter clothes on their behalf.
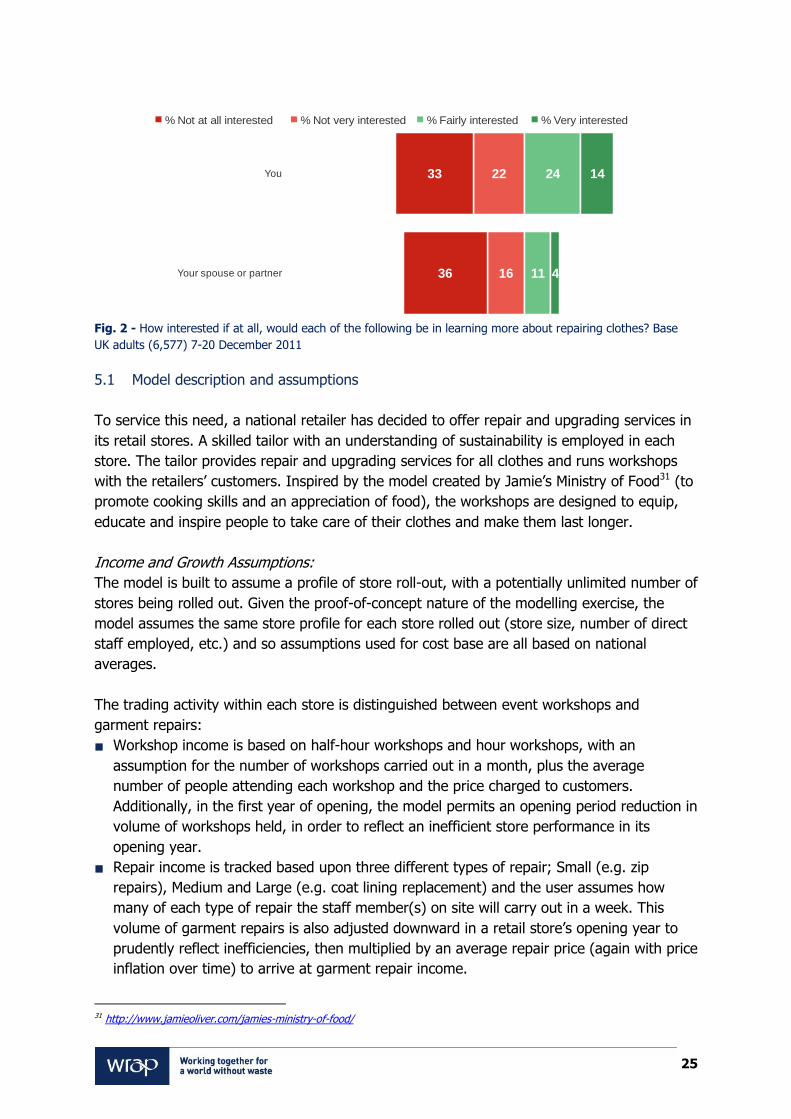
The research showed some interest in consumers wanting to develop skills to repair
clothes, with 24% reporting that they were fairly interested and 14% reporting they
were very interested. However, the majority showed no interest at all or very little
interest in wanting to repair their clothes, at 33% and 22% respectively.
Fig. 1 - How many of the clothes they have worn could be used if repaired? Base UK adults (6,577) 7-20
December 2011
30 Ipsos Mori & Nottingham Trent University (2012) Clothing Behaviour Research, January 2012
32%
34%
9%
3%
4%
5%
7%
6%
None
Only a few
Some of them (but less than half)
Around half of them
Many of them (not all but more than half)
Nearly all of them
All of them
Don’t know
Error! No text of specified style in document. 25
Fig. 2 - How interested if at all, would each of the following be in learning more about repairing clothes? Base
UK adults (6,577) 7-20 December 2011
5.1 Model description and assumptions
To service this need, a national retailer has decided to offer repair and upgrading services in
its retail stores. A skilled tailor with an understanding of sustainability is employed in each
store. The tailor provides repair and upgrading services for all clothes and runs workshops
with the retailers’ customers. Inspired by the model created by Jamie’s Ministry of Food31 (to
promote cooking skills and an appreciation of food), the workshops are designed to equip,
educate and inspire people to take care of their clothes and make them last longer.
Income and Growth Assumptions:
The model is built to assume a profile of store roll-out, with a potentially unlimited number of
stores being rolled out. Given the proof-of-concept nature of the modelling exercise, the
model assumes the same store profile for each store rolled out (store size, number of direct
staff employed, etc.) and so assumptions used for cost base are all based on national
averages.
The trading activity within each store is distinguished between event workshops and
garment repairs:
Workshop income is based on half-hour workshops and hour workshops, with an
assumption for the number of workshops carried out in a month, plus the average
number of people attending each workshop and the price charged to customers.
Additionally, in the first year of opening, the model permits an opening period reduction in
volume of workshops held, in order to reflect an inefficient store performance in its
opening year.
Repair income is tracked based upon three different types of repair; Small (e.g. zip
repairs), Medium and Large (e.g. coat lining replacement) and the user assumes how
many of each type of repair the staff member(s) on site will carry out in a week. This
volume of garment repairs is also adjusted downward in a retail store’s opening year to
prudently reflect inefficiencies, then multiplied by an average repair price (again with price
inflation over time) to arrive at garment repair income.
31 http://www.jamieoliver.com/jamies-ministry-of-food/
% Not very interested% Not at all interested % Fairly interested % Very interested
22
16
33
36
24
11
14
4
You
Your spouse or partner

Error! No text of specified style in document. 26
All of the above income assumptions are adjusted by retail specific seasonality assumptions
in order to track the monthly demand of each of the workshops and garment repairs, and
thus more accurately calculate higher profitability in busy months versus lower profitability in
quiet months.
Variable Cost Base:
The variable costs are driven by the number of stores rolled out and the total volume of
workshops and garment repairs estimated across all stores. A brief summary of each variable
cost is as follows:
Materials Purchased – the materials cost of each garment repair is multiplied by the
volume of garments repaired in a month, therefore calculating Cost of Goods Sold. In
addition to this, the model also tracks Stock assumptions to calculate the amount of
working capital a retailer must invest in order to carry sufficient level of material.
Direct Staff Costs – are based upon the number of staff employed at each retail store,
multiplied by their average salary cost (plus employer’s NI), adjusted over time to include
pay rises32;
Machine Rental Costs – reflects the monthly rental charge for hiring X number of sewing
machines on site, in order to deliver both the garment repairs and hold the workshops
with the public. The number of machines hired is dependent on store roll-out33.
Property Costs – tracking the total square footage of the entire retail portfolio, multiplied
by an average property cost per square foot (inclusive of rent, rates, utilities, etc.)34; and
Fit-Out Costs – although not a P&L item, the model incorporates an amount incurred for
each new store opening in order to fit-out the premises ready for the new trading
activities (plus any other variable one-off costs at store opening).
All of the variable cost assumptions are adjusted for cost price inflation over time.
Fixed Cost Base:
In addition to those costs that behave in line with the volume of sales and stores, other
overhead assumptions are incorporated to cover back office/administrative staff and other
general administration overheads. This also includes any one-off investments that are not
covered by the variable store fit-out assumptions above.
5.2 Financial Modelling and Analysis
To assess the commercial viability of this business model, it has been analysed under two
scenarios:
The conservative scenario: scenario based on conservative assumptions of volume of
repairs and workshops and prices that are likely to be achieved. The volume of
repairs conducted, number of people attending workshops and prices charged to
attend under this scenario are based on volumes and prices currently experienced by
businesses currently offering similar services.
The tipping point scenario: scenario where retailers are 'likely' to start offering the
service due to sufficient profit margins and/or sufficient demand created. Volume of
32 All staff costs were validated on retailweekjobs.com (accessed 26/03/2012) 33 Machine rental costs validated at http://directsewingmachines-px.rtrk.co.uk/ (accessed 26/03/2012) 34 Average retail costs per square foot European averages from Bloomsberg data
Error! No text of specified style in document. 27
repairs and number of people attending workshops were increased to reach desired
results.
The following assumptions are constant, therefore applicable to both scenarios:
one tailor/staff per store, offering workshops and repair services plus administrative
support staff at head office
machine rental cost of £50/annum each
property maintenance cost at £5/square foot
initial store fit out cost for each store is £37,500, which equates to £75/square foot
The costs above have been verified against prices currently charged by high-street repair
service providers and providers of repair workshops (e.g. Here today, Here Tomorrow).
Marketing costs are included in the tipping point scenario only.
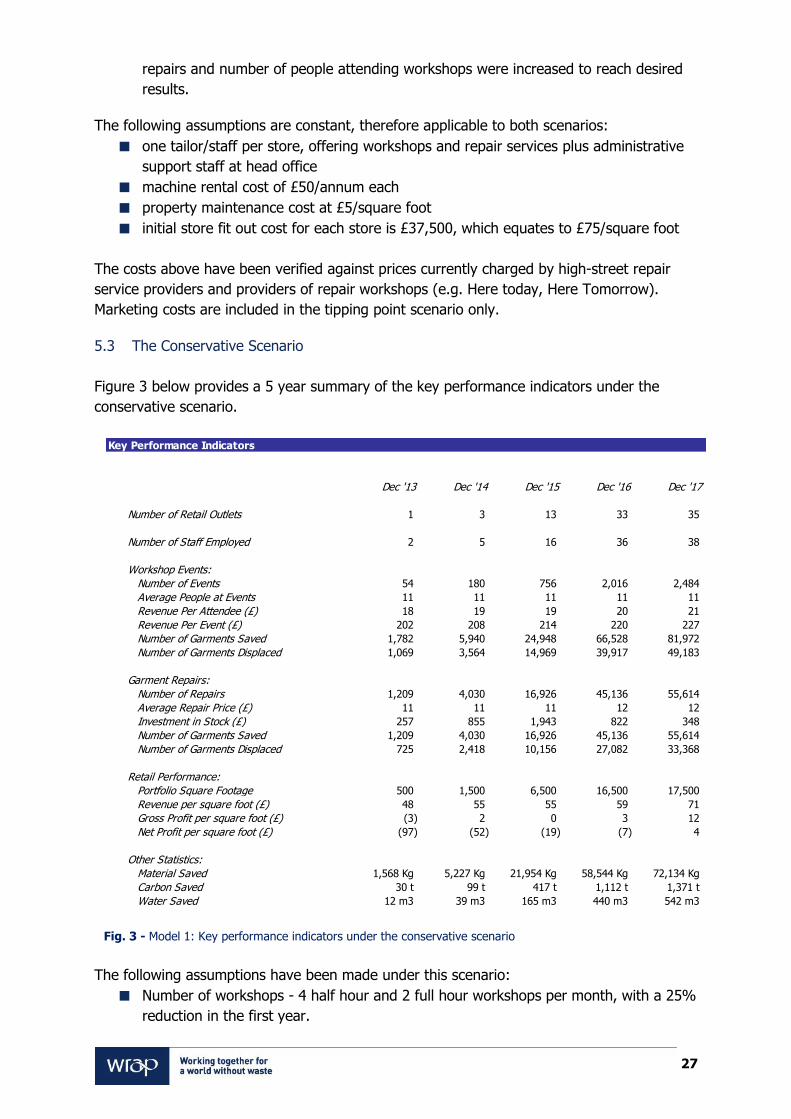
5.3 The Conservative Scenario
Figure 3 below provides a 5 year summary of the key performance indicators under the
conservative scenario.
Fig. 3 - Model 1: Key performance indicators under the conservative scenario
The following assumptions have been made under this scenario:
Number of workshops - 4 half hour and 2 full hour workshops per month, with a 25%
reduction in the first year.
Key Performance Indicators
Dec '13 Dec '14 Dec '15 Dec '16 Dec '17
Number of Retail Outlets 1 3 13 33 35
Number of Staff Employed 2 5 16 36 38
Workshop Events:
Number of Events 54 180 756 2,016 2,484
Average People at Events 11 11 11 11 11
Revenue Per Attendee (£) 18 19 19 20 21
Revenue Per Event (£) 202 208 214 220 227
Number of Garments Saved 1,782 5,940 24,948 66,528 81,972
Number of Garments Displaced 1,069 3,564 14,969 39,917 49,183
Garment Repairs:
Number of Repairs 1,209 4,030 16,926 45,136 55,614
Average Repair Price (£) 11 11 11 12 12
Investment in Stock (£) 257 855 1,943 822 348
Number of Garments Saved 1,209 4,030 16,926 45,136 55,614
Number of Garments Displaced 725 2,418 10,156 27,082 33,368
Retail Performance:
Portfolio Square Footage 500 1,500 6,500 16,500 17,500
Revenue per square foot (£) 48 55 55 59 71
Gross Profit per square foot (£) (3) 2 0 3 12
Net Profit per square foot (£) (97) (52) (19) (7) 4
Other Statistics:
Material Saved 1,568 Kg 5,227 Kg 21,954 Kg 58,544 Kg 72,134 Kg
Carbon Saved 30 t 99 t 417 t 1,112 t 1,371 t
Water Saved 12 m3 39 m3 165 m3 440 m3 542 m3
Error! No text of specified style in document. 28
Workshop revenue - half hour sessions are priced at £15 and full hour sessions at
£25, equating to an average price of £18 per person, as indicated in the summary
table above.
Number of garments saved - for each person attending a workshop, it has been
assumed that a total of 3 garments will be re-used, therefore saved from going to
waste. In addition, for each garment that is re-used, it has been assumed 0.6 of a
new garment purchase has been displaced.35
Price of repairs - includes a combination of small, medium and large repairs, at a
price of £7, £15 and £25 respectively, resulting in an average repair price of £11.
These prices are based on prices currently charged by existing repair service
providers.
Number of repairs - 20 small, 8 medium and 3 large repairs per week.
It should be noted that the assumptions behind number of workshops held per month
and repairs conducted per week is driven by what the expected demand is as
opposed to capacity of offering these services. Consumer surveys indicates low
demand for repair services, hence the volume of these services in this scenario is at a
lower end. This was further confirmed by an informal survey conducted with three
existing repair service providers. The potential to operate at full capacity of these
services is explored in the tipping point scenario.
Fig. 4 - Model 1: Financial appraisal under the conservative scenario
Funds needed and cash flow:
The amount of capital required by a retailer to undertake business model 1, based on
assumptions presented in this scenario, is £1,725k. This amount represents the
highest negative balance the retailer would experience over a 10 year (or 5 year)
period, hence would have to ensure this amount of capital is secured before
undertaking this project.
Although a retailer would start to generate profits from year 9, a positive cash
position is not experienced over a 10 year period.
Net Present Value (NPV) and Payback Period:
The negative NPV of £1,180k, which is the present 'discounted' value of future cash
flows, over a five year period indicates that a retailer is unlikely to undertake this
business model under the assumptions presented in this scenario.
The conservative scenario does not provide any payback over a 10 year period.
When comparing this to the benchmark retailer, who looks for a payback period of 24
months when considering a new venture, it is unlikely that a retailer would undertake
this project.
35 WRAP (2011a) Benefits of Re-use Case Study: Clothing - November 2011
Timeframe
Funds
needed NPV Payback
Return on
Capital IRR
Gross profit
margin per £ of
revenue (avg)
Gross profit
per square
footage
(avg)
Operating
Profit
Margin
(avg)
Operating
profit per
square
footage
(avg) EBITDA (avg)5 years £1,725k (£1,180) n/a n/a n/a 10% £6 -39% (£24) -7%
10 years £1,725k (£1,071) n/a n/a n/a 15.7% £12 -10% (£7) 5%
Model 1 Appraisal - Financial
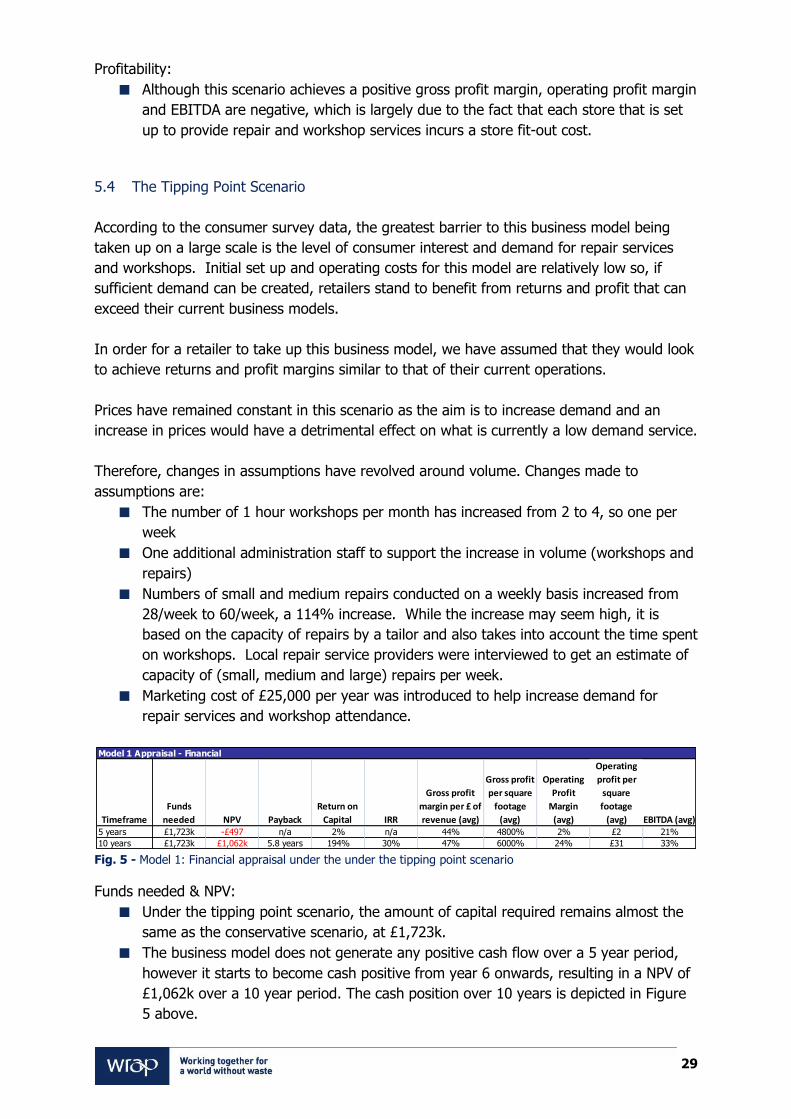
Error! No text of specified style in document. 29
Profitability:
Although this scenario achieves a positive gross profit margin, operating profit margin
and EBITDA are negative, which is largely due to the fact that each store that is set
up to provide repair and workshop services incurs a store fit-out cost.
5.4 The Tipping Point Scenario
According to the consumer survey data, the greatest barrier to this business model being
taken up on a large scale is the level of consumer interest and demand for repair services
and workshops. Initial set up and operating costs for this model are relatively low so, if
sufficient demand can be created, retailers stand to benefit from returns and profit that can
exceed their current business models.
In order for a retailer to take up this business model, we have assumed that they would look
to achieve returns and profit margins similar to that of their current operations.
Prices have remained constant in this scenario as the aim is to increase demand and an
increase in prices would have a detrimental effect on what is currently a low demand service.
Therefore, changes in assumptions have revolved around volume. Changes made to
assumptions are:
The number of 1 hour workshops per month has increased from 2 to 4, so one per
week
One additional administration staff to support the increase in volume (workshops and
repairs)
Numbers of small and medium repairs conducted on a weekly basis increased from
28/week to 60/week, a 114% increase. While the increase may seem high, it is
based on the capacity of repairs by a tailor and also takes into account the time spent
on workshops. Local repair service providers were interviewed to get an estimate of
capacity of (small, medium and large) repairs per week.
Marketing cost of £25,000 per year was introduced to help increase demand for
repair services and workshop attendance.
Fig. 5 - Model 1: Financial appraisal under the under the tipping point scenario
Funds needed & NPV:
Under the tipping point scenario, the amount of capital required remains almost the
same as the conservative scenario, at £1,723k.
The business model does not generate any positive cash flow over a 5 year period,
however it starts to become cash positive from year 6 onwards, resulting in a NPV of
£1,062k over a 10 year period. The cash position over 10 years is depicted in Figure
5 above.
Timeframe
Funds
needed NPV Payback
Return on
Capital IRR
Gross profit
margin per £ of
revenue (avg)
Gross profit
per square
footage
(avg)
Operating
Profit
Margin
(avg)
Operating
profit per
square
footage
(avg) EBITDA (avg)5 years £1,723k -£497 n/a 2% n/a 44% 4800% 2% £2 21%
10 years £1,723k £1,062k 5.8 years 194% 30% 47% 6000% 24% £31 33%
Model 1 Appraisal - Financial

Error! No text of specified style in document. 30
Return on Capital and Payback:
Return on Capital (ROC) – The assumptions in the tipping point scenario show a very
low return on capital that would be invested at 2.2% over a 5 year period, however,
over a 10 year period it provides a significantly higher ROC of 194%, far exceeding
the 15% which is seen as competitive by the benchmark retailer. This is largely due
to the longer timeframe in which the model can achieve and maintain profitability.
The question that is posed is, would a retailer be willing to wait 10 years to achieve
(or exceed) required returns, as is the case in this scenario?
Whist the assumptions applied in this scenario may not provide a payback period of 2
years; it does have potential to achieve a significantly higher ROC.
Profitability
This model under scenario two achieves breakeven and becomes profitable year 4
onwards and becomes cash positive from year 6, as demonstrated in Figure 6.
Gross profit margin achieved per unit of revenue over a 5 year period is 44%, which
is over 10% higher than that achieved by the benchmark retailer; however per
square footage this margin is significantly lower. The benchmark retailer’s 5 year
gross profit per square footage is just under £200 compared to £48 in this scenario.
This is largely due to the relatively higher space required (500 sq. ft.) within a retail
store for repair and workshops.
Operating profit per square footage is nearly at breakeven under this scenario, at £2
per sq. ft., compared to the benchmark retailer’s average of over £100 per sq. ft. For
further comparison purposes, European 4 year average operating profit is £119 / sq.
ft. and 15% per £ of revenue.36
Assessment of potential commercial attraction / value
The clothing industry has experienced increased cost of raw materials, particularly cotton, in
recent times. When cotton prices reached historical highs in 2010, fashion brands absorbed
some of that cost rather than passing it in full to consumers via increased price for
garments, thereby experiencing major hits to their bottom line. It is likely that in the future,
retailers may not be able to absorb such cost increases and will pass them on to the
consumer.
Depending on the price elasticity on demand, this could hit bottom line due to decrease in
demand for purchase of new garments, particularly for price sensitive consumers, and
potentially increase demand for repair and workshop services. However, the true impact on
demand is difficult to gauge since research from the benchmark retailer indicates that
consumers are fairly elastic to increases in prices. Despite nearly a 10% increase in price of
garments, total revenue (for the year ended January 2011) decreased by just over 2% when
looking at just the retail arm of the benchmark retailer.
Variations upon the theme of Model 1 might be worth exploring. For instance, the workshops
could be a mobile offering moving around the country or take the form of a pop-up shop.
36 Bloomberg, company reports

Error! No text of specified style in document. 31
Fig. 6 - Model 1: trends in income, expenses and cash under the tipping point scenario
5.5 Estimation of potential to reduce resource impacts
Figure 7 shows the number and weight of garments saved and the carbon and water savings
for both scenarios.
Fig. 7 - Model 1: Resource impact appraisal under conservative (1) and tipping point scenarios (2)
Garments saved:
Repairs - for each repair (small medium or large), it has been assumed that one
garment has been saved from going to landfill, plus 0.45 of a new garment purchase
has been displaced. This is a prudent assumption based on the thought that one
garment repaired will not necessarily replace a new garment.
Workshops - for each person attending a workshop, it has been assumed that an
average of 3 garments will be saved/re-used plus 1.0 of a new garment displaced for
Minimum cash reserves of NEGATIVE £1,723k, as at 31 January 2016
(2,000)
(1,000)
-
1,000
2,000
3,000
4,000
Dec '12
Jul '13
Feb '14
Sep '14
Apr '15
Nov '15
Jun '16
Jan '17
Aug '17
Mar '18
Oct '18
May '19
Dec '19
Jul '20
Feb '21
Sep '21
Apr '22
Nov '22
Trends in Income, Expenses & Cash (£'000s),for the ten years to 31 December 2022
Total Income Total Expenses Bank Balance
Timeframe
# of
garments
saved***
Garments
saved in
weight*
Carbon
Saved*
Water
saved**
# of
garments
saved***
Garments
saved in
weight*
Carbon
Saved*
Water
saved**
5 Years 419,787 137 778 173 684,283 224 1,290 288
10 Years 1,534,630 502 2,844 635 2,501,558 817 4,716 1,055
* weight in tonnes
**in cubic meters
*** includes garments displaced
Model 1 Appraisal - Resource Impact
Scenario 1 Scenario 2

Error! No text of specified style in document. 32
each garment saved. This is a prudent assumption based on the idea that with the
skills to repair garments, people will make their clothes last longer but the
relationship between repairing an item of clothing and buying new is not direct.
Based on the volume of repairs and events and the above conversion factors, the
number of garments saved over a 5 year period by events is 304,085 and 115,702 by
offering repair services, resulting in a total of 419,787 garments saved (including
displaced garments).
The number of garments saved (including displaced) under the tipping point scenario
increases by 63% due to the increase in number of workshops and attendees.
Waste reduced
Assuming an average weight of a garment is 0.33kg37, an equivalent of 137 tonnes
and 502 tonnes of garments would be saved from going to landfill under the
conservative scenario, over 5 and 10 years respectively.
Carbon saved
All carbon savings are a product of garments displaced. Under the conservative
scenario, 778 tonnes of carbon are saved in a five year period and 2,844 tonnes in a
10 year period. Under the tipping point scenario 1,290 tonnes are saved over 5 years
and 4,716 over 10 years.
Water saved
Since water saving is only achieved by preventing purchasing of new garments
(displaced garments), the potential to reduce the amount of water used under this
model is relatively low. As indicated in the methodology section, the water used in the
use phase of garments has not been included in this calculation as the water is put
back into the water catchment and can be re-used.
37 Average weight of a garment taken from MADE-BY data

Error! No text of specified style in document. 33
6.0 Business Model 2: Retailers providing large-scale leasing services
Model 2 is based on the idea that some items of clothes such as baby clothes are used for a
limited period of time before the baby has grown out of them and needs a new set. Many
baby-grows are still useable at this point. Although there is a healthy culture of passing on
baby clothes to other parents and younger siblings there is still room for a business model
which takes the limited use span of baby clothes as its starting point. There are a limited
number of existing businesses addressing this need; however Lutte Leihen in Hamburg is
experimenting with this business model. One reason why there are limited examples of this
model in practice may be due to low demand from consumers for leasing of clothes.
Assessment of potential commercial attraction / value
Leasing did not appear to be a business model that consumers are interested in, with 60%
of consumers stating they would never consider it (Figure 8).
Fig. 8 - Which if any, of the following types of clothing might you consider leasing if it was made easier? Base:
UK adults (7950) 7-20 December 2011
Demand is low and there are very few businesses operating a leasing model in the clothing
and garment sector. It is only appropriate for particular sub-sectors of the clothing market
where garments are likely to be used for a limited time before becoming redundant. Baby
clothes or maternity wear are examples of this, however these sub-sectors will only be
relevant to a limited number of consumers. Of the consumers who would consider leasing,
only 5% would consider it for baby clothes (although the percentage will be higher for the
subset of adults for whom baby clothes are a current consideration).
19%
11%
11%
8%
6%
7%
60%
Formal wear
Fancy dress
Designer clothing
Clothes for going out and socialising
Clothes for sporting or outdoor activities
None/no more than do now
None/would never consider it

Error! No text of specified style in document. 34
Fig. 9 - Why might you consider leasing an item of clothing?
6.1 Model description and assumptions
Following examples of retailers in other sectors experimenting with leasing, a national retail
brand selling baby clothes (100+ stores) is experimenting with leasing baby clothes, with the
idea of doing more with less amid increasing resource scarcity. The segment is appropriate
because babies grow out of clothes faster than the garments wear out. Baby clothes can be
leased at a fraction of the cost of buying baby clothes and are leased for a 3 month period.
The retailer works on the assumption that a pack can be leased multiple times before the
garment is worn out and a percentage of the clothes leased out are returned in a state
where they cannot be leased again due to damage occurring during the lease.
Volume and growth assumptions:
The volume of baby clothes leased is measured as a ‘unit’ and the lease of one unit is
treated as one transaction (i.e. one lease arrangement with a customer). For purposes of
this exercise, a unit comprises of 5 garments (therefore a pack of 5 baby clothes being
leased per transaction).
The number of units coming in and out of stock is based upon variable assumptions for
the timings of the product life cycle. The life cycle is of a product varies under the
conservative and tipping point scenarios, and is based on the following factors:
1. The typical length of the customer lease;
2. The amount of time taken to inspect, clean, repackage and redistribute a unit to the
next lease customer. In both scenarios, 1 month is allocated for this process38;
3. The number of times a unit can be leased before it is worn out is assumed to be 5
times39.
After a single lease, 20% of products are written off as damaged goods and not replaced40.
At the end of a product’s life cycle, in order to maintain stock levels, any units that are
written off due to wear and tear are replaced by newly purchased units.
38 This is a prudent assumption, based on the number of steps interviews with existing businesses and online research on professionally laundry services www.laundry365.co.uk/ (accessed 26/03/2012) 39 This is a prudent assumption based on indications given by Lutte Leihen and the fact that worn- out baby clothes will not send the right message to consumers. 40 A prudent assumption based on interviews with Lutte Leihen

Error! No text of specified style in document. 35
Income Assumptions:
Key pricing assumptions in the model are:
1 The anticipated retail price for 1 unit were it sold via normal retail channels; versus
2 The price at which the leasing company can purchase the units (e.g. purchased at
manufacturing cost, to reflect a retailer using its own branded goods); versus
3 The lease charge to one customer for the X month lease period.
The level of income generated is dependent on the number of times a unit can be leased to
customers and the lease price. The number of times a unit is leased and the lease charge
varies in each scenario and is further discussed in the financial analysis section.
Cash receipts from leasing activities are spread across the product life cycle, whereas a
typical retailer would normally receive 100% of the retail price at day one. These timings are
all calculated within the model’s projected cashflows and so they are incorporated within the
project appraisal techniques adopted, particularly those monitoring the time value of money
(e.g. NPV).
Variable Cost Base:
There are a range of variable costs associated with the leasing activity. A brief summary of
each variable cost is as follows:
Units Purchased – as discussed above, costs are dependent on the purchase price of a
unit. For both scenarios presented in this model, a retail sales price of £20 per unit has
been assumed and the cost to purchase a unit of garments is 16.7% of the sales price41,
so £3.34 per unit. The volume of purchases made includes both ‘New Units Added’ to the
portfolio, plus replacement of Units at the end of their life cycle;
Direct Staff Costs – are significant within the leasing activity, as it is reliant upon a manual
process of staff bringing products in and out of stock, analysed between:
Picking & Packing staff – i.e. those staff members required to pack the units ready for
shipping to customers and ready for collection by laundry. Plus staff required for
receiving units back from laundry and making ready for redistribution to the next lease
customer; and
Quality Control staff – used to inspect the garments being returned from customers to
determine if an item is damaged.
The number of direct staff employed is driven by assumptions for number of minutes
required per unit (for each of packing and quality control). The total number of direct
staff are then multiplied by an average salary cost (plus employer’s NI), adjusted over
time to include pay rises;
Laundry Costs – calculated based on a cost per garment (not cost per unit) being
laundered. It is assumed that the laundry service is carried out by an outsourcing partner,
and includes collection and delivery within their total cost of garment laundry;
Packaging Costs – represent a simple cost per unit leased, for a plastic sleeve that
contains all of the garments being sent;
Postage and Delivery Costs – are driven by the number of units sent to customers, plus
the cost assumption also includes an amount for including a return package for the
customer to send back the used garments;
41 Prudent assumption based on the cost of buying a better quality five-pack of baby grows.
Error! No text of specified style in document. 36
With regards store collection, it is assumed that the cost of sending a unit to an
individual customer is more expensive than shipping a unit internally to an existing
store for customer collection. Therefore, for prudence, it is assumed that all units are
posted to customers at home, rather than a mix of units being collected versus
shipped.
Warehousing Costs:
Assumptions are made regarding how much space (in square feet) one unit sitting in
stock will consume (units on lease to customers are not sitting in stock, therefore not
requiring space in warehousing facilities). Plus how much space is needed per direct
staff member employed, resulting in a total size of warehousing required;
This total space, multiplied by an average property cost per square foot (inclusive of
rent, rates, utilities, etc.) delivers the warehousing costs;
It has been assumed that no retail store space is required for this model and all sales
are via internet, therefore only warehousing costs are included. This impacts the
‘performance per square foot’ key performance indicator; and
Other Direct Costs – both credit card charges and warranty provisions are included, and
are calculated based on X% of turnover generated.
All of the variable cost assumptions are adjusted for cost price inflation over time.
Fixed Cost Base:
In addition to those costs that behave in line with the volume of units being leased, other
overhead assumptions are incorporated to cover back office staff and other general
administration overheads (e.g. in-store marketing materials and website running costs).
This fixed cost base also includes a one-off website build cost of £500,000 for both
scenarios42.
6.2 Financial Modelling and Analysis
This model has been analysed under two scenarios to assess it commercial viability.
6.2.1 The Conservative Scenario
Key assumptions made under this scenario are:
Volume of units purchased for leasing is 40,000 per year. As indicated in the analysis of
market factors section below, the overall market and demand for leasing baby clothes is
limited. The benchmark retailer currently has over 10% of the market share of children's
clothes (including baby wear) in the UK43. Assuming the volumes indicated in section 5.2,
the benchmark retailer’s share of the baby clothes leasing market would be over 5,000
individuals. 40,000 units a year is based on a parent leasing 7 units for a child in a year.
The maximum number of times a unit of garments can be leased by a retailer is 3 (given
the relatively high wear and tear of clothes by babies), therefore the full lifecycle of a
garment is 12 months.
42 Costs based on discussions with Stef Lewandowski, social media start-up specialist and consultant 43 Morgan Stanley company research, January 2012

Error! No text of specified style in document. 37
Fig. 10 - Model 2: Financial project appraisal under the conservative scenario
Funds needed:
The amount of capital required by a retailer to undertake business model 2 is £681k. This
represents highest negative balance the retailer would experience over a 10 year (or 5 year)
period, hence would have to ensure this amount of capital is secured before undertaking this
project.
Net Present Value (NPV), Return on Capital (RoC) & Payback Period:
A positive NPV is not achieved over a five year period, therefore neither is a Return on
Capital generated over that timeframe.
A 10 year timeframe does provide for a positive NPV and a decent ROC of 141%, compared
to just over 50% RoC achieved by the benchmark retailer in 201144.
The payback period under this scenario is 4.9 years. Whist this is higher than the two year
payback period of the benchmark retailer, a significantly higher return on capital can be
achieved if a retailer were prepared to invest with a long term view.
Profitability:
Assumptions under the conservative scenario do generate profits in line with those currently
experienced by the benchmark retailer and also European retail averages. This is not
surprising given that each unit is leased 3 times at 1/3rd the cost of the retail price,
therefore at the end of the lifecyle of a unit, the revenue generated is equal to that of a
single sale.
An average gross profit margin of 55% is achieved over a 5 and 10 year period,
compared to the benchmark retailer’s 5 year average of just under 30% and 55% for
Europe.45
Operating profit margin is lower at 0.63% and 11.63% over 5 and 10 years respectively,
predominantly due to the large set up costs involved. Beyond this time frame, this
scenario is likely to reach operating profit margins similar to the benchmark retailer’s 5
year operating margin of just below 20% and European 4 year average of 15%.
6.3 The Tipping Point Scenario
Several scenarios were tested to assess the tipping point (from a financial perspective) at
which this model would become viable for a retailer. Given the existing low demand for this
type of model, at an individual retailer level, minor increases in demand had little to no
44 Bloomberg, Company Reports 45 Bloomberg, Company Reports. Consists of performance data of 7 European Retailers, and is based on a 4 year average. 2011 data for all companies was not available
Timeframe
Funds
needed NPV Payback
Return on
Capital IRR
Gross profit
margin per £ of
revenue (avg)
Gross profit
per square
footage
(avg)
Operating
Profit
Margin
(avg)
Operating
profit per
square
footage
(avg) EBITDA (avg)5 years £681k (£154) 4.9 years n/a n/a 55% £277 1% £3 20%
10 years £681k £314k 4.9 years 141% 22% 55% £312 12% £66 29%
Model 2 Appraisal - Financial

Error! No text of specified style in document. 38
impact on the financial performance. Hence, in the tipping point scenario, demand remained
the same and other variables/assumptions were changed to achieve desired returns.
Changes made to assumptions in the tipping point scenario:
The number of times a unit of garments can be leased has increased from 3 to 4,
therefore increasing the lifecycle of a garment purchased to 16 months (up from 12
months in the conservative scenario).
A 10% increase in lease charges, so a unit would be leased at 43% of retail price instead
of 33%.46
To help facilitate the above increase, lease payments by consumers are made monthly as
opposed to up front.
A 50% increase in branding and marketing costs to help achieve the 10% increase in
lease charge, from £100,000/year in the conservative scenario to £150,000/year in the
tipping point scenario.
Fig. 11 - Model 2: Key Performance Indicators under the tipping point scenario
Profitability:
Given the extended life cycle of a garment and increased lease charge under this scenario, a
retailer stands to benefit significantly from a profitability perspective compared to the current
single sale business model. 46 The scenario has been built on assumptions that would make this model financially viable, an increase in price being one of them. It has not factored in the impact the price increase would have on demand.
Key Performance Indicators
Dec '13 Dec '14 Dec '15 Dec '16 Dec '17
Unit Volumes:
Units Purchased 40,000 50,923 56,384 56,384 56,384
Units Leased to Customers 64,745 126,651 160,345 178,586 188,439
Total Units on Lease to Customers 23,044 34,860 41,199 44,631 46,489
Total Units sitting in Stock 8,616 13,833 16,693 18,230 19,056
Garment Volumes:
Garments Purchased 200,000 254,613 281,920 281,920 281,920
Garments Saved, net 104,251 232,475 303,095 355,963 384,533
Garments Displaced, net 123,723 378,641 519,805 611,010 660,274
Core Pricing Assumptions (vs. Sales Price):
Underlying Retail Sales Price (£) 20.00 20.60 21.22 21.85 22.51
Purchase Price 16.7% 16.7% 16.7% 16.7% 16.7%
Single Lease Charge 43.3% 43.3% 43.3% 43.3% 43.3%
Total Lease Charge 173.3% 173.3% 173.3% 173.3% 173.3%
Number of Staff Employed 12 16 18 20 21
Performance by Volume of Area:
Portfolio Square Footage 1,245 1,853 2,168 2,429 2,562
Revenue per square foot (£) 395 590 670 690 713
Gross Profit per square foot (£) 248 377 429 442 459
Net Profit per square foot (£) (409) 136 197 222 241
Other Statistics:
Material Saved 15,958 Kg 42,778 Kg 57,603 Kg 67,688 Kg 73,136 Kg
Carbon Saved 164 t 424 t 567 t 666 t 720 t
Water Saved 65 m3 199 m3 273 m3 321 m3 347 m3

Error! No text of specified style in document. 39
In this scenario, applying a leasing model, each unit stands to generate £34.40 in revenue
for a retailer compared to the £20 that would be generated via the conventional single sale
model. Hence it is not surprising that the profit margins under this scenario are also higher
than those achieved by the benchmark retailer and European retail averages.
Gross profit margin for this scenario is 64% compared to the benchmark retailer’s 5 year
average of just under 30% and 4-year European average of 55%
Operating profit margin and EBITDA also exceed those experienced by the benchmark
retailer. This scenario achieves a 5 year average operating margin of 20% and EBITDA of
32%, compared to just over 15% and below 20% respective for the benchmark retailer.
As can be seen in Figure 12 below, this scenario becomes profitable and cash positive in
Year 2.
Fig. 12 - Model 2: Project financial appraisal under the tipping point scenario
Funds needed:
Although the tipping point scenario is more profitable, the amount of capital required by a
retailer in the tipping point is slightly higher than the conservative scenario, at £688k, mainly
due to the additional funding required for the increase in marketing costs.
Net Present Value (NPV), Return on Capital (RoC) & Payback Period:
The tipping point scenario starts to become profitable and generate cash year 2 onwards,
hence provides a positive NPV of £501k and RoC of 131% over a 5 year period.
This scenario also provides a payback period of 2.7 years which, although slightly longer
than the 2 year hurdle the benchmark retailer looks to achieve, is acceptable given the profit
margins that can be achieved under this scenario.
Timeframe
Funds
needed NPV Payback
Return on
Capital IRR
Gross profit
margin per £ of
revenue (avg)
Gross profit
per square
footage
(avg)
Operating
Profit
Margin
(avg)
Operating
profit per
square
footage
(avg) EBITDA (avg)5 years £688k £501k 2.7 years 131% 38% 64% £408 20% £129 32%
10 years £688k £1,634k 2.7 years 515% 51% 64% £470 29% £212 40%
Model 2 Appraisal - Financial

Error! No text of specified style in document. 40
Minimum cash reserves of NEGATIVE £688k, as at 28 February 2014
Fig. 13 - Model 2: trends in income, expenses and cash under the tipping point scenario
6.4 Analysis of related factors / market projections
Market size for this model (leasing of baby clothes) can be measured by looking at the birth
rate in the UK, which in 2011 was 12.29 per 1000 population47, which translates to
approximately 760,000 births per year (base on UK population size of 62 million). Consumer
surveys indicate that only 5% of the UK population would be interested in leasing baby
clothes. Applying a simple calculation, 5% of 760,000, results in 38,000 babies whose
parents will potentially consider leasing clothes for them. This then would need to be broken
down by each retailer’s share of the baby clothes market to come up with market size for
each retailer.
6.5 Estimation of potential to reduce resource impacts
Three key factors have been considered and included in calculating the resource impacts
under this model:
Waste generated - there is a level of waste that is generated under this model. Waste is
derived in two ways; from the garments that are written off due to damage and garments
written off due to 'old age'(they have reached the end of their lease life).
Garment saved from going to waste - the model takes into account that under
conventional models (where parents are buying clothes as opposed to leasing), some of
the baby clothes bought are passed on to family and friends or passed on to a younger
sibling. Therefore, the net effect of garments being saved from going to waste between
the two business models is the proportion that would not have been passed down or on.
For the purpose of this modelling exercise, it has been assumed that 30% of baby clothes
47 http://www.indexmundi.com/g/g.aspx?c=uk&v=25 (accessed 23/03/2012)
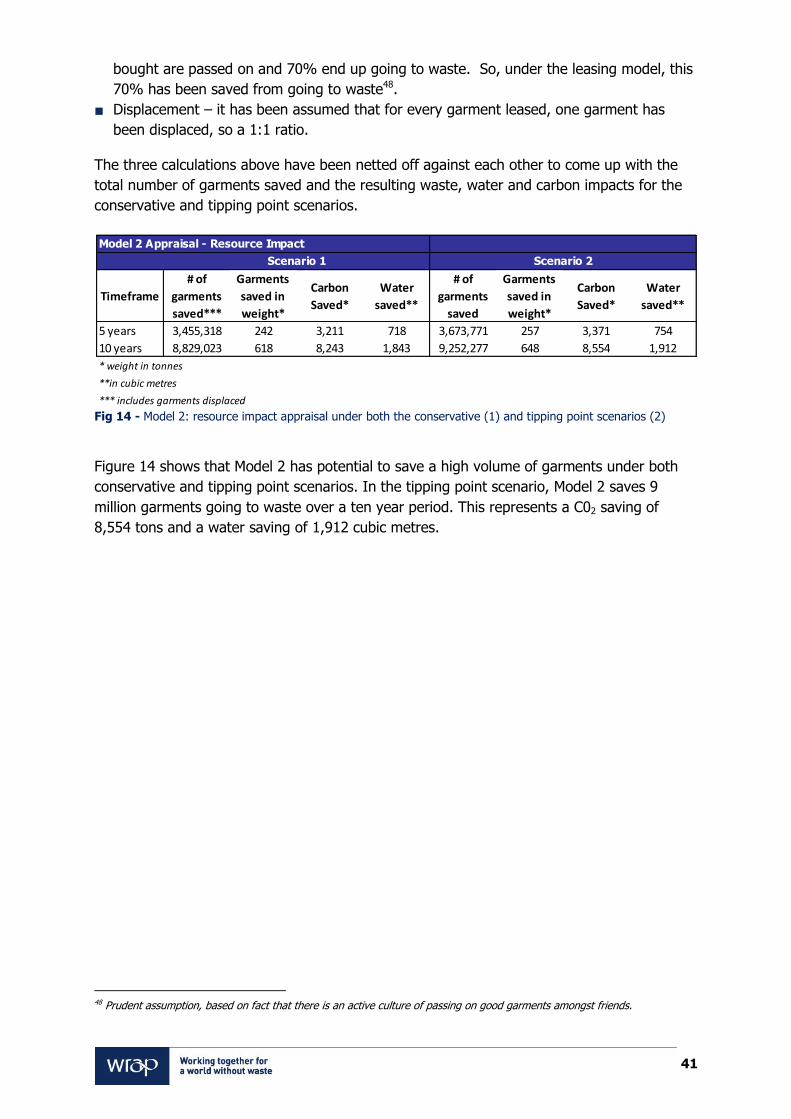
Error! No text of specified style in document. 41
bought are passed on and 70% end up going to waste. So, under the leasing model, this
70% has been saved from going to waste48.
Displacement – it has been assumed that for every garment leased, one garment has
been displaced, so a 1:1 ratio.
The three calculations above have been netted off against each other to come up with the
total number of garments saved and the resulting waste, water and carbon impacts for the
conservative and tipping point scenarios.
Fig 14 - Model 2: resource impact appraisal under both the conservative (1) and tipping point scenarios (2)
Figure 14 shows that Model 2 has potential to save a high volume of garments under both
conservative and tipping point scenarios. In the tipping point scenario, Model 2 saves 9
million garments going to waste over a ten year period. This represents a C02 saving of
8,554 tons and a water saving of 1,912 cubic metres.
48 Prudent assumption, based on fact that there is an active culture of passing on good garments amongst friends.
Timeframe
# of
garments
saved***
Garments
saved in
weight*
Carbon
Saved*
Water
saved**
# of
garments
saved
Garments
saved in
weight*
Carbon
Saved*
Water
saved**
5 years 3,455,318 242 3,211 718 3,673,771 257 3,371 754
10 years 8,829,023 618 8,243 1,843 9,252,277 648 8,554 1,912
* weight in tonnes
**in cubic metres
*** includes garments displaced
Model 2 Appraisal - Resource Impact
Scenario 1 Scenario 2

Error! No text of specified style in document. 42
7.0 Business Model 3: Retailers providing large-scale one-off hire services
Hiring formal wear is a long-established business model in the clothing industry. Moss Bros
for example has been in business since 1851. However in recent years the model has been
reinvented as online hiring has allowed new businesses to hire upmarket and high-fashion
items to discerning customers wherever they are based. Examples such as Rentthereunway
and Wishwantwear have been established by graduates of Harvard Business School and
London Business School respectively. Both businesses cite ‘Collaborative Consumption’49 as
a potentially disruptive business model for the fashion industry. Wishwantwear has an
inventory of 1000 designer dresses (r.r.p. £250 to £2000) which are available to hire at 10-
15% of the retail price. Included in the hire price is the cost of insurance and postage.
Women can select the dresses they wish to wear on a website and the dresses are shipped
to the customer with packaging for shipping back after 4 days.
Assessment of potential commercial attraction / value
Currently the market for hiring, leasing or lending clothes is very small. Formal wear is the
biggest category of hired clothing, but only 13% say they hire formal wear at least once a
year.
Fig. 15 - Thinking about the last 12 months, how often have you hired the following types of clothes for yourself
or others in your household? By hire, we mean a short term rental from one night up to a few weeks.
The research showed that there was considerable interest in the idea of hiring clothes with
64% of consumers expressing an interest in these business models. If it were made easier
for consumers to hire clothes, 40% stated they would be interested in hiring formal wear
more often, 17% would hire designer dresses more often and 13% clothes for general
socialising.
49 The idea is that technology and peer to peer communities are enabling these old market behaviours to be reinvented in ways and on a scale never before possible. From enormous marketplaces such as eBay and Craigslist, to peer-to-peer marketplaces such as Tradepal, emerging sectors such car sharing (Zipcar or RelayRides), Collaborative Consumption is said to be disrupting old modes of business.
87
89
93
93
93
93
94
94
13
11
7
7
7
7
6
6
Formal wear (e.g. weddings,
evening wear, etc.)
Fancy dress
Clothes for going out and
socialising
Winter or summer clothes
Clothes for sporting or outdoor
activities (e.g. ski wear)
Clothes for daytime leisure
Clothes for work
Designer clothing
% Not in last 12 months % At least once a year

Error! No text of specified style in document. 43
Fig. 16 - It has been suggested that it should be made easier to hire all types of clothes through the major high
street retailers. If this was the case which, if any, of the following types of clothing might you consider hiring on
a more frequent basis?
The reasons for hiring varied. 81% said they would consider it for special one-off occasions,
55% to wear an item of clothing they would not ordinarily afford, 35% to reduce the amount
of clothes in their wardrobe and 31% to reduce the amount they spent on clothes in general.
Looking deeper into the figures, women (83%) were 5% more likely than men (78%) to
consider hiring for a special occasion. With the other reasons why consumers may consider
hiring clothes over buying clothes there are some interesting trends across different age
groups. The 55-65 age group were 6% more likely than average to say that they would
consider hiring to avoid getting a wardrobe full of clothes they could not wear, whilst young
people 16-24 year olds were 8% more likely than average to justify hiring on the basis of
reducing the risk of having items they dislike after wearing them a few times. This clearly
shows that marketing the hiring concept would need to be different for different age
consumers and that the business would need a segmented strategy.
7.1 Model description and assumptions
‘Collaborative Clothes’ is a hire-business brand operated by a national retailer which allows
consumers to hire formal wear, designer wear and clothes for socialising. Collaborative
Clothes has a range of garments containing clothes that are specific to the ‘Collaborative
Clothes’ brand as well as some garments which are taken from the retail collection. Clothes
are available to hire at a fraction of the retail price. Included in the hire price is the cost of
insurance and postage. Consumers can select the clothes they wish to wear on website; the
garments are shipped to the customer with packaging for shipping back after 4 days.
Alternatively they can pick them up in store and return the items to store.
Volume and Growth assumptions:
Model 3 operates much in the same way as Model 2. The key difference between the two
models is that the length of time a garment is hired out for is shorter in Model 3 and
therefore, each garment can be hired more times and a retailer is able to generate more
revenue from a single garment. Essentially, Model 3 has a quicker turnover of stock and a
40%
27%
17%
13%
10%
13%
36%
Formal wear
Fancy dress
Celebrity/designer dresses
Clothes for going out and socialising
Clothes for sporting or outdoor activities
None/no more than do now
None/would never consider it

Error! No text of specified style in document. 44
shorter life cycle. There are no other material differences in volume calculation methods of
Model 3 versus Model 2.
Growth in volume of garments added for hire in Model 3 is as follows:
5,000 new garments are bought each year and added to the collection.
In addition to the new garments purchased, all garments written off due to damage are
replaced each year. It has been assumed that 10% of garments returned are written off
due to damage and customers are charged 15% (of lease charge) damage fee, which is
consistent with the fee charged by existing businesses.
Pricing Assumptions:
Much like Model 2, the key assumptions surrounding product retail price, purchase price and
lease charge are all calculated in the same manner. The main differences between the two
models is that under Model 3, the garments being hired are a higher value product and can
be hired out at a higher margin.
Variable Cost Base:
All of the variable costs associated with the Model 2 apply to Model 3, plus these additional
variable costs:
Direct Staff Costs – in addition to Picking / Packing Staff and Quality Control Staff, the
model has another category of direct staff; Photographer Staff. This additional category of
staff is required to process newly purchased stock units for uploading to the website.
Calculating the number of staff required is again based on average processing time to
take photos of the garments and upload them to the website, versus number of units
purchased. It has been assumed that it take 30 minutes to process each garment,
including photography and uploading of the website, and therefore each staff member
can process up to 13 garments per day.
It has been assumed that it takes a staff member 10 minutes to pick and pack one
garment, therefore can pack up to 30 garments a day. The number of packing staff is
added gradually as the volume of sales progresses through the year(s).
It has been assumed that it takes 3 minutes for a staff member to inspect a garment
returned, therefore can check up to 130 garments a day.
Insurance cost, at 1.5% of revenue, has been added given that the nature of the
garments being leased is of a relatively higher value.
Fixed Cost Base:
The key fixed cost base consists of administrative support staff, which includes one senior
manager, one junior support staff at the start of the project and one added in year three,
plus one community development manager.
The other major fixed cost includes website maintenance cost of £75,000 per annum50.
A one off website build cost of £500,000 has been included at the start of the project.
50 Prudent assumption based on the development of a commercial website. Assumptions based on conversation with Stef Lewandowski, social media consultant
Error! No text of specified style in document. 45
7.2 Financial Modelling & Analysis
The commercial viability of Model 3 is very much dependent on the lifecycle of a garment,
the volume of garments available for hire and the price points at which a garment is hired.
Financial analysis of Model 3 has been based on conservative assumptions on volume of
garments being added to the stock list every year. A small organisation like Wishwantwear
has 1,000 dresses in their collection available for hire. Given that this model is being
analysed from a large-scale retailer’s perspective, adding 5,000 garments for hire each year
is a relatively low volume when compared to the number of garments they sell each year.
The result of the financial analysis of Model 3 reveals that there is a strong business case to
be made for this model, despite the conservative assumptions applied in the analysis, hence
has been assessed only on one scenario.
As indicated in Figure 17 below, a retailer stands to generate significantly higher revenue per
garment under the hiring model compared to the current business model of single sale per
garment.
The average length of time a garment is hired under model three is 4 days (versus 3 months
in Model 2).
The life (cycle) of each garment is based on the following assumptions51:
the average length of a time a garment is hired for is 4 days;
given the short hiring period, each garment is leased twice in one month;
the processing time in between each hire is 11 days; and
maximum number of times a garment can be leased is 10.
Based on the assumptions above, each garment has a product lifecycle of 150 days.
All pricing assumptions in this model are based on a retail sales price of a garment of £125.
It has been assumed that a retailer’s cost to purchase a garment is 50% of retail price, so
£62.50 in this case.
The charge to customers to lease a garment for 4 days is 25% of the retail sales price, so
£31.25 per lease.
Given that each garment can be leased up to ten times before being written off, each
garment has the potential to generate £312.50 in revenue, as opposed to the £125 that
would be generated under the conventional single sale model currently applied by
retailers. That is a 150% increase in revenue per garment.
In the table below, the number of garments purchased each year includes the 5,000 new
units added to stock each year plus replacement of damaged garments.
The Total Units Leased to Customers includes the total number of garments that have been
leased in a given year. Total Units on Lease represents the number of garments on lease as
at year end.
51 Prudent assumptions based on interviews with Wishwantwear (11/01/2012).

Error! No text of specified style in document. 46
Fig. 17 - Model 3: key performance indicators under the conservative scenario
Furthermore, the hiring model stands to generate similar or higher profit margins compared
to current sales models.
Gross profit margin per revenue for this model is 68%, compared to the five year average
(FY2007 to FY2011) of nearly 30% achieved by the benchmark retailer.52 This is not
surprising given the increase in revenue per garment indicated above and the lower-cost
website based approach.
Operating profit margin for Model 3 of 11% and 16% over 5 and 10 years respectively is
in line with the figure achieved by the benchmark retailer in year ended January 2012.
Were it not for the one-off website building cost of £500k, operating margins achieved for
model three would be even higher.
Fig. 18 - Model 3: Financial appraisal under the conservative scenario
Based on the assumptions presented above, the amount of funding required to initiate this
business model is £587k. The amount of funding required is relatively low compared to
52 Bloomberg, company reports
Key Performance Indicators
Dec '13 Dec '14 Dec '15 Dec '16 Dec '17
Unit Volumes:
Units Purchased 6,017 6,743 6,743 6,743 6,743
Units Leased to Customers 24,363 38,476 40,846 41,243 41,309
Total Units on Lease to Customers 193 223 229 229 230
Total Units sitting in Stock 1,882 2,200 2,253 2,262 2,264
Garment Volumes:
Garments Purchased 6,017 6,743 6,743 6,743 6,743
Garments Saved, net 12,172 19,235 20,542 20,761 20,797
Garments Displaced, net 6,164 12,495 13,680 13,878 13,911
Core Pricing Assumptions (vs. Sales Price):
Underlying Retail Sales Price (£) 125.00 128.75 132.61 136.59 140.69
Purchase Price 50.0% 50.0% 50.0% 50.0% 50.0%
Single Lease Charge 25.0% 25.0% 25.0% 25.0% 25.0%
Total Lease Charge 250.0% 250.0% 250.0% 250.0% 250.0%
Number of Staff Employed 16 18 18 19 19
Performance by Volume of Area:
Portfolio Square Footage 1,375 1,588 1,590 1,590 1,591
Revenue per square foot (£) 564 794 867 902 930
Gross Profit per square foot (£) 372 540 591 616 636
Net Profit per square foot (£) (340) 153 191 185 190
Other Statistics:
Material Saved 4,584 Kg 7,933 Kg 8,555 Kg 8,660 Kg 8,677 Kg
Carbon Saved 52 t 88 t 94 t 95 t 95 t
Water Saved 12 m3 23 m3 26 m3 26 m3 26 m3
Timeframe
Funds
needed NPV Payback
Return on
Capital IRR
Gross profit
margin per £ of
revenue (avg)
Gross profit
per square
footage
(avg)
Operating
Profit
Margin
(avg)
Operating
profit per
square
footage
(avg) EBITDA (avg)5 years £587k £149k 2.9 years 36% 25% 67% £556 11% £87k 45%
10 years £587k £624k 2.9 years 224% 39% 68% £627 16% £147k 49%
Model 3 Appraisal - Financial

Error! No text of specified style in document. 47
other business models included in this study, mainly due to the fact that this model becomes
profitable in its second year of operations and starts to become cash positive from year four
(demonstrated in fig. 19 below). Furthermore, the funding required is mainly to cover the
cost of developing the website.
A payback period of 2.9 years is slightly longer than the 2 years that the benchmark retailer
currently looks for, however, a retailer stands to benefit from a higher return on capital, 37%
and 224% over 5 and 10 years respectively, in exchange for a slightly longer payback
period.
Minimum cash reserves of NEGATIVE £586,937, as at 31 January 2013
Fig 19 - Model 3: financial appraisal under the conservative scenario
7.3 Estimation of potential to reduce resource impacts
The number of garments saved is generated in a similar process to model 2. The model
offsets the number of units/garments hired against the number displaced from retailers
when a customer decides to hire rather than buy. Due to the fact that one hire is unlikely to
directly displace one garment, for Model 3, the ratio of hire to displacement is lower than for
Model 2 baby clothes leasing at 0.5. This means that the number of garments saved per hire
is lower and the resource impacts of the model follow suit.
(1,000,000)
(500,000)
-
500,000
1,000,000
1,500,000
2,000,000
Dec'12
Apr'13
Aug'13
Dec'13
Apr'14
Aug'14
Dec'14
Apr'15
Aug'15
Dec'15
Apr'16
Aug'16
Dec'16
Apr'17
Aug'17
Dec'17
Trends in Income, Expenses & Cash (£), for the five years to 31 December 2017
Total Income Total Expenses Bank Balance

Error! No text of specified style in document. 48
Fig 20 - Model 3: resource impact appraisal under the conservative scenario
Over ten years the number of garments saved through the hire is relatively low at 300,000
garments. Since carbon and water savings are tied to the number of garments saved, Model
3 generates relatively small carbon and water savings at 681 tonnes and 152 cubic metres
respectively over 10 years.
It is unlikely that a case for this business model can be made based on its resource impacts
alone.
Timeframe
# of
garments
saved***
Garments
saved in
weight*
Carbon
Saved*
Water
saved**
5 Years 153,635 38 316 71
10 Years 327,245 82 681 152
* weight in tonnes
**in cubic metres
***includes garments displaced
Model 3 Appraisal - Non -Financial

Error! No text of specified style in document. 49
8.0 Model 4: Retailers offering re-sale section for own-brand garments
and restyling services
One step that a retailer could take to encourage the re-use of garments is by creating an
incentive for customers to return used garments to store. A recent high-profile initiative in
this area is the collaboration between M&S and Oxfam. Under the Clothes Exchange scheme
launched in 2008 customers who bring a used M&S item of clothing to Oxfam receive a £5
voucher for purchasing new M&S clothes. According to Oxfam the scheme has helped
prevent over 2,500 tonnes of clothing going to landfill and raised £3 million for Oxfam’s
work53. Other examples include US outdoor brand Patagonia’s Common Threads initiative.
Under this initiative consumers can return worn out garments to Patagonia for recycling or
repurposing. Since 2005, Patagonia calculates that they have taken back 45 tons of clothing
for recycling and made 34 tons into new clothes54.
Consumers are already consuming pre-owned or second hand clothes with 58%55 stating
that they have bought or received second hand ‘leisure clothes’ in the last 12 months and
13% saying that they had bought or received second hand ‘leisure clothes’ at least once a
month.
Fig 21 - Thinking about the last 12 months, how often have you bought or received the following
types of clothes for yourself or others in your household second hand?
Furthermore, consumers reported the biggest barrier to them consuming more second hand
clothing was the choice of second hand clothes available. 23% said they would buy more
second hand clothes if the choice improved. This indicates there are currently big
opportunities for the clothing sector to reduce its waste footprint by offering services which
fulfil this need.
The same consumer survey asked consumers about their willingness to sell clothes back to a
retailer, and to buy such clothes from the retailer. Nearly two-thirds of respondents would
consider using a retailer ‘buy-back’ scheme, and more than one-third of respondents would
53 http://www.oxfam.org.uk/shop/content/secondhandstore/fashion/ms_clothes_exchange.html (accessed 23/03/12) 54 http://www.patagonia.com/us/common-threads/recycle (accessed 23/03/12) 55 according to the WRAP Ipsos-MORI Survey

Error! No text of specified style in document. 50
consider buying such clothes in the categories of formal wear, designer clothing and clothes
for going out.
8.1 Business model description and assumptions
‘Pre-owned at ABC retail’ is an initiative of a national UK fashion retailer that promotes re-use
of clothes. The fashion retailer offers an incentive for customers to return their used
garments to a store. The garments are then sent to a central warehouse for sorting, cleaning
and re-styling and distributed back to flagship stores carrying the 'Pre-owned' collection.
The pre-owned garments are then sold under the banner of the newly set up ‘Pre-owned at
ABC’ collection. The retailer adds the pre-owned collection, consisting of re-used and restyled
garments, alongside their existing product lines, and this is sold in their existing retail stores.
All customers that return garments are given a discount voucher, to be applied towards
purchases made from the 'pre-owned' collection. The intention behind this is to encourage
consumers to change purchasing patterns to a product line that has potential to reduce
resource impacts and generate commercial gain for the retailer. If a cash incentive were
given (instead of a discount voucher), there is no incentive for the consumer to alter their
purchasing behaviour. There is also the risk with a cash incentive that it is spent elsewhere
rather than in store. Furthermore, a cash offer would require a significant amount of initial
cash outlay, making this commercially less attractive for a retailer.
The retailer will take back all clothes brought back by customers but will only buyback
garments of a sufficient quality for restyle or resale. Returned clothes which are not of good
enough quality to be resold are sent to a commercial recycler for recycling.
The model has been built around the core aim of encouraging retailers to take responsibility
for the full lifecycle of the garments they sell, whilst still generating positive returns and
profits to ensure long term financial stability. Furthermore, it aims to make it easier for
consumers to purchase and consume in more sustainable ways.
Volume & Income assumptions:
A retailer sets up its existing retail stores as collection centres where consumers can drop
off unwanted clothes. For the purposes of this modelling exercise, it has been assumed
that a retailer starts off with 10 collection points in the first year, a further 150 points set
up in the second year and an increase of 10 per year thereafter, resulting in 240
collection points by year 10. Using the benchmark retailer as a basis for this model, 240
collection points would represent almost 50% of their stores acting as collection centres.
All garments collected are then sent to a central warehouse depot for sorting before being
sent to selected stores that will carry the 'pre-owned' collection. All garments returned
will fall into one of three categories:
1 ‘Recycle’ – these garments are not of sufficient quality to re-use, therefore they are
assumed to be sold to a recycling partner, who pays a small amount per garment.
Income of £0.60 per kilogram for recycled garments has been applied across all the
scenarios presented in this model56.
56 http://www.returntoearn.co.uk/what-we-pay.html
Error! No text of specified style in document. 51
2 ‘Resale’ – these garments are of the highest quality, and it is assumed that all that
they require is to be cleaned via an outsourced laundry provider, before being returned
to stores for sale as part of the ‘Pre-owned at ABC’ collection.
3 ‘Restyle’ – the final category, where an element of repair or restyle is required in order
to make the garment ready for sale within the store. This type of garment will also
need laundering prior to resale.
Of the garments collected, it has been assumed that 82.5% are recycled, 15% are resold
as is and 2.5% are restyled before resale57. Commercial viability of this model is
dependent on a sufficient ratio of garments being of a high enough quality for direct re-
sale, as this generates the largest profit margin.
The time between receipt of garment from collection to point of sale is one month for
resale garments and two months for restyle garments. An average retail price of £30 per
garment for re-sale and restyle garments has been included across all the scenarios
presented in this model58.
The roll out of stores carrying the pre-owned collection is dependent on the volume of
garments collected and sold. It has been assumed that once volume of garments sold
from the 'pre-owned' collection within a store exceeds 7,500/year59, a retailer will
introduce this range in another store. This figure was considered a suitable figure to offer
customers a choice of styles and sizes.
Variable cost base:
There are several variable cost factors that come into play, such as discount vouchers,
transportation of garments from collection points to warehouse to retail outlets, and the staff
required to handle each of the three different types of garments (recycle / resale / restyle).
A brief summary of each variable cost is as follows:
Discount vouchers – for the purposes of this modelling exercise, it has been assumed that
for every garment collected that can be re-sold or re-styled, a 15% discount voucher is
issued and can be used towards any purchase in the 'pre-owned' collection60. It is
assumed here that consumers will only return significant items to store (e.g. dresses,
jackets, coats rather than socks). A scenario has also been created where for every
garment collected, including garments recycled, a 15% discount voucher has been issued.
This will be explored further in the financial analysis section. There are two components
to factor in when calculating the cost of issuing discount vouchers:
1 Firstly the ‘Face Value’ of the discounted amount – using an average sales price of a
pre-owned garment of £30, a 15% discount results in a face value of £4.50 as a saving
to the customer and cost to the retailer.
2 However, it is likely that not all discount vouchers issued will be used by consumers
and sales of garments from the 'pre-owned' collection will also be made to consumers
57 Based on an interview with TRAID, a recycling charity, on 10/01/2012. TRAID, a UK charity with a national network of collection points, has pioneered a model of collecting garments and sorting for re-use, re-style and re-cycle. Their experience has been used as a conservative sample of what might be collected by a retailer. If the retailer encourages consumers to return better quality items the proportion of garments going to resale may be higher. 58 It is assumed that this model applies for all retailers who sell better quality garments as opposed to value fast fashion retailers. The price of a new dress at a retailer carrying a broad range varies from £25 to £125, with a median price of £50. 59 A prudent assumption applied in which to build a growth strategy. This number could be changed to build alternative growth scenarios. 60 If analysis of this model was to be taken up further (by a retailer), a more detailed break-down of varied discount rates for different types of garments should be applied.

Error! No text of specified style in document. 52
that don't have vouchers. It has been assumed that 50% of vouchers issued will be
used and 50% of purchases made will be by consumers that don't have discount
vouchers.61 Therefore, the ‘Internal Cost’ – being the true cost to the retailer of
providing the discount voucher is £2.25 (50% of £4.50). This ‘internal cost’ is used for
the model’s direct cost calculations and is designed to represent the net cost of
providing a voucher for use at its stores.
The sales price, less the internal cost of the voucher then equates to the margin made per
garment collected. This margin is before the variable processing costs discussed below.
Logistics costs – are incurred at two different points:
Transportation of garment from collection points to the central processing warehouse.
Then having been sorted and processed, shipping the resale and restyled garments to
retail stores.
Business model four has a significant amount of logistics activity compared to the other
model included in this study. Throughout all of the models, CO2 emitted from the logistics of
a business has not been included in the resource impact analysis, but were all of the models
to be adjusted to consider the implications of this, Model 4 would have a higher carbon
footprint than the other models.
Laundry Costs – it is assumed that the laundry service is carried out by an outsourcing
partner at a cost of £0.25 per garment being laundered (same as Model 3)62 and is only
applicable to ‘resale’ and ‘restyle’ garments. It is assumed the laundry provider collects
and delivers any garment as part of its laundry service cost, therefore no additional
logistics costs are incurred for laundry.
Materials Purchased – for those garments that are being restyled, it is assumed there is a
materials cost for the amount of material being consumed in a repair / restyle.
Direct Staff Costs – are significant within Model 4 activity, as it is reliant upon a number of
manual processes, analysed between:
Picking & Packing staff – i.e. those staff members required to pack the units received
from the stores and distribute them to laundry, plus receive back from laundry, make
ready for restyling (if appropriate) and then ship back to stores for subsequent resale;
and
Store staff – It is assumed that store staff will be trained to sort and process the
garments received back.
Restyling staff – used to carry out the repairs / restyling of each applicable garment.
The number of direct staff is driven by assumptions for number of minutes required
per garment (for each of packing and restyling). Plus there is an allocation of staff
at retail stores spending a proportion of time on the 'pre-owned' collection and their
costs allocated to the model accordingly.
The total number of direct staff are then multiplied by an average salary cost (plus
employer’s NI), adjusted over time to include pay rises.
61 Based on financial modellers experience of voucher use rates by other retail clients 62 Cost has been validated by comparison to existing laundry providers.
Error! No text of specified style in document. 53
Warehousing Costs:
Assumptions are made regarding how much space (in square feet) one garment sitting
in stock will consume. Plus how much space is needed per direct staff member
employed (both packing and restyling). The total of those two amounts equate to the
warehousing space required. The amount of warehouse space required is calculated
based on a requirement of 100 square feet per staff (both packing and restyling) plus
10 garments per square foot.
The warehousing space is then combined with the retail store space, which is 250
square feet for each store, to calculate the total size of portfolio required, which is then
multiplied by an average property cost per square foot (inclusive of rent, rates, utilities,
etc.) to deliver the total property costs.
Fit-Out Costs – The model incorporates a fit out cost for each store adding the 'pre-
owned' collection to its range, although this is a relatively minor cost as it only requires
new signage within an existing store. A cost of £2,500 has been assumed for each store.
Fixed Cost Base:
In addition to those costs that behave in line with the volume of sales and stores, other
overhead assumptions are incorporated to cover back office staff, which consists of a
programme manager and one marketing staff added in years one, two and three. This staff
base remains constant in the scenarios presented below.
Other general administration overheads (e.g. in-store marketing materials and website
running costs) – this fixed cost base also includes any one-off investments such as website
build costs or staff training costs.
8.2 Financial Modelling and Analysis
Financial analysis of business model 4 shows commercial viability at a larger scale, and in
this case, it particularly stacks up because of a retailer’s ability to operate at a larger scale
and maximise on economies of scale on volume of garments collected, processed and sold.
The cost base of garments is low as retailers do not incur a direct purchase cost for
garments being sold. The largest variable cost per garment sold is the discount voucher
issued and only applicable if it is used by the consumer making a purchase. Furthermore, it
has been assumed that 50% of garments sold from the 'pre-owned' collection are to
consumers that are not using discount vouchers.
This model has been analysed under two scenarios:
The conservative scenario assumes a lower volume of garments being collected per site
per annum, however it also has a lower variable cost base as fewer discount vouchers are
issued.
The tipping point scenario assumes a higher volume of garments and higher number of
discount vouchers issued to facilitate higher volume of garments collected.

Error! No text of specified style in document. 54
8.2.1 The Conservative Scenario
The conservative scenario for this model was developed iteratively drawing from evidence
provided by recycling charity TRAID and drawing inspiration from M&S’s collaboration with
Oxfam.
Key volume assumptions under the conservative scenario include:
1,000 garments per annum received at each collection point63.
Staff at collection points will be trained to conduct a quality check of garments to assess
whether a garment is categorised as 'recycle', 'resale' or 'restyle. A staff training cost of
£500 per collection point has been assumed.
A 15% discount is only given for garments that can be re-sold or restyled then sold. No
voucher is given for garments that are to be recycled.
Fig 22 - Model 4: financial appraisal under the conservative scenario
The initial capital required to set up this business is relatively low compared to other
models, at £312k. This is due to the relatively lower fixed cost base of this model and
short payback period.
The project becomes cash positive from the second year of operation (as depicted in Fig
22 below), which generates an NPV of £556k and £1,763k over 5 and 10 years
respectively. Very little capital expenditure is required in this model and it is directly tied
to the number of stores generating revenue. Hence, once a positive cash position is
achieved from operations, it continues to grow exponentially, resulting in a high NPV over
a 10 year period.
Assumptions in this scenario provide a payback period on capital invested in 2.3 years and
a very healthy return on capital over 5 and 10 years.
Profit breakeven is achieved before the end of year two (as depicted in Fig 23 below) and
continues to remain profitable for the 10 year period included in this model. Furthermore,
profit margins continue to increase over a 10 year period. The continued increase in
profit margin over a longer time frame contributes to the significantly high RoC over a 10
year period.
63 Estimate based on conversations with recycling charity TRAID (10/01/2012)
Timeframe
Funds
needed NPV Payback
Return on
Capital IRR
Gross profit
margin per £ of
revenue (avg)
Gross profit
per square
footage
(avg)
Operating
Profit
Margin
(avg)
Operating
profit per
square
footage
(avg) EBITDA (avg)5 years £312k £556k 2.3 years 259% 86% 58% £250 28% £119 28%
10 years £312k £1763k 2.3 years 1158% 98% 60% £312 39% £202 39%
Model 4 Appraisal - Financial

Error! No text of specified style in document. 55
Minimum cash reserves of NEGATIVE £312k, as at 28 February 2014
Fig 23 - Model 4: trends in income, expenses & cash under the conservative scenario
Assessment of potential commercial attraction / value
The research showed a relatively high interest from consumers in the idea of retailers buying
back clothes.
52% of consumers expressed an interest in a scheme selling their clothes back to retailers
with 8% stating they would definitely do this if it were available and 15% very likely and
29% fairly likely. Formal Wear (47%), Clothes for going out and socialising (42%) and
Designer (31%) were the categories that consumers were most likely to sell back to
retailers. These were also the categories that consumers were most interested in buying with
42% stating they would buy second hand formal wear, and 34% stating they would buy
second hand designer clothing and clothes for socialising. However consumer expectation is
that they would want to be paid relatively high amounts to bring clothes back. For example
for an item worth £15:
30% would bring it back for a minimum of £4-£5
3% Would bring it back for a minimum of £3-£4
For items worth £50
20% would bring an item back for a minimum of £15-20
13% for a minimum of £10-£15
13% for a minimum of £5-£10
Given consumers stated relatively high expectations on the value they would need to receive
to motivate them to sell back clothing, it could be challenging for businesses to manage
expectations and incentivise consumers at a commercially viable rate.
(400)
(200)
-
200
400
600
800
1,000
1,200
1,400
Dec'12
Apr'13
Aug'13
Dec'13
Apr'14
Aug'14
Dec'14
Apr'15
Aug'15
Dec'15
Apr'16
Aug'16
Dec'16
Apr'17
Aug'17
Dec'17
Trends in Income, Expenses & Cash (£'000s), for the five years to 31 December 2017
Total Income Total Expenses Bank Balance
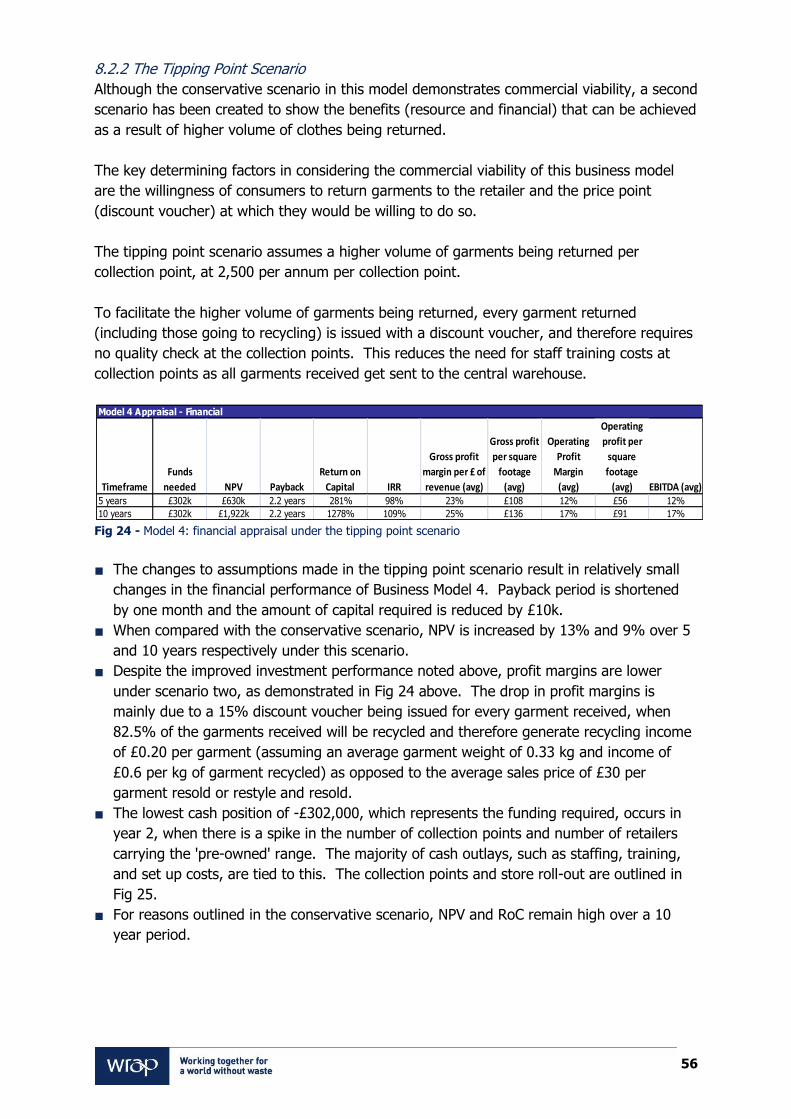
Error! No text of specified style in document. 56
8.2.2 The Tipping Point Scenario
Although the conservative scenario in this model demonstrates commercial viability, a second
scenario has been created to show the benefits (resource and financial) that can be achieved
as a result of higher volume of clothes being returned.
The key determining factors in considering the commercial viability of this business model
are the willingness of consumers to return garments to the retailer and the price point
(discount voucher) at which they would be willing to do so.
The tipping point scenario assumes a higher volume of garments being returned per
collection point, at 2,500 per annum per collection point.
To facilitate the higher volume of garments being returned, every garment returned
(including those going to recycling) is issued with a discount voucher, and therefore requires
no quality check at the collection points. This reduces the need for staff training costs at
collection points as all garments received get sent to the central warehouse.
Fig 24 - Model 4: financial appraisal under the tipping point scenario
The changes to assumptions made in the tipping point scenario result in relatively small
changes in the financial performance of Business Model 4. Payback period is shortened
by one month and the amount of capital required is reduced by £10k.
When compared with the conservative scenario, NPV is increased by 13% and 9% over 5
and 10 years respectively under this scenario.
Despite the improved investment performance noted above, profit margins are lower
under scenario two, as demonstrated in Fig 24 above. The drop in profit margins is
mainly due to a 15% discount voucher being issued for every garment received, when
82.5% of the garments received will be recycled and therefore generate recycling income
of £0.20 per garment (assuming an average garment weight of 0.33 kg and income of
£0.6 per kg of garment recycled) as opposed to the average sales price of £30 per
garment resold or restyle and resold.
The lowest cash position of -£302,000, which represents the funding required, occurs in
year 2, when there is a spike in the number of collection points and number of retailers
carrying the 'pre-owned' range. The majority of cash outlays, such as staffing, training,
and set up costs, are tied to this. The collection points and store roll-out are outlined in
Fig 25.
For reasons outlined in the conservative scenario, NPV and RoC remain high over a 10
year period.
Timeframe
Funds
needed NPV Payback
Return on
Capital IRR
Gross profit
margin per £ of
revenue (avg)
Gross profit
per square
footage
(avg)
Operating
Profit
Margin
(avg)
Operating
profit per
square
footage
(avg) EBITDA (avg)5 years £302k £630k 2.2 years 281% 98% 23% £108 12% £56 12%
10 years £302k £1,922k 2.2 years 1278% 109% 25% £136 17% £91 17%
Model 4 Appraisal - Financial
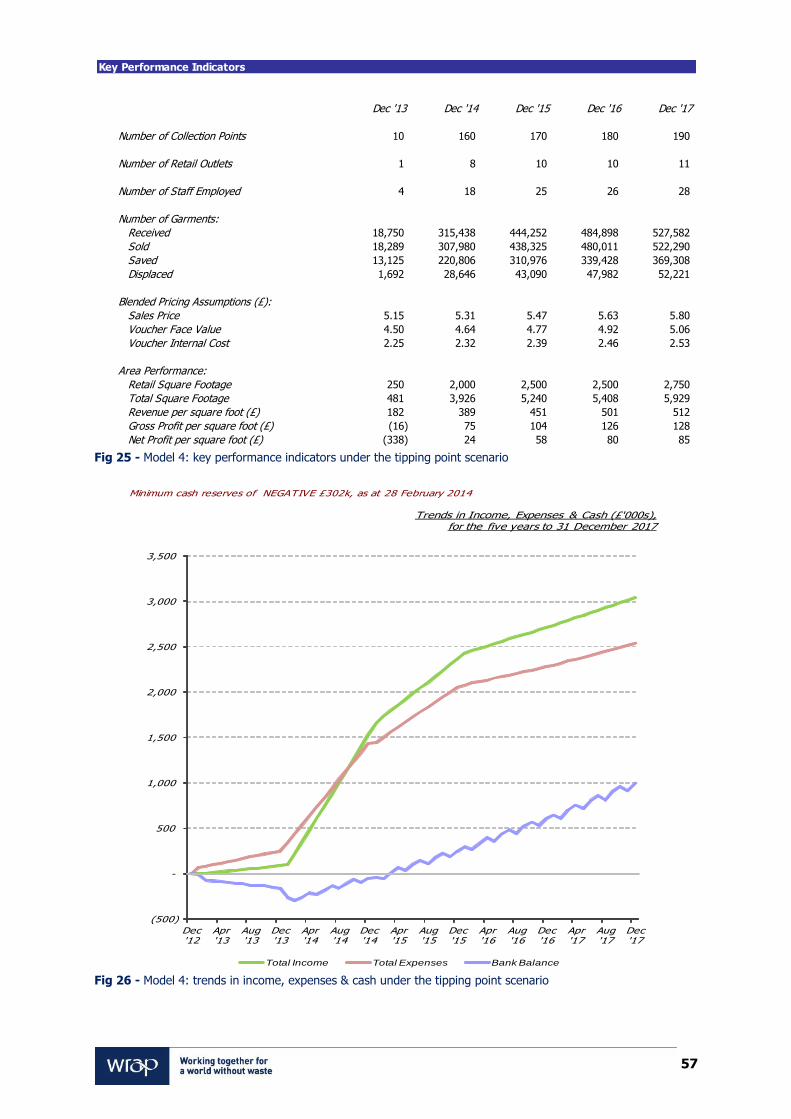
Error! No text of specified style in document. 57
Fig 25 - Model 4: key performance indicators under the tipping point scenario
Fig 26 - Model 4: trends in income, expenses & cash under the tipping point scenario
Key Performance Indicators
Dec '13 Dec '14 Dec '15 Dec '16 Dec '17
Number of Collection Points 10 160 170 180 190
Number of Retail Outlets 1 8 10 10 11
Number of Staff Employed 4 18 25 26 28
Number of Garments:
Received 18,750 315,438 444,252 484,898 527,582
Sold 18,289 307,980 438,325 480,011 522,290
Saved 13,125 220,806 310,976 339,428 369,308
Displaced 1,692 28,646 43,090 47,982 52,221
Blended Pricing Assumptions (£):
Sales Price 5.15 5.31 5.47 5.63 5.80
Voucher Face Value 4.50 4.64 4.77 4.92 5.06
Voucher Internal Cost 2.25 2.32 2.39 2.46 2.53
Area Performance:
Retail Square Footage 250 2,000 2,500 2,500 2,750
Total Square Footage 481 3,926 5,240 5,408 5,929
Revenue per square foot (£) 182 389 451 501 512
Gross Profit per square foot (£) (16) 75 104 126 128
Net Profit per square foot (£) (338) 24 58 80 85
Minimum cash reserves of NEGATIVE £302k, as at 28 February 2014
(500)
-
500
1,000
1,500
2,000
2,500
3,000
3,500
Dec '12
Apr '13
Aug '13
Dec '13
Apr '14
Aug '14
Dec '14
Apr '15
Aug '15
Dec '15
Apr '16
Aug '16
Dec '16
Apr '17
Aug '17
Dec '17
Trends in Income, Expenses & Cash (£'000s),for the five years to 31 December 2017
Total Income Total Expenses Bank Balance
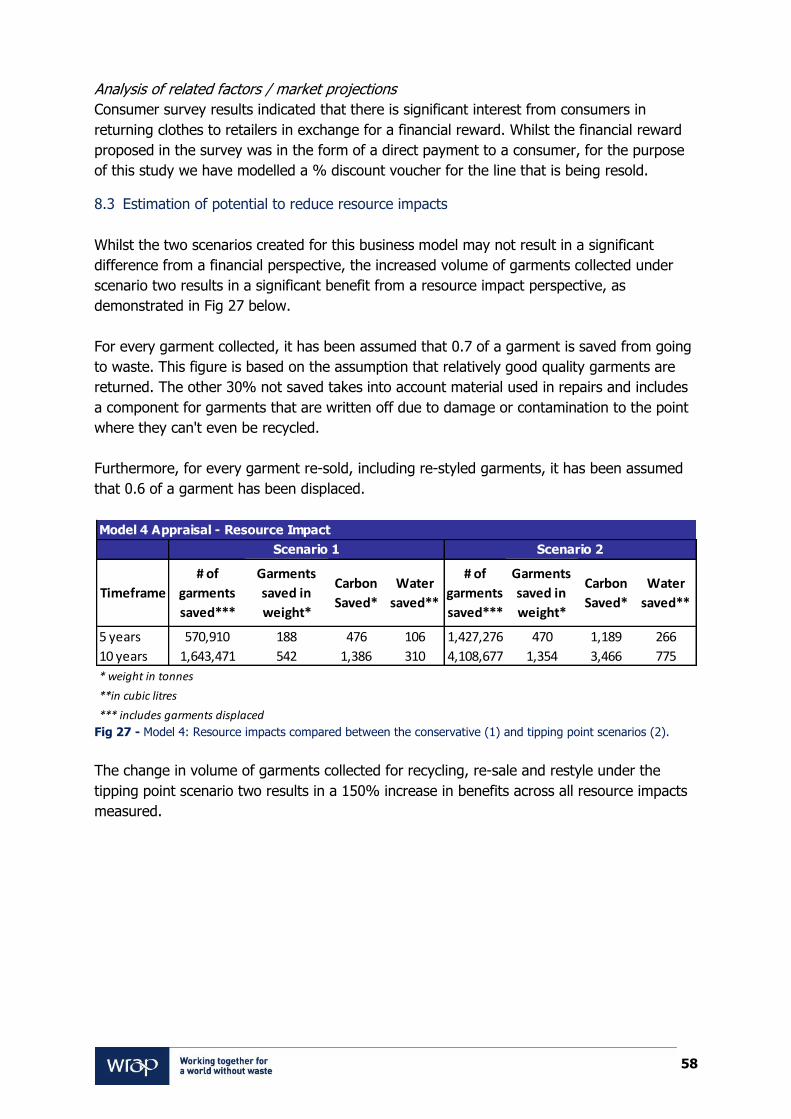
Error! No text of specified style in document. 58
Analysis of related factors / market projections
Consumer survey results indicated that there is significant interest from consumers in
returning clothes to retailers in exchange for a financial reward. Whilst the financial reward
proposed in the survey was in the form of a direct payment to a consumer, for the purpose
of this study we have modelled a % discount voucher for the line that is being resold.
8.3 Estimation of potential to reduce resource impacts
Whilst the two scenarios created for this business model may not result in a significant
difference from a financial perspective, the increased volume of garments collected under
scenario two results in a significant benefit from a resource impact perspective, as
demonstrated in Fig 27 below.
For every garment collected, it has been assumed that 0.7 of a garment is saved from going
to waste. This figure is based on the assumption that relatively good quality garments are
returned. The other 30% not saved takes into account material used in repairs and includes
a component for garments that are written off due to damage or contamination to the point
where they can't even be recycled.
Furthermore, for every garment re-sold, including re-styled garments, it has been assumed
that 0.6 of a garment has been displaced.
Fig 27 - Model 4: Resource impacts compared between the conservative (1) and tipping point scenarios (2).
The change in volume of garments collected for recycling, re-sale and restyle under the
tipping point scenario two results in a 150% increase in benefits across all resource impacts
measured.
Timeframe
# of
garments
saved***
Garments
saved in
weight*
Carbon
Saved*
Water
saved**
# of
garments
saved***
Garments
saved in
weight*
Carbon
Saved*
Water
saved**
5 years 570,910 188 476 106 1,427,276 470 1,189 266
10 years 1,643,471 542 1,386 310 4,108,677 1,354 3,466 775
* weight in tonnes
**in cubic litres
*** includes garments displaced
Model 4 Appraisal - Resource Impact
Scenario 1 Scenario 2

Error! No text of specified style in document. 59
9.0 Business Model 5: Peer to peer exchange
The development of social media and online platforms such as Ebay have allowed consumers
to buy and sell second hand items peer to peer. A study conducted by WRAP in 2010 tracked
t-shirts, jumpers and jackets added to Ebay. It estimated that the number of these items
posted to Ebay in the UK was ~2 million64. Alongside peer to peer buying and selling of items
there is a growing trend in clothing exchange, where peers can swap or hire clothing from
other peers. Swishing is a name given to a recent fashion phenomenon where people meet
to swap clothes. In recent years this trend has taken off, being profiled in the fashion press,
with numerous Facebook swishing groups being set up. Alongside this trend are social
network websites such as Ecomodo, rentmyitems and Zilok which allow peers to hire or lease
items in their local area.
Peer to peer networks have the potential to allow large scale swapping and hiring of clothes
between consumers and peers. The difficulties with these types of social media platforms
however are twofold: how to estimate the growth of these networks and; how to
commercialise what is essentially an exchange between two peers rather than between a
business and a consumer. Most social network sites utilise a small exchange fee per
transaction to generate revenue to cover the costs of developing and hosting the site.
Ecomodo, for example, uses a 0.6% charge on every exchange.
9.1 Model description and assumptions
‘Fashion Exchange’ is a business model based on a peer to peer social network platform,
enabling members (lenders and hirers) to exchange clothes and garments in their wardrobe.
Membership is free and the business generates income from charging a fee per transaction.
Lenders can indicate the piece of clothing they are willing to lend, the number of days and
the day rate they are willing to lend at. The website allows potential borrowers to see what
clothes are available to hire in their neighbourhood. Borrowers can also indicate what they
are looking for.
Lenders and Hirers come to ‘Fashion Exchange’ because they know that they will be able to
find clothes to their taste and from a likeminded group of people who enjoy and value
clothes. Lenders can earn a little extra money, help their community and be promoters of
more sustainable consumption. Borrowers can get things they need in their locality and at a
fraction of the retail price of purchasing a similar garment. The Fashion Exchange type
model would ensure safety to its users by using a hirer rating system and lenders can control
the ‘groups’ to which they lend. Lenders can also opt to insure an item through paying an
insurance fee.
Paying customer base:
The number of users represents all users that register to become members of the website
and each scenario has a different set of growth assumptions for number of members over a
10 year period.
64 WRAP (2010) Online Exchange: Potential Impacts

Error! No text of specified style in document. 60
As is the case for most businesses providing web based products and services, the key
performance indicator is not the number of registered users but the number of 'active' users.
An active user is one that actually makes a purchase, or in this case rents a piece of clothing.
Therefore the financial model takes into account the conversion of the total number of users
to active users. For prudency, the financial model further breaks down active users to
'normal' users and 'premium' users. Premium users are considered to be those that have
more than one transaction per month.
The conversion ratio from users to active users and the number of transactions per active
user is key to the financial viability of this model and this is demonstrated in scenarios 2 & 3
presented below.
Income assumptions:
Unlike Models 2 and 3, where the business owns the garments being leased or hired and
therefore retains the full lease or hire charge, in Model 5, a business does not own the
underlying garment being transacted. Income in this business model is mainly generated by
charging a transaction fee, which in this case is 6% of rental price, charged to the lender of
the garment. This inherently makes this lower margin business reliant mainly on a high
volume of transactions in order to generate profit. There are other external ways for the
model to generate income, such as advertising revenue, however these have not been
included in the model.
Testing various sensitivities in the model showed that an increase in transaction price of up
to 20% had minimal impact on cash flow and profitability. Being a low margin model, the
biggest impact comes from an increase in the number of transactions. Therefore, the
transaction fee of 6% and price to rent a garment has remained constant in each scenario.
A price of £16.85 per garment has been applied in each scenario. This price is based on the
average of a daily and weekend rental cost of a dress listed on the Ecomodo website, with a
retail purchase price of £150.65
For all scenarios, the first year is treated as a trial year with full launch taking place at the
start of year two.
Cost base:
This model has a relatively higher fixed cost base versus variable costs compared to other
models.
Staff costs – the majority of the staff required for this model falls under the fixed cost
category and consists of a programme manager, community development manager and IT
systems development manager. The only staff that fall under the variable cost category are
customer service support staff.
65 http://ecomodo.com/pages/item_view.aspx?id=040fd919-fdec-432c-8108-54674278d6b6 (accessed 23/03/12)
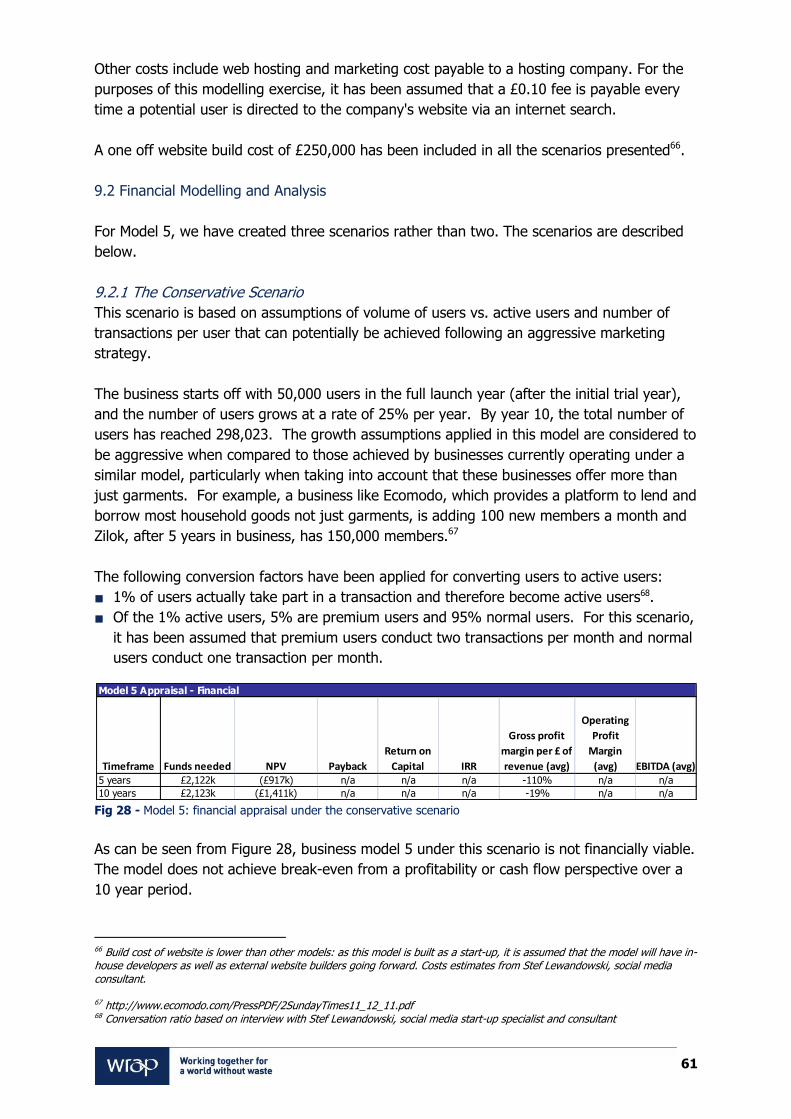
Error! No text of specified style in document. 61
Other costs include web hosting and marketing cost payable to a hosting company. For the
purposes of this modelling exercise, it has been assumed that a £0.10 fee is payable every
time a potential user is directed to the company's website via an internet search.
A one off website build cost of £250,000 has been included in all the scenarios presented66.
9.2 Financial Modelling and Analysis
For Model 5, we have created three scenarios rather than two. The scenarios are described
below.
9.2.1 The Conservative Scenario
This scenario is based on assumptions of volume of users vs. active users and number of
transactions per user that can potentially be achieved following an aggressive marketing
strategy.
The business starts off with 50,000 users in the full launch year (after the initial trial year),
and the number of users grows at a rate of 25% per year. By year 10, the total number of
users has reached 298,023. The growth assumptions applied in this model are considered to
be aggressive when compared to those achieved by businesses currently operating under a
similar model, particularly when taking into account that these businesses offer more than
just garments. For example, a business like Ecomodo, which provides a platform to lend and
borrow most household goods not just garments, is adding 100 new members a month and
Zilok, after 5 years in business, has 150,000 members.67
The following conversion factors have been applied for converting users to active users:
1% of users actually take part in a transaction and therefore become active users68.
Of the 1% active users, 5% are premium users and 95% normal users. For this scenario,
it has been assumed that premium users conduct two transactions per month and normal
users conduct one transaction per month.
Fig 28 - Model 5: financial appraisal under the conservative scenario
As can be seen from Figure 28, business model 5 under this scenario is not financially viable.
The model does not achieve break-even from a profitability or cash flow perspective over a
10 year period.
66 Build cost of website is lower than other models: as this model is built as a start-up, it is assumed that the model will have in-house developers as well as external website builders going forward. Costs estimates from Stef Lewandowski, social media consultant.
67 http://www.ecomodo.com/PressPDF/2SundayTimes11_12_11.pdf 68 Conversation ratio based on interview with Stef Lewandowski, social media start-up specialist and consultant
Timeframe Funds needed NPV Payback
Return on
Capital IRR
Gross profit
margin per £ of
revenue (avg)
Operating
Profit
Margin
(avg) EBITDA (avg)5 years £2,122k (£917k) n/a n/a n/a -110% n/a n/a
10 years £2,123k (£1,411k) n/a n/a n/a -19% n/a n/a
Model 5 Appraisal - Financial

Error! No text of specified style in document. 62
The main underlying reason for this is that the low volume of active users combined with low
margin sales under this scenario are not sufficient to cover the relatively high fixed staff cost
base.
9.2.2 The Tipping Point Scenario
The tipping point scenario is based on a significant increase in the number of website users,
and assumes 10% of the current UK population will be using the peer to peer exchange
platform by year 10, so 6.2 million users – influenced by a wider adoption of peer to peer
transactions across a variety of products and services. These are ambitious growth targets.
However, at this level the model has potential for significant resource impacts, and some
financial return over a 10 year period.
Beginning in year 4, the percentage of users converting to active users increases from 1% to
2% and is capped at 2% for the remaining years of the 10 year period.
One additional marketing support staff is added to support the aggressive marketing
required to achieve the increased volume of users and active users and one additional IT
staff is added to this scenario.
Fig 29 - Model 5: financial appraisal under the tipping point scenario
The funding required to set up a peer to peer exchange platform under the tipping point
scenario is £833k.
The changes in assumptions noted above begin to show some financial returns, but only if
considered from a longer term perspective. There is no payback on capital invested or
return on capital over a 5 year period. However, if a business or an investor in a business
was willing to accept a 7.4 year payback period, the model would provide a 184% return on
capital.
Furthermore, the business does start to become profitable by year 5 and become cash
positive year 8 onwards, as demonstrated in Fig 30 below.
Timeframe
Funds
needed NPV Payback
Return on
Capital IRR
Gross profit
margin per £ of
revenue (avg)
Operating
Profit
Margin
(avg) EBITDA (avg)5 years £833k £661k n/a n/a n/a 25% -54% -54%
10 years £833k £569k 7.4 years 184% 20% 33% 15% 15%
Model 5 Appraisal - Financial

Error! No text of specified style in document. 63
Minimum cash reserves of NEGATIVE £833,063, as at 31 August 2017
Fig 30 - Model 5: trends in income, expenses and cash under the tipping point scenario
9.2.3 Scenario 3 Tipping Point (through higher conversion rate)
Scenario 3 is based on a combination of increase in number of users and a higher conversion
of users to active users. In addition, it assumes a higher number of transactions per month
for the (premium) active users.
Total number of users increases over the years to reach 1.5 million by year 10, which
represents 2.5% of current UK population;
The percentage of users converting to active users gradually increases and peaks at
5% in year 7;
The number of transactions conducted by premium users increases from 2 per month
to 3 per month.
Fig 31 - Model 5: financial appraisal under scenario 3
Similar to the first tipping point scenario, scenario 3 does provide a positive NPV, payback on
capital invested and return on capital if considered from a long term perspective.
Timeframe
Funds
needed NPV Payback
Return on
Capital IRR
Gross profit
margin per £ of
revenue (avg)
Operating
Profit
Margin
(avg) EBITDA (avg)5 years £868k (£687k) n/a n/a n/a 26% -69% -69%
10 years £868k £803k 6.8 years 232% 24% 34% 19% 19%
Model 5 Appraisal - Financial
(2,000,000)
(1,000,000)
-
1,000,000
2,000,000
3,000,000
4,000,000
5,000,000
Dec'12
Jul'13
Feb'14
Sep'14
Apr'15
Nov'15
Jun'16
Jan'17
Aug'17
Mar'18
Oct'18
May'19
Dec'19
Jul'20
Feb'21
Sep'21
Apr'22
Nov'22
Trends in Income, Expenses & Cash (£), for the ten years to 31 December 2022
Total Income Total Expenses Bank Balance

Error! No text of specified style in document. 64
Minimum cash reserves of NEGATIVE £867,713, as at 31 August 2017
Fig 32 - Model 5: trends in income, expenses and cash under scenario 3
Analysis of related factors / market projections
The key challenge facing Model 5 is marketing the concept so that users sign up to use the
website service and continue to use it. The success of the model is dependent on having a
high volume of users actively using the platform.
9.3 Estimation of potential to reduce resource impacts
There are two aspects to be considered when measuring the life of a garment under an
exchange model. If a garment is rented out, it has multiple users and is being worn more
often than if it was worn by a sole user. Therefore, it is likely to have more wear and tear
and reach its end of life sooner. At the same time, the owner of the garment is likely to
keep that garment for longer and take better care of it because of its ability to generate
income through an exchange platform69. Taking these two factors into account, the net
reduction on number of garments going to waste is likely to be minimal. For the purposes of
this modelling exercise, it has been assumed that for every 4 garments exchanged by a
lender, one will be saved from going to waste, or for every garment exchanged, 0.25 of a
garment will be saved from going to waste.
An additional factor to be considered is the displacement affect. Again it has been assumed
that for every 4 garments borrowed; the purchase of 1 new garment will be displaced.
The same conversion factors have been applied in calculating the number of garments saved
and displaced in each of the three scenarios, therefore any change in resource impacts is
purely a result of the total number of garments being exchanged.
69 Prudent assumption based on the fact that peers are making some income from their garments.
(1,500,000)
(1,000,000)
(500,000)
-
500,000
1,000,000
1,500,000
2,000,000
2,500,000
3,000,000
3,500,000
4,000,000
Dec'12
Jun'13
Dec'13
Jun'14
Dec'14
Jun'15
Dec'15
Jun'16
Dec'16
Jun'17
Dec'17
Jun'18
Dec'18
Jun'19
Dec'19
Jun'20
Dec'20
Jun'21
Dec'21
Jun'22
Dec'22
Trends in Income, Expenses & Cash (£), for the ten years to 31 December 2022
Total Income Total Expenses Bank Balance

Error! No text of specified style in document. 65
Fig 33 - Model 5, Resource Impacts across all three scenarios
A comparison of the resource impacts across the 3 scenarios shows that the impacts are tied
closely to the volume of active users. In the conservative scenario after 10 years the model
only saves 100,000 garments and has relatively small carbon and waste savings. However as
volume of users increases as in the tipping point scenario or there is a high volume of active
users (a high conversion rate) as in Scenario 3, Model 5 provides relatively high numbers of
garments saved over 10 years at around 3 million garments in both the tipping point
scenario and scenario 3. There are also relatively high carbon and water savings after 10
years at ~10,000 tonnes of carbon and ~2,400 cubic metres of water saved.
Timeframe
# of
garments
saved***
Garments
saved in
weight*
Carbon
Saved*
Water
saved**
# of
garments
saved***
Garments
saved in
weight*
Carbon
Saved*
Water
saved**
# of
garments
saved***
Garments
saved in
weight*
Carbon
Saved*
Water
saved**
5 years 22,601 7 78 18 365,319 121 1,266 283 303,180 100 1,051 235
10 years 106,973 35 371 83 3,114,974 1,028 10,793 2,413 3,212,150 1,060 11,130 2,488
* weight in tonnes
**in cubic meters
*** includes garments displaced
Model 5 Appraisal - Resource Impact
Scenario 1 Scenario 2 Scenario 3
Error! No text of specified style in document. 66
10.0 Conclusions: Is there a business case for alternative business models in the
clothing industry?
In recent years there have been a number of high-profile calls to shift to a circular economy
– a model which is restorative or regenerative by intention and design. The circular economy
concept replaces the ‘end-of-life’ concept with restoration and shifts the emphasis of
economic production towards the use of renewable resources and the re-use of materials70.
Kingfisher CEO, Ian Cheshire’s call for a more sustainable capitalism and the Ellen MacArthur
Foundation both make a strong case for these types of businesses in the wider economy.
This report asks the question whether there is a business case for alternative ‘circular’
business models in the clothing industry. On the basis of the research in this report it would
seem that there is a potentially attractive business case for some of the models.
To summarise the study, a cross-model comparison has been undertaken. This comparison
shows that there is a significant variation between the different models in terms of their
financial and resource impact performance.
10.1 Cross-model financial analysis
Each business model included in this study has been assessed on its own merit, with an aim
to understand what would be required for each model to generate financial performance at a
level that would be acceptable to a large scale retailer in order for it to become commercially
viable. In doing so, some key financial performance indicators were looked at and compared
to the hurdle rates of the benchmark retailer.
The baseline financial performance aimed for was as follows:
payback period of 2 years;
return on capital of 15%; and
matching the 5 year average profitability performance of the benchmark retailer.
Comparisons were also made to European retail averages.71
It should be noted that only 1 scenario was created for Model 3, therefore in the figures
below, the results in the conservative scenario and tipping point for Model 3 are the same.
For Model 5, three scenarios were created. However, for the purposes of this summary, only
scenarios 1 & 3 have been included. Therefore, in the figures below for Model 5, Tipping
point scenario refers to Scenario 3 results.
70Ellen Macarthur Foundation (2012) Towards the Circular Economy: Economic and Business Rationale for an accelerated transition 71 European performance data is based on the average of 7 European retailers. European operating profit per sq. footage is a 4 year average as data for 2011 were not available. Data were only available for 5 years, not 10, hence all comparisons are made on a 5 year time horizon.

Error! No text of specified style in document. 67
Payback period and Return on Capital:
Fig 34 - Payback period of each model in years
As Figure 34 above indicates, Model 4 provides the quickest payback period under both
scenarios. This is not surprising given the relatively low set up costs involved for this model.
Model 3's payback period of 2.9 years is also considered acceptable given the higher RoC a
retailer would benefit from in exchange for a slightly longer payback period. Because Model
3 starts to become profitable in Year 2, capital is mainly required just for the initial website
set up costs and the cash generated from operations provides a quick payback period and
high return on capital invested.
Model 2's payback under the conservative scenario is relatively long, at 4.9 years; however a
retailer does stand to achieve 131% return on capital. The tipping point scenario provides
an acceptable payback period of 2.7 years and a healthy return on capital of 515% (see
Figure 35 below). Given the low level of demand for leasing garments, the key factors that
would make this model viable are the price point at which garments can be leased and the
number of times a garment can be leased.
Models 1 and 5 do not provide any payback under the conservative scenario and the
payback period under the tipping point scenario is relatively long. They are also the least
attractive models from a return on capital perspective. For Model 1, this is largely due to the
relatively high staff (1 additional staff for each store) and store fit costs incurred for setting
up each store for repair and workshop services. For Model 5, this is due to a combination of
low conversions from users to active users and low margins achieved from each transaction.
0
1
2
3
4
5
6
7
8
Model 1 Model 2 Model 3 Model 4 Model 5
Conservative Scenario
Tipping Point Scenario
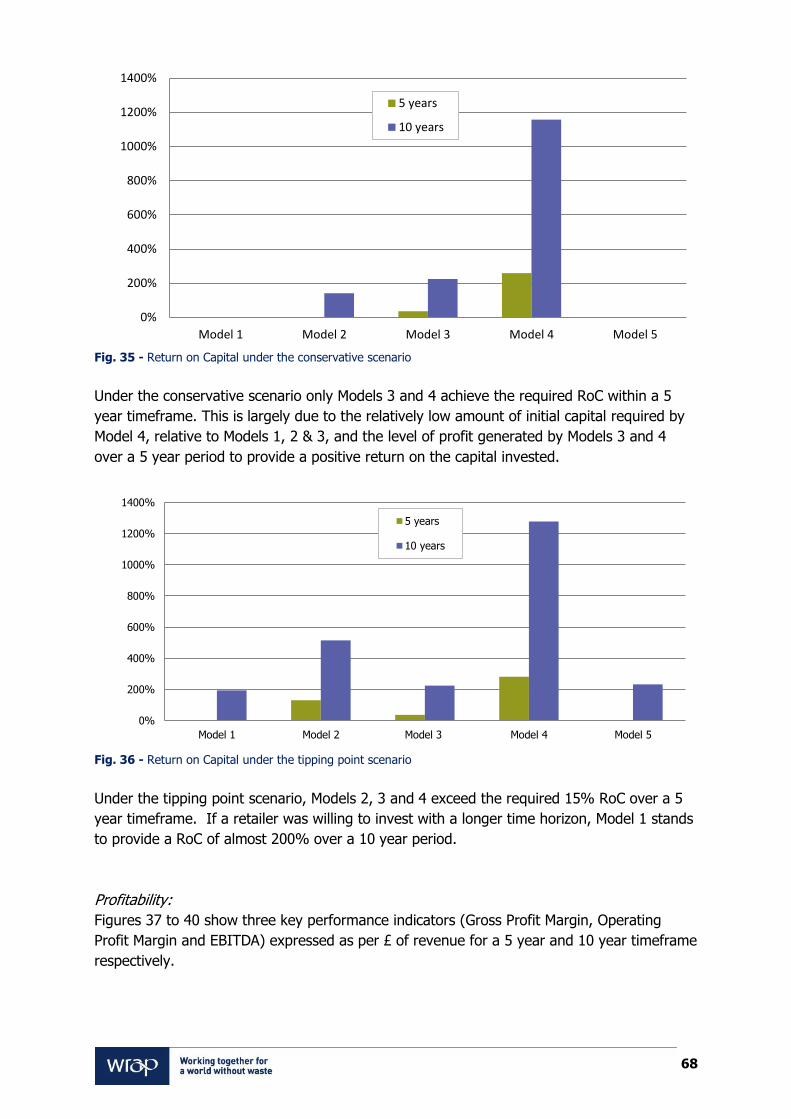
Error! No text of specified style in document. 68
Fig. 35 - Return on Capital under the conservative scenario
Under the conservative scenario only Models 3 and 4 achieve the required RoC within a 5
year timeframe. This is largely due to the relatively low amount of initial capital required by
Model 4, relative to Models 1, 2 & 3, and the level of profit generated by Models 3 and 4
over a 5 year period to provide a positive return on the capital invested.
Fig. 36 - Return on Capital under the tipping point scenario
Under the tipping point scenario, Models 2, 3 and 4 exceed the required 15% RoC over a 5
year timeframe. If a retailer was willing to invest with a longer time horizon, Model 1 stands
to provide a RoC of almost 200% over a 10 year period.
Profitability:
Figures 37 to 40 show three key performance indicators (Gross Profit Margin, Operating
Profit Margin and EBITDA) expressed as per £ of revenue for a 5 year and 10 year timeframe
respectively.
0%
200%
400%
600%
800%
1000%
1200%
1400%
Model 1 Model 2 Model 3 Model 4 Model 5
5 years
10 years
0%
200%
400%
600%
800%
1000%
1200%
1400%
Model 1 Model 2 Model 3 Model 4 Model 5
5 years
10 years

Error! No text of specified style in document. 69
Fig. 37 - 5 year profitability performance summary (per £ of revenue) under the conservative scenario
When looking at the conservative scenario, only Models 3 & 4 generate positive returns
across all three profitability ratios indicated above.
Models 3 & 4 generate gross profit margin and EBITDA in excess of the benchmark retailer
(not shown) and European 5 year average. Model 4 also generates a higher operating
margin.
Model 1 fails to generate (sufficient) profit margins when considering all three profitability
indicators.
Model 5 experiences a significant loss, on all three KPI's, and would affect the scaling of
profitability figures in the chart above, hence have been omitted.
Fig. 38 - 5 year profitability performance summary (per £ of revenue) under the tipping point scenario
Under the tipping point scenario, all business models generate gross profit margins in excess
of the benchmark retailer (not shown) and the European average, however, only Model 2
-60%
-40%
-20%
0%
20%
40%
60%
80%
Europe Model 1 Model 2 Model 3 Model 4 Model 5
Gross profit margin
Operating Profit Margin
EBITDA
-80%
-60%
-40%
-20%
0%
20%
40%
60%
80%
Europe Model 1 Model 2 Model 3 Model 4 Model 5
Gross profit margin
Operating Profit Margin
EBITDA
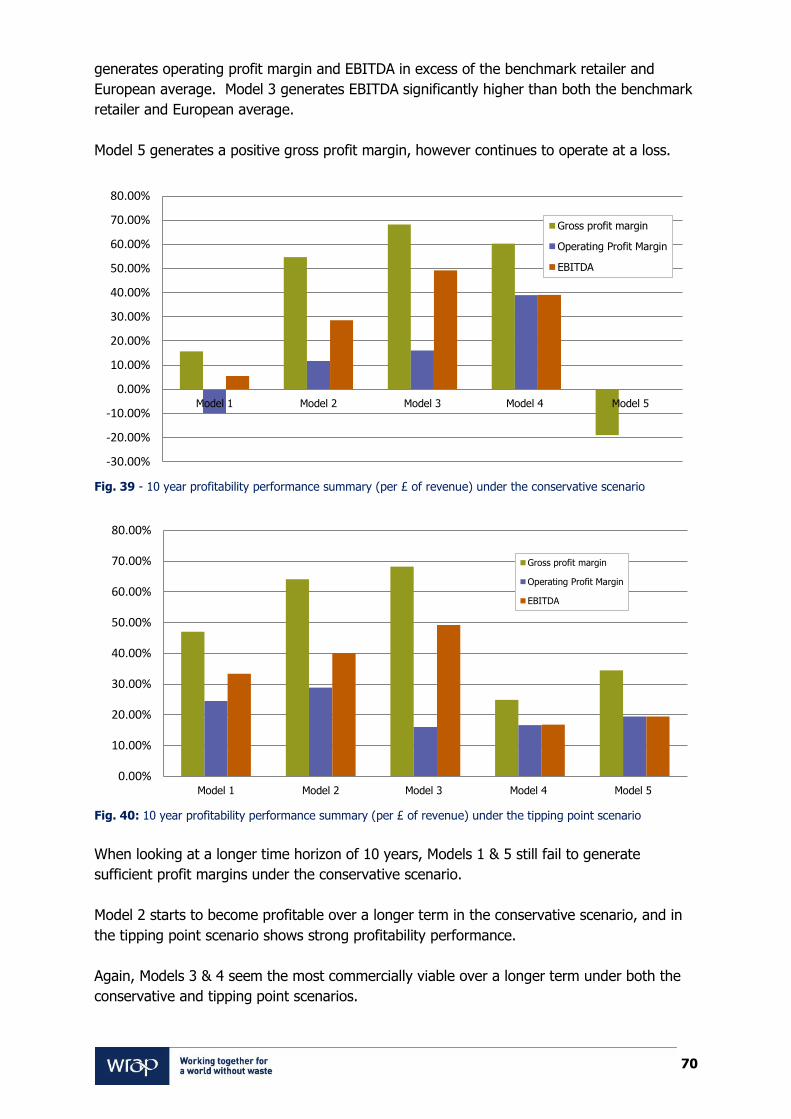
Error! No text of specified style in document. 70
generates operating profit margin and EBITDA in excess of the benchmark retailer and
European average. Model 3 generates EBITDA significantly higher than both the benchmark
retailer and European average.
Model 5 generates a positive gross profit margin, however continues to operate at a loss.
Fig. 39 - 10 year profitability performance summary (per £ of revenue) under the conservative scenario
Fig. 40: 10 year profitability performance summary (per £ of revenue) under the tipping point scenario
When looking at a longer time horizon of 10 years, Models 1 & 5 still fail to generate
sufficient profit margins under the conservative scenario.
Model 2 starts to become profitable over a longer term in the conservative scenario, and in
the tipping point scenario shows strong profitability performance.
Again, Models 3 & 4 seem the most commercially viable over a longer term under both the
conservative and tipping point scenarios.
-30.00%
-20.00%
-10.00%
0.00%
10.00%
20.00%
30.00%
40.00%
50.00%
60.00%
70.00%
80.00%
Model 1 Model 2 Model 3 Model 4 Model 5
Gross profit margin
Operating Profit Margin
EBITDA
0.00%
10.00%
20.00%
30.00%
40.00%
50.00%
60.00%
70.00%
80.00%
Model 1 Model 2 Model 3 Model 4 Model 5
Gross profit margin
Operating Profit Margin
EBITDA
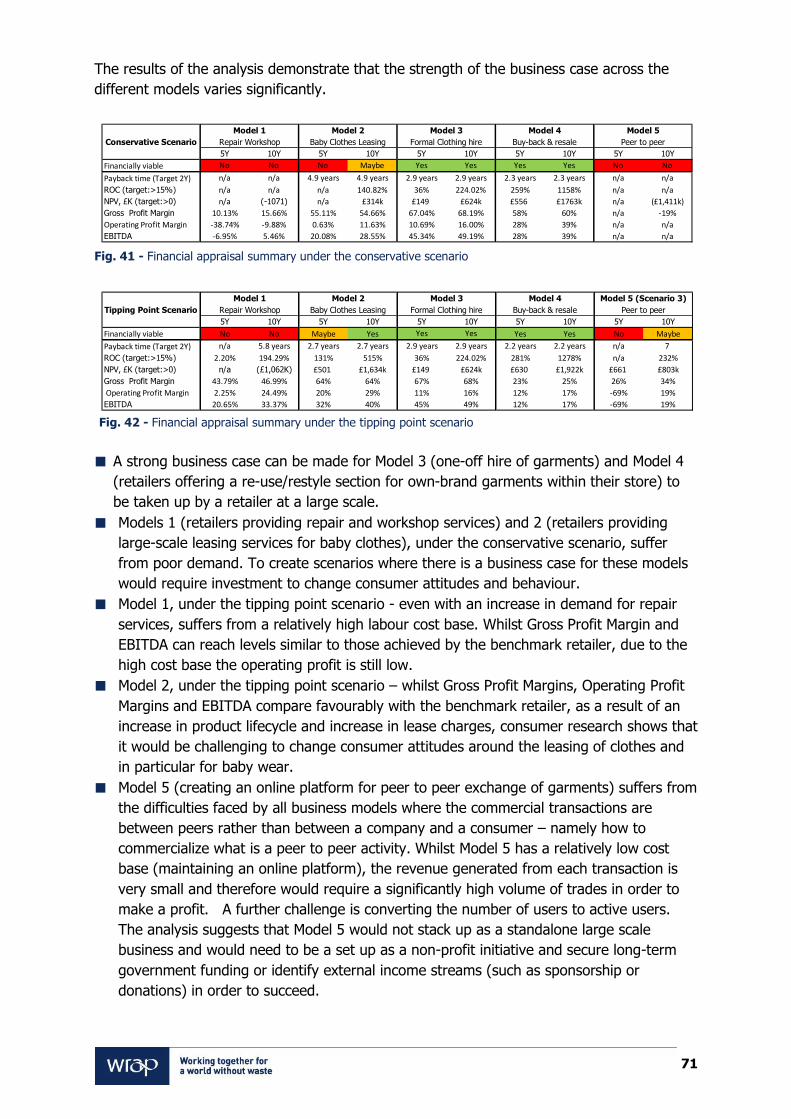
Error! No text of specified style in document. 71
The results of the analysis demonstrate that the strength of the business case across the
different models varies significantly.
Fig. 41 - Financial appraisal summary under the conservative scenario
Fig. 42 - Financial appraisal summary under the tipping point scenario
A strong business case can be made for Model 3 (one-off hire of garments) and Model 4
(retailers offering a re-use/restyle section for own-brand garments within their store) to
be taken up by a retailer at a large scale.
Models 1 (retailers providing repair and workshop services) and 2 (retailers providing
large-scale leasing services for baby clothes), under the conservative scenario, suffer
from poor demand. To create scenarios where there is a business case for these models
would require investment to change consumer attitudes and behaviour.
Model 1, under the tipping point scenario - even with an increase in demand for repair
services, suffers from a relatively high labour cost base. Whilst Gross Profit Margin and
EBITDA can reach levels similar to those achieved by the benchmark retailer, due to the
high cost base the operating profit is still low.
Model 2, under the tipping point scenario – whilst Gross Profit Margins, Operating Profit
Margins and EBITDA compare favourably with the benchmark retailer, as a result of an
increase in product lifecycle and increase in lease charges, consumer research shows that
it would be challenging to change consumer attitudes around the leasing of clothes and
in particular for baby wear.
Model 5 (creating an online platform for peer to peer exchange of garments) suffers from
the difficulties faced by all business models where the commercial transactions are
between peers rather than between a company and a consumer – namely how to
commercialize what is a peer to peer activity. Whilst Model 5 has a relatively low cost
base (maintaining an online platform), the revenue generated from each transaction is
very small and therefore would require a significantly high volume of trades in order to
make a profit. A further challenge is converting the number of users to active users.
The analysis suggests that Model 5 would not stack up as a standalone large scale
business and would need to be a set up as a non-profit initiative and secure long-term
government funding or identify external income streams (such as sponsorship or
donations) in order to succeed.
5Y 10Y 5Y 10Y 5Y 10Y 5Y 10Y 5Y 10Y
Financially viable No No No Maybe Yes Yes Yes Yes No No
Payback time (Target 2Y) n/a n/a 4.9 years 4.9 years 2.9 years 2.9 years 2.3 years 2.3 years n/a n/a
ROC (target:>15%) n/a n/a n/a 140.82% 36% 224.02% 259% 1158% n/a n/a
NPV, £K (target:>0) n/a (-1071) n/a £314k £149 £624k £556 £1763k n/a (£1,411k)
Gross Profit Margin 10.13% 15.66% 55.11% 54.66% 67.04% 68.19% 58% 60% n/a -19%
Operating Profit Margin -38.74% -9.88% 0.63% 11.63% 10.69% 16.00% 28% 39% n/a n/a
EBITDA -6.95% 5.46% 20.08% 28.55% 45.34% 49.19% 28% 39% n/a n/a
Conservative Scenario Repair Workshop Baby Clothes Leasing Formal Clothing hire Buy-back & resale Peer to peer
Model 1 Model 2 Model 3 Model 4 Model 5
5Y 10Y 5Y 10Y 5Y 10Y 5Y 10Y 5Y 10Y
Financially viable No No Maybe Yes Yes Yes Yes Yes No Maybe
Payback time (Target 2Y) n/a 5.8 years 2.7 years 2.7 years 2.9 years 2.9 years 2.2 years 2.2 years n/a 7
ROC (target:>15%) 2.20% 194.29% 131% 515% 36% 224.02% 281% 1278% n/a 232%
NPV, £K (target:>0) n/a (£1,062K) £501 £1,634k £149 £624k £630 £1,922k £661 £803k
Gross Profit Margin 43.79% 46.99% 64% 64% 67% 68% 23% 25% 26% 34%
Operating Profit Margin 2.25% 24.49% 20% 29% 11% 16% 12% 17% -69% 19%
EBITDA 20.65% 33.37% 32% 40% 45% 49% 12% 17% -69% 19%
Tipping Point Scenario Repair Workshop Baby Clothes Leasing Formal Clothing hire Buy-back & resale Peer to peer
Model 1 Model 2 Model 3 Model 4 Model 5 (Scenario 3)
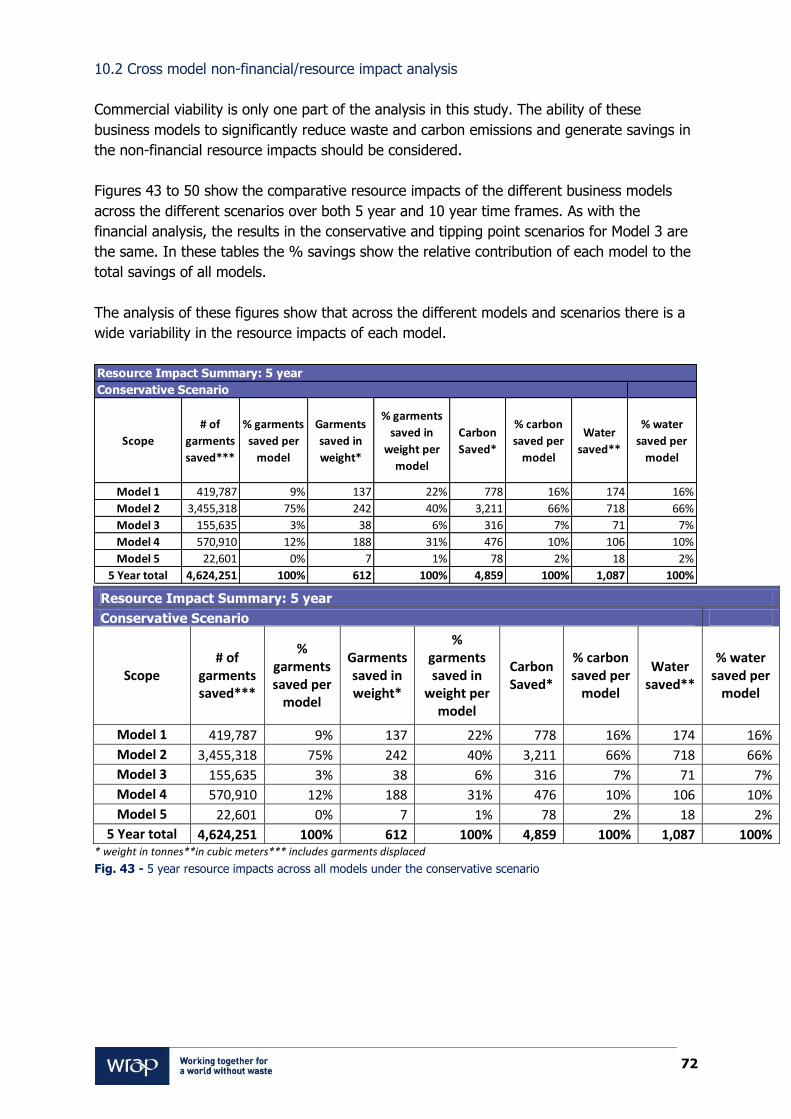
Error! No text of specified style in document. 72
10.2 Cross model non-financial/resource impact analysis
Commercial viability is only one part of the analysis in this study. The ability of these
business models to significantly reduce waste and carbon emissions and generate savings in
the non-financial resource impacts should be considered.
Figures 43 to 50 show the comparative resource impacts of the different business models
across the different scenarios over both 5 year and 10 year time frames. As with the
financial analysis, the results in the conservative and tipping point scenarios for Model 3 are
the same. In these tables the % savings show the relative contribution of each model to the
total savings of all models.
The analysis of these figures show that across the different models and scenarios there is a
wide variability in the resource impacts of each model.
Resource Impact Summary: 5 year
Conservative Scenario
Scope # of
garments saved***
% garments saved per
model
Garments saved in weight*
% garments saved in
weight per model
Carbon Saved*
% carbon saved per
model
Water saved**
% water saved per
model
Model 1 419,787 9% 137 22% 778 16% 174 16%
Model 2 3,455,318 75% 242 40% 3,211 66% 718 66%
Model 3 155,635 3% 38 6% 316 7% 71 7%
Model 4 570,910 12% 188 31% 476 10% 106 10%
Model 5 22,601 0% 7 1% 78 2% 18 2%
5 Year total 4,624,251 100% 612 100% 4,859 100% 1,087 100% * weight in tonnes**in cubic meters*** includes garments displaced
Fig. 43 - 5 year resource impacts across all models under the conservative scenario
Scope
# of
garments
saved***
% garments
saved per
model
Garments
saved in
weight*
% garments
saved in
weight per
model
Carbon
Saved*
% carbon
saved per
model
Water
saved**
% water
saved per
model
Model 1 419,787 9% 137 22% 778 16% 174 16%
Model 2 3,455,318 75% 242 40% 3,211 66% 718 66%
Model 3 155,635 3% 38 6% 316 7% 71 7%
Model 4 570,910 12% 188 31% 476 10% 106 10%
Model 5 22,601 0% 7 1% 78 2% 18 2%
5 Year total 4,624,251 100% 612 100% 4,859 100% 1,087 100%
Conservative Scenario
Resource Impact Summary: 5 year

Error! No text of specified style in document. 73
Fig. 44 - % Resource impact by model under the conservative scenario after 5 years
Resource Impact Summary: 5 year
Tipping Point Scenario
Scope
# of
garments
saved***
%
garments
saved per
model
Garments
saved in
weight*
%
garments
saved in
weight per
model
Carbon
Saved*
% carbon
saved per
model
Water
saved**
% water
saved per
model
Model 1 684,283 11% 224 20.57% 1,290 18% 288 17%
Model 2 3,673,771 59% 257 23.60% 3,371 47% 754 45%
Model 3 155,635 2% 38 3.49% 316 4% 71 4%
Model 4 1,427,276 23% 470 43.16% 1,189 16% 266 16%
Model 5 303,180 5% 100 9.18% 1,051 15% 283 17%
5 Year total 6,244,145 100% 1,089 100% 7,217 100% 1,662 100%
* weight in tonnes**in cubic meters*** includes garments displaced
Fig. 45 - 5 year resource impacts across all models under the tipping point scenario
0%
10%
20%
30%
40%
50%
60%
70%
80%
% garments saved permodel
% garments saved inweight per model
% carbon saved permodel
% water saved permodel
Model 1 Model 2 Model 3 Model 4 Model 5
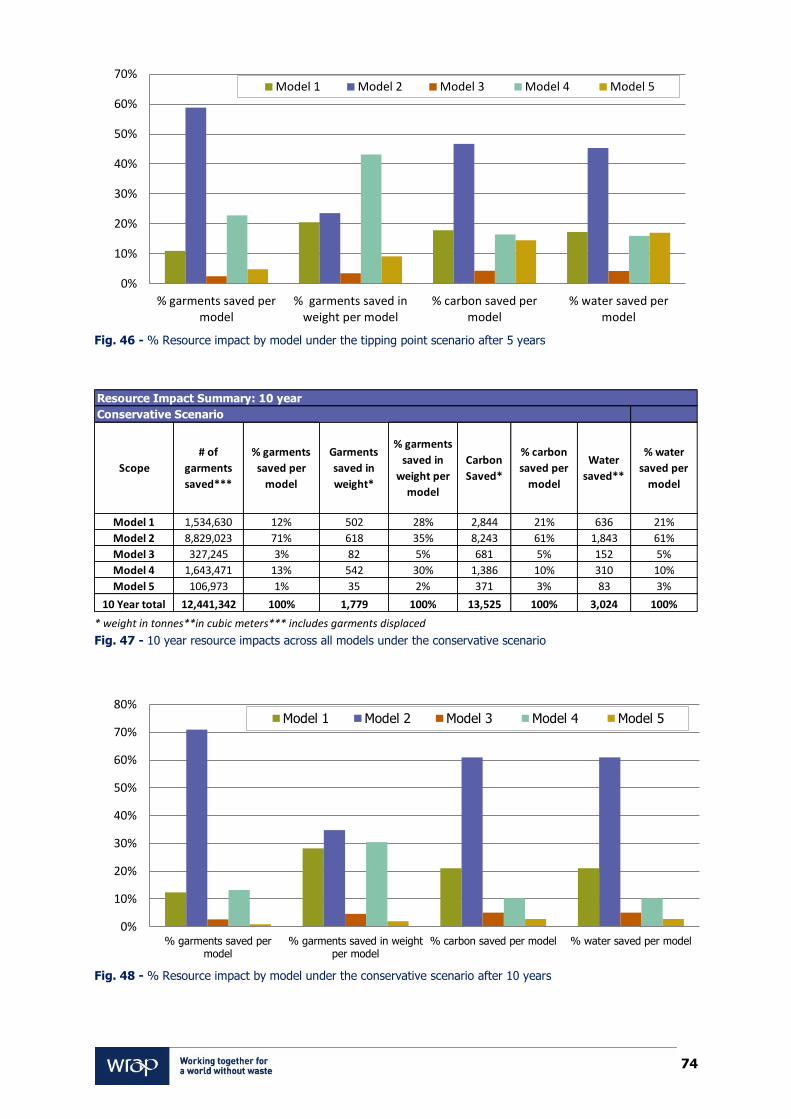
Error! No text of specified style in document. 74
Fig. 46 - % Resource impact by model under the tipping point scenario after 5 years
* weight in tonnes**in cubic meters*** includes garments displaced Fig. 47 - 10 year resource impacts across all models under the conservative scenario
Fig. 48 - % Resource impact by model under the conservative scenario after 10 years
0%
10%
20%
30%
40%
50%
60%
70%
% garments saved permodel
% garments saved inweight per model
% carbon saved permodel
% water saved permodel
Model 1 Model 2 Model 3 Model 4 Model 5
Scope
# of
garments
saved***
% garments
saved per
model
Garments
saved in
weight*
% garments
saved in
weight per
model
Carbon
Saved*
% carbon
saved per
model
Water
saved**
% water
saved per
model
Model 1 1,534,630 12% 502 28% 2,844 21% 636 21%
Model 2 8,829,023 71% 618 35% 8,243 61% 1,843 61%
Model 3 327,245 3% 82 5% 681 5% 152 5%
Model 4 1,643,471 13% 542 30% 1,386 10% 310 10%
Model 5 106,973 1% 35 2% 371 3% 83 3%
10 Year total 12,441,342 100% 1,779 100% 13,525 100% 3,024 100%
Conservative Scenario
Resource Impact Summary: 10 year
0%
10%
20%
30%
40%
50%
60%
70%
80%
% garments saved permodel
% garments saved in weightper model
% carbon saved per model % water saved per model
Model 1 Model 2 Model 3 Model 4 Model 5
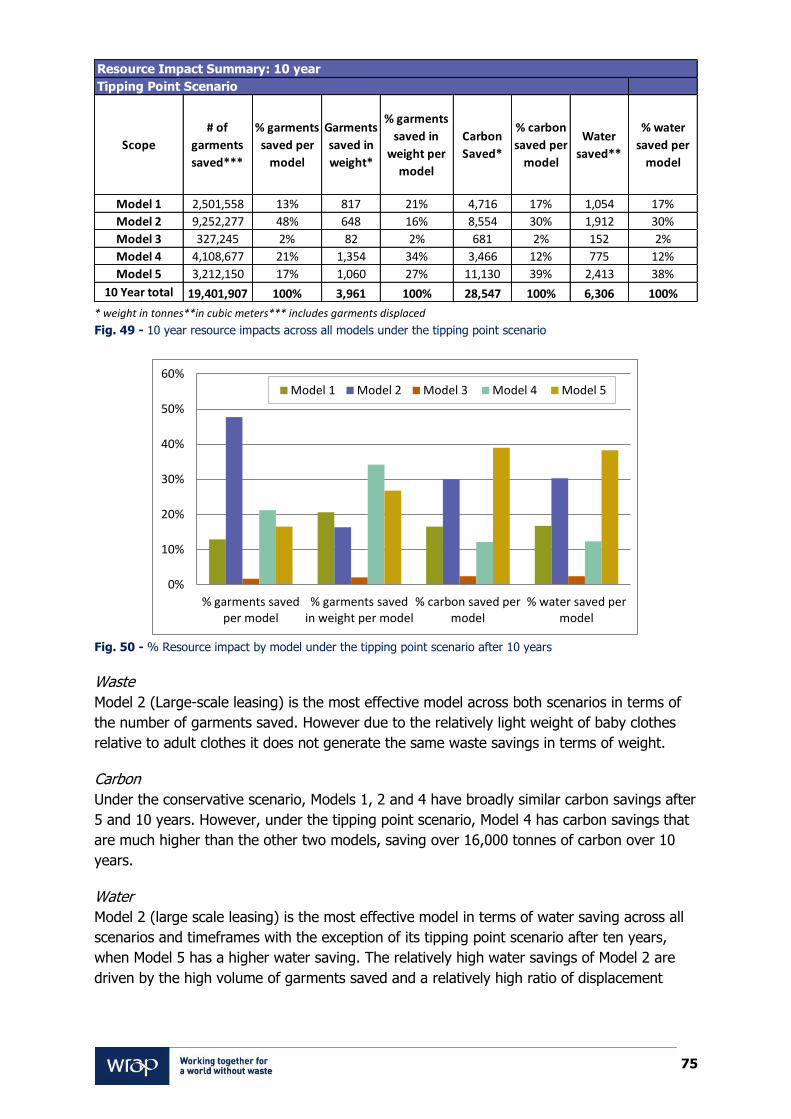
Error! No text of specified style in document. 75
* weight in tonnes**in cubic meters*** includes garments displaced
Fig. 49 - 10 year resource impacts across all models under the tipping point scenario
Fig. 50 - % Resource impact by model under the tipping point scenario after 10 years
Waste
Model 2 (Large-scale leasing) is the most effective model across both scenarios in terms of
the number of garments saved. However due to the relatively light weight of baby clothes
relative to adult clothes it does not generate the same waste savings in terms of weight.
Carbon
Under the conservative scenario, Models 1, 2 and 4 have broadly similar carbon savings after
5 and 10 years. However, under the tipping point scenario, Model 4 has carbon savings that
are much higher than the other two models, saving over 16,000 tonnes of carbon over 10
years.
Water
Model 2 (large scale leasing) is the most effective model in terms of water saving across all
scenarios and timeframes with the exception of its tipping point scenario after ten years,
when Model 5 has a higher water saving. The relatively high water savings of Model 2 are
driven by the high volume of garments saved and a relatively high ratio of displacement
Scope
# of
garments
saved***
% garments
saved per
model
Garments
saved in
weight*
% garments
saved in
weight per
model
Carbon
Saved*
% carbon
saved per
model
Water
saved**
% water
saved per
model
Model 1 2,501,558 13% 817 21% 4,716 17% 1,054 17%
Model 2 9,252,277 48% 648 16% 8,554 30% 1,912 30%
Model 3 327,245 2% 82 2% 681 2% 152 2%
Model 4 4,108,677 21% 1,354 34% 3,466 12% 775 12%
Model 5 3,212,150 17% 1,060 27% 11,130 39% 2,413 38%
10 Year total 19,401,907 100% 3,961 100% 28,547 100% 6,306 100%
Tipping Point Scenario
Resource Impact Summary: 10 year
0%
10%
20%
30%
40%
50%
60%
% garments savedper model
% garments savedin weight per model
% carbon saved permodel
% water saved permodel
Model 1 Model 2 Model 3 Model 4 Model 5

Error! No text of specified style in document. 76
effect of 1:1 as opposed to 1:0.6 allocated to Models 1, 4, and 5 and 1:0.5 allocated to
Model 3.
Model 5 has relatively low carbon and water savings after 5 years at ~1,000 tonnes of
carbon and 300 cubic metres of water. However after 10 years this model has relatively high
carbon and water savings at over 10,000 tonnes of carbon and 4,000 cubic metres of water
saved.
10.2.1 Summary
Figures 51 and 52 show summaries of the resource impacts of all the different models under
the conservative and tipping point scenarios respectively. For each resource metric, the
impacts have been categorised as ‘good’, ‘acceptable’ or ‘not acceptable’ depending on
whether they reach a given threshold. Thresholds vary depending on the resource being
analysed. For example, for the number of garments saved, the five year thresholds are as
follows <200k garments is ’not acceptable’, 200k-1000k garments is ‘acceptable’ and >1000k
is ‘good’. The thresholds move upwards in the tipping point scenario to reflect the increased
impacts.
Figure 51 shows that Models 1, 2 and 4 generate ‘good’ or ‘acceptable’ resource impacts
under the conservative scenario. However, Models 1 and 4 require up to ten years to
generate relatively good resource impacts.
Under the conservative scenario, Models 3 and 5 fail to generate ‘acceptable’ environmental
impacts after 10 years.
Under the tipping point scenario, all models apart from Model 3 Formal Clothing Hire
generate ‘acceptable’ resource impacts after 5 years and relatively good resource impacts
after 10 years.
Fig. 51 - Resource impacts for the conservative scenario
Fig. 52 - Resource impacts for the tipping point scenario
5Y 10Y 5Y 10Y 5Y 10Y 5Y 10Y 5Y 10Y
Resource Impact overall Acceptable Good Good GoodNot
acceptableAcceptable Acceptable Good
Not
acceptable
Not
acceptable
No of Garments 419,787 1,534,630 3,455,318 8,829,023 153,635 327,245 570,910 1,643,471 22,601 106,973
Garments saved in weight* 137 502 242 618 38 82 188 542 7 35
Carbon saved* 778 2,844 3,211 8,243 316 681 476 1,386 78 371
Water Saved** 174 636 718 1,843 71 152 106 310 18 83
* in tonnes, ** in cubic metres
Conservative Scenario Peer to peerBuy-back & resaleFormal Clothing hireBaby Clothes LeasingRepair Workshop
Model 1 Model 2 Model 3 Model 4 Model 5
5Y 10Y 5Y 10Y 5Y 10Y 5Y 10Y 5Y 10Y
Resource Impact overall Acceptable Good Acceptable GoodNot
acceptable
Not
acceptableAcceptable Good Acceptable Good
No of Garments 684,283 2,501,558 3,673,771 9,252,277 153,635 327,245 1,427,276 4,108,677 303,180 3,212,150
Garments saved in weight 224 817 257 648 38 82 470 1,354 100 1,060
Carbon saved 1,290 4,716 3,371 8,554 316 681 1,189 3,466 1,051 11,130
Water Saved 288 1,054 754 1,912 71 152 266 775 235 2,488
* in tonnes, ** in cubic metres
Tipping Point Scenario Peer to peerBuy-back & resaleFormal Clothing hireBaby Clothes LeasingRepair Workshop
Model 5 (Scenario 3)Model 4Model 3Model 2Model 1
Error! No text of specified style in document. 77
11.0 Recommendations and Next Steps
There are a number of key recommendations and next steps that are apparent from the
research.
All the models presented in this research are based on a variety of material assumptions that
likely to change when applied in a specific business context. The models and scenarios,
particularly for Models 2, 3 & 4, suggest that there is potential for a business case to be
made that combines strong financial performance with reasonable savings in the numbers of
garments going to waste. As stated in the methodology, we have been prudent with all
assumptions made in the models; therefore it is likely that, when tailored to individual
businesses, these models may be better than expressed in the models presented here, from
a resource impact and profitability perspective.
Furthermore, the majority of the models included in this study operate on a relatively lower
cost base compared to conventional models, and if sufficient demand can be created, they
have the potential to be even more commercially viable at a large scale and generate
significant resource benefit.

Error! No text of specified style in document. 78
Appendix I
1) Financial Model Structure
Reducing Risk:
Each ‘Option’ is projected using a separate Microsoft© Excel workbook and each workbook is
constructed in line with ‘Modelling Best Practice’. Modelling Best Practices are designed to
reduce the level of risk inherent within a set of projections and so provide greater comfort
around the accuracy of the projected results. Examples of modelling best practices include:
Separation of user input assumptions, from calculations, from outputs;
Excluding numbers from all formulae; and
Breaking down calculations into simple logical steps.
In addition to adopting Modelling Best Practices to reduce risk, each model also incorporates
a ‘Check System’ that monitors the user inputs to ensure they are entered correctly and if
not, highlight that to the user and provide necessary information to resolve any problem.
Workbook Layout:
Each Model calculates on a monthly basis for a period of either 5 or 10 years, commencing
from a variable start date. The start date is assumed to be the 1st January 2013, therefore
creating 12 month financial year-ends of the 31st December. At the end of the model period,
if selected, certain financial appraisal techniques quantify the effect of continuing the
projections into perpetuity.
Each Model incorporates a Dashboard that presents a one-page summary of projected
results, including a number of key inputs and sensitivity assumptions, project appraisal
conclusions, plus charts of the monthly profile of income vs. costs vs. resulting bank balance.
The financial statement outputs incorporate a tailored Profit & Loss account, incorporating
those line items specific to the particular Option being modelled. Each Model also outputs
two Cash Flow statements; an easy to understand receipts and payments style cash flow,
together with a secondary Cash Flow prepared on a flow of funds basis (the Model’s inbuilt
Check System continually monitors that both cash flow statements are calculating the same
closing cash balance each month, thus enhancing the security of calculations). And the final
financial statement is a Balance Sheet, fully integrated with the other financial statements.
All of the user’s input assumptions are contained on the General Inputs worksheet, grouped
in a number of logical sections. The layout and number of input assumptions are specific to
each Option being modelled and each Model demonstrates the effect of changing user
assumptions, by showing calculation results on the General Inputs page adjacent to the
input assumptions. This technique is another approach to reduce risk in modelling, so that
the user can understand and easily track the effect of assumption changes.
Other Model Structure Points:
Each ‘Option’ is projected as a single trading entity, without any added complexities of intra-
group charges or consolidation adjustments. All transactions are also assumed to be in

Error! No text of specified style in document. 79
Sterling, therefore the effect of any foreign implications (e.g. offshore manufacturing) are
ignored.
VAT assumptions are incorporated specific to the items being calculated, as are working
capital assumptions for each different customer sale and supplier purchase. And based upon
standard UK taxation regime, corporation taxation calculations are incorporated in order to
calculate net of tax cash positions.
The projections do not include any funding assumptions. If the model calculates that a
project has a funding need, rather than complicate matters by us assuming an Option
specific funding structure, the projections show a negative position at bank.

www.wrap.org.uk/clothing