wrap/fejf phase iii/iv emissions inventory project wrap - fire emissions joint forum meeting san...
TRANSCRIPT

WRAP/FEJFPhase III/IV Emissions Inventory
Project
WRAP - Fire Emissions Joint Forum MeetingSan Diego, CA
22 February 20071015a – Presentation (a)
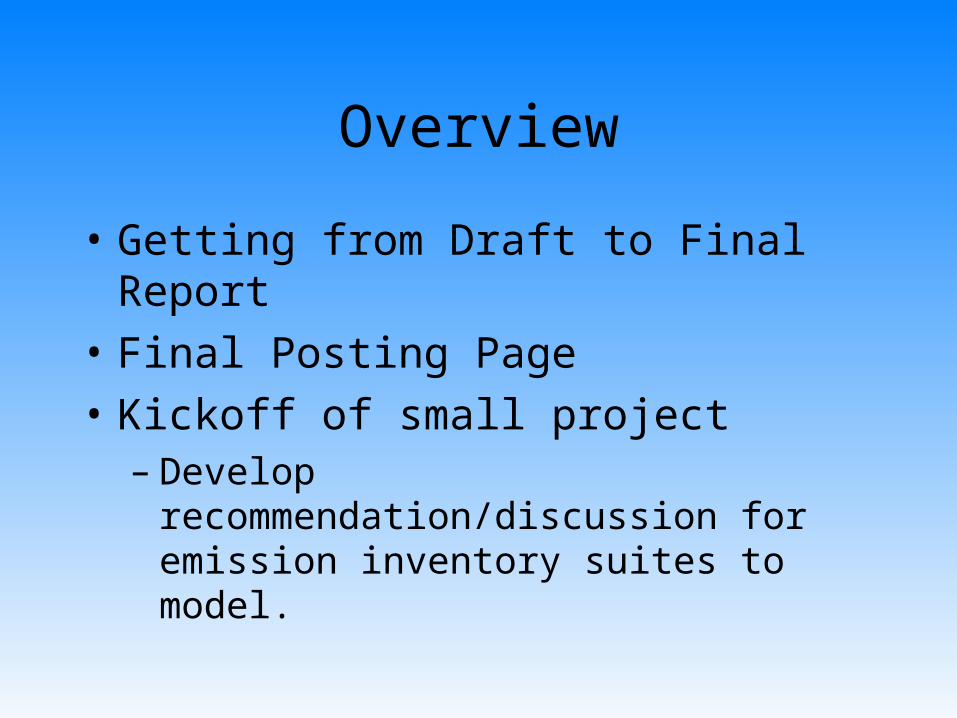
Overview
• Getting from Draft to Final Report
• Final Posting Page
• Kickoff of small project– Develop recommendation/discussion for
emission inventory suites to model.
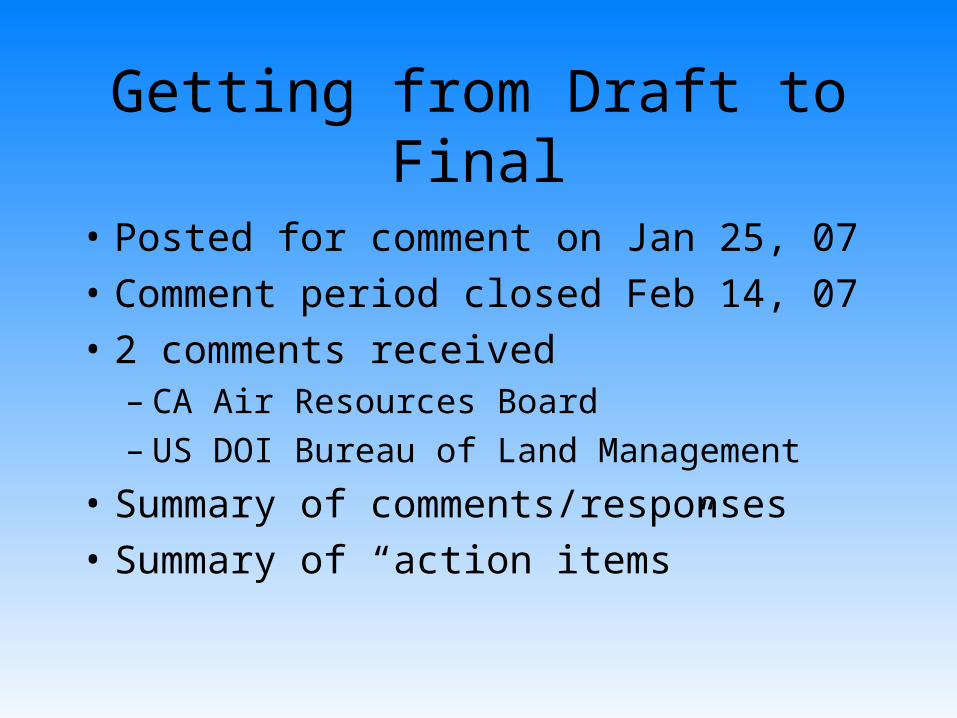
Getting from Draft to Final
• Posted for comment on Jan 25, 07
• Comment period closed Feb 14, 07
• 2 comments received– CA Air Resources Board– US DOI Bureau of Land Management
• Summary of comments/responses
• Summary of “action items”
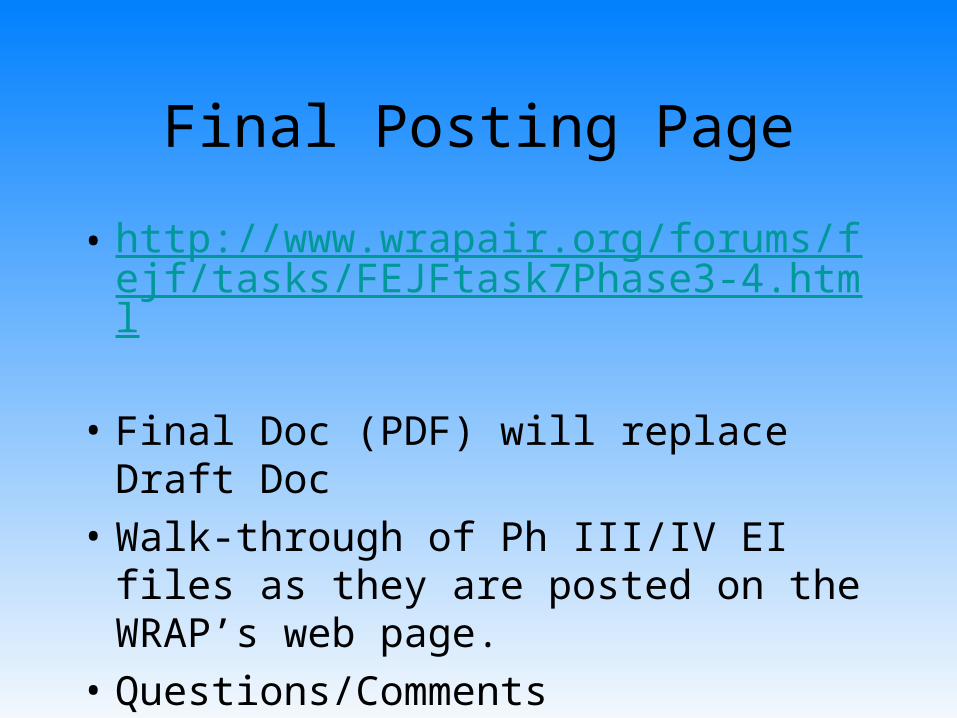
Final Posting Page
• http://www.wrapair.org/forums/fejf/tasks/FEJFtask7Phase3-4.html
• Final Doc (PDF) will replace Draft Doc
• Walk-through of Ph III/IV EI files as they are posted on the WRAP’s web page.
• Questions/Comments
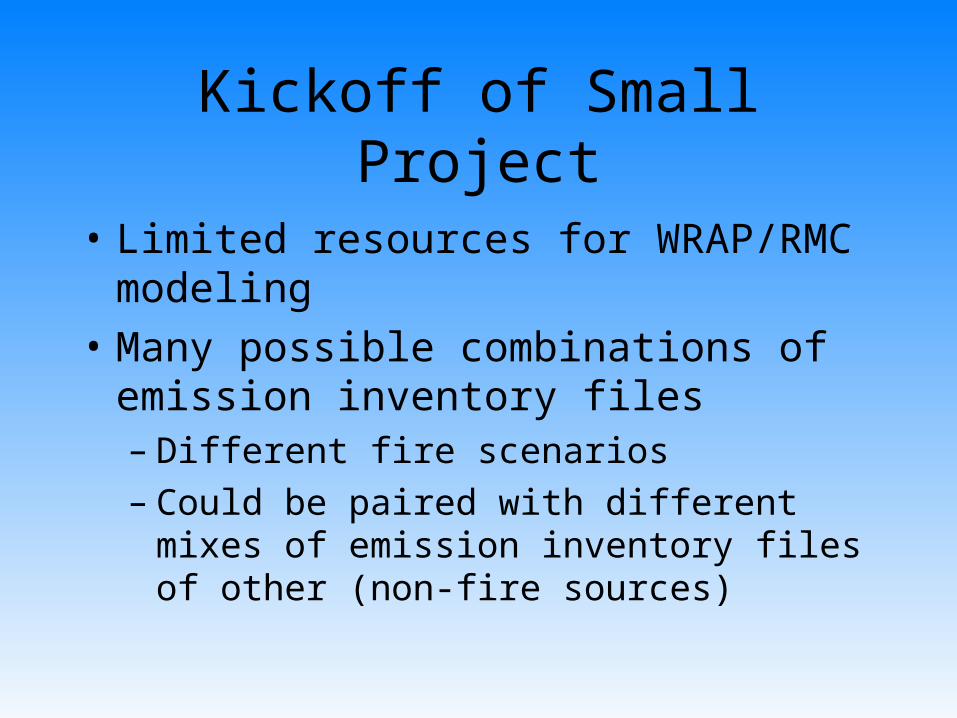
Kickoff of Small Project
• Limited resources for WRAP/RMC modeling
• Many possible combinations of emission inventory files– Different fire scenarios– Could be paired with different mixes of
emission inventory files of other (non-fire sources)
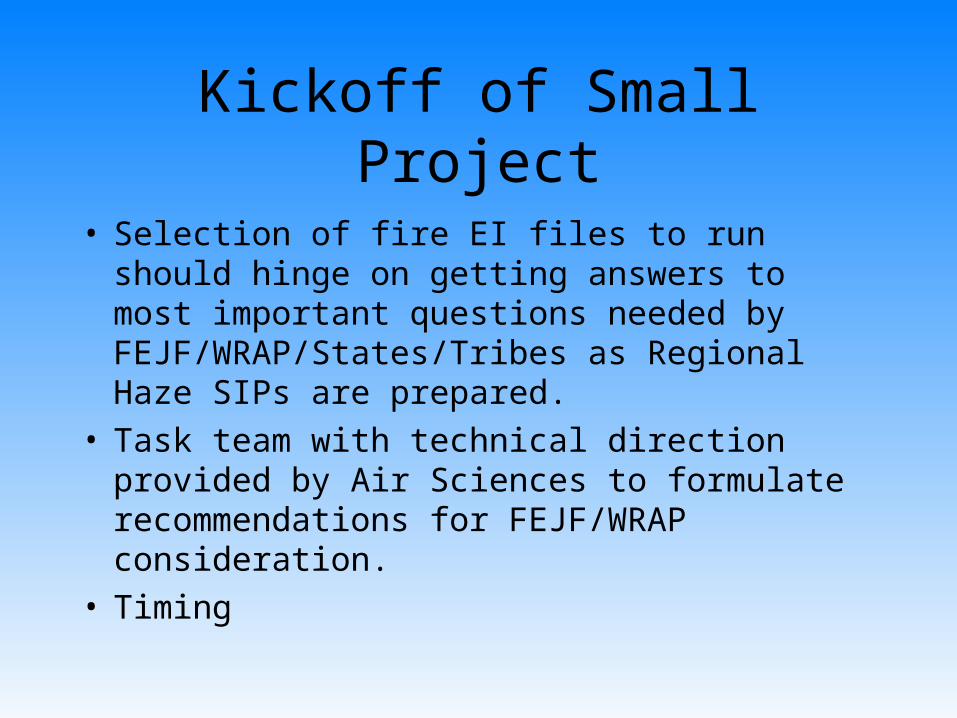
Kickoff of Small Project
• Selection of fire EI files to run should hinge on getting answers to most important questions needed by FEJF/WRAP/States/Tribes as Regional Haze SIPs are prepared.
• Task team with technical direction provided by Air Sciences to formulate recommendations for FEJF/WRAP consideration.
• Timing
WRAP/FEJFEmission Inventory Projection Tool
WRAP - Fire Emissions Joint Forum MeetingSan Diego, CA
22 February 20071015a – Presentation (b)
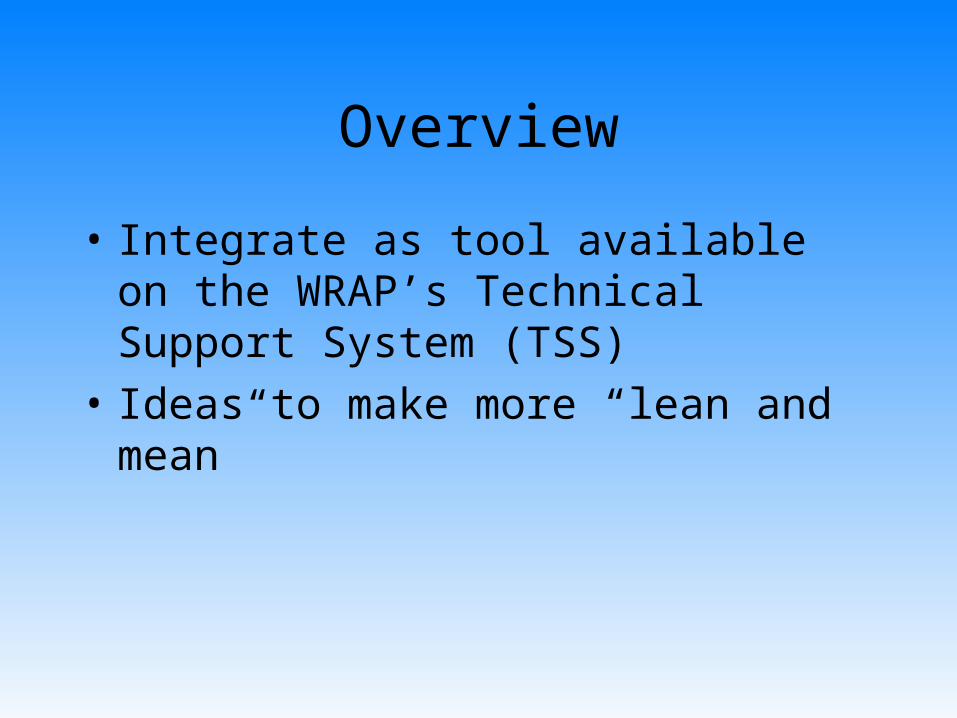
Overview
• Integrate as tool available on the WRAP’s Technical Support System (TSS)
• Ideas to make more “lean and mean”
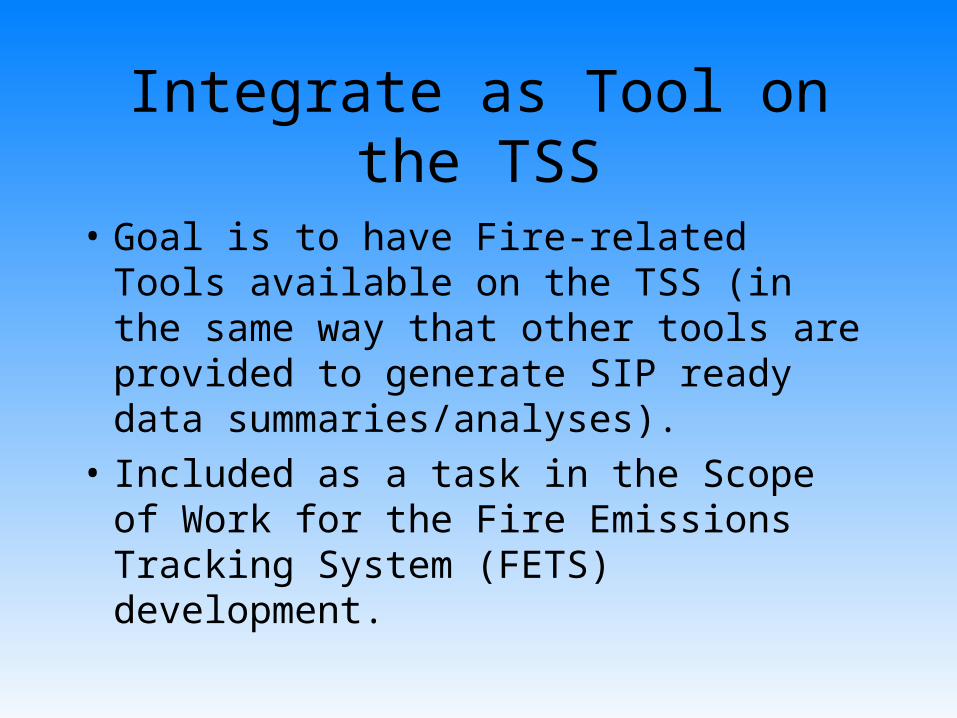
Integrate as Tool on the TSS
• Goal is to have Fire-related Tools available on the TSS (in the same way that other tools are provided to generate SIP ready data summaries/analyses).
• Included as a task in the Scope of Work for the Fire Emissions Tracking System (FETS) development.
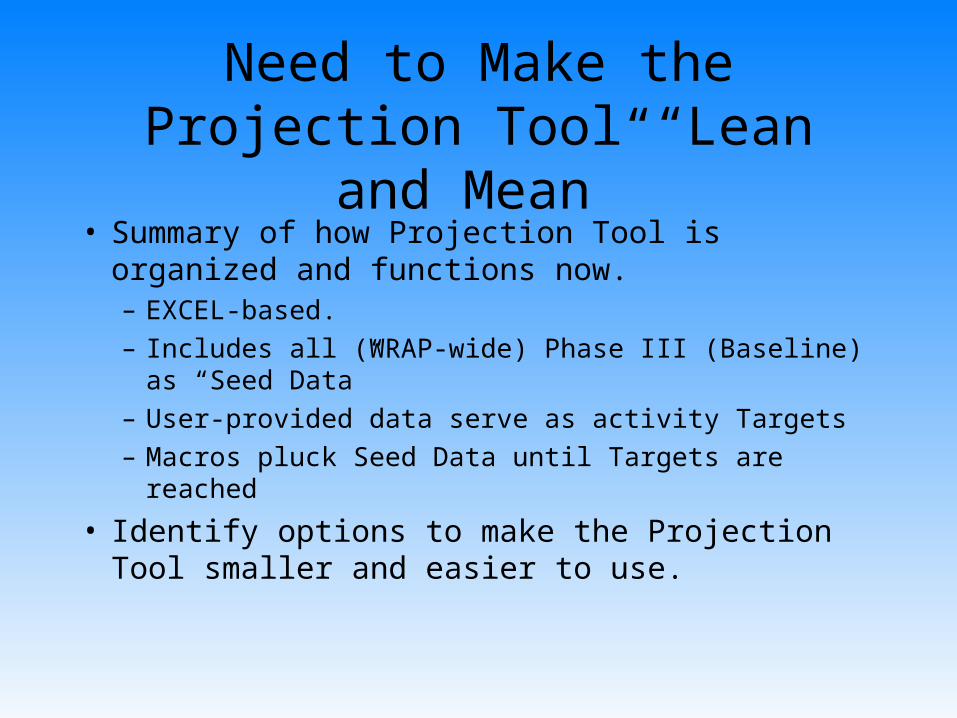
Need to Make the Projection Tool “Lean and Mean”
• Summary of how Projection Tool is organized and functions now.– EXCEL-based.– Includes all (WRAP-wide) Phase III (Baseline) as
“Seed Data”– User-provided data serve as activity Targets– Macros pluck Seed Data until Targets are reached
• Identify options to make the Projection Tool smaller and easier to use.

Need to Make the Projection Tool “Lean and Mean”
• Options to make the Projection Tool smaller and easier to grab and use.– Create 13 state-specific tools.– Limit Seed Data to representative (but relatively
small) number of events.• Lots of events in the Projection EI would be identical.• Would have to apply statistics to temporally and spatially
distribute.
– Other?
WRAP/FEJFInter RPO Report
WRAP - Fire Emissions Joint Forum MeetingSan Diego, CA
22 February 20071015a – Presentation (c)
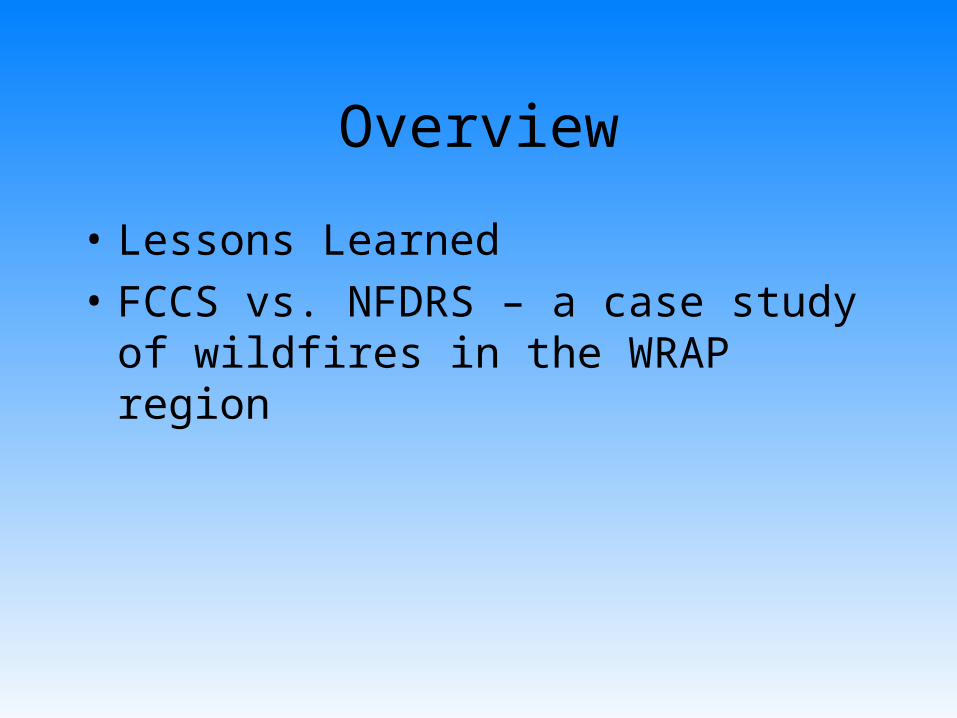
Overview
• Lessons Learned
• FCCS vs. NFDRS – a case study of wildfires in the WRAP region

Status of Draft Report
• 150pp report (approximate).• Proofreading/Formatting in Golden as we
speak.• Perhaps some changes/additions to “Lessons
Learned” section based on discussions today.• Posted and available for review on Friday,
February 23, 2007.• 2-4 weeks for review/comment, make
necessary revisions, then post as Final.
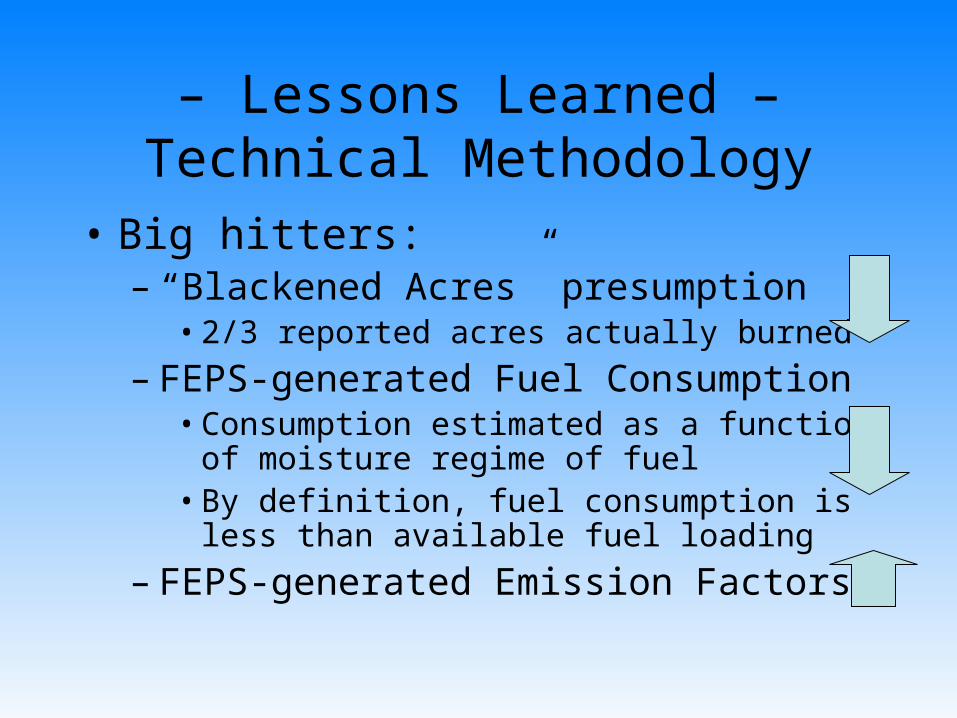
– Lessons Learned – Technical Methodology
• Big hitters:– “Blackened Acres” presumption
• 2/3 reported acres actually burned
– FEPS-generated Fuel Consumption• Consumption estimated as a function of
moisture regime of fuel• By definition, fuel consumption is less than
available fuel loading
– FEPS-generated Emission Factors
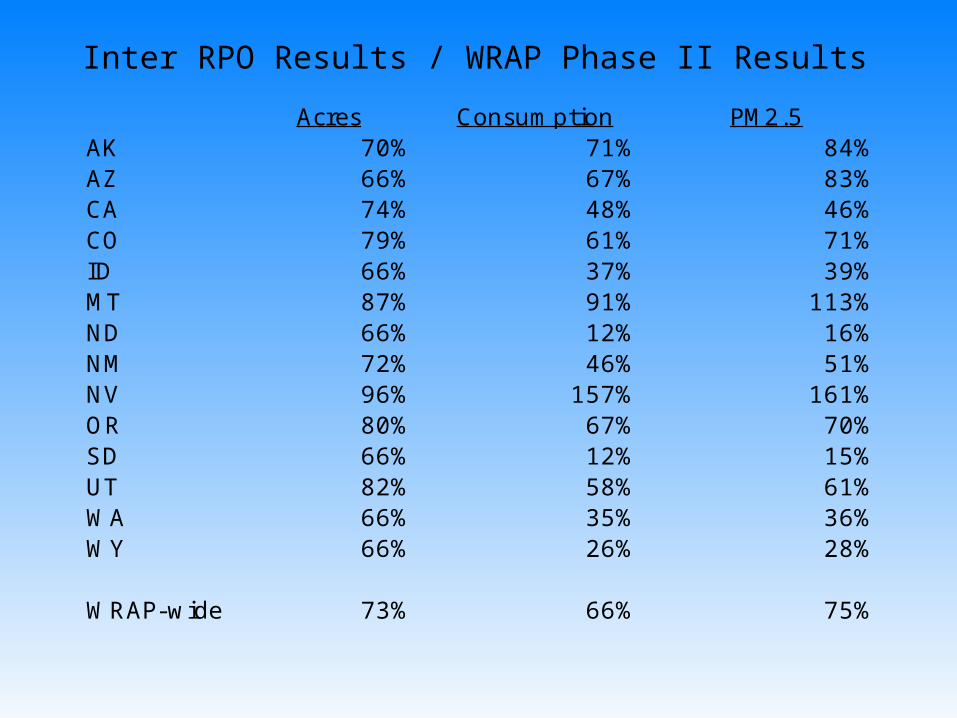
Inter RPO Results / WRAP Phase II Results
Acres Consumption PM2.5AK 70% 71% 84%AZ 66% 67% 83%CA 74% 48% 46%CO 79% 61% 71%ID 66% 37% 39%MT 87% 91% 113%ND 66% 12% 16%NM 72% 46% 51%NV 96% 157% 161%OR 80% 67% 70%SD 66% 12% 15%UT 82% 58% 61%WA 66% 35% 36%WY 66% 26% 28%
WRAP-wide 73% 66% 75%
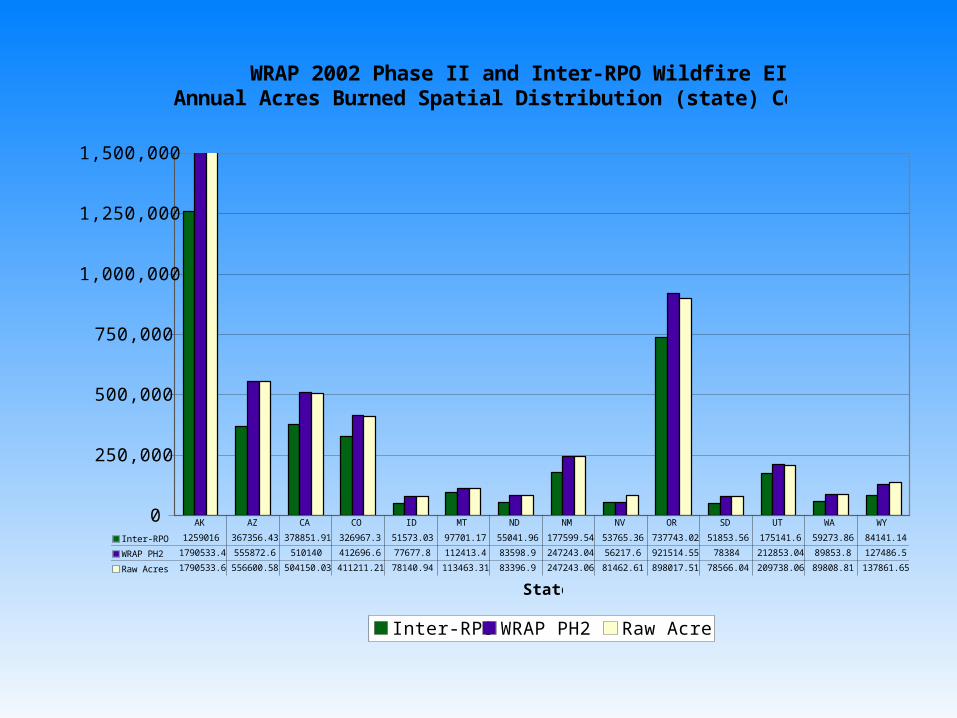
WRAP 2002 Phase II and Inter-RPO Wildfire EIAnnual Acres Burned Spatial Distribution (state) Comparison
0
250,000
500,000
750,000
1,000,000
1,250,000
1,500,000
State
Acr
es
Inter-RPO WRAP PH2 Raw Acres
Inter-RPO 1259016 367356.43 378851.91 326967.3 51573.03 97701.17 55041.96 177599.54 53765.36 737743.02 51853.56 175141.6 59273.86 84141.14
WRAP PH2 1790533.4 555872.6 510140 412696.6 77677.8 112413.4 83598.9 247243.04 56217.6 921514.55 78384 212853.04 89853.8 127486.5
Raw Acres 1790533.6 556600.58 504150.03 411211.21 78140.94 113463.31 83396.9 247243.06 81462.61 898017.51 78566.04 209738.06 89808.81 137861.65
AK AZ CA CO ID MT ND NM NV OR SD UT WA WY
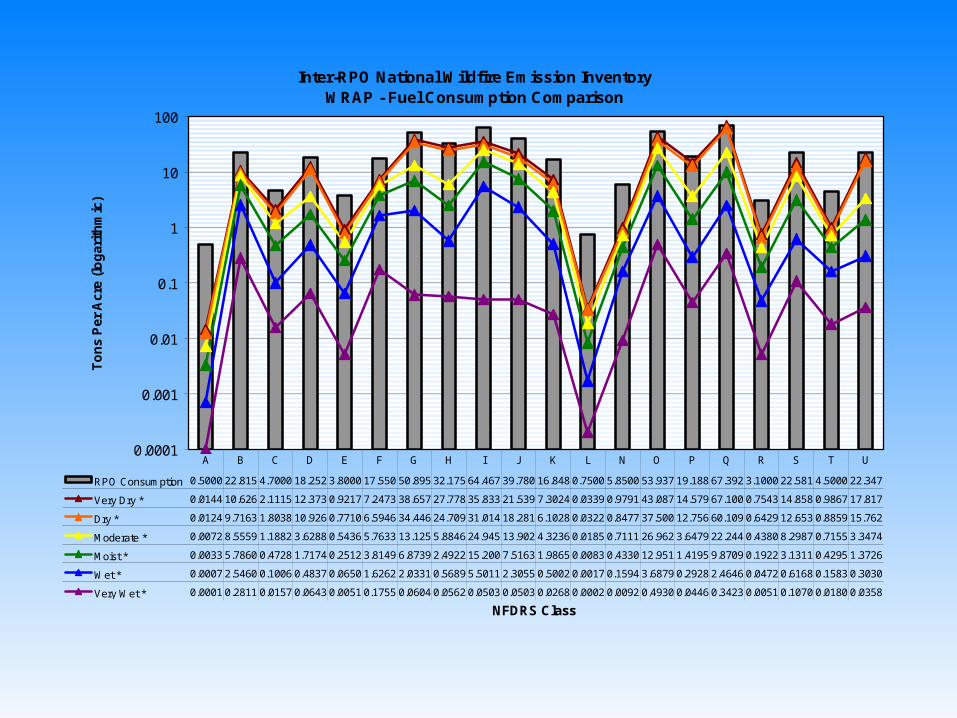
Inter-RPO National Wildfire Emission InventoryWRAP - Fuel Consumption Comparison
0.0001
0.001
0.01
0.1
1
10
100
NFDRS Class
To
ns
Per
Acr
e (l
og
arit
hm
ic)
RPO Consumption 0.5000 22.815 4.7000 18.252 3.8000 17.550 50.895 32.175 64.467 39.780 16.848 0.7500 5.8500 53.937 19.188 67.392 3.1000 22.581 4.5000 22.347
Very Dry * 0.0144 10.626 2.1115 12.373 0.9217 7.2473 38.657 27.778 35.833 21.539 7.3024 0.0339 0.9791 43.087 14.579 67.100 0.7543 14.858 0.9867 17.817
Dry * 0.0124 9.7163 1.8038 10.926 0.7710 6.5946 34.446 24.709 31.014 18.281 6.1028 0.0322 0.8477 37.500 12.756 60.109 0.6429 12.653 0.8859 15.762
Moderate * 0.0072 8.5559 1.1882 3.6288 0.5436 5.7633 13.125 5.8846 24.945 13.902 4.3236 0.0185 0.7111 26.962 3.6479 22.244 0.4380 8.2987 0.7155 3.3474
Moist * 0.0033 5.7860 0.4728 1.7174 0.2512 3.8149 6.8739 2.4922 15.200 7.5163 1.9865 0.0083 0.4330 12.951 1.4195 9.8709 0.1922 3.1311 0.4295 1.3726
Wet * 0.0007 2.5460 0.1006 0.4837 0.0650 1.6262 2.0331 0.5689 5.5011 2.3055 0.5002 0.0017 0.1594 3.6879 0.2928 2.4646 0.0472 0.6168 0.1583 0.3030
Very Wet * 0.0001 0.2811 0.0157 0.0643 0.0051 0.1755 0.0604 0.0562 0.0503 0.0503 0.0268 0.0002 0.0092 0.4930 0.0446 0.3423 0.0051 0.1070 0.0180 0.0358
A B C D E F G H I J K L N O P Q R S T U
* Inter-RPO Fuel Consumption
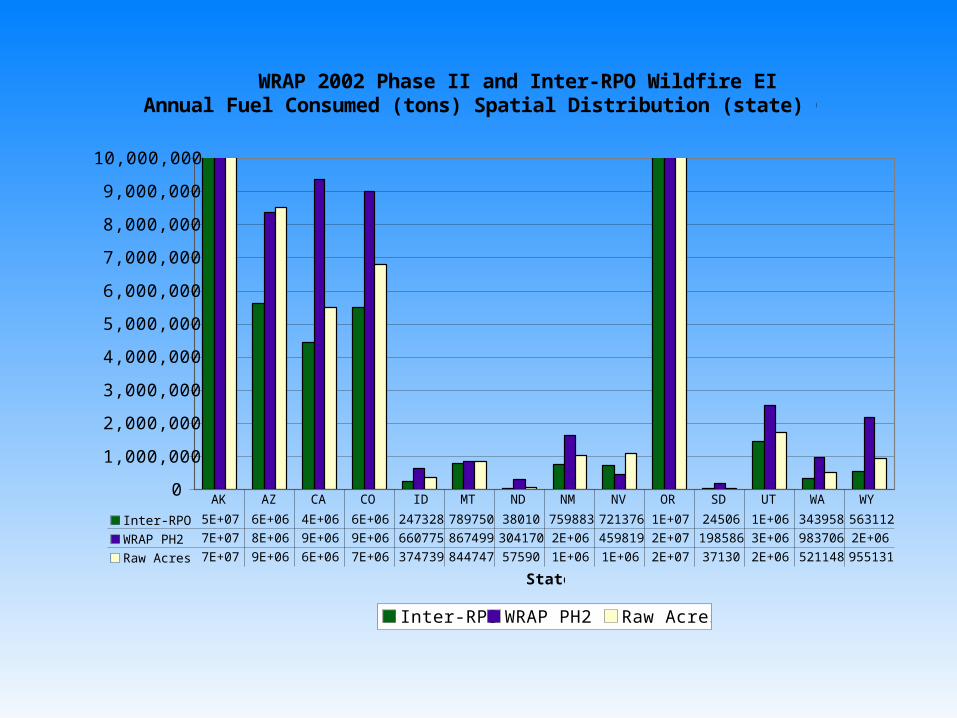
WRAP 2002 Phase II and Inter-RPO Wildfire EIAnnual Fuel Consumed (tons) Spatial Distribution (state) Comparison
0
1,000,000
2,000,000
3,000,000
4,000,000
5,000,000
6,000,000
7,000,000
8,000,000
9,000,000
10,000,000
State
Ton
s F
uel
Co
nsu
med
Inter-RPO WRAP PH2 Raw Acres
Inter-RPO 5E+07 6E+06 4E+06 6E+06 247328 789750 38010 759883 721376 1E+07 24506 1E+06 343958 563112
WRAP PH2 7E+07 8E+06 9E+06 9E+06 660775 867499 304170 2E+06 459819 2E+07 198586 3E+06 983706 2E+06
Raw Acres 7E+07 9E+06 6E+06 7E+06 374739 844747 57590 1E+06 1E+06 2E+07 37130 2E+06 521148 955131
AK AZ CA CO ID MT ND NM NV OR SD UT WA WY
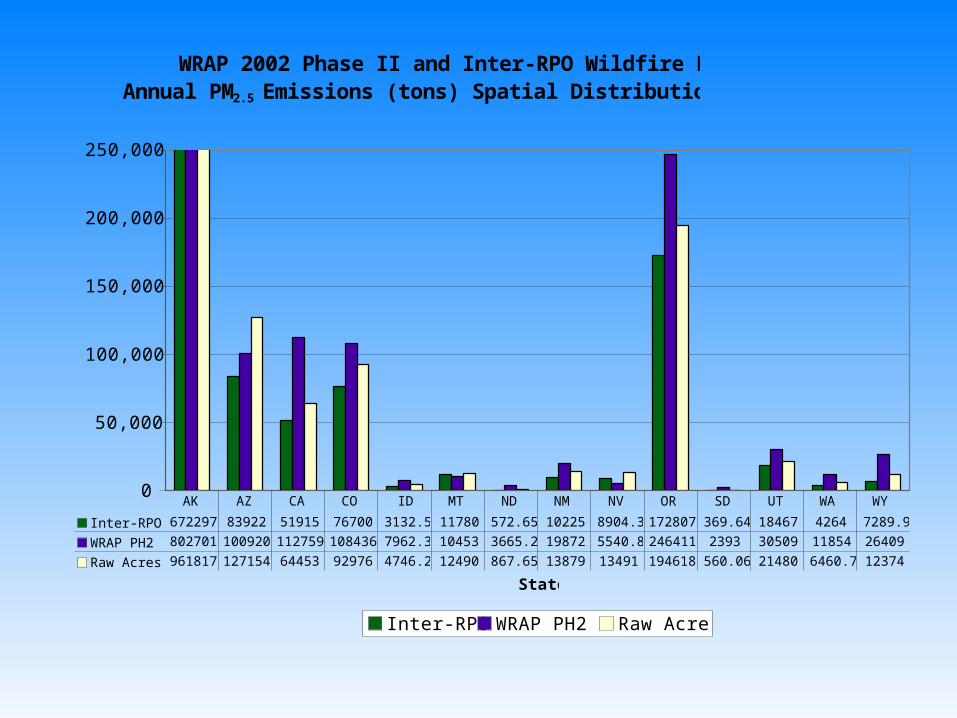
WRAP 2002 Phase II and Inter-RPO Wildfire EIAnnual PM2.5 Emissions (tons) Spatial Distribution (state)
0
50,000
100,000
150,000
200,000
250,000
State
Ton
s P
M2.
5
Inter-RPO WRAP PH2 Raw Acres
Inter-RPO 672297 83922 51915 76700 3132.5 11780 572.65 10225 8904.3 172807 369.64 18467 4264 7289.9
WRAP PH2 802701 100920 112759 108436 7962.3 10453 3665.2 19872 5540.8 246411 2393 30509 11854 26409
Raw Acres 961817 127154 64453 92976 4746.2 12490 867.65 13879 13491 194618 560.06 21480 6460.7 12374
AK AZ CA CO ID MT ND NM NV OR SD UT WA WY
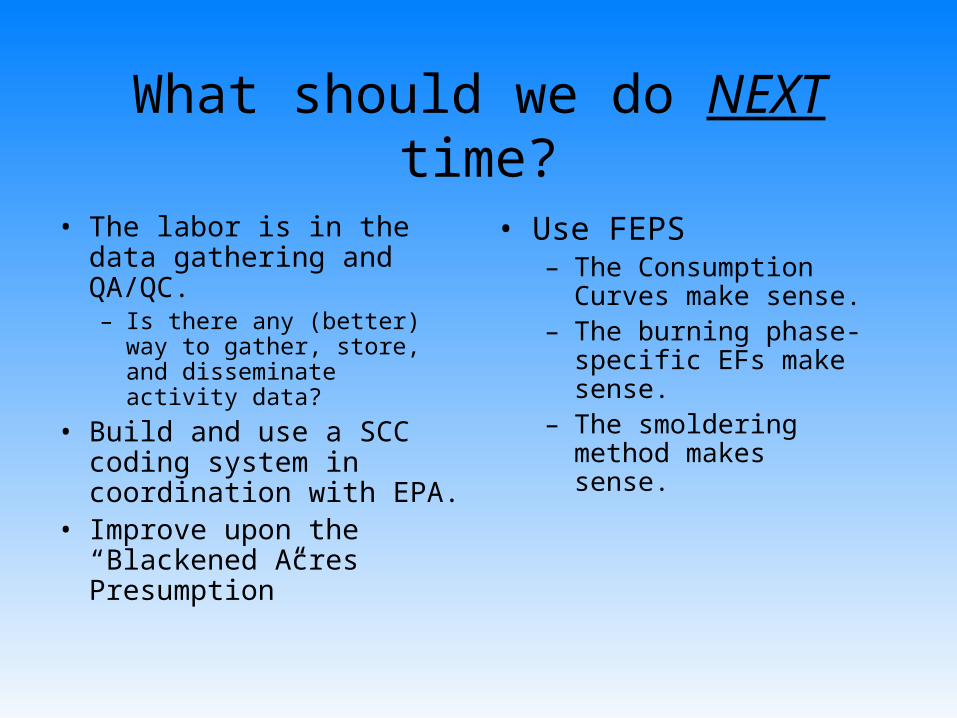
What should we do NEXT time?
• The labor is in the data gathering and QA/QC.– Is there any (better) way to
gather, store, and disseminate activity data?
• Build and use a SCC coding system in coordination with EPA.
• Improve upon the “Blackened Acres Presumption”
• Use FEPS– The Consumption
Curves make sense.– The burning phase-
specific EFs make sense.
– The smoldering method makes sense.

How should we use theInter RPO 2002 WF EI?
• If you want a wildfire EI that is developed in a consistent way across the US, there is probably no better.
• It might be an equitable way to set up “boundary” conditions due to WF emissions in regional modeling analyses.
• As a reference point to build “better” EI’s in the future:– Good activity data is
everything.– Better fire science = more
confidence in results.– Standards for NIF formats
and SCC.– …and we’ve still got the
challenge of representing these events “correctly” in the models (plume characteristics)
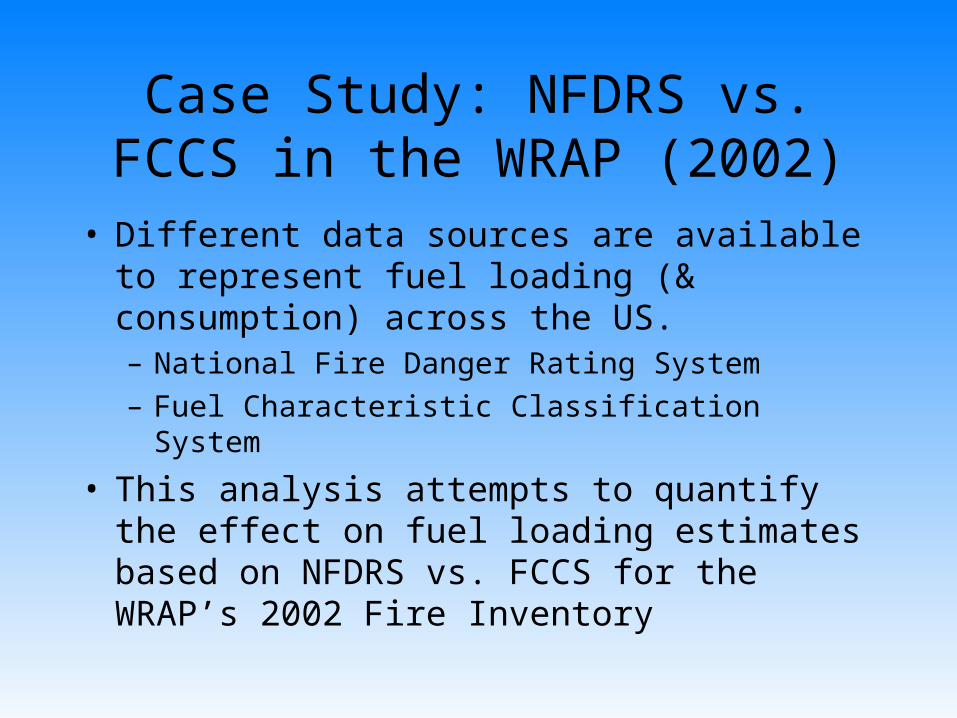
Case Study: NFDRS vs. FCCS in the WRAP (2002)
• Different data sources are available to represent fuel loading (& consumption) across the US.– National Fire Danger Rating System– Fuel Characteristic Classification System
• This analysis attempts to quantify the effect on fuel loading estimates based on NFDRS vs. FCCS for the WRAP’s 2002 Fire Inventory

Fuel Consumption Assignment Rules
Rule # Fuel loading data availability Action
1Event was subject to “large fire” fuel refinement in Phase II effort and received fuel loading based on site-level information
Use refined Phase II tons
2Fuel loading in tons or tons/acre supplied in raw activity data
Use Phase II raw tons directly
3 NFDRS code supplied in raw activity dataLook up tons from Phase II NFDRS fuel loading table
4Event subject to “perimeter-based” fuel refinement in Phase II
Assign fuel loading using perimeter over FCC map
5No fuel loading supplied in raw or refined activity data
Assign fuel loading using FCC map
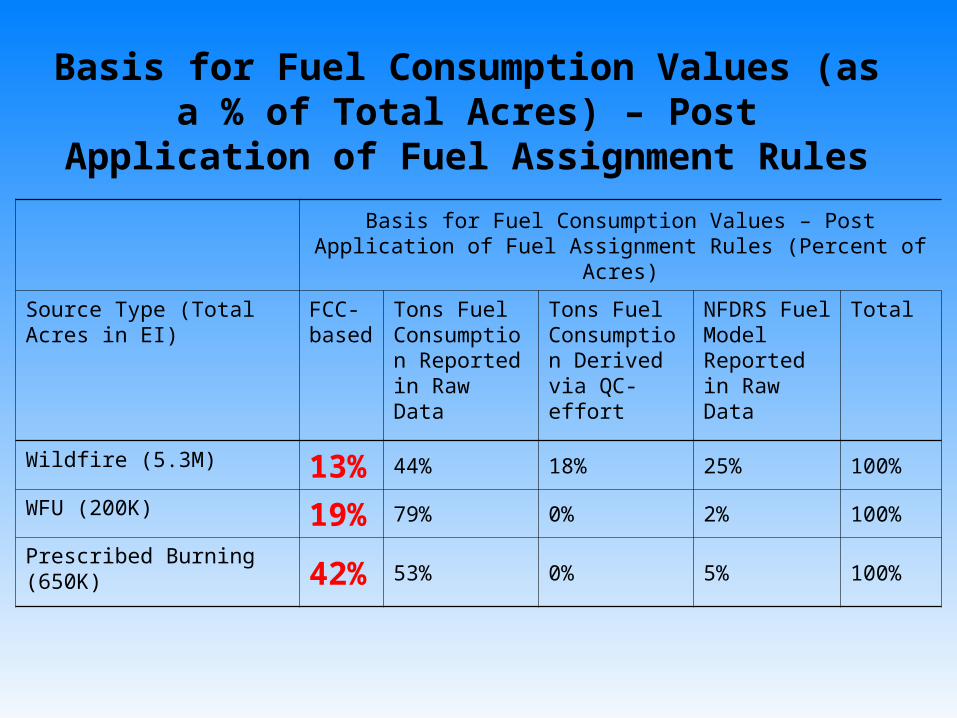
Basis for Fuel Consumption Values – Post Application of Fuel Assignment Rules (Percent of Acres)
Source Type (Total Acres in EI)
FCC-based
Tons Fuel Consumption Reported in Raw Data
Tons Fuel Consumption Derived via QC-effort
NFDRS Fuel Model Reported in Raw Data
Total
Wildfire (5.3M) 13%
44% 18% 25% 100%
WFU (200K) 19%
79% 0% 2% 100%
Prescribed Burning (650K)
42%
53% 0% 5% 100%
Basis for Fuel Consumption Values (as a % of Total Acres) – Post Application of Fuel
Assignment Rules
0
2,000,000
4,000,000
6,000,000
8,000,000
10,000,000
12,000,000
14,000,000
16,000,000
18,000,000
20,000,000
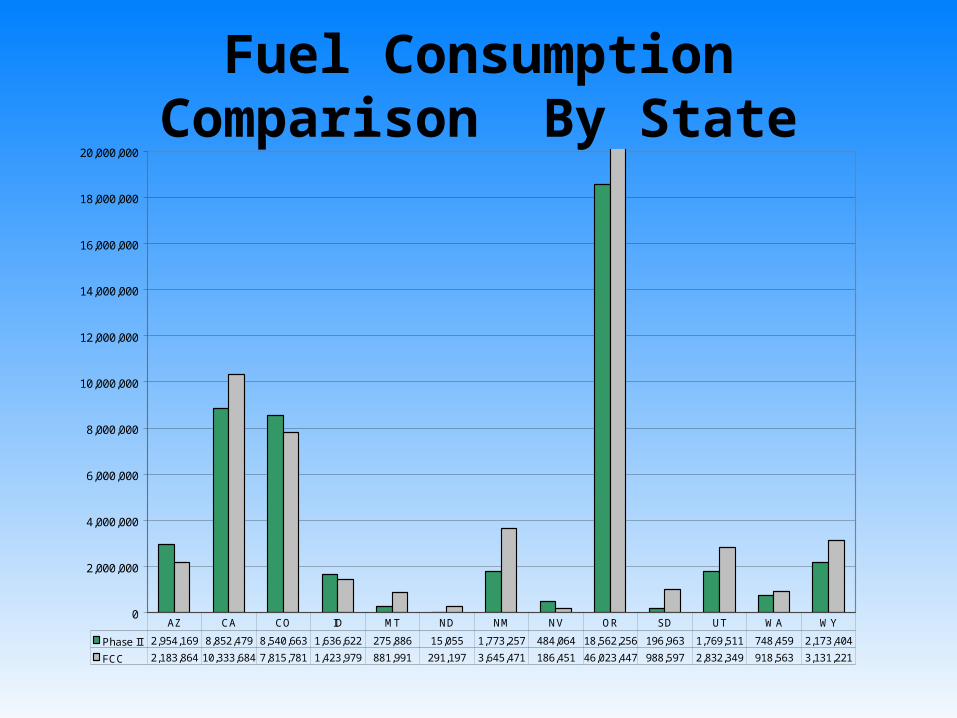
Phase II 2,954,169 8,852,479 8,540,663 1,636,622 275,886 15,055 1,773,257 484,064 18,562,256 196,963 1,769,511 748,459 2,173,404
FCC 2,183,864 10,333,684 7,815,781 1,423,979 881,991 291,197 3,645,471 186,451 46,023,447 988,597 2,832,349 918,563 3,131,221
AZ CA CO ID MT ND NM NV OR SD UT WA WY
Fuel Consumption Comparison By State
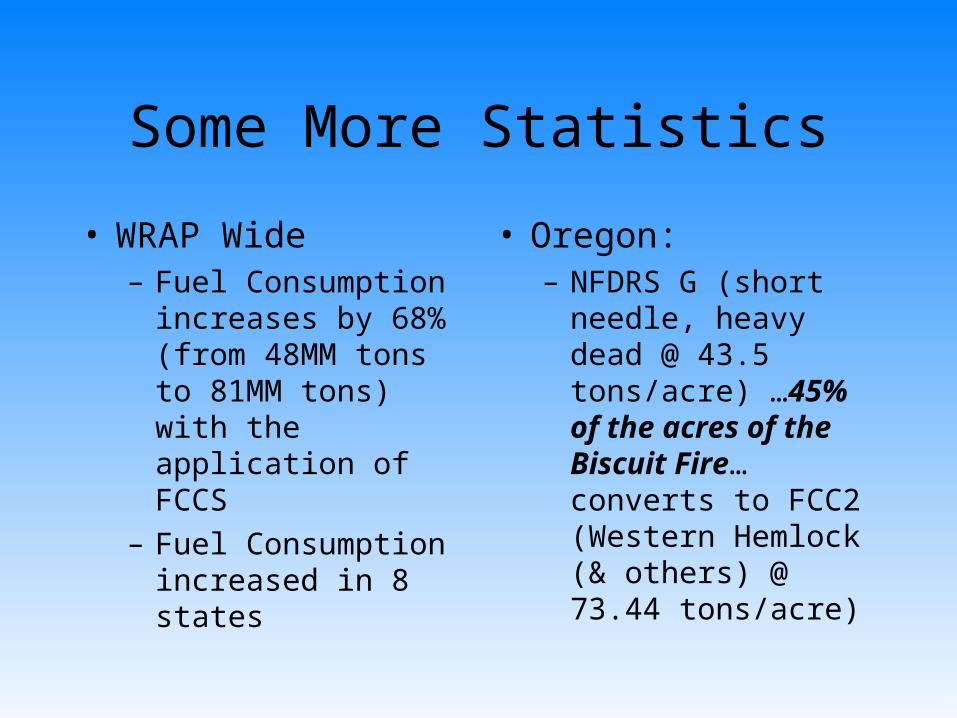
Some More Statistics
• WRAP Wide– Fuel Consumption
increases by 68% (from 48MM tons to 81MM tons) with the application of FCCS
– Fuel Consumption increased in 8 states
• Oregon:– NFDRS G (short
needle, heavy dead @ 43.5 tons/acre) …45% of the acres of the Biscuit Fire… converts to FCC2 (Western Hemlock (& others) @ 73.44 tons/acre)