wrap rpet quality report quality report.pdf · final report improving food grade rpet quality for...
TRANSCRIPT
Final Report
Improving food grade rPET
quality for use in UK packaging
A summary report on the key factors influencing the quality of food grade recycled PET (rPET) and potential methods of addressing the issues constraining the level of use of rPET in UK PET food packaging.
Project code: IMT003-001 Research date: Nov 2011 – March 2012 Date: July 2013

WRAP‟s vision is a world without waste, where resources are used sustainably. We work with businesses, individuals and communities to help them reap the benefits of reducing waste, developing sustainable products and using resources in an efficient way. Find out more at www.wrap.org.uk
Document reference: [e.g. WRAP, 2006, Report Name (WRAP Project TYR009-19. Report prepared by…..Banbury, WRAP]
Written by: Robert Dvorak, Edward Kosior and John Fletcher of Nextek Ltd
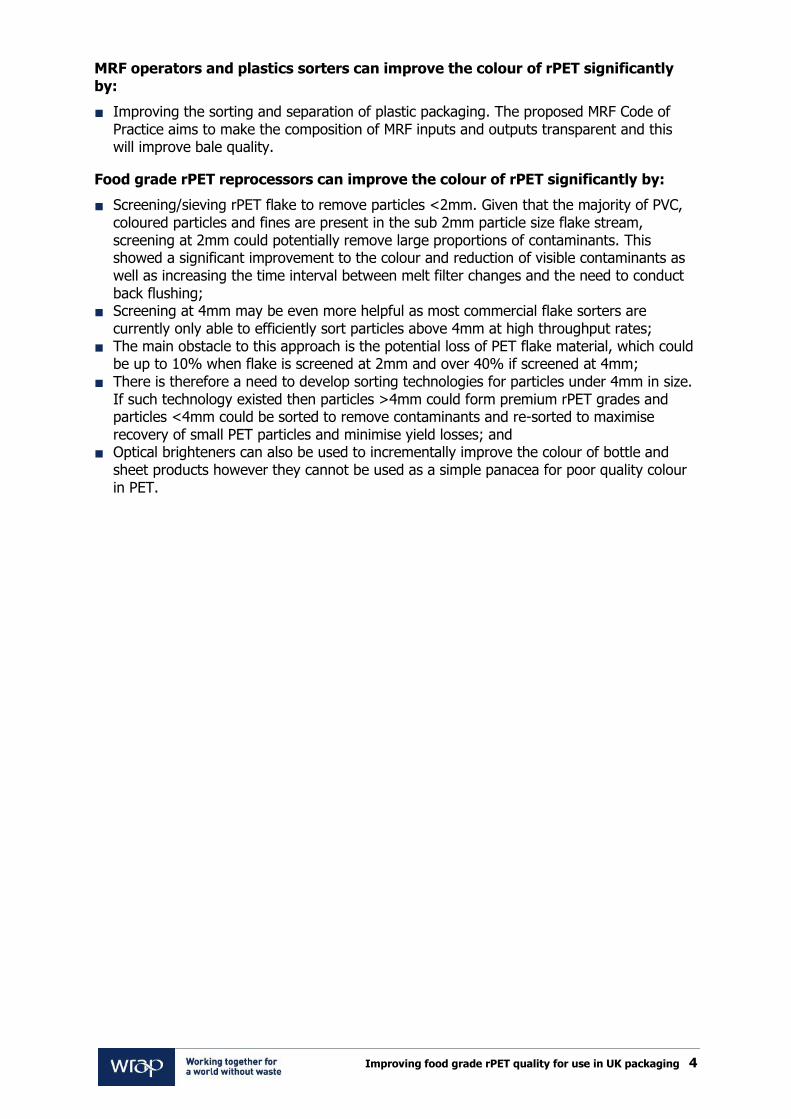
Front cover photography: Washed PET flakes showing coloured particle contamination
While we have tried to make sure this report is accurate, we cannot accept responsibility or be held legally responsible for any loss or damage arising out of or in
connection with this information being inaccurate, incomplete or misleading. This material is copyrighted. You can copy it free of charge as long as the material is
accurate and not used in a misleading context. You must identify the source of the material and acknowledge our copyright. You must not use material to endorse or
suggest we have endorsed a commercial product or service. For more details please see our terms and conditions on our website at www.wrap.org.uk

Improving food grade rPET quality for use in UK packaging 1
Executive summary
Introduction Recycling of PET bottle packaging represents one of the most successful and widespread examples of plastic packaging recycling in the UK, the EU and globally. The growth in collection and reprocessing of PET bottles in the UK has been increasing significantly over the last 10 years and this has been accompanied by significant investment in plastic recovery facilities (PRFs) and food grade recycled PET (rPET) reprocessing. Through engagement with users of rPET in plastic packaging, WRAP has identified that cases of poor rPET quality are limiting the amount rPET that can be used in new food packaging. Often smaller ratios of rPET are being used than the industry would like (around 20-30% in bottles) whereas addition rates of 50% would be possible if quality was acceptable. For thermoformed products (e.g. trays) addition rates are typically up to 50%, however these could also be at levels of up to 75-100% if resin quality was improved. Improvements to the quality of this material would therefore enable more of it to be used in new food packaging to reduce its environmental impact further (for example the use of one tonne of rPET in new drinks bottles saves around 1.5 tonnes of CO2). This would also generate economic benefits by stimulating further demand for rPET which in turn would help to develop more recycling infrastructure in the UK for PET reprocessing. Purpose of this study The purpose of this study was to identify the main factors influencing the quality of rPET being processed in the UK, to identify the root causes and make specific recommendations for the packaging supply chain on actions to improve the quality of food grade rPET. Project methodology The study gained feedback and gathered data on rPET quality from PET reprocessors, rPET bottle and sheet converters as well as key brand owners and retailers that use rPET in packaging applications. Laboratory trials and analysis of material from several reprocessors identified the key areas of concern with regard to materials and processes. Commercial scale trials validated the strategies developed in the laboratory tests to demonstrate successful removal or control of the key contaminants at the reprocessing stage, to produce a higher quality rPET for converters. Factors affecting the quality of rPET The factors affecting the quality of rPET are caused by a combination of packaging design, quality of recovered bottle bales from some Materials Recovery Facilities (MRFs) and reprocessing methods. Converters, retailers and brand owners have all identified the discolouration and colour variability of rPET as the primary quality issue affecting the adoption of rPET into packaging. This is related to many of the contaminants identified by reprocessors and listed below. Variation in rPET colour is also a key concern as it often varies from dark blue/grey to dark brown to yellow/brown. The contaminants listed by the reprocessors were (in order of occurrence from the survey results):
PVC;
Coloured plastics including black plastics, silver and other solid colours used for PET bottles / trays;

Improving food grade rPET quality for use in UK packaging 2
Metals (aluminium cans and metal springs from trigger packs);
Plastic films, bags, carrier bags;
Other non-plastic materials such as paper, glass and silicone;
Other plastics heavier than water (PS, HIPS, ABS); and
Fines, dirt, loose labels; and rubber.
The presence of black specs in rPET is an issue for reprocessors and converters that melt filter PET flake. Reprocessors believe that these are primarily related to PVC residues. Filtration screens often show trapped gas with black specs suggesting the presence of degrading PVC particles. Some black specs could be related to degraded PET fines as well as carbonised paper fibres from paper labels. Reprocessors have reported that they see a lot of metal from PET bottle trigger and pump packs. Non-ferrous metals such as aluminium are also problematic and are consistently present in PET flake due to the presence of aluminium can packaging in plastic bales. Key findings from laboratory trials The project team carried out laboratory trials to simulate the impacts of key PET contaminants on the discolouration of virgin PET. This was done by injection moulding plaques using virgin PET with a range of known levels of contaminants typically found in commercial flake materials. Several trials were also performed with screened rPET flakes (where fines < 2mm in size had been removed) and sieved particles obtained from trials performed at a UK recycler. To measure the discolouration, spectrophotometry was used to measure the resin‟s L (lightness), a (red to green shift), and b (blue to yellow shift) values. The results clearly indicate that PVC discolours PET virgin resin. The b-value of virgin PET deteriorated by more than 40% when clear PVC particles were added at 200 parts per million (ppm). The impact of PVC contamination resulted in yellowing and slight browning of the virgin resin and this was clearly observed in the moulded plaques. Coloured particles have a major impact on the discolouration of rPET as well. The presence of even very low percentages of coloured rPET particles in clear rPET flake will discolour PET. Analysis of coloured particles in rPET flake from a commercial reprocessing plant has shown that coloured particles in the sub 2mm size flake are present at high levels and were measured to be 1.5% of the overall material. Discolouration due to small particles was also a key issue. Studies on flake from a UK recycler have shown that the majority (in this case around 95%) of PVC present in PET flake is under 2mm in size. Removal of particles under 2mm in size therefore facilitates the removal of the majority of PVC contamination. The percentage of coloured particles is also typically significantly higher in the small particle fraction i.e. <4 mm and <2mm. The results from injection moulding trials clearly show that discolouration due to fines increased by a factor of 2.7 when fines were added to virgin PET (at 13% which is the original level of fines in the recycled PET flake) and a factor of 2.1 when fines were added (at 13%) to screened flake. The high b-values clearly indicate that fines are a significant discolouration contributor. The biggest impact was found to be related to the percentage of coloured particles, followed by fines and then PVC. The impact of these contaminants may be more pronounced than the lab trials showed, when they are exposed to longer thermal exposures under commercial processing operations.

Improving food grade rPET quality for use in UK packaging 3
In the UK, reheat PET resins are very popular, as the reheat additives, which are typically dark carbon black based materials, reduce the time for heating of preforms, making the reheat and blow moulding process a lot more energy efficient. However, virgin reheat resins can be optimised for recycling and can be manufactured with additives that are not based on carbon black. These developments could lead to brighter virgin and recycled PET resins, yet retain optimum reheat and blow process efficiencies. Trials were carried out using optical brighteners, additives that can be used to brighten rPET resins. Manufacturers of optical brighteners often use toner additives to shift the yellow appearance towards a blue or grey colour. The results showed that the use of these can improve the colour of bottles manufactured using rPET. Key findings from Commercial scale trials Commercial scale sheet extrusion trials were carried out at sheet manufacturers to measure the impact of screened material which had fines of less than 2mm in size removed from the rPET. The L,a,b values clearly show an improvement in the colour of the sheet product manufactured from flake that was screened. The key improvement was a significant reduction in yellowing as shown by an improved b-value. The lower level of yellowness showed by the lower b-value can be considered to be an important improvement given that the sheet was manufactured with 90% recycled content. There was substantially more than three times the contamination on the filter screen used to process the unscreened flake in comparison to the screened flake. Trials using unscreened material resulted in the ultrafine 40 micron screens becoming clogged rapidly and the filters needed to be flushed almost every 20 minutes with screens showing a build-up of aluminium particles as well as small silicone particles and black specs from PVC particles. Sheet produced from unscreened flake showed visual surface defects such as gels due to fines and silicone particles as well as black specs due to PVC. Results from this trial with screened flake show a significant improvement in terms of increased time taken for back pressure to build up due to lower levels of contamination in the flake. Filter screen back flushing of the ultra-fine 40 micron screens has improved from 20 minutes to 1.25hrs. The results achieved may be able to be improved even further if removal efficiency of sub 2mm particles and fines from the flake used improves from current 50% levels. Solutions and recommendations for industry Much work is needed to improve and maintain rPET quality. While PET thermoforms are recyclable, improvements to the packs need to be made so that they are more compatible with bottle recycling technologies. PVC, metals and contaminants from decorative bottle and thermoform elements continue to present problems, difficulty in removal and design for recyclability needs to be better developed by the entire supply chain. Brands, retailers and packaging converters can improve the colour of rPET significantly by:
Designing bottles and thermoformed PET packaging to assist recycling and reduce contamination. Guidance is available for industry to use, for example the WRAP guidance on PET bottle design: http://www.wrap.org.uk/content/pet-bottle-categorisation-tool
Using virgin resins designed for recycling and reprocessing, i.e. the adoption of fast re-heat virgin resins, which do not contain carbon black and that provide better clarity.
Improving food grade rPET quality for use in UK packaging 4
MRF operators and plastics sorters can improve the colour of rPET significantly by:
Improving the sorting and separation of plastic packaging. The proposed MRF Code of Practice aims to make the composition of MRF inputs and outputs transparent and this will improve bale quality.
Food grade rPET reprocessors can improve the colour of rPET significantly by:
Screening/sieving rPET flake to remove particles <2mm. Given that the majority of PVC, coloured particles and fines are present in the sub 2mm particle size flake stream, screening at 2mm could potentially remove large proportions of contaminants. This showed a significant improvement to the colour and reduction of visible contaminants as well as increasing the time interval between melt filter changes and the need to conduct back flushing;
Screening at 4mm may be even more helpful as most commercial flake sorters are currently only able to efficiently sort particles above 4mm at high throughput rates;
The main obstacle to this approach is the potential loss of PET flake material, which could be up to 10% when flake is screened at 2mm and over 40% if screened at 4mm;
There is therefore a need to develop sorting technologies for particles under 4mm in size. If such technology existed then particles >4mm could form premium rPET grades and particles <4mm could be sorted to remove contaminants and re-sorted to maximise recovery of small PET particles and minimise yield losses; and
Optical brighteners can also be used to incrementally improve the colour of bottle and sheet products however they cannot be used as a simple panacea for poor quality colour in PET.
Improving food grade rPET quality for use in UK packaging 5
Contents
1.0 Introduction and scope of the project .......................................................... 9 2.0 Quality issues related to recovery and collection of PET packaging ........... 11
2.1 Changes in bale composition ..................................................................... 11 2.2 Effect on PET reprocessors ....................................................................... 11 2.3 Effect on converters ................................................................................. 12 2.4 Effect on end users .................................................................................. 12
3.0 Reprocessing of post-consumer PET .......................................................... 13 3.1 Bale quality audits & quality tests performed during reprocessing ................. 13 3.2 Sorting equipment performance audits ....................................................... 13
4.0 Key contaminants impacting rPET quality .................................................. 14 4.1 Impact of PVC contamination .................................................................... 16 4.2 Impact of fines from reprocessing ............................................................. 16 4.3 Impact of metal contamination .................................................................. 16 4.4 Impact of plastics that sink with PET.......................................................... 17 4.5 Impact of coloured particles ...................................................................... 18 4.6 Impact of label adhesives ......................................................................... 19 4.7 Impact of inks from labels and sleeves ....................................................... 20 4.8 Summary of contaminant effects on rPET quality ........................................ 20
5.0 rPET quality standards and testing ............................................................. 22 5.1 Quality testing during PET reprocessing ..................................................... 22 5.2 Testing protocols used by rPET converters ................................................. 22
6.0 Industry protocols for testing rPET flake and pellet quality ....................... 24 7.0 Analysing the effects of contaminants on rPET discolouration ................... 25
7.1 rPET discolouration simulation trials ........................................................... 25 7.1.1 Effects of PVC on rPET discolouration .............................................. 27
7.2 Impact of coloured particles on rPET discolouration .................................... 29 7.3 Impact of particle size and presence of fines on rPET discolouration ............. 32 7.4 Separation of small particles and potential PET material yield loss ................ 35 7.5 Summary of results .................................................................................. 36
8.0 Functional additives for improved rPET colour and clarity ......................... 37 9.0 Large scale trials ........................................................................................ 41
9.1 Anson Packaging sheet extrusion trial using screened flake.......................... 41 9.2 TDX sheet extrusion trial using screened flake ............................................ 43
10.0 Assessing the impacts on rPET quality from thermoformed PET packs ...... 45 10.1 Issues around recyclability of PET trays...................................................... 45 10.2 PET pots tubs & cups ............................................................................... 46
11.0 Conclusions ................................................................................................ 49 12.0 Recommendations ...................................................................................... 52 13.0 References .................................................................................................. 54
Figures Figure 1: An example of metal, glass and acetal plastic components in trigger packs, which will contaminate the PET flakes from the bottle. The PP/PE components will not cause any problems as they will float and be removed in the sink-float separation step, however the metal spring, a glass ball bearing shown in the ring and an acetal plastic plunger will cause contamination problems. ............................................................................................... 17 Figure 2: Example of silicone valves from sports drink PET bottle caps that sink in water and contaminate the PET flake stream. ................................................................................. 17
Improving food grade rPET quality for use in UK packaging 6
Figure 3: Examples of plastics and metals that typically sink with granulated PET flakes and become difficult to remove. ........................................................................................... 18 Figure 4: Example of plastic materials such as ABS, OPS and PVC which are widely present in the recycled streams and will sink and end up cross contaminating PET flake during density separation processes. ........................................................................................ 18 Figure 5: Example of loss of clear PET flakes during flake sorting due to the presence of high levels of opaque coloured PET flakes from small PET bottles. .................................... 19 Figure 6: Example of granulated flakes with labels prior to several air classification and washing steps. ............................................................................................................. 20 Figure 7: Measurement of rPET colour is performed by evaluating the L, a, b values. ....... 25 Figure 8: An example of the Maguire low-pressure dryer used to dry the virgin PET at 150oC for 30-35 minutes. ........................................................................................................ 26 Figure 9: Photos of the injection moulder used during the plaque moulding PET discolouration simulation trials. ...................................................................................... 27 Figure 10: Measured discolouration effect of PVC contamination on the b-value (yellowing) of PET material. ........................................................................................................... 28 Figure 11: Example of the type of discolouration occurring in moulded plaques when virgin PET is mixed with 200ppm of PVC particles. (The top left and bottom left plaques are virgin PET control samples for comparison and all others are plaques moulded with 200ppm PVC) .................................................................................................................................. 29 Figure 12: Example of colour content at a UK reprocessor in flake that is <2mm in size. .. 30 Figure 13: Measured impact of coloured PET particles on the b-value (yellowing) of PET material. ...................................................................................................................... 31 Figure 14: Example of the type of discolouration occurring in moulded plaques when virgin PET is mixed with 1.3% of mixed coloured PET particles. (The top left and bottom left plaques are virgin control samples for comparison) ......................................................... 32 Figure 15: Typical PVC particle distribution in PET flake showing that the majority of PVC particles are less than 2mm in size. ................................................................................ 32 Figure 16: Impact of small particles (particles <2mm) on the b-value (yellowing) of PET resin. .......................................................................................................................... 33 Figure 17: Impact of fines (particles <1mm) on the b-value of virgin PET and screened flake. ........................................................................................................................... 34 Figure 18: Example of the type of discolouration occurring in moulded plaques when virgin PET is mixed with PET and other 13% of plastic fines. (The top left and bottom right plaque are virgin control samples for comparison) ..................................................................... 35 Figure 19: Example of PET flake particle size distribution of a UK PET reprocessor ........... 35 Figure 20: Example of colours of preforms and bottles made with 50% rPET and additions of toners and optical brighteners using flake from UK recycler A. ...................................... 37 Figure 21: rPET materials from different recyclers display different colours. Outer preforms are virgin preforms for comparison, material for the three discoloured preforms on the left are from Recycler A and next two are from Recycler B..................................................... 38 Figure 22: Preforms and bottles made with 50% rPET from Recycler A and mixed with a series of different levels of toners and optical brighteners. ............................................... 38 Figure 23: Preforms and bottles made with 50% rPET from Recycler B and a series of toners and optical brighteners. ...................................................................................... 39 Figure 24: Influence of screening of flake (2mm vs. 75 micron). .................................... 39 Figure 25: Sieving at 2mm or higher can remove substantial impurities. .......................... 40 Figure 26: Results of the colour spectrum of rPET sheet manufactured using screened PET flake. ........................................................................................................................... 42 Figure 27: Sheet extrusion trial using screened flakes (Courtesy of Anson Packaging). ..... 43 Figure 28: Back pressure build up showing that back flushing with screened flake occurs at an average 1.25hrs compared to 20 minutes for unscreened flake. ................................... 44 Figure 29: Examples of typical PET tray packaging in the UK and the variety of labels, lidding films and adhesives used for decorative components. ........................................... 46
Improving food grade rPET quality for use in UK packaging 7
Figure 30: Examples of UK PET tubs and the types of lidding films and label decorations typically used. .............................................................................................................. 47 Figure 31: Example of printed PET cups used for fruit smoothies, beer cups and other take-away drinks. ................................................................................................................ 47 Figure 32: Example of a „recycle friendly‟ APR approved label for PET thermoforms (Source: Avery Dennison). .......................................................................................................... 48
Tables Table 1: Example of typical contaminants and their control measures during reprocessing. 14 Table 2: Blend ratios of contaminants with virgin PET resin. ........................................... 26 Table 3: Measured L,a,b values indicating discolouration impacts of PVC particles. ........... 28 Table 4: Colour content and types of colours found in washed and sorted flake from a UK reprocessor. The flake was sieved and the colour content in the <2mm stream was analysed and measured. ............................................................................................................. 30 Table 5: Measured L,a,b values indicating discolouration impacts of coloured particles. ..... 31 Table 6: Measured L,a,b values indicating discolouration impacts of small particles (<2mm) separated from standard hot-washed sorted PET flake from a UK recycler. ........................ 33 Table 7: Measured L,a,b values indicating discolouration impacts when fines (<1mm) were added to virgin PET resin and screened PET flake. .......................................................... 34 Table 8: Summary of measured L,a,b values from key contaminants and their impacts on PET discolouration. ....................................................................................................... 36 Table 9: L,a,b values obtained from sheet samples manufactured with screened and unscreened flake. ......................................................................................................... 41
Glossary of Terms
APR Association of Plastic Recyclers is a North American organisation Chain scission The breaking of a molecular bond causing the loss of a side group or
shortening of the overall chain. DSC Differential scanning calorimetry is a thermal analytical technique in
which the difference in the amount of heat required to increase the temperature of a sample is measured. DSC is widely used for examining polymers to check their composition, melting points and glass transition temperatures for polymers and the method can also show possible polymer degradation as well as the percentage crystallinity of a polymer.
EFSA European Food Safety Authority EPBP European PET Bottle Platform EPRO European Plastic Recycling Organisations EuPR European Plastic Recyclers Food Contact Polymer or Packaging Gels
That which has been used in contact with food or has been tested and approved for use in contact with foods in compliance with the requirements of EU Regulation 10/2011. Small transparent, non-melting inclusions in the polymer.
GCMS Gas chromatography–mass spectrometry (GC-MS) is an analytical method that combines gas-liquid chromatography and mass spectrometry to identify different substances within a test sample.
GCFID A gas chromatography system with a flame ionization detector, which detects analytes by measuring an electrical current generated by electrons from burning carbon particles in the sample.
HDPE High-density polyethylene MFR or MFI Melt Flow Rate or Melt Flow Index; a rheological test method providing

Improving food grade rPET quality for use in UK packaging 8
an assessment of ease of flow within subsequent melt processing equipment. Also an indicator of molecular weight.
NIR Near infrared OPP Oriented polypropylene OPS Oriented polystyrene PCR Post-consumer recyclate PET Polyethylene terephthalate PETG Polyethylene Terephtalate Glycol, PETG or PET-G is a modified PET
copolymer which has had its crystallinity modified through addition of a modifier such as isophthalic acid, resulting in lower melting temperature and a clear amorphous resin that can be injection moulded or sheet extruded.
PP Polypropylene ppm Parts per million ppb Parts per billion PVC Polyvinyl chloride Residence time Time spent under specific processing or decontaminating conditions. rHDPE Recycled high density polyethylene rPET Recycled polyethylene terephthalate rPP Recycled polypropylene
Acknowledgements
WRAP and Nextek Limited would like to thank the many project participants for valuable feedback on the state of rPET resin quality in the UK. The feedback obtained from reprocessors, converters and end-users such as retailers and brand owners was extremely useful and we appreciate the time and effort these organisations have put into providing the necessary information. Nextek would also like to thank a number of organisations that expressed an interest in R&D trials and provided technical advice and expertise and helped to ensure that the project was completed efficiently and on time. Nextek would like to acknowledge the support and help of its project partner LRS Consultancy, for performing most of the survey interviews with UK based reprocessors and converters and summarising the key data on PET quality from these interviews. In particular special thanks to Hugh Smith and Gianluca Forlani for their perseverance in data gathering, report review and time spent on completing this project.

Improving food grade rPET quality for use in UK packaging 9
1.0 Introduction and scope of the project
There has been significant growth in the recycling of PET bottle packaging over the last 10 years and the use of recycled PET (rPET) in new food packaging to reduce the carbon impact of PET packaging. However through engagement with users of food grade rPET, WRAP has identified that in some cases the quality of rPET material is limiting the amount that can be used in food and beverage packaging. Therefore the purpose of this project was to identify and assess the key contamination elements that impact the quality of food grade rPET in the UK, determine how they restrict the use of rPET in food packaging and to identify remedies. This project built on the issues highlighted by WRAP‟s original engagement. The objectives of this project included:
Understanding the extent to which quality issues with final rPET food grade material are limiting its use in new food grade packaging, such as drinks bottles and other rigid PET packaging put onto the UK market;
Indicating the relative importance and contribution of key elements of quality for the final food grade rPET material. These elements included the impact of coloured PET particles, black specs, PVC contamination and metal contamination;
Identifying the root cause(s) of each element and impacts on packaging and the recycling process; and
Recommending actions to address each root cause.
The project methodology consisted of the following:
Telephone and face-to-face interviews with the majority of UK PET reprocessors, rPET bottle and sheet converters as well as key brand owners and retailers that use rPET in packaging applications, to:
o identify the levels and incidence of key contaminants in rPET that have a large impact on quality in packaging applications;
o understand the range of separation and washing processes used by reprocessors, and highlight any deficiencies;
o identify audit and testing procedures and measures used by reprocessors and converters relating to rPET quality, and highlight any deficiencies; and
o ascertain the primary concerns of converters, brand owners and retailers and how issues regarding rPET quality currently affect finished packaging products and limit the percentage of rPET that they can use.
Laboratory testing with material from recycling partners to:
o identify and quantify the key contaminants that have the greatest influence on reducing rPET quality and causing other rPET related problems;
o map out the root causes of contamination in terms of materials and processes used, with particular reference to the issues identified through the recycler and converter surveys; and
o develop strategies to significantly reduce the influence of identified contaminants, involving improved materials handling, processing or technologies.
Commercial trials to test and validate the above strategies, so demonstrating:
o successful removal of the key contaminants at the recycling stage, to produce higher quality rPET for converters; and
o the benefits of converters using a higher proportion of this better quality rPET in their processes, compared to existing rPET feedstock.

Improving food grade rPET quality for use in UK packaging 10
Developing specific recommendations for the industry around methods and techniques to improve rPET quality.
Conducting laboratory work with material from recycling partners, to identify their key concerns with regard to materials and processes, including quantifying the level of contaminants, optimised processing and moulding of plaques with defined levels of contaminants to simulate the effect of the contaminant on rPET resin quality; and
Mapping out what are considered the root causes that lead to a reduction in rPET quality and other rPET related problems, with a particular focus on reducing the impact of key elements identified.
Improving food grade rPET quality for use in UK packaging 11
2.0 Quality issues related to recovery and collection of PET packaging
This section summarises the key findings on rPET quality from surveys with UK PET reprocessors, converters and end users such as retailers and brand owners. Feedback was also obtained from a large EU based recycler that has processed UK plastic bale feed stocks. The comments from reprocessors were from the perspective of reprocessing clear rPET to produce a food grade material and it is important to note that reprocessors are not a homogenous group and different reprocessors are geared up to handle different types of feedstocks. For example, one facility may be able to sort mixed plastics (e.g. pots, tubs and trays) whereas another may be dedicated to bottle-only processing and may view mixed plastics as a contaminant. 2.1 Changes in bale composition PET reprocessors identified an overall shift from mixed bottle bales to mixed plastic bales (including pots, tubs and trays) from UK sources over the past three years, resulting in a reduction of PET content of bales. Bottle bales used to contain 85-90% bottles, but now most deliveries (>90%) of bales have poor quality with up to 30-40% contamination and the perception is that it is getting worse from a PET perspective. They also observed that more PET was mixed with other materials in the products in their feedstock. Examples included multi-layer blister packs, trigger packs and a variety of thermoforms. They acknowledged that some steps had been taken to reduce the mixing of PET with other materials, such as substituting PVC sleeves and aluminium caps, but felt that significant challenges remained. PRFs are typically designed with particular infeed materials in mind and variation in feedstock compositions results in yield losses and increased levels of contamination as the equipment may not be set-up in an optimum manner to deal with mixed compositions. 2.2 Effect on PET reprocessors A key issue is that virgin PET resins in the UK are primarily fast re-heat resins, which are already dark and contain small levels of carbon black. Feedback from a number of reprocessors suggests that virgin PET resin used for bottles in Europe has better clarity and results in better clarity of flake and rPET pellets. PET reprocessors said that the poorer quality bales are presenting a significant challenge for them. Despite often having various arrangements for quality testing and carefully assessing suppliers, all of them were finding problems directly related to increasing levels of contaminants in bales resulting in contamination impacts on flake and/or pellet that they produced. Key contaminants impacting on rPET quality are discussed in section 4.0. Some reprocessors highlighted how their processes were struggling to keep up with the changes in bale composition. Those designed to process mixed bottles-only were experiencing difficulties in separating PET from mixed plastics bales (consisting of bottles and pots, tubs, and trays) whereas the more modern facilities which were designed to cope with mixed plastic in-feed, were better able to handle a wider range of plastics. The consequence of this for some PET reprocessors has been a significant reduction in yields of PET. It was suggested that at least 20% of PRF throughput has no value. Some reprocessors claim that their PET yields from PET material input are now as low as 40-50%. In order to improve yields and PET material purity, further investments in sorting will be required at MRFs and PRFs to handle the increase in mixed plastics required in order to meet UK plastic packaging recycling targets. The MRF Code of Practice will also help to deliver

Improving food grade rPET quality for use in UK packaging 12
greater transparency around the composition of baled plastics and drive improvements in quality. This will enable reprocessors to target the feedstocks that are most suitable for their operations. 2.3 Effect on converters PET converters and end users generally felt that the quality of flake and pellet has improved over the last three years. They felt that this was because of continued investment in sorting equipment and general improvements in sorting at PRFs. PET converters' opinions varied widely on the current quality of rPET flake and pellets – rating this from poor to excellent. It was felt that rPET quality varies much more widely than the quality of virgin PET. Converters wanted more consistency across suppliers. Some suggested that industry standards could help achieve this. Converters felt that there are particular challenges with the quality of flake, whereas pellets are generally of a good to excellent quality. Flake suffers greater contamination problems because it is often produced by PRFs that are designed for bottle recycling that are now taking more mixed plastics. Converters do not have common standards for rPET pellet or flake quality, and have to make individual arrangements with reprocessors. Converters with good quality rPET suppliers have few rejects. Some converters have experienced up to 5% production losses due to poor quality rPET. Overall all the converters have said that the quality of rPET has improved in the UK and some use 100% rPET in specific products where colour is not an issue, but overall, improvements are still needed. See section 4.0 for further discussion of the contaminants that affect quality in flake and pellets. 2.4 Effect on end users End users were using smaller ratios of rPET – around 20-30% in bottles whereas they would prefer to use addition rates of 50% if quality was acceptable. For thermoformed products addition rates are typically up to 50%, however these could also be higher and be at levels of up to 75-100% if resin quality was improved. Product manufacturers, retailers and brand owners were reluctant to increase rPET levels because of discolouration issues and concerns over the sustainability of supply of rPET. Retailers and brand owners felt that darker looking products resulting from higher levels of UK-sourced rPET content would not appeal to their customers. However the UK retailer interviewed did not find that levels of rejects increased when using rPET to manufacture PET bottle or thermoformed packaging when compared to 100% virgin PET. rPET discolouration was identified as the main limiting factor for greater usage and the issue of colour variation was also of major concern.
Improving food grade rPET quality for use in UK packaging 13
3.0 Reprocessing of post-consumer PET
Plants originally designed for reprocessing of mixed bottle packaging-only are now finding it difficult to produce good quality rPET material for converters. Plants that have been designed and built more recently and have extensive sorting and re-sorting capabilities are better able to remove contaminants and improve recovery of PET bottle packaging.
3.1 Bale quality audits & quality tests performed during reprocessing All reprocessors reported that they perform visual bale checks. In instances where bales are clearly heavily contaminated, they are isolated and sent back to the suppliers (MRFs) and while this situation is not common it does occur. Non-bottle plastics, cardboard and metal are normally the most visible contaminants. Reprocessors find they need to pay significantly more attention to the quality of bales from new suppliers and suppliers known for poor quality bales as composition standards can vary from delivery to delivery. Small sample testing is commonly performed on most bales, and typically includes analysing approximately 6-8kg from each bale and photographing the presence of contaminants. While helpful in terms of understanding the presence of likely contaminants in the bales, it is very time consuming and costly. This level of testing suggests that there is a lack of standards for plastic bale compositions in the UK. It is common for all reprocessors in the UK as well as in Europe to perform a daily material mass balance to determine PET yields and losses related to contamination. In particular, this needs to be performed specifically with suppliers known for poor quality bales. Some reprocessors reported that they perform mass balance tests and extensive quality checks every 4-6 hours to maintain product quality and be aware of any potential problems. Serious non-conformance is reported and heavily contaminated bales are sent back to suppliers. 3.2 Sorting equipment performance audits All reprocessors regularly check and test the performance of key recycling equipment systems. Particular attention is paid to sorting systems, to ensure that sorting accuracy and product purity is maintained at high levels. The audits are performed by determining the level of contamination after a specific sorting/separation step and identifying remaining contaminants in sorted streams. Sorting and early removal of contaminants are the primary steps to ensuring material purity. All reprocessors continuously monitor and maintain the required running conditions of hot washing and decontamination extrusion systems.
Improving food grade rPET quality for use in UK packaging 14
4.0 Key contaminants impacting rPET quality
The key contaminants identified during the surveys are described in this section and also include explanations of the specific impacts that these contaminants have on rPET quality. Recycled PET is affected by contaminants from poorly designed PET bottles and thermoforms as well as materials that are difficult to separate from many other types of packaging products that end up in the commingled packaging waste stream. The following is a list of key contaminants listed by the reprocessors (in order of occurrence from the survey results):
PVC;
Other non-bottle plastics including black plastics;
Silver and other solid colours used for PET bottles/trays;
Metals (aluminium cans and metal springs from trigger packs);
Plastic films, bags, carrier bags;
Paper;
Glass;
Silicone;
Other plastics heavier than water (PS, HIPS, ABS);
Fines, dirt, loose labels;
Rubber.
Table 1: Example of typical contaminants and their control measures during reprocessing.
Factor Control Limits
Input bottle quality Bottle sorting >30 mm
Dust, wood, glass, inorganics Bottle sieving / washing <30 mm
Bottle colour Colour sorting >30 mm
Multi-layer nylon Air classification when delaminated <3 mm
Sleeves – PVC, PS, PETG, PET, etc
Sort as bottles and flake / Air classification when granulated with bottles
>2 mm
Metals – closures, cans, springs
Metal detectors / melt filter > 0.5 mm
Rubber, silicone rubber Colour Sort, Raman Spectroscopy >2 mm
Oxygen scavenger and dispersed nylon additives
Raman Spectroscopy >2 mm
Adhesives Wash settings & chemicals Temperature and friction
The limits in Table 1 refer to the size of items that can be readily sorted by the equipment that is usually used to remove the contaminants. The table shows that the limit for most contaminants is 2 mm and it is difficult to selectively remove contaminants smaller than that size. Therefore sieving at 2 mm could be a useful strategy in removing a range of contaminants. The down side of this approach is the loss of yield of PET if this PET is not redirected into other products. Of these contaminants, reprocessors find PVC, metal springs, aluminium, labels, adhesives and silicone from caps the most difficult to remove during reprocessing. When asked to rank contaminants by severity and occurrence, the following contaminants were identified: PVC contamination causes black specs in rPET, discolouration and a drop in the intrinsic
Improving food grade rPET quality for use in UK packaging 15
viscosity of rPET. Black Specs are found in almost all recycled PET resins. Although rPET resins are melt filtered down to very fine levels (50-100 micron) degraded particles from burnt paper label fibers or degraded PVC black specs that further disintegrate and contaminate rPET resins are a real issue for converters and end users. Black specs are the end result of poorly chosen components such as paper labels or PVC thermoforms and shrink sleeves. Coloured PET/other Coloured Plastics cause discolouration of extruded recycled PET resins. The level of discolouration is typically related to the colour types and the levels of coloured contaminants present. Coloured particles can come from coloured packaging but also from components such as PET shrink sleeves, which will be identified as PET and will in many cases contaminate clear PET flakes. Whilst better than PVC/OPS shrink sleeves, coloured PET sleeves will cause discolouration as they are often heavily printed and the ink will discolour and contaminate the rPET during melt reprocessing (extrusion). Metal contaminants typically from springs in trigger packs or metal closures. These can cause serious problems if they get past a filtration system and can result in product recalls or packaging products being put on-hold and re-sorted. For reprocessors and converters who extrude PET flake, the presence of metal particles also causes filter screen packs to become blocked and this results in significant material losses due to extra filter flushing. Metal components need to be avoided in plastic packaging. Aluminium contaminants found in rPET come from two sources, namely aluminium foils or residual particles from aluminium cans. Aluminium contaminants are usually removed when melt-filtered, however if they get past a filter screen they are seen as serious contaminants that result in products being put on hold or recalled. Aluminium components in PET packaging need to be avoided. Silicone contamination has increased due to the popularity of leak resistant silicone valves and also silicone valves in sport drink caps. Silicone valves cause gels and defects in products made from rPET that contain silicone contaminants. Silicone valves should be foamed or have a density less than 1gm/cm3 or be designed in such a way that once a cap is granulated the silicone floats and is removed with the polyolefinic cap material. Adhesive contamination results in yellowing of recycled PET. Certain adhesives can also cause the formation of gels and haziness within the rPET resin and products. PETG is often mistaken as PET. However PETG has greater melt strength than PET and is often used for wide mouth jars and can cause gels and other processing problems. PS/OPS/HIPS particles will cause problems for rPET resin during reprocessing and cross contamination with PS/HIPS will often result in bottle defects. Many PET bottle designers still use OPS for sleeves or for labels on PET bottles. Labels or sleeves should be made from polyolefinic materials such as OPP labels or PE based stretch sleeves with inks that do not run in hot wash systems. PLA contamination is relatively new in the PET industry, but is a potential threat. PLA particles present in PET flake are difficult to identify and remove and when extruded together as the two materials cool they will phase separate due to their different glass transition temperatures. This could potentially cause problems during solid stating, as the granules with PLA contamination could become tacky and stick to surrounding PET pellets which would result in the formation of clusters. When rPET is processed into bottles any presence of PLA contamination will cause haziness due to induced crystallinity. There are a

Improving food grade rPET quality for use in UK packaging 16
few PLA bottles present in the EU/UK bottle market, however PLA is becoming popular in the thermoform packaging sector and the increasing recovery of thermoformed packaging will mean higher levels of PLA in PET. PLA labels have now also entered the marketplace and these will also cause problems for PET bottle recycling if they aren‟t effectively removed by air classification systems. PLA labels or sleeves should be avoided for use with PET bottle or thermoform packaging. 4.1 Impact of PVC contamination Contamination from PVC thermoforms and shrink sleeves was identified as the most difficult form of contamination to remove or eliminate from PET flakes. PVC bottles are easier to remove and sort by NIR sorting systems as they have thicker wall sections than thin-wall PVC thermoforms. Sorting of PET bottles with PVC shrink sleeves has two impacts, (i) loss of good PET bottles if sorted into a PVC or coloured bottle stream, and (ii) discolouration and degradation of rPET from coloured PVC sleeves. PVC particles sink together with PET in wash and sink-float tanks and in general are difficult to eliminate or reduce to very low levels. Larger PVC particles (>4mm) can be efficiently removed with NIR flake sorters however small size flakes are difficult to identify and remove and for this reason most of the PVC contamination found in PET flake is that of small sized PVC particles, typically 1-2mm and finer. PVC degrades at the temperatures that PET is processed and it produces hydrochloric acid gas, which is corrosive and attacks PET polymer chains causing chain scission and degradation as well as corroding processing equipment. Small amounts of PVC can significantly reduce the intrinsic viscosity of rPET. Due to the degradation caused by PVC, rPET resins become discoloured to unacceptable yellow or dark brown colours and the dechlorinated PVC becomes brittle and creates black specs within the rPET resin. 4.2 Impact of fines from reprocessing Fines from PET and other materials cause problems due to a number of factors, including:
PET fines have a much larger surface area and will oxidise much faster during drying and discolour during extrusion;
Presence of other materials and small particle contaminants leads to discolouration and degradation of rPET resin;
Fines build-up in flake sorting systems and cause inefficiencies;
Degraded PET powder can become a non-melting particle and will quickly clog melt filters and create black degraded deposits;
Due to static, fines will often build-up on reprocessing equipment such as dryers, in pipes and degrade into building blocks such as ethylene glycol (EG). When these materials end up in extruders or when PET flakes are coated with EG this further degrades PET during extrusion; and
Current screening and sieving systems are not yet able to achieve complete removal of fines and dust from PET flake, with typical fines removal rates averaging around 50%. Better removal of fines and PET contaminants would significantly improve quality of flake because of a more complete removal of contaminants.
4.3 Impact of metal contamination Metals are found in plastic packaging items such as trigger packs and pump packs. Metals are used for springs and ball bearings in these devices and are extremely problematic for recycling plants as they are difficult to remove using metal detectors. Metals will typically sink and end up mixed with PET flakes. When extruded they can damage and block filter screen packs. Packs that use metals should be redesigned and be replaced with other plastics, which are recycle friendly and do not contaminate the PET recyclate.

Improving food grade rPET quality for use in UK packaging 17
Figure 1: An example of metal, glass and acetal plastic components in trigger packs, which will contaminate the PET flakes from the bottle. The PP/PE components will not cause any problems as they will float and be removed in the sink-float separation step, however the metal spring, a glass ball bearing shown in the ring and an acetal plastic plunger will cause contamination problems.
4.4 Impact of plastics that sink with PET A variety of plastics and components present in plastic packaging that have a density greater than water (>1gm/cm3) will typically end up with PET flakes unless they have been tested according to www.petbottleplatform.eu/technical.php and proven to be relatively easy to remove and separate.
Figure 2: Example of silicone valves from sports drink PET bottle caps that sink in water and contaminate the PET flake stream.
a) PP cap, rubber seal and silicone valve b) Cap and rubber seal float while silicone
valve sinks
Improving food grade rPET quality for use in UK packaging 18
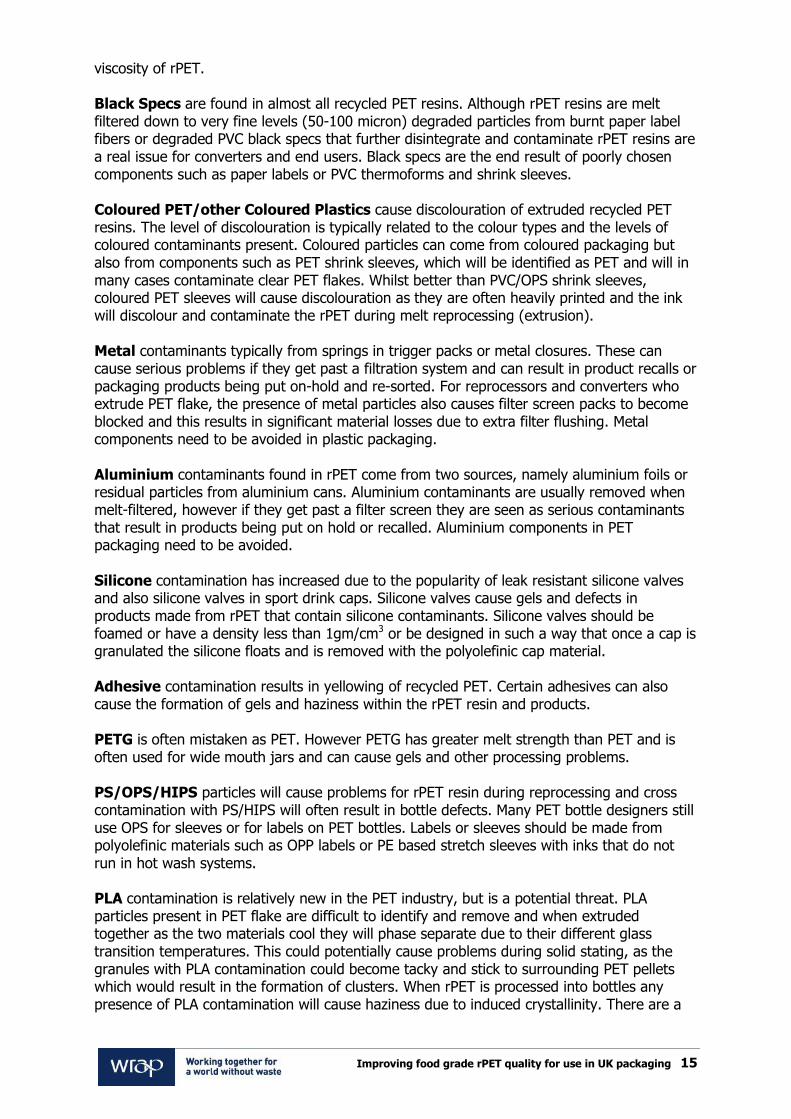
Figure 3: Examples of plastics and metals that typically sink with granulated PET flakes and become difficult to remove.
Trigger packs contain metal spring and ball bearings as well as a variety of plastics such as Nylon, Glass fibre filled PP, Acetal
Silicone rubber in sports cap (clear silicone rubber is difficult to separate from PET, unless it floats)
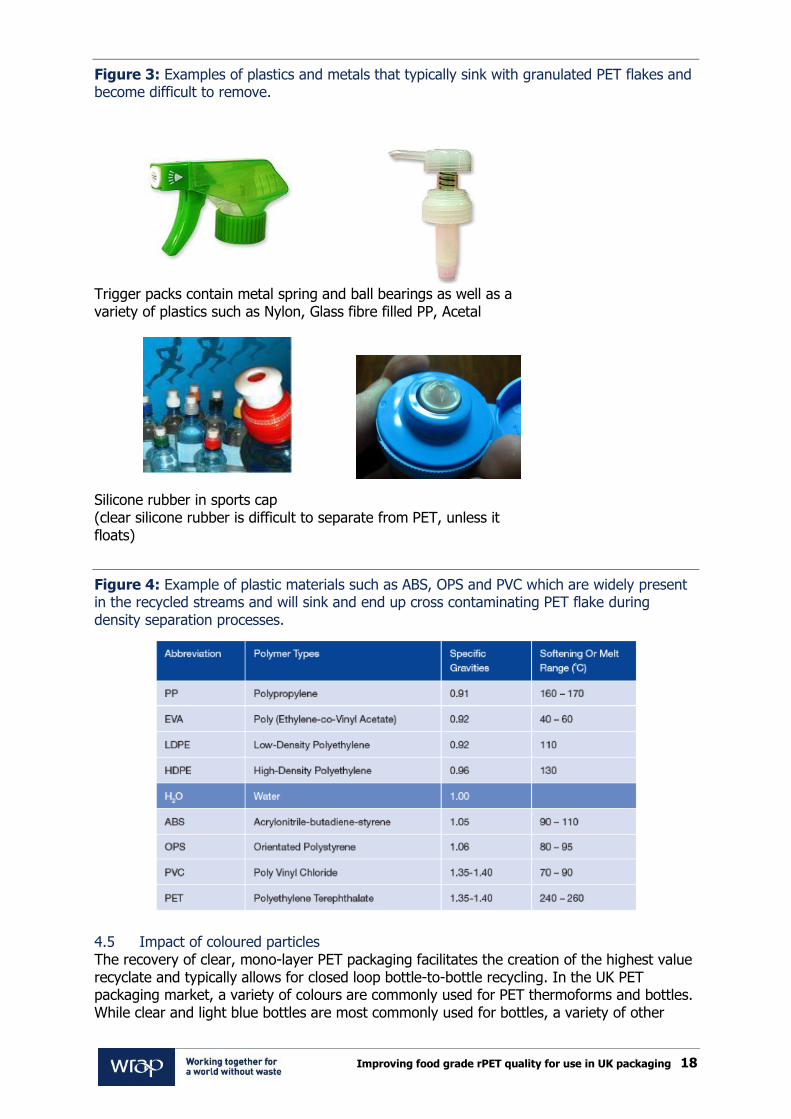
Figure 4: Example of plastic materials such as ABS, OPS and PVC which are widely present in the recycled streams and will sink and end up cross contaminating PET flake during density separation processes.
4.5 Impact of coloured particles The recovery of clear, mono-layer PET packaging facilitates the creation of the highest value recyclate and typically allows for closed loop bottle-to-bottle recycling. In the UK PET packaging market, a variety of colours are commonly used for PET thermoforms and bottles. While clear and light blue bottles are most commonly used for bottles, a variety of other

Improving food grade rPET quality for use in UK packaging 19
colours is also utilised in bottles and thermoforms. Coloured bottles and thermoforms will typically be colour sorted and separated from clear and light blue bottles. However the use of colourants should be minimised as much as possible by PET packaging designers. Translucent tints that are very light shades of blue or green are acceptable, as these colours alter the colour of recycled PET in a minor way and help to offset any yellowing that may occur during the recycling process. Strong tints for example mid to dark-blue, green, brown and blacks should be avoided whenever possible. Tints cause fewer discolouration issues than opaque colours as they can become dispersed and do not cause haziness in recycled PET as opaque colours do. Black and metallic colours for PET packaging should be avoided where possible. Black coloured plastics are difficult to sort unless the black colorant is NIR detectable. Research shows that the presence of even very small amounts of black or dark brown PET flakes can significantly discolour a stream of clear / light blue PET recyclate. Key considerations include:
Recovered coloured PET packaging has lower monetary value than clear (typically 50% lower);
The use of strongly pigmented bottles (black, white and opaque colours) has a significant negative impact on the quality of recycled PET since presence of small amounts of coloured fragments discolour recycled PET during extrusion;
Small coloured particles are difficult to remove with current flake sorting systems; and
The presence of coloured PET also increases the losses of clear/light blue PET during flake sorting as for every coloured PET flake removed, one or two clear PET flakes are typically lost with it.
Figure 5: Example of loss of clear PET flakes during flake sorting due to the presence of high levels of opaque coloured PET flakes from small PET bottles.
4.6 Impact of label adhesives The amount of adhesive and surface coverage should always be minimised to reduce contamination and discolouration of rPET during recycling. While the majority of bottle labels are now made from OPP and use water-soluble or alkali soluble adhesives that are acceptable for recycling and are readily removed during reprocessing, many PET thermoforms use labels and adhesives that are difficult to remove. Adhesives that cannot be

Improving food grade rPET quality for use in UK packaging 20
removed remain coated to the flakes and will typically embed undesirable contaminants. Adhesives used for labels on PET bottle and thermoform packaging should be designed to release at wash temperatures of 60-80°C to ensure removal of labels during recycling. The use of thermoset polyurethane adhesives in PET packaging is particularly problematic.
4.7 Impact of inks from labels and sleeves The presence of printed label and sleeve fragments in PET flakes can result in discolouration due to the inks and the different polymers typically used for labels and sleeves.
Figure 6: Example of granulated flakes with labels prior to several air classification and washing steps.
Air classification and hot wash systems need to be highly efficient to ensure that the majority of labels and sleeves are removed from flakes. Residual labels and sleeves that remain with PET flake will discolour rPET resins due to the presence of inks. For these reasons it is important that sleeves and labels are designed to be readily removable from PET bottle and thermoform packaging and for labels and sleeves to be removed from bottles and thermoforms at an early stage of PET recycling. Inks on labels and sleeves, which are not easily removed or water soluble, need to be specified and selected for all PET packaging. Loss of colour from labels and sleeves can significantly discolour wash water and residual inks in wash water can later re-coat the flake surface and adhere to flakes with attached label adhesives as well as requiring more frequent water changes. 4.8 Summary of contaminant effects on rPET quality Discolouration of rPET has been identified as the primary quality issue and is related to many of the contaminants discussed. Reprocessors, converters and end-users all face the problems related to dark rPET colour, which limits its usage in many packaging applications. Variation in rPET colour is also a key concern as rPET colour often varies from dark blue/grey to dark brown to yellow/brown. The presence of black specs in rPET is an issue for reprocessors and converters that melt filter PET flake. Reprocessors believe that these are primarily related to PVC residues. Filtration screens often show trapped gas with black specs suggesting the presence of degrading PVC particles. Some black specs could be related to degraded PET fines as well as carbonised paper fibres from paper labels. Reprocessors have reported that they see a lot of metal from PET bottle trigger and pump packs. Non-ferrous metals such as aluminium are also problematic and are consistently present in PET flake due to the presence of aluminium can packaging in plastic bales.

Improving food grade rPET quality for use in UK packaging 21
Reprocessors have suggested that redesign of trigger and pump packs and separate collection of metal packaging products would help.

Improving food grade rPET quality for use in UK packaging 22
5.0 rPET quality standards and testing 5.1 Quality testing during PET reprocessing Reprocessors perform a number of physical tests to measure the levels of contaminants as well as analytical tests to measure the physical properties of rPET and compliance with food regulations. PET material quality and physical property testing includes:
Manual lab sort of production samples with visual identification for metal, coloured particles, polyolefinic labels and flakes with visible residual adhesives. These tests result in measured levels of contaminants in flake and are typically measured in ppm;
Oven tests for PVC and adhesive, some are considering using solvents to measure adhesive levels in the future;
Colour tests (L, a, b values);
IV tests;
Some perform GC MS and GC FID tests for headspace and migration testing internally, while others do so externally, but have plans to purchase testing equipment and perform food contact safety tests internally;
Some reprocessors perform audits on equipment such as metal detectors / optical sorters;
No standards on testing performance of equipment or audits performed during reprocessing, - equipment is generally only tested if it appears to be underperforming;
Test protocols exist for testing of flake quality or measurements of specific contaminants as developed by APR or EPBP;
None of the recyclers were planning to purchase or install automated NIR laboratory testing units to determine contaminant levels. They will either continue with manual inspections or keep investing in sorting equipment;
Based on feedback obtained it appears that PVC levels, aluminium/metal levels and adhesive and label levels are regularly measured to be the highest; and
Most reprocessors agreed that additional sorting (flake sorting in particular) and pre-cleaning early on in the process would help to further improve quality of rPET flake. PRFs that were designed with mixed plastic infeed in mind have more pre-cleaning steps and sorting equipment units while other PRFs that were designed to only deal with bottle infeed in general do not have as many pre-cleaning and sorting units. Equipment such as large trommels, disc screens and ballistic separators with correct screen sizing is needed at all PRFs to properly pre-clean PET packaging.
5.2 Testing protocols used by rPET converters Converters individually agree specifications on levels of acceptable contamination with rPET reprocessors. Most converters use UK sourced materials where possible; some also use European materials, which are often better quality but converters have commented that they are committed to UK rPET. Key quality and processing issues for converters:
Most now receive rPET with a letter of conformity;
Visual checks on pellets and flake;
Bulk density tests, flake is becoming lighter due to light-weighting which is resulting in problems in feeding of flake into drying and extrusion systems;
rPET pellet was preferred but more costly and had extra heat history creating a darker colouration;
Some perform moisture tests, DSC and IV tests;
Colour of produced preforms, bottles and sheet/thermoforms is tested;
If flake is used such as in most sheet extrusion operations then filtration is performed anywhere from 40 micron to 100 micron;

Improving food grade rPET quality for use in UK packaging 23
Key contaminants include metals, black specs from carbonised PVC and adhesive / gel formation on screens;
Ongoing issues with black specs;
Changes in colour of rPET can be a real problem for bottle blowers in particular;
Testing is the same as for virgin resin products, colour, technical and physical properties and food contact tests (often performed externally) – most have internal standards for specific products and the tests are performed against these standards;
Most converters experience approximately 2-5% losses when using rPET, this is mainly due to screens becoming blocked with metal, black specs and gels;
For converters that do very fine filtration (40-60 micron) the losses in material can be as high as £5k/month, but the result of ultra-fine filtration is clean pellets with only very fine residual fines and black specs; and
For all the converters, colour is the main obstacle to achieving higher levels of recycled content in their products. Dark rPET colour is also what their customers (brand owners and retailers) most complain about.

Improving food grade rPET quality for use in UK packaging 24
6.0 Industry protocols for testing rPET flake and pellet quality
The survey feedback from both reprocessors and converters suggested that industry protocols or guidelines from organisations such as EPBP or APR are not widely used, or perhaps not as well known as would be expected. The development of best practise guidelines for PET recycling and achieving best possible rPET quality by following leading industry benchmarks and testing standards may be beneficial for the industry overall and should be considered. These developments could be performed together with key European organisations such as EuPR, EPRO, EPBP and Petcore.

Improving food grade rPET quality for use in UK packaging 25
7.0 Analysing the effects of contaminants on rPET discolouration
Recycled PET has classically been more yellow or brown when compared to virgin PET. The factors that cause discolouration of rPET include:
Presence of PVC particles;
Coloured particles from PET and other polymers;
Adhesive residues;
Processing of residual rPET fines and dust with PET flake; and
Thermal and oxidative history.
To measure the discolouration of rPET resin, spectrophotometry was used to measure the resin‟s L, a, and b values. The „b‟ value is of particular importance for recycled PET as it denotes the yellowness of an item. A higher „b‟ value represents a more yellow resin.
Figure 7: Measurement of rPET colour is performed by evaluating the L, a, b values.
7.1 rPET discolouration simulation trials A series of R&D laboratory trials were performed to evaluate the impact of PVC, coloured PET particles and PET fines on the discolouration and yellowing of rPET. The trials included mixing of virgin PET with these contaminants in known quantities as well as comparing the L,a,b values (used as a measure of colour) of hot washed flake from a UK recycler. Virgin PET was used as the main constituent for the majority of the trials due to its ability to not mask the yellowing effect of the contaminants. The test matrix used for the study is presented below.
Improving food grade rPET quality for use in UK packaging 26
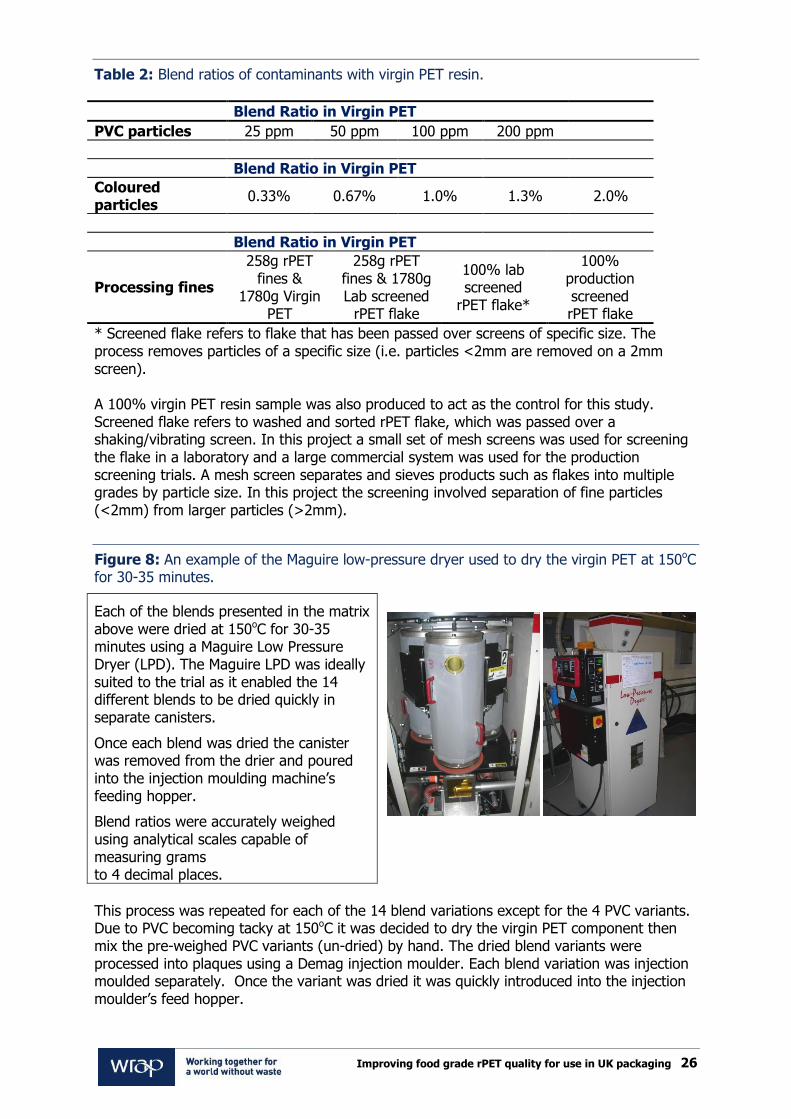
Table 2: Blend ratios of contaminants with virgin PET resin.
Blend Ratio in Virgin PET
PVC particles 25 ppm 50 ppm 100 ppm 200 ppm
Blend Ratio in Virgin PET
Coloured particles
0.33% 0.67% 1.0% 1.3% 2.0%
Blend Ratio in Virgin PET
Processing fines
258g rPET fines &
1780g Virgin PET
258g rPET fines & 1780g Lab screened
rPET flake
100% lab screened
rPET flake*
100% production screened rPET flake
* Screened flake refers to flake that has been passed over screens of specific size. The process removes particles of a specific size (i.e. particles <2mm are removed on a 2mm screen). A 100% virgin PET resin sample was also produced to act as the control for this study. Screened flake refers to washed and sorted rPET flake, which was passed over a shaking/vibrating screen. In this project a small set of mesh screens was used for screening the flake in a laboratory and a large commercial system was used for the production screening trials. A mesh screen separates and sieves products such as flakes into multiple grades by particle size. In this project the screening involved separation of fine particles (<2mm) from larger particles (>2mm).
Figure 8: An example of the Maguire low-pressure dryer used to dry the virgin PET at 150oC for 30-35 minutes.
Each of the blends presented in the matrix above were dried at 150oC for 30-35 minutes using a Maguire Low Pressure Dryer (LPD). The Maguire LPD was ideally suited to the trial as it enabled the 14 different blends to be dried quickly in separate canisters.
Once each blend was dried the canister was removed from the drier and poured into the injection moulding machine‟s feeding hopper.
Blend ratios were accurately weighed using analytical scales capable of measuring grams to 4 decimal places.
This process was repeated for each of the 14 blend variations except for the 4 PVC variants. Due to PVC becoming tacky at 150oC it was decided to dry the virgin PET component then mix the pre-weighed PVC variants (un-dried) by hand. The dried blend variants were processed into plaques using a Demag injection moulder. Each blend variation was injection moulded separately. Once the variant was dried it was quickly introduced into the injection moulder‟s feed hopper.

Improving food grade rPET quality for use in UK packaging 27
A minimum of 30 shots were discarded prior to samples being taken. Consecutive samples were then taken, recorded and immediately placed into an appropriately marked clear sample bag. For statistically useful data a sample size of greater than 20 plaques was taken for each variant. Upon the collection of a suitable amount of samples (>20) the rest of the variant was purged from the injection moulder leaving the hopper and barrel empty. This ensured that there was a distinct separation of samples between variants. The moulded plaques were then analysed using a spectrophotometer to assess the varying „b‟ value.
Figure 9: Photos of the injection moulder used during the plaque moulding PET discolouration simulation trials.
a) Demag ET 150 injection moulder fitted with a general purpose 25mm screw
b) Plaque mould
The laboratory trials simulated the impacts of key PET contaminants on the discolouration of virgin PET by injection moulding plaques with a range of levels of contaminants typically found in commercial flake materials. Several trials were also performed with screened PET flakes and sieved particles obtained from trials performed at a UK recycler. 7.1.1 Effects of PVC on rPET discolouration PVC has been extensively documented as a significant contaminant in the PET recyclate stream. When PET flakes are reprocessed in an extruder, the PVC contamination even when at very low levels, severely degrades at the processing temperatures used for PET and causes extensive discolouration in the form of yellowing and browning of PET and black specs due to the presence of charred PVC particles. The black specs form when PVC undergoes degradation due to dehydrochlorination and the formation of HCl gas at PET processing temperatures (typically 275-290°C). It has also been widely documented that even small amounts of PVC in PET flake can significantly reduce the melt viscosity of rPET and hence the molecular weight of rPET resin. For this reason separation and removal of small particles is necessary to help improve quality of rPET.

Improving food grade rPET quality for use in UK packaging 28
Table 3: Measured L,a,b values indicating discolouration impacts of PVC particles.
Discolouration impact
Amount of added PVC
L* - value
a* - value
b* - value
Virgin PET resin (control) 89.83 -0.37 1.35
PVC – 25ppm 89.94 -0.33 1.47
PVC – 50ppm 89.87 -0.30 1.63
PVC – 100ppm 89.68 -0.24 2.02
PVC – 200ppm 89.70 -0.23 2.28
* L,a,b values based on an average of 20 sample measurements
L = Lightness; a = red to green shift; b=blue to yellow shift
Table 3 and Figure 10 show the impact of increasing levels of PVC particles on the yellowing of virgin PET resin. Data from the trials shows b-value deterioration of approximately 40%. The discolouration impact from PVC particles on recycled PET would be significantly higher in commercial processing systems as the residence time in the barrel of commercial extruders is longer and flakes are also exposed to temperatures of 160°C inside dryers for 6-8 hours. In these trials the impact of temperature on the PVC particles was considerably lower as the residence time in the injection moulder during the plaque moulding trials was relatively short and the PVC particles in these trials were not exposed to any drying temperatures in these trials in comparison to commercial processing systems.
Figure 10: Measured discolouration effect of PVC contamination on the b-value (yellowing) of PET material.

Improving food grade rPET quality for use in UK packaging 29
Figure 11: Example of the type of discolouration occurring in moulded plaques when virgin PET is mixed with 200ppm of PVC particles. (The top left and bottom left plaques are virgin PET control samples for comparison and all others are plaques moulded with 200ppm PVC)
In summary, the results from the laboratory tests clearly indicate that PVC discolours PET virgin resin. The b-value of virgin PET deteriorated by more than 40% when clear PVC particles were added at 200ppm. The impact of PVC contamination resulted in yellowing and slight browning of the virgin resin and this was clearly observed in the moulded plaques. The discolouration impact from PVC would have also been greater if the PVC contaminant flakes were exposed to more intense thermal conditions such as those encountered under commercial reprocessing conditions as PVC particles would discolour more under such conditions. 7.2 Impact of coloured particles on rPET discolouration Coloured particles from plastics such as PET, PVC, PS, ABS as well as other plastics that have a specific density greater than 1, and are found in packaging often end up in small quantities in recycled PET flake. While PVC and PS particles are particularly damaging to PET, small coloured PET flakes can also cause discolouration. Presence of coloured flakes within the clear/light blue PET flake stream results in losses of good material during colour sorting operations. This is because for every coloured flake removed during flake sorting, another one or two clear flakes are lost. Therefore a colour content of 1.5% can readily result in losses of 3-4.5% of good clear flakes. This section focuses on small coloured particles and describes the impact on rPET discolouration.
Improving food grade rPET quality for use in UK packaging 30
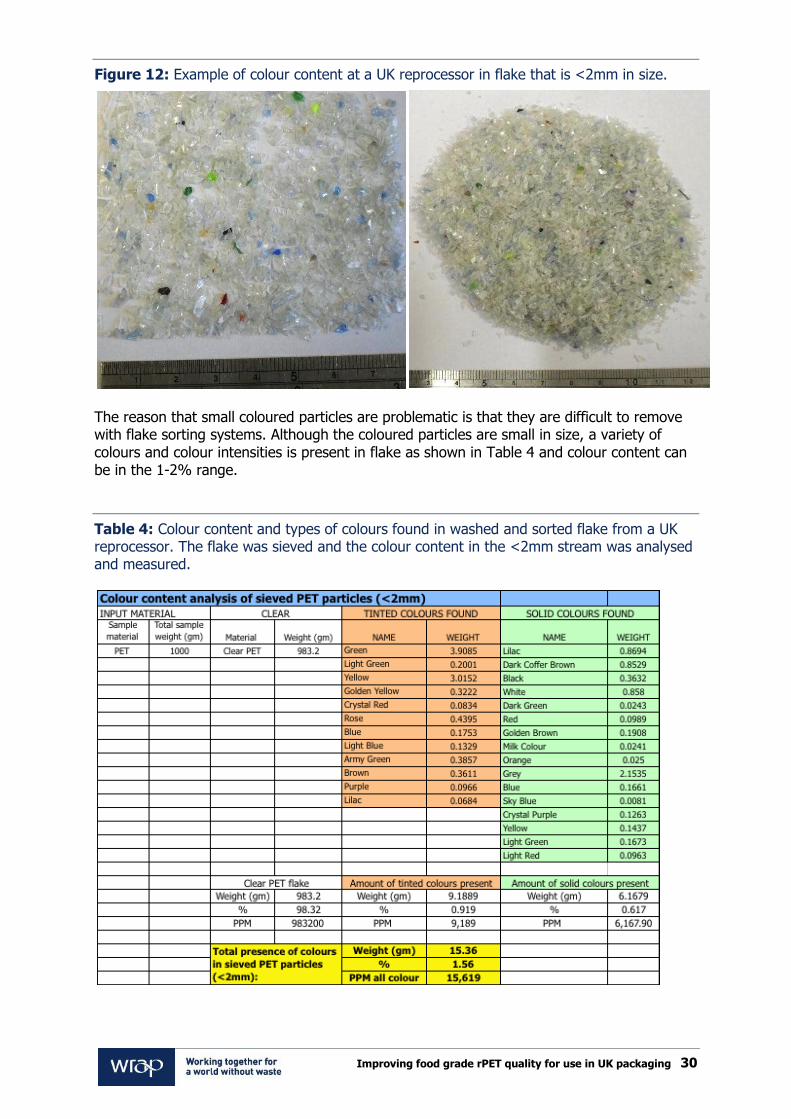
Figure 12: Example of colour content at a UK reprocessor in flake that is <2mm in size.
The reason that small coloured particles are problematic is that they are difficult to remove with flake sorting systems. Although the coloured particles are small in size, a variety of colours and colour intensities is present in flake as shown in Table 4 and colour content can be in the 1-2% range.
Table 4: Colour content and types of colours found in washed and sorted flake from a UK reprocessor. The flake was sieved and the colour content in the <2mm stream was analysed and measured.

Improving food grade rPET quality for use in UK packaging 31
Table 5: Measured L,a,b values indicating discolouration impacts of coloured particles.
Discolouration impact
Amount of coloured PET added L – value a - value b - value
Virgin PET resin (control) 89.83 -0.37 1.35
Coloured PET 0.33% 89.80 -0.43 1.80
Coloured PET 0.67% 88.16 0.01 2.98
Coloured PET 1.0% 88.44 -0.52 3.08
Coloured PET 1.33% 87.02 -0.28 5.51
Coloured PET 2.0% 86.54 -0.47 4.66
* L,a,b values based on an average of 20 sample measurements
Figure 13: Measured impact of coloured PET particles on the b-value (yellowing) of PET material.
Data obtained from the plaques showed that a mix of coloured particles can significantly discolour PET resin. While the impact on yellowing was varied, a large trend towards yellowing and discolouration was observed. The lower result at 2% colour addition when compared to 1.3% may have been due to poor mixing. The plaques showed some colour dispersion but the colours were not fully dispersed during injection moulding due to poor mixing in a very short screw.

Improving food grade rPET quality for use in UK packaging 32
Figure 14: Example of the type of discolouration occurring in moulded plaques when virgin PET is mixed with 1.3% of mixed coloured PET particles. (The top left and bottom left plaques are virgin control samples for comparison)
The results obtained from these trials have shown that coloured particles have a major impact on the discolouration of PET. The presence of even very low percentages of coloured PET particles in clear PET flake will discolour PET. Analysis of coloured particles in PET flake from a commercial reprocessing plant has shown that coloured particles in the sub 2mm size flake are present at high levels and were measured to be 1.5%. 7.3 Impact of particle size and presence of fines on rPET discolouration Particle size plays an important role in causing discolouration of rPET resin. Many modern plants sieve and remove particles below 2mm and in some cases below 4mm because these small particles are difficult to accurately sort. This does however impact the reprocessors‟ material yields as losses can range between 5-10% of the overall flake stream. Discolouration due to small particles comes from several factors. Studies on flake from a UK recycler have shown that the majority of PVC present in PET flake is under 2mm in size. The percentage of coloured particles is also typically significantly higher in the small particle fraction i.e. <4 mm and <2mm.
Figure 15: Typical PVC particle distribution in PET flake showing that the majority of PVC particles are less than 2mm in size.

Improving food grade rPET quality for use in UK packaging 33
Figure 15 shows that the majority of PVC particles found in PET flake are under 2mm in size. Removal of particles under 2mm in size therefore facilitates the removal of majority of PVC contamination. Data in Table 6 shows the impacts of small particles and PET fines on the L,a,b values. The graph in Figure 16 demonstrates the significant impact of small particles on the b-value, which is considered the most important indicator of discolouration and yellowing.
Table 6: Measured L,a,b values indicating discolouration impacts of small particles (<2mm) separated from standard hot-washed sorted PET flake from a UK recycler.
Discolouration impact
Flake size L - value a - value b - value
Control (Virgin PET) 89.83 -0.37 1.35
Screened PET flake (>2mm) 89.16 -0.84 3.05
Sieved PET particles (<2mm) 86.24 -1.40 5.72
* L,a,b values based on an average of 20 sample measurements
Figure 16: Impact of small particles (particles <2mm) on the b-value (yellowing) of PET resin.
The impact of particles smaller than 1mm (i.e. fines) is also significant as data in Table 7 and Figure 17 shows. The results from injection moulding trials clearly show that discolouration due to fines increases by a factor of 2.7 when fines are added to virgin PET (at 13% which is the original level of fines in the recycled PET flake) and a factor of 2.1 when fines are added (at 13%) to screened flake. The high b-values clearly indicate that fines are a significant discolouration contributor.
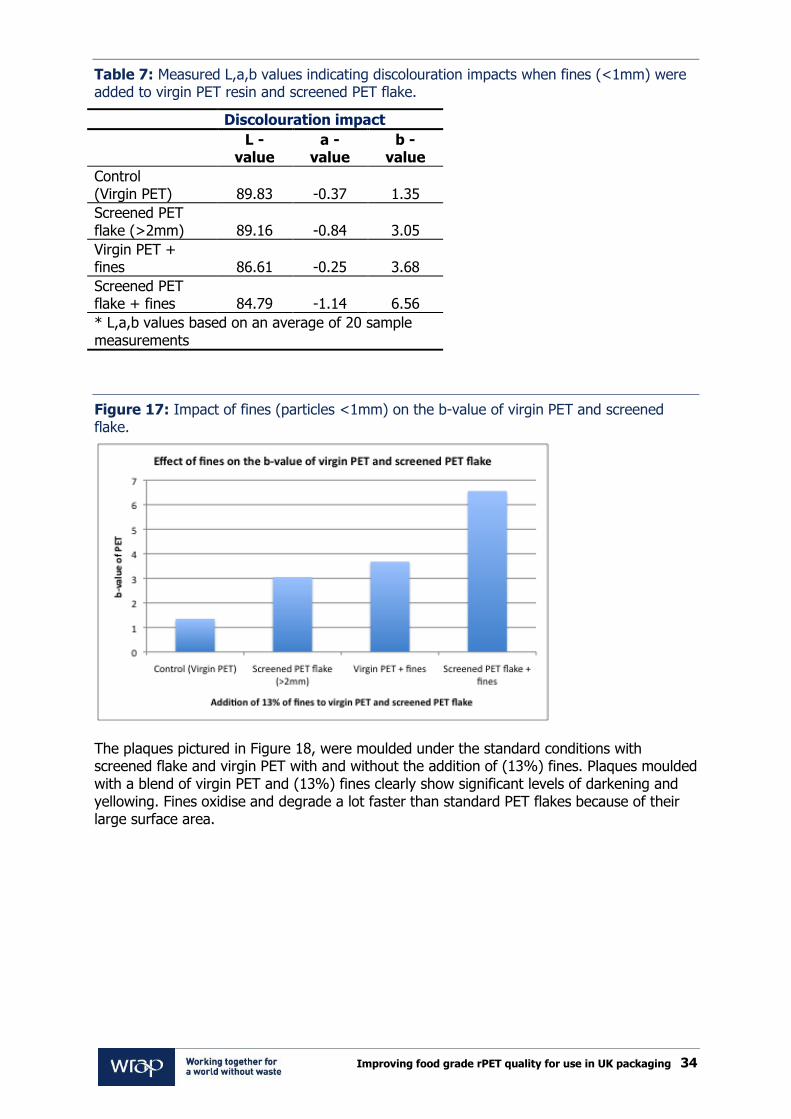
Improving food grade rPET quality for use in UK packaging 34
Table 7: Measured L,a,b values indicating discolouration impacts when fines (<1mm) were added to virgin PET resin and screened PET flake.
Discolouration impact
L -
value a -
value b -
value
Control (Virgin PET) 89.83 -0.37 1.35
Screened PET flake (>2mm) 89.16 -0.84 3.05
Virgin PET + fines 86.61 -0.25 3.68
Screened PET flake + fines 84.79 -1.14 6.56
* L,a,b values based on an average of 20 sample measurements
Figure 17: Impact of fines (particles <1mm) on the b-value of virgin PET and screened flake.
The plaques pictured in Figure 18, were moulded under the standard conditions with screened flake and virgin PET with and without the addition of (13%) fines. Plaques moulded with a blend of virgin PET and (13%) fines clearly show significant levels of darkening and yellowing. Fines oxidise and degrade a lot faster than standard PET flakes because of their large surface area.

Improving food grade rPET quality for use in UK packaging 35
Figure 18: Example of the type of discolouration occurring in moulded plaques when virgin PET is mixed with PET and other 13% of plastic fines. (The top left and bottom right plaque are virgin control samples for comparison)
7.4 Separation of small particles and potential PET material yield loss UK sourced PET flakes were analysed to determine typical particle distribution. While this is directly related to selected granulation size, most recyclers granulate PET bottles and thermoforms in 10-13mm screens. Flake from a UK recycler was measured over several weeks and it was determined that PET flakes >2mm make up approximately 90-95% of the overall flake stream. PET flakes <2mm in size typically make up 5-10% of the PET flake stream (on average).
Figure 19: Example of PET flake particle size distribution of a UK PET reprocessor
Given that the majority of PVC, coloured particles and fines are present in the sub 2mm particle size flake stream, screening at 2mm could potentially remove large proportions of contaminants. While screening would not remove all small particles due to some entrapment between flakes, it is believed that many contaminants could be reduced and rPET quality improved. Screening at 4mm may be even more helpful as most commercial flake sorters are currently only able to efficiently sort particles above 4mm at high throughput rates.

Improving food grade rPET quality for use in UK packaging 36
The main obstacle to this approach is the potential loss of PET flake material, which could be up to 10% when flake is screened at 2mm and over 40% if screened at 4mm. There is therefore a need to develop sorting technologies for particles under 4mm in size. If such technology existed then particles >4mm could form premium rPET grades and particles <4mm could be sorted to remove contaminants and re-sorted to maximise recovery of small PET particles and minimise yield losses. At present, efficient and high speed sorting technology for small particles is not yet commercially available although research in this area is ongoing. 7.5 Summary of results The results from the laboratory trials show that small particles cause the largest shift in colour towards yellowing and darkening. This is because small particles under 2mm in size contain PVC, higher levels of colour as well as fines. The impact of individual contaminants such as PVC, colour and fines was measured and recorded for assessment. The biggest impact was found to be related to the percentage of coloured particles, followed by fines and then PVC. The impact of these contaminants may be more pronounced when they are exposed to longer thermal exposures under commercial processing operations.
Table 8: Summary of measured L,a,b values from key contaminants and their impacts on PET discolouration.
Average value
L a b
Control (Virgin PET) 89.83 -0.37 1.35
Screened PET flake (>2mm) 89.16 -0.84 3.05
Sieved PET particles (<2mm) 86.24 -1.40 5.72
PVC - 25ppm 89.94 -0.33 1.47
PVC - 50ppm 89.87 -0.30 1.63
PVC - 100ppm 89.68 -0.24 2.02
PVC - 200ppm 89.70 -0.23 2.28
Coloured PET 0.33% 89.80 -0.43 1.80
Coloured PET 0.67% 88.16 0.01 2.98
Coloured PET 1.0% 88.44 -0.52 3.08
Coloured PET 1.3% 87.02 -0.28 5.51
Coloured PET 2.0% 86.54 -0.47 4.66
Virgin PET + fines 86.61 -0.25 3.68
Screened PET flake + fines 84.79 -1.14 6.56

Improving food grade rPET quality for use in UK packaging 37
8.0 Functional additives for improved rPET colour and clarity
Optical brighteners are additives that can be used to brighten rPET resins. Several suppliers of recycling equipment already offer PET recycling systems with ancillary equipment designed to feed optical brighteners to improve the colour of rPET pellets and many optical brighteners are food contact approved. Optical brighteners absorb light in the UV spectrum and emit the energy in the visible spectrum, making the rPET resin look brighter. Manufacturers of optical brighteners often use toner additives to shift the yellow appearance towards a blue or grey colour. The possibility of colour improvements is also related to the types of virgin PET resins used, for example in the UK reheat PET resins are very popular, as the reheat additives, which are typically dark, carbon black based materials reduce the time for heating of preforms, making the reheat and blow process a lot more energy efficient. However, virgin reheat resins can be optimised for recycling and can be manufactured with additives that are not based on carbon black. These developments could lead to brighter virgin and recycled PET resins, yet retain optimum reheat and blow process efficiencies. ColorMatrix, a leading global producer of liquid colour and additives for plastics, performed a series of evaluation trials using its Optica™ toner, and the reheat blow additive Joule™ RHB as the only non-carbon black based reheat additive to improve the colour and reprocessing of rPET resins. The evaluation of these additives is important, as even virgin PET resins used in the UK are often darker than those used in Europe due to the heavier presence of carbon black particles in fast reheat PET resins. The ColorMatrix toners, and non-carbon black reheat additives used in these trials were formulated to resolve particular issues such as discolouration of rPET resins, typically experienced during sheet extrusion or injection moulding of preforms. Figure 20, shows a series of preforms and bottles manufactured with different toners and optical brightener additives using PET flake material from two UK recyclers. ColorMatrix used the flake to formulate additives to optimise the colour of the final product. The results are seen in bottles but are also applicable to sheet and thermoformed packaging.
Figure 20: Example of colours of preforms and bottles made with 50% rPET and additions of toners and optical brighteners using flake from UK recycler A.

Improving food grade rPET quality for use in UK packaging 38
As part of the research and development of optical brighteners for recycled PET resins, ColorMatrix granulated the standard flake more finely and then sieved the finely granulated flake at 2mm and also at 75 micron. The rPET resin was then blended with 50% virgin resin and a series of tests with red and blue toners and optical brighteners were performed.
Figure 21: rPET materials from different recyclers display different colours. Outer preforms are virgin preforms for comparison, material for the three discoloured preforms on the left are from Recycler A and next two are from Recycler B.
The results from trials with flake from Recycler A showed that a level of colour improvement could be achieved. Figure 22 shows two virgin PET bottles (at the edges), a standard 50:50 rPET/virgin bottle made with 2mm sieved flake (2nd from left) and three bottles made with a variety of toners and optical brighteners. The photo of the bottles in Figure 22 clearly shows that there is a shift from yellow/brown looking bottle (2nd from left) to blue/grey for the 3rd, 4th and 5th bottles from the left. The third bottle from the left showed a good improvement in colour and was the closest in terms of clarity to the virgin bottles.
Figure 22: Preforms and bottles made with 50% rPET from Recycler A and mixed with a series of different levels of toners and optical brighteners.

Improving food grade rPET quality for use in UK packaging 39
Preforms and bottles made with flake from Recycler B, showed a shift from a yellow colour tone as shown by bottle on the left hand side in Figure 23 to a more grey tone as shown by the bottle on the right hand side.
Figure 23: Preforms and bottles made with 50% rPET from Recycler B and a series of toners and optical brighteners.
Bottles made from material that was screened using a 2mm screen, showed significantly fewer impurities than bottles screened at 75 micron.
Figure 24: Influence of screening of flake (2mm vs. 75 micron).
The photograph in Figure 25 showing the levels of contamination on bottles clearly demonstrates that removing particles under 2mm in size results in bottles that have fewer impurities, solid particles, blacks specs and what appear to be gels. At 50% rPET content, gels, specs and solid particles are visible in all the bottles but far fewer are present in bottles that have been sieved at 2mm vs. 75 micron. This suggests that the screening and removal of particles below 2mm results in better quality recycled PET resin with fewer impurities and visual defects.

Improving food grade rPET quality for use in UK packaging 40
Figure 25: Sieving at 2mm or higher can remove substantial impurities.

Improving food grade rPET quality for use in UK packaging 41
9.0 Large scale trials
Several large scale trials were performed as part of this project and focused on evaluating the performance of screened PET flake in sheet extrusion trials.
9.1 Anson Packaging sheet extrusion trial using screened flake A sheet extrusion trial running screened (<2mm removed) PET flakes versus unscreened PET flakes was organised at Anson Packaging thermoforming plant in Cambridgeshire. The purpose of the trial was to evaluate the colour of sheet produced with flake that had been screened with particles under 2mm removed. A direct comparison of the results could then made with sheet manufactured with unscreened flake. An A/B/A layer sheet was produced with the A layer being virgin and comprising of a total of 10% of the sheet cross sectional weight (i.e. 5% on each side). The B layer consisted of the 90% unscreened or screened PCR rPET material. Standard operating conditions for sheet extrusion and thermoforming were used throughout the trial.
Table 9: L,a,b values obtained from sheet samples manufactured with screened and unscreened flake.
Unscreened PET flake
Screened PET flake
Colour difference
L-value 92.58 93.92 ∆ L-value = 1.34 lighter
a-value -1.27 -1.24 ∆ a-value = 0.03 less green
b-value 3.38 2.51 ∆ b-value = 0.88 less yellow
The L,a,b values clearly show an improvement in the colour of the sheet product manufactured from flake that was screened. The key improvement was a significant reduction in yellowing as shown by an improved b-value. The lower level of yellowness showed by the lower b-value can be considered to be an important improvement given that the sheet was manufactured with 90% recycled content. During the trial an attempt was made to measure and identify any changes in the build-up of contaminants on the screens and to evaluate and compare the differences between screened and unscreened flake. However as only one screen filter change was performed during the one tonne trial a direct comparison could not be made. In order to get a more accurate picture, larger volumes of trial material would need to be processed. When reviewing the amount of material left on filter screens, visually there appeared to be a greater amount of metal (in percentage terms versus other contaminant materials) on the screen when the unscreened PET flake was trialled compared to the screened PET flake. A reason for this may however be due to the trial time being 3 hours for unscreened flake compared to 1 hour for screened flake. A shorter run was performed with the screened material because only 1 tonne of material was available for the trial and this was processed within 1 hour. However even with this time difference there still appeared to be substantially more than 3 times the contamination on the filter screen used to process the unscreened flake in comparison to the screened flake.
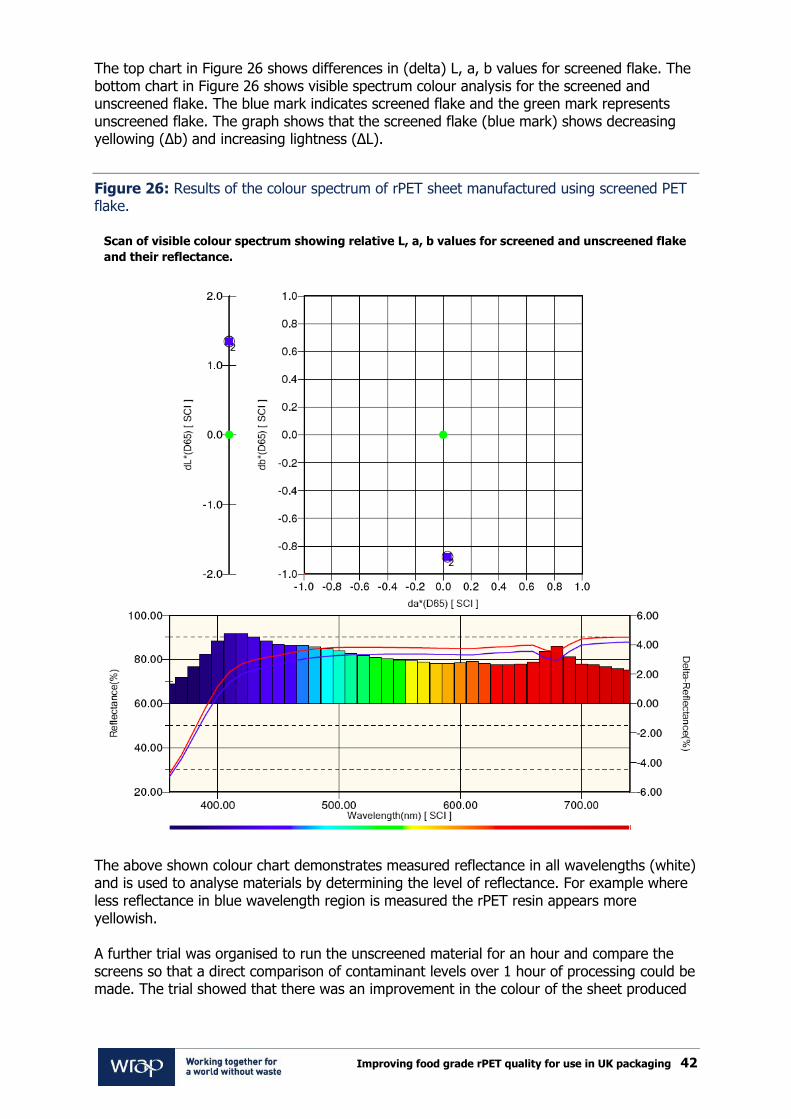
Improving food grade rPET quality for use in UK packaging 42
The top chart in Figure 26 shows differences in (delta) L, a, b values for screened flake. The bottom chart in Figure 26 shows visible spectrum colour analysis for the screened and unscreened flake. The blue mark indicates screened flake and the green mark represents unscreened flake. The graph shows that the screened flake (blue mark) shows decreasing yellowing (∆b) and increasing lightness (∆L).
Figure 26: Results of the colour spectrum of rPET sheet manufactured using screened PET flake.
The above shown colour chart demonstrates measured reflectance in all wavelengths (white) and is used to analyse materials by determining the level of reflectance. For example where less reflectance in blue wavelength region is measured the rPET resin appears more yellowish. A further trial was organised to run the unscreened material for an hour and compare the screens so that a direct comparison of contaminant levels over 1 hour of processing could be made. The trial showed that there was an improvement in the colour of the sheet produced
Scan of visible colour spectrum showing relative L, a, b values for screened and unscreened flake
and their reflectance.

Improving food grade rPET quality for use in UK packaging 43
with screened flake. It was less yellow and there was a measured 26% improvement in the b-value of the 90% rPET sheet.
Figure 27: Sheet extrusion trial using screened flakes (Courtesy of Anson Packaging).
9.2 TDX sheet extrusion trial using screened flake Sheet extrusion trials using screened flake from a UK recycler were run at TDX. The purpose of these trials was to evaluate whether screened recycled flake was less contaminated and reduced the level of clogging on filter packs that was previously experienced when unscreened hot washed rPET flake was trialled. A further objective of the trial was to also visually evaluate whether the screened flake resulted in sheet with fewer visual solid particle defects and reduced levels of gels and black specs. The screened flake was sieved in a batch process using an automated machine using a 3mm screen for a period of 20 minutes. Quality testing of the screened flake showed that reduction of fines and particles under 2mm in size was only 50% effective, that is there were still 50% of fines still remained in the flake even after screening trials. The limited removal of fines was due to limitations in current design of screening equipment and due to dust and fines being more easily trapped in PET flake. Improvements to screening systems are needed to achieve 90% removal of small particles and effective removal of trapped fines and dust particles from PET flakes. The recycled content of the screened flake in the sheet was set to 30% and the remaining 70% was made up of 10% virgin, 30% PCR rPET flake from another UK recycler and 30% reuse of thermoformed PET trim. The extrusion sheet was produced at 950kg/hr and was filtered with a 40-micron 4-layer screen. The automated filtration set-point on the sheet extrusion line was set to 50 bar pressure, at which point the filters were back-flushed and contaminants removed. The graph in Figure 28 shows processing times between filter flushing. Longer intervals mean that less PET material is lost to flushing also improving the processing life of filter screen packs, leading to lower costs associated with screen replacements.

Improving food grade rPET quality for use in UK packaging 44
Time of trial
Figure 28: Back pressure build up showing that back flushing with screened flake occurs at an average 1.25hrs compared to 20 minutes for unscreened flake.
Previous trials using unscreened material resulted in the ultrafine 40 micron screens becoming clogged rapidly and the filters needed to be flushed almost every 20 minutes with screens showing a build up of aluminium particles as well as small silicone particles and black specs from PVC particles. Sheet produced from unscreened flake showed visual surface defects such as gels due to fines and silicone particles as well as black specs due to PVC. Results from this trial with screened flake show a significant improvement in terms of increased time taken for back pressure to build up due to lower levels of contamination in the flake. Filter screen back flushing of the ultra-fine 40 micron screens has improved from 20 minutes to 1.25hrs. The results achieved may be able to be improved even further if removal efficiency of sub 2mm particles and fines from flake improves from current 50% levels.
Ba
ck
pre
ssu
re (
ba
r)

Improving food grade rPET quality for use in UK packaging 45
10.0 Assessing the impacts on rPET quality from thermoformed PET packs
Over the last few years there has been a concerted effort to improve the recyclability of PET bottles. Guidelines for recycle friendly bottles and components such as label adhesives, barrier materials, caps and closures are now well developed and have been documented by WRAP, EPBP, UNESDA and EFBW (see list of key documents in References). Both virgin PET and blends with rPET resins are widely used for thermoformed packaging such as pots, tubs, trays and cups. There are a number of key overarching principles that are appropriate for all PET thermoforms such as pots, tubs and trays. These include:
Design for ease of separation and removal of materials such as lidding films, wraps and labels from PET thermoforms to allow for ease and efficiency of recycling;
Avoidance of using materials that are known to significantly contaminate and reduce quality of rPET;
Use of fewer packaging materials on PET bottles to allow for ease and efficiency of recycling.
Programs and assessment protocols for improved recyclability of thermoformed PET packs such as pots, tubs and trays have only recently been considered. A recent study on National Mixed Rigid Plastic Bale Composition Study & Analysis of Non-Bottle Rigid Plastic Available for Recycling in the USA has described typical compositions of non- bottle rigids, including PET thermoforms. In the USA, the new PET Thermoform Label and Adhesive Evaluation Program from the Association of Post-consumer Reprocessors helps to identify and define recycle friendly thermoform components such as labels and adhesives which allow PET thermoformed packaging to be recycled in an efficient manner. As a response to the new APR protocols, label making companies of pressure-sensitive laminate labels have developed labels that satisfy both the need to adhere and to be removed prior to and during recycling. APR‟s, PET Thermoform Program is a voluntary program to makers of PET thermoform labels and adhesives to assess the effects of materials decisions on the recyclability of PET thermoforms and receive publicity for successful evaluations. Links to several of the key protocols are provided in the References section of this report, however we would encourage organizations in the PET thermoforming industry to read APR‟s Protocol for Evaluating PET Thermoform Labels and Adhesives for Compatibility with PET Recycling, the PET Thermoform Program Operating Procedures and the PET Thermoform Program Petitioner Agreement. In addition WRAP has produced industry guidance on the design of rigid plastic packaging for recycling, which includes non-bottle PET packaging. This will be available on the WRAP website in 2013. 10.1 Issues around recyclability of PET trays PET trays can introduce a number of contaminants into the PET recyclate stream. Most PET trays are manufactured from sheet that contains a PE or a PP top layer for effective heat sealing with lidding films. As the amounts of recovered PET trays increase in bales due to increased mixed plastics collections, there is potential for haziness due to the presence of PE or PP on flakes from trays.
Lidding films (usually PET) if attached to the tray, are difficult to remove during reprocessing because the lidding film is heat-sealed to the tray. When shredded most of the lidding film fragments can be removed, however residual lidding film attached to tray or pot/tub will remain with the flake material.

Improving food grade rPET quality for use in UK packaging 46
Figure 29: Examples of typical PET tray packaging in the UK and the variety of labels, lidding films and adhesives used for decorative components.
10.2 PET pots tubs & cups Labels attached directly to the rigid parts of thermoforms should be able to be physically detached from the thermoform and separate from the PET flakes by specific gravity in flotation tanks or air separators. They should not leave adhesive residues on the packs. Metallised or foil labels should be avoided as they increase levels of contaminants or may cause the packs to be ejected to waste by metal detectors; labels with deposition techniques that provide a very thin layer of metal may be acceptable but need validation. Metallised paper labels although not ideal, are always preferred to decorative or safety aluminium based foils, as this results in fewer rejects during sorting and metal detection. Thin metallic foils are sometimes added to bottles or thermoforms for increased consumer appeal and in some circumstances for security, as tamper evidence measures. If decoration or safety/tamper proof evidence is needed on particular packs it is best to use polyolefin based stretch sleeves or standard paper labels designed for such a function. PS / PVC, PLA or PET shrink sleeves should not be used as these will cross contaminate the PET flake material.

Improving food grade rPET quality for use in UK packaging 47
Figure 30: Examples of UK PET tubs and the types of lidding films and label decorations typically used.
PET is also becoming increasingly popular for take away drinks, fruit smoothies, beer cups and other products. These packs are often decorated with a variety of labels and sometimes printed for promotional purposes. Where printing inks are used on PET cups and tubs, they should be washable and removable under standard hot-wash recycling conditions otherwise any flakes recovered from cups that are surface printed will discolour rPET resin when the flakes are extruded.
Figure 31: Example of printed PET cups used for fruit smoothies, beer cups and other take-away drinks.
Label adhesives It is recommended that where possible, the adhesive be applied in a very thin layer and should only cover a minimal surface area of the pack. Labels, which best achieve this, only use adhesive at the label edges or use fine and thin adhesive droplets in only a few positions. With any new label development designers should perform adhesive separation tests and check that the label adhesive is on the EuPR positive glue list http://www.plasticsrecyclers.eu/ The adhesive should always be able to separate from PET flakes during the hot caustic water wash step, so that it can be removed with filters or centrifuges from the wash water.
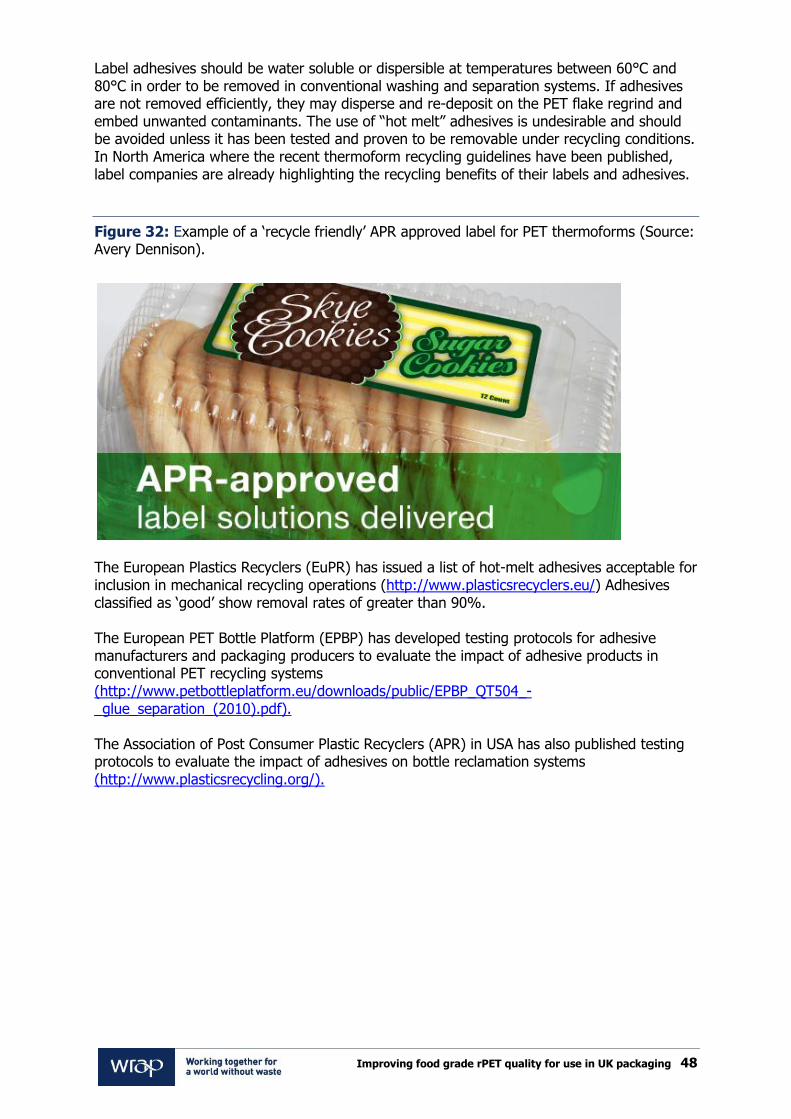
Improving food grade rPET quality for use in UK packaging 48
Label adhesives should be water soluble or dispersible at temperatures between 60°C and 80°C in order to be removed in conventional washing and separation systems. If adhesives are not removed efficiently, they may disperse and re-deposit on the PET flake regrind and embed unwanted contaminants. The use of “hot melt” adhesives is undesirable and should be avoided unless it has been tested and proven to be removable under recycling conditions. In North America where the recent thermoform recycling guidelines have been published, label companies are already highlighting the recycling benefits of their labels and adhesives.
Figure 32: Example of a „recycle friendly‟ APR approved label for PET thermoforms (Source: Avery Dennison).
The European Plastics Recyclers (EuPR) has issued a list of hot-melt adhesives acceptable for inclusion in mechanical recycling operations (http://www.plasticsrecyclers.eu/) Adhesives classified as „good‟ show removal rates of greater than 90%. The European PET Bottle Platform (EPBP) has developed testing protocols for adhesive manufacturers and packaging producers to evaluate the impact of adhesive products in conventional PET recycling systems (http://www.petbottleplatform.eu/downloads/public/EPBP_QT504_-_glue_separation_(2010).pdf). The Association of Post Consumer Plastic Recyclers (APR) in USA has also published testing protocols to evaluate the impact of adhesives on bottle reclamation systems (http://www.plasticsrecycling.org/).

Improving food grade rPET quality for use in UK packaging 49
11.0 Conclusions
The findings from this study show that UK plastic reprocessors have experienced a significant deterioration in quality of plastic bottle bales over the last three to four years, and this is one factor impacting rPET quality. UK converters report that improvements in rPET pellet and flake quality have been achieved by a number of reprocessors in the last three years, which they attributed to better sorting at UK PRFs and continued investment into separation technologies and equipment. However converters continue to experience problems with rPET resins and there is concern over a wide variation in rPET quality – particularly of flake – across their suppliers, which results in the need to test regularly and manage their own quality standards. Of specific concern is the level of discolouration that rPET resins show. The materials from UK reprocessors are sometimes considered to be too dark and variable in terms of colour. Survey results and feedback from converters, retailers and brand owners clearly shows that quality concerns are limiting the recycled content levels in packaging and wider use of rPET by end users. Analysis of the main quality issues related to rPET resin in the UK shows rPET discolouration and colour variability, presence of small coloured particles and small particles / fines, which increase the level of black specks, gels and general degradation of material. Normal discolouration of rPET in the UK is towards yellow-brown. Key contaminants impacting rPET quality The key contaminants identified by UK reprocessors, in order of occurrence:
PVC;
Other non-bottle plastics including black plastics;
Decorative elements from thermoform packaging;
Silver and other solid colours used for PET bottles / trays;
Metals (aluminium cans and metal springs from trigger packs);
Plastic films, bags, carrier bags;
Paper;
Glass;
Silicone;
Plastics heavier than water (PS, ABS);
Fines, dirt, loose labels; and
Rubber.
The presence of small (<2mm) coloured PET particles in clear PET flakes was identified to contribute towards significant discolouration of rPET resins. Reprocessing of PET packaging creates PET fines and dust and the presence of fines and dust in PET flake can significantly contribute towards rPET discolouration and effective removal of fines is therefore very important for quality improvement. Other contaminants that pose significant challenges to all reprocessors of PET are residual fragments of metals, usually from granulated trigger and pump pack springs, as well as some aluminium fragments from cans. The continued presence of black plastics and residual labels/sleeves and films also contribute towards rPET quality downgrades. Mixed plastics within products collected for recycling can also be problematic and result in yield losses and increased levels of contamination in food grade rPET.
Improving food grade rPET quality for use in UK packaging 50
Industry surveys and feedback from dialogue with reprocessors has confirmed that PVC is a particularly challenging contaminant to remove from PET flake. Feedback from reprocessors and results from trials confirmed the widely held view that PVC significantly impacts rPET quality, colour and properties. Trials simulating the discolouration impacts of most serious contaminants typically found in PET flake such as PVC, colour and fines clearly showed how the presence of these particles and in particular those under 2mm in size significantly increase discolouration of rPET even when present in small quantities in PET flake. Assessment of flake under 2mm in size found higher levels of colour and PVC in comparison to PET flake over 4mm in size. Current flake sorting systems are highly efficient at removing polymer, colour and other materials contaminants larger than 4mm and capable of removing some contaminants down to 2mm in size. However particles smaller than 2mm cannot currently be efficiently sorted. There is a need for effective advanced sorting technologies and systems for purification of small PET particles to increase the overall PET flake purity and reduce any potential material losses. Until such technologies are developed reprocessors should consider screening their PET flake using automated vibrating sieve screens with 2mm holes. The removal of sub 2mm material is expected to improve quality of the remaining flake. The efficiency of sieving screens can vary and is directly related to flake distribution and sufficient residence time and reprocessors need to make sure that fines and small particles are indeed being removed. The industry also needs to consider potential end-markets for sub 2mm particles, the fibre market may potentially be able to utilise these materials, however this approach needs to be evaluated. While there are significant potential productivity benefits at sheet manufacturers as a result of improving the quality of PET flake through techniques such as screening and separation of particles under 2mm in size, there are also material yield losses at the recycler, often by as much as 5-10%. This can have a significant impact on the financial performance of recycling plants which may be offset by the higher sales yields due to the improved quality. While sieving can be effective as an end-of-pipe solution to improving quality, it would also be beneficial to address bale quality to remove contamination at the start of the recycling process. The wide variation of rPET quality – with some suppliers achieving excellent quality and others poor quality – suggests that there is scope for significant improvement in process improvements across the industry, including investment in modern PRFs and the latest sorting technology. Bale quality audits & quality tests performed during reprocessing All reprocessors perform visual bale checks to detect poorer quality bales however this method is not quantitative. Small sample testing is commonly performed on most bales if there are doubts on bale quality, and involves analysing approximately 6-8kg from each bale and photographing the presence of contaminants. It is common for all reprocessors in the UK to perform a daily material mass balance to determine PET yields and losses related to contamination. Some reprocessors perform mass balance tests and extensive quality checks every 4-6 hours to maintain product quality and be aware of any potential problems. Serious non-conformance is reported to suppliers and usually only occurs when there is obvious contamination in high levels and is visually obvious as well as measured. All reprocessors regularly check and test the performance of key recycling equipment systems. Particular attention is paid to sorting systems, to ensure that sorting accuracy and product purity is maintained at high levels. All reprocessors continuously monitor and

Improving food grade rPET quality for use in UK packaging 51
maintain the required running conditions of hot washing and decontamination extrusion systems. Summary In summary, much work is needed to improve and maintain rPET quality. Collections and reprocessing of mixed plastic packaging are increasing levels of contaminants in the PET bottle recycling stream. While PET thermoforms are recyclable, improvements to the packs need to be made so that they are more compatible with bottle recycling technologies. This can only be achieved by direct involvement of the bottle and thermoform packaging industry in collaboration with UK reprocessors. New products entering the market need to be designed for recycling, so that the materials can be utilised back into valuable products, - this can only be achieved through design of products where decorative elements are easily removable and separable using commercially available recycling technologies. Colour for rPET can be significantly improved by:
The adoption of fast re-heat virgin resins, which do not contain carbon black and provide better clarity.
Virgin resins designed for recycling and reprocessing.
The removal of small particles will help the removal of the majority of contaminants as current flake sorting systems can only accurately sort above 2-4mm and the majority of contaminant are present in the small particle fraction <2mm and to a lesser degree in the 2-4mm fraction. However removal of the small particles impacts yields and therefore the economic performance of most reprocessing plants. Physical and spectroscopic separation and sorting technologies are needed to improve purity and minimise yield losses through re-sorting techniques.
Optical brighteners also present an opportunity to improve the clarity of rPET resins as well as in products, which utilise high levels of rPET content.

Improving food grade rPET quality for use in UK packaging 52
12.0 Recommendations
Improving bale quality Given that most UK PET reprocessors primarily handle UK collected PET material, there is an opportunity to improve quality by improving the sorting and separation of plastic packaging. The proposed MRF Code of Practice aims to make the composition of MRF inputs and outputs transparent and this will improve bale quality. Development of recyclability guidelines for thermoformed PET packaging There has been extensive work done by the PET bottling industry over the last few years to improve the recyclability of PET bottle packaging, including adoption of recycle friendly caps and closures, improvements to label and adhesive removal and overall reduction of adhesive coverage for labels. Other steps such as a move away from PVC sleeves and cap liners have further helped to facilitate quality improvements in PET bottle recycling. Guidelines developed for testing the impact of barrier materials, adhesives and other bottle components on PET bottle recyclability have helped the PET bottling industry to design and specify components which are „recycle friendly‟. WRAP has worked with the industry to produce recyclability guidance for PET drinks bottles (http://www.wrap.org.uk/content/pet-bottle-categorisation-tool) and for pots, tubs, trays and non-drinks bottles WRAP has produced industry guidance on the design of rigid plastic packaging for recycling, which includes non-bottle PET packaging. This will be available on the WRAP website in 2013 and is intended to support the UK industry to maximise the recyclability of PET packaging placed onto the UK market. A study to identify types of contaminants present in recovered post-consumer PET thermoformed packaging as well as origins and levels of the identified contaminants would help to focus on problematic pack types. Such a study should assess and determine quality of rPET from postconsumer mixed thermoform packaging and to directly identify the presence of specific contaminants and to perform a comparison to the quality of flake and pellets achieved from bottle only inputs. Industrial trials could identify problematic materials and components in the PET thermoforming packaging supply chain. For example, PVC, PLA and PS materials are more widely used in thermoformed packaging than in the bottle market and need to be effectively sorted. The presence of residual lidding films and tray film wraps, multi-layer trays and tubs, the use of PE/PP layers on PET sheet, paper labels and difficult to remove adhesives as well as directly printed pots, tubs and cups are all key areas which require investigation. Working group on PET thermoform packaging recyclability Considering that thermoformed rigid PET packaging is growing in popularity and uses a large quantity of rPET, it is important that recyclability of thermoformed PET packaging is improved. A European working group on PET thermoform packaging recyclability would be a way to develop this further, as European reprocessors are having similar issues to UK reprocessors and this appears to be related to contamination from thermoform packaging that has not been designed with recycling in mind. Improvements to rPET colour rPET discolouration was identified as the major quality issue for the industry and dark or yellow/brown colour of rPET is also the main limiting factor to increased levels of rPET usage in both bottles and thermoformed packaging. Retailers and brand owners recognise discolouration as a key limitation but have not experienced more complaints or product quality issues.

Improving food grade rPET quality for use in UK packaging 53
Improvements to colour can be achieved by focusing on multiple causes of discolouration. These include better separation and purification of PET flake as well as the use of additives such as toners and optical brighteners that have been specifically designed for improving the colour of rPET materials. Several UK reprocessors have expressed an interest in further R&D into the use of food contact approved optical additives to improve the clarity and brightness of rPET. Improvements to colour also need to come from new virgin resins that have better clarity and use fast reheat additives that are not carbon black based. New food contact additives that improve clarity, stability and reduce oxidation during reprocessing are needed. Reprocessors can significantly improve the quality of rPET by screening/sieving rPET flake to remove particles of <2mm in size. Given that the majority of PVC, coloured particles and fines are present in the sub 2mm particle size flake stream, screening at 2mm could potentially remove large proportions of contaminants. This showed a significant improvement to the colour and reduction of visible contaminants as well as increasing the time interval between melt filters changes and the need to conduct back flushing. Screening at 4mm may be even more helpful as most commercial flake sorters are currently only able to efficiently sort particles above 4mm at high throughput rates. However the main obstacle to this approach is the potential loss of PET flake material, which could be up to 10% when flake is screened at 2mm and over 40% if screened at 4mm. There is therefore a need to develop sorting technologies for particles under 4mm in size. If such technology existed then particles >4mm could form premium rPET grades and particles <4mm could be sorted to remove contaminants and re-sorted to maximise recovery of small PET particles and minimise yield losses.

Improving food grade rPET quality for use in UK packaging 54
13.0 References
APR 2011, Design for Recyclability Guidelines, http://postconsumer1.ipower.com/images/stories/doc/dfr_2011_december.pdf APR 2011, PET Thermoform Label and Adhesive Evaluation Program, http://postconsumer1.ipower.com/pet-thermoforms, and http://postconsumer1.ipower.com/images/documents/pet_thermoforms/pet%20thermoform%20test%20for%20adhesives%20and%20labels%20approved.pdf
APR 2011, Protocols to evaluate the impact of adhesives on bottle reclamation systems, http://www.plasticsrecycling.org/ APR 2011, National Mixed Rigid Plastic Bale Composition Study & Analysis of Non-Bottle Rigid Plastic Available for Recycling – Executive summary http://postconsumer1.ipower.com/images/stories/doc/executive_summary_2011_rigids_audit.pdf APR 2011, PET Thermoform Program Operating Procedures, http://postconsumer1.ipower.com/images/documents/pet_thermoforms/apr%20thermoform%20program%20operating%20procedures%20-%20approved.pdf APR 2011, Model Bale Specifications: PET Thermoform, http://postconsumer1.ipower.com/images/stories/doc/pet_thermoform_model_bale_spec.pdf EFBW, UNESDA 2011, Design Guide for PET Bottle Recyclability, http://www.efbw.eu/images/file/Design%20Guide%20for%20PET%20Bottle%20Recyclability_31%20March%202011.pdf European PET Bottle Platform: PET recycling Test Protocol, 2010 http://www.petbottleplatform.eu/ European PET Bottle Platform (EPBP) 2010, Swimming Silicone APTAR Valve Assessment http://www.petbottleplatform.eu/downloads/public/4._APTAR_Food+Beverage_swimming_silicone_valve.pdf European PET Bottle Platform: Sink Float Separation Test Protocol, 2010 http://www.petbottleplatform.eu/ European PET Bottle Platform: Glue Separation Test Protocol, 2010 http://www.petbottleplatform.eu/ European PET Bottle Platform (EPBP) 2010, MXD6 Assessment http://www.petbottleplatform.eu/downloads/public/4._Mitsubishi_Gas_Chemical_MXD6_multilayer_-_opinion.pdf EuPR 2001, Positive glue list, http://www.plasticsrecyclers.eu/ Petcore 2006, Protocol to evaluate the influence of PLA bottles on the clear RPET stream Petcore 2008, http://www.petcore.org/content/02182008-study-made-effect-pla-pet-recycling-stream Petcore 2008, http://www.petcore.org/content/021808-petcore-evaluation-polylactic-acid-pla

Improving food grade rPET quality for use in UK packaging 55
Petcore 2009, http://www.petcore.org/content/09-2009-plaand-its-threat-european-pet-recycle-industry Petcore 2011, Protocol‟s for evaluating barrier materials, is available from Petcore website once registered, www.petcore.org WRAP PET bottle categorisation tool, http://www.wrap.org.uk/content/pet-bottle-categorisation-tool

www.wrap.org.uk/plastics