working paper no. 357 supporting indian farmers: price ... · sap state advised prices te triennium...
TRANSCRIPT

Working Paper No. 357
Supporting Indian Farmers:
Price Support or Direct
Income/Investment Support?
Ashok Gulati
Tirtha Chatterjee
Siraj Hussain
April 2018
INDIAN COUNCIL FOR RESEARCH ON INTERNATIONAL ECONOMIC RELATIONS

Table of Contents
List of Abbreviations ................................................................................................................ i
Acknowledgement .................................................................................................................... ii
Abstract ....................................................................................................................................iii
Executive Summary ................................................................................................................ iv
1. Introduction ........................................................................................................................ 1
2. Towards Price Deficiency Payments (PDP) (Bhavantar Bhugtan Yojana (BBY)) ...... 4
3. Likely Impact of the BBY scheme- An analysis of major crops .................................... 6
4. What if BBY is scaled at national level? ........................................................................ 10
5. Direct Income (Investment) Support based schemes .................................................... 17
6. Concluding Remarks and Policy Implications .............................................................. 21
References ............................................................................................................................... 22
Annexure ................................................................................................................................. 23
List of Tables
Table 1: BBY scheme ............................................................................................................ 4
Table 2: MSP and ASP at Rupees per Quintal announced for the covered crops ................. 5
Table 3: Crop wise details for the BBY scheme kharif 2017-18 ........................................... 9
Table 4: Compensation if scheme is scaled at an all India level (only considering marketed
surplus) ................................................................................................................... 16
List of Figures
Figure 1: Difference between MSP and ASP (%), and share of production actually
compensated ........................................................................................................... 10
Figure 2: Expected Increase in MSPs in 2018-19 over 2017-18 (%) .................................... 12
Figure 3: Crop wise compensation that may be needed under two scenarios (Rs crore) ...... 17
Figure 4: Expenses incurred on target payments and direct input subsidies in China .......... 20

i
List of Abbreviations
ASP Average Sale Price
BBY Bhavantar Bhugtan Yojana
CCE Crop Cutting Experiment
CNY Chinese Yuan
DIS Direct Income/Investment Support
FRP Fair and Remunerative Prices
GDP Gross Domestic Product
GoMP Government of Madhya Pradesh
GoI Government of India
GoK Government of Karnataka
GoT Government of Telangana
GST Goods and Services Tax
MP Madhya Pradesh
MPWLC MP Warehousing & Logistics Corporation
MSP Minimum Support Price
MT Metric Tonne
NPA Non Performing Asset
OECD Organisation for Economic Co-operation and Development
PDP Price Deficiency Payment
SAP State Advised Prices
TE Triennium ending
USD United States Dollars
WSI warehouse storage incentive

ii
Acknowledgement
We are extremely thankful to Secretary, Agriculture and other officers of State Government
of Madhya Pradesh for their help during the course of the research. We are grateful to Mr. C.
Parthasarathi, Agricultural Production Commissioner and Principal Secretary to Government
of Telangana for his insights. We appreciate the help we received from NCDEX Institute of
Commodity Research (NICR) in the earlier stages of the paper. We sincerely thank our two
distinguished reviewers for critically reviewing our paper and giving us very constructive
feedback, which has helped in enriching the paper. Needless to say, the responsibility of
facts, figures, analysis and views expressed in this paper fully rests with the authors.

iii
Abstract
With increasing farm distress in the wake of falling farm prices in 2017, the State Government of
Madhya Pradesh (GoMP) came out with an innovative scheme called Bhavantar Bhugtan Yojana
(BBY), a price deficiency payment (PDP) scheme, to support farmers. It covered eight Kharif
crops in 2017-18 and promised to pay the difference between their minimum support prices
(MSPs) and their market prices (averaged for MP and at least two other adjoining states). The
scheme was abruptly withdrawn in March 2018 just before the commencement of rabi-marketing
season. In this paper we review the scheme, the challenges it posed in its implementation during
kharif 2017-18, but more importantly compute its likely costs, if it is scaled at the national level.
Under the assumption of MSP being equal to 1.5 times A2+FL cost, and excluding the quantum
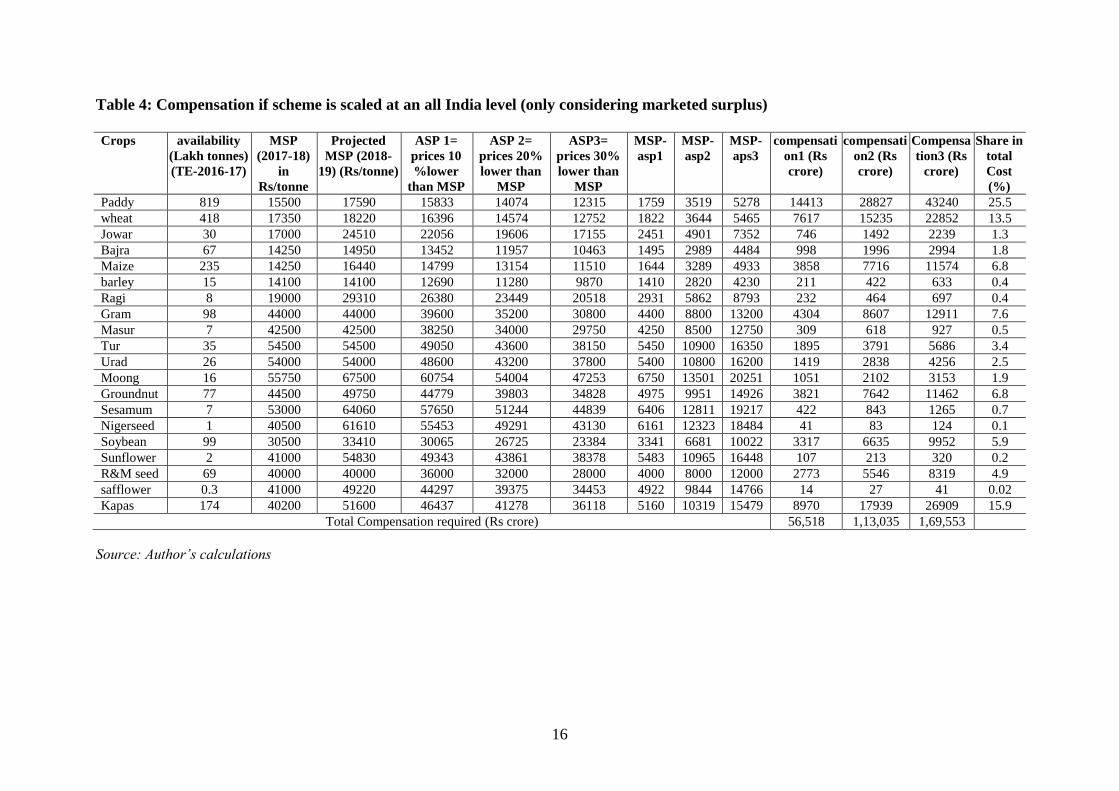
of paddy and wheat procured at MSP and sugarcane at FRP/SAP, we find that compensation of
Rs 56,518 crore will have to be made if market prices are 10 percent lower than MSP, Rs 1.13
lakh crore when market prices are 20 percent lower than MSP and Rs 1.69 lakh crore when prices
are 30 percent lower than MSPs. We find that the scheme is prone to manipulation by traders and
lower level mandi functionaries, and may end up helping them more than the farmers, despite
best intentions of the Government.
We also highlight that MSPs based on cost plus pricing, completely ignoring the demand side,
will lead to major distortions in the agri-marketing system. The resulting efficiency losses may
far exceed the support that government is intending to extend to farmers. Therefore, wisdom lies
in thinking rationally now, and support farmers through less distortionary policies. It may be
through investing heavily in marketing infrastructure, storage and food processing, changing the
APMC Act to allow direct buying from farmer producer organizations (FPOs) bypassing the
archaic mandi system, or direct income (investment) support (DIS) on per hectare basis, as
recently announced by Telangana and Karnataka. DIS is easier to implement, more transparent,
more equitable, crop neutral, and less distortionary than the PDPs/BBY type schemes. DIS, if
launched at the national level will cost Rs 1.97 lakh crore under the assumption that all farmers
get Rs 10,000/ha irrespective of what crops they are growing and whom they are selling. The
cost will be much lower if farmers, who have sold their paddy and wheat at MSP to government
agencies and sugarcane at FRP/SAP to sugar mills, are excluded from this DIS payment. This
would be on comparable basis to the costs under PDP schemes, and yet less distortionary.
_________
Key words: Bhavantar Bhugtan Yojana, Price Deficiency Payment, Direct Income Support,
Madhya Pradesh, Telangana
JEL Classification: Q18, Q13, Q11.
Authors’ email: [email protected]; [email protected]; [email protected]
_________
Disclaimer: Opinions and recommendations in the report are exclusively of the author(s) and not of any
other individual or institution including ICRIER. This report has been prepared in good faith on the basis
of information available as on the date of publication. All interactions and transactions with industry sponsors and their representatives have been transparent and conducted in an open, honest and
independent manner as enshrined in ICRIER Memorandum of Association. ICRIER does not accept any corporate funding that comes with a mandated research area that is not in line with ICRIER’s research
agenda. The corporate funding of an ICRIER activity does not, in any way, imply ICRIER’s endorsement
of the views of the sponsoring organisation or its products or policies. ICRIER does not conduct research that is focused on any specific product or service provided by the corporate sponsor.

iv
Executive Summary
With prices of almost all major kharif crops falling way below announced Minimum Support
Prices (MSPs) in 2017, the farming community is feeling disillusioned and stressed despite
good harvest. Pulses and oilseeds were among the most adversely affected crops. There could
be several reasons driving this fall in prices such as - (1) significant increase in domestic
production; (2) large influx of imports; (3) uncertainty about changes in stocking limits
making traders and other stakeholders hesitant about the market, and (4) turbulence in cash
transactions in trading of these agro-commodities post GST and demonetization.
There have been many attempts by state governments to support farmers through various
policy instruments, ranging from farm loan waivers to PDPs to direct income/investment
support (DIS) on per hectare (ha) basis. PDP based scheme, Bhavantar Bhugtan Yojana
(BBY), covering eight crops was implemented in kharif 2017 in MP while Telangana and
Karnataka plan to implement DIS in Kharif-2018. In this paper we examine the PDP/BBY
scheme of GoMP to ensure remunerative prices to farmers and then work out its potential
costs, if this scheme was to be scaled up to all India level.
The BBY scheme in MP could benefit only 23 percent of production casting a shadow on
how it will benefit majority of farmers if it is scaled up at all India level. Assuming that
somehow a system will be erected to benefit all the production that is marketed and excluding
the Government procurement of wheat and paddy at MSP and sugarcane sold to sugar mills
at FRP/SAP, the financial costs of ramping up BBY/PDP at national level are staggering,
ranging from Rs 56,518 crore to Rs 1.13 lakh crore to Rs 1.69 lakh crore annually, depending
upon if market prices are 10 percent, 20 percent or 30 percent below MSP, respectively. But
bigger costs are likely to be inflicted from massive distortions which this scheme, coupled
with MSP based on 1.5 times the cost A2+FL, would bring about.
This is because the MSP formula based on just cost plus pricing, without any considerations
to the demand side of the commodities and their inter-crop price parity, is likely to play
havoc in the economy causing major distortions to the functioning of markets. Just to give a
feel of the possible situation, MSP of paddy for 2018-19 kharif season will have to go up by
11 to 14 percent, of cotton by 19 to 28 percent, and jowar by 42 to 44 percent, if MSP pricing
is based on 1.5 times the cost A2+FL. Under such a pricing structure, farmers may find it
profitable to allocate more area under jowar and increasing its production significantly. In the
absence of commensurate demand, market prices may fall way below the announced MSP
necessitating large scale procurement at MSP or large outgo through PDP. This would not be
economically very rational. Besides, the BBY is prone to manipulation by traders and several
mandi level functionaries. Since the window for registration and bringing produce to the
market is going to be short, it is likely to depress market prices unduly, with traders
exploiting full advantage of it. The non-registered farmers, especially the small ones who
generally sell their produce at farm gate level to aggregators, would be the worst victims of
these low market prices as they will not get any compensation and yet they would face
unduly low market prices. The resulting efficiency losses, therefore, are likely to be bigger
than the support government may be intending to extend to farmers.

v
A better option may be to go for DIS to farmers on per hectare basis, which would be much
simpler to implement, transparent, crop-neutral and without causing much distortion to the
functioning of markets. This policy of DIS has been announced by Telangana and Karnataka,
and one has to wait and see how it is rolled out and how much will that cost. Telangana is
planning to give Rs 10,000/ha (Rs 4000/acre), per season, to farmers. Karnataka’s plan is
more modest and targeted to only dry land farmers.
If DIS is scaled at the national level, at Rs 10,000 per ha, and for total gross cropped area of
around 1978 lakh ha, total payment will be Rs 1.97 lakh crore. At Rs 5000/ha, it will cost
only half, about Rs 98.5 thousand crore. So, direct income transfer at all India level may not
be cheaper but direct income transfer will not accentuate market distortions and its associated
efficiency losses, and it would be much more inclusive and equitable, as well as transparent.
But if one brings it on comparable basis to PDP by excluding farmers having sold their wheat
and paddy to Govt. agencies, and sugarcane to sugar mills, and those growing non-MSP
crops, the cost of DIS will also drop significantly and would be comparable to PDP. Where
DIS scores over PDP would be that it will not damage the functioning of markets and will not
create massive distortions that may take years to clean up.
Interestingly, China also implements a sort of DIS, which it calls comprehensive input
subsidy scheme which gives an aggregate input support to the farmer on a per acre basis.
Direct payments to grain farmers first started in 2004. In addition, two more schemes, viz.
Agricultural input comprehensive subsidies and seed variety subsidies were launched in
2006. In 2015, Chinese Government combined the three schemes and implemented a pilot of
the single payment scheme. In 2016, it cost the Chinese government USD 21.1 billion
(roughly equal to Rs 1,36,500 crore in Indian currency). Merging all input based subsidy
schemes into one lump sum payment on per ha basis shows that China is gradually moving
towards Direct Income/Investment Support (DIS) or Direct Benefit Transfer (DBT).
No doubt some steps have to be taken before implementing DBT like digitization of plots,
linking them with Aadhaar and bank accounts and tenancy reforms, if possible, among others.
However, since it is less prone to distortion, it will be more sustainable and helpful for Indian
farmers, though it is likely to cost more than PDP, if it is extended at the rate of Rs 10,000/ha
(on lines of Telangana), as it will go much beyond MSP crops. Since the primary objective is
to stabilize farmers’ incomes, the need of the hour is to reach farmers efficiently and at an
appropriate time. Therefore, raising MSPs with no supporting procurement mechanism is
unlikely to mitigate farmers from the supply shocks and price risks. As discussed earlier, this
will only lead to either large PDP or huge procurement costs in case of Government
procurement. We believe that in due course we need to decrease the number of commodities
for which MSPs are announced. One may also argue that with passage of time, MSPs have to
be substituted with Direct Income/Investment Support that will be less distortionary for
Indian agriculture.
1
Supporting Indian Farmers:
Price Support or Direct Income/Investment Support?
Ashok Gulati, Tirtha Chatterjee and Siraj Hussain
1. Introduction
It is being realized that farmers are under increasing stress during last four years. First, there
were two consecutive droughts (2014-15 and 2015-16) and then farm prices of large number
of commodities ranging from pulses to oilseeds fell way below their minimum support prices
(MSPs) in 2016-17 and 2017-18. No wonder, the centre and several state governments are
searching for ways and means to genuinely help farmers. And when it is season of elections,
this topic becomes even more urgent.
It was Prime Minister himself, who had promised to waive-off loans of Uttar Pradesh (UP)
farmers, if BJP was voted to power. Subsequently, in the very first cabinet meeting of the
newly elected government in UP, this promise was fulfilled. That led to increasing demand
for loan waivers in several states, and in many cases (UP in April 2017, Maharashtra and
Karnataka in June 2017, Punjab and Rajasthan in September 2017) these demands were
accepted. The RBI Governor as well as NABARD Chairman, both came out against this
wave of loan waivers saying this will destroy the credit culture in rural areas and will
adversely impact loan recovery in subsequent years. But the main opposition party, Congress,
has been demanding farm loan waivers at all India level, having done so in 2008-09 when
they were in power at the centre.
This paper does not dwell into this type of support to farmers as we feel that loan waivers
cannot solve their problems in any sustainable manner, though it may provide temporary
relief to some farmers. What this paper looks at is the two other alternative modes of
supporting farmers, BBY/PDP has been recently tried by GoMP in kharif 2017, and DIS as
announced by the Government of Telangana (GoT) and Government of Karnataka (GoK) for
the forthcoming kharif of 2018.
As pointed out above, during Kharif 2017-18, market prices of several major Kharif crops fell
way below announced Minimum Support Prices. This happened despite several schemes of
Government of India like procurement at MSP, Market Interventions Schemes, Price Support
Scheme and Price Stabilization Fund to mitigate price risk.
So the first question to ask is: what is responsible for these lower prices in the last couple of
years? And in the light of this, what is the best package for farmers that can protect their
meager incomes. We dig a little deeper to understand the plausible factors driving the
depression in agri-prices. First, we look at the domestic production availability of pulses and
oilseeds which were the most affected crops in the last two years. Production of total pulses
rose considerably from 17 and 16 Million Metric Tonnes (MMT) respectively in 2014-15 and
2015-16 respectively to 23 and 24 MMT respectively in 2016-17 and 2017-18. This is almost
a 44 percent jump. Similarly, oilseed production was also higher at 31 and 30 MMT in 2016-

2
17 and 2017-18 respectively compared to 28 MMT and 25 MMT in 2014-15 and 2015-16,
which was a 24 percent increase in production in 2016-17 over 2015-16.
Despite significantly high domestic production of pulses and oilseeds, there were no efforts to
reduce the flow of imports of pulses and edible oils well in time. For example, 2016-17 saw
record production of pulses (23 MMT) and record imports (6.6 MMT) at zero import duty.
This is what led to a collapse in domestic market prices of pulses. Situation did not improve
much in kharif 2017-18. Lower international prices acted as a catalyst leading to influx in
imports. It was only in November, 2017 when import duty on yellow peas was raised from
zero to 50 percent, and in December, 2017 import duties on chana and masoor were raised
from zero to 30 percent. Similarly, it was only in November 2017 that import duty on crude
palm oil was raised from 15 percent to 30 percent, and refined palm oil from 25 to 40 percent,
and refined soya oil from 20 to 35 percent. These restrictions on imports in the form of high
import duties came too late, as massive imports had already taken place by then, and as a
result, farmers had to face rapidly declining prices of pulses and oilseeds. What all this
implies is that the trade policies have to be effectively dovetailed with domestic MSP policy
ensuring that large scale imports are not coming into country at prices way below MSP.
Another reason which seems to be driving the decline in prices is the stocking limits imposed
and the uncertainty surrounding that. Traders and other stakeholders are not comfortable
holding stocks because of this uncertainty of stocking limits. GST and demonetization in July
2017 and November 2016 made the situation worse for agri-trade transactions, which are
generally cash based but the new rules don’t permit large scale cash transactions. So traders
are wary to enter markets in a big way, leaving a larger glut in the market. Against this
background, in this paper we evaluate the schemes implemented to compensate the farmers
for price loss when market prices dip below MSP. Bhavantar Bhugtan Yojana (BBY) was
launched by GoMP in Kharif 2017. This is a PDP based scheme which covered eight Kharif
crops, namely, maize, tur, urad, moong, soybean, groundnut, sesamum, and nigerseed. The
difference between MSP and the Average Sale Price (ASP) is supposed to be given to the
farmer, where ASP was calculated by taking the average modal prices in mandis in MP and
two other reference states. We discuss the scheme in detail in Section 2.
It is interesting to note that agricultural growth has made rapid strides in MP. Gulati et al
(2017) find that agriculture growth in Madhya Pradesh (MP) during the decade of 2005-06 to
2014-15 was around 9.7 percent per annum, which is the highest growth rate registered in
agriculture by any major state of India over a ten year period. They find that the last five
years have been even more spectacular when agricultural GDP grew at 14.2 percent per
annum. The study finds that among several measures taken by the state government to make
rapid strides in agriculture, three interventions stand out – road infrastructure, expanded
irrigation and a strong procurement system put in place for wheat along with bonus over MSP
for wheat.
Despite such high growth in agricultural production, the state has not been able to protect its
farmers from price risks. In 2017-18 mandi prices of several crops have been below their
respective MSPs announced by the Central Government. For example, average modal price in

3
Madhya Pradesh for soybean was Rs 2594 per quintal between 16th October and 31st
December which was approximately 15 percent lower than the announced MSP of Rs 3050
per quintal; for urad, the prevailing mandi modal price was Rs 2601 per quintal between 16th
October and 22nd December in Madhya Pradesh which was 52 percent lower than the
announced MSP of Rs 5400 per quintal. And so on. What this presumably points out to is the
mismatch in the outcomes of production augmenting policies and agri-marketing policies.
Unprecedented increases in production led to market crash and tumbling prices as storage and
processing facilities were not commensurably augmented.
We evaluate BBY in MP in terms of its impact on market arrivals, mandi prices, its coverage
and reach among farmers and share of produce covered by the scheme. Our review shows
that the scheme had at best limited coverage and less than a quarter of the entire produce of
the state was compensated. We also study the impact of the scheme if it is launched at the
national level. We compute costs for three scenarios- one, market prices are 10 percent below
MSP, two, when prices are 20 percent below MSP and three, when prices are 30 percent
below MSPs and find that it will cost Rs 56518 crore in the first, Rs 1.13 lakh crore in the
second and Rs 1.69 lakh crore in the third scenario.
Our review shows that PDP, rather than correcting the market, might distort it further. The
higher cost plus pricing (1.5 times A2+FL costs) model for MSP which ignores demand side
will lead to large scale distortions in the system with high efficiency losses. In contrast, the
GoT and GoK plan to launch Direct Income/Investment Support (DIS), either as input
support scheme or income support on per ha basis for both the seasons of Kharif and Rabi in
2018-19.
It is interesting to note that DIS has been in practice in China which gives an aggregate input
support to the farmer on a per acre basis. DIS based schemes do not distort markets as would
be experienced in case of price deficiency schemes. Such a scheme will be more equitable,
inclusive, will not involve unnecessary paperwork, reduce the role of intermediaries, and will
not distort the market by artificially depressing prices. There are a few steps which can make
it beneficial for tenant farmers also. For this the tenancy laws have to be revamped, plots
have to be digitized and farmer’s Aadhaar number linked for easy payment. If these steps are
taken, direct benefit transfer through a DIS type scheme seems to be the way forward.
Since, the objective is to stabilize their incomes and reach them at the earliest possible time
and in the most efficient manner, a DIS based approach would be more preferable. As
recommended by CACP in 2014-15 Kharif report, a review of the number of crops under the
commission’s mandate is urgently required. Since, procurement infrastructure is not
developed for most commodities other than rice and wheat, announcing high MSPs is
unlikely to yield any positive impact in the current scenario. The paper recommends that in
due course, like China, comprehensive DIS based schemes should replace other schemes.
The paper is organized as follows: We first describe the BBY scheme in Section 2. We
discuss the coverage of the scheme in terms of farmers registered, production covered in
Section 3. We also compute the total cost of the scheme if it covered all the produce of the

4
state. In Section 4, we discuss the cost of the scheme if it is scaled at an All India level. In
section 5 we compare the scheme with DBTs and conclude in section 6.
2. Towards Price Deficiency Payments (PDP) (Bhavantar Bhugtan Yojana (BBY))
Bhavatar Bhugtan Yojana (BBY), introduced by GoMP in September 2017 covered eight
Kharif crops (Table 1). As per the scheme, the farmer selling his produce in the notified
APMC yard will be directly paid the difference between the MSP and the average sale price
(ASP) where ASP is the average of the prevailing modal mandi prices in MP and two other
states (Table 1).
Table 1: BBY scheme
S. No. Crop Time period for sale
under BBY
Name of two states, (other than MP) of
which model wholesale rates to be
considered Oilseed Crops
1 Soybean October 16 – December 31 Maharashtra, Rajasthan
2 Groundnut October 16 – December 15 Gujarat, Rajasthan 3 Sesamum October 16 – December 15 Odisha, Chhattisgarh
4 Ramtil October 16 – December 15 West Bengal, Rajasthan
Food Crops 5 Maize October 16 – January 31 Karnataka, Maharashtra
Pulses 6 Moong October 16 – December 15 Rajasthan, Maharashtra
7 Urad October 16 – December 15 Rajasthan, Uttar Pradesh 8 Tur February 01 – April 30 Maharashtra, Gujarat
Source: Government of Madhya Pradesh
The scheme also includes a warehouse storage incentive (WSI) for a registered farmer who
does not sell his produce during the notified period and instead decides to keep his produce in
a registered warehouse. The warehouse has to be registered with MP Warehousing &
Logistics Corporation (MPWLC). The WSI has been declared at the rate of Rs 9.90 per
quintal per month. Since the time window available to the farmers for the BBY scheme is
limited and the farmers might want to hold their stock during the initial months in
anticipation of better prices later, this initiative, if efficiently implemented, will somewhat
shield farmers from lower prices.
Determination of Average Sale Price- ASP was calculated for the specified crops in the
following manner- (1) Weighted Modal wholesale price for the crops in the APMCs of
Madhya Pradesh are collected from the agmarknet portal. (2) Weighted Modal wholesale
prices of the same crops as appeared in agmarknet portal for other two states and (3) ASP is
average of the above three modal (wholesale) prices. MSP and the announced ASP for the
selected crops during the different time periods during the BBY scheme are given in Table 2.

5
Table 2: MSP and ASP at Rupees per Quintal announced for the covered crops
16 Oct-31 Oct 2017 01 Nov- 30 Nov 2017 01 Dec to 31 Dec 2017
Crop MSP ASP Difference ASP Difference ASP Difference
Maize 1425 1190 235 1110 315 1127 298
Soybean 3050 2580 470 2640 410 2829 221
Moong 5575 4120 1455 4120 1455 4522 1053
Urad 5400 3000 2400 3070 2330 3291 2109
Groundnut 4450 3720 730 3570 880 3605 845
Source: State Government of Madhya Pradesh
This price deficiency payment mechanism comes into action only if ASP is below MSP. No
payments are to be done in case ASP is at par or more than MSP. The price deficiency
payment would be made to the farmer’s bank account for the quantity traded in the APMC
which is up to the maximum limit of his expected production. The expected production is
calculated on the basis of sown area given by farmer at the time of registration (verified by
the revenue department) and average productivity of the district of that crop. The average
productivity of a crop was calculated for best three years out of 5 preceding years as per Crop
Cutting Experiments (CCEs) carried out by the Revenue Department. In any agro-climatic
zone, best figure of a district compared to others in that agro-climatic zone were considered
as average productivity for all other districts falling in the same agro-climatic zone.
The payments in the farmers bank accounts through Direct Benefit Transfer would be done
by headquarter APMC after verification and confirmation by a committee headed by the
District Collector as per following formula:-
If the sale price of the produce at the APMC >= MSP, no benefit would be paid
If ASP < the sale price of agriculture produce at the APMC < MSP, benefit = MSP-
sale price of the farmer.
If the sale price of agriculture produce sold in the APMC < ASP<MSP, benefit =
MSP -ASP.
Registration of farmers and payment mechanism-To get benefit of the scheme, a farmer
has to register on the BBY portal specifically developed for this purpose within the stipulated
time at registration centers run by 3,500 PACS and 257 APMCs. The farmers were required
to compulsorily furnish Aadhaar Number, Bank account details and mobile number on portal
at the time of registration. Every farmer was allotted a unique registration number (URN).
Farmers were also informed of the URN through SMS on their registered mobile number.
The registration data pertaining to sown area is to be verified by the revenue officials in the
field. It is mandatory for farmers to trade agriculture produce in the notified APMC campus
within the time period declared for sale. The payment of BBY is to be done directly into
beneficiary farmers bank accounts.

6
The APMCs are supposed to carry out the sale of the crop produce as per their rules. The
farmers have to provide the URN generated during registration on BBY portal after the
auction of produce in APMC. Nominated officials of APMC have to record the URN along
with quantity of sale and rate of sale on Agreement Slip, Weight Slip and Payment slip after
the completion of the auction. APMCs are directed to upload details of the agriculture
produce, its daily arrival and rate on the agmarknet portal of Government of India after
closure of the auction process every day by 6.00 pm. The entries of Agreement Slip, Weight
Slip and Payment slip are to be then uploaded against the URN of the farmers on the
Bhavantar Bhugtan Yojana (BBY) portal. It has been directed to upload details of registered
farmers' transactions only after the payment by the licensee trader to the farmer has been
made. The sale carried out using Trade Receipt (where the whole stock is not brought in the
APMC yard and the auction happens only on the basis of sample) was not considered valid
for the purpose of Bhavantar Bhugtan Yojana (BBY) scheme. The amount payable to a
farmer is to be transferred to his/her bank account registered on BBY portal at the time of
registration.
3. Likely Impact of the BBY scheme- An analysis of major crops
The scheme covered eight Kharif crops, maize, urad, moong, tur, soybean, groundnut,
sesamum and nigerseed. In all, 21 lakh farmers registered under the scheme. Out of the total
97 lakh Hectares of area under these eight crops in MP, 43 lakh ha (45 percent) was
registered under the scheme in Kharif 2017. The cost incurred by the state Government to
compensate the registered produce (including tur) is expected to be around Rs 1944 crore1. In
this section, we analyse the impact of the scheme by comparing production, market arrivals
and prices of commodities covered under the BBY scheme on a crop by crop basis (Table 3).
We also compare data on production, market arrivals and mandi prices for the previous five
years for each crop in this section. This gives us a better understanding of the impact of the
scheme launched in 2017-18 vis-a-vis earlier years. Detailed Tables for each crop are given
in Annexure Tables 1 to 8.
Maize- 2.99 lakh maize farmers registered with the scheme. They form approximately 14
percent of the total farmers registered under the scheme. Overall 13.17 lakh ha was the total
cropped area under maize in MP. Out of which only 4.41 lakh ha (33 percent) was registered
under the scheme. Total production of maize was recorded at 49.1 lakh MT and out of which
5.5 lakh MT was the mandi arrivals. Therefore only 11.1 percent of the total produce was
compensated. Annexure Table 1 shows that average mandi modal prices in MP are lower
than that recorded in Karnataka and Maharashtra. Total compensation made under BBY was
Rs 154 crore. However, total value of compensation would have been Rs 1388 crore, if entire
produce was compensated (Table-3).
Urad- In total, 6.15 lakh urad farmers registered with the scheme. They form 28 percent of
the total farmers registered under the scheme. Overall 17.89 lakh ha was the total cropped
______________________ 1 This includes the expected compensation for tur

7
area under urad. Out of which 11.98 lakh ha (67 percent) was registered under the scheme.
Total urad production was recorded as 17.71 lakh MT. But only 5.69 lakh MT of market
arrivals was registered and compensated under the scheme, i.e., 32.1 percent of the total
produce in the state was compensated. Annexure Table 2 shows that the fall in prices was the
maximum for urad. Highest increase in both production and mandi arrivals (95 percent and
650 percent) was seen in 2014-15 but unlike 2017-18, prices rose during that period. Thus,
under BBY, only 32 percent of urad production was compensated. The total compensation
would have been Rs 4037 crore, if entire production was compensated for the price difference
(Table-3).
Moong- Only 13,700 farmers registered for the scheme in Kharif 2017. They form
approximately 1 percent of the total number of farmers who registered for the scheme. Out of
2.28 lakh ha of area under moong, only 0.13 lakh ha (6 percent) was registered for the
scheme. Total moong production was 1.6 lakh MT in Kharif 2017-18. Annexure Table 3
shows that production, market arrivals and mandi prices fell in MP this year by 45 percent, 50
percent and 14 percent respectively compared to 2016-17. Only 1.3 percent of the total
production was compensated by the scheme. Total compensation paid was only Rs 3 crore.
This shows extremely poor coverage of the scheme, which may be due to various factors.
Further, if the scheme was fully inclusive and if entire production was brought to the mandis,
the total compensation would have been Rs 216 crore instead of a meagre amount of Rs 3
crore actually paid (Table-3).
Soybean- Soybean is one of the most dominant kharif crops of MP. In total, 10.59 lakh
soybean farmers registered with the scheme. They form 48 percent of the total farmers
registered under the scheme. Overall 50 lakh ha was the total cropped area under soybean,
but only 25 lakh ha (50 percent) was registered under the scheme. Out of total soybean
production of 69.4 lakh MT, only 12.84 lakh MT of produce (18.5 percent) was compensated
by the scheme despite the fact that modal price in MP was 2594/quintal vis-à-vis an MSP of
Rs 3050/quintal (Annexure Table 4). Market prices of soybean in both Maharashtra and
Rajasthan were a tad higher compared to that in MP. Total compensation actually made was
Rs 471 crore, while it would have been Rs 2547 crore if entire produce was brought under the
scheme (Table-3).
Groundnut- Overall 42,000 farmers registered for the scheme, which forms approximately 2
percent of the total farmers registered under the scheme. Out of 2.18 lakh ha of area under
groundnut in Kharif 2017-18, only 0.46 lakh ha was registered. Total groundnut production
recorded was 3.46 lakh MT. An amount of Rs 11 crore was paid as compensation which was
for just 4 percent of total groundnut production in the state. Had the entire produce been
compensated, the total compensation would have been Rs 283 crore (Table-3). Annexure
Table 5 shows that total production fell in MP compared to that last year. Prices in Madhya
Pradesh fell by 18 percent this year compared to that of last year. Mandi prices in MP were
17 percent and 5 percent lower respectively compared to the two reference states of Gujarat
and Rajasthan.

8
Tur, Sesasum and Nigerseed- We discuss tur, sesamum and nigerseeed together since no
payment have been done against these crops. For sesamum and nigerseed, the average sale
price was higher than MSP and data for tur is not available yet as the scheme was to start
from 1st of February, 2018.
In case of tur, 1.13 lakh farmers registered for tur under the scheme. This forms
approximately 5 percent of the total farmers who registered under the scheme. Out of total
cropped area of 6.5 lakh ha under tur, only 1 lakh ha was registered. Annexure Table- 8
shows that production is expected to rise in 2017-18 compared to that of the previous year.
Sesamum- For sesamum, 41,900 farmers registered under the BBY scheme, which formed 2
percent of the total farmers registered under the scheme. The total cropped area was 4 lakh
ha, out of which only 0.4 Lakh ha was registered. Only 0.4 percent of the total production of
sesamum in MP was registered under the scheme. Annexure Table 6 shows that production in
MP fell by 2 percent in 2017-18 while there was an enormous increase in market arrivals by
822 percent. Prices increased by 17 percent in 2017-18 compared to previous year. While
there was no data available for sesamum prices in Odisha, prices in mandis of Chhattisgarh
show that they were lower than MP by 4 percent in 2017-18.
Nigerseed- In case of Niger seed, 3505 farmers registered who form less than 1 percent of
the total farmers registered under the scheme. The total cropped area was 0.6 lakh ha, out of
which 0.04 lakh ha was registered under the scheme. Annexure Table 7 shows that
production in MP fell by 7 percent in 2017-18 while market arrivals were lower by 16 percent
in 2017-18 compared to 2016-17. Prices have been declining in the last two years. No
compensation was made for nigerseed as prices were higher than that of MSP announced.
Only 0.1 percent of the produce was registered under the scheme.
Total Cost incurred - According to the GoMP, total expected expenditure incurred under the
BBY scheme during the entire phase was Rs 1944 crore. This includes compensation for
soybean, groundnut, maize, moong, urad and expected compensations for tur in February,
2018. We compute the cost of the scheme if the entire produce was registered and brought to
the market for sale. The expenses equal the product of the difference between the ASP and
the MSP and production registered under the scheme. Table 3 shows that the total cost of
compensation would have been Rs 8478 crore, and not Rs 1944 crore, if the Government had
compensated entire production which was sold at the price lower than the MSP.
Thus, the value of compensation actually paid by the GoMP was less than 25 percent of the
total compensation that would have been paid if the scheme covered all the produce marketed
below MSP. It is clear that a large number of farmers did not register themselves on the portal
and they therefore had to sell their produce at prices which were lower than that of the
announced MSPs. Figure 1 below presents the percentage of the produce covered and
compensation made together. It shows that despite high differences between ASP and MSP,
only a small share of the total produce was registered and hence compensated under the
scheme. For example, despite ASPs being 42 percent lower than that of the announced MSP,

9
only 32 percent of the total urad produced was compensated. We find that difference between
MSP and ASP for soybean was 12 percent but only 18.5 percent was compensated.
Table 3: Crop wise details for the BBY scheme kharif 2017-18
crops Maize Urad Moong Tur Soybean Groundnut Sesamum Nigerseed
Production (Lakh MT) 49.1 17.71 1.6 8 69.4 3.46 2 0.25
Registered Production
(lakh MT) 13.89 8.1 0.09 1.38 38.91 0.87 0.38 0.02
Registered market arrivals
(Lakh MT) 5.45 5.69 0.02 NA 12.84 0.14 0.001 0.001
Mandi Prices in MP (Rs/
quintal) 1090 2582 3594
2594
No. of registered farmers
(Lakhs) 2.99 6.15 0.14 1.13 10.59 0.43 0.42 0.04
Total cropped area (Lakh
ha) 13.17 17.89 2.28 6.47 50.1 2.18 4.24 0.61
Registered area (Lakh ha) 4.41 11.98 0.13 1.17 24.86 0.46 0.38 0.04
Compensation actually
paid (Rs crore) 154 1297 3 NA 471 11 0 0
Compensation that would
have been paid if entire
produce was to be covered
under BBY (Rs crore)
1388 4037 216 NA 2547 283 0 0
Total compensation that
could have been paid for
all crops
Rs 8470 crore
Source: Authors’ computation based on data from agmarknet portal (accessed on 13th February,
2018), DES and State Government of Madhya Pradesh

10
Figure 1: Difference between MSP and ASP (%), and share of production actually
compensated
Source: Compiled by authors based on information obtained from GoMP.
What all this indicates is that the BBY scheme for kharif 2017-18 had a very limited reach.
Given that the features of the scheme are extremely attractive and farmers are assured that
they will receive the announced MSP irrespective of the prevailing mandi prices, it was
expected that all produce in the state would be registered under the scheme. But obviously
that did not happen. This low level of participation only goes to show that there are several
obstacles which might have come on the way of a farmer registering himself. For example,
extensive paper work was required on the part of the farmer in terms of registration,
submission of documents etc. All these are mandatory for him to avail the benefits of the
scheme. It must have been difficult, confusing, time consuming and expensive for the farmer.
At the time of sowing, the small and marginal farmers would have found it too cumbersome
to register. Also, the short time window of the scheme might not have given him enough time
to register himself.
It is also conceivable that market prices were more depressed than the counterfactual scenario
with no scheme in place. This could have been because of the small window when it was
mandatory for all the produce to be sold in the mandis and also because of manipulative
practices of traders and lower level bureaucracy. Therefore, it is plausible that losses borne by
the farmer who did not register for the scheme were more than the counterfactual scenario
because of both depressed prices and lack of compensation.
4. What if BBY is scaled at national level?
The 3 year action agenda formulated by Niti Aayog in August 2017 recommends price
deficiency payment (PDP) to mitigate price risk2. It suggests that PDP schemes will be
beneficial as it would not require procurement and therefore prevent accumulation of
unwanted stocks. If the scheme is scaled at an all India level, it will cover all crops which are
______________________ 2 http://niti.gov.in/writereaddata/files/coop/IndiaActionPlan.pdf (Page 28)
32.1
18.511.1
4.0 1.2
-42.2
-12.0-19.8 -18.4
-23.7
-60.0
-40.0
-20.0
0.0
20.0
40.0
Urad Soybean Maize Groundnut Moong
Pe
rce
nta
ge o
f to
tal
pro
du
ctio
n c
om
pe
nsa
ted
by
BB
Y a
nd
Dif
fere
nce
be
twe
en
A
vera
ge A
SP a
nd
MSP
% of total production compensated by BBY % difference of ASP wrt MSP

11
brought to the mandi for sale and do not receive MSPs announced by the Central
Government. In this section, we estimate the cost which the exchequer will have to bear if the
scheme is launched at the national level. Two possible scenarios can be expected- First, half-
baked implementation of the scheme. Here, the scheme will not cost a lot, on papers, one can
say that the scheme was offered but nothing much will change on ground. However, this will
also not address the farm distress. Second, where the scheme is well targeted and efficiently
implemented. The costs computed here are for the second scenario. These costs can be
assumed to be somewhat conservative as they are based on previous years’ marketed surplus
estimates. However with implementation of BBY for a narrow period of say 2-3 months,
market arrivals are likely to increase more than usual, and therefore the market prices may get
depressed even further. Traders are likely to take full advantage of that situation, widening
the gap between market prices and MSP. Thus, in reality, if the scheme is fully implemented,
it won’t be a surprise if the costs even cross the estimates being presented here.
Our study includes all crops for which MSPs are announced by the Government of India.
They are paddy, wheat, jowar, bajra, barley, ragi among cereals, gram, masur, tur, moong and
urad among pulses and groundnut, soybean, sesamum, nigerseed, sunflower, rape and
mustard seed and safflower among oilseeds. Besides these, we also have cash crops like
cotton (kapas). Our current estimates of costs have been computed by multiplying net
available quantity with the price difference between projected MSP and projected sale prices.
The steps used to compute the projected MSPs, net availability and compensation under the
BBY scheme are reported in detail in Annexure Table 9.
We first project MSP for 2018-19. The A2+FL costs published by Commission for
Agricultural Costs and Prices for Kharif crops are collected from Kharif reports for marketing
year 2017-18. For Rabi crops, same are taken from Rabi reports for marketing year 2018-19.
We first project A2+FL costs for 2018-19 by increasing the A2+FL costs for 2017-18 by 5
percent. We believe that this will cover annual increase in cost of inputs like seed, diesel,
pesticides, labour etc. As announced by Finance Minister in his budget speech on 1st
February 2018, the projected MSPs for 2018-19 are calculated by increasing the projected
A2+FL costs by 50 percent. The MSP projections and the difference between the projected
MSP for 2018-19 and actual MSP for 2017-18 are given in Annexure Table 10.
The expected increase in MSPs in 2018-19 over 2017-18 is given in Figure 2. Along with
A2+FL costs, we also present MSPs projected on the basis of C2 cost plus pricing in Figure
2. We find that this A2+FL cost plus pricing of MSPs will mean that present MSPs will have
to raised by more than 40 percent for jowar, nigerseed and ragi, between 15 and 35 percent
for maize, cotton, safflower, sesamum, moong, and sunflower and between 10 to 15 percent
for paddy, groundnut and soybean.

12
Figure 2: Expected Increase in MSPs in 2018-19 over 2017-18 (%)
Note- Sorted in ascending order of A2+FL costs Source: Authors' calculations
It must be noted that cost plus pricing which completely ignores demand side will lead to
major distortions in the system. For example, we find that jowar prices need to go up by 42 to
44 percent according to the proposed 50 percent margin over projected A2+FL costs.
Therefore, relative to other crops, farmers will find it more attractive to increase area under
jowar and its production will increase. Higher supply without any commensurate change on
the demand side cannot sustain high MSP, and the market prices will go way below that
MSP, thus requiring either large scale procurement by the government at MSP or huge price
deficiency payments. Similarly, higher cotton and paddy MSPs will have a negative impact
on their competitiveness in global markets adversely impacting India’s exports of these
commodities. This in turn will cause a glut in domestic markets, necessitating massive
procurement operations or large scale price deficiency payments. That’s why the Terms of
Reference of Commission for Agricultural Costs and Prices (CACP) requires it to consider
several factors before recommending MSPs like demand and supply, prices in domestic and
international markets, cost of production, inter crop price parity, terms of trade and its impact
on inflation and downstream industries. Therefore, only cost plus pricing (1.5 times the cost
A2+FL), which ignores the demand side completely will lead to large scale distortions in the
system with high efficiency losses. It is, thus, not an economically rationale decision. We
discuss the plausible impact of enhanced MSPs on paddy in Box-1.
0 0 0 0 0 0 05 5
10 11 12 14 1519 20 21 21
2834
42 4452 54
22 25 2632 33 33
38 41
14
51 47 4551 54
6053
7061
71 74
91 94 99 95
0
10
20
30
40
50
60
70
80
90
100
R &
M s
eed
Suga
rcan
e
Gra
m
Ura
d
Bar
ley
Tur
Len
til
Baj
ra
Wh
eat
Soyb
ean
Pad
dy
Gra
de
A
Gro
un
d n
ut
Pad
dy
com
mo
n
Mai
ze
Co
tto
n L
on
g st
aple
Saff
low
er
Sesa
mu
m
Mo
on
g
Co
tto
n M
ed
ium
Sta
ple
Sun
flo
wer
Jow
ar M
ald
and
i
Jow
ar H
ybri
d
Nig
ers
eed
Rag
i
% in
cre
ase
in p
roje
cte
d M
SP
Based on A2+FL cost Based on C2 cost
13
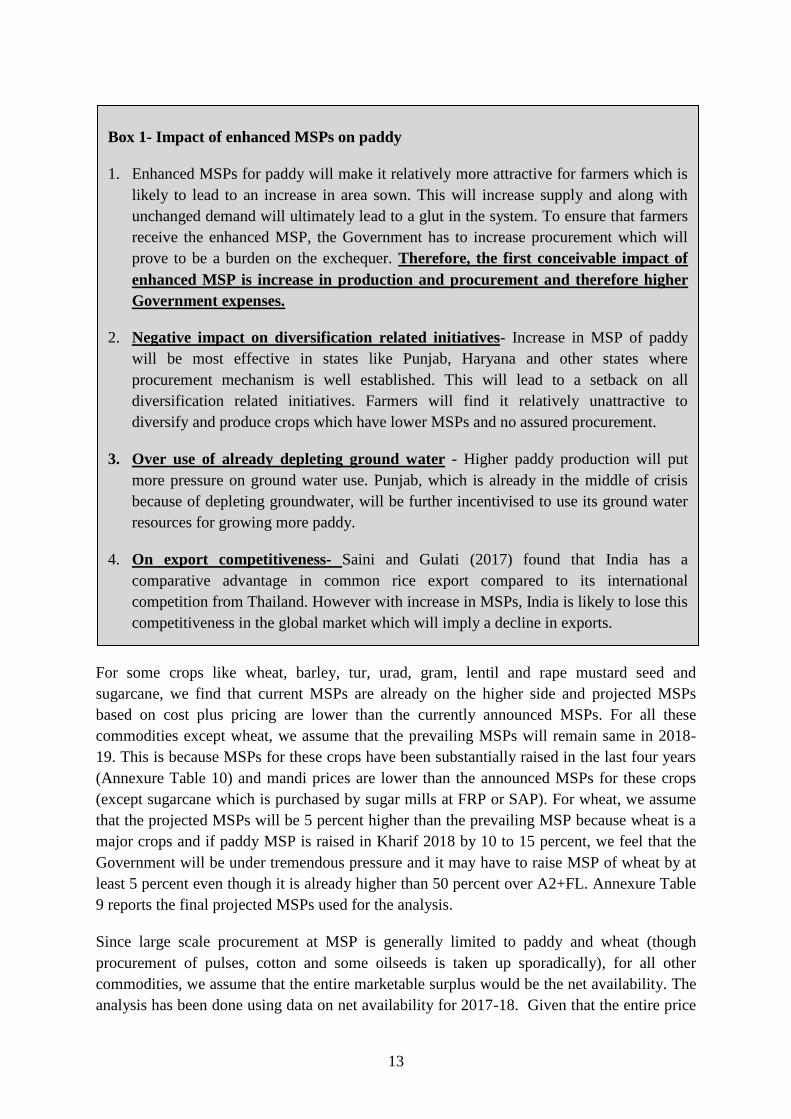
For some crops like wheat, barley, tur, urad, gram, lentil and rape mustard seed and
sugarcane, we find that current MSPs are already on the higher side and projected MSPs
based on cost plus pricing are lower than the currently announced MSPs. For all these
commodities except wheat, we assume that the prevailing MSPs will remain same in 2018-
19. This is because MSPs for these crops have been substantially raised in the last four years
(Annexure Table 10) and mandi prices are lower than the announced MSPs for these crops
(except sugarcane which is purchased by sugar mills at FRP or SAP). For wheat, we assume
that the projected MSPs will be 5 percent higher than the prevailing MSP because wheat is a
major crops and if paddy MSP is raised in Kharif 2018 by 10 to 15 percent, we feel that the
Government will be under tremendous pressure and it may have to raise MSP of wheat by at
least 5 percent even though it is already higher than 50 percent over A2+FL. Annexure Table
9 reports the final projected MSPs used for the analysis.
Since large scale procurement at MSP is generally limited to paddy and wheat (though
procurement of pulses, cotton and some oilseeds is taken up sporadically), for all other
commodities, we assume that the entire marketable surplus would be the net availability. The
analysis has been done using data on net availability for 2017-18. Given that the entire price
Box 1- Impact of enhanced MSPs on paddy
1. Enhanced MSPs for paddy will make it relatively more attractive for farmers which is
likely to lead to an increase in area sown. This will increase supply and along with
unchanged demand will ultimately lead to a glut in the system. To ensure that farmers
receive the enhanced MSP, the Government has to increase procurement which will
prove to be a burden on the exchequer. Therefore, the first conceivable impact of
enhanced MSP is increase in production and procurement and therefore higher
Government expenses.
2. Negative impact on diversification related initiatives- Increase in MSP of paddy
will be most effective in states like Punjab, Haryana and other states where
procurement mechanism is well established. This will lead to a setback on all
diversification related initiatives. Farmers will find it relatively unattractive to
diversify and produce crops which have lower MSPs and no assured procurement.
3. Over use of already depleting ground water - Higher paddy production will put
more pressure on ground water use. Punjab, which is already in the middle of crisis
because of depleting groundwater, will be further incentivised to use its ground water
resources for growing more paddy.
4. On export competitiveness- Saini and Gulati (2017) found that India has a
comparative advantage in common rice export compared to its international
competition from Thailand. However with increase in MSPs, India is likely to lose this
competitiveness in the global market which will imply a decline in exports.

14
difference between MSP and mandi sale price will be compensated under a PDP type
scheme, it is likely that marketable surplus will be higher than that used in the analysis and
almost entire produce may be brought by the farmers to the market. So, as discussed earlier,
the current analysis may be seen as a conservative estimate of the total cost incurred by the
exchequer for the scheme.
Net availability for paddy is calculated by deducting procurement, basmati rice production
and export from marketable surplus. Average of Marketed Surplus Ratio (MSR) for TE-
2014-153 has been used to compute marketable surplus for 2017-18. For wheat, we deduct the
procurement for 2017-18 from the marketed surplus while for other commodities, net
availability is assumed to be equal to the marketed surplus. The calculation for net
availability for all crops is given in Annexure Tables 12. Net availability of rice and cotton
are converted to paddy and kapas using the formula given in Annexure Table 9 as MSPs are
announced for paddy and kapas (raw cotton with seed).
Three scenarios have been constructed for calculation of total compensation-
a. When average sale prices are 10 percent below projected MSP for 2018-19
b. When average sale prices are 20 percent below projected MSP for 2018-19
c. When average sale prices are 30 percent below projected MSP for 2018-19
We compute the difference between the MSPs and the average sale prices in the three
scenarios. This will be the compensation for each quintal of the produce brought to the
market. As reported in Table-4, we find that in the first scenario, when mandi prices are
assumed to be 10 percent lower than MSP, the total cost which the centre will have to bear
will be Rs 56,518 crore while in the second scenario, when the MSP has been assumed to be
20 percent lower, the total cost will touch Rs1,13,035 crore. In the third scenario, when
market prices are assumed to be 30 percent lower than MSPs, the costs are Rs1,69,553 crore.
The highest compensation will be for paddy (25.5 percent), wheat (13.5 percent) and kapas
(15.9 percent). Figure 3 gives the crop wise compensation.
Our analysis does not include sugarcane since Fair and Remunerative Prices (FRP) or State
Advised Prices (SAP) is actually paid by sugar mills and not by the Government.
Government of India (GOI) fixes FRP of sugarcane, based on the recommendations of the
Commission (CACP). Some states like UP announce SAP which is higher than the
recommended FRPs. Sugar mills have to bear the burden whenever sugar prices plummet.
They have to pay the announced FRP/SAP for the sugarcane they buy from the farmers and
in return realize low prices for sugar. Therefore, the sugar mills are compelled by the State
Governments to subsidize the farmers leading to huge sugar cane arrears. This makes them
sick and loss making. Rangarajan Committee report on the Regulation of Sugar Sector in
______________________ 3 2014-15 is the latest year for which MSR are available

15
India (2012) recommended that 75 percent of the revenue generated from sugar (ex-mill
value of sugar) must be paid to the farmer for the sugarcane supplied and suggested that
states must do away with SAPs as they are distortionary. Logically, the state governments
must bear the burden and create a price stabilization fund and allocate funds from its budget
for payment to farmers in years when sugar prices fall. In years of depressed sugar prices, this
fund could be used to fulfill the gap between what mill owners can pay to farmers and the
FRP or SAP. This is akin to a Price Deficiency Payment scheme.
In case the state Governments decide to pay the price differences to sugarcane farmers, the
total cost of the scheme will be even higher and rise to Rs 65,525 crore in case prices are 10
percent below the projected MSPs and Rs 1,31,050 crore when sale prices are 20 percent
below projected MSPs and Rs 1,96,575 crore when prices are 30 percent lower than
MSP/FRP/SAP
16
Table 4: Compensation if scheme is scaled at an all India level (only considering marketed surplus)
Crops availability
(Lakh tonnes)
(TE-2016-17)
MSP
(2017-18)
in
Rs/tonne
Projected
MSP (2018-
19) (Rs/tonne)
ASP 1=
prices 10
%lower
than MSP
ASP 2=
prices 20%
lower than
MSP
ASP3=
prices 30%
lower than
MSP
MSP-
asp1
MSP-
asp2
MSP-
aps3
compensati
on1 (Rs
crore)
compensati
on2 (Rs
crore)
Compensa
tion3 (Rs
crore)
Share in
total
Cost
(%)
Paddy 819 15500 17590 15833 14074 12315 1759 3519 5278 14413 28827 43240 25.5
wheat 418 17350 18220 16396 14574 12752 1822 3644 5465 7617 15235 22852 13.5
Jowar 30 17000 24510 22056 19606 17155 2451 4901 7352 746 1492 2239 1.3
Bajra 67 14250 14950 13452 11957 10463 1495 2989 4484 998 1996 2994 1.8
Maize 235 14250 16440 14799 13154 11510 1644 3289 4933 3858 7716 11574 6.8
barley 15 14100 14100 12690 11280 9870 1410 2820 4230 211 422 633 0.4
Ragi 8 19000 29310 26380 23449 20518 2931 5862 8793 232 464 697 0.4
Gram 98 44000 44000 39600 35200 30800 4400 8800 13200 4304 8607 12911 7.6
Masur 7 42500 42500 38250 34000 29750 4250 8500 12750 309 618 927 0.5
Tur 35 54500 54500 49050 43600 38150 5450 10900 16350 1895 3791 5686 3.4
Urad 26 54000 54000 48600 43200 37800 5400 10800 16200 1419 2838 4256 2.5
Moong 16 55750 67500 60754 54004 47253 6750 13501 20251 1051 2102 3153 1.9
Groundnut 77 44500 49750 44779 39803 34828 4975 9951 14926 3821 7642 11462 6.8
Sesamum 7 53000 64060 57650 51244 44839 6406 12811 19217 422 843 1265 0.7
Nigerseed 1 40500 61610 55453 49291 43130 6161 12323 18484 41 83 124 0.1
Soybean 99 30500 33410 30065 26725 23384 3341 6681 10022 3317 6635 9952 5.9
Sunflower 2 41000 54830 49343 43861 38378 5483 10965 16448 107 213 320 0.2
R&M seed 69 40000 40000 36000 32000 28000 4000 8000 12000 2773 5546 8319 4.9
safflower 0.3 41000 49220 44297 39375 34453 4922 9844 14766 14 27 41 0.02
Kapas 174 40200 51600 46437 41278 36118 5160 10319 15479 8970 17939 26909 15.9
Total Compensation required (Rs crore) 56,518 1,13,035 1,69,553
Source: Author’s calculations

17
Figure 3: Crop wise compensation that may be needed under two scenarios (Rs crore)
Source: Authors’ computation (sorted in descending order)
To summarize, we find that the scheme may turn out to be a financial burden for the
exchequer, will be messy to implement, and will distort the markets. It can adversely impact
exports of some commodities (most notably rice and cotton, including yarn and fabrics), will
also be regressive towards diversification, especially in Punjab region, leading to faster
depletion of groundwater.
5. Direct Income (Investment) Support based schemes
Given the distortions that PDP schemes can create, we discuss here an alternate scheme
which is based on Direct Income (Investment) Support (DIS). The State Government of
Telangana and Karnataka plan to launch such a scheme for both the seasons of Kharif and
Rabi in 2018-19. The State Government of Telangana has announced that the proposed
scheme, called Direct Investment Support (Rythu Bandhu) will support investment at Rs
4000 per acre (about Rs 10,000/ha) per farmer, per season, for purchase of inputs like (1)
Seeds, (2) Fertilizers, (3) Pesticides & (4) Other investments in the field operations, of
farmers’ choice, for the crop season. Broadly, it is supposed to take care of the initial
investment needs of every farmer.
If the farmer cultivates the land during both seasons, he is eligible for Rs 8000 per acre (about
Rs 20,000/ha). Prior to the implementation of the scheme in Kharif-2018, the revenue
department of GoT has updated data on land records by conducting the Land Records
Updation Program (LRUP). The data collected from the LRUP will be used for the
implementation of the DIS. The amount will be paid to the farmers account, before beginning
of the season, i.e., in the month of May for Kharif and October in Rabi season. Bank account
number, IFSC code, Aadhaar numbers of individual farmers have being collected during the
Survey carried out across the state by the State Government. The required budget has been
calculated based on area under each crop. It has been decided that the amount will be
05000
100001500020000250003000035000400004500050000
Rs
cro
re
sale price 10 % below MSP sale price 20 % below MSP sale price 30 % below MSP
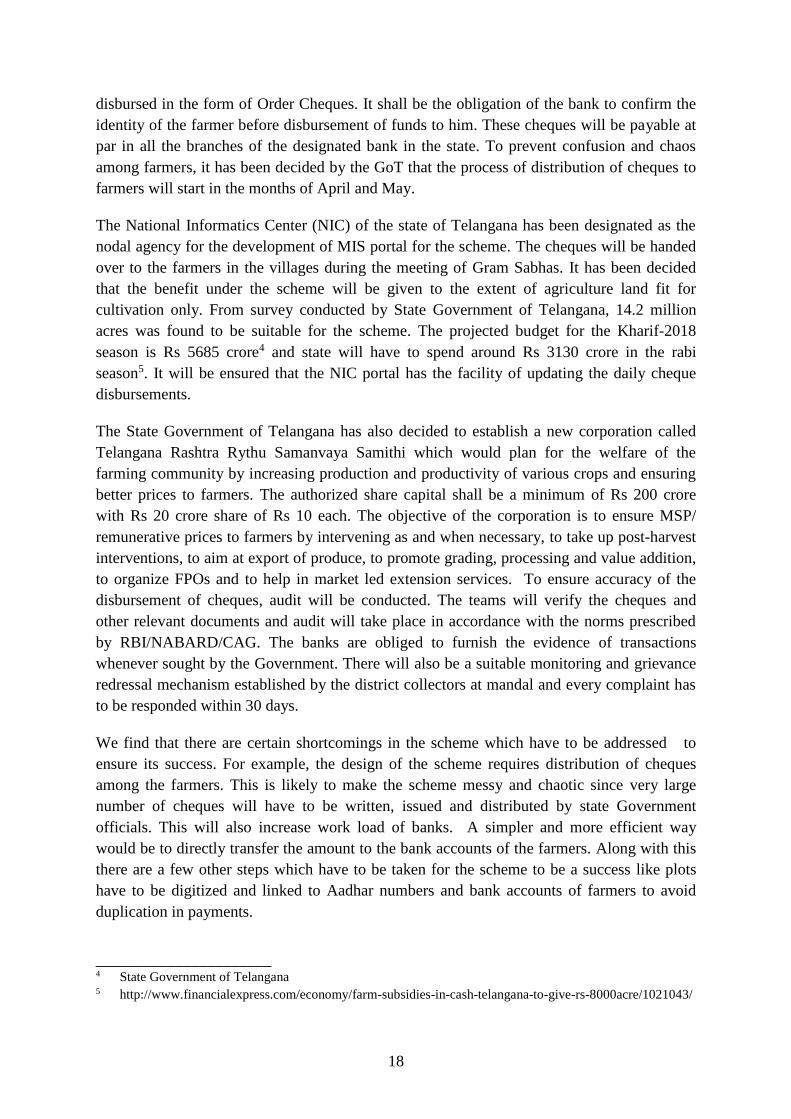
18
disbursed in the form of Order Cheques. It shall be the obligation of the bank to confirm the
identity of the farmer before disbursement of funds to him. These cheques will be payable at
par in all the branches of the designated bank in the state. To prevent confusion and chaos
among farmers, it has been decided by the GoT that the process of distribution of cheques to
farmers will start in the months of April and May.
The National Informatics Center (NIC) of the state of Telangana has been designated as the
nodal agency for the development of MIS portal for the scheme. The cheques will be handed
over to the farmers in the villages during the meeting of Gram Sabhas. It has been decided
that the benefit under the scheme will be given to the extent of agriculture land fit for
cultivation only. From survey conducted by State Government of Telangana, 14.2 million
acres was found to be suitable for the scheme. The projected budget for the Kharif-2018
season is Rs 5685 crore4 and state will have to spend around Rs 3130 crore in the rabi
season5. It will be ensured that the NIC portal has the facility of updating the daily cheque
disbursements.
The State Government of Telangana has also decided to establish a new corporation called
Telangana Rashtra Rythu Samanvaya Samithi which would plan for the welfare of the
farming community by increasing production and productivity of various crops and ensuring
better prices to farmers. The authorized share capital shall be a minimum of Rs 200 crore
with Rs 20 crore share of Rs 10 each. The objective of the corporation is to ensure MSP/
remunerative prices to farmers by intervening as and when necessary, to take up post-harvest
interventions, to aim at export of produce, to promote grading, processing and value addition,
to organize FPOs and to help in market led extension services. To ensure accuracy of the
disbursement of cheques, audit will be conducted. The teams will verify the cheques and
other relevant documents and audit will take place in accordance with the norms prescribed
by RBI/NABARD/CAG. The banks are obliged to furnish the evidence of transactions
whenever sought by the Government. There will also be a suitable monitoring and grievance
redressal mechanism established by the district collectors at mandal and every complaint has
to be responded within 30 days.
We find that there are certain shortcomings in the scheme which have to be addressed to
ensure its success. For example, the design of the scheme requires distribution of cheques
among the farmers. This is likely to make the scheme messy and chaotic since very large
number of cheques will have to be written, issued and distributed by state Government
officials. This will also increase work load of banks. A simpler and more efficient way
would be to directly transfer the amount to the bank accounts of the farmers. Along with this
there are a few other steps which have to be taken for the scheme to be a success like plots
have to be digitized and linked to Aadhar numbers and bank accounts of farmers to avoid
duplication in payments.
______________________ 4 State Government of Telangana 5 http://www.financialexpress.com/economy/farm-subsidies-in-cash-telangana-to-give-rs-8000acre/1021043/

19
On similar lines, State Government of Karnataka also plans to implement DBT of Rs 5000 Rs
per ha for dry land farmers in Kharif 2018. Details of the scheme are still awaited.
It is interesting to note that Direct Income transfer has been in practice in China since 2004.
China gives an aggregate input support to the farmer on a per acre basis. In addition to direct
payments, two more schemes, viz. agricultural input comprehensive subsidies and seed
variety subsidies were launched in 2006 which also were based on the principles of Direct
Income Support and were paid on the basis of area under cultivation.
In 2015, Chinese Government combined the three above mentioned area based payments
(direct payments for grain producers, comprehensive subsidy on agricultural inputs and seed
variety subsidy) and implemented a pilot of the single payment scheme called “agricultural
support and protection subsidy”. Funds are allocated to protect arable land fertility and to
preserve grain production capacity, support large scale production within so-called “new-
style” farms who rent land from neighbours, family farms, cooperative farms and farms run
by agribusiness companies through developing credit programs and support services. The
government decided to extend this single payment scheme to the whole country in 2016. At
CNY 140.5 billion (USD 21.1 billion) in 2016, this scheme remains the most important
budgetary support program for Chinese agriculture (OECD, 2017). Figure 4 gives the
expense incurred on the scheme since 2004.
They also have a price deficiency scheme which is called “Target Price Payments” since
2014. Against this scheme, direct payments were made to producers of cotton and soybean in
order to “compensate farmers for the difference between a target price fixed by the
government in advance and a lower price in the actual market”. However, as Figure 4 shows,
it only covers two crops, soybean and cotton, and total expenses are approximately one- third
of the expenses incurred in the “agricultural support and protection subsidy”. It is interesting
to observe that China had maize also under this PDP scheme earlier, but given that it causes
lot of distortions, it has moved it out of this scheme. The lessons from Chinese experience are
twofold: (1) put all input support in one lump sum support on per hectare basis; and (2) keep
PDP to minimal, say one or two crops. Else, the market distortions and the consequent
efficiency losses may outweigh the support government wants to extend to farmers.

20
Figure 4: Expenses incurred on target payments and direct input subsidies in China
Source: OECD database
So, in the Indian case, if the Direct Income Support scheme is scaled at the national level, say
at Rs 10,000 per ha, and payments are based on gross cropped area which was 1978 lakh ha
in TE- 2014-15, the total payment will be Rs 1.97 lakh crore. If the DIS is only Rs 5000/ha,
which seems doable, the cost of the scheme will be just below Rs 1 lakh crore. Thus, the
scheme by itself may not be much cheaper but DIS based schemes are less prone to market
distortions compared to BBY scheme. It is crop neutral as it does not incentivize producers to
produce any particular crop. It involves lower intervention from market participants at the
lowest level and thus the benefits can be directly targeted to the real beneficiaries i.e. the
farmers rather than the middlemen who might extract most of the deal in case of the price
deficiency scheme.
It must be noted that the objective of all these schemes, whether they are PDP based, DBT
based or loan waivers, is to stabilize income of farmers. The idea is to reach farmers quickly
and efficiently. As discussed earlier, in terms of penetration and reach, even BBY scheme
undertaken by MP was not very successful. The scheme could not reach even 25 percent of
the total produce. Only 32 percent of urad production was compensated, when ASP was 42
percent below the announced MSPs, mandi prices even lower than the ASPs. Therefore, both
these schemes which target both positive and negative supply shocks in the market have been
found to be relatively unsuccessful in terms of reach and timely intervention and farmers
have not benefitted from either of these schemes.
Majority of farmers who are small and marginal do not bring their produce directly to the
market. It is the traders who bring the produce and all the price compensation which the
farmers get are therefore indirect. The easiest and most direct and fastest way to reach the
farmer is through Direct Benefit Transfer related schemes. This will work irrespective of the
0.0
5.0
10.0
15.0
20.0
25.0
20
04
20
05
20
06
20
07
20
08
20
09
20
10
20
11
20
12
20
13
20
14
20
15
20
16
Bill
ion
$
Target payments for cottonand soybean (Billion $)
Direct payments to grainfarmers (Billion $)
Agricultural inputcomprehensive subsidies(Billion $)
Seed subsidies (Billion $)
Agricultural supportpayments (Billion $)
The three schemes were merged in 2015

21
shocks that the farmer receives, be it supply or price. As discussed earlier, there are steps
which have to be taken to make it fool proof like digitization of plots, linking it with Aadhar
numbers and bank accounts to avoid duplication of farmer identities. We believe that once
these reforms are undertaken, DIS related schemes should be a substitute of PDP based
schemes and procurement at MSPs. Rather, we should reduce the number of crops for which
MSPs are announced. This limited set of commodities should be those for which procurement
machinery is robust and efficient.
6. Concluding Remarks and Policy Implications
So where does one go from here? Our analysis in preceding sections reveals that it is very
difficult to reach the farmers, especially small ones through PDP type schemes. Needless to
say, if reaching them is difficult through such a scheme, the increasing farm distress cannot
be mitigated, at least in the short run. And even if systems are erected to reach large number
of farmers, PDP based on the difference between MSP that is 1.5 times cost A2+FL, and
market prices, will lead to several major market distortions. This would cause damage on
several fronts ranging from exports to faster depletion of groundwater. The other alternative
policy of giving DIS on per ha basis seems better, simple to implement, more transparent and
inclusive. India can learn from other countries experiences also and move towards DIS type
schemes and avoid PDP.
Either of the schemes, PDP or DIS, is not going to be cheap. But given the level of farm
distress and urgency to alleviate it as soon as possible, and in a more inclusive manner, DIS
seems a better option.
22
References
Commission For Agricultural Costs And Prices, Price Policy for Kharif Crops, The
Marketing Season-2014-15, Commission For Agricultural Costs And Prices, 2014
Gulati, A, Rajkhowa, P. and Sharma, P, (2017) Making Rapid Strides- Agriculture In
Madhya Pradesh: Sources, Drivers And Policy Lessons, ICRIER Working Paper- 339
Gulati, A and Hussain, S. From Plate to Plough: How to help the farmer, Indian Express,
January, 2018
OECD (2017), "China", in Agricultural Policy Monitoring and Evaluation 2017, OECD
Publishing, Paris. http://dx.doi.org/10.1787/agr_pol-2017-10-en
Gulati, A., Roy, R. and Hussain, S.(2017), Getting Punjab Agriculture Back on High
Growth Path: Sources, Drivers and Policy Lessons
Report on the Regulation of Sugar Sector in India: The Way Forward, 2012, (Chairperson: C.
Rangarajan), Government of India
Saini, S. and Gulati, A. (2017) Price Distortions in Indian Agriculture (ICRIER and
The World Bank)
23
Annexure
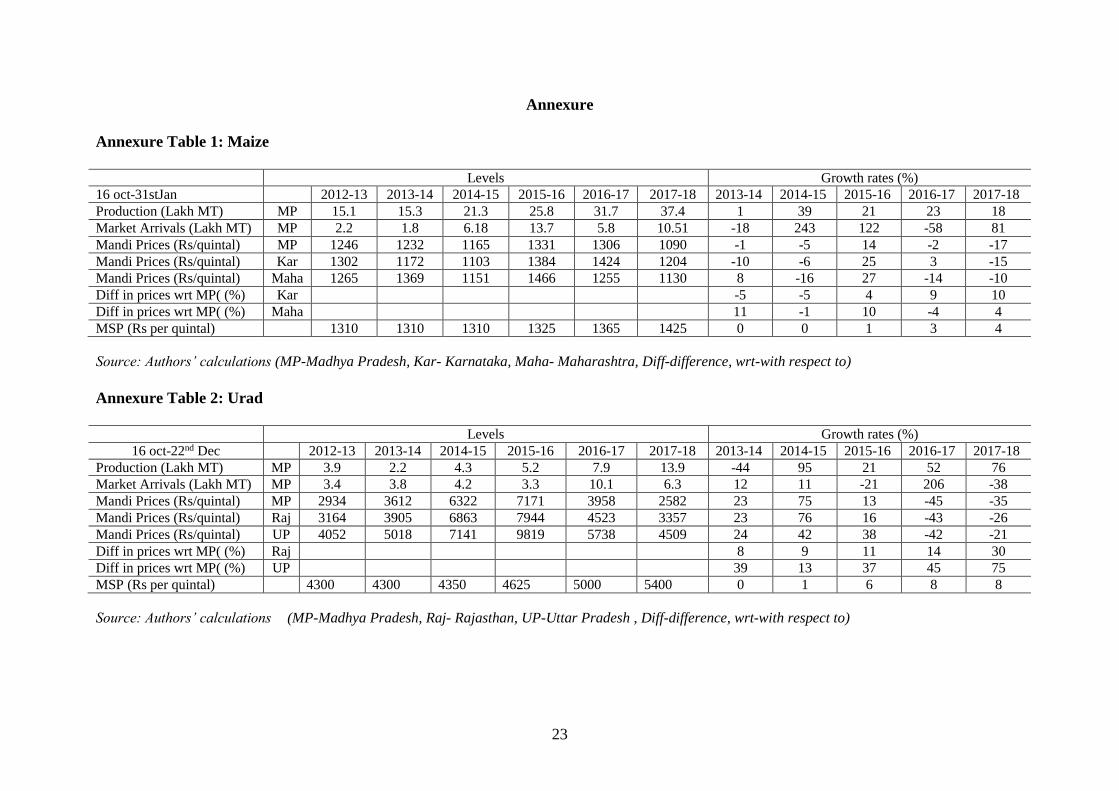
Annexure Table 1: Maize
Levels Growth rates (%)
16 oct-31stJan 2012-13 2013-14 2014-15 2015-16 2016-17 2017-18 2013-14 2014-15 2015-16 2016-17 2017-18
Production (Lakh MT) MP 15.1 15.3 21.3 25.8 31.7 37.4 1 39 21 23 18
Market Arrivals (Lakh MT) MP 2.2 1.8 6.18 13.7 5.8 10.51 -18 243 122 -58 81
Mandi Prices (Rs/quintal) MP 1246 1232 1165 1331 1306 1090 -1 -5 14 -2 -17
Mandi Prices (Rs/quintal) Kar 1302 1172 1103 1384 1424 1204 -10 -6 25 3 -15
Mandi Prices (Rs/quintal) Maha 1265 1369 1151 1466 1255 1130 8 -16 27 -14 -10
Diff in prices wrt MP( (%) Kar -5 -5 4 9 10
Diff in prices wrt MP( (%) Maha 11 -1 10 -4 4
MSP (Rs per quintal)
1310 1310 1310 1325 1365 1425 0 0 1 3 4
Source: Authors’ calculations (MP-Madhya Pradesh, Kar- Karnataka, Maha- Maharashtra, Diff-difference, wrt-with respect to)
Annexure Table 2: Urad
Levels Growth rates (%)
16 oct-22nd Dec
2012-13 2013-14 2014-15 2015-16 2016-17 2017-18 2013-14 2014-15 2015-16 2016-17 2017-18
Production (Lakh MT) MP 3.9 2.2 4.3 5.2 7.9 13.9 -44 95 21 52 76
Market Arrivals (Lakh MT) MP 3.4 3.8 4.2 3.3 10.1 6.3 12 11 -21 206 -38
Mandi Prices (Rs/quintal) MP 2934 3612 6322 7171 3958 2582 23 75 13 -45 -35
Mandi Prices (Rs/quintal) Raj 3164 3905 6863 7944 4523 3357 23 76 16 -43 -26
Mandi Prices (Rs/quintal) UP 4052 5018 7141 9819 5738 4509 24 42 38 -42 -21
Diff in prices wrt MP( (%) Raj 8 9 11 14 30
Diff in prices wrt MP( (%) UP 39 13 37 45 75
MSP (Rs per quintal)
4300 4300 4350 4625 5000 5400 0 1 6 8 8
Source: Authors’ calculations (MP-Madhya Pradesh, Raj- Rajasthan, UP-Uttar Pradesh , Diff-difference, wrt-with respect to)

24
Annexure Table 3: Moong
Levels YOY Growth rates (%)
16 oct-15 Dec 2012-13 2013-14 2014-15 2015-16 2016-17 2017-18 2013-14 2014-15 2015-16 2016-17 2017-18
Production (Lakh MT) MP 0.4 0.4 0.7 0.8 2.9 1.6 0 75 14 263 -52
Market Arrivals (Lakh MT) MP 0 0 0.2 0.1 0.2 0.1 -50 100 -50
Mandi Prices (Rs/quintal) MP 4204 3824 6091 6524 4184 3594 -9 59 7 -36 -14
Mandi Prices (Rs/quintal) Raj 5085 4928 6708 6945 4317 4299 -3 36 4 -38 0
Mandi Prices (Rs/quintal) Maha 4718 5394 7267 7729 4662 4160 14 35 6 -40 -11
Diff in prices wrt MP( (%) Raj 29 10 6 3 20
Diff in prices wrt MP( (%) Maha 41 19 18 11 16
MSP (Rs per quintal)
4400 4500 4600 4850 5225 5575 2 2 5 8 7
Source: Authors’ calculations (MP-Madhya Pradesh, Raj-Rajasthan, Maha- Maharashtra, Diff-difference, wrt-with respect to)
Annexure Table 4: Soybean
Levels YOY Growth rates (%)
16 oct-31 Dec 2012-13 2013-14 2014-15 2015-16 2016-17 2017-18 2013-14 2014-15 2015-16 2016-17 2017-18
Production (Lakh MT) MP 78 52.4 63.5 49.1 70.8 69.4 -33 21 -23 44 -2
Market Arrivals (Lakh MT) MP 30.2 19.1 27.4 9.6 12.6 18.8 -37 43 -65 31 49
Mandi Prices (Rs/quintal) MP 3062.7 3398.29 6736 3386.8 2771.1 2594.2 11 98 -50 -18 -6
Mandi Prices (Rs/quintal) Maha 3055.4 3308.6 3156.2 3542.3 2676.3 2649.6 8 -5 12 -24 -1
Mandi Prices (Rs/quintal) Raj 3090.5 3498.6 3142.5 3524 2896.7 2710.8 13 -10 12 -18 -6
Diff in prices wrt MP( (%) Maha -3 5 5 -3 2
Diff in prices wrt MP( (%) Raj 3 4 4 5 4
MSP (Rs per quintal)
2200 2500 2500 2600 2775 3050 14 0 4 7 10
Source: Authors’ calculations(MP-Madhya Pradesh, Maha- Maharashtra, Raj- Rajasthan , Diff-difference, wrt-with respect to)

25
Annexure Table 5: Groundnut
Levels YOY Growth rates (%)
16 oct-15 Dec 2012-13 2013-14 2014-15 2015-16 2016-17 2017-18 2013-14 2014-15 2015-16 2016-17 2017-18
Production (Lakh MT) MP 3.117 3.242 3.7 3.315 3.84 3.46 4 14 -10 16 -10
Market Arrivals (Lakh
MT)16 oct-15 Dec MP 0.065 0.035 0.165 0.093 0.099 0.307 -46 371 -44 6 210
Mandi Prices (Rs/quintal) MP 4574 3199 3560 3606 4013 3290 -30 11 1 11 -18
Mandi Prices (Rs/quintal) Guj 4920 3345 3688 3892 3938 3851 -32 10 6 1 -2
Mandi Prices (Rs/quintal) Raj 4659 3392 3422 3925 3793 3469 -27 1 15 -3 -9
Diff in prices wrt MP( (%) Guj 5 4 8 -2 17
Diff in prices wrt MP( (%) Raj 6 -4 9 -5 5
MSP (Rs per quintal)
3700 4000 4000 4030 4220 4450 8 0 1 5 5
Source: Authors’ calculations(MP-Madhya Pradesh, Guj- Gujarat, Raj-Rajasthan , Diff-difference, wrt-with respect to)
Annexure Table 6: Sesamum
Levels YOY Growth rates (%)
16 oct-15 Dec 2012-13 2013-14 2014-15 2015-16 2016-17 2017-18 2013-14 2014-15 2015-16 2016-17 2017-18
Production (Lakh MT) MP 1.6 1.4 1.9 1.8 1.9 1.9 -11 33 -3 8 -2
Market Arrivals (Lakh
MT)16 oct-15 Dec MP 0.032 0.013 0.218 0.28 0.027 0.249 -59 1577 28 -90 822
Mandi Prices (Rs/quintal) MP 8224 11933 8499 5802 5704 6674 45 -29 -32 -2 17
Mandi Prices (Rs/quintal) Odi 3840 no data 7800 no data no data no data no data no data no data no data no data
Mandi Prices (Rs/quintal) Chhat 3800 4300 4171 4640 4800 5000 13 -3 11 3 4
Diff in prices wrt MP( (%) Odi no data no data no data no data no data
Diff in prices wrt MP( (%) Chhatt -64 -51 -20 -16 -25
MSP (Rs per quintal)
4200 4500 4600 4700 5000 5300 7 2 2 6 6
Source: Authors’ calculations(MP-Madhya Pradesh, Odi- Odisha, Chhat- Chhattisgarh , Diff-difference, wrt-with respect to)

26
Annexure Table 7: Nigerseed
Levels YOY Growth rates (%)
16 oct-15 Dec 2012-13 2013-14 2014-15 2015-16 2016-17 2017-18 2013-14 2014-15 2015-16 2016-17 2017-18
Production (Lakh MT) MP 0.298 0.275 0.16 0.23 0.27 0.25 -8 -42 44 17 -7
Market Arrivals (Lakh MT) MP 0.001 0.0017 0.0077 0.0062 0.0032 0.0027 75 340 -19 -48 -16
Mandi Prices (Rs/quintal) MP 3514 4256 4884 6190 5276 4484 21 15 27 -15 -15
Mandi Prices (Rs/quintal) WB No No No No No No No No No No No
Mandi Prices (Rs/quintal) Raj No No No No No No No No No No No
Diff in prices wrt MP( (%) WB
No No No No No
Diff in prices wrt MP( (%) Raj
No No No No No
MSP (Rs per quintal)
3500 3500 3600 3650 3825 4050 0 3 1 5 6
Source: Authors’ calculations (MP-Madhya Pradesh, WB- West Bengal, Raj- Rajasthan , Diff-difference, wrt-with respect to)
Annexure Table 8: Tur/ Arhar
Feb 1- April 30 2012-13 2013-14 2014-15 2015-16 2016-17 2017-18 2013-14 2014-15 2015-16 2016-17 2017-18
Production (Lakh MT) MP 3.51 3.32 5.11 6.24 7.8 8.06 -5 54 22 25 3
Mandi Prices (Rs/quintal) MP 0.51 0.27 0.94 0.98 1.83
-47 248 4 87 no data
Mandi Prices (Rs/quintal) MP 3486 3501 4762 6498 4005
0 36 36 -38 no data
Mandi Prices (Rs/quintal) Mah 4068 4156 5593 7857 4202
2 35 40 -47 no data
Mandi Prices (Rs/quintal) Guj 3922 3743 5444 7182 4095
-5 45 32 -43 no data
Diff in prices wrt MP( (%) Mah
19 17 21 5 no data
Diff in prices wrt MP( (%) Guj
7 14 11 2 no
MSP (Rs per quintal) 3850 4300 4350 4625 5050 5450 12 1 6 9 8
Source: Authors’ calculations( MP-Madhya Pradesh, Guj- Gujarat, Mah- Maharashtra , Diff-difference, wrt-with respect to)

27
Annexure Table 9: Steps to calculate the BBY compensation
STEP-A- Calculate projected MSPs for 2018-19
1. We calculate projected A2+FL cost by increasing the current A2+FL cost by 5%. The
Kharif A2+FL costs are for marketing season 2017-18 and Rabi A2+FL costs are for
marketing season 2018-19.These are compiled from Rabi and Kharif reports published by
CACP
2. We then raise the projected A2+FL costs by 50% to get the projected MSPs for 2018-19
3. We deduct the projected MSPs from the past MSPs and for the crops for which the
difference is negative,
a. For wheat we raise the present MSP by 5% to get the projected MSP as we feel that if
paddy MSP is raised for kharif crops in 2018 as mentioned above, the same for wheat
for Rabi 2018-19 will also have to be raised by at least 5%
b. For other crops, we keep the MSP same
STEP -B- Calculate net availability
1. We first compute marketed surplus for 2017-18 for all the commodities. Marketed
Surplus has been computed using Marketed Surplus Ratio for TE-2014-15 since that is
the last year of data availability. Data on Marketed Surplus Ratio has been compiled from
Agricultural Statistics At a Glance, published by Department of Agriculture, Cooperation
and Farmers Welfare, Govt. of India.
2. For rice and wheat, we deduct procurement for 2017-18
3. We deduct basmati rice production and export. The deducted basmati production has been
assumed to be 85 lakh tonnes. 6
4. For wheat, net availability = production – procurement
5. For other commodities, net availability = marketed surplus
6. Net availability of Rice is converted to paddy by the following formula- (100/67*net
availability of rice).
7. Net availability of cotton is converted to kapas using the formula- (100/33*net
availability of cotton)
______________________ 6 This is based on data for 2014 (Source: http://www.airea.net/page/60/statistical-data/state-wise-basmati-
rice-production) and basmati rice production for 2017-18 (Source:
http://www.tribuneindia.com/news/business/basmati-exporters-reap-rich-dividends/490976.html).
28
STEP -C- Calculate compensation for three scenarios
1. First scenario is when the prices are 10 percent below MSP.
2. Second scenario is when prices are 20 percent below MSP.
3. Third scenario is when prices are 30 percent below MSP.
4. We compute the difference between the prices computed in the previous steps with that of
the projected MSP.
5. The difference in the three prices is multiplied by net availability computed in STEP- B.
6. The sum of the total compensation for all crops is equal to PDP compensation.

29
Annexure Table 10: MSP projections for 2018-19
MSP projection
A2+FL
(2017-18)
(Rs/q)
MSP
(2017-18)
(Rs/q)
Projected
A2+FL (5 %
high)
(Rs/q)
Projected MSP
(50 % higher
than projected
A2+FL)
(Rs/q)
col [5]-col [3]
(Rs/q)
Projected MSP if
A2+FL<MSP (5%
rise over current MSP
for wheat, unchanged
for others) (Rs/q)
Projected
MSP
(Rs/q)
Projected
MSP- old
MSP
(Rs/q)
% increase
in MSP
[1] [2] [3] [4] [5] [6] [7] [8] [9] [10]
Paddy common 1117 1550 1172 1759 209
1759 209 14
Paddy Grade A 1117 1590 1172 1759 169
1759 169 11
Wheat 817 1735 857 1286 -449 1822 1822 87 5
Jowar Hybrid 1556 1700 1633 2450 750
2451 751 44
Jowar Maldandi 1556 1725 1633 2450 725
2451 726 42
Bajra 949 1425 996 1494 69
1495 70 5
Maize 1044 1425 1096 1644 219
1644 219 15
Ragi 1861 1900 1954 2931 1031
2931 1031 54
Tur 3318 5450 3483 5225 -225 5450 5450 0 0
Moong 4286 5575 4500 6750 1175
6750 1175 21
Urad 3265 5400 3428 5142 -258 5400 5400 0 0
Ground nut 3159 4450 3316 4975 525
4975 525 12
Soybean 2121 3050 2227 3340 290
3341 291 10
Sunflower 3481 4100 3655 5482 1382
5483 1383 34
Cotton Medium Staple 3276 4020 3439 5159 1139
5160 1140 28
Cotton Long staple 3276 4320 3439 5159 839
5160 840 19
Barley 845 1410 887 1330 -80 1410 1410 0 0
Gram 2461 4400 2584 3876 -524 4400 4400 0 0
Lentil 2366 4250 2484 3726 -524 4250 4250 0 0
Rapeseed & Mustard 2123 4000 2229 3343 -657 4000 4000 0 0
Safflower 3125 4100 3281 4921 821
4922 822 20
Sesamum 4067 5300 4270 6405 1105
6406 1106 21
Nigerseed 3912 4050 4107 6161 2111
6161 2111 52
Sugarcane 145 255 152 228 -27 255 255 0 0
Source: Authors’ calculations

30
Annexure Table 11: MSPs for last five years
MSPs announced (Rs/quintal) YOY Growth Rates (%)
crop 2017-18 2016-17 2015-16 2014-15 2013-14 2017-18 2016-17 2015-16 2014-13
Paddy common 1550 1470 1410 1360 1310 5 4 4 4
Paddy Grade A 1590 1510 1450 1400 1345 5 4 4 4
Jowar Hybrid 1700 1625 1570 1530 1500 5 4 3 2
Jowar Maldandi 1725 1650 1590 1550 NA 5 4 3 NA
Bajra 1425 1330 1275 1250 1250 7 4 2 0
Maize 1425 1365 1325 1310 1310 4 3 1 0
Ragi 1900 1725 1650 1550 1500 10 5 6 3
Tur (Arhar) 5450 5050 4625 4350 4300 8 9 6 1
Moong 5575 5225 4850 4600 4500 7 8 5 2
Urad 5400 5000 4625 4350 4300 8 8 6 1
Groundnut-in-shell 4450 4220 4030 4000 4000 5 5 1 0
Soyabean 3050 2775 2600 2500 2500 10 7 4 0
Sunflower Seed 4100 3950 3800 3750 3700 4 4 1 1
Sesamum 5300 5000 4700 4600 4500 6 6 2 2
Nigerseed 4050 3825 3650 3600 3500 6 5 1 3
Cotton medium staple 4020 3860 3800 3750 3700 4 2 1 1
cotton long staple 4320 4160 4100 4050 4000 4 1 1 1
wheat 1735 1625 1525 1450 1400 7 7 5 4
barley 1410 1325 1225 1150 1100 6 8 7 5
gram 4400 4000 3425 3175 3100 10 17 8 2
masur 4250 3950 3325 3075 2950 8 19 8 4
R&M seed 4000 3700 3350 3100 3050 8 10 8 2
safflower 4100 4000 3300 3050 3000 3 21 8 2
Sugarcane
255 230 230 220
11 0 5
Source: Authors’ calculations

31
Annexure Table 12: net availability of commodities
crops
Production 2017-18
(lakh tonnes)
Marketed Surplus
Ratio (MSR)
Marketed Surplus (lakh
tonnes)
Procurement
(lakh tonnes)
Basmati Production
(lakh tones)
net availability
(lakh tonnes)
Rice 1110 82.6 917 283 85 549
Wheat 971 74.8 726 308 0 418
Jowar 47 65.3 30 0 0 30
Bajra 93 72.1 67 0 0 67
Maize 271 86.5 235 0 0 235
barley 20 75.2 15 0 0 15
Ragi 20 40.4 8 0 0 8
Gram 111 88.1 98 0 0 98
Masur 8 91.1 7 0 0 7
Tur 40 86.5 35 0 0 35
Urad 32 81.3 26 0 0 26
Moong 17 89.5 16 0 0 16
Groundnut 82 93.5 77 0 0 77
Sesamum 7 91.9 7 0 0 7
Nigerseed 1 92.0 1 0 0 1
Soyabean 114 87.2 99 0 0 99
Sunflower 2 84.6 2 0 0 2
Rapeseed/Mustard 75 91.9 69 0 0 69
Safflower 0.4 67.0 0 0 0 0.3
Cotton 58 99.5 57 0 0 57
Sugarcane 3532 100.0 3532 0 0 3532
Source: Authors’ calculations (Net availability of rice and cotton have been converted to paddy and kapas in Table 4)

1
LATEST ICRIER’S WORKING PAPERS
NO. TITLE AUTHOR YEAR
356 SOLID WASTE MANAGEMENT
IN INDIA
AN ASSESSMENT OF
RESOURCE RECOVERY AND
ENVIRONMENTAL IMPACT
ISHER JUDGE AHLUWALIA
UTKARSH PATEL
APRIL 2018
355 CHANGING TASK CONTENTS
OF JOBS IN INDIA:
IMPLICATIONS AND WAY
FORWARD
PANKAJ VASHISHT
JAY DEV DUBEY
MARCH
2018
354 TRADE RULES IN E-
COMMERCE: WTO AND INDIA
ARPITA MUKHERJEE
AVANTIKA KAPOOR
MARCH
2018
353 SCALING UP ROOFTOP SOLAR
POWER IN INDIA: THE
POTENTIAL OF MUNICIPAL
SOLAR BONDS
SAURABH TRIVEDI
INDRO RAY
GREGOR VULTURIUS
AMRITA GOLDAR
LABANYA PRAKASH J
SANDEEP PAUL
AARSI SAGAR
MARCH
2018
352 CROP INSURANCE IN INDIA:
KEY ISSUES AND WAY
FORWARD
ASHOK GULATI
PRERNA TERWAY
SIRAJ HUSSAIN
FEBRUARY
2018
351 DEMONETISATION – A
GOLDEN OPPORTUNITY FOR
WIDENING THE TAXPAYER
BASE
RAJIVA RANJAN SINGH
ANANDITA BAGCHI
JANUARY
2018
350 TRADE FACILITATION
MEASURES TO ENHANCE
WOMEN’S PARTICIPATION IN
CROSS-BORDER TRADE IN
BBIN
NISHA TANEJA
SANJANA JOSHI
SHRAVANI PRAKASH
SAMRIDHI BIMAL
JANUARY
2018
349 AGRICULTURAL COMMODITY
FUTURES: SEARCHING FOR
POTENTIAL WINNERS
ASHOK GULATI
TIRTHA CHATTERJEE
SIRAJ HUSSAIN
DECEMBER
2017
348 WAITING FOR JOBS RADHICKA KAPOOR NOVEMBER
2017
347 INDIA AND TRADE
FACILITATION IN SERVICES
(TFS) AGREEMENT:
CONCERNS AND WAY
FORWARD
ARPITA MUKHERJEE
AVANTIKA KAPOOR
OCTOBER
2017
346 LABOUR REGULATIONS IN
INDIA: RATIONALISING THE
LAWS GOVERNING WAGES
ANWARUL HODA
DURGESH K. RAI
OCTOBER
2017

1
About ICRIER
Established in August 1981, ICRIER is an autonomous, policy-oriented, not-for-profit,
economic policy think tank. ICRIER’s main focus is to enhance the knowledge content of
policy making by undertaking analytical research that is targeted at informing India’s policy
makers and also at improving the interface with the global economy.
ICRIER’s office is located in the institutional complex of India Habitat Centre, New Delhi.
ICRIER’s Board of Governors include leading academicians, policymakers, and
representatives from the private sector. Dr. Isher Ahluwalia is ICRIER’s chairperson.
Dr. Rajat Kathuria is Director and Chief Executive.
ICRIER conducts thematic research in the following eight thrust areas:
Macroeconomic Management Financial Liberalisation and Regulation
Global Competitiveness of the Indian Economy – Agriculture, Manufacturing and
Services
Multilateral Trade Negotiations and FTAs
Challenges and Opportunities of Urbanization
Climate Change and Sustainable Development
Physical and Social Infrastructure including Telecom, Transport Energy and Health
Asian Economic Integration with focus on South Asia
Skill Development, Entrepreneurship and Jobs
To effectively disseminate research findings, ICRIER organises workshops, seminars and
conferences to bring together academicians, policymakers, representatives from industry and
media to create a more informed understanding on issues of major policy interest. ICRIER
routinely invites distinguished scholars and policymakers from around the world to deliver
public lectures and give seminars on economic themes of interest to contemporary India.