working paper no. 355 changing task contents of jobs in ...icrier.org/pdf/working_paper_355.pdf ·...
TRANSCRIPT

1
Working Paper No. 355
Changing Task Contents of Jobs in
India: Implications and Way Forward
Pankaj Vashisht
Jay Dev Dubey
March 2018
INDIAN COUNCIL FOR RESEARCH ON INTERNATIONAL ECONOMIC RELATIONS

i
Table of Contents
Abstract .................................................................................................................................... ii
1. Introduction ......................................................................................................................1
2. Evolution of demand and supply Labour in India ........................................................3
3. Data Sources and Methodology .......................................................................................5
3.1 Data Sources ...............................................................................................................5
3.2 Methodology ................................................................................................................6
4. Task Content of Jobs in India .........................................................................................7
4.1 Overall Trend ..............................................................................................................7
4.2 Intergenerational Dimensions of Task Content ..........................................................9
4.3 Structural Change and Task Content ........................................................................11
4.4 Task, Technology and Education ..............................................................................12
4.5 Social Dimension of Task ..........................................................................................15
5. Conclusion .......................................................................................................................17
References ...............................................................................................................................19
Annexure 1: Changing task Content of Manufacturing Sector Jobs ................................21
List of Tables
Table 1: Changing Structure of the Indian Economy ............................................................... 3
Table 2: Occupational Structure of Employment ..................................................................... 4
Table 3: Education profile of Indian Labour Force .................................................................. 5
Table 4: Trend in Task Intensities by Birth Cohort ................................................................ 10
Table 5: Fixed Effect Regression: Change in Task content, Technological change and
Education .................................................................................................................. 14
List of Figures
Figure 1: Task Content Measures ............................................................................................. 7
Figure 2: Evolution of Task Content of Jobs in India ............................................................... 8
Figure 3: Decomposition of change in task intensities in India during 1983-84 to 2011-12 . 11
Figure 4: Average Task Content of Jobs by Social Groups .................................................... 16
Figure 5: Contribution to Change in Non-routine Cognitive Task Contents .......................... 17
ii
Abstract
In this paper, we analyse the evolution of the task content of jobs in India between 1983 and
2011. Following standard literature, we calculated five task intensities by combining NSS data
with O-Net data at the 3-digit level of occupational classification. We find that, in line with
global trend, non-routine cognitive analytical as well as non-routine cognitive interactive task
intensity of jobs has increased in India, while manual task intensities have declined. However,
unlike in the US and Europe, the routine cognitive task content has not declined. Our analysis
further shows that technology seems to be a major factor behind the evolution of non-routine
cognitive analytical and interactive tasks in India whereas structural change and change in the
supply of labour has shaped manual task contents.
_________
Key Words: Task content of jobs, routinisation, job polarisation
JeL classification: J23, J24, I25
Author’s email: [email protected]
_________
Disclaimer: Opinions and recommendations in the report are exclusively of the author(s) and not of
any other individual or institution including ICRIER. This report has been prepared in good faith on
the basis of information available at the date of publication. All interactions and transactions with
industry sponsors and their representatives have been transparent and conducted in an open, honest
and independent manner as enshrined in ICRIER Memorandum of Association. ICRIER does not accept
any corporate funding that comes with a mandated research area which is not in line with ICRIER’s
research agenda. The corporate funding of an ICRIER activity does not, in any way, imply ICRIER’s
endorsement of the views of the sponsoring organization or its products or policies. ICRIER does not
conduct research that is focused on any specific product or service provided by the corporate sponsor.

1
Changing Task Content of Jobs in India: Implications and Way Forward
Pankaj Vashisht* and Jay Dev Dubey
1. Introduction
World has been going through a phase of digital revolution. Starting from early 1970s, digital
technology has invaded all aspects of human life. From communication to finance to
manufacturing to social interaction, the use of digital technology is visible everywhere. This
enormous increase in the use of digital technology has also coincided with occupational upgrading
and a sharp increase in wage disparity. Starting from mid-1980s, there has been an increase in
wage disparities between skilled and unskilled workers in countries across the globe. A large
number of theoretical as well as empirical studies conducted during the 1990s argued that rising
wage disparity and the adoption of ICT technology were linked and that the adoption of ICT
technology was the reason for rising wage disparities (Bound and Johnson, 1992; Levy and
Murnane, 1992; Katz and Murphy, 1992). Propounding the hypothesis of Skill Biased
Technological Progress (SBTP), these studies argued that digital technology has been skill biased
and therefore, has increased the demand for highly skilled workers, leading to the increase in wage
inequality. The SBTP hypothesis proved empirically very successful and dominated the debate on
wage disparity until the late 1990s. However, it started receiving a lot of criticism towards the end
of the 1990s for treating the relation between technology and skill demand as a black box.
Moreover, it also failed to explain the growing polarisation of labour markets in many countries.
The polarisation of the labour market suggests that the demand for both highly skilled and
unskilled workers was increasing simultaneously which is clearly at odds with the SBTP
hypothesis.
In response to the criticism, some scholars provided a more nuanced version of the SBTP
hypothesis (Autor et al 2004). Instead of dividing labour into the skilled and unskilled categories,
these models tried to understand the skill requirement of different jobs through a task based
framework. These models categorise the tasks performed by labour into two broad groups – routine
and non-routine – which are imperfect substitutes for each other. The routine tasks are those that
can be codified and therefore, can be easily performed by machines. In contrast, non-routine tasks
require human interaction and hence, cannot be mechanised easily. Non-routine tasks are further
divided into two sub groups – non-routine cognitive and non-routine manual tasks. These models
* Pankaj Vashisht is a senior fellow at ICRIER and Jay Dev Dubey is a research scholar at Jawaharlal Nehru University.
This paper is part of the World Bank sponsored “Jobs for Development” research project at ICRIER. Financial
support from the World Bank is gratefully acknowledged. The authors are also thankful to Prof. Pravakar Sahoo,
Institute of Economic Growth and Dr. Deb Kusum Das for their valuable comments and suggestions on this paper.
The earlier version of this paper was presented at “Jobs for Development” conference at the World Bank
Headquarters, Washington DC on November 4, 2016. The authors are thankful to the participants of the conference
for their valuable comments and suggestions.

2
indicate that recent improvements in ICT and the consequent decline in the price of ICT capital
have reduced the demand for labour to carry out routine tasks. In contrast, it has increased labour
demand for non-routine cognitive tasks. Since non-routine task intensive occupations are
concentrated at the top and bottom of the wage pyramid, it has led to a polarisation of labour
market. In short, these models suggest that the recent surge in the use of digital technology has
changed the skill demand by de-routinising jobs.
Since 2003, a number of studies have reported the de-routinisation of jobs in many countries.
However, these studies differ in their explanation of the trend. One set of studies have attributed
the change in the task content of jobs to changes in technology. In their pioneering work, Autor et
al (2004) reported that between 1960 and 1980, use of ICT in USA was negatively associated with
routine manual and cognitive task content while it was positively associated with non-routine
cognitive task contents. Michaels et al (2014) and De la Rica and Gortaazar (2016) reported similar
results for selected OECD countries. However, a few other studies have attributed the de-
routinisation of jobs to supply side factors. Examining the employment structure in the United
Kingdom (UK), Salvatori (2015) reported polarisation of jobs in the UK between 1979 and 2012.
However, unlike other studies, he concluded that the change in the employment structure in the
UK was purely driven by a decline in supply of non-graduates rather than technology. Hardy et al
(2015, 2016) reported similar results for central and East European countries. Yet another strand
of literature has attributed the change in task content or job polarisation to structural change.
Barany and Siegel (2015) argued that the process of job polarisation in US started in the early
1950s and it was closely linked to the shift in employment from manufacturing to services.
The Indian economy is not isolated from the ongoing wave of technological change. Moreover,
the structure of the Indian economy has also changed substantially since it opened up to
international trade and technology in the early 1980s. The share of agriculture in total GDP has
declined from more than 35 per cent in 1983-84 to less than 15 per cent in 2011-12, while that of
services has gone up by from 38.6 per cent to 58.3 per cent during same period. These changes in
the Indian economy have also coincided with a growing concern regarding skill shortage (Vashisht
2017). In response, the Government of India has started an ambitious Skill India programme.
However, little is known about the evolution of skill demand and its determinants in India. Against
this backdrop, following a task based framework, this paper attempts to quantify the evolution of
skill demand in India. In particular, this paper examines the evolution of task content of jobs in
India since 1983 and tries to identify the demand and supply side factors that have shaped the task
content of jobs. The paper shows that the demand for cognitive skills has indeed increased in India
and technology has played a big role in this. However, unlike in developed countries, India has not
observed a complete de-routinisation of jobs as routine cognitive task intensity has not decline.
The paper argues that government initiatives for skill development are steps in the right direction.
However, to overcome the challenges that arise from the changing nature of jobs, the government
should work on the Indian education system to improve the quality of education at all levels.

3
The rest of this paper is organised in four sections. Section 2 provides an overview of labour
demand and supply in India. Section 3 deals with data sources and methodology for the estimation
of task contents, while finding are reported in section 4. Section 5 concludes the paper with a
recapitulation of the main findings and their policy implications.
2. Evolution of demand and supply Labour in India
After following inward looking economic policies for nearly three decades, India opened up to
international trade and technology in the early 1980s. Since then, there has been a substantial
acceleration in the growth rate of the Indian economy. The major contributors to the acceleration
in the growth rate have been the manufacturing and services sectors. Consequently, the
employment structure of the Indian economy has changed substantially. In 1983, the share of
agriculture in total employment was more than 68 per cent; this fell to below 48 per cent in 2011-
12. During same period, the share of the services sector in total employment went from less than
18 per cent to around 25 per cent, while the share of manufacturing in total employment increased
from 10.63 per cent to 12.19 per cent. Notably, the share of the construction sector has registered
the biggest increase in total employment. In 1983, only 2.39 per cent of the total Indian workforce
was employed in the construction sector. However, this figure increased to 13.79 per cent in 2011-
12.
Table 1: Changing Structure of the Indian Economy
Share in GDP Share in Employment
1983 2012 1983 2012
Agriculture, Forestry & Fishing 35.29 14.10 68.44 47.93
Mining & Quarrying 2.95 2.06 0.64 0.59
Manufacturing 14.79 15.70 10.63 12.19
Electricity, Gas & Water Supply 1.59 1.88 0.38 0.59
Construction 6.77 7.87 2.39 13.79
Services 38.61 58.39 17.52 24.91
Total 100 100 100 100 Source: Compiled from NSS and NAS data
The change in the structure of economy has influenced the demand for skilled labour. Since
services as well as manufacturing employ more skilled workers, the employment shift in favour of
these sectors increased the overall demand for skilled workers in India. An analysis of employment
by occupation suggests that the share of highly skilled occupations such as managers, professionals
and technical associates in total employment has increased substantially. In 1983, the combined
share of highly skilled occupations (managers, professionals and associate professionals) in total
employment was only 4.78 per cent; this increased to 13.41 per cent in 2011-12. Among highly
skilled workers, the most staggering increase has been in the share of managers. The share of

4
managers in total employment went up from just 1.13 per cent in 1983 to 6.76 per cent in 2011-
12, registering a growth of roughly 500 per cent. The share of highly skilled workers in total
employment has increased at the cost of skilled agricultural and fishery workers as their share in
total employment has declined from more than 44 per cent to below 32 per cent. Notably, unlike
developed countries, the share of routine task intensive occupations such as clerks, plant and
machine operators and craft related workers has not declined in India. In fact, the share of these
occupations in total employment has increased marginally (Table 2). There was a marginal
increase in the employment share of elementary occupations between 1983-84 and 1993-94.
However, the trend reversed thereafter and the share of elementary occupations in total
employment declined to 27.78 per cent in 2011-12, which is lower than what it was in 1983-84.
Table 2: Occupational Structure of Employment
1983-84 1993-94 2009-10 2011-12
Legislator, Senior Officers and Managers 1.13 1.95 5.17 6.76
Professionals 1.45 1.69 3.51 3.54
Technical and Associate Professionals 2.20 2.42 2.76 3.11
Clerks 1.66 1.72 1.77 1.88
Services, Shop and Market Sales Workers 6.37 7.28 6.65 7.36
Skilled Agriculture and Fishery Workers 44.54 40.05 34.33 31.77
Craft Related Trade Workers 9.50 10.27 11.23 12.96
Plant and Machine Operator 2.97 3.26 3.49 4.64
Elementary Occupations 29.82 30.92 30.60 27.78
Missing NCO Code 0.34 0.42 0.36 0.10 Source: Author’s compilation from NSS unit level data
The supply of labour in India has increased substantially over the last three decades. In 1983-84,
286 million workers were active in the Indian labour market; this increased to 420 million in 2011-
12. The quantitative increase in labour force also coincided with a significant qualitative
improvement. In 1983-84, the Indian workforce was largely dominated by illiterate workers, while
the share of workers with secondary and tertiary education was very low (Table 3). However, the
educational profile of workers has changed substantially over last three decades. The share of
illiterate workers in the total workforce has declined from more than 60 per cent in 1983-84 to 31
per cent in 2011-12. During same period, the share of workers with primary and secondary
education has increased roughly by 8 and 5 percentage points respectively. The supply of labour
with tertiary education has increased the most. The number of workers with tertiary education
increased from 6.7 million in 1983 to 70.6 million in 2011-12. In line with this, the share of workers
with tertiary education in the total workforce increased from 2.3 per cent to 16.3 per cent.

5
Table 3: Education profile of Indian Labour Force
1983-84 2011-12
No. in Million % Share No. in Million % Share
Not Literate 167.11 58.33 129.07 30.70
Literate Without Formal Schooling 5.98 2.09 2.01 0.48
Below Primary 26.50 9.25 43.84 10.43
Primary 36.02 12.57 56.05 13.33
Middle 25.48 8.90 69.16 16.45
Secondary 18.57 6.49 49.64 11.81
Above Secondary 6.79 2.37 70.66 16.31
Higher Secondary 27.75 6.60
Diploma/Certificate Course 5.95 1.41
Graduate 26.88 6.39
Postgraduate And Above 10.08 2.40
Total 286.487 420.42 Source: Author’s Compilation from NSSO Data, Various Rounds
3. Data Sources and Methodology
3.1 Data Sources
Data needed for the estimation of task content of jobs has been drawn from two different sources.
Following the standard literature, we have used the Occupational Information Network (O-Net)
database as a source of information on task intensities1 of different occupations. Two editions of
O-Net dataset, O-Net 2003 and O-Net 2014, are available. However, in this paper, we use only O-
Net 2003. The information about various task intensities in O-Net data is tabulated according to
the Standard Occupation Classification (SOC). In order to make it comparable with Indian data,
we prepared a crosswalk between SOC and NCO 20042 at 3-digit level of disaggregation.
Detailed information on employment in Indian economy has been taken from several rounds of
the Employment and Unemployment Survey (EUS)3 conducted by the National Sample Survey
Office (NSSO). During the period 1983-84 to 2009-10, six rounds of survey have been conducted,
at an interval of five years. However, in order to check the impact of the global financial crisis on
employment, another major survey, with broad coverage, was conducted in 2011-12. In this paper,
we use data from all seven rounds. Apart from providing statistics on labour conditions and
employment and unemployment, the EUS also identifies the industry affiliation and occupation of
1 Various task intensities in O-Net data have been measured at a scale of 1 to 5. For a detailed overview of O-Net
data please see Hardy et al (2015)
2 The crosswalk tables are available on demand.
3 EUS is a quinquennial survey conducted by National Sample Survey Office, MOSPI - GOI is the official source of
information on employment and labour conditions in India.

6
individual workers. However, the industrial as well as the occupational classification used in
different rounds is not the same. The National Classification of Occupations (NCO) 1968 was used
in the 38th (1983-84), 43rd (1987-88), 50th (1993-94), 55th (1999-2000) and 61st (2004-05)
rounds of EUS, while NCO 2004 has been used in the remaining two rounds. In order to make the
data comparable, we work out a crosswalk between NCO 1968 and NCO 2004 at the three-digit
level, using the official concordance table. Similarly, we work out a concordance between different
National Industrial Classifications (NIC) at the one-digit level to make the sectors comparable.
3.2 Methodology
After sorting out comparability issues, we pooled the data from all seven rounds and assigned the
sixteen task items to each individual according to their occupation code (Figure 1). Having
assigned the task items to NSS data, we followed the standard procedure to calculate the task
content of jobs. Following Hardy et al (2015), first we standardised each task item to make the
data comparable using the following formula.
⋀ 𝑖 ⋀ 𝑗 ∈ 𝐽 𝑡𝑠𝑡𝑑 = 𝑡𝑖𝑗 − 𝜇𝑗
𝛿𝑗, . . 1
Where; j is the set of 16 task items, µ is weighted average of jth task item and δ is the standard
deviation of jth task item, i is the ith observation in EUS data and w is weight assigned to ith
observation in EUS data. The weighted average and standard deviation of the task item is
calculated as follow.
⋀ 𝑗 ∈ 𝐽 𝜇𝑗 = ∑ 𝑡𝑖𝑗𝑤𝑖
𝑁𝑖=1
∑ 𝑤𝑖𝑁𝑖=1
. . 2
⋀ 𝑗 ∈ 𝐽 𝛿𝑗 = √(∑ 𝑤𝑖(𝑡𝑖𝑗 − 𝜇𝑗
𝑁𝑖=1
∑ 𝑤𝑖𝑁𝑖=1
)
2
. . 3
After standardising the task items, we calculated the five main task content measures: non-routine
cognitive analytical, non-routine cognitive interactive, routine cognitive, routine manual and non-
routine manual, by adding up the appropriate task items as depicted in Figure 1 and subsequently
standardising the five task contents. In order to make the results comparable, we also rescale the
five task contents so that the initial value of all five task contents become 0.

7
Figure 1: Task Content Measures
Source: prepared based on Acemoglu and Autor (2011)
4. Task Content of Jobs in India
4.1 Overall Trend
The five task intensities, calculated using the methodology explained above, are shown in Figure
2. Our results show that the task content of jobs in India has changed significantly over the last
three decades. In line with the global trend, non-routine cognitive task intensities of jobs in India
have increased. Between 1983-84 and 2011-12, the non-routine congestive analytical and non-
routine cognitive personal task content of jobs in India increased by 10 and 9 percentage points
respectively. Notably, the most significant increase in non-routine cognitive task intensities has
been observed after 1998. The non-routine cognitive analytical task intensity grew on an average,
Task
Cognitive
Non-routine
Analytical
1. Analysing data / information
2. Thinking creatively
3. Interpreting information for others
Interactive
4. Establishing & maintaining relations
5. Guiding, directing & motivating subordinates
6. Coaching/developing others
Routine 7. Repeating the same task
8. Being exact or accurate
9.Doing structured rather than unstructured work
Manual
Routine
10. Pace determined by speed of machine 11. Controlling machine and processes 12. Performing task involving repetitive motions
Non-routine 13. Operating vehicles, mechanised devices or
equipments
14. Using hands to handle, control or feel object tools or controls
15. Doing work requiring manual dexterity
16. Doing work requiring spatial orientation

8
by 0.14 percentage points between 1983-84 and 1998-99. However, the average rate of growth
increased to 0.57 percentage points after 1998-99. Similarly, the average rate of increase in non-
routine cognitive interactive task intensity has been four time higher in the post 1998-99 period as
compared to pre 1998-99 period.
Manual task contents, both routine and non-routine, declined during 1983-84 to 2011-12. The
decline in non-routine manual task intensity has been significantly higher than routine manual task
intensity. Our results further show that routine cognitive task intensity of Indian jobs has not
declined. In fact, the routine cognitive task intensity of Indian jobs has increased by 3.2 percentage
points between 1983-84 and 2011-12. However, most of the observed increase in routine cognitive
task intensity took place before 1998-99. Since 1998-99, the routine cognitive task intensity has
been rather constant. A sectoral analysis suggests that routine cognitive task has been constant
because of the services and agriculture sectors. Both these sectors have witness increase in routine
cognitive task intensity. In contrast, there has been a complete de-routinisation of jobs in the
manufacturing sector after 1998 (Annexure 1). It perhaps shows that the Indian manufacturing
sector has gone for rapid automation since 1998 when 100 percent foreign direct investment was
allowed in most manufacturing industries.
Figure 2: Evolution of Task Content of Jobs in India
-15.00
-10.00
-5.00
0.00
5.00
10.00
15.00
1983 1987 1993 1998 2004 2009 2011
Non-routine cognitive analytical Non-routine cognitive interactive
Routine cognitive Routine Manual
Non-routine manual
9
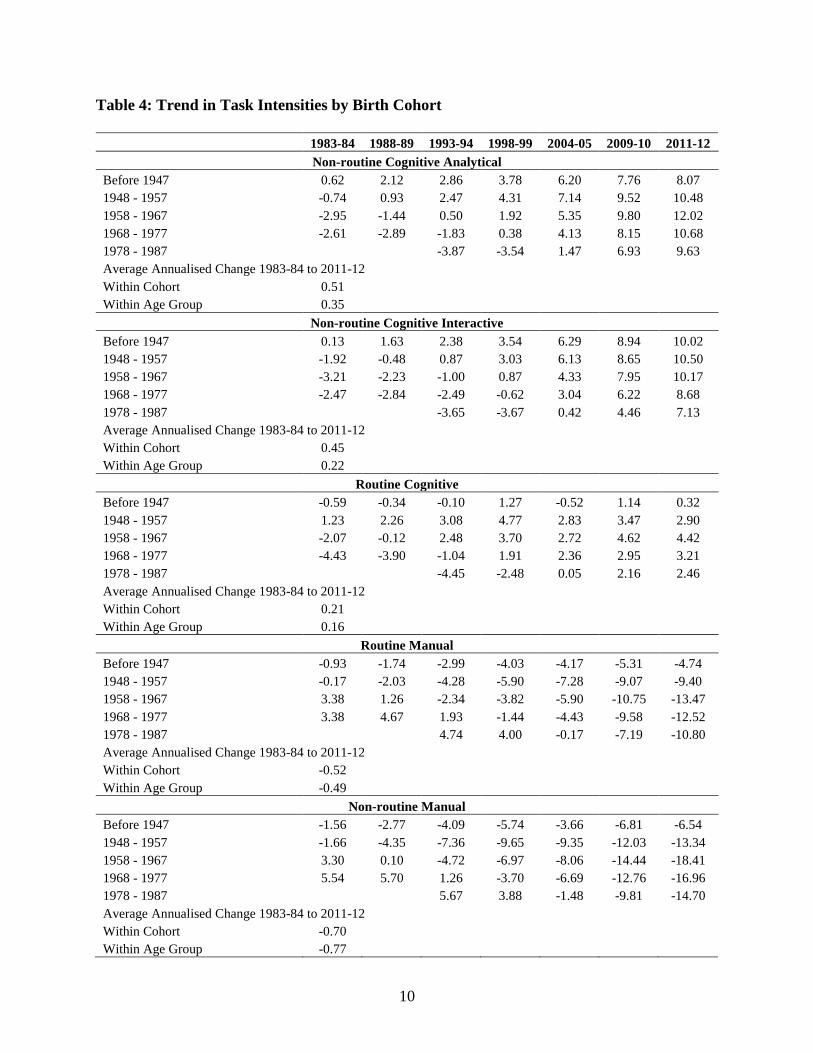
4.2 Intergenerational Dimensions of Task Content
The overall change in task content can be driven by the cohort effect, the unobserved
heterogeneity. Since the younger generation has access to better and more relevant educational
opportunity, it is possible that young entry cohorts can have a higher level of analytical activities.
In fact, in the case of Poland, Hardy et al (2016) have shown that task content of jobs in Poland
has been strongly driven by the cohort effect. To evaluate this possibility, we estimated the task
intensity for different birth cohorts. The results are shown in Table 4. The first birth cohort consists
of individual born before 1947, the second cohort consists of individual born between 1948 and
1957 and third cohort consists of individuals born between 1958 and 1967 and so on. A birth cohort
can be followed by moving horizontally along the same row, while the same age group can be
tracked by moving diagonally downward. Within cohorts, the change in particular task content can
be attributed to age and time effects. The age effect depicts how the task content of a given cohort
changes as the cohort ages while the time effect explains how the task content of a cohort changes
due to macro economic shocks. In contrast, the change within an age group could be attributed to
cohort or time effects. The cohort effect describes the difference between cohorts that may be
because of differences in educational opportunities (Spitz-Oener 2006).
Our results in Table 4 show two interesting results. First, it is shows that older cohorts have
experienced the same trend as younger cohorts. Notably, in line with Hardy et al (2016), we found
that the relative change in the task intensities of the younger cohorts has been higher than the older
cohorts. For example, the non-routine cognitive analytical task intensity of cohort born between
before 1947 increased by 7.55 percentage points while for all age cohorts born after 1958, the
increase in non-routine cognitive analytical task intensity during the studies period was higher than
13 percentage points. Similarly, the changes in manual task intensities have also been higher for
younger cohorts. However, the difference is not as stark as report by Hardy et al (2016) for Poland.
Second, it is evident from the table that change in task intensities in India has occurred both within
age group as well as within birth cohorts. Notably, for all task intensities except the Non-routine
manual task intensity, the changes in within cohorts has been more pronounced than the changes
among age groups. For example, the non-routine cognitive analytical task intensity within a cohort
increased by 0.51 percentage points annually while the average annual increase in among age
groups was only 0.35 percentage points. These results suggest that the time effect rather than age
and cohort effect has been the prime driver of change in task intensities observed during 1983-84
to 2011-12.
10
Table 4: Trend in Task Intensities by Birth Cohort
1983-84 1988-89 1993-94 1998-99 2004-05 2009-10 2011-12
Non-routine Cognitive Analytical
Before 1947 0.62 2.12 2.86 3.78 6.20 7.76 8.07
1948 - 1957 -0.74 0.93 2.47 4.31 7.14 9.52 10.48
1958 - 1967 -2.95 -1.44 0.50 1.92 5.35 9.80 12.02
1968 - 1977 -2.61 -2.89 -1.83 0.38 4.13 8.15 10.68
1978 - 1987 -3.87 -3.54 1.47 6.93 9.63
Average Annualised Change 1983-84 to 2011-12 Within Cohort 0.51 Within Age Group 0.35
Non-routine Cognitive Interactive
Before 1947 0.13 1.63 2.38 3.54 6.29 8.94 10.02
1948 - 1957 -1.92 -0.48 0.87 3.03 6.13 8.65 10.50
1958 - 1967 -3.21 -2.23 -1.00 0.87 4.33 7.95 10.17
1968 - 1977 -2.47 -2.84 -2.49 -0.62 3.04 6.22 8.68
1978 - 1987 -3.65 -3.67 0.42 4.46 7.13
Average Annualised Change 1983-84 to 2011-12 Within Cohort 0.45 Within Age Group 0.22
Routine Cognitive
Before 1947 -0.59 -0.34 -0.10 1.27 -0.52 1.14 0.32
1948 - 1957 1.23 2.26 3.08 4.77 2.83 3.47 2.90
1958 - 1967 -2.07 -0.12 2.48 3.70 2.72 4.62 4.42
1968 - 1977 -4.43 -3.90 -1.04 1.91 2.36 2.95 3.21
1978 - 1987 -4.45 -2.48 0.05 2.16 2.46
Average Annualised Change 1983-84 to 2011-12 Within Cohort 0.21 Within Age Group 0.16
Routine Manual
Before 1947 -0.93 -1.74 -2.99 -4.03 -4.17 -5.31 -4.74
1948 - 1957 -0.17 -2.03 -4.28 -5.90 -7.28 -9.07 -9.40
1958 - 1967 3.38 1.26 -2.34 -3.82 -5.90 -10.75 -13.47
1968 - 1977 3.38 4.67 1.93 -1.44 -4.43 -9.58 -12.52
1978 - 1987 4.74 4.00 -0.17 -7.19 -10.80
Average Annualised Change 1983-84 to 2011-12 Within Cohort -0.52 Within Age Group -0.49
Non-routine Manual
Before 1947 -1.56 -2.77 -4.09 -5.74 -3.66 -6.81 -6.54
1948 - 1957 -1.66 -4.35 -7.36 -9.65 -9.35 -12.03 -13.34
1958 - 1967 3.30 0.10 -4.72 -6.97 -8.06 -14.44 -18.41
1968 - 1977 5.54 5.70 1.26 -3.70 -6.69 -12.76 -16.96
1978 - 1987 5.67 3.88 -1.48 -9.81 -14.70
Average Annualised Change 1983-84 to 2011-12 Within Cohort -0.70 Within Age Group -0.77

11
4.3 Structural Change and Task Content
Given the fact that the task intensity of jobs varies from sector to sector, a shift in employment
from one sector to another can potentially change the overall task composition of jobs in a country.
In fact, Barany and Siegel (2015) have argued that job polarisation in the US has been closely
linked to the shift in employment from manufacturing to services. India has also witnessed a
significant change in the structure of employment over the last three decades. In order to quantify
the role of structural change in shaping task intensities, we use shift share decomposition.4 We
decompose the observed change in five task intensities into three components; (i) within sector
change, i.e., contribution of change in task intensity within a particular sector over time, (ii)
between sector change, i.e., contribution of change in the structure of employment and (iii)
contribution of the interaction between these two. The results of our shift share analysis are shown
in Figure 3.
Figure 3: Decomposition of change in task intensities in India during 1983-84 to 2011-12
It is evident from Figure 3 that the change in non-routine cognitive analytical task intensity is
strongly driven by within sector change. Our analysis suggests that more than 77 per cent of the
change in non-routine cognitive analytical task intensity can be attributed to within sector change,
while another 11 per cent can be attributed to the interaction between within and between sector
4 Mathematically, the shift share decomposition can be depicted as ∆𝑇𝑗𝑡 = ∑ (∆𝐸𝑠𝑡 𝛾∗
𝑠𝑡𝑠 ) + ∑ (∆𝛾𝑠𝑡𝐸∗𝑠𝑠 ) +
∑ (∆𝐸𝑠𝑡∆𝛾𝑠𝑡𝑠 ) where E is share of sector in total employment, 𝛾 is task intensity, s stands for sector, t stands for
time, overhead * denotes the initial value. The first term in the equation captures the between sector effect, second
terms captures the within sector effect and third terms captures the interaction between within and between effect.
-16.00
-11.00
-6.00
-1.00
4.00
9.00
Non-routine
cognitive
analytical
Non-routine
cognitive
interactive
Routine cognitive Routine manual Non-routine
manual
Interaction Between Sector Within Sector
12
effects. Only 12 per cent of the change in non-routine cognitive analytical task intensity can be
attributed to a change in the employment structure. The within sector effect has been even stronger
in the case of non-routine cognitive interactive task intensity as it accounts for more than 88 per
cent of the observed increase in non-routine cognitive interactive task intensity. Notably, the
contribution of a change in employment structure to a change in non-routine cognitive interactive
task intensity has been 0. In contrast, structural shift in employment has played a significant role
in shaping the remaining three task intensities. Almost 50 per cent of the observed change in
routine and manual task intensities has been driven by a shift in employment from high routine
and manual task intensive sectors to less routine and manual task intensive sectors.
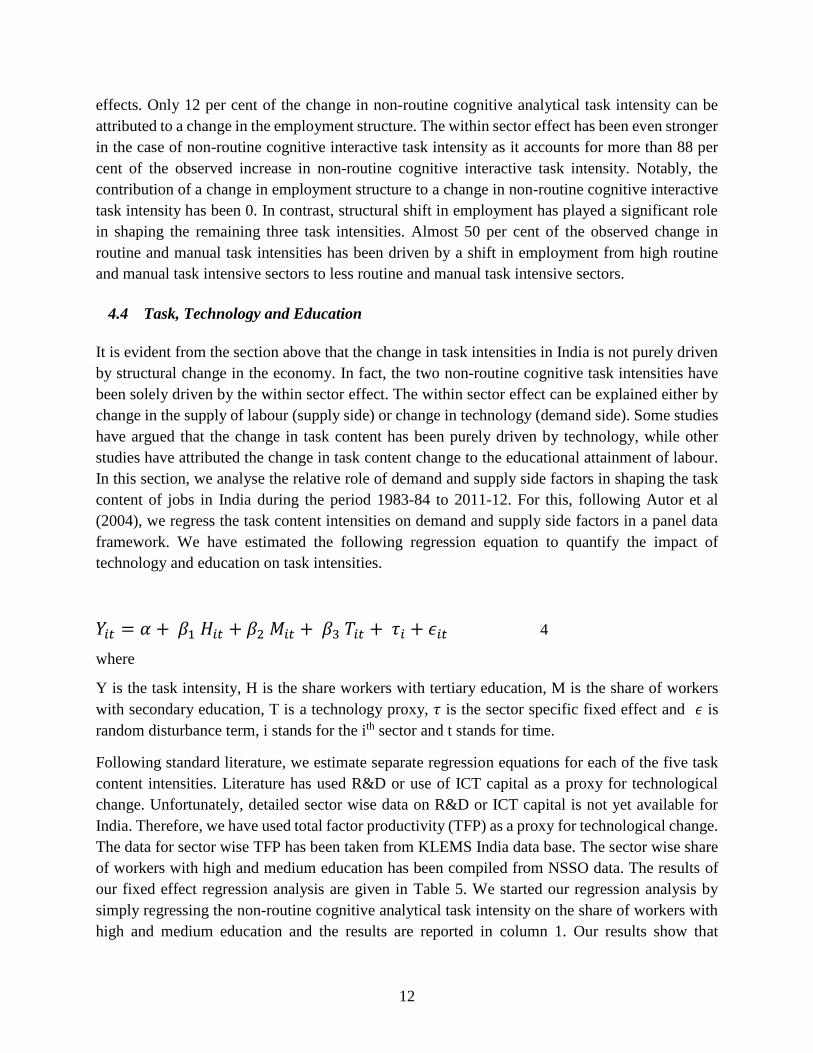
4.4 Task, Technology and Education
It is evident from the section above that the change in task intensities in India is not purely driven
by structural change in the economy. In fact, the two non-routine cognitive task intensities have
been solely driven by the within sector effect. The within sector effect can be explained either by
change in the supply of labour (supply side) or change in technology (demand side). Some studies
have argued that the change in task content has been purely driven by technology, while other
studies have attributed the change in task content change to the educational attainment of labour.
In this section, we analyse the relative role of demand and supply side factors in shaping the task
content of jobs in India during the period 1983-84 to 2011-12. For this, following Autor et al
(2004), we regress the task content intensities on demand and supply side factors in a panel data
framework. We have estimated the following regression equation to quantify the impact of
technology and education on task intensities.
𝑌𝑖𝑡 = 𝛼 + 𝛽1 𝐻𝑖𝑡 + 𝛽2 𝑀𝑖𝑡 + 𝛽3 𝑇𝑖𝑡 + 𝜏𝑖 + 𝜖𝑖𝑡 4
where
Y is the task intensity, H is the share workers with tertiary education, M is the share of workers
with secondary education, T is a technology proxy, 𝜏 is the sector specific fixed effect and 𝜖 is
random disturbance term, i stands for the ith sector and t stands for time.
Following standard literature, we estimate separate regression equations for each of the five task
content intensities. Literature has used R&D or use of ICT capital as a proxy for technological
change. Unfortunately, detailed sector wise data on R&D or ICT capital is not yet available for
India. Therefore, we have used total factor productivity (TFP) as a proxy for technological change.
The data for sector wise TFP has been taken from KLEMS India data base. The sector wise share
of workers with high and medium education has been compiled from NSSO data. The results of
our fixed effect regression analysis are given in Table 5. We started our regression analysis by
simply regressing the non-routine cognitive analytical task intensity on the share of workers with
high and medium education and the results are reported in column 1. Our results show that

13
educational upskilling is positively associated with non-routine cognitive analytical task intensity.
In particular, the coefficient of the share of workers with tertiary education is positive and
significant at one per cent. In column 2, we control for technology. The inclusion of TFP in the
equation has two significant effects. First, it increases the overall explanatory power of the
equation as the value of r square goes up substantially. Second and more importantly, the inclusion
of TFP in the equation reduces the magnitude of the coefficient of tertiary education and renders
it insignificant. The coefficient of TFP turned out to be positive and significant. These results
suggest that the increase in non-routine cognitive analytical task intensity is driven by
technological change rather than upskilling.
In column 3 and 4, we repeat our specifications for non-routine cognitive interactive task intensity.
The results are similar to that for non-routine cognitive analytical task intensity; the non-routine
cognitive interactive task intensity in India is also driven by technology. We do find a positive
association between the share of workers with tertiary education and non-routine cognitive
interactive task intensity. However, the association turned insignificant when we included TFP in
regression equation. In column 5 and 6 of table 5, we repeat the same specifications for routine
cognitive task intensity. Our results suggest that an increase in the relative supply of workers with
medium education is positively associated with routine cognitive task intensity. However, a simple
back of the envelope calculation suggests that an increase in the supply of workers with medium
education explains only 14 per cent of the observed increase in routine cognitive task intensity.
Moreover, a very low value for R square suggests that the model has a very low explanatory power.
Given the fact that routine cognitive task intensity is mainly driven by structural change, these
results are not very surprising.
Our results suggest that upskilling has been the main driver of change in routine and non-routine
manual task intensities. The results in column 7 and 8 of Table 5 show that an increase in the
relative supply of workers with tertiary as well as secondary education is negatively associated
with routine manual task intensity. The supply of workers with tertiary education during 1983-84
to 2011-12 has increased by 14.4 percentage points. A simple decomposition of change in routine
manual tasks, using the coefficient reported in column 8 of Table 5, shows the hat around 57 per
cent of the change in routine task intensity can be attributed to the increase in the supply of workers
with tertiary education alone, while another 20 per cent can be attributed to the increase in supply
of workers with secondary education.

14
Table 5: Fixed Effect Regression: Change in Task content, Technological change and Education
Non-routine
Cognitive
Analytical
Non-routine
Cognitive
Interactive
Routine
Cognitive Routine Manual
Non-routine Manual
Physical
1 2 3 4 5 6 7 8 9 10
High Education Share 0.029*
(.003)
0.004
(.005)
0.029*
(.004)
0.005
(.006)
0.002
(.003)
0.001
(.004)
-.042*
(.004)
-.041*
(.006)
-.049*
(.005)
-.053*
(.006)
Medium Education
Share
-0.007
(.011)
0.004
(.003)
-0.007
(.012)
0.003
(.002)
.009***
(.004)
.009**
(.002)
-.037*
(.005)
-.038*
(.004)
-.053*
(.002)
-.052*
(.003)
Total Factor
Productivity .013*
(.002) .012*
(.003) .000
(.00) -.001
(.002) -0.001
(.003)
No. of Observations 42 42 42 42 42 42 42 42 42 42
Within R Square 0.35 0.62 0.30 0.55 0.02 0.02 .56 .57 0.57 0.58
Note: Estimation using Driscoll Kraay standard error. The standard error is given in parenthesis. * Significant at 1 per cent level
* Significant at 5 per cent level
*** Significant at 10 per cent level

15
Similar results can be seen for non-routine manual physical task intensity in columns 9 and 10
of Table 5. The results show that the coefficient of TFP is not significantly different from 0,
while supply of workers with tertiary and secondary education is negatively associated with
non-routine manual physical task intensity. Our decomposition exercise suggests that the
increase in the supply of workers with tertiary and secondary education accounts for around 55
and 20 per cent respectively of the observed change in non-routine manual physical task
intensity. To sum up, our regression analysis suggests that technology is driving the change in
two non-routine cognitive task intensities, while upskilling has shaped manual task intensities.
4.5 Social Dimension of Task
With the changing nature of jobs, the quality of education is going to be the key for job seekers
in the Indian labour market. Unfortunately, India has a very complicated and inefficient
education system. It has some very good private schools where the quality of education is
comparable to global standards. However, access to these schools is primarily restricted to the
economically well off section of the society. In contrast, a large section of Indian society still
relies on government schools for the education of their children. It is widely documented that
government run schools are in disarray and fail miserably to impart basic reading and
computational skills to their students. A recent survey shows that 74 per cent of students in
Delhi government run schools fail to read a paragraph in Hindi, the native language, while 64
per cent student fail to do simple 3 digits by one digit division. Given this stark difference in
the quality of education between government and private schools, the changing nature of jobs
can further exacerbate the existing economic inequality. Our data does not allow us to examine
the task content of jobs according to the economic status of an individual. However, it does
allow us to examine the task content of jobs as per the social status of an individual. Since the
incidence of poverty is higher among the socially weaker sections, i. e. Scheduled Castes and
Scheduled Tribes, we estimate the task content of jobs performed by different social groups in
Indian society to gauge the implications of the changing task consent of jobs for social and
economic inequality. Our analysis suggests that cognitive task intensities of jobs performed by
socially forward castes, denoted as others, is very high. It implies that the employment of
socially forward sections of society is concentrated in occupations which require cognitive
skills (Figure 4). In contrast, the employment of socially backward castes, specifically the
Scheduled Castes, is more concentrated in occupations which require manual skills and
therefore, the manual task content of their jobs is relatively high. Since the overall demand for
manual tasks is declining, these results suggest that the changing task content of jobs in India
may pose a big challenge for socially backward communities.

16
Figure 4: Average Task Content of Jobs by Social Groups
However, a mere decline in manual jobs may not hurt socially backward sections if their
participation in cognitive jobs goes up. A temporal analysis of task content by social groups
suggests that the trend in task intensities has been similar for all social groups. It implies that
the change in task intensities has not been driven by any single social group. However, as
expected, the contribution of different social groups to the observed change in different task
intensities varies significantly. We estimated the contribution of different social groups in the
change of three task contents that have increased over the period and results are shown in Figure
5. Contrary to expectations, our analysis suggests that the contribution of two socially
backward communities to the change in non-routine cognitive analytical (NRCA) task content
has not been lower than their share in total population. In fact, the contribution of schedule
tribes to the change in NRCA task content has been significantly higher than their share in total
population5 while in the case of schedule castes, it has been marginally lower than their share
in the total population. Our results further suggest that the combined contribution of the two
socially backward communities to the observed change in non routine cognitive interactive task
intensity has also been more or less in line with their share in total population. However, if we
look at the contribution of these two groups separately, we do find that the contribution of
scheduled castes to the change in non-routine cognitive interactive task content has been
significantly lower than their share in total population, while the contribution of scheduled
tribes has been much higher than their share in total population. Therefore, these results suggest
that socially weaker sections have not been lagging behind as far as their participation in non-
routine cognitive task intensive occupations is concerned and this may be due to the
government’s affirmative action in the form of reservation in education and jobs for these
groups.
5 According to the 2011 Census, schedule tribes and schedule castes account for 8.6 and 16.8 per cent
respectively of the Indian population.

17
Figure 5: Contribution to Change in Non-routine Cognitive Task Contents
5. Conclusion
The ongoing digital revolution has brought enormous benefits. It has increased productivity
and made life much easier. However, it has also created significant challenges, especially in
labour markets. Studies have shown that the rapid improvement in digital technology and the
consequent decline in the cost of automation have changed the task content of jobs in many
countries. In this paper, we analyse the task content of jobs in India between 1983 and 2011.
Combining the O-Net data with NSS EUS data, we find that, in line with global trends, the
non-routine cognitive analytical as well as the non-routine cognitive interactive task intensity
of jobs has increased in India, while manual task intensity has declined. However, unlike in the
US and Europe, the routine cognitive task content has not declined in India. Moreover, we find
that the change in task intensities has not been driven by cohort effect as all birth cohorts have
witnessed a similar trend in their task intensities. Our analyses further shows that the change
in the two non-routine cognitive task contents has been strongly related to the change in total
factor productivity. Therefore, technology seems to be a major factor behind the evolution of
non-routine cognitive tasks in India. However, this needs further investigation as change in
TFP is not a direct measure of technology. Our results show that manual task intestines have
been shaped by structural change and change in the supply of labour.
The changing task content of jobs in India has significant implications for education and skill
formation. With the rapidly declining manual task intensities of jobs, the role of education and
skill has increased substantially in the Indian labour market. The latest Talent Shortage Survey
corroborates this and shows that 48 per cent of employers in India face difficulties in filling
job vacancies due to skill and talent shortage (Manpower Group 2016). If not addressed
urgently, skill shortage can be fatal for growth and job creation in India. Fortunately, the
Government of India has realised the growing role of skills and has started an ambitious skilling
69.9 75.268.7
15.711.5 18.9
14.4 13.3 12.4
0%
10%
20%
30%
40%
50%
60%
70%
80%
90%
100%
Non-routine cognitiveanalytical
Non-routine cognitiveinteractive
Routine cognitive
Scheduled Tribes Scheduled castes Others

18
programme under the Pradhan Mantri Kaushal Vikas Yojana (PMKVY). With this scheme the
government aims to provide soft and other industry relevant skills to 10 million youths. Apart
from this, the government has also notified National Apprenticeship Promotion Scheme to
provide apprenticeship training to 5 million youth by 2019-20. Although, these are steps in the
right direction, they are not directed towards cognitive skill formation and therefore, cannot be
a substitute for the quality of formal education given at various levels. Government has to
introduce the short term skilling programmes because the formal education system in India has
failed miserably at all levels. From time to time, research has highlighted the failure of schools
in India to impart basic reading and computational skills to their students. A recent survey by
the Delhi government’s Directorate of Education shows that 74 per cent of students in Delhi
government run schools failed to read a paragraph in Hindi, the native language, while 64 per
cent student failed to do simple 3 digits by one digit division. With this kind of basic schooling,
it is no wonder that the quality of vocational and higher education in India has remained
substandard. Employers in India frequently argue that youth even with graduate degrees are
not employable. Since the demand for cognitive skills is expected to increase further in the
years to come, the government should focus more on the quality of education at all levels to
address the issue of growing skill shortage.

19
References
Acemoglu, D., Autor, D. (2011): ‘Skills, Tasks and Technologies: Implications for
Employment and Earnings’, In: Handbook of Labor Economics. Elsevier, pp. 1043–
1171.
Autor D. H. and D. Dron (2013): “The Growth of Low-Skill Service Jobs and the Polarization
of the US Labor Market”, American Economic Review Vol. 103(5): 1553–1597.
Autor D., Levy F., Murnane R. (2003): ‘The Skill Content of Recent Technological Change:
An Empirical Exploration’, Quarterly Journal of Economics 118 (4).
Bound, John and George Johnson (1992): “Changes in the Structure of Wages in the 1980s:
An Evaluation of Alternative Explanations.” American Economic Review Vol. 83 (3):
371-392.
De la Rica S., Gortazar L. (2016): ‘Differences in Job De-Routinization in OECD Countries:
Evidence from PIAAC’, IZA Discussion Paper No. 9736.
Goos M. Manning A and Salomons A. (2009): “Job Polerization in Europe” American
Economic Review Papers and Proceedings, Vol. 99 (2).
Goos M., Manning A., Salomons A. (2014) ‘Explaining Job Polarization: Routine-Biased
Technological Change and Offshoring’, American Economic Review Vol. 104 (8),
2509–2526.
Hardy W., Keister R., Lewandowski, P. (2015): ‘Do entrants take it all? The evolution of task
content of jobs in Poland’, IBS Working Paper 10/2015.
Hardy W., Keister R., Lewandowski, P. (2016): ‘Technology or Upskilling: Trend in the Task
Composition of Jobs in Central and Eastern Europe’, HKUST IEMS Working Paper
No. 2016-40.
Katz, Lawrence and Kevin M. Murphy (1992): “Changes in Relative Wages, 1963-1987:
Supply and Demand Factors.” Quarterly Journal of Economics Vol. 107 (1): 35-78.
Levy, Frank and Richard J. Murnane (1992): “U.S. Earnings and Earnings Inequality: A
Review of Recent Trends and Proposed Explanations.” Journal of Economic
Literature Vol. 30 (3): 1333-1381.
Machin S., Van Reenen J. (1998): ‘Technology and changes in skill structure: evidence from
seven OECD countries’, Quarterly Journal of Economics Vol. 113 (4): 1215–1244.
Manpower Group (2016): Talent Shortage Survey, Manpower Group.
Michaels G, Natraj A. and J. V. Reenen (2013): “Has ICT Polarized Skill Demand? Evidence
from Eleven Countries over 25 years”, NBER Working Paper No. 16138

20
Michaels G., Natraj A., Van Reenen, J. (2014): ‘Has ICT polarized skill demand? Evidence
from eleven countries over twenty five years’, Review of Economics and Statistics Vol.
96 (1): 60-77.
Salvatori A. (2015): ‘The Anatomy of Job Polarization in the UK’, IZA Discussion Papers
9193.
Spitz‐Oener A. (2006): ‘Technical Change, Job Tasks, and Rising Educational Demands:
Looking outside the Wage Structure’, Journal of Labor Economics Vol. 24 (2): 235-
270.
Vashisht P. (2017): ‘Destruction or Polarization: Estimating the Impact of Technology on
Manufacturing Jobs in India’, ICRIER Working Paper 334.

21
Annexure 1: Changing task Content of Manufacturing Sector Jobs
-2
-1.5
-1
-0.5
0
0.5
1
1.5
1983 1988 1993 1998 2004 2009 2011
Non Routine Cognitive Analytical Non Routine Cognitive Interactive
Routine Cognitive Routine Manual
Non Routine Manual Physical
1
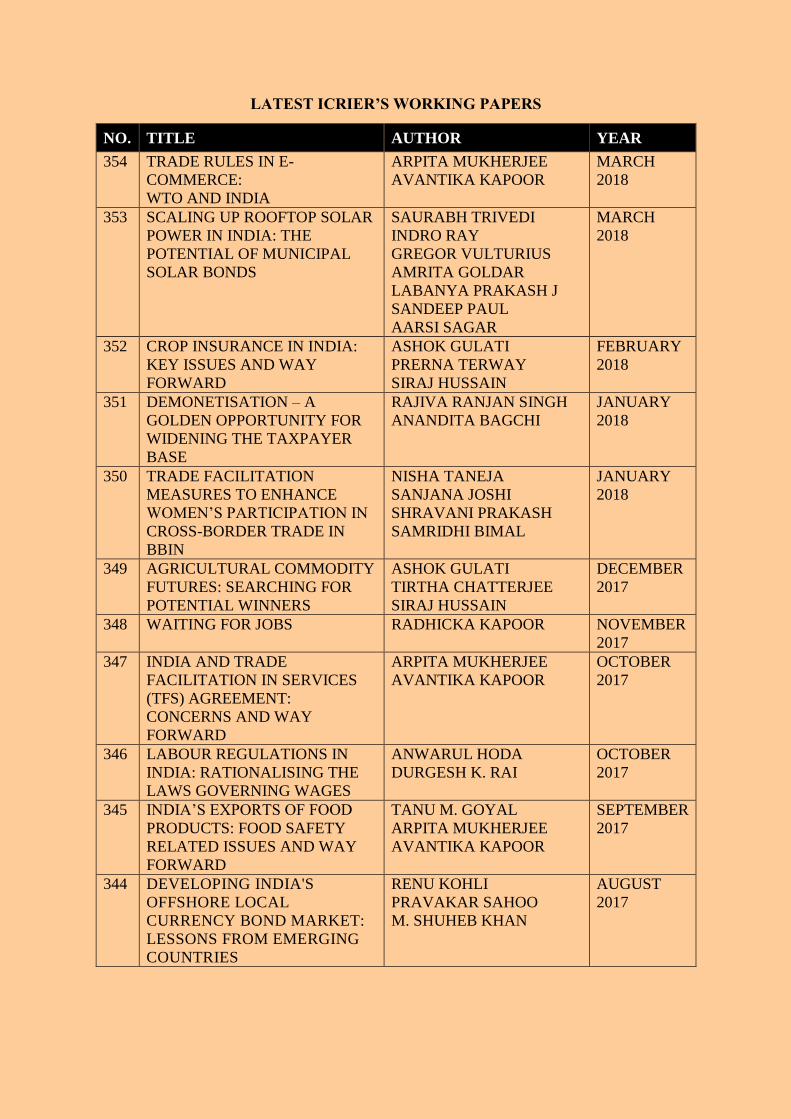
LATEST ICRIER’S WORKING PAPERS
NO. TITLE AUTHOR YEAR
354 TRADE RULES IN E-
COMMERCE:
WTO AND INDIA
ARPITA MUKHERJEE
AVANTIKA KAPOOR
MARCH
2018
353 SCALING UP ROOFTOP SOLAR
POWER IN INDIA: THE
POTENTIAL OF MUNICIPAL
SOLAR BONDS
SAURABH TRIVEDI
INDRO RAY
GREGOR VULTURIUS
AMRITA GOLDAR
LABANYA PRAKASH J
SANDEEP PAUL
AARSI SAGAR
MARCH
2018
352 CROP INSURANCE IN INDIA:
KEY ISSUES AND WAY
FORWARD
ASHOK GULATI
PRERNA TERWAY
SIRAJ HUSSAIN
FEBRUARY
2018
351 DEMONETISATION – A
GOLDEN OPPORTUNITY FOR
WIDENING THE TAXPAYER
BASE
RAJIVA RANJAN SINGH
ANANDITA BAGCHI
JANUARY
2018
350 TRADE FACILITATION
MEASURES TO ENHANCE
WOMEN’S PARTICIPATION IN
CROSS-BORDER TRADE IN
BBIN
NISHA TANEJA
SANJANA JOSHI
SHRAVANI PRAKASH
SAMRIDHI BIMAL
JANUARY
2018
349 AGRICULTURAL COMMODITY
FUTURES: SEARCHING FOR
POTENTIAL WINNERS
ASHOK GULATI
TIRTHA CHATTERJEE
SIRAJ HUSSAIN
DECEMBER
2017
348 WAITING FOR JOBS RADHICKA KAPOOR NOVEMBER
2017
347 INDIA AND TRADE
FACILITATION IN SERVICES
(TFS) AGREEMENT:
CONCERNS AND WAY
FORWARD
ARPITA MUKHERJEE
AVANTIKA KAPOOR
OCTOBER
2017
346 LABOUR REGULATIONS IN
INDIA: RATIONALISING THE
LAWS GOVERNING WAGES
ANWARUL HODA
DURGESH K. RAI
OCTOBER
2017
345 INDIA’S EXPORTS OF FOOD
PRODUCTS: FOOD SAFETY
RELATED ISSUES AND WAY
FORWARD
TANU M. GOYAL
ARPITA MUKHERJEE
AVANTIKA KAPOOR
SEPTEMBER
2017
344 DEVELOPING INDIA'S
OFFSHORE LOCAL
CURRENCY BOND MARKET:
LESSONS FROM EMERGING
COUNTRIES
RENU KOHLI
PRAVAKAR SAHOO
M. SHUHEB KHAN
AUGUST
2017

2
About ICRIER
Established in August 1981, ICRIER is an autonomous, policy-oriented, not-for-profit,
economic policy think tank. ICRIER’s main focus is to enhance the knowledge content of
policy making by undertaking analytical research that is targeted at informing India’s policy
makers and also at improving the interface with the global economy.
ICRIER’s office is located in the institutional complex of India Habitat Centre, New Delhi.
ICRIER’s Board of Governors include leading academicians, policymakers, and
representatives from the private sector. Dr. Isher Ahluwalia is ICRIER’s chairperson.
Dr. Rajat Kathuria is Director and Chief Executive.
ICRIER conducts thematic research in the following eight thrust areas:
Macroeconomic Management Financial Liberalisation and Regulation
Global Competitiveness of the Indian Economy – Agriculture, Manufacturing and Services
Multilateral Trade Negotiations and FTAs
Challenges and Opportunities of Urbanization
Climate Change and Sustainable Development
Physical and Social Infrastructure including Telecom, Transport Energy and Health
Asian Economic Integration with focus on South Asia
Skill Development, Entrepreneurship and Jobs
To effectively disseminate research findings, ICRIER organises workshops, seminars and
conferences to bring together academicians, policymakers, representatives from industry and
media to create a more informed understanding on issues of major policy interest. ICRIER
routinely invites distinguished scholars and policymakers from around the world to deliver
public lectures and give seminars on economic themes of interest to contemporary India.