competition issues in india - icrier.org
TRANSCRIPT


Competition Issues
in India’s Mobile Handset Industry
INDIAN COUNCIL FOR RESEARCH ON INTERNATIONAL ECONOMIC RELATIONS

DISCLAIMER
Opinions and recommendations in the report are exclusively of the author(s) and not of any other individual or
institution including ICRIER. This report has been prepared in good faith on the basis of information available
at the date of publication. All interactions and transactions with industry sponsors and their representatives
have been transparent and conducted in an open, honest and independent manner as enshrined in ICRIER
Memorandum of Association. ICRIER does not accept any corporate funding that comes with a mandated
research area which is not in line with ICRIER’s research agenda. The corporate funding of an ICRIER activity
does not, in any way, imply ICRIER’s endorsement of the views of the sponsoring organization or its products
or policies. ICRIER does not conduct research that is focused on any specific product or service provided by the
corporate sponsor.
Table of Contents
Acknowledgements .......................................................................................................................................... i
Executive Summary ......................................................................................................................................... ii
1. Introduction and Background ................................................................................................................ 1
1.1 The Rise of India’s Mobile Handset Industry ..................................................................................... 2
1.1.1 The Rise (and fall) of Domestic Brands ................................................................................... 2
1.2 Domestic Manufacturing and Local Value Addition .............................................................. 3
2. Competition Analysis ............................................................................................................................. 5
2.1 Dissecting the Market for Mobile Handsets ...................................................................................... 5
2.2 Market Structure Analysis – Market Concentration, Product Differentiation and Barriers to Entry 8
2.2.1 Market Concentration: HHI & Numbers Equivalent ............................................................... 9
2.2.2 Other Measures of Market Concentration ........................................................................... 14
2.2.3 Product Differentiation and the MCI Index .......................................................................... 15
2.2.4 Entry and Exit of Firms – Implications for Competition ........................................................ 18
2.3 Conclusions ..................................................................................................................................... 20
3. Survey Analysis .................................................................................................................................... 22
3.1 Sample Description ......................................................................................................................... 22
3.2 Survey Results ................................................................................................................................. 23
3.2.1 User Preferences for Brands and Features ........................................................................... 23
3.2.2 User trends for Mobile Phone Features and Apps ............................................................... 26
3.2.3 Lock-In Trends ...................................................................................................................... 27
3.2.4 Price Trends .......................................................................................................................... 28
3.2.5 Trends in the Market for Second Hand Phones .................................................................... 29
3.3 Summing up Survey Findings .......................................................................................................... 31
4. Conclusions and Policy Recommendations .......................................................................................... 33
Endnotes........................................................................................................................................................ 37
Bibliography .................................................................................................................................................. 41
Appendix ....................................................................................................................................................... 43

List of Tables
Table 1.1: Top 8 Brands (Market share by Value) in India’s Mobile Handset Industry............................... 3
Table 2.1: Annual Changes in Average Selling Price for Feature Phones, Phablets and Regular
Smartphones .............................................................................................................................. 6
Table 2.2: Annual Changes in Average Selling Price for 2G, 2.5G, 3G and 4G Phones ............................... 6
Table 2.3: Number of Brands Manufacturing Across Technology Generations ......................................... 7
Table 2.4: Number of Brands Manufacturing Across Different Price Bands ............................................... 7
Table 2.5: Number of Brands Manufacturing Feature Phones, Phablets and Regular Smartphones ......... 7
Table 2.6: Year-wise HHI Estimations for Different Market Segments ..................................................... 11
Table 2.7: Estimates for N, IR and IRp for Overall Industry, Feature Phone and Smartphone Categories13
Table 2.8: Estimates for N, IR and IRp by Technology Generations .......................................................... 13
Table 2.9: Correlation Matrix for Different Measures of Concentration at the Overall Industry Level .... 15
Table 2.10a: PMD Estimates for the Mobile Phone Industry in India Using Technology Generations as
Submarkets .............................................................................................................................. 17
Table 2.10b: PMD Estimates for the Mobile Phone industry in India Using Phone Type as Submarkets ..... 17
Table 2.11: PMD Estimates for the Market of Each Technology Generation Using Price Bands as
Submarkets .............................................................................................................................. 18
Table 3.1: Average Scores Assigned to Important Factors and Features ................................................. 26
Table 3.2: Average Scores Assigned to Features and Apps based on Frequency of Use ......................... 26
Table 3.3: Number of Responses for Each Price Bracket across the Range of Monthly Incomes ............ 29
Table 3.4: Average Score for Features/ Factors of Second Hand Mobile Phones .................................... 31
List of Figures
Figure 1.1: Labour Cost and Business Environment in Select Countries ...................................................... 4
Figure 2.1: Structure – Conduct – Performance Framework ....................................................................... 9
Figure 2.2: Concentration Curve ................................................................................................................ 10
Figure 2.3: Number of Brands in the Industry and also Across Different Technology Generations ......... 19
Figure 2.4: Industry Level Estimates for Number of Brands, Entry, Exit and Churn Rates ......................... 20
Figure 3.1: Distribution of Sample by Educational Qualification, Occupation and Monthly Income........ 23
Figure 3.2: Percentage Share of Brands among Surveyed Consumers ...................................................... 24
Figure 3.3: Place of Purchase and Source of Information for Purchase of Mobile Phones ....................... 24
Figure 3.4: Average Minutes Spent Per Day on Activities on a Mobile Phone .......................................... 27
Figure 3.5: Usage of Old Mobile Phones .................................................................................................... 30
Table A3.1: Concentration Indices by Type of Phone ................................................................................. 55
Table A3.2: Concentration Indices by Price Bands ...................................................................................... 55
Table A3.3: Concentration Indices by Technology Generation ................................................................... 57

i
Acknowledgements
We are grateful to our project sponsor, Qualcomm, for giving us the opportunity to undertake this study on
one of the most dynamic sectors of the Indian economy. The core analysis of this study would not have been
possible without the timely and comprehensive data sets and valuable comments on the data analysis
provided by IDC, which has helped in presenting a nuanced picture of the mobile handset industry in India. We
are grateful to Hansa Cheetah for facilitating the consumer survey. It is rare that we find young minds that
engage with analytical and intellectual activities not just with vigour and enthusiasm, but also with creativity.
Our dedicated intern, Gauri Bansal, has been exemplary in this regard, whose thorough research and ideas
have contributed invaluably to the competition analysis in this report. We are also grateful to our interns,
Siddharth Mishra, Ankita Sharma, Saumitra Khullar, Tanya Vaidya and Manvi Puri, for their timely assistance
with data collection, analysis, coordination, and also, their infectious enthusiasm. We are thankful to domestic
and foreign mobile manufacturing brands, industry associations and stakeholders for their inputs that have
helped us gain a better understanding of the sector. Our former colleagues, Parnil Urdhwareshe, Vatsala
Shreeti and Smriti Chandrashekar were pivotal in conceptualisation of the study and have continued their
support long distance. We are beholden, both for their erudition and the sustained friendship. Last, but not
the least, we are grateful to our colleagues at ICRIER for providing a stimulating environment which makes
such research possible. All errors remain our own.


ii
Executive Summary
Mobile phones have been the key to India’s
technology revolution. India is the second largest
mobile phone market globally, next only to China.
At the end of 2018, the estimated number of smart
phone users in India was 337 million, compared to
2.53 billion users worldwide. One would imagine
that the exponential increase in cheaper smart
phone models would displace the market for
feature phones; to the contrary, feature phones
continue to dominate the Indian market. While
smart phone and feature phone shipments in
2018Q3 were about the same, a comparison of
growth rates shows that both phablets (large screen
smartphones) and regular smartphones eclipse
feature phones.
Mobile phone sales have increased dramatically
over the last decade, both in terms of the volume
and value. Using data from 2007 to 2018, we find
that the compounded annual growth rate (CAGR) of
mobile phone sales was 6.66% and 6.54% by volume
and value respectively. The average selling price of
phones decreased at a CAGR of 0.11% during the
same period. Research shows that the smartphone
industry boasts of the lowest Innovation Cycle Time
amongst a host of other industries. The number of
years from initiation of R&D to first customer
delivery is on average three years for the industry.
At present, the mobile phone market in India is
congested with over 75 brands and 3400 models.
The market is also very dynamic; the pecking order
of firms is constantly changing with new brands
challenging established manufacturers. Chinese
brands such as Xiaomi, Gionee, Oppo and Vivo are
now very prominent in the Indian market, sidelining
established domestic brands such as Lava, Intex and
Micromax. In 2018, Xiaomi replaced Samsung to
become the top player in India by volume. The
Government of India viewed the rise of mobile
phone users as an opportunity to scale up domestic
manufacturing in the country. In April 2017, it
notified the Phased Manufacturing Program (PMP)
to boost domestic manufacturing through a mix of
fiscal incentives. A report in 2017 estimated the
possibility for domestic local value addition in
mobile phones to rise up to 25.8% by 2019. The
recently implemented National Policy on Electronics
(NPE 2019) that will replace the 2012 policy, has set
a target of manufacture of 1 billion mobile phones
by 2025.
This report focuses on concentration, technological
progress, adoption and price points in the mobile
handset market in India over a ten-year period
between 2008 and 2018. The objective is to
examine the extent and nature of competition in
the market.
A feature mapping exercise included in this report,
finds quality improvements across different price
bands of mobile phones, between 2008 and 2018.
In order to minimise conflation with factors such as
brand, type of phone, etc. we segregated phone
models manufactured only by Samsung across 12
price bands for this analysis. Samsung has products
across all sub-markets considered in this report. The
analysis finds improvements in functionalities
across most price bands with the addition of
features such as dual SIM, improved wi-fi, GPS and
cameras. Comparison of technology and phone
types indicates that the market for mobile phone is
highly segmented and any competition analysis at
the industry level may be subject to qualifications.
Defining the relevant market is central to any
competition analysis. There are two fundamental
dimensions of the relevant market – product and
geography. Since the analysis focuses on India and
sub-regional demand data is not available, the
market segmentation in this report is based on
product categories. We segment the market using
three distinct approaches, by price, by technology
and by phone type, in addition to an overall analysis
of the market.
Price bands are defined based on observable
characteristics in the data and expert feedback.
Technology generations are exogenously
determined, namely 2G, 2.5G, 3G and 4G. The
introduction of each generation was a landmark in
the technology evolution of the industry. And
finally, the third segmentation divides the market
into broad product categories, namely, feature

iii
phones, phablets and smartphones. There are
however, overlapping trends across different
market segmentations. For example, 2G and 2.5G
phones generally fall within the lower price bands.
Feature phones also fall within the lower price
bands.
The competition analysis estimates market
concentration ratios for different sub-segments. We
also conduct product differentiation and entry-exit
analyses to complement findings from the
concentration ratios. We use the most widely
applied concentration index, the Herfindahl
Hirschman Index (HHI) to measure market
concentration across different market sub-
segments. The HHI values for most market
segments are significantly lower in 2018 as
compared to 2007. In market segments like
phablets, regular smartphones and phones in the
4G category, the secular decline in HHI since 2007
has been very sharp. However, for each of these
three segments, HHI has increased from 2016 to
2018. As one would expect, concentration levels are
relatively high in the higher price segments. It is
vital to emphasise that seller concentration is only a
necessary and not sufficient condition for regulatory
intervention. Other characteristics such as rivalry,
contestability are also crucial.
Since firms gravitate to unequal sizes it makes
competition assessments based only on the number
of firms, difficult. The reciprocal of HHI, the
numbers equivalent (N) accounts for unequal sizes
of firms in the market. For example, if a given
market has more firms than another, but greater
variance in size it is hard to ascertain which market
is more competitive. A quantitative analysis using N
provides insights into the nature of competition in
the market. If there are a large number of firms on
the fringes, it could indicate their irrelevance in
influencing the degree of active competition.
The estimates for numbers-equivalent and the
corresponding number of irrelevant brands is less
sanguine than that for HHI. The proportion of
irrelevant brands have declined in most segments,
although are still relatively high. This has impacted
HHIs, which is a measure that uses data for all firms
in the relevant market. The number of irrelevant
firms implies that the level of effective competition
could be lesser than implied by market structure
measures. Policy interventions that empower a
larger pool of competitive manufacturers and
increase their relevance in the market, will reduce
future risk. The academic search for the defining
measure of concentration has led to the
development of several indicators to complement
HHI and to overcome its reported limitations. We
use measures such as the K-Concentration Ratio,
Horvath Index, Entropy Index, Ginevicius Index and
GRS Index to estimate market concentration across
the same sub segments. All results point towards
adequate and increasing competition across
different segments of the industry with the
exception of phones belonging in the higher price
category. The HHI correlates well with all other
measures of concentration estimated in the report.
Product differentiation is an important determinant
of market concentration. Economic theory suggests
that product differentiation enables firms to
establish entry barriers. The estimates for product
market differentiation (PMD) find that the degree of
product differentiation has increased after the
introduction of 4G phones in 2012. Product
differentiation increased in the 3G market up until
2016 after which it declined. On the other hand,
PMD increased steadily between 2012 and 2018 in
the 4G market. However, our overall analysis finds
that the 4G market is the least rivalrous among all
four technology generations.
Finally, an analysis of entry and exits in the industry
finds that an increase in the total number of brands
until 2015 was on account of a higher entry
compared to the exit rate. From 2016 onwards, the
exit rate began to surpass the entry rate, resulting
in a decline in the total number of brands. While
the entry rate has declined over time, the trend in
exit is mixed. The highest exit rate is observed in
2017. Entry and exit could also be a surrogate for
expected profits. When expected profitability is
high, firms are more likely to enter than exit and
vice versa. Hit and run sort of entry has been
witnessed in the Indian mobile market and serves
the objective of the firm interested in only short
term profits. It also helps in disciplining wary
incumbents i.e. it lends contestability to the market
and helps in pro-competitive outcomes. In India’s
mobile phone market, there have been instances of

Competition Issues in India’s Mobile Handset Industry
iv
exit from the entire market/ or a particular sub-
market within two years of starting operations. This
could be a case of undue exuberance on part of the
firm or a conscious decision for short run gains.
Whatever the reason, competition for the market is
good for competition in the market.
Analysis of the composite handset market as well as
the various sub-segments reveals two immediate
and palpable conclusions. One, measures of
competition as reflected in the several overlapping
but mutually reinforcing indices reveal significant
competition over time and across segments. There
is no doubt that the structural estimates vary
overtime and of late have shown a tendency to
increase especially in segments where consolidation
is taking place. Antitrust concerns surrounding this
shift however are minimal. The second striking
feature of the handset market is the recent
domination by Chinese brands. Even during times
when Indian brands were enjoying high growth, the
extent of value addition within the country was
minimal as a large proportion of the components
were being imported from China. The last three
budgets have tried to incentivise local production by
raising duties on imported components. While local
value addition has increased slowly it still remains
below 20% reflecting in part the efficacy of
assembly in India and in part the disability that
Indian manufacturing has to contend with.
Consumer preferences have adapted to the
constant improvements in mobile technology and
handset manufacturing. The demand for
sophisticated features has created a virtuous cycle
of innovation on the producer side. In this report,
we also analyse findings from a primary consumer
survey to understand the demand side of the
industry and how consumer preferences affect
competition in the handset industry in India.
The survey findings indicate that handset choices
are driven largely by the technology support they
offer and features such as battery life and screen
size assume higher importance than price. A
recurrent response was the willingness to pay a
premium for improvements in the preferred
features. While familiarity with functions and
improvements in digital literacy may have
generated quality-sensitive demand, rapid changes
in technology have also led to shorter replacement
cycles of mobile phones, especially among those
who can afford it. The survey also finds a willingness
to switch to other models and brands for new
experiences and features. This also explains the
increased product differentiation in the market.
Despite these new trends, there is a clear
preference for mid-range smartphones, regardless
of income levels.
The breadth and depth of the used phones (second
hand) market influences demand in the primary
market, reflecting the typical characteristics of a
durable good. A small percentage of respondents
indicated a willingness to buy from the second hand
market. The short replacement cycles are probably
driving the growth of second hand phones in India.
With thriving online market places we expect the
volumes to increase in the future.
From a consumer perspective, we do not find any
direct evidence of anti-competitive outcomes. The
demand and use of mobile phones is becoming
ubiquitous especially among the urban youth and
the general consumption patterns seem to be
maturing with users willing to pay a premium for
preferred features. The availability of online
resources is reducing information asymmetries in
both primary and secondary markets. The neutrality
of platforms that provide information, advertise and
sell mobile phones has become an important
determinant of competitive outcomes.
The mobile industry in India is rapidly evolving.
Taking advantage of the low entry and exit barriers,
the entry of Chinese brands transformed the
domestic handset industry. The mobile handset
industry displays healthy competition, with no
immediate concern about exercise of market power
by any one entity. At the same time a high
proportion of irrelevant firms exists that could
either grow to be competitive threats in the future
or just fall by the wayside. It is essential that policy
interventions allow for incentives to develop long
term innovation capabilities within the larger set of
manufacturers in the industry. Substantive value
addition as proposed under the National Electronics
Policy (NEP) 2019 will also limit cases of hit and run
entry, which are prominent within certain sub-
segments. Policies must be developed to support

v
research capabilities in newer technology
generations.
While the industry has seen much progress, both
technologically as well as behaviourally, a large part
of the population is still to benefit from the use of
mobile phones, especially in the light of the push
towards digital India. The government has increased
its focus on domestic manufacturing of mobile
phones, not only to address underpenetration of
technology but to limit its reliance on imported
technology and imported products.
To encourage domestic manufacturing of mobile
phones, India liberalised FDI norms and under the
revised policy, foreign investment in manufacturing
will be automatically approved. Budget 2018-19
increased customs duties on specific mobile
components. However, significant investments will
be required to develop the necessary infrastructure
to support domestic manufacturing of components
and spare parts in the future. India’s experience
with import substitution policies that prevailed in
the decades before liberalisation was inimical to
fostering industrialization. On the other hand,
Japan and Korea have demonstrated that industrial
policies with sunset clauses can have pro
industrialisation impacts. It must be recognized
that protectionist measures are a double edged
sword.
Economies of scale and the presence of a mature
ecosystem, continue to enable the low cost of
production for mobile phones in China. Even though
several contract manufacturers from Taiwan, Korea
and China are considering India, the feasibility of
manufacturing core components such as chipsets
remain distant. The government must undertake
measures to develop adequate infrastructure and
policy incentives to progressively transform India
into a large scale manufacturing ecosystem. In this
respect Vietnam has stolen by a march by offering
lower tax rates, comparable wage rates and lower
overall costs of doing business. The advantage of a
large market size that India has and will continue to
possess, is often offset by these disability costs.
NITI Aayog has set up a committee on how to jump-
start India’s exports of mobile phones in particular
and electronics in general. The committee was
created in the backdrop of the failure of India’s
phased-manufacturing-programme (PMP) for
mobiles. The objective is not to alienate foreign
manufacturers, but to build domestic capability that
will enable sustainable growth with the added
benefit of local job creation. Also in this context,
India must seriously evaluate the need to host a
semi-conductor fabrication unit. India’s potential
lies in addressing the under-served demand of
nearly half a billion people, and the constant need
for up gradation from the other half. Collaborative
steps by the government and industry can help
build domestic capacity while maintaining healthy
levels of competition.
1
1. Introduction and Background
Telecom and information technology have
transformed the way we live. Mobile phones have
been the key to this revolution in India. It is now the
second largest smart phone market globally. In
2010, UN reported a tragic irony - India had more
mobile phones than toilets1. While the access to
household toilets has risen sharply2, the euphoria
around mobile phones hasn’t withered either. At
the end of 2018, the estimated number of smart
phone users in India was 337 million, compared to
2.53 billion users worldwide3. One would imagine
that the exponential increase in cheaper smart
phone models would displace the market for
feature phones. To the contrary, feature phones
continue to dominate the Indian market, with over
50 percent share4 (by volume), driven by a
preference among users in small towns who find
little value to buy smart phones. In 2017 Reliance
introduced the 4G enabled Jio feature phone.
Cheaper feature phones with 4G capabilities that
allow users to access the Internet have slowed
down the adoption of smart phones, particularly
among price sensitive consumers, who dominate
rural and semi urban markets. While smart phone
and feature phone sales in Q3 2018 registered equal
number of shipments, in a comparison of growth
rates, sale of both phablets and regular smart
phones have clearly outcompeted feature phones.
Phablets5 entered the market in 2012 and have
grown at a compounded annual growth rate (CAGR)
of 137.98 percent during the period 2012 to 2018;
the corresponding number for regular smart phones
is 18.91 percent during the period 2007 to 2018,
while that of feature phones stood at a meager 0.74
percent. The difference is higher if we take growth
in sales by value. As the base effect diminishes,
growth rates for sale of phablets and regular smart
phones are also likely to moderate.
At present, the mobile phone market in India is
overcrowded with over 75 brands and 3400
models6. 2G and 2.5G mobile phones are largely
manufactured by relatively unknown brands. These
are phones that fall within the less than Rs 2500
price range. This market is also very dynamic; the
pecking order of firms is constantly changing with
new brands challenging established manufacturers.
Chinese brands such as Xiaomi, Gionee, Oppo and
Vivo are now very prominent in the Indian market,
overthrowing established domestic brands such as
Lava, Intex and Micromax. In 2018, Xiaomi replaced
Samsung to become the top player in India.
Domestic brands were handicapped by their
inability to manufacture locally and reached out to
design manufacturers in China. Retail distributors
who understood the industry supply chain also
launched local, fly by night brands of mobile phones
like Kool, Sunny and Vijay7. In November 2016, a
report by Counterpoint Research and IIM Bangalore
estimated the local value addition in mobile phone
manufacturing to be just under 6%8. The
Government in India viewed the rise of mobile
phone users as an opportunity to scale up domestic
manufacturing in the country. In April 2017, it
notified the Phased Manufacturing Program (PMP)
to boost domestic manufacturing through a mix of
fiscal incentives. A report in 2017 estimated the
possibility for domestic local value addition in
mobile phones to rise up to 25.8% by 20199. This
study also reported that 4G smart phones available
at less than Rs 4500 offer very poor user
experience. It recommended the minimum
specifications of a smart phone, the estimated price
for which would be Rs. 8500. This is a challenge for
policy that seeks to achieve the twin objectives of
affordability and digital ubiquity The recently
implemented National Policy on Electronics (NPE
2019) that replaced the 2012 policy has set a target
of manufacturing 1 billion mobile phones by 202510
.
In this report we take a close look at the evolution
of the mobile handset market in India. We will chart
the transformation of the industry through
technological progress, usage and price of mobile
phones in India, with the objective to identify
competition issues. We will also review the policies
for local value addition and provide
recommendations that are best suited for driving
the competitiveness of India’s domestic industry,
given the demands of its digital future. In the
following sections of the introduction we trace the
history of the industry with a focus on the rise of
domestic brands. We will also highlight challenges
related to domestic manufacturing. The second

2
section will focus on competition analysis including
an overview of the market structure, technological
advancements, estimation of concentration ratios
and an entry – exit analysis. The third section will
present survey findings of consumer data collected
through an online platform on, prices, user
preferences, lock-ins etc. The final section
concludes and offers policy recommendations.
1.1 The Rise of India’s Mobile Handset Industry
In 1994, the waiting list to get a telephone installed
in India was four years, and the number on that list
was two million.11
. By 2018, India had over a billion
mobile subscribers 12
and monthly sales of mobile
phones averaged 10 million units.13
Nokia, Motorola
and Ericsson - the fashionable brands in the early-
2000s thrived on the quality of their built-in camera,
radio and music applications. The dual SIM
technology patented by Siemens in the 1990s also
lifted demand from 2010, as a large number of
mobile users preferred the convenience to switch
between service providers to take advantage of the
best deals or when coverage was patchy. Some also
preferred to separate their personal and
professional calls14
. In 2009, Taiwanese
manufacturer HTC launched India’s first Android
based smart phone. This was around the time
Blackberry had successfully positioned itself as the
ultimate smart phone, thriving on the success of its
instant messaging app, BBM. Before Apple’s iPhone
arrived, Android prototypes were cheap clones of
the Blackberry15
. With the mobile industry moving
towards bigger touch screen displays, Android
steadily captured market share in India. With the
decline of Symbian, the operating system used on
Nokia phones, Android established dominance in
the Indian market and Apple captured a niche. As of
2018Q2, Android held 84 percent of the mobile
operating system market in India.16
More recently,
the online-exclusive brands like Xiaomi, Honor,
OnePlus etc. have disrupted the market. Online
channels contributed to 42.2 percent of total sales
in 2018Q4, driving the overall growth of smart
phone sales in India.17
Unsurprisingly, these brands
are among the top 8 in the Indian market since
201718
. Contemporaneously Nokia phones have also
resurfaced after HMD Global acquired rights to sell
their phones. In May 2017, Nokia’s classic 3310 was
re-launched with a vastly improved battery life, a
camera and a colour screen. While, there are
several traditional users who would discard modern
technology to return to the days of text messages,
polyphonic ringtones and Snake, there is skepticism
around Nokia’s ability to compete with smart phone
juggernauts such as Xiaomi, Samsung and Apple.
The inherent networks effect of the digital industry
also limits that possibility. Regardless, India’s love
affair with the mobile is here to stay. With mobile as
the future of everything, it is estimated that smart
phone users alone will touch 442.5 million19
by 2022
making India a very seductive smart phone market.
1.1.1 The Rise (and fall) of Domestic Brands
An interesting milestone in the development of
India’s mobile handset market has been the rise of
domestic brands such as Micromax, Spice, Lava and
Karbonn. These were companies that served as
distribution channels for Nokia, Motorola, Sony
Ericsson, LG and others, who forayed into
manufacturing. They partnered with design and
manufacturers in China, a phenomenon popularly
referred to as the white-labelling deal20
. The
differential duty structure was among the primary
drivers that stimulated investments in domestic
assembly. The market was flooded with cheap
smart phones made available by domestic
companies that looked identical to existing foreign
brands and similar in hardware and software
capabilities. Table 1.1 below traces the record of
top 8 mobile phone brands in the Indian market.
The rise of domestic brands began in 2009. 2015
was another turning point; domestic brands were
being challenged by Chinese Original Equipment
Manufacturers (OEM) such as Oppo, Vivo, Xiaomi
and Gionee. Based on market intelligence, the
Chinese brands were able to produce more variety,
offer healthier margins and create better marketing
campaigns compared to their Indian counterparts.
Some brands sold exclusively online, using hunger
marketing strategies to enhance product
desirability. 2018 recorded the highest ever smart
phone shipments in a year, in India, with a total
shipment of 142.3 million devices.21
In 2018Q4,
Xiaomi led the market in units sold with a market
share of 28.9 percent, followed by Samsung and
Vivo.22
Several reasons explain fall of domestic
brands including the lack of innovation and R&D
capabilities. Samsung has maintained its steady

Competition Issues in India’s Mobile Handset Industry
3
position as a market leader, by value, during this
battle for dominance between Indian and Chinese
mobile phone manufacturers.
Table 1.1: Top 8 Brands (Market share by Value) in India’s Mobile Handset Industry
2007 2008 2009 2010 2011 2012 2013 2014 2015 2016 2017 2018
Nokia Nokia Nokia Nokia Nokia Samsung Samsung Samsung Samsung Samsung Samsung Samsung
Sony
Ericsson Samsung Samsung Samsung Samsung Nokia Nokia Micromax Micromax Apple Xiaomi Xiaomi
Motorola Sony
Ericsson
LG
Electronics G-Five G-Five Micromax Micromax Nokia Apple Oppo Vivo Vivo
Samsung LG
Electronics Micromax Micromax Micromax Karbonn Karbonn Apple Intex Xiaomi Apple Oppo
LG
Electronics Motorola
Sony
Ericsson
LG
Electronics Blackberry Apple Sony Karbonn Lava Micromax Oppo Lyf
Classic Spice Spice Blackberry HTC HTC Apple Sony Lenovo Lenovo Motorola Apple
Huawei Huawei G-Five Spice Karbonn Blackberry Lava Lava HTC Vivo Micromax OnePlus
Spice Vodafone Karbonn Maxx Spice Sony Intex Motorola Motorola Lyf Lenovo Nokia
Source: IDC’s Quarterly Mobile Phone Tracker, 2018Q2
The government push for Make in India will alter
the market, as will technological change and
evolving consumer preferences. Companies that are
able to anticipate better are likely to grow faster.
Indian brands have also seen a comeback in 2017.
New models launched by Jio, Micromax and Lava
are strategically targeted in specific price bands.
Domestic companies are also investing in R&D with
a hope to regain market share. A key to the success
of Indian brands will also depend on their marketing
strategy, including the choice and balance between
online and offline selling.
1.2 Domestic Manufacturing and Local Value
Addition
Despite the rise of domestic mobile phone brands,
the question that continues to bedevil analysis is
the extent to which these phones are made in India.
Two recent reports23
offer insights. While India
successfully manufactures some non-electronic
components and accessories, and runs the assembly
and testing processes, high-end electronic
components are imported as completely built units
(CBU). According to IAMAI and Enixta (2017) the
battery pack is likely to see improved local value
addition at 63.7%, followed by camera and display
at 49.6% and 41.8% respectively by 2019.
Undoubtedly this requires policy perseverance,
especially with respect to investment in research
and design, practical skill training and ease of doing
business. The imposition of the Basic Custom Duty
at 10% on import of mobile phones and specified
components (since July 2017), reinforces the
Government’s intent to indigenize manufacturing of
mobile phones, as it helps maintain the duty
differential regime even after the implementation
of the Goods and Service Tax (GST).
The Phased Manufacturing Plan (PMP) has also
encouraged many domestic and foreign players to
build capacity in India. Taiwan’s contract
manufacturing companies - Foxconn and Wistron
have built multiple plants in the country to
manufacture and assemble mobile phones. While
expansion is undisputed, companies have reported
several legal and political roadblocks in scaling up
units and developing a vendor ecosystem. For
example, provision of power, water and an
affordable line of credit add to India’s costs. The
overall cost of manufacturing in India is estimated
to be higher than in other Asian countries (Refer
Figure 1.1).

4
Figure 1.1: Labour Cost and Business Environment in Select Countries
Source: Compiled by authors from ‘Asia in 2025 – Development prospects and challenges for middle-income countries’, ODI (September
2018)
With the exception of a huge market base, the
ecosystem currently lacks a compelling reason for
foreign manufacturers to build capacity in India.
With nothing to tie them down, these new facilities
will be quickly uprooted and re-established in other
countries where costs of manufacturing are lower.
Building domestic competitiveness in an industry
which has been heavily reliant on imports for
decades is undoubtedly hard. The NPE 2019 will
lead to formulation of several schemes, initiatives,
projects, etc., in consultation with the concerned
Ministries/ Departments, for the development of
ESDM sector in the country. It will enable flow of
investment and technology, leading to higher value
addition in the domestically manufactured
electronic products, including mobile phones.
Samsung has recently invested Rs. 500 crore to add
capacity, and domestic firms such as Micromax and
Lava, among several others are also upgrading their
facilities24
. According to a report by CyberMedia
Research, over 150 mobile handset manufacturing
units have been set up in India over the past four
years.25
The report also found that Completely
Knocked Down (CKD)26
manufacturing units stood at
57 percent while Semi Knocked Down (SKD)27
manufacturing units stood at 39 percent at the end
of 2018Q4.28
This study analyzes competition in India’s mobile
handset industry and identifies trends that affect its
growth in the future. The analysis detailed in
Section 2, shows that competition in India’s mobile
handset industry has steadily increased over the
past decade, with low barriers to entry and new
brands flooding the Indian market. Based on
findings of our primary survey in Section 3, which
found consumers’ willingness to pay for improved
features and user experience, there is continuous
innovation in horizontal features of mobile phones.
With India’s mobile handset industry displaying
such robust competition, it is essential that policies
incentivize innovation and promote domestic
manufacturing to allow Indian firms to capture
more value from the mobile industry moving
forward. The report provides some policy
recommendations and sets the ground for further
discussion.
0
20
40
60
80
100
120
0
2
4
6
8
10
12
Time to start a business (days)
Quality of port infrastructure
Quality of electricity supply
0
0.5
1
1.5
2
2.5
3
3.5
0
20
40
60
80
100
120
Hourly labour cost as a % of China
GDP per person employed, as a % of US
Hourly labour cost ($)

5
2. Competition Analysis
Technology has been the driver for mobile
manufacturing globally but India has the added
benefit of market size that few other countries can
claim. Add to this the government’s focus on
scaling up domestic manufacturing and the
opportunity is alluring. Both domestic and foreign
firms have unsurprisingly increased their
investments in India.
Time is thus ripe to analyse the forces of
competition in this industry and identify
interventions that can catalyse its growth. The
number of new mobile phones has increased
remarkably over time, also due to the entry of new
companies which were not traditionally telecom.
Moreover, the quality of mobile phones has
considerably improved over time with the
continuous introduction of new functionalities both
on hardware and software. An interesting fact that
underlines the growth and innovation strategies of
the two global leaders in smartphone design and
sales – Samsung and Apple – is that, while Samsung
was far ahead in terms of new products launched,
Apple’s approach was more measured with only 6
new products. A lack of a clear dominant design in
the global smartphone market is thus not due to the
technical progress but prominently because of
individual firms’ strategies29
.
In the Indian market mobile phone sales have
increased dramatically over the last decade, both in
terms of the volume and value. Using data from
2007 to 2018, we find that the compounded annual
growth rate (CAGR) of mobile sales was 6.66% and
6.54% by volume and value respectively. In
comparison the average selling price of phones
decreased at a CAGR of 0.11%. Research shows
smartphones to be an industry which sees the
lowest Innovation Cycle Time amongst a host of
other industries. The number of years from
initiation of R&D to first customer delivery is on
average three years for the industry30
.
We ran a technology feature mapping across
different price bands of mobile phones between
2008 and 2018. In order to minimise conflation with
factors such as brand, type of phone, etc. we
segregated phone models manufactured only by
Samsung across 12 price bands31
. Samsung has
products across all sub-markets considered in this
report. We compared different features of mobile
phones such as operating systems, processor speed,
resolution, battery life etc. to understand
technology evolution in mobile phone
manufacturing and its impact on price. In 2008,
some feature phones manufactured by Samsung
were priced in the $300 - $400 and $400 - $500
range. These phones were touch screen and 3G
enabled. In 2018, an ultra-low end Samsung
smartphone was available in the $75 - $100 price
band that had 4G capability, provided a significantly
higher internal storage space, higher resolution
camera and touch screen input that was better than
any other Samsung phone available in that price
band in 2008. In the higher price bands i.e. $500 -
$700 and > $700, phones were available both in
2008 and 2018. However, the models in 2018 had
higher camera resolution, bigger screen sizes and
better specifications overall. A shift is seen in the
input method – while the high and ultra-high-end
phones mostly used QWERTY plus touch screen or
alphanumeric input methods in 2008, the models in
2018 were all touch screen with bigger screen sizes.
The phones in 2018 in the higher price bands were
also mostly dual SIM phones. The feature mapping
exercise finds improvements in functionalities
across most prices bands with the addition of dual
SIM, improved wi-fi, GPS and camera. Details of the
mapping are available in Appendix 1 of this report.
This analysis also led us to conclude that the market
for mobile phones is highly segmented and any
competition analysis at the industry level may be
subject to qualifications. Defining the relevant
market is central to any competition analysis. There
are two fundamental dimensions of the relevant
market – product and geography. Since the analysis
is focused on India and sub-regional demand data is
not available, the market segmentation in this
report is based on product categories.
2.1 Dissecting the Market for Mobile Handsets
As opposed to general regulatory analysis using
prospective (ex-ante) definitions for a market,
6
competition authorities often look backwards (ex-
post) to define a relevant market. Relevant markets
defined in terms of products are considered to be
sufficiently substitutable by users and sufficiently
similar from the perspective of suppliers. Mobile
phone models vary significantly in price, technology
and functionality and therefore cannot be clubbed
as one market. For the purpose of this study we
segment the market using three distinct
approaches, in addition to an overall analysis of the
market.
The first approach segments the market using
different price bands. We used histograms on the
data for mobile phones sales from 2007 to 2018 to
divide the market by 12 price bands. These are -
<$25, $25 - $75, $75 - $100, $100 - $125, $125 -
$150, $150 - $175, $175 - $200, $200 - $300, $300 -
$400, $400 - $500, $500 - $700, >$700. The second
segmentation is based on technology generations,
namely 2G, 2.5G, 3G and 4G. The introduction of
each generation was a landmark in the technology
evolution of the industry. The third segmentation is
the broadest, dividing the market into product
categories, namely, feature phones, phablets and
smartphones.32
There are however, overlapping
trends across different market segmentations. For
example, 2G and 2.5G phones generally fall within
the lower price bands. Feature phones also fall
within the lower price bands. The first batch of
lower end smartphones, priced at less than $25 was
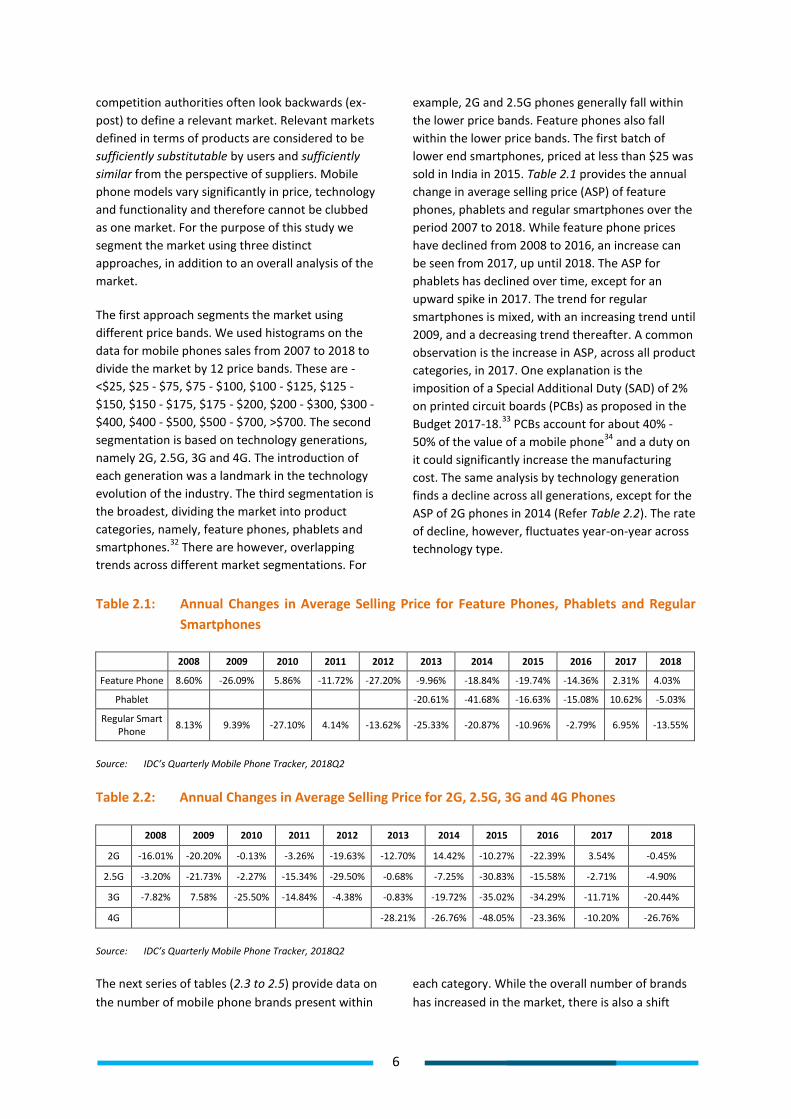
sold in India in 2015. Table 2.1 provides the annual
change in average selling price (ASP) of feature
phones, phablets and regular smartphones over the
period 2007 to 2018. While feature phone prices
have declined from 2008 to 2016, an increase can
be seen from 2017, up until 2018. The ASP for
phablets has declined over time, except for an
upward spike in 2017. The trend for regular
smartphones is mixed, with an increasing trend until
2009, and a decreasing trend thereafter. A common
observation is the increase in ASP, across all product
categories, in 2017. One explanation is the
imposition of a Special Additional Duty (SAD) of 2%
on printed circuit boards (PCBs) as proposed in the
Budget 2017-18.33
PCBs account for about 40% -
50% of the value of a mobile phone34
and a duty on
it could significantly increase the manufacturing
cost. The same analysis by technology generation
finds a decline across all generations, except for the
ASP of 2G phones in 2014 (Refer Table 2.2). The rate
of decline, however, fluctuates year-on-year across
technology type.
Table 2.1: Annual Changes in Average Selling Price for Feature Phones, Phablets and Regular
Smartphones
2008 2009 2010 2011 2012 2013 2014 2015 2016 2017 2018
Feature Phone 8.60% -26.09% 5.86% -11.72% -27.20% -9.96% -18.84% -19.74% -14.36% 2.31% 4.03%
Phablet
-20.61% -41.68% -16.63% -15.08% 10.62% -5.03%
Regular Smart
Phone 8.13% 9.39% -27.10% 4.14% -13.62% -25.33% -20.87% -10.96% -2.79% 6.95% -13.55%
Source: IDC’s Quarterly Mobile Phone Tracker, 2018Q2
Table 2.2: Annual Changes in Average Selling Price for 2G, 2.5G, 3G and 4G Phones
2008 2009 2010 2011 2012 2013 2014 2015 2016 2017 2018
2G -16.01% -20.20% -0.13% -3.26% -19.63% -12.70% 14.42% -10.27% -22.39% 3.54% -0.45%
2.5G -3.20% -21.73% -2.27% -15.34% -29.50% -0.68% -7.25% -30.83% -15.58% -2.71% -4.90%
3G -7.82% 7.58% -25.50% -14.84% -4.38% -0.83% -19.72% -35.02% -34.29% -11.71% -20.44%
4G
-28.21% -26.76% -48.05% -23.36% -10.20% -26.76%
Source: IDC’s Quarterly Mobile Phone Tracker, 2018Q2
The next series of tables (2.3 to 2.5) provide data on
the number of mobile phone brands present within
each category. While the overall number of brands
has increased in the market, there is also a shift

Competition Issues in India’s Mobile Handset Industry
7
towards the manufacture of new generation
phablets and smartphones. The number of brands
present in the lower price bands has also fallen
from their peak in 2014. However, the $75 - $100
price range has seen the highest number of
entrants. The market for high-end phones, priced at
over $700 is relatively concentrated with only 5
brands, as of 2018Q2.
Table 2.3: Number of Brands Manufacturing Across Technology Generations
2007 2008 2009 2010 2011 2012 2013 2014 2015 2016 2017 2018
2G 12 13 15 25 21 27 27 33 26 23 20 14
2.5G 24 28 34 32 35 37 35 37 32 25 21 17
3G 9 14 15 19 20 30 32 45 43 32 20 5
4G
3 7 14 40 44 50 42
Source: IDC’s Quarterly Mobile Phone Tracker, 2018Q2
Table 2.4: Number of Brands Manufacturing Across Different Price Bands
2007 2008 2009 2010 2011 2012 2013 2014 2015 2016 2017 2018
$0 - $25 6 11 13 15 25 31 33 36 27 26 22 17
$25 - $75 15 19 25 30 32 35 31 35 37 30 31 24
$75 - $100 10 16 22 23 20 18 25 31 36 33 35 26
$100 - $125 9 13 13 16 14 14 24 29 32 32 35 25
$125 - $150 8 10 14 11 11 15 25 24 30 24 25 21
$150 - $175 7 12 10 8 11 16 20 24 24 26 25 16
$175 - $200 5 11 9 6 9 10 14 21 22 19 22 16
$200 - $300 10 12 11 12 14 15 18 25 25 22 24 17
$300 - $400 12 14 14 14 11 11 11 16 17 16 13 10
$400 - $500 12 12 9 10 10 8 9 13 12 10 9 7
$500 - $700 11 13 11 10 10 7 8 9 9 10 10 8
> $700 7 9 4 3 1 3 6 6 7 8 5 5
Source: IDC’s Quarterly Mobile Phone Tracker, 2018Q2
Table 2.5: Number of Brands Manufacturing Feature Phones, Phablets and Regular
Smartphones
2007 2008 2009 2010 2011 2012 2013 2014 2015 2016 2017 2018
Feature Phone 17 20 28 31 35 37 34 36 29 26 23 18
Phablet
2 11 24 36 42 42 34
Regular Smart
Phone 13 16 17 18 20 32 34 43 51 45 47 36
Source: IDC’s Quarterly Mobile Phone Tracker, 2018Q2
We use this background on the mobile phone
industry to develop competition analysis in the
following sub-sections. The entire analysis is based
on data collected and disseminated by IDC through
their Quarterly Mobile Phone Tracker35
for the
period 2007 to 2018Q2.36
IDC uses a bottom-up
methodology to deliver an accurate view of mobile
phone markets across different countries. This
report is restricted to data for India.37

8
2.2 Market Structure Analysis – Market
Concentration, Product Differentiation and
Barriers to Entry
Market concentration measures the extent to which
sales in a market are dominated by one or more
businesses. It is a key component of market
structure analysis along with product differentiation
and barriers to entry. Economic theory suggests
that, other things being equal, firms with significant
market positions in highly concentrated markets will
tend to restrain output, increase prices and retard
competitive efforts of other firms unless the market
is contestable. Significant resource concentration
and large firm sizes are believed to confer market
power38
.
The level of competition in a market can vary
between perfect competition (minimum
concentration) and monopoly (maximum
concentration). Concentration measures offer a
simple way to measure the competition level in any
market within these two extremes. It is also used as
an input for market regulation.
The mobile manufacturing market possesses at
least three distinguishing characteristics that are
relevant for competition analysis (i) products are
differentiated (ii) a few relatively large suppliers
exist but the market place is crowded at the lower
end (iii) the rate of innovation is high. These
features suggest that firms may not simply be the
price takers of the perfectly competitive model.
Consumer preference for a specific brand confers
some degree of market power on firms, and
competition is thus imperfect. Market power is the
ability to profitably raise price above marginal cost,
reflecting, on the demand side, a premium that
consumers are willing to pay for variety.
The traditional approach to assessing market power
in the industrial organization literature is the
Structure-Conduct-Performance paradigm (SCP).
The S-C-P approach assumes a stable, causal
relationship between the structure of an industry,
firm conduct, and market performance as measured
by economic profits. The set of observable
structural variables are measures of seller
concentration and barriers to entry and the line of
causality is envisaged to run from structure through
conduct to performance or the exercise of market
power. The implication is that concentration
facilitates the exercise of market power.
In contrast to this industry approach to conduct and
performance, one can envisage an alternative
approach that makes the firm the centerpiece of
analysis. Firms differentiate their products and
differ in their organization form and internal
efficiency.39
It is the drive to be different that
unleashes dynamic competition of the
Schumpeterian type. This firm approach reverses
the link between structure and conduct and
performance; it is firm-specific efficiency
advantages that determine how large a firm
becomes and therefore industry concentration.
Thus, more efficient companies with superior
products grow to be larger than other firms.40
The
New Empirical Industrial Organization (NEIO) places
more emphasis on firm specific attributes. In case
these are the source of high market shares, the
relation between structure and market power must
be nuanced. America’s soft-drink industry, to take
one example, is noted for price competition
although only two firms, Coca-Cola and PepsiCo,
control three-quarters of sales. The reason the two
firms enjoy high market share is because of product
preference and quality rather than structural
attributes of the industry.
In our present exercise the focus is on a single
mobile industry and not the traditional inter-
industry comparisons of performance and conduct
of firms within those industries. The SCP paradigm
uses market concentration as a basis to analyse
market structure. The SCP framework was
developed by Bain in 195941
and enriched by others
over time, and it emphasizes the extent to which
concentration elevates price above minimum
average cost42
. The SCP framework is illustrated in
Figure 2.1 below
Competition Issues in India’s Mobile Handset Industry
9
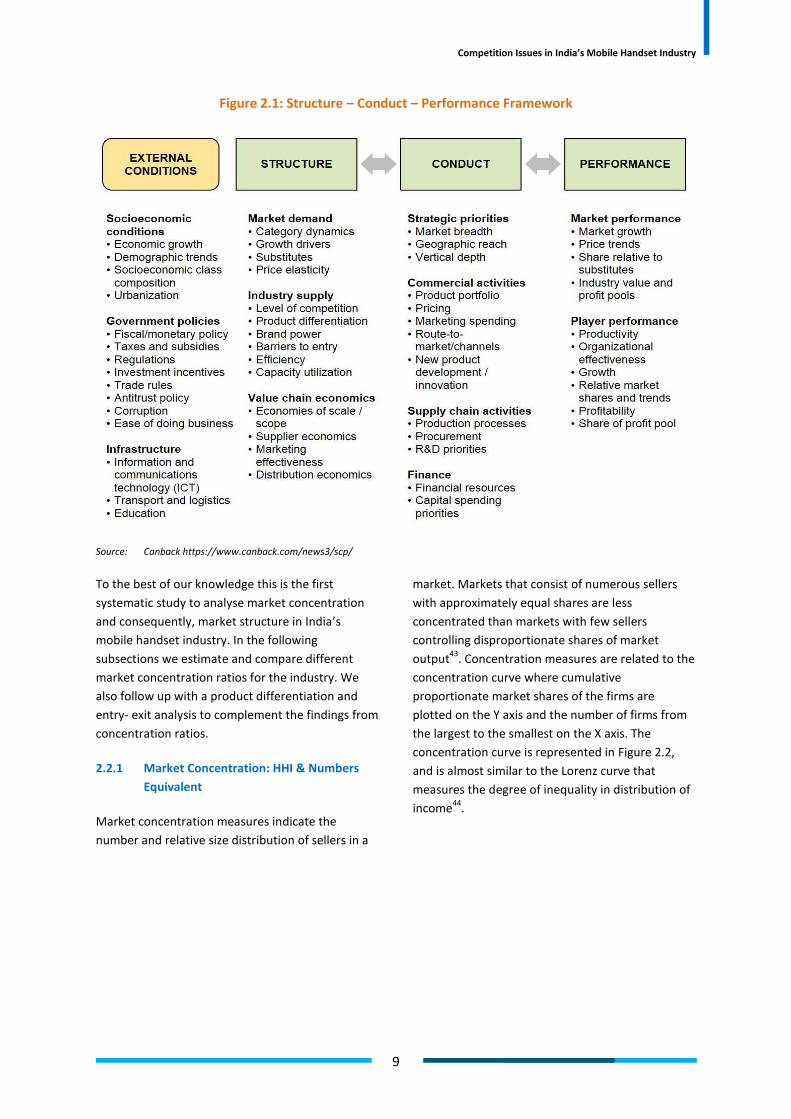
Figure 2.1: Structure – Conduct – Performance Framework
Source: Canback https://www.canback.com/news3/scp/
To the best of our knowledge this is the first
systematic study to analyse market concentration
and consequently, market structure in India’s
mobile handset industry. In the following
subsections we estimate and compare different
market concentration ratios for the industry. We
also follow up with a product differentiation and
entry- exit analysis to complement the findings from
concentration ratios.
2.2.1 Market Concentration: HHI & Numbers
Equivalent
Market concentration measures indicate the
number and relative size distribution of sellers in a
market. Markets that consist of numerous sellers
with approximately equal shares are less
concentrated than markets with few sellers
controlling disproportionate shares of market
output43
. Concentration measures are related to the
concentration curve where cumulative
proportionate market shares of the firms are
plotted on the Y axis and the number of firms from
the largest to the smallest on the X axis. The
concentration curve is represented in Figure 2.2,
and is almost similar to the Lorenz curve that
measures the degree of inequality in distribution of
income44
.

10
Figure 2.2: Concentration Curve
Source: Adapted from Barthwal 2007
From a usability perspective, concentration indices
should be easy to compute, independent of the
market size and easy to interpret along the
continuum of perfect competition to monopoly.
The most widely applied concentration index is the
Herfindahl –Hirschman Index (HHI). Measured using
the formula H = ∑ 𝑆𝑖2𝑁𝑖=1 where si is the market
share of firm i and N is the number of firms. While
it takes into account all firms in the industry, it
assigns greater weight to the larger sized firms in an
industry. HHI varies between a lower limit of 0 and
1 (Monopoly) and the closer it is to 1, the more
concentrated the industry. If there are N equal-sized
firms, then HHI= 1/N. The inverse of HHI, 1/HHI is
the equivalent number of equal-sized firms in the
market that results in the same HHI. HHI is also
equal to
𝐻𝐻𝐼 = 1𝑁 + 𝑁𝜎2
where σ2 is the variance of firm size. This indicates
that changes in HHI arise from changes in the
absolute number of firms and the size distribution
of firms. The larger the variance of firm sizes –
indicating a wider distribution of firm sizes around
the mean – the larger the HHI. If market shares are
measured in percentages, then the HHI is scaled by
10,000. We calculate HHI for the overall mobile
handset industry in India and various segments
defined in the sections above. The results are
presented in Table 2.6.

Competition Issues in India’s Mobile Handset Industry
11
Table 2.6: Year-wise HHI Estimations for Different Market Segments
Market Segment 2007 2008 2009 2010 2011 2012 2013 2014 2015 2016 2017 2018
HHI for overall industry 0.34 0.40 0.32 0.16 0.19 0.20 0.18 0.13 0.14 0.12 0.13 0.16
HHI by
generations
2G 0.64 0.61 0.67 0.48 0.49 0.27 0.22 0.22 0.30 0.19 0.20 0.21
2.5G 0.24 0.32 0.22 0.14 0.17 0.17 0.15 0.13 0.13 0.15 0.20 0.19
3G 0.71 0.61 0.52 0.27 0.24 0.30 0.26 0.15 0.11 0.11 0.17 0.41
4G
0.90 0.31 0.26 0.23 0.14 0.14 0.17
HHI by
phone type
Feature
Phone 0.29 0.38 0.29 0.15 0.20 0.20 0.19 0.16 0.15 0.16 0.16 0.32
Phablet
0.99 0.73 0.13 0.20 0.16 0.18 0.23
Regular
Smart
Phone
0.70 0.56 0.59 0.38 0.22 0.26 0.20 0.15 0.14 0.12 0.11 0.13
HHI by price
bands
< $25 0.71 0.17 0.17 0.32 0.20 0.07 0.09 0.11 0.13 0.14 0.13 0.35
$25 -
$75 0.35 0.38 0.28 0.14 0.15 0.22 0.18 0.17 0.13 0.11 0.11 0.18
$75 -
$100 0.30 0.43 0.46 0.16 0.38 0.36 0.25 0.16 0.18 0.09 0.23 0.28
$100 -
$125 0.34 0.60 0.41 0.34 0.44 0.49 0.22 0.14 0.16 0.23 0.14 0.22
$125 -
$150 0.43 0.34 0.38 0.39 0.31 0.18 0.15 0.26 0.16 0.18 0.15 0.17
$150 -
$175 0.39 0.41 0.25 0.42 0.38 0.18 0.31 0.18 0.18 0.17 0.25 0.23
$175 -
$200 0.36 0.53 0.32 0.42 0.26 0.46 0.27 0.21 0.17 0.29 0.35 0.26
$200 -
$300 0.53 0.45 0.38 0.31 0.22 0.17 0.36 0.22 0.28 0.18 0.23 0.32
$300 -
$400 0.30 0.40 0.78 0.33 0.29 0.30 0.31 0.24 0.20 0.19 0.21 0.30
$400 -
$500 0.36 0.49 0.29 0.22 0.25 0.28 0.63 0.18 0.53 0.67 0.35 0.52
$500 -
$700 0.39 0.26 0.28 0.29 0.19 0.69 0.22 0.36 0.36 0.43 0.48 0.32
> $700 0.55 0.33 0.34 0.43 1.00 0.94 0.32 0.54 0.52 0.69 0.52 0.64
Source: Authors’ calculations using data from IDC’s Quarterly Mobile Phone Tracker, 2018Q2
The HHI values for most market segments are
significantly lower in 2018 as compared to 2007.
However, while HHI values have declined from 2007
to 2015, there has been a minor increase in
concentration thereafter. The number of
manufacturing brands in all market segments has
also declined, reflecting churn. In market segments
like phablets, regular smartphones and phones in
the 4G category, the secular decline in HHI since
2007 has been very sharp. However, for each of
these three segments, HHI has increased from 2016
to 2018. As one would expect, concentration levels
are relatively high in the higher price segments i.e.
$400 - $500, $500 - $700 and > $700. HHI estimates
below 0.10 (1000) are indicative of highly
competitive markets, and those falling between
0.10 and 0.20 (1000 and 2000) indicate no adverse
effects of competition. Values above 0.20 (2000)
can become a matter of concern and may require
regulatory attention45
. It is vital to emphasise that
seller concentration is only a necessary and not
sufficient condition for regulatory intervention.
Other characteristics such as rivalry, contestability
are also crucial. And usually the assumption that
buyers are unconcentrated is reasonable. However,
buyer concentration may well make it difficult for
sellers to exercise market power.

12
In 2018, the segments 3G, feature phones, and all
price bands except $25 - $75 and $125 - $150, have
HHI values above 0.20, indicating concentration. In
particular, all mobile phone categories priced above
$400 report very high HHIs. The limited number of
manufacturers for phones over $400, results in high
values of HHI. In 2018, phones priced over $700
comprised 0.86% of the total market by volume but
10.16% of the total market share by value. All
phones sold over $400 comprised only 1.51% of the
total market share by volume, but 14.59% by value.
Chinese brands – Xiaomi, Oppo, Vivo are rapidly
expanding their market shares as smaller brands are
unable to compete on quality, functionality and
variety.46
There is a rise in the HHI for 3G phones,
perhaps driven by the leapfrogging from 2G to
cheap 4G phones, reducing the demand for 3G and
consequently the number of 3G suppliers.
Adelman (1961), argued that since firms gravitate to
unequal sizes it makes competition assessments
based only on the number of firms difficult47
. For
example, if a given market has more firms than
another, but greater variance in size it is hard to
ascertain which market is more competitive. He
proposed the numbers – equivalent (N), the
reciprocal of HHI as a guide (see above). According
to Adelman, while the real structure of the industry
consists of much more than its size distribution, the
measure N is closer to the ultimate (and
unknowable) truth than a vague cloud of a dozen or
a hundred firms who are "in the market" but may or
may not count for anything.
Despite being a reasonable indicator of market
concentration, the numbers-equivalent by itself is
not adequate. As the numbers- equivalent
increases, and the industry moves from monopoly
towards either oligopoly or monopolistic
competition, it becomes challenging to identify the
threshold that indicate a change in market
structure. Horowitz48
in an analysis of the Numbers
Equivalent in US manufacturing industries had
defined some thresholds. For instance, an industry
consisting of less than 10 firms, has been
categorised as a “tight oligopoly”. The “Rule of
Three” suggests that market forces can predict the
evolution of competitive industries49
. In an
industry’s early stages of growth, there are several
competitors. However, as the industry matures,
three firms that adapt better, survive and thrive in
the market with a total market share of 70-90%.
While there are several examples from other
countries, the telecom services industry in India has
also demonstrated this phenomenon; from a
hypercompetitive market with almost 15 service
providers, the industry now comprises of 4 players
that command over 97 percent of the market
share50
. The unviable firms are gradually weeded
out by market forces.
A quantitative analysis using ‘N’provides insights
into the nature of competition in the market. If
there are a large number of firms on the fringes, it
could indicate their irrelevance in influencing the
degree of active competition. Thus, we define:
Irrelevant Firms (IR) = Actual Number of Firms in the
Industry – N ……………. (1)
Proportion of Irrelevant Firms (IRp) = IR/ Total
Number of Firms ………… …. (2)
While an increase in the number of players in the
market can give the notion of increased
competition, if the increase does not lead to
significant changes in market shares then the level
of competition remains unaffected. We calculate N,
IR and IRp for different segments of the mobile
industry in India51
. Results for the overall industry
and feature phone/ smart phone categories are
provided in Table 2.7 below. Table 2.8 captures the
detail on the segmentation by technology
generations. The results for the price segments are
available in Appendix 2.

Competition Issues in India’s Mobile Handset Industry
13
Table 2.7: Estimates for N, IR and IRp for Overall Industry, Feature Phone and Smartphone
Categories
Product
Category Measure 2007 2008 2009 2010 2011 2012 2013 2014 2015 2016 2017 2018
Total Industry
Numbers Equivalent 3 2 3 6 5 5 6 8 7 8 8 6
Number of irrelevant
brands 24 28 34 31 35 41 38 45 48 48 47 40
Proportion of
irrelevant brands 89% 92% 92% 83% 87% 89% 87% 85% 87% 85% 86% 86%
Feature Phone
Numbers Equivalent 3 3 3 7 5 5 5 6 7 6 6 3
Number of irrelevant
brands 14 17 25 24 30 32 29 30 22 20 17 15
Proportion of
irrelevant brands 80% 87% 88% 78% 86% 86% 85% 83% 77% 76% 72% 82%
Phablet
Numbers Equivalent
1 1 8 5 6 5 4
Number of irrelevant
brands 1 10 16 31 36 37 30
Proportion of
irrelevant brands 50% 88% 68% 86% 85% 87% 87%
Regular Smart
Phone
Numbers Equivalent 1 2 2 3 5 4 5 7 7 9 9 8
Number of irrelevant
brands 12 14 15 15 15 28 29 36 44 36 38 28
Proportion of
irrelevant brands 89% 89% 90% 85% 77% 88% 85% 85% 86% 81% 80% 79%
Source: Authors’ calculations using data from IDC’s Quarterly Mobile Phone Tracker, 2018Q2
Table 2.8: Estimates for N, IR and IRp by Technology Generations
Technology
Generation Measure 2007 2008 2009 2010 2011 2012 2013 2014 2015 2016 2017 2018
2G
Numbers Equivalent 2 2 1 2 2 4 4 5 3 5 5 5
Number of irrelevant brands 10 11 14 23 19 23 23 28 23 18 15 9
Proportion of irrelevant brands 87% 87% 90% 92% 90% 86% 83% 86% 87% 77% 75% 66%
2.5G
Numbers Equivalent 4 3 5 7 6 6 7 8 8 7 5 5
Number of irrelevant brands 20 25 29 25 29 31 28 29 24 18 16 12
Proportion of irrelevant brands 83% 89% 87% 77% 83% 84% 81% 79% 77% 73% 76% 69%
3G
Numbers Equivalent 1 2 2 4 4 3 4 7 9 9 6 2
Number of irrelevant brands 8 12 13 15 16 27 28 38 34 23 14 3
Proportion of irrelevant brands 84% 88% 87% 81% 79% 89% 88% 85% 79% 72% 71% 51%
4G
Numbers Equivalent
1 3 4 4 7 7 6
Number of irrelevant brands
2 4 10 36 37 43 36
Proportion of irrelevant brands
63% 54% 72% 89% 84% 86% 86%
Source: Authors’ calculations using data from IDC’s Quarterly Mobile Phone Tracker, 2018Q2
The estimate for numbers-equivalent and the
corresponding number of irrelevant brands is less
optimistic than that for HHI. With declining HHIs,
the proportion of irrelevant brands have steadily
declined in most segments, however they are still
relatively high. While the number of brands in most
of the market segments is increasing (Table 2.3 –
2.5), the brands have been unsuccessful in
capturing significant market shares. For 4G enabled
mobile phones and the phablet category, the
proportion of irrelevant brands has increased over
time. However, in the price band segmentation, the
proportion of irrelevant firms has increased in the

14
lower price bands. In the higher price bands i.e.
$300 to above $700, the proportion of irrelevant
brands has decreased over time, although the
decline is not steady (Refer to Appendix 2). The
number of irrelevant firms implies that the level of
competition is in fact lower than that projected by
the active number of firms in the market. This is
established by the presence of several small firms in
the industry, which are captured in the IDC data as
‘Others’ and collectively comprise almost 30 percent
of the market. The pool of the firms however
changes annually as there is rapid entry and exit.
Many firms that don’t intend to scale up and may
exit after dip sticks in the market. This is especially
true of fly by night operators. However, some new
entrants, both domestic and foreign were able to
become relevant players in the market. Indian
brands like Micromax, Lava, Karbonn and Intex that
dominated the market and held a share of almost
50% in 2014, rapidly lost their share to Chinese
brands and accounted for less than 9% in 2018.52
On
the other hand, Chinese smartphone brands have
successfully carved out a share among Indian
consumers. According to Counterpoint Research,
Chinese brands not only sport better specifications,
they have maintained affordable pricing and kept
pace with improvements in technology, particularly
the sudden shift from 3G to 4G in India.
Consequently, several brands have been rendered
irrelevant. Indian brands like Micromax were left
them with huge stocks of 3G smartphones in their
supply chains, in a market that was focusing on 4G
devices.53
Policy interventions that empower a
larger pool of competitive manufacturers and
increase their relevance in the market, will reduce
the risk of monopolisation in the future.
2.2.2 Other Measures of Market Concentration
The academic search for the defining measure of
concentration has led to the development of several
indicators to complement HHI and to overcome its
reported limitations. The Holy Grail has however
been elusive. HHI and numbers-equivalent thus
continue to be the most popular empirically,
although it is useful to complement these with
other measures of market concentration such as the
N-Concentration Ratio, Horvath Index, Entropy
Index, Ginevicius Index and the GRS Index.
The K-Concentration Ratio defined as Ck= ∑ 𝑆𝑖𝑘𝑖=1 ,
where Si54
is the market share for each of the top k
firms in the industry. This measure is very sensitive
to the choice of k. it provides information about
changes in market share between the top N firms in
an industry, but does not capture changes in
distribution.
The Horvath Index (1970) is defined as HOR =S155
+ ∑ 𝑆𝑖2(2 − 𝑆𝑖)𝑁𝑖=2 , where S1 is the market share of
the largest firm in the industry. This index assigns
larger weights to all firms as compared to the HHI56
.
As a comprehensive concentration index (CCI) it
discretely accounts for the share of the largest firm
and for other firms in a weighted form57. The value
of the index ranges between 3n2−3n+1n3 and 1
provided n is not equal to two. However, this index
is not popular in use as it does not provide for
theoretical or computational advantages as
compared to other indices.
The Entropy Index is measured using the formula
E= ∑ 𝑆𝑖 𝐿𝑛( 1𝑆𝑖)𝑛𝑖=1 . The index is derived from the
information theory and measures the degree of
uncertainty faced by a firm in the market place. The
value of the index varies from 0 to Log (n) where n
is the number of firms. The value of the index
approaches 0 if the market is a monopoly and
reaches its highest value log n in a perfectly
competitive market i.e. market shares of all firms
are equal and market concentration is the lowest.
The Entropy Index assigns larger weights to smaller
firms as compared to the weights assigned during
computation of the HHI. The Entropy Index fails the
test of duopoly - the formula results in the highest
value predicting perfect competition for an
underlying duopoly market.
The Ginevicius Index is measured using the formula
GIN = ∑ ( 𝑆𝑖1+𝑛(1−𝑠𝑖))𝑛𝑖=1 . The value of the index ranges
between 0 and 1. This index also fails to represent
true market concentration especially when shares
are skewed in favour of a few firms. For example, if
there are two firms in a market where one has 90%
market share and the other has 10%, then the index
takes a value of approximately 0.786 which is
relatively low considering the high degree of
concentration in this market.

Competition Issues in India’s Mobile Handset Industry
15
The GRS Index is measured using GRS = ∑ (𝑛2𝑆1+0.3𝑆𝑖2𝑛2+0.3𝑛𝑆1𝑆𝑖 𝑆𝑖)𝑛𝑖=1 . This index is based on the
Taylor Series. The value of GRS lies between 0 and 1
and it takes the value 1/n if all firms have equal
market share. It is believed to provide the most
accurate measure of market concentration58
.
The estimates for all indices across different
segments of the industry are provided in Appendix
3. All results point towards improving competition
across different segments of the industry with the
exception of phones belonging in the higher price
category. This has already been indicated in the
discussion on HHI estimates. We present a
correlation matrix (Refer Table 2.9) at the industry
level to present a comparison across different
indices. The HHI correlates well with other
measures of concentration, with most coefficients
above 0.9. The negative correlation with the
Entropy Index and N is because of the use of
reciprocals in the formula.
Table 2.9: Correlation Matrix for Different Measures of Concentration at the Overall Industry
Level
HHI C4 GIN GRS E N
HHI 1
C4 0.8906
(0.0001) 1
GIN 0.9694
(0.0000)
0.898
(0.0001) 1
GRS 0.9897
(0.0000)
0.8305
(0.0008)
0.9513
(0.0000) 1
E -0.9712
(0.0000)
-0.9645
(0.0000)
-0.9712
(0.0000)
-0.9365
(0.0000) 1
N -0.9547
(0.0000)
-0.9494
(0.0000)
-0.9142
(0.0000)
-0.9284
(0.0000)
0.9704
(0.0000) 1
(Numbers in parentheses are p values, all correlation coefficients are significant at the 95% level of significance, p values <0.05)
Source: Authors’ calculations using data from IDC’s Quarterly Mobile Phone Tracker, 2018Q2
In summary, the market concentration analysis finds
an increase in market consolidation, particularly
from 2016 to 2018, owing largely to the recent exits
of smartphone brands from a hyper-competitive
mobile handset market in India. We know that HHIs
have been declining and alongside the proportion of
irrelevant brands. However, the numbers-
equivalent analysis reveals that there continues to
be a high proportion of irrelevant firms in the
industry.
Several fringe firms have been unsuccessful in
capturing market share, large enough to influence
the level of competition in the industry. However,
some Chinese brands have steadily out-competed
their Indian counterparts, who have failed to match
the sophisticated features, the constant
improvements in specifications and affordability
offered by Chinese brands. Policy interventions that
help strengthen capabilities of the smaller firms by
developing the overall ecosystem will definitely help
improve the competitiveness of Indian firms and
secure the level of competition in the future.
2.2.3 Product Differentiation and the MCI Index
In the introduction we highlighted the fragmented
nature of the mobile handset industry. Product
differentiation in the industry is high, in part due to
consumer demand for variety.59
In addition, there is
anecdotal evidence to suggest that consumers
change handsets often, sometimes even within a
year60
. Product differentiation is an important
determinant of market concentration. Economic
theory suggests that product differentiation enables
firms to establish entry barriers61
. Empirical
evidence supports the claim that product
differentiation influences market concentration and
confers market power62
. Milne in 199263
proposed a
new index to calculate market concentration in
differentiated markets. The three step procedure
for measuring concentration is – define the relevant

16
market and submarkets and measure product
market differentiation and concentration. To begin,
concentration is estimated for each sub-market by
taking the sum of squared sub-market shares. A
submarket concentration index (SCI) is defined as
SCIi= ∑ 𝑆𝑖𝑗2𝑚𝑗=1 where Sij is firm j’s share in the
submarket i. The properties of this measure are
identical to those of the HHI, except that SCI, is
measured at the submarket level rather than the
total market level. Once submarket concentration
indices have been calculated, a market
concentration index (MCI) can be calculated by
taking a weighted average of the submarket
concentration indices. A weighted average is used
because it captures the relative level of monopoly
power in each submarket. The weights are
determined by the size (total sales) of each
submarket. MCI= ∑ 𝑊𝑖 𝑆𝐶𝐼𝑖𝑛𝑖=1∑ 𝑊𝑖𝑛𝑖=1
MCI has the same bounds as HHI- ranging between
zero (many small firms and hence no concentration)
and 10,000 (monopoly). However, unlike HHI, MCI
has important additional properties. Since MCI is a
weighted average, it adjusts for the firms'
differentiated product offerings across submarkets.
The result is a value that is greater than or equal to
the HHI. The lower bound of MCI is equal to that of
the HHI and is achieved if there is only one
submarket or if the market share distribution
corresponds to the submarket share distributions.
The upper bound is a monopoly situation (like that
of the HHI) and in markets where firms have
partitioned to create completely different
submarkets. In general, the lesser the degree of
product differentiation, the closer MCI is to HHI; the
greater the degree of product differentiation, the
closer MCI is to 10,000.
Product differentiation is measured by the ratio of
MCI and HHI. PMD = MCI/ HHI ranges between 1
and n, where n is the number of firms, and each
firm belongs to a different market segment. Higher
the value of PMD, lesser is the rivalry among firms
as each offers a differentiated product. Conversely
as product differentiation declines the market will
become increasingly rivalrous with more firms
contesting in the same market (sub-market).
We first measure PMD using the feature phone,
phablet and regular smart phone categorization of
mobile phones. The average value of the index over
the period 2007 to 2018 is 1.94. Since PMD is
greater than 1, there definitely exists a degree of
product differentiation; whether high or low
becomes clearer once we compare the numbers
over time and across different types of
categorisations. This was also apparent from the
sub-market shares for different brands which
dominated different categories of mobile phones.
Using the technology generation categorisation we
find a rising trend in PMD. The average estimate of
PMD before the introduction of 4G phones in 2012
was 1.12, and 1.99 for the period 2013 to 2018
(Please refer to Table 2.10a). The number of 4G
models increased from 6 in 2012 to 1060 in 2016
and dropped to 668 in 2018. The number of models
in the 3G category increased from 96 in 2007 to 462
in 2012, 848 in 2016 and 14 in 2018, explaining the
rise in PMD from 2007 to 2016 and the subsequent
decline. For the overall market, manufacturers
began to rationalize the number of available
models64
. The increase in PMD is less sharp if we
use the feature phone, phablet and regular smart
phone categorization (Please refer to Table 2.10b).

Competition Issues in India’s Mobile Handset Industry
17
Table 2.10a: PMD Estimates for the Mobile Phone Industry in India Using Technology
Generations as Submarkets
Year PMD Average PMD
2007 1.116364
1.12
2008 1.046757
2009 1.092663
2010 1.228734
2011 1.130035
2012 5.680758
2013 2.907083
1.99
2014 3.04456
2015 2.193672
2016 1.469042
2017 1.220589
2018 1.126197
Source: Authors’ calculations using data from IDC’s Quarterly Mobile Phone Tracker, 2018Q2
Table 2.10b: PMD Estimates for the Mobile Phone industry in India Using Phone Type as
Submarkets
Year PMD Average PMD
2007 1.067669
1.07
2008 1.013846
2009 1.035181
2010 1.165377
2011 1.070023
2012 1.160053
2013 1.297605
1.21
2014 1.216235
2015 1.124116
2016 1.127969
2017 1.136547
2018 1.356361
Source: Authors’ calculations using data from IDC’s Quarterly Mobile Phone Tracker, 2018Q2
We further dissect the market for each technology
generation into price bands65
, treating each
generation as a separate market and the price
bands as submarkets within each technology
market. Not all technology generations find models
across each price band. For example, the most
expensive 2G phones fall within the $100 - $125
band, while 2.5G and 3G phones were available
across all price bands at least at some point
between 2007 and 2016. 4G phones were not
available in the less than $25 category until 2017. A
summary of PMD estimates for each technology
generation is provided in Table 2.11 below. Product
differentiation has increased in the 3G market up
until 2016 after which it declined. On the other
hand, PMD increased steadily between 2012 and
2018 in the 4G market. An increase in PMD is
observed even in the 2G and 2.5G markets,
however, the 4G market is least rivalrous among all
four technology generations.
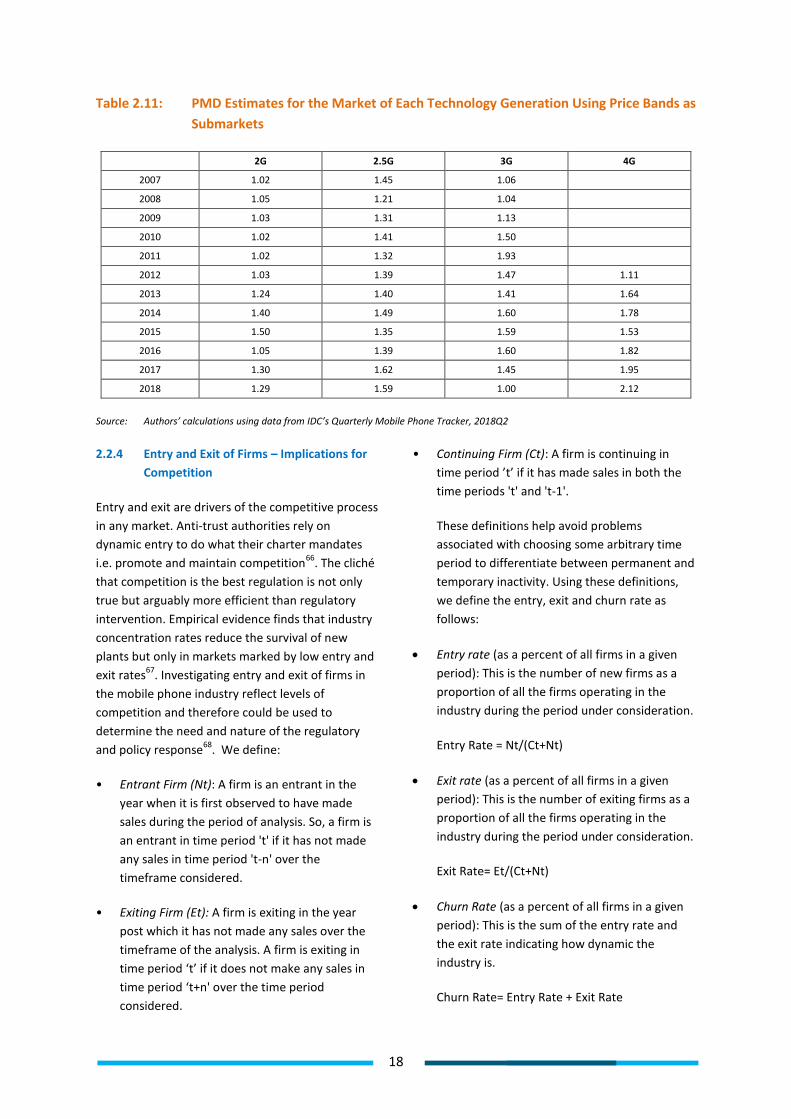
18
Table 2.11: PMD Estimates for the Market of Each Technology Generation Using Price Bands as
Submarkets
2G 2.5G 3G 4G
2007 1.02 1.45 1.06
2008 1.05 1.21 1.04
2009 1.03 1.31 1.13
2010 1.02 1.41 1.50
2011 1.02 1.32 1.93
2012 1.03 1.39 1.47 1.11
2013 1.24 1.40 1.41 1.64
2014 1.40 1.49 1.60 1.78
2015 1.50 1.35 1.59 1.53
2016 1.05 1.39 1.60 1.82
2017 1.30 1.62 1.45 1.95
2018 1.29 1.59 1.00 2.12
Source: Authors’ calculations using data from IDC’s Quarterly Mobile Phone Tracker, 2018Q2
2.2.4 Entry and Exit of Firms – Implications for
Competition
Entry and exit are drivers of the competitive process
in any market. Anti-trust authorities rely on
dynamic entry to do what their charter mandates
i.e. promote and maintain competition66
. The cliché
that competition is the best regulation is not only
true but arguably more efficient than regulatory
intervention. Empirical evidence finds that industry
concentration rates reduce the survival of new
plants but only in markets marked by low entry and
exit rates67
. Investigating entry and exit of firms in
the mobile phone industry reflect levels of
competition and therefore could be used to
determine the need and nature of the regulatory
and policy response68
. We define:
• Entrant Firm (Nt): A firm is an entrant in the
year when it is first observed to have made
sales during the period of analysis. So, a firm is
an entrant in time period 't' if it has not made
any sales in time period 't-n' over the
timeframe considered.
• Exiting Firm (Et): A firm is exiting in the year
post which it has not made any sales over the
timeframe of the analysis. A firm is exiting in
time period ‘t’ if it does not make any sales in
time period ‘t+n' over the time period
considered.
• Continuing Firm (Ct): A firm is continuing in
time period ’t’ if it has made sales in both the
time periods 't' and 't-1'.
These definitions help avoid problems
associated with choosing some arbitrary time
period to differentiate between permanent and
temporary inactivity. Using these definitions,
we define the entry, exit and churn rate as
follows:
Entry rate (as a percent of all firms in a given
period): This is the number of new firms as a
proportion of all the firms operating in the
industry during the period under consideration.
Entry Rate = Nt/(Ct+Nt)
Exit rate (as a percent of all firms in a given
period): This is the number of exiting firms as a
proportion of all the firms operating in the
industry during the period under consideration.
Exit Rate= Et/(Ct+Nt)
Churn Rate (as a percent of all firms in a given
period): This is the sum of the entry rate and
the exit rate indicating how dynamic the
industry is.
Churn Rate= Entry Rate + Exit Rate

Competition Issues in India’s Mobile Handset Industry
19
A simple yet effective way to analyse entry exit
activity is to record the number of firms operational
in the market and the corresponding changes in the
numbers over time. We use data for the period
2007 to 2018 for this exercise. For a better
understanding of the trend we also provide the
number of firms manufacturing phones across
different technology generations. There are very
few firms that focus on an exclusive generation of
phones, except perhaps for 2.5G until 2014 and 4G
in 2015 and 2016. Figure 2.4 provides a
representation of the total number of firms in the
market along with the number of firms producing a
single type or mix of technology generation phones.
The number of firms producing phones across all
technology generations has increased substantially
since 2012.
The rise in the total number of brands until 2015 is
on account of a higher entry versus exit rate. From
2016, exit rate begins to surpass entry rate, and the
total number of brands in the market also fall.
While entry rate has declined over time, the trend
in exit rate is mixed. The highest exit rate is
observed in 2017. Churn rate in the industry has
followed a steady decline over time. Figure 2.5
provides data for number of firms, exit, entry and
churn rates for the overall industry from 2007 to
2018.
Figure 2.3: Number of Brands in the Industry and also Across Different Technology Generations
Source: Compiled by authors using data from IDC’s Quarterly Mobile Phone Tracker, 2018Q2
Entry and exit could also be a surrogate for
expected profits. For example, instances of one-
round entry and one-round exit69
in case of
homogenous firms may reflect market expectations.
When expected profitability is high, firms are more
likely to enter than leave the market and vice
versa70
. There are also findings in the literature
related to hit-and-run entry. For India’s mobile
phone market, several cases of hit and run entry
exist where firms have either exited the entire
market/ or a particular sub-market within two years
of starting operations (Refer to Appendix 5 for
brand-wise details). This could be a case of
exuberant firms whose expectations at entry are
not realised in the market and thus exit becomes a
rational choice. In a contestable market71
, hit-and-
run entry or even the threat of it leads to outcomes
which mimic those of competitive markets (e.g. zero
long-run profit) even if the market structure is not
competitive72
. Thus competition for the market
could lead to competition in the market.
27 30
37 37 40
46 44
53 55 56 55
46
0
10
20
30
40
50
60
2007 2008 2009 2010 2011 2012 2013 2014 2015 2016 2017 2018
2G 2.5G 3G
4G 2G, 2.5G 2.5G, 3G
2.5G, 4G 3G, 4G 2G, 2.5G, 3G
2G, 3G, 4G 2G, 2.5G, 4G 2.5G, 3G, 4G
2G, 2.5G, 3G, 4G Total number of brands

20
Figure 2.4: Industry Level Estimates for Number of Brands, Entry, Exit and Churn Rates
Source: Compiled by authors using data from IDC’s Quarterly Mobile Phone Tracker, 2018Q2
An analysis of industry churn for different market
segments finds rising exits across 2.5G and 3G
manufacturers. For 2G, wherein the exit rate rises
up until 2012 and then shows an overall decreasing
trend, declining finally to 0% in 2017. While several
firms were exiting the older technology sub-
markets, there were still some firms entering these
markets even until 2016, though the entry rates
were very low. For 2G and 2.5G segments, there
were no new entrants in the market in 2017 and
2018 (Q1 and Q2). In case of 4G however, since the
market took off only in 2012, the exit rates have
been close to nil, but increased later to almost 22%
in 2017. In 2018, the entry rate also tempered to
about 5%, from a peak of 65% in 2015. Within these
segments, industry churn has demonstrated a rising
trend for 4G phones and potentially signals a
growing market, versus the case of 2G and 2.5G,
which are relatively mature markets. Please refer to
Appendix 6 for the industry churn analysis of sub-
markets defined on the basis of technology
generations.
2.3 Conclusions
The handset market in India witnessed the entry of
several small and big manufacturers, both Indian
and foreign. The market demonstrated features of
hyper-competition which eventually led to the exit
of several brands, especially in maturing and/or
obsolete technology segments. Moreover,
competitive pressure led to a decline in the number
of brands across most market segments in 2018 as
manufacturers consolidated within and across
segments. There was a consequent increase in
measures of market concentration, albeit without
raising any apparent antitrust concerns.
Analysis at the sub-segment level shows differential
competition across categories. The market for
premium phones, is small and relatively more
concentrated. With Chinese brands acquiring a large
portion of the market share, the number of active
brands is very low. This is reinforced by the large
number of irrelevant brands in the market. The
product market differentiation and entry-exit
analysis complement these findings. The degree of
product differentiation as measured by the PMD
2007 2008 2009 2010 2011 2012 2013 2014 2015 2016 2017 2018
Churn rate 43.33% 43.24% 24.32% 30.00% 32.61% 6.82% 22.64% 23.64% 19.64% 29.63%
Number of Brands 27 30 37 37 40 46 44 53 55 56 55 46
Entry rate 26.67% 29.73% 18.92% 12.50% 26.09% 6.82% 11.32% 16.36% 8.93% 7.41% 6.52%
Exit rate 14.81% 16.67% 13.51% 5.41% 17.50% 6.52% 0.00% 11.32% 7.27% 10.71% 22.22%
26.67%
6.52%
14.81%
22.22%
0
10
20
30
40
50
60
0.00%
5.00%
10.00%
15.00%
20.00%
25.00%
30.00%
35.00%
40.00%
45.00%
50.00%
Nu
mb
er
of
Fim
s
Ch
urn
Ra
te

Competition Issues in India’s Mobile Handset Industry
21
index, finds the market for 4G phones to be more
concentrated, but also more dynamic than 2G and
2.5G. The industrial churn in 4G is mostly driven by
the entry of new firms although it is showing signs
of moderating.
Analysis of the composite handset market as well as
the various sub-segments reveals two immediate
and palpable conclusions. One, measures of
competition as reflected in the several overlapping
but mutually reinforcing indices reveal significant
competition over time and across segments. There
is no doubt that the structural estimates vary
overtime and of late have shown a tendency to
increase especially in segments where consolidation
is taking place. Antitrust concerns surrounding this
shift however are minimal. If the structural
measures of competition are juxtaposed with the
churn analysis, competitive concerns would be
alleviated if not eliminated. The churn analysis
suggests that high entry, real or expected
(suggesting low entry barriers) acts as a market
disciplining devise even if concentration is rising.
This is the inescapable truth of contestable markets.
The second striking feature of the handset market is
the recent domination by Chinese brands. Even
during times when Indian brands were enjoying
high growth, the extent of value addition within the
country was minimal as a large proportion of the
components were being imported from China. The
last three budgets have tried to incentivise local
production by raising duties on imported
components. While local value addition has
increased slowly it still remains below 20%
reflecting in part the efficacy of assembly in India
and in part the disability that Indian manufacturing
has to contend with. We return to this discussion in
the final section of the report.
The next section complements the analysis in this
section with survey findings on consumer
preferences. For example, insights on brand
stickiness or technology lock-ins, explain the
outcomes from secondary data analysis and help
build an appropriate policy response where
necessary.

3. Survey Analysis
The rapidly changing economic landscape of the
country has also influenced consumer buying
behaviour. The decision process, including
purchase, is influenced by rising affluence, the
pattern of urbanization, and fundamental shifts in
family structures.73
The use and consumption of
technology including digital services is among the
most affected. As of September 2018, there were
over 1.1 billion mobile subscribers in India.74
The
wide adoption can be attributed to a number of
factors, including, reduction in costs of data plans,
increased affordability of smartphones and the
recent entry of Chinese brands such as Oppo, Vivo
and Xiaomi, that offer cheaper devices with
improved features including bigger screens, better
user interfaces, local language support, etc.75
Consumer preferences have adapted to the
constant improvements in mobile technology and
handset manufacturing. The demand for
sophisticated features has created a virtuous cycle
of innovation on the producer side. In this section,
we analyse findings from a primary consumer
survey of mobile phones to understand the demand
side of the industry and how consumer preferences
affect competition in the handset industry in India.
3.1 Sample Description
To start, a structured questionnaire76
was first
piloted using a small sample in 2017. Inadequacies
and inconsistencies were addressed in the revised
version administered to a larger audience.
Responses were collected using Survey Monkey, an
online survey platform over a period of four
months. We also sought the help of Hansa Cheetah,
a microwork platform for data collection that
circulated our questionnaire among empanelled
respondents. Using both platforms we received a
total of 544 responses. Approximately 72% of the
respondents belong to Tier 1 cities that include
Delhi (as well as other parts of NCR), Mumbai
(including Greater Mumbai and Navi Mumbai),
Kolkata, Bangalore, Hyderabad and Chennai. The
average age of respondents is approximately 27
years and the gender distribution is fairly equal.
Approximately 73% of the sample is comprised of
graduates or post-graduates. Students make up the
largest category under “Occupation” with a 32%
share, followed by 24% employed with the private
sector. While 30% respondents have not reported
their monthly income, about 22% reported earning
less than Rs. 30,000, followed by 20% who reported
“No income”. Our survey does not capture rural
consumers, although they make up for a substantial
proportion of the demand and thus, naturally
influence the demand side factors. Demand for
features such as vernacular support, not only in
handsets, but also in apps, arise from the rural and
semi-urban population. The need for simplified
operations on mobile phones becomes necessary
given the low rates of digital literacy in India.
Education, occupation and location play important
roles in determining consumer preferences. While
are sample is not completely representative, it
captures some trends in purchase and usage of
mobile phones in India. Approximately 96.9%
respondents in our survey reported using a
smartphone, while only 2.76% reported using
feature phones. Figure 3.1 provides the sample
distribution by level of education, type of
occupation and monthly income in rupees.

Competition Issues in India’s Mobile Handset Industry
23
Employed
with Private
Sector
24%
Employed
with Public
Sector
4%
Employed
with a Not-
for-Profit
6% Business
13% [CATEGORY
NAME]
[PERCENTAG
E]
Student
32%
Not Seeking
Employment
1% Others
15%
Distirbution by type of occupation
Figure 3.1: Distribution of Sample by Educational Qualification, Occupation and Monthly Income
3.2 Survey Results
3.2.1 User Preferences for Brands and Features
The analysis in Section 2, points towards changing
brand preferences among users, especially with the
entry of Chinese brands over the last couple of
years. Samsung, India’s top smartphone seller77
since 2012, was outstripped by Xiaomi in the last
quarter of 2017. Our survey results almost mirror
brand preferences indicated by secondary data in
2017. The dominant brand, as illustrated in Figure
3.2 below, is Samsung, followed by Motorola, which
is a subsidiary of Lenovo. There is an equal share of
Apple and Xiaomi users. While there may be gender
and age specific brand preferences, our sample data
does not adequately capture this. The choice of
brand is driven by several factors, including
technology, design, brand, purpose as well as social
reference groups (Ehtesham Mohammad, 2012).78
The primary survey reveals a significant departure in
consumer buying behaviour for mobile phones in
India. 42% respondents reported acquiring mobile
phones online, followed by 39% who purchased
from retail stores. Additionally, 49% respondents
relied on recommendations from friends and family,
while 34% relied on online resources for purchase
(Refer Figure 3.3 below). While survey results
indicate a change in trend with product reviews
aplenty on the Internet, the reliance on word-of-
mouth recommendations from friends and family
continues to be significant. Evidence from the
literature finds that word-of-mouth sources were
perceived to be more reliable, credible and less
biased (Edgett and Parkinson, 1993, Murray,
< 30,000
22%
0%
0% 30,000 -< 50,000
13%
50,000 -< 1,00,000
8% 1,00,000 -< 3,00,000
4% > 3,00,000
3%
No income
20%
No response
30%
Distribution by level of monthly income
Mphil/PhD
1%
Post
Graduation
26%
Graduation
47%
Sr.
Secondary
(upto class
12)
19%
Secondary
(upto class
10)
6%
Primary
(upto class
5)
1%
Distirbution by level of education

24
Online
42%
Retail shops
39%
Local mobile
stores
17%
Repurchase/s
econd-hand
purchase
1%
Others
1%
Place of purchase
1991).79
Due to the lack of tangible evidence to help
evaluate a purchasing decision, consumers sought
advice from family and friends which was regarded
as independent, flexible, and more trustworthy,
incorporating positive and negative perspectives.80
In sum, data shows a massive marketing expense
incurred by mobile phone companies on online
retail platforms. Brands are ditching brick and
mortar for smart sales through the online route. A
successful case in point was the exclusive online
launch of Xiaomi in 201481
.
In general, consumer buying behaviour is influenced
by two broad factors - individual and
environmental.82
While the former includes factors
such as demographics, consumer knowledge,
perception, motivation, lifestyle etc., the latter
includes factors like culture, social class, reference
group, family, household etc.83
Literature suggests
that a consumer goes through five different steps
while purchasing a product - need recognition,
information search, evaluation of alternatives,
purchase and post purchase evaluation (Schiffman
et al, 2015).84
However, in case of mobile phone
purchases, consumers may either go through all five
stages of rational decision making, or make a quick
choice based on hedonic considerations.85
Use of
online platforms will play a significant role in each
of the five steps mentioned above. While online
platforms help address some information
asymmetries in the market, maintaining their
neutrality in terms of the information available is
important to achieve competitive outcomes in the
industry.
Figure 3.2: Percentage Share of Brands among Surveyed Consumers
Figure 3.3: Place of Purchase and Source of Information for Purchase of Mobile Phones
Online
resources
34%
Recommend
ations from
friends and
family
49%
Reccommend
ations by
mobile stores
13%
Others
4%
Source for information
Apple
10%
Lenovo
7%
Micromax
4% Motorola
14%
OnePlus
4%
OPPO
6%
Samsung
20%
Vivo
4%
Xiaomi
10%
No response
8%
Brand preferences

Competition Issues in India’s Mobile Handset Industry
25
In order to develop a better understanding of
consumer preferences the questionnaire was
designed to assign scores to different factors
influencing the purchase of mobile phones, such as
brand, technology support, price, etc, as well as
features of mobile phones such as battery life,
memory, etc. Since India is a price sensitive market,
we would have expected price to be one of the
driving factors, however, our survey finds that
respondents consider “Technology Support (3G/4G
support)” as the most important factor, followed by
“Brand” for decisions driving the purchase of a
mobile phone. Recent studies also find that factors
like quality, features and brand name have
surpassed price as more important factors
influencing choice of mobile phones.86
With respect
to features, “Battery Life” was accorded the highest
score followed by “Memory Storage” and “RAM and
Processing Speed”. Table 3.1, given below, tabulates
the average scores assigned and the corresponding
ranks of these factors and features based on their
scores.
The results from our survey are not atypical. A study
by Saif et al (2012) found that consumers valued
new technology features as the most important
variable driving their decision to purchase a new
mobile phone.87
Another study by Karjaluoto et al
(2005), finds that price, brand and user interface
tend to be the most influential factors, affecting the
actual choice among mobile phone brands.
Additionally, a study by Osman et al (2012) also
found that after smartphone design, a built-in Wi-Fi
adapter was the second most common specification
that is important to consumers during a buying
decision. This corroborates our findings on the
importance of technology support; which on
average has been ranked as the most important
factor when considering purchase of a mobile
phone.
While design and technology are tangible phone
features, the preference for brands is also an
outcome of intangible aspects. Studies have found
that purchasing branded products and preference
for brand origin, depends on the age of
consumers.88
Research has examined the degree of
strength in the relationship between marketplace-
related beliefs and pre-purchase external search
behaviour (Duncan and Olshavsky, 1982).89
They
find that sometimes, consumers simplify the search
and evaluation process by focusing on brands,
stores, labels or seller's market share. These
variables are used as indicators of quality.90
The other deterministic factor is product
differentiation that continues to characterise
competition among manufacturers.91
Two distinct
development strategies are normally used by firms -
vertical innovation and horizontal innovation (Kroski
and Kretschmer, 2007).92
The former represents
improvements to the product’s technical
characteristics and establishes a clear quality
ranking for consumers, while the latter entails
development of new product characteristics that
result in a significant improvement only for those
with a higher willingness to pay.93
Approximately
74.8% respondents said that if between two
phones, ceteris paribus, one preferred feature such
as battery, camera etc. were to improve, then they
would be willing to pay more for the improved
phone. In the highest income bracket (> Rs.
3,00,000 per month) respondents have expressed a
willingness to pay 50% more in price for a phone
when, other factors remaining the same, the quality
of one preferred feature has been improved.
Empirical evidence in literature suggests that
increased competition coupled with continuous
technological development has led to the
emergence of dominant designs in vertical features.
However, the determinant of competition is
innovation in horizontal features, particularly in
screen size and width, and even in operating
systems to a certain extent.94
From our secondary
data analysis we find an increasing trend in product
differentiation for the overall industry in India.

26
Table 3.1: Average Scores Assigned to Important Factors and Features
Factors and Features Average Scores (On a scale of 1
to 5)
Rank (1 being the highest and 5
being the lowest
Rating of these factors
by importance for
buying a mobile phone
Price 3.94 5
Brand 4.1 2
Operating System 3.98 4
Service Centre Accessibility 3.99 3
Technology support (3G/4G
support)
4.27 1
Rating of features by
importance
Battery Life 4.28 1
Screen Size 4.01 6
RAM and Processing speed 4.21 3
Storage Memory 4.23 2
Camera Resolution 4.13 5
Vernacular Support 3.86 7
Operating System 3.72 9
Audio Quality 3.8 8
Display Resolution 4.15 4
3.2.2 User trends for Mobile Phone Features
and Apps95
“There’s an app for that” – Apple’s buzz-worthy
phrase is now a reality96
. The phenomenal rise of
apps has transformed the use of mobile phones
from only calling and messaging to several other
technology enabled services. Our survey finds that
that “Calls”, “E-mail” and “Internet Browsing” were
the features most frequently used on the mobile
phone, followed by “Instant Messaging”, “Camera”,
“Music”, “Videos” and “Games”. Among most
frequently used mobile applications, “Social
Networking” received the highest average score,
followed by “News and Knowledge” and “Maps and
Navigation”. Table 3.2 below provides a ranking
based on average scores reported by respondents.
Table 3.2: Average Scores Assigned to Features and Apps based on Frequency of Use
Features and Apps Average Scores (On a scale of
1 to 5)
Rank (1 being the highest and 5 being
the lowest
Rating of these
features based on
frequency of use
Calls 4.19 1
Text/Instant Messaging 4.13 2
Camera 4.12 3
E-mail 4.19 1
Internet Browsing 4.19 1
Music 4.06 4
Videos 3.61 5
Games 3.43 6
Rating of these apps
based on frequency
of use
Social Networking 4.1 1
Entertainment (Gaming, Music,
Video)
3.31 6
News and Knowledge 4.09 2
Maps and Navigation 4.04 3
Health and Lifestyle 3.91 5
E-Commerce 3.99 4
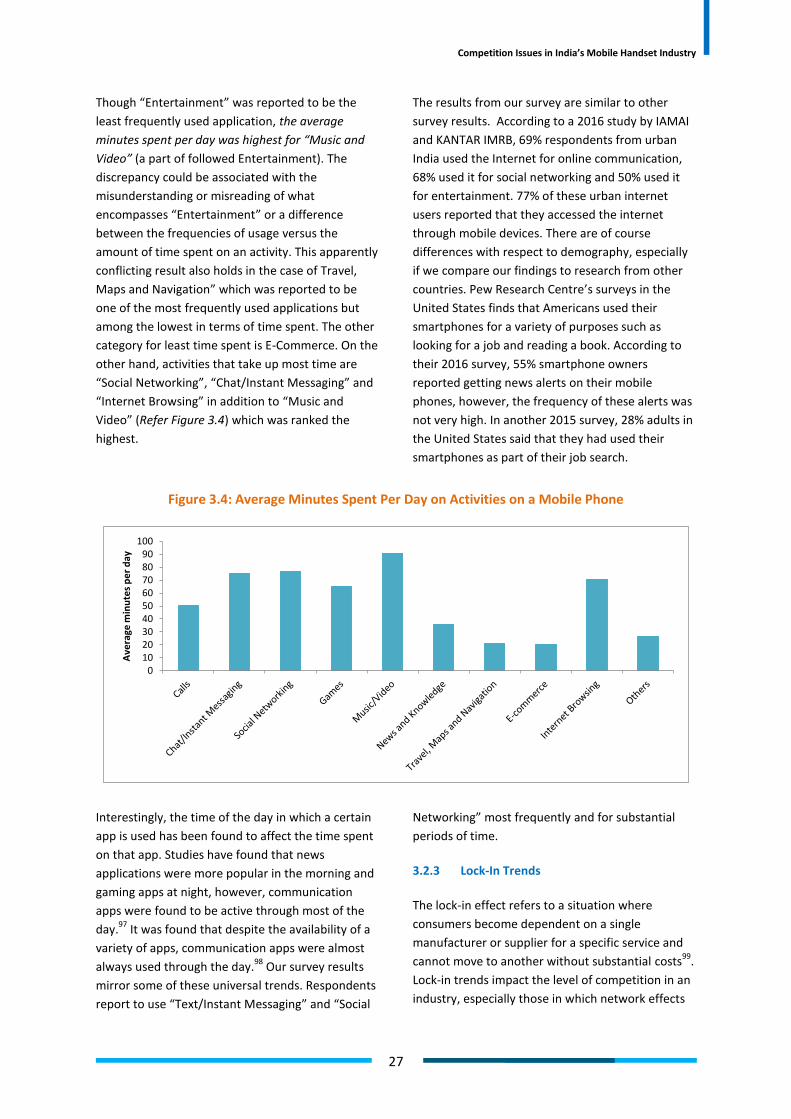
Competition Issues in India’s Mobile Handset Industry
27
Though “Entertainment” was reported to be the
least frequently used application, the average
minutes spent per day was highest for “Music and
Video” (a part of followed Entertainment). The
discrepancy could be associated with the
misunderstanding or misreading of what
encompasses “Entertainment” or a difference
between the frequencies of usage versus the
amount of time spent on an activity. This apparently
conflicting result also holds in the case of Travel,
Maps and Navigation” which was reported to be
one of the most frequently used applications but
among the lowest in terms of time spent. The other
category for least time spent is E-Commerce. On the
other hand, activities that take up most time are
“Social Networking”, “Chat/Instant Messaging” and
“Internet Browsing” in addition to “Music and
Video” (Refer Figure 3.4) which was ranked the
highest.
The results from our survey are similar to other
survey results. According to a 2016 study by IAMAI
and KANTAR IMRB, 69% respondents from urban
India used the Internet for online communication,
68% used it for social networking and 50% used it
for entertainment. 77% of these urban internet
users reported that they accessed the internet
through mobile devices. There are of course
differences with respect to demography, especially
if we compare our findings to research from other
countries. Pew Research Centre’s surveys in the
United States finds that Americans used their
smartphones for a variety of purposes such as
looking for a job and reading a book. According to
their 2016 survey, 55% smartphone owners
reported getting news alerts on their mobile
phones, however, the frequency of these alerts was
not very high. In another 2015 survey, 28% adults in
the United States said that they had used their
smartphones as part of their job search.
Figure 3.4: Average Minutes Spent Per Day on Activities on a Mobile Phone
Interestingly, the time of the day in which a certain
app is used has been found to affect the time spent
on that app. Studies have found that news
applications were more popular in the morning and
gaming apps at night, however, communication
apps were found to be active through most of the
day.97
It was found that despite the availability of a
variety of apps, communication apps were almost
always used through the day.98
Our survey results
mirror some of these universal trends. Respondents
report to use “Text/Instant Messaging” and “Social
Networking” most frequently and for substantial
periods of time.
3.2.3 Lock-In Trends
The lock-in effect refers to a situation where
consumers become dependent on a single
manufacturer or supplier for a specific service and
cannot move to another without substantial costs99
.
Lock-in trends impact the level of competition in an
industry, especially those in which network effects
0
10
20
30
40
50
60
70
80
90
100
Av
era
ge
min
ute
s p
er
da
y

28
exist. If products are incompatible, switching costs
and network effects bind customers to vendors,
locking-in not only customers, but also markets to
early choices.100
Even when efficient options are
available, customers find themselves hindered by
lock-in101
, giving vendors lucrative ex-post market
power over the same buyer.102
Firms compete ex
ante for this ex post power, using penetration
pricing, introductory offers, and price wars.103
We received almost equal proportion of responses
on brand stickiness. 244 respondents (44.85%)
expressed a willingness to switch to a different
model within the same brand or a completely
different brand and model, while 256 respondents
(47.06%) did not want to switch. Among those who
were unwilling to switch, the commonly cited
reason was familiarity with the functionality of their
current phones. Some of the other reported reasons
were - other brands did not offer a similar phone
within the same price range or being locked-in by
device type and/or operating system. However, a
majority of the respondents did not provide any
reason for their unwillingness to switch
brands/models. Out of the 244 respondents who
expressed a willingness to switch, the highest
frequency response was the need for new
experiences and features in a device (33.6%),
followed by availability of better options in the
same price range in other brands (16%). Some also
reported high cost of repair/service or poor service
experience as the reason to switch. A high
proportion among those reporting willingness to
switch also reported buying mobile phones once in
2 years.
Lock-in is often considered a means to increase
customer loyalty and , create a market for cross-
selling opportunities, bind consumers to the
business, and eventually gain recurring revenues
from the same pool of customers (Amit & Zott,
2001; Farrell & Klemperer, 2007; Harrison, Beatty,
Reynolds, & Noble, 2012).104
It is sometimes
suggested that businesses incorporate lock-in into
their business models to achieve higher economic
sustainability and increase levels of value creation
and revenue generation.105
When an entrenched
dominant standard exists in the industry, or when
an industry is in the process of identifying a
dominant standard, then other firms stand at a risk
of being locked out of the market because the
technology standard it supports is rejected in favour
of a competing standard.106
Technical interrelatedness between hardware and
software components also leads to technology lock-
ins107
. For example, a particularly useful app that
might be available on Apple’s app store, may not be
available on Google Play Store for android
platforms. Products of Apple such as chargers are
uniquely designed, while for other brands, chargers
are interchangeable. While our survey findings
don’t find strong evidence of lock-in trends in the
industry, we cannot rule out the possibility of lock-
ins at least within certain niche segments of the
market. Overall it appears that designs, features
and usage of smartphones are acquiring a dominant
general structure. With increased knowledge of
technology usage, switching between devices with
different operating systems does not act as a major
hindrance. In fact, the rising level of product
differentiation in the market, also establishes the
willingness among consumers to experiment with
new models. Anti-competitive outcomes on account
of lock-ins are therefore not an immediate concern
for the industry. This however excludes the analysis
on phones being bundled with service packs, i.e.
collaborations between service providers and
phone manufacturers, and the overall impact on the
industry.
3.2.4 Price Trends
With rising household incomes, decline in average
price of smartphones, familiarity with functionality
of mobile devices, availability of superior features
and their application in our daily lives, the
willingness to own and pay for mobile phones has
also increased. According to our survey result, the
price bracket “Rs 10001 - 20000” has emerged as
the most popular among respondents across all
income categories (Refer Table 3.3). This reflects a
predominant demand for mid-range handsets
independent of monthly incomes. In the high
income category this preference can be attributed
to the need for frequent replacements of phones.

Competition Issues in India’s Mobile Handset Industry
29
Table 3.3: Number of Responses for Each Price Bracket across the Range of Monthly Incomes
Monthly Income Price bracket for purchasing a mobile phone
< 2500 2501 -
5000
5001 -
10000
10001 -
20000
20001 -
30000
30001 -
50000
> 50000 Blank
responses
< 30,000 4 4 16 78 14 4 2 0
30,000 -< 50,000 2 1 10 46 10 1 1 0
50,000 -< 1,00,000 0 0 5 22 11 6 2 0
1,00,000 -< 3,00,000 0 0 0 11 4 4 2 0
> 3,00,000 0 0 1 9 1 1 2 0
No income 2 0 12 45 22 18 8 0
Blank Response 2 1 17 127 10 6 0 0
The demand for mobile phones is also driven by the
increasing affordability of mobile services.
According to data from the World Bank, even
though 8 in 10 people own a mobile phone in the
developing world, the cost of using mobile phones
significantly varies.108
Excluding the cost of
handsets, the cost (adjusted for PPP) of using a
mobile phone in India is $2.80, which is however
higher than the cost in countries such as Sri Lanka
($0.97), Bangladesh ($1.42), Iran ($2.01), Pakistan
($2.12) and Nepal ($2.49).109
In rural India, mobile
phones are often the only source of accessing the
Internet. A study conducted by the NSSO for the
July 2014 - June 2015 period show that among
services, the expenditure of rural households is the
highest for mobile phones and communication
services, accounting for 25.33% of their total
spending, while that for urban households was
marginally higher at 26.33%.110
Almost three
quarters of present day urban Internet users use
only mobile phones for internet access as compared
to a mere 52% in 2014 and this growth is being
driven by falling smartphone prices, less expensive
data packages, and the availability of more mobile-
friendly content.111
The bundling of mobile handsets with telecom
services makes expenditure on mobile services a
determining factor in handset selection.112
For
example, Micromax’s Canvas 2 smartphone was
launched with a year-long offer of free 1GB data per
day and 600 minutes of calls from Airtel.113
In
contrast to developed markets114
, handsets in India
have been traditionally sold independent of tariff
plans.115
However, with structural shifts in the post-
Jio telecom industry, such bundling plans are being
symbiotically used by mobile phone manufacturers
and service providers to secure competitive
positions in the industry.
3.2.5 Trends in the Market for Second Hand
Phones
The durable goods literature is vast and rich. A
consumer durable such as a smartphone yields
utility over time so there will be a long period
between successive purchases. A 2014 study by the
Consumer Electronics Association found that
smartphones and feature phones had a life
expectancy of 4.7 years.116
However, more recent
estimates suggest that the average phone has a use
phase of less than two years.117
Several studies have
shown that second-hand market activity can
support and promote primary markets by making
existing products into “liquid assets” that
consumers can easily sell (Fox 1957).118
Although
suppliers do not directly gain from the sale of used
goods, studies show that the existence of a
secondary market increases consumers’ valuation of
a new good, which can then subsequently lead to
higher supplier profits.119
Our results establish that the replacement cycle is
becoming shorter; part of the reason could be a
vibrant market for second hand phones. Even
though the average selling price of smartphones
(mobile phones in general) has steadily declined,
the second-hand market for handsets continues to
thrive. Constant improvements in technology have
made upgrade cycles of smartphones shorter, and

30
thus fuelled demand for second hand
smartphones.120
Numerous trade-in and buy-back
programs across multiple channels and platforms
have also significantly contributed to the growth of
the market for used smartphones.121
The supply
side is fed by those who want to change their
phones frequently and experience the latest
upgradations in technology.122
According to IDC
estimates, the worldwide market for used and
refurbished smartphones is set to grow to 222.6
million units by 2020.123
The second hand market can be split into two
categories - the first is through local retailers and
the second is refurbished markets.124
In the former
market, used mobile phones are traded through
local retailers or online platforms, while in the
latter, phones are tested and repaired before being
resold. These come with a guarantee as well as a
price premium. 125
Our survey does not distinguish
between these two types of markets. Only 10%
respondents reported selling their phones in the
second hand market, while 14% reported trading or
exchanging their old phones for new ones.
Handset manufacturers also leverage the benefits
of the used-phones market through exchange
offers.
Figure 3.5: Usage of Old Mobile Phones
Growth of the used-goods business in India is
thriving with the help of e-commerce and with
websites and apps like OLX and Quikr dedicated to
this marketplace. There were almost 10 million
mobile phones and mobile accessories listed on OLX
in FY 2016-17 alone.126
There has also been a
growing realisation among consumers that there is
value attached to a used device that can be
extracted by reselling rather than keeping them as
idle assets at home. However, industry reports
show that 80% of the trade of pre-used mobile
phones is still offline through dealers, retailers and
shop-owners.
In our survey, 59 respondents, i.e. 10.85% of the
sample reported that they would buy a mobile
phone from the second hand market, while
approximately 51.5% respondents reported that
they would not buy mobile phones from the second
hand market. Of those willing to buy phones from
the second hand market, a majority of
approximately 35.6% were students. The average
scores assigned to the following features by those
willing to buy mobile phones from the second hand
market is given in Table 3.4 below. The highest
score has been assigned to “Better
Features/Functions than existing phone” closely
followed by “Age and Condition” and “Background
of phone seller”. The least score has been assigned
to “Price”, though not significantly lower than other
factors.
Lack of information about the quality of used goods
in second-hand markets drives down prices; this is
an instance of “adverse selection” (Akerlof 1970).127
The presence of this information asymmetry leads
Trade for a new
phone
14% Sell in the second hand
market for phones
10%
Give away to
family/charity
21%
Leave unused
15% Recycle
1%
Others
2%
No response
37%

Competition Issues in India’s Mobile Handset Industry
31
to a “lemons” problem where low-quality goods
drive out high quality goods in static markets128
.
Although, one might expect that the emergence of
Internet-based second hand marketplaces would
bridge the information asymmetry, in the form of
customer reviews and other crowd sourced
information, studies suggest that is not entirely the
case. Studies suggest that despite the presence of
signaling mechanisms like reputation feedback and
product condition disclosures, the information
asymmetry problem between buyers and sellers
persists in online markets.129
Table 3.4: Average Score for Features/ Factors of Second Hand Mobile Phones
Feature/Factors Average Score
Price 3.66
Brand 3.81
Better Features/Functions than existing phone 3.98
Age and Condition 3.93
Background of phone seller 3.83
A survey conducted by IMRB for OLX Consumer
Research on Used-Goods and Selling Trends (OLX
CRUST) shows that nearly 4 million pre-owned
mobile phones are sold online in India and 75% of
the pre-owned mobile phone buyers and 55% of
their sellers were young millennials aged between
19-29 years.130
This corroborates our findings where
the average age of those willing to buy phones from
the second hand market is 25 years. The average
price of each mobile phone sold on OLX was Rs.
9000 compared to the average selling price of new
smartphones in India which is Rs. 10,000.131
The
need to frequently replace smartphones and
experience technology upgradations also implies
that most second-hand phones are not necessarily
overused and that premium price phones are also
available in this market.132
Our survey findings show that approximately 49% of
those who were willing to buy phones from the
second hand market reported that they would buy
at a discount of 20-40%. There has been a steady
influx of Chinese brands in the secondary market as
well, with Xiaomi, Lenovo and OnePlus showing the
highest growth in the marketplace, while Apple
continues to enjoy aspirational value.133
This market
also attracts first time smartphone users as many
feature phone users who want to experience video,
data and content, can’t necessarily afford a high
budget purchase.134
3.3 Summing up Survey Findings
The survey findings reinforce the prevailing
understanding on the subject. However, since the
respondents mostly belong to the urban youth
category, we cannot extrapolate these results for all
sections of consumers; although it is valuable in
identifying some changing preferences in the
industry. Firstly, we find that handset choices are
driven largely by the technology support they offer
and features such as battery life and screen size
assume higher importance than price. Evidence
from the existing literature corroborates this
finding. A recurrent response has been the
willingness to pay a premium for improvements in
the preferred feature of the phone. While
familiarity with functions and improvements in
digital literacy may have generated quality-sensitive
demand, rapid changes in technology have also led
to shorter replacement cycles of mobile phones,
especially among those who can afford it.
While there is evidence that familiarity with the
operations and functioning of the existing phone
determines future choices of handset brands, a very
large percentage of respondents also report a
willingness to switch to other models and brands for
new experiences and features. This also explains the
increased product differentiation in the market.
Despite these new trends, there is a clear
preference for mid-range smartphones, regardless
of income levels. The other determinant of
affordability is the low costs of operating a mobile
phone, and with bundling of handsets and service

32
plans, these costs are likely to influence consumer
preferences for handsets.
With declining handset prices and the tremendous
uptake of mobile data, smartphones have become
the device for accessing the Internet, especially in
rural areas. Thus, in terms of usage, e-mail and
Internet browsing emerge as the most frequently
used features, apart from calls. The phenomenal
rise of apps and the easy access to myriad daily
services using a mobile device has rendered them
important considerations and increasingly
indispensable. As per our survey, social networking,
news and knowledge and navigation apps are also
frequently used, making mobile phones a multi-
utility device and consequently changing the factors
that drive its demand.
The breadth and depth of the used phones market
in India is likely to influence demand in the primary
market. Although most respondents reported that
their used phones were given away to
family/charity or were left unused, there is some
evidence of selling old phones in the second hand
market and trading/exchanging old phones for new
ones. Respondents, albeit a small percentage, have
also a willingness to buy from the second hand
market. The short replacement cycles are probably
driving the growth of second hand markets.
Moreover, with online market places we expect the
volumes to increase in the future.
The demand and use of mobile phones is
ubiquitous especially among the urban youth. The
general consumption patterns seem to be maturing
with users willing to pay a premium for preferred
features. The availability of online resources is
reducing information asymmetries in both primary
and secondary markets. The neutrality of platforms
that provide information, advertise and sell mobile
phones is important for the industry to maintain
competitive outcomes. The following concluding
section ties together our findings from both primary
and secondary data and offers policy
recommendations.

33
4. Conclusions and Policy Recommendations
Mobile phones in India have witnessed a
tremendous uptake. These pocket sized devices are
fast replacing computers to become the most
widely used means of Internet access, particularly in
emerging economies such as India. As innovations
continue to increase the application of technology
to daily life, its adoption is gradually becoming a
metric of human progress. The mobile industry
contributed 6.5% ($140 billion) to India’s GDP in
2015 and this is projected to increase to 8.2% by
2020.135
More than 120 manufacturing units have
created 450,000 jobs in the mobile phone industry
since 2014.136
The overall ecosystem for handsets
and services combined is rapidly evolving.
For an industry with low entry and exit barriers, the
entry of Chinese brands has transformed the
handset industry in India. With features like bigger
screens, improved user interface, local language
support, along with lower prices and enormous
marketing support; these brands have won over
Indian consumers.137
Samsung retained its position
of dominance for five years, weathering massive
disruptions in mobile phone form factors, consumer
purchase behaviour and challenge from several
competitors.138
With a 259% growth rate in 2017,
Xiaomi replaced Samsung as the market leader for
the last quarter of 2017.139
Chinese brands have
also shifted customer buying behaviour from offline
to online140
and continue to compete aggressively in
price segments that used to be dominated by local
Indian brands or global brands like Samsung.141
This
study tries to capture effects on competition for
India’s mobile handset industry and identify trends
that might impede its growth in the future. Our
analysis provides perspectives using secondary data
on sales of mobile phones and a primary survey of
consumers on buying behaviour for mobile phones.
From 2007, competition has steadily increased in
the mobile handset industry in India. New brands
flooded the Indian market leading to levels of hyper
competition. Since 2016, firms unable to sustain
such competition exited, leading to consolidation
and subsequent increase in market concentration
ratios. Moreover, the level of competition also
varies across different sub-markets. Our results
from secondary data analysis show that the market
for premium phones is relatively more
concentrated. While the low- and medium-priced
segments observe frequent entry and exit of
manufacturers there are relatively fewer
manufacturers in the premium segment. Findings
from our primary survey also find that demand for
mobile phones in India is predominantly driven by
the mid-range category, encouraging manufacturers
to focus on this segment. The Product Market
Differentiation (PMD) index estimates find that the
market for 4G phones are relatively less
heterogeneous in terms of number of differentiated
models, alternatively these submarkets are less
rivalrous than the homogenous markets for older
generation. The survey findings also report a
willingness to pay for improved features and user
experience. The possibility of innovations in 4G
handsets invites new entrants to this segment,
reportedly one with higher industrial churn,
compared to the relatively static 2G and 2.5G
markets, which most brands are now exiting. Based
on this analysis, we find evidence for continuous
innovations in horizontal features of mobile phones,
which based on literature, is a positive determinant
of competition in the market.
The mobile industry in India is rapidly evolving.
Taking advantage of the low entry and exit barriers,
the entry of Chinese brands transformed the
domestic handset industry. The mobile handset
industry displays healthy competition, with no
immediate concern about exercise of market power
by any one entity. At the same time a high
proportion of irrelevant firms exists that could
either grow to be competitive threats in the future
or just fall by the wayside. It is essential that policy
interventions allow for incentives to develop long
term innovation capabilities within the larger set of
manufacturers in the industry. Substantive value
addition as proposed under the National Electronics
Policy (NEP) 2019 will also limit cases of hit and run
entry, which are prominent within certain sub-
segments. Policies must be developed to support
research capabilities in newer technology
generations.

34
Competition analysis must be linked to other
changes in buying behaviour such as the choice of
online formats over brick and mortar stores. The
survey results also indicate an increasing trend
towards use of online resources for pre-purchase
research on mobile phones. While technology helps
disintermediate by minimizing the levels of
information asymmetry, the use of such platforms
must be built on principles of neutrality as they are
likely to influence demand patterns in the future.
Moreover, our survey results find that consumers
turn to the thriving secondary market for mobile
phones to meet their constant needs for upgraded
technology and user experiences at discounted
prices. India’s price sensitive market is now
maturing towards becoming technology sensitive.
The role of online platforms is only expected to
increase in times to come.
While the industry has seen much progress, both
technologically as well as behaviourally, a large part
of the population is still to benefit from the use of
mobile phones, especially in the light of the push
towards digital India. The government has increased
its focus on domestic manufacturing of mobile
phones, not only to address underpenetration of
technology but to limit its reliance on imported
technology and imported products.
To encourage domestic manufacturing of mobile
phones, India has now liberalised FDI norms and
under the revised policy, foreign investment in
manufacturing will be automatically approved and
companies will be able to sell products produced
through wholesale and retail routes, including e-
commerce, without requiring prior government
permission. Mobile handset manufacturing is a
focus area under the government’s Make in India
initiative. The government’s phased manufacturing
program (PMP) is also aimed to promote indigenous
manufacturing of cellular mobile handsets, its sub-
assemblies and parts/sub-parts to establish a robust
manufacturing ecosystem in India. The
government’s target under the Digital India
program is to have net zero imports of electronics
by 2020. As a step towards this, Budget 2018-19,
increased customs duties from 15% to 20% on
specific mobile parts. Import duties on chargers,
adapters, battery packs, microphones, wired
headsets, keypads, antenna, side-keys, and USB
cables, were increased from 7.5% or 10% to 15%.
Similarly, import duty on printed circuit boards
(PCBs) has also been levied at 10%. Some
manufacturers have forayed into the assembly of
PCBs and the target for 2019-20 is to begin
assembly of displays and touch glass. However, for
these objectives to be realised, significant
investments are required to develop the necessary
infrastructure that will support domestic
manufacturing of components and spare parts in
the future.
However, India’s experience with import
substitution policies that prevailed in the decades
before liberalisation was inimical to fostering
industrialization. On the other hand, Japan and
Korea have demonstrated that industrial policies
with sunset clauses can have pro industrialisation
impacts. It must be recognized that protectionist
measures are a double edged sword. For making
India a manufacturing hub for mobile handsets,
investments in R&D are necessary. Not more than a
handful of mobile technology patents have been
filed in India. Building design capacity will be an
important component of achieving self-reliance in
the mobile handset industry, along with other
horizontal reforms such as access to infrastructure
and ease of doing business.
Economies of scale and the presence of a mature
ecosystem, continue to enable the low cost of
production for mobile phones in China.142
Even
though several contract manufacturers from
Taiwan, Korea and China are looking at India, the
feasibility of manufacturing core components such
as chipsets remain distant.143
The government has
to undertake measures to develop adequate
infrastructure and policy incentives to progressively
transform India into a large scale manufacturing
ecosystem.144
In this respect Vietnam has stolen by
a march over India by offering lower tax rates,
comparable wage rates and lower overall costs of
doing business. The advantage of a large market
size that India has, and will continue to possess, is
often offset by these other disability costs including
the uncertainties of transacting business.
NITI Aayog has set up a committee on how to jump-
start India’s exports of mobile phones in particular
and electronics in general145
. The committee was

Competition Issues in India’s Mobile Handset Industry
35
created in the backdrop of the failure of India’s
phased-manufacturing-programme (PMP) for
mobiles. The objective is not to alienate foreign
manufacturers, but to build domestic capability that
will enable sustainable growth with the added
benefit of local job creation. The perennial debate
on industrial policy will arise –whether supporting a
specific sector is just or efficacious. Or should the
policy simply aim to lower the overall cost of doing
business and let the market choose the sectoral
focus. Also in this context, India must seriously
evaluate the need to host a semi-conductor
fabrication unit if the objective is to boost
electronics in general.
India’s potential lies in addressing the under-served
demand of nearly half a billion people, and the
constant need for up gradation from the other half.
Collaborative steps by the government and industry
can help build domestic capacity while maintaining
healthy levels of competition.


37
_______________________________________________________
Endnotes
1. http://www.telegraph.co.uk/news/worldnews/asia/india/7593567/India-has-more-mobile-phones-than-toilets-UN-report.html
2. In 2018-19, 88.9% of India’s population were estimated to have access to a household toilet
3. Statista https://www.statista.com/statistics/330695/number-of-smartphone-users-worldwide/ Accessed on 15
th March, 2019
4. http://techdash.in/wp-content/uploads/2017/08/CMR-India-Monthly-Mobile-Handset-Report-June-2017.pdf
5. Phablets are smart phones with screen sizes higher that 5 inches. Most smart phones today are phablets that offer a better
visual experience, among other benefits, to consumers. 6. Compiled from data on Gizbot https://www.gizbot.com/mobile-brands-in-india/ Accessed on 15
th March, 2019
7. https://economictimes.indiatimes.com/tech/hardware/with-over-100-handset-brands-in-a-15-billion-market-consolidation-is-
just-around-the-corner/articleshow/57782305.cms 8. “Maximising Local Value Addition in Mobile Phone Manufacturing: A Practical Phased Approach (2016) by IIM Bangalore and
Counterpoint Researchers 9. “Indian Mobile Phone Market: Emerging Opportunities for Fulfilling India’s Digital Economy Dream (2017) by IAMAI and ENIXTA
10. http://pib.nic.in/PressReleaseIframePage.aspx?PRID=1565285
11. Assa Doron and Robin Jeffrey, 2013, “The Great Indian Phonebook “, Harvard University Press
12. COAI Mobile Subscriber Report (December 2018)
13. https://economictimes.indiatimes.com/tech/hardware/indian-smartphone-market-expands-14-5-pc-in-2018-
idc/articleshow/67957147.cms. Accessed on 15th march, 2019 14.
https://www.pcworld.com/article/201465/article.html 15.
https://www.theverge.com/2016/9/30/13119924/blackberry-failure-success 16.
Authors’ calculation from IDC’s Quarterly Mobile Phone Tracker, 2018Q2 17.
https://www.idc.com/getdoc.jsp?containerId=prAP44856419 18.
Refer to Table 1 19.
Statista https://www.statista.com/statistics/467163/forecast-of-smartphone-users-in-india/ 20.
https://gadgets.ndtv.com/mobiles/features/how-indian-smartphone-makers-lost-the-war-against-chinese-companies-17471 21.
https://indianexpress.com/article/technology/mobile-tabs/indian-smartphone-market-saw-highest-ever-shipments-in-2018-
xiaomi-on-top-idc/ 22.
Op Cit, 11 23.
Counterpoint and IIM Bangalore (2016); IAMAI and Enixta (2017) 24.
http://businessworld.in/article/Is-India-The-New-Mobile-Manufacturing-Hub-/06-03-2017-113881/ 25.
https://gadgets.ndtv.com/mobiles/news/over-150-mobile-manufacturing-units-set-up-in-india-in-past-4-years-cmr-1994275 26.
Completely Knocked Down (CKD) originates from the automobile and automotives manufacturing industries. In this process,
the manufacturer completely disassembles a vehicle at the origin and reassembles it in another country (Source -
https://carbiketech.com/automotive-manufacturing-cbu-ckd-skd/) 27.
Semi Knocked Down (SKD) originates from the automobile and automotives manufacturing industries. In this process, a vehicle
is partially disassembled by the manufacturer at the origin and reassembled in another country. (Source -
https://carbiketech.com/automotive-manufacturing-cbu-ckd-skd/) 28.
Ibid 29.
Cecere, Corrocher and Battaglia, 2014, “Innovation and Competition in the smartphone industry: Is there a dominant design?”
Telecommunications Policy 30.
KPMG, 2015, “Remaining Competitive in the Technology Industry” 31.
The twelve price bands are < $25, $25 - $75, $75 - $100, $100 - $125, $125 - $150, $150 - $175, $175 - $200, $200 - $300, $300
- $400, $400 - $500, $500 - $700, > $700 32.
Refer to footnote 4 for a distinction between phablets and regular smartphones 33.
https://indianexpress.com/article/technology/tech-news-technology/budget-2017-mobile-phone-costs-will-go-up-in-india-pcb-
sad-tax-4502356/ 34.
Ibid 35.
IDC's Quarterly Mobile Phone Tracker, 2018Q2 Available at https://www.idc.com/tracker/showproductinfo.jsp?prod_id=103 36.
We refer to 2018Q2, as 2018, hereafter, in the report 37.
Please refer to footnote 34 for details on assumptions made for the analysis of competition 38.
Allardice and Erdevig, 1981, “Perspectives on Banking Concentration” Federal Bank of Chicago 39.
Williamson, “The Economic Institutions of Capitalism”,1985. 40.
Demsetz, “Barriers to Entry”, 1982. 41.
Joe Bain. Industrial Organization. New York: John Wiley & Sons, 1959 42.
Weiss, 1979“The Structure Conduct Performance Paradigm and Antritrust” University of Pennsylvania Vol 127:1104 43.
Op Cit 44.
Barthwal, 2007, “ Industrial Economics: An Introductory Text Book” 45.
Parida and Acharya, 2017, “Structural Change and Competition in the Indian Non-Life Insurance Industry: A Study in the Post-
reform Period”. Presented at the National Conference on Economics of Competition Law, Competition Commission of India
(CCI) 46.
Ibid

38
47. Adleman, 1969, “Comment on the H Concentration Measure as a Numbers-Equivalent”, The Review of Economics and
Statistics,Vol 51, No. 1 pp. 99-101 48.
Horowitz, 1971, “Numbers Equivalent in US Manufacturing Industries: 1954, 1958 and 1963” Southern Economic Journal pp
396-408 49.
Sheth and Sisodia, 2002 “Competitive Markets and the Rule of Three”, Ivey Business Journal 50.
TRAI Performance Indicators Report, March 2019 51.
Number of firms only includes the major players and excludes the “Other” category. It must be noted that even if the players
classified in the "Others" category were to be included in the analysis, the Numbers Equivalent would remain more or less
constant, as just like the HHI, it is not as sensitive to small players as it is to the major ones. However, if the actual number of
firms would increase, it would only inflate the Number of Irrelevant firms in the industry 52.
https://www.thehindu.com/business/indian-phones-pale-before-chinese-dragon/article26168903.ece 53.
https://www.livemint.com/Technology/KsUB8dksllxzBqcUCFfySJ/How-Chinese-mobile-phones-took-over-the-Indian-
market.html 54.
Si is used as standard notification for firm market share in other indices 55.
S1is used as the standard notification for the market share of the largest firm in the industry in other indices 56.
Op Cit 57.
Horvath, 1970, “Suggestion for a Comprehensive Measure of Concentration” Southern Economic Journal, 36 pp 446 - 452 58.
Ginevicius and Cirba (2009), “Additive Measurement of Market Concentration”, Journal of Business Economics and
Management, Vol 10, Issue 3, pp 191-198 59.
Chamberlin’s Theory of Monopolistic Competition (1933) 60.
https://www.91mobiles.com/hub/91mobiles-smartphone-buyer-insights-study-2019/ 61.
Bain, 1956, “Barriers to New Competition” Cambridge MA, Harvard University Press 62.
Wright 1978, Ferguson 1972a, Mueller 1969 63.
Milne, 1992, “A Marketing Approach for Measuring Product Market Differentiation and Concentration in Antitrust Cases”
Journal of Public Policy and Marketing, Vol 11, No. 2 pp 90 - 100 64.
Please refer to Appendix 4 for a distribution of models available by brands for different technology generations 65.
We use the same set of 7 price bands defined above in Section 2.2.2.1 66.
Hanner, Hosken, Olson and Smith, 2011, “Dynamics in a Mature Industry: Entry, Exit and Growth of Big-Box Grocery Retailers”,
US Federal Trade Commission 67.
Op Cit 68.
Firm Entry and Exit in New Zealand Industries, 2012, Ministry of Economic Development, New Zealand 69.
Prieger and Connolly (2013), “A Basic Analysis of Entry and Exit in the US Broadband Market, 2005-2008”, Pepperdine Digital
Commons, School of Public Policy Working Papers 70.
Siegfried and Evans (1994) 71.
A contestable market is one with zero entry and exit costs (Baumol 1982) 72.
Baumol, Panzar and Willig (1982) 73.
https://www.bcg.com/en-in/publications/2017/marketing-sales-globalization-new-indian-changing-consumer.aspx 74.
http://www.trai.gov.in/sites/default/files/PIR_July_Sept_28122017.pdf 75.
https://qz.com/945127/internet-use-in-india-proves-desktops-are-only-for-westerners/ 76.
Refer Appendix 7 for a copy of the questionnaire used for data collection. 77.
https://www.cnbc.com/2018/01/25/xiaomi-beats-samsung-to-be-indias-top-fourth-quarter-smartphone-seller.html 78.
Savitha Nair, Nivea Nelson N and Karthika R, 2016, “Consumer preference towards mobile phones: An empirical analysis”,
International Journal of Applied Research, Volume 2, Issue 12, pp. 343-347 79.
Ibid 80.
Op Cit 81.
https://economictimes.indiatimes.com/tech/hardware/how-chinas-handset-maker-xiaomi-came-first-in-
india/articleshow/61798368.cms 82.
Mesay Sata, 2013, “Factors Affecting Consumer Buying Behaviour of Mobile Phone Devices”, Mediterranean Journal of Social
Sciences, Volume 4, Issue 12, October 2013 83.
Op Cit 84.
Op Cit 85.
Op Cit 86.
Ibid 87.
Op Cit 88.
Henrieta Hrablik Chobanova et al, 2015, “Impact of Brand on Consumer Behaviour”, Procedia Economics and Finance, pp. 615-
621 89.
Peter W. Turnbull et al, 2000, “Customer Confusion: The Mobile Phone Market”, Journal of Marketing Management, Volume
16, pp. 143-163 90.
Op Cit 91.
Grazia Cecere et al, 2014, “Innovation and Competition in the Smartphone Industry: Is there a dominant design?”,
Telecommunications Policy 92.
Op Cit 93.
Op Cit 94.
Op Cit 95.
Please refer to Appendix 8 for tables on brand and feature preferences by demography 96.
http://edition.cnn.com/2010/TECH/mobile/10/12/app.for.that/index.html

Competition Issues in India’s Mobile Handset Industry
39
97. Matthias Bohmer et al, 2011, “Falling Asleep with Angry Birds, Facebook and Kindle - A Large Scale Study on Mobile Application
Usage”, In Proceedings of the 13th international conference on Human computer interaction with mobile devices and services,
pp. 47-56, ACM, August 2011 98.
Op Cit 99.
https://cambridgeservicealliance.eng.cam.ac.uk/resources/Downloads/Monthly%20Papers/2014
AugustPaperBusinesstoConsumerLockinEffect.pdf 100.
Joseph Farrell and Paul Klemperer, 2007, “Coordination and lock-in: Competition with switching costs and network effects”,
Handbook of Industrial Organisation, Volume 3, pp. 1967-2072 101.
Op Cit 102.
Op Cit 103.
Op Cit 104.
Ibid 105.
Op Cit 106.
Melissa A. Schilling, 1998, “Technology Lockout: An Integrative Model of the Economic and Strategic Factors Driving Technology
Success and Failure”, The Academy of Management Review, Volume 23, Issue 2, pp. 267-284, April 1998 107.
Ibid 108.
http://blogs.worldbank.org/opendata/where-are-cheapest-and-most-expensive-countries-own-mobile-phone? 109.
International Telecommunications Union; Op Cit 110.
https://www.indiatoday.in/mail-today/story/rural-india-technonology-mobile-phones-national-survey-328188-2016-07-09 111.
https://www.bcg.com/en-in/publications/2017/marketing-sales-globalization-new-indian-changing-consumer.aspx 112.
https://telecom.economictimes.indiatimes.com/news/handset-telco-bundling-the-next-big-thing-in-indias-telecom-
market/59490336 113.
Op Cit 114.
Sangheon Lee and Minsoo Park, 2016, “Bundling and Subsidy Competition in the Mobile Telecommunications Market: A
Welfare Analysis of Subsidy Regulation”, Korea and the World Economy, Volume 17, Issue 2, pp. 267-293, August 2016 115.
Ibid 116.
https://www.cta.tech/News/Blog/Articles/2014/September/The-Life-Expectancy-of-Electronics.aspx 117.
https://environment.yale.edu/news/article/when-it-comes-to-smartphone-lifespan-brand-name-matters-more-than-
hardware/ 118.
Valerie M. Thomas, 2003, “Demand and Dematerialization Impacts of Second-Hand Markets - Reuse or More Use?”, Journal of
Industrial Ecology, Volume 7, Issue 2 119.
Anindya Ghose, Rahul Telang and Ramayya Krishnan, 2005, “Effects of Electronic Secondary Markets on the Supply Chain”,
Journal of Management Information Systems, Volume 22, Issue 2, pp. 91-120 120.
http://indianexpress.com/article/technology/mobile-tabs/why-indias-second-hand-smartphone-market-still-offers-a-first-class-
bargain/ 121.
https://www.idc.com/getdoc.jsp?containerId=prUS41929916 122.
Ibid 123.
Op Cit 124.
Ibid 125.
Op Cit 126.
https://www.outlookindia.com/newsscroll/olx-mobile-phones-category-booming-steered-by-millennials/1059672 127.
Ibid 128.
Anindya Ghose, 2009, “Internet Exchanges for Used Goods: An Empirical Analysis of Trade Patterns and Adverse Selection”, MIS
Quarterly, Volume 33, Issue 2, pp. 263-291, June 2009 129.
Op Cit 130.
http://www.zeebiz.com/technology/news-indian-millennials-prefer-used-phones-over-new-survey-finds-16684 131.
Ibid 132.
Op Cit 133.
Ibid 134.
Op Cit 135.
The Mobile Economy, India 2016 report of global telecom industry body GSM 136.
https://economictimes.indiatimes.com/tech/hardware/smartphones-emerge-as-bright-spot-for-indian-
manufacturing/articleshow/66357164.cms 137.
https://qz.com/945127/internet-use-in-india-proves-desktops-are-only-for-westerners/ 138.
https://the-ken.com/story/inside-xiaomis-india-
comeback/?utm_source=daily_newsletter&utm_medium=email&utm_campaign=daily_story&utm_campaign=The%20Ken&ut
m_source=Email&utm_medium=Newsletter# 139.
Op Cit 140.
Op Cit 141.
Ibid 142.
http://businessworld.in/article/Is-India-The-New-Mobile-Manufacturing-Hub-/06-03-2017-113881/ 143.
https://www.businesstoday.in/technology/news/smartphones-still-not-made-in-india-key-parts-still-imported-from-
china/story/303704.html 144.
Ibid 145.
https://www.financialexpress.com/economy/kant-panel-aims-for-vietnam-like-model-for-mobile-phone-exports/1679103/


41
Bibliography
Andrew e. Burke and Aoife Hanley, 2009, “Market
concentration and business survival in static v
dynamic industries”, Kiel Working Paper No. 1517
Anindya Ghose, 2009, “Internet Exchanges for Used
Goods: An Empirical Analysis of Trade Patterns and
Adverse Selection”, MIS Quarterly, Volume 33, Issue
2, pp. 263-291, June 2009
Anindya Ghose, Rahul Telang and Ramayya
Krishnan, 2005, “Effects of Electronic Secondary
Markets on the Supply Chain”, Journal of
Management Information Systems, Volume 22,
Issue 2, pp. 91-120
Assa Doron and Robin Jeffery, 2013, “The Great
Indian Phonebook”, Harvard University Press
Daniel Hanner et al., 2011, “Dynamics in a Mature
Industry: Entry, Exit and Growth of Big-Box
Retailers”, Bureau of Economics, Federal Trade
Commission, Working Paper No. 308, September
2011
David R. Allardice and Eleanor Erdevig, 1981, “The
significance and measurement of concentration”,
Business and Financial Review, Economic
Perspective, Federal Bank of Chicago, pp. 3-5,
March/April 1981
Duncan Bailey and Stanley E. Boyle, 1971, “The
Optimal Measure of Concentration” Journal of the
American Statistical Association, Volume 66, Issue
336, pp. 702-06
Edward H. Chamberlin, 1933, “The theory of
monopolistic competition”
George R. Milne, 1992, “A marketing approach for
measuring product market differentiation and
concentration in antitrust cases”, Journal of Public
Policy & Marketing, pp. 90-100
Grazia Cecere, Nicoletta Corrocher and Ricardo
David Battaglia, 2015, “Innovation and Competition
in the Smartphone Industry: Is there a dominant
design?”, Telecommunications Policy, Volume 39,
Issue 3-4, pp. 162-175
Henrieta Hrablik Chobanova et al, 2015, “Impact of
Brand on Consumer Behaviour”, Procedia Economics
and Finance, pp. 615-621
IAMAI and Enixta Innovations, 2017, “Indian
Mobile Phone Market: emerging Opportunities for
fulfilling India’s digital economy dream”, A joint
report by IAMAI and Enixta Innovations
Ira Horowitz, 1971, “Numbers-equivalents in the US
Manufacturing Industries: 1954, 1958 and 1963”,
Southern Economic Journal, pp. 396-408
Janos Horvath, 1970, “Suggestion for a
comprehensive measure of concentration”,
Southern Economic Journal, pp. 446-452
Joe S. Bain, 1956, “Barriers to new competition”,
Cambridge, MA: Harvard University Press, Volume
3, p. 55
Joe S. Bain, 1959, “Industrial Organization”, New
York: John Wiley and Sons
Jorge L. Contreas and Rohini Lakshane, 2017,
“Patents and Mobile Devices in India: An Empirical
Survey”, Vanderbilt Journal of Transnational Law,
Volume 50, Issue 1, January 2017
Joseph Farrell and Paul Klemperer, 2007,
“Coordination and lock-in: Competition with
switching costs and network effects”, Handbook of
Industrial Organisation, Volume 3, pp. 1967-2072
KPMG, 2015, “Remaining Competitive in the
Technology Industry”
Leonard W. Weiss, 1979, “The Structure Conduct
Performance Paradigm and Antitrust” University of
Pennsylvania Law Review, Volume 127, Issue 4, pp.
1104-1140
Leslie Hannah and John Anderson Kay, 1977,
“Concentration in modern industry: Theory,
measurement and the UK Experience”, Macmillan
London

42
Markus Eurich and Michael Burtscher, 2014, “The
Business-to-Consumer Lock-in Effect”, Cambridge
Service Alliance, University of Cambridge, August
2014
Matthias Bohmer et al, 2011, “Falling Asleep with
Angry Birds, Facebook and Kindle - A Large Scale
Study on Mobile Application Usage”, In Proceedings
of the 13th international conference on Human
computer interaction with mobile devices and
services, pp. 47-56, ACM, August 2011
Melissa A. Schilling, 1998, “Technology Lockout: An
Integrative Model of the Economic and Strategic
Factors Driving Technology Success and Failure”,
The Academy of Management Review, Volume 23,
Issue 2, pp. 267-284, April 1998
Mesay Sata, 2013, “Factors Affecting Consumer
Buying Behaviour of Mobile Phone Devices”,
Mediterranean Journal of Social Sciences, Volume 4,
Issue 12, October 2013
Michelle Connolly and James E. Prieger, 2013, “A
basic analysis of entry and exit in the US broadband
market, 2005-2008”, Review of Network Economics,
Volume 12, Issue 3, pp. 229-270
Morris A. Adelman, 1969, “Comment on the “H”
concentration measure as a numbers-equivalent”,
The Review of economics and statistics, Volume 51,
Issue 1, pp. 99-101
Peter W. Turnbull et al, 2000, “Customer Confusion:
The Mobile Phone Market”, Journal of Marketing
Management, Volume 16, pp. 143-163
Pulak Mishra, Divesh Mohit and Parimal, 2011,
“Market Concentration in Indian Manufacturing
Sector: Measurement Issues”, Economic and
Political Weekly, Volume 46, Issue 49, 3 December,
2011
R.R. Barthwal, 2007, “Industrial Economics: an
introductory text book”, New Age International
Romualdas Ginevicius and Stasys Cirba, 2009,
“Additive measurement of market concentration”,
Journal of Business Economics and Management,
Volume 10, Issue 3, pp. 191-198
Sangheon Lee and Minsoo Park, 2016, “Bundling
and Subsidy Competition in the Mobile
Telecommunications Market: A Welfare Analysis of
Subsidy Regulation”, Korea and the World Economy,
Volume 17, Issue 2, pp. 267-293, August 2016
Savitha Nair, Nivea Nelson N and Karthika R, 2016,
“Consumer preference towards mobile phones: An
empirical analysis”, International Journal of Applied
Research, Volume 2, Issue 12, pp. 343-347
Tapas Kumar Parida and Debashis Acharya, 2017,
“Structural Change and Competition in the Indian
Non-Life Insurance Industry: A Study in the Post-
reform Period”, Presented at the National
Conference on Economics of Competition Law,
Competition Commission of India (CCI)
Tarun Pathak, Chirantan Chatterjee and Neil Shah,
“Maximizing Local Value Addition in Indian Mobile
Phone Manufacturing: A Practical Phased
Approach”, Indian Institute of Management,
Bangalore and Counterpoint Technology Market
Research, November 17, 2016
Tinh Doan et al., 2012, “Firm Entry and Exit in New
Zealand Industries”, Ministry of Economic
Development, New Zealand, June 2012
Valerie M. Thomas, 2003, “Demand and
Dematerialization Impacts of Second-Hand Markets
- Reuse or More Use?”, Journal of Industrial Ecology,
Volume 7, Issue 2
Other Data Sources
IDC’s Quarterly Mobile Phone Tracker 201

Com
petit
ion
Issue
s in
Indi
a’s M
obile
Han
dset
Indu
stry
Ap
pe
nd
ix
Ap
pe
nd
ix 1
Ta
ble
A1
.1:
Sa
msu
ng
Fe
atu
re M
ap
pin
g
Bra
nd
Y
ea
r P
rod
uct
De
tail
G
en
era
tio
n
Pri
ce
Ba
nd
Air
Inte
rfa
ce
Op
era
tin
g
Sy
ste
m
OS
Ve
rsio
n
Blu
eto
oth
D
ua
l
SIM
Sto
rag
e (
GB
)
Fo
rm
Fa
cto
r G
PS
In
pu
t M
eth
od
M
eg
ap
ixe
ls
Ba
nd
Pro
cess
or
Sp
ee
d
Ba
nd
RA
M
(GB
)
Scr
ee
n
Siz
e
Asp
ect
Ra
tio
Dis
pla
y
Ty
pe
Wa
terp
ro
ofi
ng
Du
al
Re
ar
Ca
me
ra
Fin
ge
rpri
nt
Re
ad
er
Sm
art
ph
on
e
Tie
r
Sa
msu
ng
2
00
8
Fe
atu
re
Ph
on
e
2.5
G
< $
25
CD
MA
20
00
1xR
TT
R
TO
S
N/A
N
o
N/A
0
B
ar
No
A
lph
an
um
eri
c N
o C
am
era
N
/A
N/A
N
/A
N/A
N
/A
N/A
N
/A
N/A
N
/A
Sa
msu
ng
2
01
8
Fe
atu
re
Ph
on
e
2G
<
$2
5
GS
M
RT
OS
N
/A
No
N
/A
0
Ba
r N
o
Alp
ha
nu
me
ric
No
Ca
me
ra
N/A
N
/A
N/A
N
/A
N/A
N
/A
N/A
N
/A
N/A
Fe
atu
re
Ph
on
e
2.5
G
< $
25
G
PR
S/
ED
GE
R
TO
S
N/A
Y
es
N/A
0
B
ar
No
A
lph
an
um
eri
c N
o C
am
era
N
/A
N/A
N
/A
N/A
N
/A
N/A
N
/A
N/A
N
/A
Fe
atu
re
Ph
on
e
2G
<
$2
5
GS
M
RT
OS
N
/A
No
N
/A
0
Ba
r N
o
Alp
ha
nu
me
ric
01
: V
GA
(<1
MP
) N
/A
N/A
N
/A
N/A
N
/A
N/A
N
/A
N/A
N
/A
Fe
atu
re
Ph
on
e
2G
<
$2
5
GS
M
RT
OS
N
/A
Ye
s N
/A
0
Ba
r N
o
Alp
ha
nu
me
ric
No
Ca
me
ra
N/A
N
/A
N/A
N
/A
N/A
N
/A
N/A
N
/A
N/A
Fe
atu
re
Ph
on
e
2G
<
$2
5
GS
M
RT
OS
N
/A
No
N
/A
0
Ba
r N
o
Alp
ha
nu
me
ric
No
Ca
me
ra
N/A
N
/A
N/A
N
/A
N/A
N
/A
N/A
N
/A
N/A
Fe
atu
re
Ph
on
e
2.5
G
< $
25
G
PR
S/
ED
GE
R
TO
S
N/A
Y
es
N/A
0
B
ar
No
A
lph
an
um
eri
c N
o C
am
era
N
/A
N/A
N
/A
N/A
N
/A
N/A
N
/A
N/A
N
/A
Fe
atu
re
Ph
on
e
2G
<
$2
5
GS
M
RT
OS
N
/A
No
N
/A
0
Ba
r N
o
Alp
ha
nu
me
ric
01
: V
GA
(<1
MP
) N
/A
N/A
N
/A
N/A
N
/A
N/A
N
/A
N/A
N
/A
Sa
msu
ng
2
00
8
Fe
atu
re
Ph
on
e
2.5
G
$2
5 -
$7
5
GP
RS
/ E
DG
E
RT
OS
N
/A
No
N
/A
0
Cla
msh
ell
N
o
Alp
ha
nu
me
ric
01
: V
GA
(<1
MP
) N
/A
N/A
N
/A
N/A
N
/A
N/A
N
/A
N/A
N
/A
Fe
atu
re
Ph
on
e
2.5
G
$2
5 -
$7
5
GP
RS
/ E
DG
E
RT
OS
N
/A
No
N
/A
0.6
B
ar
No
A
lph
an
um
eri
c N
o C
am
era
N
/A
N/A
N
/A
N/A
N
/A
N/A
N
/A
N/A
N
/A
Fe
atu
re
Ph
on
e
2.5
G
$2
5 -
$7
5
GP
RS
/ E
DG
E
RT
OS
N
/A
Ye
s N
/A
0.5
B
ar
No
A
lph
an
um
eri
c N
o C
am
era
N
/A
N/A
N
/A
N/A
N
/A
N/A
N
/A
N/A
N
/A
Fe
atu
re
Ph
on
e
2.5
G
$2
5 -
$7
5
GP
RS
/ E
DG
E
RT
OS
N
/A
Ye
s N
/A
0
Slid
er
No
A
lph
an
um
eri
c N
o C
am
era
N
/A
N/A
N
/A
N/A
N
/A
N/A
N
/A
N/A
N
/A
Fe
atu
re
Ph
on
e
2.5
G
$2
5 -
$7
5
GP
RS
/ E
DG
E
RT
OS
N
/A
No
N
/A
0.4
B
ar
No
A
lph
an
um
eri
c N
o C
am
era
N
/A
N/A
N
/A
N/A
N
/A
N/A
N
/A
N/A
N
/A
Fe
atu
re
Ph
on
e
2.5
G
$2
5 -
$7
5
GP
RS
/ E
DG
E
RT
OS
N
/A
No
N
/A
1.2
C
lam
she
ll
No
A
lph
an
um
eri
c N
o C
am
era
N
/A
N/A
N
/A
N/A
N
/A
N/A
N
/A
N/A
N
/A
Fe
atu
re
Ph
on
e
2.5
G
$2
5 -
$7
5
GP
RS
/ E
DG
E
RT
OS
N
/A
No
N
/A
0
Ba
r N
o
Alp
ha
nu
me
ric
No
Ca
me
ra
N/A
N
/A
N/A
N
/A
N/A
N
/A
N/A
N
/A
N/A
Fe
atu
re
Ph
on
e
2.5
G
$2
5 -
$7
5
GP
RS
/ E
DG
E
RT
OS
N
/A
No
N
/A
0
Ba
r N
o
Alp
ha
nu
me
ric
No
Ca
me
ra
N/A
N
/A
N/A
N
/A
N/A
N
/A
N/A
N
/A
N/A
Fe
atu
re
Ph
on
e
2.5
G
$2
5 -
$7
5
CD
MA
20
00
1xR
TT
R
TO
S
N/A
N
o
N/A
0
.1
Ba
r N
o
Alp
ha
nu
me
ric
No
Ca
me
ra
N/A
N
/A
N/A
N
/A
N/A
N
/A
N/A
N
/A
N/A

Bra
nd
Y
ea
r P
rod
uct
De
tail
G
en
era
tio
n
Pri
ce
Ba
nd
Air
Inte
rfa
ce
Op
era
tin
g
Sy
ste
m
OS
Ve
rsio
n
Blu
eto
oth
D
ua
l
SIM
Sto
rag
e (
GB
)
Fo
rm
Fa
cto
r G
PS
In
pu
t M
eth
od
M
eg
ap
ixe
ls
Ba
nd
Pro
cess
or
Sp
ee
d
Ba
nd
RA
M
(GB
)
Scr
ee
n
Siz
e
Asp
ect
Ra
tio
Dis
pla
y
Ty
pe
Wa
terp
ro
ofi
ng
Du
al
Re
ar
Ca
me
ra
Fin
ge
rpri
nt
Re
ad
er
Sm
art
ph
on
e
Tie
r
Fe
atu
re
Ph
on
e
2G
$2
5 -
$7
5
GS
M
RT
OS
N
/A
No
N
/A
1
Ba
r N
o
Alp
ha
nu
me
ric
No
Ca
me
ra
N/A
N
/A
N/A
N
/A
N/A
N
/A
N/A
N
/A
N/A
Fe
atu
re
Ph
on
e
2.5
G
$2
5 -
$7
5
GP
RS
/ E
DG
E
RT
OS
N
/A
Ye
s N
/A
0
Ba
r N
o
Alp
ha
nu
me
ric
01
: V
GA
(<1
MP
) N
/A
N/A
N
/A
N/A
N
/A
N/A
N
/A
N/A
N
/A
Fe
atu
re
Ph
on
e
2.5
G
$2
5 -
$7
5
GP
RS
/ E
DG
E
RT
OS
N
/A
No
N
/A
0
Ba
r N
o
Alp
ha
nu
me
ric
01
: V
GA
(<1
MP
) N
/A
N/A
N
/A
N/A
N
/A
N/A
N
/A
N/A
N
/A
Fe
atu
re
Ph
on
e
2.5
G
$2
5 -
$7
5
GP
RS
/ E
DG
E
RT
OS
N
/A
No
N
/A
0
Ba
r N
o
Alp
ha
nu
me
ric
No
Ca
me
ra
N/A
N
/A
N/A
N
/A
N/A
N
/A
N/A
N
/A
N/A
Fe
atu
re
Ph
on
e
2.5
G
$2
5 -
$7
5
GP
RS
/ E
DG
E
RT
OS
N
/A
Ye
s N
/A
0
Ba
r N
o
Alp
ha
nu
me
ric
02
:
1M
P<
2M
P
N/A
N
/A
N/A
N
/A
N/A
N
/A
N/A
N
/A
N/A
Fe
atu
re
Ph
on
e
2G
$2
5 -
$7
5
GS
M
RT
OS
N
/A
No
N
/A
1
Ba
r N
o
Alp
ha
nu
me
ric
No
Ca
me
ra
N/A
N
/A
N/A
N
/A
N/A
N
/A
N/A
N
/A
N/A
Fe
atu
re
Ph
on
e
2.5
G
$2
5 -
$7
5
CD
MA
20
00
1xR
TT
R
TO
S
N/A
N
o
N/A
1
B
ar
No
A
lph
an
um
eri
c N
o C
am
era
N
/A
N/A
N
/A
N/A
N
/A
N/A
N
/A
N/A
N
/A
Fe
atu
re
Ph
on
e
2.5
G
$2
5 -
$7
5
GP
RS
/ E
DG
E
RT
OS
N
/A
No
N
/A
0
Ba
r N
o
Alp
ha
nu
me
ric
No
Ca
me
ra
N/A
N
/A
N/A
N
/A
N/A
N
/A
N/A
N
/A
N/A
Fe
atu
re
Ph
on
e
2.5
G
$2
5 -
$7
5
GP
RS
/ E
DG
E
RT
OS
N
/A
No
N
/A
0.4
B
ar
No
A
lph
an
um
eri
c N
o C
am
era
N
/A
N/A
N
/A
N/A
N
/A
N/A
N
/A
N/A
N
/A
Fe
atu
re
Ph
on
e
2G
$2
5 -
$7
5
GS
M
RT
OS
N
/A
No
N
/A
0
Ba
r N
o
Alp
ha
nu
me
ric
No
Ca
me
ra
N/A
N
/A
N/A
N
/A
N/A
N
/A
N/A
N
/A
N/A
Fe
atu
re
Ph
on
e
2.5
G
$2
5 -
$7
5
GP
RS
/ E
DG
E
RT
OS
N
/A
Ye
s N
/A
0.5
B
ar
No
A
lph
an
um
eri
c N
o C
am
era
N
/A
N/A
N
/A
N/A
N
/A
N/A
N
/A
N/A
N
/A
Fe
atu
re
Ph
on
e
2.5
G
$2
5 -
$7
5
GP
RS
/ E
DG
E
RT
OS
N
/A
Ye
s N
/A
0
Slid
er
No
A
lph
an
um
eri
c N
o C
am
era
N
/A
N/A
N
/A
N/A
N
/A
N/A
N
/A
N/A
N
/A
Fe
atu
re
Ph
on
e
2.5
G
$2
5 -
$7
5
GP
RS
/ E
DG
E
RT
OS
N
/A
Ye
s N
/A
0
Ba
r N
o
Alp
ha
nu
me
ric
01
: V
GA
(<1
MP
) N
/A
N/A
N
/A
N/A
N
/A
N/A
N
/A
N/A
N
/A
Fe
atu
re
Ph
on
e
2.5
G
$2
5 -
$7
5
GP
RS
/ E
DG
E
RT
OS
N
/A
Ye
s N
/A
0
Slid
er
No
A
lph
an
um
eri
c
01
: V
GA
(<1
MP
) N
/A
N/A
N
/A
N/A
N
/A
N/A
N
/A
N/A
N
/A
Fe
atu
re
Ph
on
e
2.5
G
$2
5 -
$7
5
CD
MA
20
00
1xR
TT
R
TO
S
N/A
N
o
N/A
1
B
ar
No
A
lph
an
um
eri
c N
o C
am
era
N
/A
N/A
N
/A
N/A
N
/A
N/A
N
/A
N/A
N
/A
Fe
atu
re
Ph
on
e
2G
$2
5 -
$7
5
GS
M
RT
OS
N
/A
No
N
/A
0
Ba
r N
o
Alp
ha
nu
me
ric
No
Ca
me
ra
N/A
N
/A
N/A
N
/A
N/A
N
/A
N/A
N
/A
N/A
Fe
atu
re
Ph
on
e
2.5
G
$2
5 -
$7
5
GP
RS
/ E
DG
E
RT
OS
N
/A
No
N
/A
0.6
B
ar
No
A
lph
an
um
eri
c N
o C
am
era
N
/A
N/A
N
/A
N/A
N
/A
N/A
N
/A
N/A
N
/A
Fe
atu
re
Ph
on
e
2.5
G
$2
5 -
$7
5
GP
RS
/ E
DG
E
RT
OS
N
/A
No
N
/A
0
Ba
r N
o
Alp
ha
nu
me
ric
No
Ca
me
ra
N/A
N
/A
N/A
N
/A
N/A
N
/A
N/A
N
/A
N/A
Fe
atu
re
Ph
on
e
2.5
G
$2
5 -
$7
5
GP
RS
/ E
DG
E
RT
OS
N
/A
No
N
/A
1
Cla
msh
ell
N
o
Alp
ha
nu
me
ric
No
Ca
me
ra
N/A
N
/A
N/A
N
/A
N/A
N
/A
N/A
N
/A
N/A
Fe
atu
re
Ph
on
e
2.5
G
$2
5 -
$7
5
GP
RS
/ E
DG
E
RT
OS
N
/A
No
N
/A
0.6
B
ar
No
A
lph
an
um
eri
c N
o C
am
era
N
/A
N/A
N
/A
N/A
N
/A
N/A
N
/A
N/A
N
/A
Fe
atu
re
Ph
on
e
2.5
G
$2
5 -
$7
5
CD
MA
20
00
1xR
TT
R
TO
S
N/A
N
o
N/A
0
.1
Ba
r N
o
Alp
ha
nu
me
ric
No
Ca
me
ra
N/A
N
/A
N/A
N
/A
N/A
N
/A
N/A
N
/A
N/A
Fe
atu
re
Ph
on
e
2.5
G
$2
5 -
$7
5
GP
RS
/ E
DG
E
RT
OS
N
/A
No
N
/A
1.2
C
lam
she
ll
No
A
lph
an
um
eri
c N
o C
am
era
N
/A
N/A
N
/A
N/A
N
/A
N/A
N
/A
N/A
N
/A
Fe
atu
re
Ph
on
e
2.5
G
$2
5 -
$7
5
GP
RS
/ E
DG
E
RT
OS
N
/A
No
N
/A
0
Ba
r N
o
Alp
ha
nu
me
ric
01
: V
GA
(<1
MP
) N
/A
N/A
N
/A
N/A
N
/A
N/A
N
/A
N/A
N
/A
Fe
atu
re
Ph
on
e
2.5
G
$2
5 -
$7
5
GP
RS
/ E
DG
E
RT
OS
N
/A
No
N
/A
0
Cla
msh
ell
N
o
Alp
ha
nu
me
ric
No
Ca
me
ra
N/A
N
/A
N/A
N
/A
N/A
N
/A
N/A
N
/A
N/A

Com
petit
ion
Issue
s in
Indi
a’s M
obile
Han
dset
Indu
stry
Bra
nd
Y
ea
r P
rod
uct
De
tail
G
en
era
tio
n
Pri
ce
Ba
nd
Air
Inte
rfa
ce
Op
era
tin
g
Sy
ste
m
OS
Ve
rsio
n
Blu
eto
oth
D
ua
l
SIM
Sto
rag
e (
GB
)
Fo
rm
Fa
cto
r G
PS
In
pu
t M
eth
od
M
eg
ap
ixe
ls
Ba
nd
Pro
cess
or
Sp
ee
d
Ba
nd
RA
M
(GB
)
Scr
ee
n
Siz
e
Asp
ect
Ra
tio
Dis
pla
y
Ty
pe
Wa
terp
ro
ofi
ng
Du
al
Re
ar
Ca
me
ra
Fin
ge
rpri
nt
Re
ad
er
Sm
art
ph
on
e
Tie
r
Fe
atu
re
Ph
on
e
2.5
G
$2
5 -
$7
5
GP
RS
/ E
DG
E
RT
OS
N
/A
No
N
/A
0.6
B
ar
No
A
lph
an
um
eri
c N
o C
am
era
N
/A
N/A
N
/A
N/A
N
/A
N/A
N
/A
N/A
N
/A
Fe
atu
re
Ph
on
e
2.5
G
$2
5 -
$7
5
GP
RS
/ E
DG
E
RT
OS
N
/A
No
N
/A
0.6
B
ar
No
A
lph
an
um
eri
c N
o C
am
era
N
/A
N/A
N
/A
N/A
N
/A
N/A
N
/A
N/A
N
/A
Fe
atu
re
Ph
on
e
2.5
G
$2
5 -
$7
5
GP
RS
/ E
DG
E
RT
OS
N
/A
No
N
/A
0.6
B
ar
No
A
lph
an
um
eri
c N
o C
am
era
N
/A
N/A
N
/A
N/A
N
/A
N/A
N
/A
N/A
N
/A
Fe
atu
re
Ph
on
e
2.5
G
$2
5 -
$7
5
GP
RS
/ E
DG
E
RT
OS
N
/A
No
N
/A
0
Ba
r N
o
Alp
ha
nu
me
ric
No
Ca
me
ra
N/A
N
/A
N/A
N
/A
N/A
N
/A
N/A
N
/A
N/A
Fe
atu
re
Ph
on
e
2.5
G
$2
5 -
$7
5
GP
RS
/ E
DG
E
RT
OS
N
/A
No
N
/A
0
Ba
r N
o
Alp
ha
nu
me
ric
01
: V
GA
(<1
MP
) N
/A
N/A
N
/A
N/A
N
/A
N/A
N
/A
N/A
N
/A
Fe
atu
re
Ph
on
e
2.5
G
$2
5 -
$7
5
CD
MA
20
00
1xR
TT
R
TO
S
N/A
N
o
N/A
0
.1
Ba
r N
o
Alp
ha
nu
me
ric
No
Ca
me
ra
N/A
N
/A
N/A
N
/A
N/A
N
/A
N/A
N
/A
N/A
Fe
atu
re
Ph
on
e
2.5
G
$2
5 -
$7
5
GP
RS
/ E
DG
E
RT
OS
N
/A
No
N
/A
1.2
C
lam
she
ll
No
A
lph
an
um
eri
c N
o C
am
era
N
/A
N/A
N
/A
N/A
N
/A
N/A
N
/A
N/A
N
/A
Sa
msu
ng
2
01
8
Fe
atu
re
Ph
on
e
2.5
G
$2
5 -
$7
5
GP
RS
/ E
DG
E
RT
OS
N
/A
Ye
s N
/A
0
Ba
r N
o
Alp
ha
nu
me
ric
01
: V
GA
(<1
MP
) N
/A
N/A
N
/A
N/A
N
/A
N/A
N
/A
N/A
N
/A
Fe
atu
re
Ph
on
e
2.5
G
$2
5 -
$7
5
GP
RS
/ E
DG
E
RT
OS
N
/A
Ye
s N
/A
0
Ba
r N
o
Alp
ha
nu
me
ric
03
:
2M
P<
3M
P
N/A
N
/A
N/A
N
/A
N/A
N
/A
N/A
N
/A
N/A
Fe
atu
re
Ph
on
e
2.5
G
$2
5 -
$7
5
GP
RS
/ E
DG
E
RT
OS
N
/A
Ye
s N
/A
0
Ba
r N
o
Alp
ha
nu
me
ric
04
:
3M
P<
4M
P
N/A
N
/A
N/A
N
/A
N/A
N
/A
N/A
N
/A
N/A
Fe
atu
re
Ph
on
e
2.5
G
$2
5 -
$7
5
GP
RS
/ E
DG
E
RT
OS
N
/A
Ye
s N
/A
0
Ba
r N
o
Alp
ha
nu
me
ric
01
: V
GA
(<1
MP
) N
/A
N/A
N
/A
N/A
N
/A
N/A
N
/A
N/A
N
/A
Fe
atu
re
Ph
on
e
2.5
G
$2
5 -
$7
5
GP
RS
/ E
DG
E
RT
OS
N
/A
Ye
s N
/A
0
Ba
r N
o
Alp
ha
nu
me
ric
03
:
2M
P<
3M
P
N/A
N
/A
N/A
N
/A
N/A
N
/A
N/A
N
/A
N/A
Fe
atu
re
Ph
on
e
2.5
G
$2
5 -
$7
5
GP
RS
/ E
DG
E
RT
OS
N
/A
Ye
s N
/A
0
Ba
r N
o
Alp
ha
nu
me
ric
04
:
3M
P<
4M
P
N/A
N
/A
N/A
N
/A
N/A
N
/A
N/A
N
/A
N/A
Sa
msu
ng
2
00
8
Fe
atu
re
Ph
on
e
2.5
G
$7
5 -
$1
00
CD
MA
20
00
1xR
TT
R
TO
S
N/A
N
o
N/A
0
B
ar
No
A
lph
an
um
eri
c N
o C
am
era
N
/A
N/A
N
/A
N/A
N
/A
N/A
N
/A
N/A
N
/A
Fe
atu
re
Ph
on
e
2.5
G
$7
5 -
$1
00
G
PR
S/
ED
GE
R
TO
S
N/A
Y
es
N/A
0
S
lide
r N
o
Alp
ha
nu
me
ric
01
: V
GA
(<1
MP
) N
/A
N/A
N
/A
N/A
N
/A
N/A
N
/A
N/A
N
/A
Fe
atu
re
Ph
on
e
2.5
G
$7
5 -
$1
00
G
PR
S/
ED
GE
R
TO
S
N/A
Y
es
N/A
0
B
ar
No
A
lph
an
um
eri
c
02
:
1M
P<
2M
P
N/A
N
/A
N/A
N
/A
N/A
N
/A
N/A
N
/A
N/A
Fe
atu
re
Ph
on
e
2.5
G
$7
5 -
$1
00
G
PR
S/
ED
GE
R
TO
S
N/A
Y
es
N/A
0
S
lide
r N
o
Alp
ha
nu
me
ric
01
: V
GA
(<1
MP
) N
/A
N/A
N
/A
N/A
N
/A
N/A
N
/A
N/A
N
/A
Fe
atu
re
Ph
on
e
2.5
G
$7
5 -
$1
00
G
PR
S/
ED
GE
R
TO
S
N/A
N
o
N/A
0
C
lam
she
ll
No
A
lph
an
um
eri
c
01
: V
GA
(<1
MP
) N
/A
N/A
N
/A
N/A
N
/A
N/A
N
/A
N/A
N
/A
Fe
atu
re
Ph
on
e
2.5
G
$7
5 -
$1
00
G
PR
S/
ED
GE
R
TO
S
N/A
N
o
N/A
0
S
lide
r N
o
Alp
ha
nu
me
ric
01
: V
GA
(<1
MP
) N
/A
N/A
N
/A
N/A
N
/A
N/A
N
/A
N/A
N
/A
Fe
atu
re
Ph
on
e
2.5
G
$7
5 -
$1
00
G
PR
S/
ED
GE
R
TO
S
N/A
Y
es
N/A
0
B
ar
No
A
lph
an
um
eri
c
01
: V
GA
(<1
MP
) N
/A
N/A
N
/A
N/A
N
/A
N/A
N
/A
N/A
N
/A
Fe
atu
re
Ph
on
e
2.5
G
$7
5 -
$1
00
G
PR
S/
ED
GE
R
TO
S
N/A
N
o
N/A
0
C
lam
she
ll
No
A
lph
an
um
eri
c
01
: V
GA
(<1
MP
) N
/A
N/A
N
/A
N/A
N
/A
N/A
N
/A
N/A
N
/A
Fe
atu
re
Ph
on
e
2.5
G
$7
5 -
$1
00
G
PR
S/
ED
GE
R
TO
S
N/A
Y
es
N/A
0
S
lide
r N
o
Alp
ha
nu
me
ric
01
: V
GA
(<1
MP
) N
/A
N/A
N
/A
N/A
N
/A
N/A
N
/A
N/A
N
/A
Fe
atu
re
Ph
on
e
2.5
G
$7
5 -
$1
00
CD
MA
20
00
1xR
TT
R
TO
S
N/A
N
o
N/A
0
B
ar
No
A
lph
an
um
eri
c N
o C
am
era
N
/A
N/A
N
/A
N/A
N
/A
N/A
N
/A
N/A
N
/A
Sa
msu
ng
2
01
8
Re
gu
lar
Sm
art
ph
on
e
4G
$7
5 -
$1
00
TD
/FD
-LT
E
Ad
van
ced
A
nd
roid
An
dro
id
No
ug
at
Ye
s
Du
al
Sta
nd
by
8
F
ull
Scr
ee
n
Ye
s T
ou
chsc
ree
n
06
:
5M
P<
6M
P
03
:
1.2
GH
z<1
.41
4
.7
'16
: 9
O
LED
N
/A
No
N
o
Ult
ra L
ow
-
En
d

Bra
nd
Y
ea
r P
rod
uct
De
tail
G
en
era
tio
n
Pri
ce
Ba
nd
Air
Inte
rfa
ce
Op
era
tin
g
Sy
ste
m
OS
Ve
rsio
n
Blu
eto
oth
D
ua
l
SIM
Sto
rag
e (
GB
)
Fo
rm
Fa
cto
r G
PS
In
pu
t M
eth
od
M
eg
ap
ixe
ls
Ba
nd
Pro
cess
or
Sp
ee
d
Ba
nd
RA
M
(GB
)
Scr
ee
n
Siz
e
Asp
ect
Ra
tio
Dis
pla
y
Ty
pe
Wa
terp
ro
ofi
ng
Du
al
Re
ar
Ca
me
ra
Fin
ge
rpri
nt
Re
ad
er
Sm
art
ph
on
e
Tie
r
7.0
G
Hz
Re
gu
lar
Sm
art
ph
on
e
4G
$7
5 -
$1
00
TD
/FD
-LT
E
Ad
van
ced
A
nd
roid
An
dro
id
Ma
rsh
m
allo
w 6
.0
Ye
s
Du
al
Sta
nd
by
1
6
Fu
ll S
cre
en
Y
es
To
uch
scre
en
09
:
8M
P<
9M
P
03
:
1.2
GH
z<1
.4
GH
z 2
5
'1
6 :
9
LCD
N
/A
No
N
o
Ult
ra L
ow
-
En
d
Re
gu
lar
Sm
art
ph
on
e
4G
$7
5 -
$1
00
TD
/FD
-LT
E
Ad
van
ced
A
nd
roid
An
dro
id
Lolli
po
p
5.1
Y
es
Du
al
Sta
nd
by
8
F
ull
Scr
ee
n
Ye
s T
ou
chsc
ree
n
06
:
5M
P<
6M
P
03
:
1.2
GH
z<1
.4
GH
z 1
4
.3
'5 :
3
LCD
N
/A
No
N
o
Ult
ra L
ow
-
En
d
Re
gu
lar
Sm
art
ph
on
e
4G
$7
5 -
$1
00
T
D/F
D-L
TE
A
nd
roid
An
dro
id
Lolli
po
p
5.1
Y
es
Du
al
Sta
nd
by
8
F
ull
Scr
ee
n
Ye
s T
ou
chsc
ree
n
06
:
5M
P<
6M
P
03
:
1.2
GH
z<1
.4
GH
z 1
4
.7
'16
: 9
O
LED
N
/A
No
N
o
Ult
ra L
ow
-
En
d
Re
gu
lar
Sm
art
ph
on
e
4G
$7
5 -
$1
00
TD
/FD
-LT
E
Ad
van
ced
A
nd
roid
An
dro
id
No
ug
at
7.0
Y
es
Du
al
Sta
nd
by
8
F
ull
Scr
ee
n
Ye
s T
ou
chsc
ree
n
06
:
5M
P<
6M
P
03
:
1.2
GH
z<1
.4
GH
z 1
4
.7
'16
: 9
O
LED
N
/A
No
N
o
Ult
ra L
ow
-
En
d
Sa
msu
ng
2
00
8
Fe
atu
re
Ph
on
e
2.5
G
$1
00
-
$1
25
G
PR
S/
ED
GE
R
TO
S
N/A
Y
es
N/A
0
S
lide
r N
o
Alp
ha
nu
me
ric
02
:
1M
P<
2M
P
N/A
N
/A
N/A
N
/A
N/A
N
/A
N/A
N
/A
N/A
Fe
atu
re
Ph
on
e
2.5
G
$1
00
-
$1
25
G
PR
S/
ED
GE
R
TO
S
N/A
Y
es
N/A
0
S
lide
r N
o
Alp
ha
nu
me
ric
01
: V
GA
(<1
MP
) N
/A
N/A
N
/A
N/A
N
/A
N/A
N
/A
N/A
N
/A
Fe
atu
re
Ph
on
e
2.5
G
$1
00
-
$1
25
G
PR
S/
ED
GE
R
TO
S
N/A
Y
es
N/A
0
B
ar
No
A
lph
an
um
eri
c
02
:
1M
P<
2M
P
N/A
N
/A
N/A
N
/A
N/A
N
/A
N/A
N
/A
N/A
Fe
atu
re
Ph
on
e
2.5
G
$1
00
-
$1
25
G
PR
S/
ED
GE
R
TO
S
N/A
Y
es
N/A
0
B
ar
No
A
lph
an
um
eri
c
03
:
2M
P<
3M
P
N/A
N
/A
N/A
N
/A
N/A
N
/A
N/A
N
/A
N/A
Fe
atu
re
Ph
on
e
2.5
G
$1
00
-
$1
25
CD
MA
20
00
1xR
TT
R
TO
S
N/A
N
o
N/A
0
B
ar
No
A
lph
an
um
eri
c
02
:
1M
P<
2M
P
N/A
N
/A
N/A
N
/A
N/A
N
/A
N/A
N
/A
N/A
Fe
atu
re
Ph
on
e
2.5
G
$1
00
-
$1
25
G
PR
S/
ED
GE
R
TO
S
N/A
Y
es
N/A
0
.1
Ba
r N
o
Alp
ha
nu
me
ric
03
:
2M
P<
3M
P
N/A
N
/A
N/A
N
/A
N/A
N
/A
N/A
N
/A
N/A
Fe
atu
re
Ph
on
e
2.5
G
$1
00
-
$1
25
G
PR
S/
ED
GE
R
TO
S
N/A
Y
es
N/A
0
S
lide
r N
o
Alp
ha
nu
me
ric
02
:
1M
P<
2M
P
N/A
N
/A
N/A
N
/A
N/A
N
/A
N/A
N
/A
N/A
Fe
atu
re
Ph
on
e
2.5
G
$1
00
-
$1
25
G
PR
S/
ED
GE
R
TO
S
N/A
Y
es
N/A
0
S
lide
r N
o
Alp
ha
nu
me
ric
01
: V
GA
(<1
MP
) N
/A
N/A
N
/A
N/A
N
/A
N/A
N
/A
N/A
N
/A
Fe
atu
re
Ph
on
e
2.5
G
$1
00
-
$1
25
CD
MA
20
00
1xR
TT
R
TO
S
N/A
N
o
N/A
0
B
ar
No
A
lph
an
um
eri
c N
o C
am
era
N
/A
N/A
N
/A
N/A
N
/A
N/A
N
/A
N/A
N
/A
Fe
atu
re
Ph
on
e
2.5
G
$1
00
-
$1
25
G
PR
S/
ED
GE
R
TO
S
N/A
Y
es
N/A
0
B
ar
No
A
lph
an
um
eri
c
02
:
1M
P<
2M
P
N/A
N
/A
N/A
N
/A
N/A
N
/A
N/A
N
/A
N/A
Fe
atu
re
Ph
on
e
2.5
G
$1
00
-
$1
25
G
PR
S/
ED
GE
R
TO
S
N/A
Y
es
N/A
0
S
lide
r N
o
Alp
ha
nu
me
ric
01
: V
GA
(<1
MP
) N
/A
N/A
N
/A
N/A
N
/A
N/A
N
/A
N/A
N
/A
Sa
msu
ng
2
01
8
Re
gu
lar
Sm
art
ph
on
e
4G
$1
00
-
$1
25
TD
/FD
-LT
E
Ad
van
ced
A
nd
roid
An
dro
id
No
ug
at
7.1
Y
es
Du
al
Sta
nd
by
1
6
Fu
ll S
cre
en
Y
es
To
uch
scre
en
09
:
8M
P<
9M
P
04
:
1.4
GH
z<1
.6
GH
z 2
5
'1
6 :
9
OLE
D
N/A
N
o
No
Lo
w-E
nd
Re
gu
lar
Sm
art
ph
on
e
4G
$1
00
-
$1
25
TD
/FD
-LT
E
Ad
van
ced
A
nd
roid
An
dro
id
Ma
rsh
m
allo
w 6
.0
Ye
s
Du
al
Sta
nd
by
8
F
ull
Scr
ee
n
Ye
s T
ou
chsc
ree
n
09
:
8M
P<
9M
P
04
:
1.4
GH
z<1
.6
GH
z 1
.5
5
'16
: 9
LC
D
N/A
N
o
No
Lo
w-E
nd
Re
gu
lar
Sm
art
ph
on
e
4G
$1
00
-
$1
25
T
D/F
D-L
TE
A
nd
roid
An
dro
id
Ma
rsh
m
allo
w 6
.0
Ye
s
Du
al
Sta
nd
by
1
6
Fu
ll S
cre
en
Y
es
To
uch
scre
en
09
:
8M
P<
9M
P
04
:
1.4
GH
z<1
.6
GH
z 2
5
'1
6 :
9
OLE
D
N/A
N
o
No
Lo
w-E
nd
Re
gu
lar
Sm
art
ph
on
e
4G
$1
00
-
$1
25
TD
/FD
-LT
E
Ad
van
ced
A
nd
roid
An
dro
id
Lolli
po
p
5.1
Y
es
Du
al
Sta
nd
by
8
F
ull
Scr
ee
n
Ye
s T
ou
chsc
ree
n
09
:
8M
P<
9M
P
04
:
1.4
GH
z<1
.6
GH
z 1
.5
5
'16
: 9
O
LED
N
/A
No
N
o
Low
-En
d

Com
petit
ion
Issue
s in
Indi
a’s M
obile
Han
dset
Indu
stry
Bra
nd
Y
ea
r P
rod
uct
De
tail
G
en
era
tio
n
Pri
ce
Ba
nd
Air
Inte
rfa
ce
Op
era
tin
g
Sy
ste
m
OS
Ve
rsio
n
Blu
eto
oth
D
ua
l
SIM
Sto
rag
e (
GB
)
Fo
rm
Fa
cto
r G
PS
In
pu
t M
eth
od
M
eg
ap
ixe
ls
Ba
nd
Pro
cess
or
Sp
ee
d
Ba
nd
RA
M
(GB
)
Scr
ee
n
Siz
e
Asp
ect
Ra
tio
Dis
pla
y
Ty
pe
Wa
terp
ro
ofi
ng
Du
al
Re
ar
Ca
me
ra
Fin
ge
rpri
nt
Re
ad
er
Sm
art
ph
on
e
Tie
r
Ph
ab
let
4G
$1
00
-
$1
25
TD
/FD
-LT
E
Ad
van
ced
A
nd
roid
An
dro
id
Ma
rsh
m
allo
w 6
.0
Ye
s
Du
al
Sta
nd
by
1
6
Fu
ll S
cre
en
Y
es
To
uch
scre
en
14
:
13
MP
<1
4M
P
03
:
1.2
GH
z<1
.4
GH
z 2
5
.5
'16
: 9
LC
D
N/A
N
o
No
Lo
w-E
nd
Re
gu
lar
Sm
art
ph
on
e
4G
$1
00
-
$1
25
TD
/FD
-LT
E
Ad
van
ced
A
nd
roid
An
dro
id
Ma
rsh
m
allo
w 6
.0
Ye
s
Du
al
Sta
nd
by
8
F
ull
Scr
ee
n
Ye
s T
ou
chsc
ree
n
09
:
8M
P<
9M
P
04
:
1.4
GH
z<1
.6
GH
z 1
.5
5
'16
: 9
LC
D
N/A
N
o
No
Lo
w-E
nd
Re
gu
lar
Sm
art
ph
on
e
4G
$1
00
-
$1
25
T
D/F
D-L
TE
A
nd
roid
An
dro
id
Ma
rsh
m
allo
w 6
.0
Ye
s
Du
al
Sta
nd
by
1
6
Fu
ll S
cre
en
Y
es
To
uch
scre
en
09
:
8M
P<
9M
P
04
:
1.4
GH
z<1
.6
GH
z 2
5
'1
6 :
9
OLE
D
N/A
N
o
No
Lo
w-E
nd
Re
gu
lar
Sm
art
ph
on
e
4G
$1
00
-
$1
25
TD
/FD
-LT
E
Ad
van
ced
A
nd
roid
An
dro
id
Lolli
po
p
5.1
Y
es
Du
al
Sta
nd
by
8
F
ull
Scr
ee
n
Ye
s T
ou
chsc
ree
n
09
:
8M
P<
9M
P
04
:
1.4
GH
z<1
.6
GH
z 1
.5
5
'16
: 9
O
LED
N
/A
No
N
o
Low
-En
d
Re
gu
lar
Sm
art
ph
on
e
4G
$1
00
-
$1
25
TD
/FD
-LT
E
Ad
van
ced
A
nd
roid
An
dro
id
Ma
rsh
m
allo
w 6
.0
Ye
s
Du
al
Sta
nd
by
1
6
Fu
ll S
cre
en
Y
es
To
uch
scre
en
09
:
8M
P<
9M
P
03
:
1.2
GH
z<1
.4
GH
z 2
5
'1
6 :
9
LCD
N
/A
No
N
o
Low
-En
d
Ph
ab
let
4G
$1
00
-
$1
25
TD
/FD
-LT
E
Ad
van
ced
A
nd
roid
An
dro
id
Ma
rsh
m
allo
w 6
.0
Ye
s
Du
al
Sta
nd
by
1
6
Fu
ll S
cre
en
Y
es
To
uch
scre
en
14
:
13
MP
<1
4M
P
03
:
1.2
GH
z<1
.4
GH
z 2
5
.5
'16
: 9
LC
D
N/A
N
o
No
Lo
w-E
nd
Sa
msu
ng
2
00
8
Fe
atu
re
Ph
on
e
2.5
G
$1
25
-
$1
50
G
PR
S/
ED
GE
R
TO
S
N/A
Y
es
N/A
0
B
ar
No
A
lph
an
um
eri
c
03
:
2M
P<
3M
P
N/A
N
/A
N/A
N
/A
N/A
N
/A
N/A
N
/A
N/A
Fe
atu
re
Ph
on
e
2.5
G
$1
25
-
$1
50
CD
MA
20
00
1xR
TT
R
TO
S
N/A
Y
es
N/A
0
S
lide
r N
o
Alp
ha
nu
me
ric
02
:
1M
P<
2M
P
N/A
N
/A
N/A
N
/A
N/A
N
/A
N/A
N
/A
N/A
Fe
atu
re
Ph
on
e
2.5
G
$1
25
-
$1
50
G
PR
S/
ED
GE
R
TO
S
N/A
Y
es
N/A
0
S
lide
r N
o
Alp
ha
nu
me
ric
02
:
1M
P<
2M
P
N/A
N
/A
N/A
N
/A
N/A
N
/A
N/A
N
/A
N/A
Fe
atu
re
Ph
on
e
3G
$1
25
-
$1
50
WC
DM
A/
HS
PA
R
TO
S
N/A
Y
es
N/A
0
S
lide
r N
o
Alp
ha
nu
me
ric
03
:
2M
P<
3M
P
N/A
N
/A
N/A
N
/A
N/A
N
/A
N/A
N
/A
N/A
Fe
atu
re
Ph
on
e
2.5
G
$1
25
-
$1
50
CD
MA
20
00
1xR
TT
R
TO
S
N/A
Y
es
N/A
0
S
lide
r N
o
Alp
ha
nu
me
ric
02
:
1M
P<
2M
P
N/A
N
/A
N/A
N
/A
N/A
N
/A
N/A
N
/A
N/A
Fe
atu
re
Ph
on
e
3G
$1
25
-
$1
50
WC
DM
A/
HS
PA
R
TO
S
N/A
Y
es
N/A
0
B
ar
No
A
lph
an
um
eri
c
03
:
2M
P<
3M
P
N/A
N
/A
N/A
N
/A
N/A
N
/A
N/A
N
/A
N/A
Fe
atu
re
Ph
on
e
2.5
G
$1
25
-
$1
50
G
PR
S/
ED
GE
R
TO
S
N/A
Y
es
N/A
0
C
lam
she
ll
No
A
lph
an
um
eri
c
02
:
1M
P<
2M
P
N/A
N
/A
N/A
N
/A
N/A
N
/A
N/A
N
/A
N/A
Fe
atu
re
Ph
on
e
2.5
G
$1
25
-
$1
50
G
PR
S/
ED
GE
R
TO
S
N/A
Y
es
N/A
0
S
lide
r N
o
Alp
ha
nu
me
ric
02
:
1M
P<
2M
P
N/A
N
/A
N/A
N
/A
N/A
N
/A
N/A
N
/A
N/A
Fe
atu
re
Ph
on
e
2.5
G
$1
25
-
$1
50
G
PR
S/
ED
GE
R
TO
S
N/A
Y
es
N/A
0
B
ar
No
A
lph
an
um
eri
c
03
:
2M
P<
3M
P
N/A
N
/A
N/A
N
/A
N/A
N
/A
N/A
N
/A
N/A
Fe
atu
re
Ph
on
e
2.5
G
$1
25
-
$1
50
G
PR
S/
ED
GE
R
TO
S
N/A
Y
es
N/A
0
B
ar
No
A
lph
an
um
eri
c
03
:
2M
P<
3M
P
N/A
N
/A
N/A
N
/A
N/A
N
/A
N/A
N
/A
N/A
Fe
atu
re
Ph
on
e
2.5
G
$1
25
-
$1
50
G
PR
S/
ED
GE
R
TO
S
N/A
Y
es
N/A
0
S
lide
r N
o
Alp
ha
nu
me
ric
02
:
1M
P<
2M
P
N/A
N
/A
N/A
N
/A
N/A
N
/A
N/A
N
/A
N/A
Sa
msu
ng
2
01
8
Ph
ab
let
4G
$1
25
-
$1
50
TD
/FD
-LT
E
Ad
van
ced
A
nd
roid
An
dro
id
Ore
o 8
.0
Ye
s
Du
al
Sta
nd
by
1
6
Fu
ll S
cre
en
Y
es
To
uch
scre
en
14
:
13
MP
<1
4M
P
04
:
1.4
GH
z<1
.6
GH
z 2
5
.5
'16
: 9
O
LED
N
/A
No
N
o
Low
-En
d
Ph
ab
let
4G
$1
25
-
$1
50
TD
/FD
-LT
E
Ad
van
ced
A
nd
roid
An
dro
id
No
ug
at
7.0
Y
es
Du
al
Sta
nd
by
1
6
Fu
ll S
cre
en
Y
es
To
uch
scre
en
14
:
13
MP
<1
4M
P
05
:
1.6
GH
z<1
.8
GH
z 2
5
.5
'16
: 9
O
LED
N
/A
No
N
o
Low
-En
d
Ph
ab
let
4G
$1
25
-
$1
50
T
D/F
D-L
TE
A
nd
roid
An
dro
id
Ma
rsh
mY
es
Du
al
Sta
nd
by
1
6
Fu
ll S
cre
en
Y
es
To
uch
scre
en
14
:
13
MP
<1
4M
P
05
:
1.6
GH
z<1
.83
5
.5
'16
: 9
LC
D
N/A
N
o
Ye
s Lo
w-E
nd

Bra
nd
Y
ea
r P
rod
uct
De
tail
G
en
era
tio
n
Pri
ce
Ba
nd
Air
Inte
rfa
ce
Op
era
tin
g
Sy
ste
m
OS
Ve
rsio
n
Blu
eto
oth
D
ua
l
SIM
Sto
rag
e (
GB
)
Fo
rm
Fa
cto
r G
PS
In
pu
t M
eth
od
M
eg
ap
ixe
ls
Ba
nd
Pro
cess
or
Sp
ee
d
Ba
nd
RA
M
(GB
)
Scr
ee
n
Siz
e
Asp
ect
Ra
tio
Dis
pla
y
Ty
pe
Wa
terp
ro
ofi
ng
Du
al
Re
ar
Ca
me
ra
Fin
ge
rpri
nt
Re
ad
er
Sm
art
ph
on
e
Tie
r
allo
w 6
.0
GH
z
Ph
ab
let
4G
$1
25
-
$1
50
T
D/F
D-L
TE
A
nd
roid
An
dro
id
No
ug
at
7.1
Y
es
Du
al
Sta
nd
by
3
2
Fu
ll S
cre
en
Y
es
To
uch
scre
en
14
:
13
MP
<1
4M
P
05
:
1.6
GH
z<1
.8
GH
z 3
5
.5
'16
: 9
LC
D
N/A
N
o
Ye
s Lo
w-E
nd
Re
gu
lar
Sm
art
ph
on
e
4G
$1
25
-
$1
50
TD
/FD
-LT
E
Ad
van
ced
A
nd
roid
An
dro
id
Ma
rsh
m
allo
w 6
.0
Ye
s
Du
al
Sta
nd
by
1
6
Fu
ll S
cre
en
Y
es
To
uch
scre
en
14
:
13
MP
<1
4M
P
03
:
1.2
GH
z<1
.4
GH
z 2
5
.2
'16
: 9
O
LED
N
/A
No
N
o
Low
-En
d
Ph
ab
let
4G
$1
25
-
$1
50
TD
/FD
-LT
E
Ad
van
ced
A
nd
roid
An
dro
id
Ma
rsh
m
allo
w 6
.0
Ye
s
Du
al
Sta
nd
by
1
6
Fu
ll S
cre
en
Y
es
To
uch
scre
en
14
:
13
MP
<1
4M
P
05
:
1.6
GH
z<1
.8
GH
z 2
5
.5
'16
: 9
O
LED
N
/A
No
N
o
Low
-En
d
Ph
ab
let
4G
$1
25
-
$1
50
TD
/FD
-LT
E
Ad
van
ced
A
nd
roid
An
dro
id
No
ug
at
7.0
Y
es
Du
al
Sta
nd
by
1
6
Fu
ll S
cre
en
Y
es
To
uch
scre
en
14
:
13
MP
<1
4M
P
05
:
1.6
GH
z<1
.8
GH
z 2
5
.5
'16
: 9
O
LED
N
/A
No
N
o
Low
-En
d
Sa
msu
ng
2
00
8
Fe
atu
re
Ph
on
e
2.5
G
$1
50
-
$1
75
G
PR
S/
ED
GE
R
TO
S
N/A
Y
es
N/A
0
.1
Slid
er
No
A
lph
an
um
eri
c
03
:
2M
P<
3M
P
N/A
N
/A
N/A
N
/A
N/A
N
/A
N/A
N
/A
N/A
Fe
atu
re
Ph
on
e
2.5
G
$1
50
-
$1
75
CD
MA
20
00
1xR
TT
R
TO
S
N/A
Y
es
N/A
0
S
lide
r N
o
Alp
ha
nu
me
ric
02
:
1M
P<
2M
P
N/A
N
/A
N/A
N
/A
N/A
N
/A
N/A
N
/A
N/A
Fe
atu
re
Ph
on
e
2.5
G
$1
50
-
$1
75
CD
MA
20
00
1xR
TT
R
TO
S
N/A
Y
es
N/A
0
S
lide
r N
o
Alp
ha
nu
me
ric
02
:
1M
P<
2M
P
N/A
N
/A
N/A
N
/A
N/A
N
/A
N/A
N
/A
N/A
Sa
msu
ng
2
01
8
Ph
ab
let
4G
$1
50
-
$1
75
TD
/FD
-LT
E
Ad
van
ced
A
nd
roid
An
dro
id
Ore
o 8
.0
Ye
s
Du
al
Sta
nd
by
3
2
Fu
ll S
cre
en
Y
es
To
uch
scre
en
14
:
13
MP
<1
4M
P
04
:
1.4
GH
z<1
.6
GH
z 3
5
.5
'16
: 9
O
LED
N
/A
No
N
o
Low
-En
d
Re
gu
lar
Sm
art
ph
on
e
4G
$1
50
-
$1
75
TD
/FD
-LT
E
Ad
van
ced
A
nd
roid
An
dro
id
Ma
rsh
m
allo
w 6
.0
Ye
s
Du
al
Sta
nd
by
3
2
Fu
ll S
cre
en
Y
es
To
uch
scre
en
14
:
13
MP
<1
4M
P
04
:
1.4
GH
z<1
.6
GH
z 3
5
'1
6 :
9
LCD
N
/A
No
Y
es
Low
-En
d
Ph
ab
let
4G
$1
50
-
$1
75
TD
/FD
-LT
E
Ad
van
ced
A
nd
roid
An
dro
id
No
ug
at
7.0
Y
es
Du
al
Sta
nd
by
3
2
Fu
ll S
cre
en
Y
es
To
uch
scre
en
14
:
13
MP
<1
4M
P
05
:
1.6
GH
z<1
.8
GH
z 3
5
.5
'16
: 9
O
LED
N
/A
No
N
o
Low
-En
d
Ph
ab
let
4G
$1
50
-
$1
75
T
D/F
D-L
TE
A
nd
roid
An
dro
id
No
ug
at
7.1
Y
es
Du
al
Sta
nd
by
6
4
Fu
ll S
cre
en
Y
es
To
uch
scre
en
14
:
13
MP
<1
4M
P
05
:
1.6
GH
z<1
.8
GH
z 4
5
.5
'16
: 9
LC
D
N/A
N
o
Ye
s Lo
w-E
nd
Re
gu
lar
Sm
art
ph
on
e
4G
$1
50
-
$1
75
TD
/FD
-LT
E
Ad
van
ced
A
nd
roid
An
dro
id
Ma
rsh
m
allo
w 6
.0
Ye
s
Du
al
Sta
nd
by
1
6
Fu
ll S
cre
en
Y
es
To
uch
scre
en
14
:
13
MP
<1
4M
P
04
:
1.4
GH
z<1
.6
GH
z 2
5
'1
6 :
9
LCD
N
/A
No
Y
es
Low
-En
d
Re
gu
lar
Sm
art
ph
on
e
4G
$1
50
-
$1
75
TD
/FD
-LT
E
Ad
van
ced
A
nd
roid
An
dro
id
Ma
rsh
m
allo
w 6
.0
Ye
s
Du
al
Sta
nd
by
3
2
Fu
ll S
cre
en
Y
es
To
uch
scre
en
14
:
13
MP
<1
4M
P
04
:
1.4
GH
z<1
.6
GH
z 3
5
'1
6 :
9
LCD
N
/A
No
Y
es
Low
-En
d
Ph
ab
let
4G
$1
50
-
$1
75
TD
/FD
-LT
E
Ad
van
ced
A
nd
roid
An
dro
id
No
ug
at
7.0
Y
es
Du
al
Sta
nd
by
3
2
Fu
ll S
cre
en
Y
es
To
uch
scre
en
14
:
13
MP
<1
4M
P
05
:
1.6
GH
z<1
.8
GH
z 3
5
.5
'16
: 9
O
LED
N
/A
No
N
o
Low
-En
d
Ph
ab
let
4G
$1
50
-
$1
75
TD
/FD
-LT
E
Ad
van
ced
A
nd
roid
An
dro
id
Ma
rsh
m
allo
w 6
.0
Ye
s
Du
al
Sta
nd
by
1
6
Fu
ll S
cre
en
Y
es
To
uch
scre
en
14
:
13
MP
<1
4M
P
05
:
1.6
GH
z<1
.8
GH
z 3
5
.5
'16
: 9
O
LED
N
/A
No
N
o
Low
-En
d
Ph
ab
let
4G
$1
50
-
$1
75
T
D/F
D-L
TE
A
nd
roid
An
dro
id
Ma
rsh
m
allo
w 6
.0
Ye
s
Du
al
Sta
nd
by
1
6
Fu
ll S
cre
en
Y
es
To
uch
scre
en
14
:
13
MP
<1
4M
P
05
:
1.6
GH
z<1
.8
GH
z 3
5
.5
'16
: 9
LC
D
N/A
N
o
Ye
s Lo
w-E
nd
Ph
ab
let
4G
$
15
0 -
T
D/F
D-L
TE
A
nd
roid
A
nd
roid
Y
es
Du
al
32
F
ull
Scr
ee
n
Ye
s T
ou
chsc
ree
n
14
: 0
5:
3
5.5
'1
6 :
9
LCD
N
/A
No
Y
es
Low
-En
d

Com
petit
ion
Issue
s in
Indi
a’s M
obile
Han
dset
Indu
stry
Bra
nd
Y
ea
r P
rod
uct
De
tail
G
en
era
tio
n
Pri
ce
Ba
nd
Air
Inte
rfa
ce
Op
era
tin
g
Sy
ste
m
OS
Ve
rsio
n
Blu
eto
oth
D
ua
l
SIM
Sto
rag
e (
GB
)
Fo
rm
Fa
cto
r G
PS
In
pu
t M
eth
od
M
eg
ap
ixe
ls
Ba
nd
Pro
cess
or
Sp
ee
d
Ba
nd
RA
M
(GB
)
Scr
ee
n
Siz
e
Asp
ect
Ra
tio
Dis
pla
y
Ty
pe
Wa
terp
ro
ofi
ng
Du
al
Re
ar
Ca
me
ra
Fin
ge
rpri
nt
Re
ad
er
Sm
art
ph
on
e
Tie
r
$1
75
N
ou
ga
t
7.1
Sta
nd
by
1
3M
P<
14
MP
1.6
GH
z<1
.8
GH
z
Sa
msu
ng
2
00
8
Fe
atu
re
Ph
on
e
2.5
G
$1
75
-
$2
00
G
PR
S/
ED
GE
R
TO
S
N/A
Y
es
N/A
0
.1
Slid
er
No
A
lph
an
um
eri
c
03
:
2M
P<
3M
P
N/A
N
/A
N/A
N
/A
N/A
N
/A
N/A
N
/A
N/A
Fe
atu
re
Ph
on
e
2.5
G
$1
75
-
$2
00
G
PR
S/
ED
GE
R
TO
S
N/A
Y
es
N/A
0
B
ar
No
A
lph
an
um
eri
c
03
:
2M
P<
3M
P
N/A
N
/A
N/A
N
/A
N/A
N
/A
N/A
N
/A
N/A
Fe
atu
re
Ph
on
e
2.5
G
$1
75
-
$2
00
CD
MA
20
00
1xR
TT
R
TO
S
N/A
Y
es
N/A
0
S
lide
r N
o
Alp
ha
nu
me
ric
03
:
2M
P<
3M
P
N/A
N
/A
N/A
N
/A
N/A
N
/A
N/A
N
/A
N/A
Fe
atu
re
Ph
on
e
3G
$1
75
-
$2
00
WC
DM
A/
HS
PA
R
TO
S
N/A
Y
es
N/A
1
B
ar
No
A
lph
an
um
eri
c
04
:
3M
P<
4M
P
N/A
N
/A
N/A
N
/A
N/A
N
/A
N/A
N
/A
N/A
Fe
atu
re
Ph
on
e
2.5
G
$1
75
-
$2
00
G
PR
S/
ED
GE
R
TO
S
N/A
Y
es
N/A
0
.1
Ba
r N
o
Alp
ha
nu
me
ric
03
:
2M
P<
3M
P
N/A
N
/A
N/A
N
/A
N/A
N
/A
N/A
N
/A
N/A
Fe
atu
re
Ph
on
e
2.5
G
$1
75
-
$2
00
G
PR
S/
ED
GE
R
TO
S
N/A
Y
es
N/A
0
B
ar
No
A
lph
an
um
eri
c
03
:
2M
P<
3M
P
N/A
N
/A
N/A
N
/A
N/A
N
/A
N/A
N
/A
N/A
Sa
msu
ng
2
01
8
Ph
ab
let
4G
$1
75
-
$2
00
TD
/FD
-LT
E
Ad
van
ced
A
nd
roid
An
dro
id
Ore
o 8
.0
Ye
s
Du
al
Sta
nd
by
3
2
Fu
ll S
cre
en
Y
es
To
uch
scre
en
14
:
13
MP
<1
4M
P
05
:
1.6
GH
z<1
.8
GH
z 3
5
.6
'18
.5 :
9
OLE
D
N/A
N
o
Ye
s Lo
w-E
nd
Ph
ab
let
4G
$1
75
-
$2
00
TD
/FD
-LT
E
Ad
van
ced
A
nd
roid
An
dro
id
No
ug
at
7.0
Y
es
Du
al
Sta
nd
by
3
2
Fu
ll S
cre
en
Y
es
To
uch
scre
en
14
:
13
MP
<1
4M
P
05
:
1.6
GH
z<1
.8
GH
z 4
5
.7
'16
: 9
LC
D
N/A
N
o
Ye
s Lo
w-E
nd
Ph
ab
let
4G
$1
75
-
$2
00
TD
/FD
-LT
E
Ad
van
ced
A
nd
roid
An
dro
id
Ma
rsh
m
allo
w 6
.0
Ye
s
Du
al
Sta
nd
by
1
6
Fu
ll S
cre
en
Y
es
To
uch
scre
en
14
:
13
MP
<1
4M
P
05
:
1.6
GH
z<1
.8
GH
z 3
5
.5
'16
: 9
LC
D
N/A
N
o
Ye
s Lo
w-E
nd
Ph
ab
let
4G
$1
75
-
$2
00
TD
/FD
-LT
E
Ad
van
ced
A
nd
roid
An
dro
id
Ma
rsh
m
allo
w 6
.0
Ye
s
Du
al
Sta
nd
by
3
2
Fu
ll S
cre
en
Y
es
To
uch
scre
en
14
:
13
MP
<1
4M
P
05
:
1.6
GH
z<1
.8
GH
z 3
5
.5
'16
: 9
LC
D
N/A
N
o
Ye
s Lo
w-E
nd
Ph
ab
let
4G
$1
75
-
$2
00
TD
/FD
-LT
E
Ad
van
ced
A
nd
roid
An
dro
id
No
ug
at
7.0
Y
es
Du
al
Sta
nd
by
3
2
Fu
ll S
cre
en
Y
es
To
uch
scre
en
14
:
13
MP
<1
4M
P
05
:
1.6
GH
z<1
.8
GH
z 3
5
.5
'16
: 9
O
LED
N
/A
No
Y
es
Low
-En
d
Ph
ab
let
4G
$1
75
-
$2
00
TD
/FD
-LT
E
Ad
van
ced
A
nd
roid
An
dro
id
Ore
o 8
.0
Ye
s
Du
al
Sta
nd
by
6
4
Fu
ll S
cre
en
Y
es
To
uch
scre
en
14
:
13
MP
<1
4M
P
05
:
1.6
GH
z<1
.8
GH
z 4
5
.6
'18
.5 :
9
OLE
D
N/A
N
o
Ye
s Lo
w-E
nd
Ph
ab
let
4G
$1
75
-
$2
00
TD
/FD
-LT
E
Ad
van
ced
A
nd
roid
An
dro
id
Ma
rsh
m
allo
w 6
.0
Ye
s
Du
al
Sta
nd
by
1
6
Fu
ll S
cre
en
Y
es
To
uch
scre
en
14
:
13
MP
<1
4M
P
05
:
1.6
GH
z<1
.8
GH
z 3
5
.5
'16
: 9
LC
D
N/A
N
o
Ye
s Lo
w-E
nd
Ph
ab
let
4G
$1
75
-
$2
00
TD
/FD
-LT
E
Ad
van
ced
A
nd
roid
An
dro
id
Ma
rsh
m
allo
w 6
.0
Ye
s
Du
al
Sta
nd
by
3
2
Fu
ll S
cre
en
Y
es
To
uch
scre
en
14
:
13
MP
<1
4M
P
05
:
1.6
GH
z<1
.8
GH
z 3
5
.5
'16
: 9
LC
D
N/A
N
o
Ye
s Lo
w-E
nd
Ph
ab
let
4G
$1
75
-
$2
00
TD
/FD
-LT
E
Ad
van
ced
A
nd
roid
An
dro
id
No
ug
at
7.0
Y
es
Du
al
Sta
nd
by
3
2
Fu
ll S
cre
en
Y
es
To
uch
scre
en
14
:
13
MP
<1
4M
P
05
:
1.6
GH
z<1
.8
GH
z 3
5
.5
'16
: 9
O
LED
N
/A
No
Y
es
Low
-En
d
Ph
ab
let
4G
$1
75
-
$2
00
T
D/F
D-L
TE
A
nd
roid
An
dro
id
No
ug
at
7.1
Y
es
Du
al
Sta
nd
by
6
4
Fu
ll S
cre
en
Y
es
To
uch
scre
en
14
:
13
MP
<1
4M
P
05
:
1.6
GH
z<1
.8
GH
z 4
5
.5
'16
: 9
LC
D
N/A
N
o
Ye
s Lo
w-E
nd
Sa
msu
ng
2
00
8
Fe
atu
re
Ph
on
e
2.5
G
$2
00
-
$3
00
G
PR
S/
ED
GE
R
TO
S
N/A
Y
es
N/A
0
B
ar
No
A
lph
an
um
eri
c
03
:
2M
P<
3M
P
N/A
N
/A
N/A
N
/A
N/A
N
/A
N/A
N
/A
N/A
Fe
atu
re
Ph
on
e
2.5
G
$2
00
-
$3
00
G
PR
S/
ED
GE
R
TO
S
N/A
Y
es
N/A
0
.1
Slid
er
No
A
lph
an
um
eri
c
04
:
3M
P<
4M
P
N/A
N
/A
N/A
N
/A
N/A
N
/A
N/A
N
/A
N/A

Bra
nd
Y
ea
r P
rod
uct
De
tail
G
en
era
tio
n
Pri
ce
Ba
nd
Air
Inte
rfa
ce
Op
era
tin
g
Sy
ste
m
OS
Ve
rsio
n
Blu
eto
oth
D
ua
l
SIM
Sto
rag
e (
GB
)
Fo
rm
Fa
cto
r G
PS
In
pu
t M
eth
od
M
eg
ap
ixe
ls
Ba
nd
Pro
cess
or
Sp
ee
d
Ba
nd
RA
M
(GB
)
Scr
ee
n
Siz
e
Asp
ect
Ra
tio
Dis
pla
y
Ty
pe
Wa
terp
ro
ofi
ng
Du
al
Re
ar
Ca
me
ra
Fin
ge
rpri
nt
Re
ad
er
Sm
art
ph
on
e
Tie
r
Fe
atu
re
Ph
on
e
2.5
G
$2
00
-
$3
00
CD
MA
20
00
1xR
TT
R
TO
S
N/A
N
o
N/A
0
B
ar
No
A
lph
an
um
eri
c N
o C
am
era
N
/A
N/A
N
/A
N/A
N
/A
N/A
N
/A
N/A
N
/A
Fe
atu
re
Ph
on
e
2.5
G
$2
00
-
$3
00
G
PR
S/
ED
GE
R
TO
S
N/A
Y
es
N/A
0
S
lide
r N
o
Alp
ha
nu
me
ric
04
:
3M
P<
4M
P
N/A
N
/A
N/A
N
/A
N/A
N
/A
N/A
N
/A
N/A
Fe
atu
re
Ph
on
e
3G
$2
00
-
$3
00
WC
DM
A/
HS
PA
R
TO
S
N/A
Y
es
N/A
1
B
ar
No
A
lph
an
um
eri
c
04
:
3M
P<
4M
P
N/A
N
/A
N/A
N
/A
N/A
N
/A
N/A
N
/A
N/A
Re
gu
lar
Sm
art
ph
on
e
3G
$2
00
-
$3
00
WC
DM
A/
HS
PA
O
the
rs
N/A
Y
es
N/A
0
S
lide
r N
o
Alp
ha
nu
me
ric
03
:
2M
P<
3M
P
N/A
N
/A
N/A
N
/A
N/A
N
/A
N/A
N
/A
Mid
-Ra
ng
e
Fe
atu
re
Ph
on
e
2.5
G
$2
00
-
$3
00
G
PR
S/
ED
GE
R
TO
S
N/A
Y
es
N/A
0
.1
Ba
r N
o
Alp
ha
nu
me
ric
03
:
2M
P<
3M
P
N/A
N
/A
N/A
N
/A
N/A
N
/A
N/A
N
/A
N/A
Fe
atu
re
Ph
on
e
3G
$2
00
-
$3
00
WC
DM
A/
HS
PA
R
TO
S
N/A
Y
es
N/A
0
S
lide
r N
o
Alp
ha
nu
me
ric
04
:
3M
P<
4M
P
N/A
N
/A
N/A
N
/A
N/A
N
/A
N/A
N
/A
N/A
Re
gu
lar
Sm
art
ph
on
e
3G
$2
00
-
$3
00
WC
DM
A/
HS
PA
O
the
rs
N/A
Y
es
N/A
0
B
ar
No
A
lph
an
um
eri
c
03
:
2M
P<
3M
P
N/A
N
/A
N/A
N
/A
N/A
N
/A
N/A
N
/A
Mid
-Ra
ng
e
Re
gu
lar
Sm
art
ph
on
e
3G
$2
00
-
$3
00
WC
DM
A/
HS
PA
O
the
rs
N/A
Y
es
N/A
0
S
lide
r N
o
Alp
ha
nu
me
ric
03
:
2M
P<
3M
P
N/A
N
/A
N/A
N
/A
N/A
N
/A
N/A
N
/A
Mid
-Ra
ng
e
Fe
atu
re
Ph
on
e
2.5
G
$2
00
-
$3
00
CD
MA
20
00
1xR
TT
R
TO
S
N/A
Y
es
N/A
0
S
lide
r N
o
Alp
ha
nu
me
ric
+
To
uch
scre
en
03
:
2M
P<
3M
P
N/A
N
/A
N/A
N
/A
N/A
N
/A
N/A
N
/A
N/A
Fe
atu
re
Ph
on
e
2.5
G
$2
00
-
$3
00
G
PR
S/
ED
GE
R
TO
S
N/A
Y
es
N/A
0
S
lide
r N
o
Alp
ha
nu
me
ric
04
:
3M
P<
4M
P
N/A
N
/A
N/A
N
/A
N/A
N
/A
N/A
N
/A
N/A
Fe
atu
re
Ph
on
e
2.5
G
$2
00
-
$3
00
G
PR
S/
ED
GE
R
TO
S
N/A
Y
es
N/A
0
.1
Slid
er
No
A
lph
an
um
eri
c
04
:
3M
P<
4M
P
N/A
N
/A
N/A
N
/A
N/A
N
/A
N/A
N
/A
N/A
Fe
atu
re
Ph
on
e
2.5
G
$2
00
-
$3
00
G
PR
S/
ED
GE
R
TO
S
N/A
Y
es
N/A
0
.1
Slid
er
No
A
lph
an
um
eri
c
03
:
2M
P<
3M
P
N/A
N
/A
N/A
N
/A
N/A
N
/A
N/A
N
/A
N/A
Fe
atu
re
Ph
on
e
2.5
G
$2
00
-
$3
00
G
PR
S/
ED
GE
R
TO
S
N/A
Y
es
N/A
0
.1
Slid
er
No
A
lph
an
um
eri
c
04
:
3M
P<
4M
P
N/A
N
/A
N/A
N
/A
N/A
N
/A
N/A
N
/A
N/A
Fe
atu
re
Ph
on
e
2.5
G
$2
00
-
$3
00
G
PR
S/
ED
GE
R
TO
S
N/A
Y
es
N/A
0
.1
Slid
er
No
A
lph
an
um
eri
c
03
:
2M
P<
3M
P
N/A
N
/A
N/A
N
/A
N/A
N
/A
N/A
N
/A
N/A
Fe
atu
re
Ph
on
e
2.5
G
$2
00
-
$3
00
G
PR
S/
ED
GE
R
TO
S
N/A
Y
es
N/A
0
B
ar
No
A
lph
an
um
eri
c
03
:
2M
P<
3M
P
N/A
N
/A
N/A
N
/A
N/A
N
/A
N/A
N
/A
N/A
Fe
atu
re
Ph
on
e
2.5
G
$2
00
-
$3
00
G
PR
S/
ED
GE
R
TO
S
N/A
Y
es
N/A
0
S
lide
r N
o
Alp
ha
nu
me
ric
04
:
3M
P<
4M
P
N/A
N
/A
N/A
N
/A
N/A
N
/A
N/A
N
/A
N/A
Sa
msu
ng
2
01
8
Ph
ab
let
4G
$2
00
-
$3
00
TD
/FD
-LT
E
Ad
van
ced
A
nd
roid
An
dro
id
Ore
o 8
.0
Ye
s
Du
al
Sta
nd
by
3
2
Fu
ll S
cre
en
Y
es
To
uch
scre
en
17
:
16
MP
<1
7M
P
05
:
1.6
GH
z<1
.8
GH
z 4
5
.6
'18
.5 :
9
OLE
D
N/A
N
o
Ye
s M
id-R
an
ge
Ph
ab
let
4G
$2
00
-
$3
00
TD
/FD
-LT
E
Ad
van
ced
A
nd
roid
An
dro
id
Ore
o 8
.0
Ye
s
Du
al
Sta
nd
by
6
4
Fu
ll S
cre
en
Y
es
To
uch
scre
en
17
:
16
MP
<1
7M
P
05
:
1.6
GH
z<1
.8
GH
z 4
5
.6
'18
.5 :
9
OLE
D
N/A
N
o
Ye
s M
id-R
an
ge
Ph
ab
let
4G
$2
00
-
$3
00
TD
/FD
-LT
E
Ad
van
ced
A
nd
roid
An
dro
id
Ma
rsh
m
allo
w 6
.0
Ye
s
Du
al
Sta
nd
by
6
4
Fu
ll S
cre
en
Y
es
To
uch
scre
en
17
:
16
MP
<1
7M
P
07
:
2.0
GH
z<2
.3
GH
z 4
5
.7
'16
: 9
O
LED
N
/A
No
Y
es
Mid
-Ra
ng
e
Ph
ab
let
4G
$2
00
-
$3
00
TD
/FD
-LT
E
Ad
van
ced
A
nd
roid
An
dro
id
Ore
o 8
.0
Ye
s
Du
al
Sta
nd
by
6
4
Fu
ll S
cre
en
Y
es
To
uch
scre
en
14
:
13
MP
<1
4M
P
05
:
1.6
GH
z<1
.8
GH
z 4
5
.6
'18
.5 :
9
OLE
D
N/A
N
o
Ye
s M
id-R
an
ge
Ph
ab
let
4G
$2
00
-
$3
00
TD
/FD
-LT
E
Ad
van
ced
A
nd
roid
An
dro
id
Ore
o 8
.0
Ye
s
Du
al
Sta
nd
by
3
2
Fu
ll S
cre
en
Y
es
To
uch
scre
en
14
:
13
MP
<1
4M
P
05
:
1.6
GH
z<1
.8
GH
z 4
5
.5
'16
: 9
O
LED
N
/A
Ye
s Y
es
Mid
-Ra
ng
e

Com
petit
ion
Issue
s in
Indi
a’s M
obile
Han
dset
Indu
stry
Bra
nd
Y
ea
r P
rod
uct
De
tail
G
en
era
tio
n
Pri
ce
Ba
nd
Air
Inte
rfa
ce
Op
era
tin
g
Sy
ste
m
OS
Ve
rsio
n
Blu
eto
oth
D
ua
l
SIM
Sto
rag
e (
GB
)
Fo
rm
Fa
cto
r G
PS
In
pu
t M
eth
od
M
eg
ap
ixe
ls
Ba
nd
Pro
cess
or
Sp
ee
d
Ba
nd
RA
M
(GB
)
Scr
ee
n
Siz
e
Asp
ect
Ra
tio
Dis
pla
y
Ty
pe
Wa
terp
ro
ofi
ng
Du
al
Re
ar
Ca
me
ra
Fin
ge
rpri
nt
Re
ad
er
Sm
art
ph
on
e
Tie
r
Ph
ab
let
4G
$2
00
-
$3
00
TD
/FD
-LT
E
Ad
van
ced
A
nd
roid
An
dro
id
No
ug
at
7.0
Y
es
Du
al
Sta
nd
by
6
4
Fu
ll S
cre
en
Y
es
To
uch
scre
en
14
:
13
MP
<1
4M
P
05
:
1.6
GH
z<1
.8
GH
z 3
5
.5
'16
: 9
O
LED
N
/A
No
Y
es
Mid
-Ra
ng
e
Ph
ab
let
4G
$2
00
-
$3
00
TD
/FD
-LT
E
Ad
van
ced
A
nd
roid
An
dro
id
Ore
o 8
.0
Ye
s
Du
al
Sta
nd
by
6
4
Fu
ll S
cre
en
Y
es
To
uch
scre
en
17
:
16
MP
<1
7M
P
06
:
1.8
GH
z<2
.0
GH
z 4
6
'1
8.5
: 9
O
LED
N
/A
Ye
s Y
es
Mid
-Ra
ng
e
Ph
ab
let
4G
$2
00
-
$3
00
TD
/FD
-LT
E
Ad
van
ced
A
nd
roid
An
dro
id
Ore
o 8
.0
Ye
s
Du
al
Sta
nd
by
3
2
Fu
ll S
cre
en
Y
es
To
uch
scre
en
14
:
13
MP
<1
4M
P
05
:
1.6
GH
z<1
.8
GH
z 4
5
.5
'16
: 9
O
LED
N
/A
Ye
s Y
es
Mid
-Ra
ng
e
Ph
ab
let
4G
$2
00
-
$3
00
TD
/FD
-LT
E
Ad
van
ced
A
nd
roid
An
dro
id
No
ug
at
7.0
Y
es
Du
al
Sta
nd
by
3
2
Fu
ll S
cre
en
Y
es
To
uch
scre
en
14
:
13
MP
<1
4M
P
05
:
1.6
GH
z<1
.8
GH
z 4
5
.7
'16
: 9
LC
D
N/A
N
o
Ye
s M
id-R
an
ge
Ph
ab
let
4G
$2
00
-
$3
00
TD
/FD
-LT
E
Ad
van
ced
A
nd
roid
An
dro
id
No
ug
at
7.0
Y
es
Du
al
Sta
nd
by
6
4
Fu
ll S
cre
en
Y
es
To
uch
scre
en
14
:
13
MP
<1
4M
P
05
:
1.6
GH
z<1
.8
GH
z 3
5
.5
'16
: 9
O
LED
N
/A
No
Y
es
Mid
-Ra
ng
e
Sa
msu
ng
2
00
8
Fe
atu
re
Ph
on
e
2.5
G
$3
00
-
$4
00
CD
MA
20
00
1xR
TT
R
TO
S
N/A
Y
es
N/A
0
S
lide
r N
o
Alp
ha
nu
me
ric
+
To
uch
scre
en
03
:
2M
P<
3M
P
N/A
N
/A
N/A
N
/A
N/A
N
/A
N/A
N
/A
N/A
Fe
atu
re
Ph
on
e
2.5
G
$3
00
-
$4
00
G
PR
S/
ED
GE
R
TO
S
N/A
Y
es
N/A
0
.2
Slid
er
No
A
lph
an
um
eri
c
06
:
5M
P<
6M
P
N/A
N
/A
N/A
N
/A
N/A
N
/A
N/A
N
/A
N/A
Re
gu
lar
Sm
art
ph
on
e
3G
$3
00
-
$4
00
WC
DM
A/
HS
PA
O
the
rs
N/A
Y
es
N/A
0
B
ar
No
A
lph
an
um
eri
c
03
:
2M
P<
3M
P
N/A
N
/A
N/A
N
/A
N/A
N
/A
N/A
N
/A
Mid
-Ra
ng
e
Fe
atu
re
Ph
on
e
3G
$3
00
-
$4
00
WC
DM
A/
HS
PA
R
TO
S
N/A
Y
es
N/A
0
.1
Slid
er
No
A
lph
an
um
eri
c
06
:
5M
P<
6M
P
N/A
N
/A
N/A
N
/A
N/A
N
/A
N/A
N
/A
N/A
Fe
atu
re
Ph
on
e
3G
$3
00
-
$4
00
WC
DM
A/
HS
PA
R
TO
S
N/A
Y
es
N/A
0
.2
Fu
ll S
cre
en
N
o
To
uch
scre
en
06
:
5M
P<
6M
P
N/A
N
/A
N/A
N
/A
N/A
N
/A
N/A
N
/A
N/A
Fe
atu
re
Ph
on
e
2.5
G
$3
00
-
$4
00
G
PR
S/
ED
GE
R
TO
S
N/A
Y
es
N/A
0
S
lide
r N
o
Alp
ha
nu
me
ric
04
:
3M
P<
4M
P
N/A
N
/A
N/A
N
/A
N/A
N
/A
N/A
N
/A
N/A
Re
gu
lar
Sm
art
ph
on
e
3G
$3
00
-
$4
00
WC
DM
A/
HS
PA
O
the
rs
N/A
Y
es
N/A
0
S
lide
r N
o
Alp
ha
nu
me
ric
03
:
2M
P<
3M
P
N/A
N
/A
N/A
N
/A
N/A
N
/A
N/A
N
/A
Mid
-Ra
ng
e
Re
gu
lar
Sm
art
ph
on
e
3G
$3
00
-
$4
00
WC
DM
A/
HS
PA
O
the
rs
N/A
Y
es
N/A
0
S
lide
r N
o
Alp
ha
nu
me
ric
03
:
2M
P<
3M
P
N/A
N
/A
N/A
N
/A
N/A
N
/A
N/A
N
/A
Mid
-Ra
ng
e
Fe
atu
re
Ph
on
e
2.5
G
$3
00
-
$4
00
CD
MA
20
00
1xR
TT
R
TO
S
N/A
Y
es
N/A
0
S
lide
r N
o
Alp
ha
nu
me
ric
+
To
uch
scre
en
03
:
2M
P<
3M
P
N/A
N
/A
N/A
N
/A
N/A
N
/A
N/A
N
/A
N/A
Sa
msu
ng
2
01
8
Ph
ab
let
4G
$3
00
-
$4
00
TD
/FD
-LT
E
Ad
van
ced
A
nd
roid
An
dro
id
Ore
o 8
.0
Ye
s
Du
al
Sta
nd
by
6
4
Fu
ll S
cre
en
Y
es
To
uch
scre
en
17
:
16
MP
<1
7M
P
06
:
1.8
GH
z<2
.0
GH
z 4
6
'1
8.5
: 9
O
LED
N
/A
Ye
s Y
es
Mid
-Ra
ng
e
Ph
ab
let
4G
$3
00
-
$4
00
TD
/FD
-LT
E
Ad
van
ced
A
nd
roid
An
dro
id
No
ug
at
7.1
Y
es
Du
al
Sta
nd
by
6
4
Fu
ll S
cre
en
Y
es
To
uch
scre
en
17
:
16
MP
<1
7M
P
07
:
2.0
GH
z<2
.3
GH
z 6
6
'1
8.5
: 9
O
LED
IP
68
N
o
Ye
s M
id-R
an
ge
Ph
ab
let
4G
$3
00
-
$4
00
TD
/FD
-LT
E
Ad
van
ced
A
nd
roid
An
dro
id
Ma
rsh
m
allo
w 6
.0
Ye
s
Du
al
Sta
nd
by
6
4
Fu
ll S
cre
en
Y
es
To
uch
scre
en
17
:
16
MP
<1
7M
P
06
:
1.8
GH
z<2
.0
GH
z 6
6
'1
6 :
9
OLE
D
N/A
N
o
Ye
s M
id-R
an
ge
Ph
ab
let
4G
$3
00
-
$4
00
TD
/FD
-LT
E
Ad
van
ced
A
nd
roid
An
dro
id
Ma
rsh
m
allo
w 6
.0
Ye
s
Du
al
Sta
nd
by
6
4
Fu
ll S
cre
en
Y
es
To
uch
scre
en
17
:
16
MP
<1
7M
P
07
:
2.0
GH
z<2
.3
GH
z 4
5
.7
'16
: 9
O
LED
N
/A
No
Y
es
Mid
-Ra
ng
e
Ph
ab
let
4G
$3
00
-
$4
00
TD
/FD
-LT
E
Ad
van
ced
A
nd
roid
An
dro
id
Ma
rsh
m
allo
w 6
.0
Ye
s
Du
al
Sta
nd
by
6
4
Fu
ll S
cre
en
Y
es
To
uch
scre
en
17
:
16
MP
<1
7M
P
06
:
1.8
GH
z<2
.0
GH
z 6
6
'1
6 :
9
OLE
D
N/A
N
o
Ye
s M
id-R
an
ge

Bra
nd
Y
ea
r P
rod
uct
De
tail
G
en
era
tio
n
Pri
ce
Ba
nd
Air
Inte
rfa
ce
Op
era
tin
g
Sy
ste
m
OS
Ve
rsio
n
Blu
eto
oth
D
ua
l
SIM
Sto
rag
e (
GB
)
Fo
rm
Fa
cto
r G
PS
In
pu
t M
eth
od
M
eg
ap
ixe
ls
Ba
nd
Pro
cess
or
Sp
ee
d
Ba
nd
RA
M
(GB
)
Scr
ee
n
Siz
e
Asp
ect
Ra
tio
Dis
pla
y
Ty
pe
Wa
terp
ro
ofi
ng
Du
al
Re
ar
Ca
me
ra
Fin
ge
rpri
nt
Re
ad
er
Sm
art
ph
on
e
Tie
r
Sa
msu
ng
2
00
8
Fe
atu
re
Ph
on
e
3G
$4
00
-
$5
00
WC
DM
A/
HS
PA
R
TO
S
N/A
Y
es
N/A
0
.2
Slid
er
No
A
lph
an
um
eri
c
06
:
5M
P<
6M
P
N/A
N
/A
N/A
N
/A
N/A
N
/A
N/A
N
/A
N/A
Fe
atu
re
Ph
on
e
3G
$4
00
-
$5
00
WC
DM
A/
HS
PA
R
TO
S
N/A
Y
es
N/A
0
.1
Slid
er
No
A
lph
an
um
eri
c
06
:
5M
P<
6M
P
N/A
N
/A
N/A
N
/A
N/A
N
/A
N/A
N
/A
N/A
Fe
atu
re
Ph
on
e
3G
$4
00
-
$5
00
WC
DM
A/
HS
PA
R
TO
S
N/A
Y
es
N/A
0
.2
Fu
ll S
cre
en
N
o
To
uch
scre
en
06
:
5M
P<
6M
P
N/A
N
/A
N/A
N
/A
N/A
N
/A
N/A
N
/A
N/A
Fe
atu
re
Ph
on
e
3G
$4
00
-
$5
00
WC
DM
A/
HS
PA
R
TO
S
N/A
Y
es
N/A
0
.2
Slid
er
No
A
lph
an
um
eri
c
06
:
5M
P<
6M
P
N/A
N
/A
N/A
N
/A
N/A
N
/A
N/A
N
/A
N/A
Fe
atu
re
Ph
on
e
2.5
G
$4
00
-
$5
00
G
PR
S/
ED
GE
R
TO
S
N/A
Y
es
N/A
0
.2
Slid
er
No
A
lph
an
um
eri
c
06
:
5M
P<
6M
P
N/A
N
/A
N/A
N
/A
N/A
N
/A
N/A
N
/A
N/A
Re
gu
lar
Sm
art
ph
on
e
2.5
G
$4
00
-
$5
00
G
PR
S/
ED
GE
O
the
rs
N/A
Y
es
N/A
0
.1
Fu
ll S
cre
en
N
o
To
uch
scre
en
03
:
2M
P<
3M
P
N/A
N
/A
N/A
N
/A
N/A
N
/A
N/A
N
/A
Hig
h-E
nd
Fe
atu
re
Ph
on
e
2.5
G
$4
00
-
$5
00
G
PR
S/
ED
GE
R
TO
S
N/A
Y
es
N/A
0
.2
Slid
er
No
A
lph
an
um
eri
c
06
:
5M
P<
6M
P
N/A
N
/A
N/A
N
/A
N/A
N
/A
N/A
N
/A
N/A
Fe
atu
re
Ph
on
e
3G
$4
00
-
$5
00
WC
DM
A/
HS
PA
R
TO
S
N/A
Y
es
N/A
0
.1
Slid
er
No
A
lph
an
um
eri
c
06
:
5M
P<
6M
P
N/A
N
/A
N/A
N
/A
N/A
N
/A
N/A
N
/A
N/A
Fe
atu
re
Ph
on
e
3G
$4
00
-
$5
00
WC
DM
A/
HS
PA
R
TO
S
N/A
Y
es
N/A
0
.2
Slid
er
No
A
lph
an
um
eri
c
06
:
5M
P<
6M
P
N/A
N
/A
N/A
N
/A
N/A
N
/A
N/A
N
/A
N/A
Sa
msu
ng
2
01
8
Ph
ab
let
4G
$4
00
-
$5
00
TD
/FD
-LT
E
Ad
van
ced
A
nd
roid
An
dro
id
No
ug
at
7.1
Y
es
Du
al
Sta
nd
by
6
4
Fu
ll S
cre
en
Y
es
To
uch
scre
en
17
:
16
MP
<1
7M
P
07
:
2.0
GH
z<2
.3
GH
z 6
6
'1
8.5
: 9
O
LED
IP
68
N
o
Ye
s H
igh
-En
d
Sa
msu
ng
2
00
8
Re
gu
lar
Sm
art
ph
on
e
3G
$5
00
-
$7
00
WC
DM
A/
HS
PA
O
the
rs
N/A
Y
es
N/A
0
.3
Me
sse
ng
e
r Y
es
QW
ER
TY
+
To
uch
scre
en
03
:
2M
P<
3M
P
N/A
N
/A
N/A
N
/A
N/A
N
/A
N/A
N
/A
Hig
h-E
nd
Re
gu
lar
Sm
art
ph
on
e
3G
$5
00
-
$7
00
WC
DM
A/
HS
PA
O
the
rs
N/A
Y
es
N/A
0
.2
Ba
r Y
es
Alp
ha
nu
me
ric
04
:
3M
P<
4M
P
N/A
N
/A
N/A
N
/A
N/A
N
/A
N/A
N
/A
Hig
h-E
nd
Re
gu
lar
Sm
art
ph
on
e
3G
$5
00
-
$7
00
WC
DM
A/
HS
PA
O
the
rs
N/A
Y
es
N/A
0
.2
Ba
r Y
es
Alp
ha
nu
me
ric
04
:
3M
P<
4M
P
N/A
N
/A
N/A
N
/A
N/A
N
/A
N/A
N
/A
Hig
h-E
nd
Re
gu
lar
Sm
art
ph
on
e
3G
$5
00
-
$7
00
WC
DM
A/
HS
PA
O
the
rs
N/A
Y
es
N/A
0
.3
Me
sse
ng
e
r Y
es
QW
ER
TY
+
To
uch
scre
en
03
:
2M
P<
3M
P
N/A
N
/A
N/A
N
/A
N/A
N
/A
N/A
N
/A
Hig
h-E
nd
Sa
msu
ng
2
01
8
Ph
ab
let
4G
$5
00
-
$7
00
TD
/FD
-LT
E
Ad
van
ced
A
nd
roid
An
dro
id
Ma
rsh
m
allo
w 6
.0
Ye
s N
o
32
F
ull
Scr
ee
n
Ye
s T
ou
chsc
ree
n
13
:
12
MP
<1
3M
P
08
:
2.3
+G
Hz
4
5.5
'1
6 :
9
OLE
D
IP6
8
No
Y
es
Hig
h-E
nd
Ph
ab
let
4G
$5
00
-
$7
00
TD
/FD
-LT
E
Ad
van
ced
A
nd
roid
An
dro
id
No
ug
at
7.0
Y
es
Du
al
Sta
nd
by
6
4
Fu
ll S
cre
en
Y
es
To
uch
scre
en
13
:
12
MP
<1
3M
P
08
:
2.3
+G
Hz
4
5.8
'1
8.5
: 9
O
LED
IP
68
N
o
Ye
s
Ult
ra H
igh
-
En
d
Re
gu
lar
Sm
art
ph
on
e
4G
$5
00
-
$7
00
TD
/FD
-LT
E
Ad
van
ced
A
nd
roid
An
dro
id
Ma
rsh
m
allo
w 6
.0
Ye
s N
o
32
F
ull
Scr
ee
n
Ye
s T
ou
chsc
ree
n
13
:
12
MP
<1
3M
P
08
:
2.3
+G
Hz
4
5.1
'1
6 :
9
OLE
D
IP6
8
No
Y
es
Hig
h-E
nd
Ph
ab
let
4G
$5
00
-
$7
00
TD
/FD
-LT
E
Ad
van
ced
A
nd
roid
An
dro
id
Ma
rsh
m
allo
w 6
.0
Ye
s N
o
32
F
ull
Scr
ee
n
Ye
s T
ou
chsc
ree
n
13
:
12
MP
<1
3M
P
08
:
2.3
+G
Hz
4
5.5
'1
6 :
9
OLE
D
IP6
8
No
Y
es
Hig
h-E
nd
Sa
msu
ng
2
00
8
Re
gu
lar
Sm
art
ph
on
e
3G
>
$7
00
WC
DM
A/
HS
PA
O
the
rs
N/A
Y
es
N/A
8
S
lide
r Y
es
Alp
ha
nu
me
ric
09
:
8M
P<
9M
P
N/A
N
/A
N/A
N
/A
N/A
N
/A
N/A
N
/A
Ult
ra H
igh
-
En
d
Re
gu
lar
Sm
art
ph
on
e
3G
>
$7
00
WC
DM
A
/HS
PA
O
the
rs
N/A
Y
es
N/A
8
F
ull
Scr
ee
n
Ye
s T
ou
chsc
ree
n
06
:
5M
P<
6M
P
N/A
N
/A
N/A
N
/A
N/A
N
/A
N/A
N
/A
Ult
ra H
igh
-
En
d
Re
gu
lar
Sm
art
ph
on
e
3G
>
$7
00
WC
DM
A/
HS
PA
O
the
rs
N/A
Y
es
N/A
1
6
Fu
ll S
cre
en
Y
es
To
uch
scre
en
06
:
5M
P<
6M
P
N/A
N
/A
N/A
N
/A
N/A
N
/A
N/A
N
/A
Ult
ra H
igh
-
En
d

Com
petit
ion
Issue
s in
Indi
a’s M
obile
Han
dset
Indu
stry
Bra
nd
Y
ea
r P
rod
uct
De
tail
G
en
era
tio
n
Pri
ce
Ba
nd
Air
Inte
rfa
ce
Op
era
tin
g
Sy
ste
m
OS
Ve
rsio
n
Blu
eto
oth
D
ua
l
SIM
Sto
rag
e (
GB
)
Fo
rm
Fa
cto
r G
PS
In
pu
t M
eth
od
M
eg
ap
ixe
ls
Ba
nd
Pro
cess
or
Sp
ee
d
Ba
nd
RA
M
(GB
)
Scr
ee
n
Siz
e
Asp
ect
Ra
tio
Dis
pla
y
Ty
pe
Wa
terp
ro
ofi
ng
Du
al
Re
ar
Ca
me
ra
Fin
ge
rpri
nt
Re
ad
er
Sm
art
ph
on
e
Tie
r
Sa
msu
ng
2
01
8
Ph
ab
let
4G
>
$7
00
TD
/FD
-LT
E
Ad
van
ced
A
nd
roid
An
dro
id
No
ug
at
7.1
Y
es
Du
al
Sta
nd
by
6
4
Fu
ll S
cre
en
Y
es
To
uch
scre
en
13
:
12
MP
<1
3M
P
08
:
2.3
+G
Hz
6
6.3
'1
8.5
: 9
O
LED
IP
68
Y
es
Ye
s
Ult
ra H
igh
-
En
d
Ph
ab
let
4G
>
$7
00
TD
/FD
-LT
E
Ad
van
ced
A
nd
roid
An
dro
id
No
ug
at
7.0
Y
es
Du
al
Sta
nd
by
6
4
Fu
ll S
cre
en
Y
es
To
uch
scre
en
13
:
12
MP
<1
3M
P
08
:
2.3
+G
Hz
4
6.2
'1
8.5
: 9
O
LED
IP
68
N
o
Ye
s
Ult
ra H
igh
-
En
d
Ph
ab
let
4G
>
$7
00
TD
/FD
-LT
E
Ad
van
ced
A
nd
roid
An
dro
id
No
ug
at
7.0
Y
es
Du
al
Sta
nd
by
1
28
F
ull
Scr
ee
n
Ye
s T
ou
chsc
ree
n
13
:
12
MP
<1
3M
P
08
:
2.3
+G
Hz
6
6.2
'1
8.5
: 9
O
LED
IP
68
N
o
Ye
s
Ult
ra H
igh
-
En
d
Ph
ab
let
4G
>
$7
00
TD
/FD
-LT
E
Ad
van
ced
A
nd
roid
An
dro
id
Ore
o 8
.0
Ye
s
Du
al
Sta
nd
by
6
4
Fu
ll S
cre
en
Y
es
To
uch
scre
en
13
:
12
MP
<1
3M
P
08
:
2.3
+G
Hz
4
5.8
'1
8.5
: 9
O
LED
IP
68
N
o
Ye
s
Ult
ra H
igh
-
En
d
Ph
ab
let
4G
>
$7
00
TD
/FD
-LT
E
Ad
van
ced
A
nd
roid
An
dro
id
Ore
o 8
.0
Ye
s
Du
al
Sta
nd
by
1
28
F
ull
Scr
ee
n
Ye
s T
ou
chsc
ree
n
13
:
12
MP
<1
3M
P
08
:
2.3
+G
Hz
4
5.8
'1
8.5
: 9
O
LED
IP
68
N
o
Ye
s
Ult
ra H
igh
-
En
d
Ph
ab
let
4G
>
$7
00
TD
/FD
-LT
E
Ad
van
ced
A
nd
roid
An
dro
id
Ore
o 8
.0
Ye
s
Du
al
Sta
nd
by
2
56
F
ull
Scr
ee
n
Ye
s T
ou
chsc
ree
n
13
:
12
MP
<1
3M
P
08
:
2.3
+G
Hz
4
5.8
'1
8.5
: 9
O
LED
IP
68
N
o
Ye
s
Ult
ra H
igh
-
En
d
Ph
ab
let
4G
>
$7
00
TD
/FD
-LT
E
Ad
van
ced
A
nd
roid
An
dro
id
Ore
o 8
.0
Ye
s
Du
al
Sta
nd
by
6
4
Fu
ll S
cre
en
Y
es
To
uch
scre
en
13
:
12
MP
<1
3M
P
08
:
2.3
+G
Hz
6
6.2
'1
8.5
: 9
O
LED
IP
68
Y
es
Ye
s
Ult
ra H
igh
-
En
d
Ph
ab
let
4G
>
$7
00
TD
/FD
-LT
E
Ad
van
ced
A
nd
roid
An
dro
id
Ore
o 8
.0
Ye
s
Du
al
Sta
nd
by
1
28
F
ull
Scr
ee
n
Ye
s T
ou
chsc
ree
n
13
:
12
MP
<1
3M
P
08
:
2.3
+G
Hz
6
6.2
'1
8.5
: 9
O
LED
IP
68
Y
es
Ye
s
Ult
ra H
igh
-
En
d
Ph
ab
let
4G
>
$7
00
TD
/FD
-LT
E
Ad
van
ced
A
nd
roid
An
dro
id
Ore
o 8
.0
Ye
s
Du
al
Sta
nd
by
2
56
F
ull
Scr
ee
n
Ye
s T
ou
chsc
ree
n
13
:
12
MP
<1
3M
P
08
:
2.3
+G
Hz
6
6.2
'1
8.5
: 9
O
LED
IP
68
Y
es
Ye
s
Ult
ra H
igh
-
En
d
Ph
ab
let
4G
>
$7
00
TD
/FD
-LT
E
Ad
van
ced
A
nd
roid
An
dro
id
No
ug
at
7.1
Y
es
Du
al
Sta
nd
by
6
4
Fu
ll S
cre
en
Y
es
To
uch
scre
en
13
:
12
MP
<1
3M
P
08
:
2.3
+G
Hz
6
6.3
'1
8.5
: 9
O
LED
IP
68
Y
es
Ye
s
Ult
ra H
igh
-
En
d
Ph
ab
let
4G
>
$7
00
TD
/FD
-LT
E
Ad
van
ced
A
nd
roid
An
dro
id
No
ug
at
7.0
Y
es
Du
al
Sta
nd
by
6
4
Fu
ll S
cre
en
Y
es
To
uch
scre
en
13
:
12
MP
<1
3M
P
08
:
2.3
+G
Hz
4
5.8
'1
8.5
: 9
O
LED
IP
68
N
o
Ye
s
Ult
ra H
igh
-
En
d
Ph
ab
let
4G
>
$7
00
TD
/FD
-LT
E
Ad
van
ced
A
nd
roid
An
dro
id
No
ug
at
7.0
Y
es
Du
al
Sta
nd
by
6
4
Fu
ll S
cre
en
Y
es
To
uch
scre
en
13
:
12
MP
<1
3M
P
08
:
2.3
+G
Hz
4
6.2
'1
8.5
: 9
O
LED
IP
68
N
o
Ye
s
Ult
ra H
igh
-
En
d
Ph
ab
let
4G
>
$7
00
TD
/FD
-LT
E
Ad
van
ced
A
nd
roid
An
dro
id
No
ug
at
7.0
Y
es
Du
al
Sta
nd
by
1
28
F
ull
Scr
ee
n
Ye
s T
ou
chsc
ree
n
13
:
12
MP
<1
3M
P
08
:
2.3
+G
Hz
6
6.2
'1
8.5
: 9
O
LED
IP
68
N
o
Ye
s
Ult
ra H
igh
-
En
d
Ph
ab
let
4G
>
$7
00
TD
/FD
-LT
E
Ad
van
ced
A
nd
roid
An
dro
id
Ore
o 8
.0
Ye
s
Du
al
Sta
nd
by
6
4
Fu
ll S
cre
en
Y
es
To
uch
scre
en
13
:
12
MP
<1
3M
P
08
:
2.3
+G
Hz
4
5.8
'1
8.5
: 9
O
LED
IP
68
N
o
Ye
s
Ult
ra H
igh
-
En
d
Ph
ab
let
4G
>
$7
00
TD
/FD
-LT
E
Ad
van
ced
A
nd
roid
An
dro
id
Ore
o 8
.0
Ye
s
Du
al
Sta
nd
by
1
28
F
ull
Scr
ee
n
Ye
s T
ou
chsc
ree
n
13
:
12
MP
<1
3M
P
08
:
2.3
+G
Hz
4
5.8
'1
8.5
: 9
O
LED
IP
68
N
o
Ye
s
Ult
ra H
igh
-
En
d
Ph
ab
let
4G
>
$7
00
TD
/FD
-LT
E
Ad
van
ced
A
nd
roid
An
dro
id
Ore
o 8
.0
Ye
s
Du
al
Sta
nd
by
2
56
F
ull
Scr
ee
n
Ye
s T
ou
chsc
ree
n
13
:
12
MP
<1
3M
P
08
:
2.3
+G
Hz
4
5.8
'1
8.5
: 9
O
LED
IP
68
N
o
Ye
s
Ult
ra H
igh
-
En
d
Ph
ab
let
4G
>
$7
00
TD
/FD
-LT
E
Ad
van
ced
A
nd
roid
An
dro
id
Ore
o 8
.0
Ye
s
Du
al
Sta
nd
by
6
4
Fu
ll S
cre
en
Y
es
To
uch
scre
en
13
:
12
MP
<1
3M
P
08
:
2.3
+G
Hz
6
6.2
'1
8.5
: 9
O
LED
IP
68
Y
es
Ye
s
Ult
ra H
igh
-
En
d
Ph
ab
let
4G
>
$7
00
TD
/FD
-LT
E
Ad
van
ced
A
nd
roid
An
dro
id
Ore
o 8
.0
Ye
s
Du
al
Sta
nd
by
1
28
F
ull
Scr
ee
n
Ye
s T
ou
chsc
ree
n
13
:
12
MP
<1
3M
P
08
:
2.3
+G
Hz
6
6.2
'1
8.5
: 9
O
LED
IP
68
Y
es
Ye
s
Ult
ra H
igh
-
En
d
Ph
ab
let
4G
>
$7
00
TD
/FD
-LT
E
Ad
van
ced
A
nd
roid
An
dro
id
Ore
o 8
.0
Ye
s
Du
al
Sta
nd
by
2
56
F
ull
Scr
ee
n
Ye
s T
ou
chsc
ree
n
13
:
12
MP
<1
3M
P
08
:
2.3
+G
Hz
6
6.2
'1
8.5
: 9
O
LED
IP
68
Y
es
Ye
s
Ult
ra H
igh
-
En
d
So
urc
e:
C
om
pile
d b
y a
uth
ors
fro
m I
DC
’s Q
ua
rte
rly
Mo
bile
Ph
on
e T
rack
er,
20
18
Q2

Ap
pe
nd
ix 2
Ta
ble
A2
.1:
Pri
ce-b
an
d w
ise
Nu
mb
ers
Eq
uiv
ale
nt
an
d I
rre
lev
an
t B
ran
ds
Pri
ce B
an
d
Me
asu
re
20
07
2
00
8
20
09
2
01
0
20
11
2
01
2
20
13
2
01
4
20
15
2
01
6
20
17
2
01
8
< $
25
Nu
mb
ers
Eq
uiv
ale
nt
1
6
6
3
5
15
1
1
9
8
7
8
3
Nu
mb
er
of
Irre
leva
nt
Bra
nd
s 5
5
7
1
2
20
1
6
22
2
7
19
1
9
14
1
4
Pro
po
rtio
n o
f Ir
rele
van
t B
ran
ds
76
%
46
%
53
%
79
%
80
%
53
%
67
%
76
%
72
%
73
%
66
%
83
%
$2
5 -
$7
5
Nu
mb
ers
Eq
uiv
ale
nt
3
3
4
7
6
4
5
6
8
9
9
6
Nu
mb
er
of
Irre
leva
nt
Bra
nd
s 1
2
16
2
1
23
2
6
31
2
6
29
2
9
21
2
2
18
Pro
po
rtio
n o
f Ir
rele
van
t B
ran
ds
81
%
86
%
86
%
77
%
80
%
87
%
82
%
83
%
79
%
70
%
70
%
76
%
$7
5 -
$1
00
Nu
mb
ers
Eq
uiv
ale
nt
3
2
2
6
3
3
4
6
5
11
4
4
Nu
mb
er
of
Irre
leva
nt
Bra
nd
s 7
1
4
20
1
7
17
1
5
21
2
5
31
2
2
31
2
2
Pro
po
rtio
n o
f Ir
rele
van
t B
ran
ds
66
%
86
%
90
%
73
%
87
%
85
%
84
%
80
%
85
%
65
%
88
%
86
%
$1
00
- $
12
5
Nu
mb
ers
Eq
uiv
ale
nt
3
2
2
3
2
2
5
7
6
4
7
5
Nu
mb
er
of
Irre
leva
nt
Bra
nd
s 6
1
1
11
1
3
12
1
2
19
2
2
26
2
8
28
2
0
Pro
po
rtio
n o
f Ir
rele
van
t B
ran
ds
67
%
87
%
81
%
82
%
84
%
85
%
81
%
75
%
80
%
86
%
80
%
82
%
$1
25
- $
15
0
Nu
mb
ers
Eq
uiv
ale
nt
2
3
3
3
3
6
7
4
6
6
7
6
Nu
mb
er
of
Irre
leva
nt
Bra
nd
s 6
7
1
1
8
8
9
18
2
0
24
1
8
18
1
5
Pro
po
rtio
n o
f Ir
rele
van
t B
ran
ds
71
%
70
%
81
%
77
%
71
%
63
%
73
%
84
%
80
%
77
%
73
%
72
%
$1
50
- $
17
5
Nu
mb
ers
Eq
uiv
ale
nt
3
2
4
2
3
6
3
6
5
6
4
4
Nu
mb
er
of
Irre
leva
nt
Bra
nd
s 4
1
0
6
6
8
10
1
7
18
1
9
20
2
1
12
Pro
po
rtio
n o
f Ir
rele
van
t B
ran
ds
64
%
80
%
61
%
70
%
76
%
65
%
84
%
76
%
77
%
77
%
84
%
73
%
$1
75
- $
20
0
Nu
mb
ers
Eq
uiv
ale
nt
3
2
3
2
4
2
4
5
6
3
3
4
Nu
mb
er
of
Irre
leva
nt
Bra
nd
s 2
9
6
4
5
8
1
0
16
1
6
16
1
9
12
Pro
po
rtio
n o
f Ir
rele
van
t B
ran
ds
45
%
83
%
66
%
61
%
57
%
78
%
73
%
78
%
73
%
82
%
87
%
76
%
$2
00
- $
30
0
Nu
mb
ers
Eq
uiv
ale
nt
2
2
3
3
5
6
3
5
4
6
4
3
Nu
mb
er
of
Irre
leva
nt
Bra
nd
s 8
1
0
8
9
9
9
15
2
0
21
1
6
20
1
4
Pro
po
rtio
n o
f Ir
rele
van
t B
ran
ds
81
%
82
%
76
%
73
%
67
%
61
%
85
%
81
%
86
%
75
%
82
%
81
%
$3
00
- $
40
0
Nu
mb
ers
Eq
uiv
ale
nt
3
3
1
3
3
3
3
4
5
5
5
3
Nu
mb
er
of
Irre
leva
nt
Bra
nd
s 9
1
1
13
1
1
8
8
8
12
1
2
11
8
7
Pro
po
rtio
n o
f Ir
rele
van
t B
ran
ds
72
%
82
%
91
%
78
%
69
%
70
%
71
%
74
%
71
%
67
%
63
%
67
%
$4
00
- $
50
0
Nu
mb
ers
Eq
uiv
ale
nt
3
2
3
4
4
4
2
5
2
1
3
2
Nu
mb
er
of
Irre
leva
nt
Bra
nd
s 9
1
0
6
6
6
4
7
8
10
9
6
5
Pro
po
rtio
n o
f Ir
rele
van
t B
ran
ds
77
%
83
%
62
%
55
%
60
%
55
%
82
%
58
%
84
%
85
%
68
%
72
%
$5
00
- $
70
0
Nu
mb
ers
Eq
uiv
ale
nt
3
4
4
3
5
1
5
3
3
2
2
3
Nu
mb
er
of
Irre
leva
nt
Bra
nd
s 8
9
7
7
5
6
3
6
6
8
8
5
Pro
po
rtio
n o
f Ir
rele
van
t B
ran
ds
77
%
70
%
68
%
66
%
48
%
79
%
44
%
69
%
69
%
77
%
79
%
61
%
> $
70
0
Nu
mb
ers
Eq
uiv
ale
nt
2
3
3
2
1
1
3
2
2
1
2
2
Nu
mb
er
of
Irre
leva
nt
Bra
nd
s 5
6
1
1
0
2
3
4
5
7
3
3
Pro
po
rtio
n o
f Ir
rele
van
t B
ran
ds
74
%
66
%
27
%
22
%
0%
6
5%
4
8%
6
9%
7
3%
8
2%
6
1%
6
9%
So
urc
e:
A
uth
ors
’ ca
lcu
lati
on
s u
sin
g d
ata
fro
m I
DC
’s Q
ua
rte
rly
Mo
bile
Ph
on
e T
rack
er,
20
18
Q2

Com
petit
ion
Issue
s in
Indi
a’s M
obile
Han
dset
Indu
stry
Ap
pe
nd
ix 3
Se
gm
en
t 1
– F
ea
ture
Ph
on
es,
Ph
ab
lets
an
d R
eg
ula
r S
ma
rtp
ho
ne
s
Ta
ble
A3
.1:
Co
nce
ntr
ati
on
In
dic
es
by
Ty
pe
of
Ph
on
e
Ye
ar
C4
Co
nce
ntr
ati
on
Ra
tio
H
erf
ind
ah
l - H
irsc
hm
an
In
de
x G
ine
vici
us
Ind
ex
GR
S I
nd
ex
En
tro
py
Ind
ex
Fe
atu
re
Ph
on
e
Ph
ab
let
Re
gu
lar
Sm
art
ph
on
e
Fe
atu
re
Ph
on
e
Ph
ab
let
Re
gu
lar
Sm
art
ph
on
e
Fe
atu
re
Ph
on
e
Ph
ab
let
Re
gu
lar
Sm
art
ph
on
e
Fe
atu
re
Ph
on
e
Ph
ab
let
Re
gu
lar
Sm
art
ph
on
e
Fe
atu
re
Ph
on
e
Ph
ab
let
Re
gu
lar
Sma
rtp
ho
ne
20
07
0
.80
0.9
6
0.2
9
0
.70
0
.08
0.2
7
0.4
9
0
.82
1
.70
0.7
4
20
08
0
.85
0.9
1
0.3
8
0
.56
0
.09
0.1
6
0.6
0
0
.74
1
.55
1.0
5
20
09
0
.74
0.9
6
0.2
9
0
.59
0
.05
0.1
6
0.5
1
0
.75
1
.93
0.9
5
20
10
0
.70
0.9
0
0.1
5
0
.38
0
.04
0.0
9
0.2
7
0
.57
2
.34
1.3
8
20
11
0
.75
0.8
6
0.2
0
0
.22
0
.04
0.0
6
0.3
5
0
.34
2
.14
1.7
6
20
12
0
.72
1
.00
0
.74
0
.20
0
.99
0
.26
0
.03
0
.99
0
.04
0
.33
0
.93
0
.47
2
.27
0
.02
1
.92
20
13
0
.75
0
.96
0
.68
0
.19
0
.77
0
.20
0
.04
1
.00
0
.04
0
.36
0
.86
0
.40
2
.16
0
.62
2
.25
20
14
0
.69
0
.68
0
.60
0
.16
0
.15
0
.15
0
.03
0
.95
0
.03
0
.32
0
.30
0
.34
2
.22
2
.32
2
.49
20
15
0
.68
0
.66
0
.60
0
.15
0
.21
0
.14
0
.04
0
.96
0
.02
0
.25
0
.43
0
.32
2
.19
2
.26
2
.62
20
16
0
.68
0
.62
0
.54
0
.16
0
.16
0
.12
0
.04
0
.98
0
.02
0
.33
0
.35
0
.27
2
.19
2
.45
2
.69
20
17
0
.65
0
.73
0
.58
0
.16
0
.18
0
.11
0
.05
0
.94
0
.02
0
.31
0
.33
0
.20
2
.21
2
.16
2
.61
20
18
0
.83
0
.80
0
.65
0
.32
0
.23
0
.13
0
.08
0
.97
0
.03
0
.53
0
.40
0
.24
1
.66
1
.94
2
.41
So
urc
e:
A
uth
ors
’ ca
lcu
lati
on
s u
sin
g I
DC
’s Q
ua
rte
rly
Mo
bile
Ph
on
e T
rack
er,
20
18
Q2
Se
gm
en
t 2
– P
rice
Ba
nd
s
Ta
ble
A3
.2:
Co
nce
ntr
ati
on
In
dic
es
by
Pri
ce B
an
ds
C4
Pri
ce B
an
d
20
07
2
00
8
20
09
2
01
0
20
11
2
01
2
20
13
2
01
4
20
15
2
01
6
20
17
2
01
8
< $
25
0
.99
0
.74
0
.74
0
.81
0
.72
0
.42
0
.52
0
.61
0
.66
0
.67
0
.63
0
.82
$2
5-$
75
0
.78
0
.83
0
.76
0
.66
0
.70
0
.78
0
.78
0
.73
0
.68
0
.61
0
.56
0
.72
$7
5-$
10
0
0.8
7
0.8
6
0.8
0
0.7
5
0.9
1
0.9
4
0.8
3
0.6
7
0.7
0
0.4
9
0.7
8
0.7
8
$1
00
-$1
25
0
.88
0
.94
0
.90
0
.90
0
.97
0
.95
0
.78
0
.64
0
.66
0
.67
0
.66
0
.84
$1
25
-$1
50
0
.98
0
.88
0
.93
0
.97
0
.91
0
.74
0
.66
0
.77
0
.66
0
.71
0
.74
0
.79
$1
50
-$1
75
0
.98
0
.89
0
.90
0
.95
0
.96
0
.79
0
.86
0
.79
0
.70
0
.73
0
.87
0
.81
$1
75
-$2
00
1
.00
0
.90
0
.98
0
.99
0
.92
0
.94
0
.87
0
.69
0
.72
0
.75
0
.85
0
.88
$2
00
-$3
00
0
.96
0
.95
0
.90
0
.92
0
.84
0
.74
0
.86
0
.72
0
.74
0
.73
0
.85
0
.92
$3
00
-$4
00
0
.93
0
.88
0
.97
0
.92
0
.91
0
.88
0
.87
0
.84
0
.78
0
.81
0
.83
0
.97
$4
00
-$5
00
0
.91
0
.92
0
.91
0
.87
0
.94
0
.88
0
.93
0
.81
0
.90
0
.98
0
.98
0
.90
$5
00
-$7
00
0
.95
0
.91
0
.88
0
.88
0
.84
0
.97
0
.87
0
.93
0
.92
0
.97
0
.93
0
.94
> $
70
0
0.9
6
0.9
3
1.0
0
1.0
0
1.0
0
1.0
0
0.9
4
0.9
9
0.9
9
0.9
9
1.0
0
1.0
0

HH
I
Pri
ce B
an
d
20
07
2
00
8
20
09
2
01
0
20
11
2
01
2
20
13
2
01
4
20
15
2
01
6
20
17
2
01
8
< $
25
0
.71
0
.17
0
.17
0
.32
0
.20
0
.07
0
.09
0
.11
0
.13
0
.14
0
.13
0
.35
$2
5-$
75
0
.35
0
.38
0
.28
0
.14
0
.15
0
.22
0
.18
0
.17
0
.13
0
.11
0
.11
0
.18
$7
5-$
10
0
0.3
0
0.4
3
0.4
6
0.1
6
0.3
8
0.3
6
0.2
5
0.1
6
0.1
8
0.0
9
0.2
3
0.2
8
$1
00
-$1
25
0
.34
0
.60
0
.41
0
.34
0
.44
0
.49
0
.22
0
.14
0
.16
0
.23
0
.14
0
.22
$1
25
-$1
50
0
.43
0
.34
0
.38
0
.39
0
.31
0
.18
0
.15
0
.26
0
.16
0
.18
0
.15
0
.17
$1
50
-$1
75
0
.39
0
.41
0
.25
0
.42
0
.38
0
.18
0
.31
0
.18
0
.18
0
.17
0
.25
0
.23
$1
75
-$2
00
0
.36
0
.53
0
.32
0
.42
0
.26
0
.46
0
.27
0
.21
0
.17
0
.29
0
.35
0
.26
$2
00
-$3
00
0
.53
0
.45
0
.38
0
.31
0
.22
0
.17
0
.36
0
.22
0
.28
0
.18
0
.23
0
.32
$3
00
-$4
00
0
.30
0
.40
0
.78
0
.33
0
.29
0
.30
0
.31
0
.24
0
.20
0
.19
0
.21
0
.30
$4
00
-$5
00
0
.36
0
.49
0
.29
0
.22
0
.25
0
.28
0
.63
0
.18
0
.53
0
.67
0
.35
0
.52
$5
00
-$7
00
0
.39
0
.26
0
.28
0
.29
0
.19
0
.69
0
.22
0
.36
0
.36
0
.43
0
.48
0
.32
> $
70
0
0.5
5
0.3
3
0.3
4
0.4
3
1.0
0
0.9
4
0.3
2
0.5
4
0.5
2
0.6
9
0.5
2
0.6
4
Gin
evi
ciu
s In
de
x
Pri
ce B
an
d
20
07
2
00
8
20
09
2
01
0
20
11
2
01
2
20
13
2
01
4
20
15
2
01
6
20
17
2
01
8
< $
25
0
.44
0
.10
0
.08
0
.10
0
.05
0
.03
0
.03
0
.03
0
.04
0
.04
0
.05
0
.09
$2
5-$
75
0
.10
0
.09
0
.06
0
.04
0
.04
0
.04
0
.04
0
.03
0
.03
0
.04
0
.03
0
.05
$7
5-$
10
0
0.1
3
0.1
2
0.1
0
0.0
5
0.0
8
0.0
8
0.0
5
0.0
4
0.0
3
0.0
3
0.0
4
0.0
5
$1
00
-$1
25
0
.16
0
.21
0
.13
0
.09
0
.12
0
.14
0
.05
0
.04
0
.04
0
.04
0
.03
0
.05
$1
25
-$1
50
0
.20
0
.14
0
.11
0
.13
0
.12
0
.08
0
.05
0
.06
0
.04
0
.05
0
.05
0
.05
$1
50
-$1
75
0
.21
0
.14
0
.12
0
.19
0
.13
0
.07
0
.07
0
.05
0
.05
0
.05
0
.05
0
.08
$1
75
-$2
00
0
.25
0
.20
0
.14
0
.23
0
.13
0
.18
0
.09
0
.06
0
.05
0
.08
0
.07
0
.08
$2
00
-$3
00
0
.21
0
.15
0
.14
0
.11
0
.09
0
.08
0
.09
0
.05
0
.06
0
.05
0
.05
0
.08
$3
00
-$4
00
0
.11
0
.12
0
.34
0
.10
0
.12
0
.12
0
.13
0
.08
0
.07
0
.07
0
.09
0
.13
$4
00
-$5
00
0
.12
0
.17
0
.14
0
.12
0
.12
0
.15
0
.29
0
.09
0
.19
0
.29
0
.15
0
.27
$5
00
-$7
00
0
.14
0
.10
0
.12
0
.13
0
.11
0
.40
0
.14
0
.16
0
.15
0
.16
0
.19
0
.16
> $
70
0
0.2
8
0.1
5
0.2
8
0.3
8
1.0
0
0.9
0
0.2
0
0.3
1
0.2
5
0.3
6
0.3
2
0.4
0
GR
S I
nd
ex
Pri
ce B
an
d
20
07
2
00
8
20
09
2
01
0
20
11
2
01
2
20
13
2
01
4
20
15
2
01
6
20
17
2
01
8
< $
25
0
.82
0
.23
0
.24
0
.53
0
.38
0
.15
0
.16
0
.18
0
.18
0
.26
0
.25
0
.57
$2
5-$
75
0
.57
0
.60
0
.50
0
.28
0
.30
0
.38
0
.32
0
.32
0
.19
0
.17
0
.19
0
.34
$7
5-$
10
0
2.0
8
1.5
7
1.4
9
3.8
5
1.9
1
2.2
1
2.3
8
3.6
0
3.0
6
6.5
8
2.6
7
2.0
7
$1
00
-$1
25
0
.54
0
.76
0
.61
0
.43
0
.52
0
.64
0
.38
0
.28
0
.32
0
.44
0
.26
0
.36
$1
25
-$1
50
7
.92
9
.95
1
3.9
4
10
.94
1
0.9
6
14
.98
2
4.9
9
23
.96
2
9.9
8
23
.98
2
4.9
9
20
.99
$1
50
-$1
75
0
.57
0
.61
0
.40
0
.59
0
.45
0
.26
0
.50
0
.28
0
.36
0
.31
0
.40
0
.37
$1
75
-$2
00
0
.49
0
.71
0
.40
0
.48
0
.33
0
.65
0
.43
0
.42
0
.31
0
.51
0
.56
0
.35
$2
00
-$3
00
0
.70
0
.63
0
.58
0
.49
0
.33
0
.28
0
.57
0
.42
0
.51
0
.35
0
.37
0
.50
$3
00
-$4
00
0
.40
0
.60
0
.87
0
.50
0
.45
0
.49
0
.51
0
.40
0
.37
0
.29
0
.32
0
.43
$4
00
-$5
00
0
.54
0
.67
0
.43
0
.35
0
.34
0
.45
0
.78
0
.28
0
.71
0
.80
0
.45
0
.70
$5
00
-$7
00
0
.57
0
.39
0
.45
0
.47
0
.23
0
.81
0
.31
0
.51
0
.48
0
.52
0
.66
0
.47
> $
70
0
0.7
1
0.4
9
0.4
4
0.5
8
1.0
0
0.9
2
0.4
0
0.7
0
0.6
5
0.8
1
0.6
5
0.7
5

Com
petit
ion
Issue
s in
Indi
a’s M
obile
Han
dset
Indu
stry
En
tro
py
Ind
ex
Pri
ce B
an
d
20
07
2
00
8
20
09
2
01
0
20
11
2
01
2
20
13
2
01
4
20
15
2
01
6
20
17
2
01
8
< $
25
0
.63
1
.92
1
.94
1
.63
2
.14
2
.96
2
.74
2
.45
2
.28
2
.26
2
.29
1
.60
$2
5-$
75
1
.62
1
.58
1
.95
2
.39
2
.33
2
.07
2
.08
2
.18
2
.37
2
.49
2
.47
2
.14
$7
5-$
10
0
1.5
6
1.4
0
1.4
8
2.1
7
1.3
3
1.2
9
1.8
5
2.3
0
2.2
3
2.7
1
2.0
0
1.8
4
$1
00
-$1
25
1
.46
0
.95
1
.36
1
.42
1
.04
1
.04
1
.98
2
.41
2
.33
2
.15
2
.42
1
.89
$1
25
-$1
50
1
.13
1
.47
1
.33
1
.15
1
.44
1
.98
2
.38
1
.94
2
.31
2
.16
2
.16
2
.06
$1
50
-$1
75
1
.20
1
.35
1
.60
1
.19
1
.22
1
.89
1
.66
2
.07
2
.19
2
.04
1
.74
1
.59
$1
75
-$2
00
1
.14
1
.10
1
.23
1
.00
1
.49
1
.18
1
.65
2
.11
2
.16
1
.83
1
.61
1
.62
$2
00
-$3
00
0
.99
1
.15
1
.39
1
.48
1
.76
1
.98
1
.53
2
.14
1
.95
2
.15
1
.85
1
.47
$3
00
-$4
00
1
.43
1
.36
0
.56
1
.42
1
.52
1
.58
1
.55
1
.75
1
.91
1
.99
1
.84
1
.39
$4
00
-$5
00
1
.37
1
.11
1
.50
1
.69
1
.18
1
.55
0
.90
1
.93
1
.13
0
.72
1
.24
1
.10
$5
00
-$7
00
1
.25
1
.59
1
.56
1
.55
1
.73
0
.72
1
.67
1
.33
1
.32
1
.04
1
.12
1
.39
> $
70
0
0.9
8
1.3
9
1.1
5
0.9
7
0.0
0
0.0
9
1.3
3
0.8
8
0.8
1
0.6
3
0.8
2
0.6
0
So
urc
e:
A
uth
ors
’ ca
lcu
lati
on
s u
sin
g I
DC
’s Q
ua
rte
rly
Mo
bile
Ph
on
e T
rack
er,
20
18
Q2
Se
gm
en
t 3
– T
ech
no
log
y G
en
era
tio
ns
Ta
ble
A3
.3:
Co
nce
ntr
ati
on
In
dic
es
by
Te
chn
olo
gy
Ge
ne
rati
on
Ye
ar
C4
Co
nce
ntr
ati
on
Ra
tio
H
erf
ind
ah
l - H
irsc
hm
an
In
de
x G
ine
vici
us
Ind
ex
GR
S I
nd
ex
En
tro
py
Ind
ex
2G
2
.5G
3
G
4G
2
G
2.5
G
3G
4
G
2G
2
.5G
3
G
4G
2
G
2.5
G
3G
4
G
2G
2
.5G
3
G
4G
20
07
0
.94
0
.77
0
.99
0.6
4
0.2
4
0.7
1
0.2
5
0.0
5
0.3
6
0.7
9
0.4
0
0.8
2
0.8
9
1.8
5
0.6
4
2
00
8
0.9
4
0.8
1
0.9
5
0.6
1
0.3
2
0.6
1
0.2
1
0.0
6
0.2
0
0.7
7
0.5
2
0.7
6
0.9
3
1.7
5
0.9
0
2
00
9
0.9
5
0.6
9
0.9
5
0.6
7
0.2
2
0.5
2
0.2
2
0.0
4
0.1
5
0.8
0
0.4
3
0.7
0
0.8
3
2.2
0
1.0
5
2
01
0
0.8
5
0.6
9
0.8
7
0.4
8
0.1
4
0.2
7
0.0
9
0.0
4
0.0
7
0.6
8
0.2
2
0.4
5
1.3
6
2.4
0
1.6
3
2
01
1
0.9
2
0.7
0
0.8
7
0.4
9
0.1
7
0.2
4
0.1
0
0.0
3
0.0
6
0.6
8
0.2
8
0.3
7
1.2
4
2.3
1
1.6
9
2
01
2
0.7
5
0.6
9
0.8
1
1.0
0
0.2
7
0.1
7
0.3
0
0.9
0
0.0
5
0.0
3
0.0
5
0.8
3
0.4
8
0.2
6
0.5
1
0.9
0
1.9
6
2.4
1
1.7
4
0.2
1
20
13
0
.75
0
.73
0
.78
0
.91
0
.22
0
.15
0
.26
0
.31
0
.05
0
.03
0
.04
0
.18
0
.36
0
.23
0
.48
0
.43
2
.06
2
.29
2
.00
1
.40
20
14
0
.75
0
.66
0
.62
0
.84
0
.22
0
.13
0
.15
0
.26
0
.04
0
.03
0
.03
0
.09
0
.39
0
.20
0
.33
0
.36
1
.99
2
.33
2
.47
1
.72
20
15
0
.87
0
.65
0
.58
0
.72
0
.30
0
.13
0
.11
0
.23
0
.05
0
.03
0
.03
0
.03
0
.44
0
.21
0
.23
0
.43
1
.59
2
.28
2
.66
2
.14
20
16
0
.73
0
.67
0
.59
0
.59
0
.19
0
.15
0
.11
0
.14
0
.05
0
.05
0
.03
0
.03
0
.35
0
.28
0
.22
0
.32
2
.05
2
.22
2
.55
2
.52
20
17
0
.79
0
.72
0
.65
0
.65
0
.20
0
.20
0
.17
0
.14
0
.06
0
.06
0
.06
0
.02
0
.33
0
.38
0
.36
0
.27
1
.93
2
.08
2
.26
2
.46
20
18
0
.84
0
.75
0
.99
0
.70
0
.21
0
.19
0
.41
0
.17
0
.08
0
.07
0
.26
0
.03
0
.30
0
.34
0
.51
0
.31
1
.83
2
.03
1
.05
2
.27
So
urc
e:
A
uth
ors
’ ca
lcu
lati
on
s u
sin
g I
DC
’s Q
ua
rte
rly
Mo
bile
Ph
on
e T
rack
er,
20
18
Q2

Appendix 4
FigureA4.1: Number of Phone Models across Technology Generations
Source: Compiled by authors using data from IDC’s Quarterly Mobile Phone Tracker, 2018Q2
2010 2011 2012 2013 2014 2015 2016 2017 2018
2.5G 16 10 26 108 238 158 48 10
3G 102 160 226 350 503 686 404 136 7
4G 4 22 55 230 441 552 329
Total 118 170 256 480 796 1074 893 698 336
118
170
256
480
796
1074
893
698
336
0
200
400
600
800
1000
1200

Competition Issues in India’s Mobile Handset Industry
Table A4.1: Brand – Wise Number of Models for 2.5G Technology
Brand 2007 2008 2009 2010 2011 2012 2013 2014 2015 2016 2017 2018
10.or
Acer
Airfone
Alcatel 1
Apple
Aroma
ASUS
BenQ Siemens
Bird
Blackberry 4 3 2 1 1 1
Bleu
Bloom 2
Byond 1 5 1
Carlvo
Celkon 4 16 16 6 3
Classic
Comio
Coolpad
Curitel
Dallab
Datawind 1 2 1
Dell
DoPod
E-Ten
Fly 6 2
Forme 2 2
Garmin
G-Five 2
Gigabyte
Gild
Gionee
GLX
Gnine
Haier
Hi-Tech 6 9 4 1
Honor
HP 1
HTC 3
Huawei
iBall 4 11 26 8
Idea Cellular
i-Mate
Infinix
Infocus
Intex 3 12 50 33 8
Itel
Karbonn 1 11 33 18 7 3
Kechao
Kenxindia 1 1 2
Krome
Kyocera
Lava 5 17 9 2
LeEco
Lemon 1 2
Lenovo 1
Lephone
LG Electronics
Lyf
Maxx 1 1 1 5 2
Meizu
Micromax 1 4 12 21 16 6
Microsoft
Mio

Mobiistar
Motorola 1
MTS
MWG
Nokia 3 3 2 1
Nubia
O2
Obi
Olive
OnePlus
Onida 4 1
Oppo
Palm
Panasonic 3 2
Pantech
QiKU
RealMe
Rocker
Sagem
Samsung 2 2 1 2 3 5
Siemens
Simputer (Encore)
Sony
Sony Ericsson
Spektra
Spice 1 1 7 17 12 7
Swipe 2
Tata Indicom
TCL
Tecno
Usha-Lexus
Videocon 1 10 14 6 4
Virgin Mobile
Vivo
Vodafone
VOTO
Xiaomi
XOLO 1
YU
Yxtel 2 5 4 7 4 2
Zen 3 12 9
ZTE
ZUK
Total 16 10 26 108 238 158 48 10 0
Source: Compiled by authors using data from IDC’s Quarterly Mobile Phone Tracker, 2018Q2

Competition Issues in India’s Mobile Handset Industry
Table A4.2: Brand – Wise Number of Models for 3G Technology
Brand 2007 2008 2009 2010 2011 2012 2013 2014 2015 2016 2017 2018
10.or
Acer 4 8 3 2 2 1
Airfone
Alcatel 4 13 16 7
Apple 3 3 3 2 3 3
Aroma
ASUS 1 1 4 5 2 1
BenQ Siemens
Bird
Blackberry 16 25 19 8 7 6
Bleu
Bloom 1 4
Byond 1 5 1
Carlvo
Celkon 9 23 26 38 28 4 1
Classic
Comio
Coolpad 1 1 2 1
Curitel
Dallab
Datawind 2 3 3 1
Dell 3 3
DoPod
E-Ten
Fly 1 2 6 1 6
Forme 1 4
Garmin 4 1
G-Five 4 6 3 2
Gigabyte
Gild
Gionee 12 20 18 17 5 1
GLX 1 1
Gnine
Haier
Hi-Tech 1 3 4 13 6 3
Honor 1 2 4 1
HP 1 1
HTC 16 19 25 22 14 13 4 2
Huawei 2 8 7 12 11 6 1
iBall 6 7 32 14
Idea Cellular 1
i-Mate
Infinix
Infocus 3 1
Intex 2 8 23 86 63 20
Itel 9 7 2
Karbonn 1 11 32 56 52 24 13
Kechao
Kenxindia 1 15 8 10
Krome
Kyocera
Lava 1 4 19 30 51 34 12
LeEco
Lemon 2 5 4 3
Lenovo 20 22 6 2
Lephone
LG Electronics 4 9 11 12 15 9 1
Lyf
Maxx 3 9
Meizu
Micromax 1 5 15 29 52 82 62 12
Microsoft 1 7 5
Mio

Brand 2007 2008 2009 2010 2011 2012 2013 2014 2015 2016 2017 2018
Mobiistar
Motorola 3 5 7 1 3 4 1
MTS 1
MWG
Nokia 23 23 23 15 13 1
Nubia
O2
Obi
Olive 1
OnePlus
Onida 1 3 6
Oppo 5 8 1 1
Palm
Panasonic 3 11 16 13 8
Pantech
QiKU
RealMe
Rocker
Sagem
Samsung 11 24 28 23 25 24 7 1
Siemens
Simputer (Encore)
Sony 12 16 17 13 2
Sony Ericsson 9 17 10
Spektra
Spice 1 4 9 11 20 30 26
Swipe 9 7 6 2
Tata Indicom
TCL
Tecno
Usha-Lexus
Videocon 10 10 33 36 23 1
Virgin Mobile
Vivo 7 4 1
Vodafone
VOTO
Xiaomi 2 3
XOLO 1 14 46 30 4
YU
Yxtel 1 2
Zen 1 18 16 4
ZTE 2 8 7 6 3
ZUK
Total 102 160 226 350 503 686 404 136 7
Source: Compiled by authors using data from IDC’s Quarterly Mobile Phone Tracker 2018Q2
Table A4.3: Brand – Wise Number of Models for 4G Technology
Brand 2007 2008 2009 2010 2011 2012 2013 2014 2015 2016 2017 2018
10.or 3 3
Acer 2 2 2
Airfone
Alcatel 2 6 6 2
Apple 1 3 4 7 8 10 9
Aroma
ASUS 5 10 13 10
BenQ Siemens
Bird
Blackberry 3 4 7 3 4 1
Bleu
Bloom
Byond
Carlvo
Celkon 5 10 9

Competition Issues in India’s Mobile Handset Industry
Brand 2007 2008 2009 2010 2011 2012 2013 2014 2015 2016 2017 2018
Classic
Comio 4 8
Coolpad 4 9 13 10
Curitel
Dallab
Datawind 1
Dell
DoPod
E-Ten
Fly
Forme
Garmin
G-Five
Gigabyte
Gild
Gionee 8 17 17 14
GLX
Gnine
Google 2 4 2
Haier
Hi-Tech 1 5
Honor 1 4 9 15 8
HP
HTC 4 4 15 14 8 3
Huawei 1 1 1 3 3 2
iBall 2 4
Idea Cellular
i-Mate
Infinix 4 5
Infocus 9 11 13 7
Intex 11 38 48 15
Itel 2 11 12
Karbonn 1 8 19 14
Kechao
Kenxindia 2
Krome
Kyocera
Lava 3 22 21 7
LeEco 5 2
Lemon
Lenovo 2 18 29 18 3
Lephone
LG Electronics 3 8 12 12 14 4
Lyf 5 31 6 1
Maxx
Meizu 4 3 4
Micromax 14 29 44 23
Microsoft 3 4
Mio
Mobiistar 2
Motorola 2 10 14 15 12
MTS
MWG
Nokia 2 6 8 1 5 9
Nubia 1 3 10
O2
Obi 1 1 1
Olive
OnePlus 1 3 5 3 2
Onida 1
Oppo 4 6 7 11 12
Palm
Panasonic 7 19 33 11
Pantech
QiKU 1 1
RealMe 1

Brand 2007 2008 2009 2010 2011 2012 2013 2014 2015 2016 2017 2018
Rocker
Sagem
Samsung 10 23 37 38 37
Siemens
Simputer (Encore)
Sony 2 5 10 12 12 2
Sony Ericsson
Spektra
Spice 1 4 5
Swipe 1 5 15 9
Tata Indicom
TCL 2 2
Tecno 5 9
Usha-Lexus
Videocon 1 10 7 5
Virgin Mobile
Vivo 6 8 15 17
Vodafone
VOTO 3 1
Xiaomi 1 5 10 14 14
XOLO 3 8 6 1
YU 5 7 8
Yxtel
Zen 3 18 6
ZTE 5 5 2
ZUK 2 1
Total 0 0 0 0 0 4 22 55 230 441 552 329
Source: Compiled by authors using data from IDC’s Quarterly Mobile Phone Tracker, 2018Q2

Com
petit
ion
Issue
s in
Indi
a’s M
obile
Han
dset
Indu
stry
Ap
pe
nd
ix 5
Ta
ble
A5
.1:
Bra
nd
– W
ise
In
du
stry
Ch
urn
An
aly
sis
Bra
nd
2
00
7
20
08
2
00
9
20
10
2
01
1
20
12
2
01
3
20
14
2
01
5
20
16
2
01
7
20
18
10
.or
4
4
Ace
r
2
.5,
3
3
3
3
3
3
, 4
3
, 4
4
Air
fon
e
2.5
Alc
ate
l
2.5
, 3
2
, 2
.5,
3
2,
2.5
, 3
2
, 2
.5,
3,
4
4
4
4
Ap
ple
3
3
3
3
3,
4
3,
4
3,
4
3,
4
4
4
4
Aro
ma
2,
2.5
2
, 2
.5
AS
US
3
2.5
, 3
2
.5,
3
3
3
3
3,
4
3,
4
3,
4
4
Be
nQ
Sie
me
ns
2.5
, 2
Bir
d
2
Bla
ckb
err
y
2.5
, 3
2
.5,
3
2.5
, 3
2
.5,
3
2.5
, 3
2
.5,
3
2.5
, 3
, 4
2
.5,
3,
4
2.5
, 3
, 4
4
4
4
Ble
u
2.5
, 2
Blo
om
2.5
2
.5
2,
2.5
, 3
2
, 2
.5,
3
Byo
nd
2,
2.5
, 3
2
, 2
.5,
3
2,
2.5
, 3
Ca
rlvo
2
.5
2,
2.5
2
, 2
.5
2,
2.5
2
2
, 2
.5
Ce
lko
n
2,
2.5
2
, 2
.5,
3
2,
2.5
, 3
2
, 2
.5,
3
2,
2.5
, 3
2
, 2
.5,
3,
4
2,
2.5
, 3
, 4
2
, 2
.5,
3,
4
Cla
ssic
2
.5,
2
2.5
2
.5
Co
mio
4
4
Co
olp
ad
2.5
2
.5
2.5
, 3
2
.5
3
3
3
4
4
4
4
Da
taw
ind
3
2.5
, 3
2
, 2
.5,
3
2,
2.5
, 3
, 4
De
ll
3
3
Do
Po
d
2.5
E-T
en
2
.5
2.5
Fly
2
.5
2.5
, 2
2
.5,
2
2,
2.5
, 3
2
, 2
.5
2,
2.5
, 3
2
, 2
.5,
3
2,
2.5
, 3
2
.5,
3
Fo
rme
2,
2.5
2
.5
2,
2.5
2
, 2
.5
2,
2.5
, 3
2
, 2
.5,
3
2,
2.5
2
, 2
.5
2,
2.5
Ga
rmin
3
3
3
G-F
ive
2
.5
2,
2.5
2
, 2
.5
2,
2.5
, 3
2
, 2
.5,
3
2,
2.5
, 3
2
, 2
.5,
3
Gig
ab
yte
2
.5,
3
Gild
2,
2.5
2
, 2
.5
2,
2.5
2
, 2
.5
2,
2.5
Gio
ne
e
2.5
, 3
2
, 2
.5,
3
2.5
, 3
, 4
2
.5,
3,
4
2.5
, 3
, 4
2
.5,
3,
4
GLX
2,
2.5
, 3
2
, 2
.5,
3
2.5
2.5
Gn
ine
2,
2.5
2
, 2
.5
2,
2.5
Go
og
le
4
4
4
Ha
ier
2.5
, 2
2
.5,
2
2.5
, 2
2
, 2
.5
2,
2.5
Hi-
Te
ch
2
, 2
.5
2,
2.5
2
, 2
.5,
3
2,
2.5
, 3
2
, 2
.5,
3
2,
2.5
, 3
2
, 2
.5,
3,
4
2,
2.5
, 3
, 4
2
, 2
.5
Ho
no
r
3
3
, 4
3
, 4
3
, 4
4
4
HP
2
.5
2.5
, 3
3
2
.5
3
3
HT
C
2.5
, 3
2
.5,
3
2.5
, 3
2
.5,
3
3
3
3,
4
3,
4
3,
4
3,
4
3,
4
4

Bra
nd
2
00
7
20
08
2
00
9
20
10
2
01
1
20
12
2
01
3
20
14
2
01
5
20
16
2
01
7
20
18
Hu
aw
ei
2.5
2
.5,
2
2.5
, 2
, 3
2
, 2
.5,
3
2,
2.5
, 3
2
, 2
.5,
3,
4
2.5
, 3
, 4
2
.5,
3,
4
2.5
, 3
, 4
3
, 4
4
iBa
ll
2
, 2
.5
2,
2.5
, 3
2
, 2
.5,
3
2,
2.5
, 3
, 4
2
, 2
.5,
3,
4
2,
2.5
2
, 2
.5
Ide
a C
ellu
lar
3
i-M
ate
2
.5,
3
2.5
, 3
2
.5
Infi
nix
4
4
Info
cus
2,
2.5
, 3
, 4
2
, 2
.5,
3,
4
2,
2.5
, 4
2
, 2
.5,
4
Inte
x
2.5
, 2
2
.5,
2
2,
2.5
2
, 2
.5,
3
2,
2.5
, 3
2
, 2
.5,
3
2,
2.5
, 3
2
, 2
.5,
3,
4
2,
2.5
, 3
, 4
2
, 2
.5,
3,
4
2,
2.5
, 4
ite
l
2,
2.5
, 3
, 4
2
, 2
.5,
3,
4
2,
2.5
, 3
, 4
Ka
rbo
nn
2
.5,
2
2,
2.5
2
, 2
.5,
3
2,
2.5
, 3
2
, 2
.5,
3
2,
2.5
, 3
2
, 2
.5,
3,
4
2,
2.5
, 3
, 4
2
, 2
.5,
3,
4
2,
2.5
, 4
Ke
cha
o
2
.5
2.5
2
, 2
.5,
3
2,
2.5
2
, 2
.5
Ke
nxi
nd
a
2
, 2
.5
2,
2.5
2
, 2
.5,
3
2,
2.5
, 3
2
, 2
.5,
3
2,
2.5
, 3
, 4
Kyo
cera
2
.5
2
.5
Lava
2
.5
2,
2.5
2
, 2
.5,
3
2,
2.5
, 3
2
, 2
.5,
3
2,
2.5
, 3
2
, 2
.5,
3,
4
2,
2.5
, 3
, 4
2
, 2
.5,
3,
4
2,
2.5
, 4
LeE
co
4
4
Lem
on
2
.5
2.5
, 3
2
, 2
.5
2,
2.5
, 3
2
.5,
3
2,
2.5
, 3
2
, 2
.5,
3
2,
2.5
2
, 2
.5
2,
2.5
Len
ovo
3
3
, 4
2
.5,
3,
4
3,
4
4
4
Lep
ho
ne
2
.5
2,
2.5
2
.5
2.5
LG E
lect
ron
ics
2.5
, 2
2
.5,
2,
3
2,
2.5
, 3
2
, 2
.5,
3
2.5
, 3
2
.5,
3
2,
2.5
, 3
, 4
2
, 2
.5,
3,
4
3,
4
3,
4
4
4
Lyf
4
4
4
4
Ma
xx
2,
2.5
2
, 2
.5
2,
2.5
2
, 2
.5
2,
2.5
, 3
2
, 2
.5,
3
2,
2.5
2
, 2
.5
2,
2.5
Me
izu
4
4
4
Mic
rom
ax
2
.5
2.5
, 3
2
, 2
.5,
3
2,
2.5
, 3
2
, 2
.5,
3
2,
2.5
, 3
2
, 2
.5,
3
2,
2.5
, 3
, 4
2
, 2
.5,
3,
4
2,
2.5
, 3
, 4
2
, 2
.5,
4
Mic
roso
ft
3
3
, 4
3
, 4
Mio
2
.5
Mo
biis
tar
4
Mo
toro
la
2.5
, 2
, 3
2
.5,
2,
3
2,
2.5
, 3
2
, 2
.5,
3
2,
2.5
, 3
2
.5,
3
3
2,
3,
4
3,
4
3,
4
4
4
MT
S
2
.5
2.5
2
.5
3
MW
G
3
No
kia
2
.5,
2,
3
2.5
, 2
, 3
2
, 2
.5,
3
2,
2.5
, 3
2
, 2
.5,
3
2,
2.5
, 3
, 4
2
, 2
.5,
3,
4
2,
2.5
, 3
, 4
2
, 2
.5,
3,
4
2,
2.5
2
, 2
.5,
4
2,
2.5
, 4
nu
bia
4
4
4
O2
2
.5,
3
2.5
, 3
Ob
i
4
4
4
Oliv
e
2
, 2
.5
2.5
, 3
2
.5
2,
2.5
2
, 2
.5
On
eP
lus
4
4
4
4
4
On
ida
2.5
2
.5
2.5
, 3
2
, 2
.5,
3
2.5
2
.5
2,
2.5
, 3
2
, 2
.5,
3,
4
2.5
OP
PO
3,
4
3,
4
3,
4
3,
4
4
Pa
lm
2.5
, 3
2
.5,
3
Pa
na
son
ic
3
2,
2.5
, 3
2
, 2
.5,
3,
4
2,
3,
4
2,
3,
4
4
QiK
U
4
4
Re
al M
e
4
Ro
cke
r
2,
2.5
2
.5
2,
2.5
Sa
ge
m
2.5
, 2
2
.5,
2

Com
petit
ion
Issue
s in
Indi
a’s M
obile
Han
dset
Indu
stry
Bra
nd
2
00
7
20
08
2
00
9
20
10
2
01
1
20
12
2
01
3
20
14
2
01
5
20
16
2
01
7
20
18
Sa
msu
ng
2
.5
2.5
, 2
, 3
2
, 2
.5,
3
2,
2.5
, 3
2
, 2
.5,
3
2,
2.5
, 3
2
, 2
.5,
3
2,
2.5
, 3
, 4
2
, 2
.5,
3,
4
2,
2.5
, 3
, 4
2
, 2
.5,
3,
4
2,
2.5
, 4
So
ny
3
3
, 4
3
, 4
3
, 4
3
, 4
4
4
So
ny
Eri
csso
n
2.5
, 2
, 3
2
.5,
2,
3
2,
2.5
, 3
2
, 2
.5,
3
2.5
, 3
2
.5,
3
Sp
ice
2
.5,
2
2.5
, 2
2
, 2
.5
2,
2.5
, 3
2
, 2
.5,
3
2,
2.5
, 3
2
, 2
.5,
3
2,
2.5
, 3
2
, 2
.5,
3,
4
2,
2.5
, 3
2
.5,
4
2.5
, 4
Sw
ipe
2
.5,
3,
4
3,
4
3,
4
3,
4
Ta
ta I
nd
ico
m
2
.5
2.5
2.5
TC
L
4
4
Te
cno
4
4
Ush
a-L
exu
s 2
.5,
2
2.5
, 2
2
.5
2,
2.5
Vid
eo
con
2
, 2
.5
2,
2.5
2
, 2
.5,
3
2,
2.5
, 3
2
, 2
.5,
3,
4
2,
2.5
, 3
, 4
2
, 2
.5,
3,
4
2.5
, 3
, 4
Vir
gin
Mo
bile
2.5
2
.5
2.5
vivo
3
, 4
3
, 4
3
, 4
4
Vo
da
fon
e
2
2.5
, 2
2
, 2
.5
2
2,
2.5
VO
TO
4
4
Xia
om
i
3,
4
3,
4
4
4
4
XO
LO
3
3
2
.5,
3
3,
4
3,
4
4
4
YU
4
4
4
Yxt
el
2
, 2
.5
2,
2.5
2
, 2
.5
2,
2.5
2
, 2
.5,
3
2,
2.5
, 3
Ze
n
2.5
2
, 2
.5
2.5
2
.5
2,
2.5
2
, 2
.5,
3
2,
2.5
, 3
2
, 2
.5,
3,
4
2,
2.5
, 3
, 4
2
, 2
.5,
4
ZT
E
2.5
2
.5
2,
2.5
2
, 2
.5,
3
2.5
, 3
2
, 2
.5,
3
2,
2.5
, 3
2
, 2
.5,
3
2,
2.5
, 3
, 4
4
4
ZU
K
4
4
So
urc
e:
C
om
pile
d b
y a
uth
ors
usi
ng
da
ta f
rom
ID
C’s
Qu
art
erl
y M
ob
ile
Ph
on
e T
rack
er,
20
18
Q2
.
Ta
ble
A5
.1.1
: C
olo
ur
Co
de
s
E
xit
E
ntr
y
C
on
tin
uin
g
No
te:
T
he
nu
mb
ers
in t
he
bo
xes
rep
rese
nt
the
te
chn
olo
gy
ge
ne
rati
on
of
the
ma
rke
t se
gm
en
t w
he
re e
ntr
y/e
xit/
con
tin
uin
g s
ale
s to
ok p
lace

Appendix 6
Table A6.1: Brand – wise churn of 2.5G Technology Generation
Brand 2007 2008 2009 2010 2011 2012 2013 2014 2015 2016 2017 2018
10.or
Acer
Airfone
Alcatel
Apple
Aroma
ASUS
BenQ Siemens
Bird
Blackberry
Bleu
Bloom
Byond
Carlvo
Celkon
Classic
Comio
Coolpad
Curitel
Dallab
Datawind
Dell
DoPod
E-Ten
Fly
Forme
Garmin
G-Five
Gigabyte
Gild
Gionee
GLX
Gnine
Haier
Hi-Tech
Honor
HP
HTC
Huawei
iBall
Idea Cellular
i-Mate
Infinix
Infocus
Intex
Itel
Karbonn
Kechao
Kenxindia
Krome
Kyocera
Lava
LeEco
Lemon
Lenovo
Lephone
LG Electronics
Lyf
Maxx
Meizu

Competition Issues in India’s Mobile Handset Industry
Brand 2007 2008 2009 2010 2011 2012 2013 2014 2015 2016 2017 2018
Micromax
Microsoft
Mio
Mobiistar
Motorola
MTS
MWG
Nokia
Nubia
O2
Obi
Olive
OnePlus
Onida
Oppo
Palm
Panasonic
Pantech
QiKU
RealMe
Rocker
Sagem
Samsung
Siemens
Simputer (Encore)
Sony
Sony Ericsson
Spektra
Spice
Swipe
Tata Indicom
TCL
Tecno
Usha-Lexus
Videocon
Virgin Mobile
Vivo
Vodafone
VOTO
Xiaomi
XOLO
YU
Yxtel
Zen
ZTE
ZUK
Source: Compiled by authors using data from IDC’s Quarterly Mobile Phone Tracker, 2018Q2
Table A6.2: Brand – wise Churn for 2G Technology Generation
Company 2007 2008 2009 2010 2011 2012 2013 2014 2015 2016 2017 2018
10.or
Acer
Airfone
Alcatel
Apple
Aroma
ASUS
BenQ Siemens
Bird
Blackberry
Bleu
Bloom
Byond

Company 2007 2008 2009 2010 2011 2012 2013 2014 2015 2016 2017 2018
Carlvo
Celkon
Classic
Comio
Coolpad
Curitel
Dallab
Datawind
Dell
DoPod
E-Ten
Fly
Forme
Garmin
G-Five
Gigabyte
Gild
Gionee
GLX
Gnine
Haier
Hi-Tech
Honor
HP
HTC
Huawei
iBall
Idea Cellular
i-Mate
Infinix
Infocus
Intex
Itel
Karbonn
Kechao
Kenxindia
Krome
Kyocera
Lava
LeEco
Lemon
Lenovo
Lephone
LG Electronics
Lyf
Maxx
Meizu
Micromax
Microsoft
Mio
Mobiistar
Motorola
MTS
MWG
Nokia
Nubia
O2
Obi
Olive
OnePlus
Onida
Oppo
Palm
Panasonic
Pantech

Competition Issues in India’s Mobile Handset Industry
Company 2007 2008 2009 2010 2011 2012 2013 2014 2015 2016 2017 2018
QiKU
RealMe
Rocker
Sagem
Samsung
Siemens
Simputer (Encore)
Sony
Sony Ericsson
Spektra
Spice
Swipe
Tata Indicom
TCL
Tecno
Usha-Lexus
Videocon
Virgin Mobile
Vivo
Vodafone
VOTO
Xiaomi
XOLO
YU
Yxtel
Zen
ZTE
ZUK
Source: Compiled by authors using data from IDC’s Quarterly Mobile Phone Tracker, 2018Q2
Table A6.3: Brand – wise Churn for 3G Technology Generation
Company 2007 2008 2009 2010 2011 2012 2013 2014 2015 2016 2017 2018
10.or
Acer
Airfone
Alcatel
Apple
Aroma
ASUS
BenQ Siemens
Bird
Blackberry
Bleu
Bloom
Byond
Carlvo
Celkon
Classic
Comio
Coolpad
Curitel
Dallab
Datawind
Dell
DoPod
E-Ten
Fly
Forme
Garmin
G-Five
Gigabyte
Gild
Gionee

Company 2007 2008 2009 2010 2011 2012 2013 2014 2015 2016 2017 2018
GLX
Gnine
Haier
Hi-Tech
Honor
HP
HTC
Huawei
iBall
Idea Cellular
i-Mate
Infinix
Infocus
Intex
Itel
Karbonn
Kechao
Kenxindia
Krome
Kyocera
Lava
LeEco
Lemon
Lenovo
Lephone
LG Electronics
Lyf
Maxx
Meizu
Micromax
Microsoft
Mio
Mobiistar
Motorola
MTS
MWG
Nokia
Nubia
O2
Obi
Olive
OnePlus
Onida
Oppo
Palm
Panasonic
Pantech
QiKU
RealMe
Rocker
Sagem
Samsung
Siemens
Simputer (Encore)
Sony
Sony Ericsson
Spektra
Spice
Swipe
Tata Indicom
TCL
Tecno
Usha-Lexus
Videocon
Virgin Mobile

Competition Issues in India’s Mobile Handset Industry
Company 2007 2008 2009 2010 2011 2012 2013 2014 2015 2016 2017 2018
Vivo
Vodafone
VOTO
Xiaomi
XOLO
YU
Yxtel
Zen
ZTE
ZUK
Source: Compiled by authors using data from IDC’s Quarterly Mobile Phone Tracker, 2018Q2
Table A6.4: Brand – wise Churn for 4G Technology Generation
Company 2007 2008 2009 2010 2011 2012 2013 2014 2015 2016 2017 2018
10.or
Acer
Airfone
Alcatel
Apple
Aroma
ASUS
BenQ Siemens
Bird
Blackberry
Bleu
Bloom
Byond
Carlvo
Celkon
Classic
Comio
Coolpad
Curitel
Dallab
Datawind
Dell
DoPod
E-Ten
Fly
Forme
Garmin
G-Five
Gigabyte
Gild
Gionee
GLX
Gnine
Haier
Hi-Tech
Honor
HP
HTC
Huawei
iBall
Idea Cellular
i-Mate
Infinix
Infocus
Intex
Itel
Karbonn
Kechao

Company 2007 2008 2009 2010 2011 2012 2013 2014 2015 2016 2017 2018
Kenxindia
Krome
Kyocera
Lava
LeEco
Lemon
Lenovo
Lephone
LG Electronics
Lyf
Maxx
Meizu
Micromax
Microsoft
Mio
Mobiistar
Motorola
MTS
MWG
Nokia
Nubia
O2
Obi
Olive
OnePlus
Onida
OPPO
Palm
Panasonic
Pantech
QiKU
RealMe
Rocker
Sagem
Samsung
Siemens
Simputer (Encore)
Sony
Sony Ericsson
Spektra
Spice
Swipe
Tata Indicom
TCL
Tecno
Usha-Lexus
Videocon
Virgin Mobile
Vivo
Vodafone
VOTO
Xiaomi
XOLO
YU
Yxtel
Zen
ZTE
ZUK
Source: Compiled by authors using data from IDC’s Quarterly Mobile Phone Tracker, 2018Q2

Competition Issues in India’s Mobile Handset Industry
Appendix 7
ICRIER Survey
Mobile Phone Consumer Preference Survey
1. City - _____________________________
2. Age - _____________________________
3. Gender
o Male
o Female
o Other
4. Highest Level of Educational Qualification
o MPhil/PhD
o Post Graduation
o Graduation
o Sr. Secondary (upto class 12)
o Secondary (upto class 10)
o Upper Primary (upto class 8)
o Primary (upto class 5)
o Other (please specify) ___________________________
5. Occupation
o Employed with Private Sector
o Employed with Public Sector
o Employed with a Not-for-Profit
o Business
o Independent Professional (Lawyer/Doctor)
o Student
o Not seeking employment
o Other (please specify) ____________________________
6. Monthly income (Rs./month)
o < 30,000
o 30,000 – < 50,000
o 50,000 – < 1,00,000
o 1,00,000 – < 3,00,000
o > 3,00,000
o No income

7. What kind of mobile phone do you currently use? (The boundary between feature phones and
smartphones is a bit fuzzy. Feature phones essentially allow voice calling, camera, basic internet
access and apps with limited capabilities). Please select on the basis of your understanding.
o Smartphone (brand, model, price, year of purchase) -
____________________________________________________
o Feature Phone (brand, model, price, year of purchase) -
___________________________________________________
o Other (please specify) (brand, model, price, year of purchase) -
_____________________________________________
8. If you do not use a Smartphone currently, would you like to switch to one?
o Yes
o No
9. If answer to Q8 is no, then please briefly give reasons:
_____________________________________________________________________________
10. How often do you buy a new mobile phone?
o Once a year
o Once in 2 years
o Once in 3 years
o Other (please specify) - ________________________________________
11. Where do you mostly buy your mobile phone from?
o Online (e-commerce websites like Amazon, Flipkart, Snapdeal etc.)
o Retail shops (eg: Croma)
o Local mobile stores
o Repurchase/Second-hand purchase
o Other (please specify) - ____________________________________________
12. Which is the most important among the following in influencing your purchase of a mobile phone?
o Online resources
o Recommendations from family and friends
o Recommendations by mobile stores
o Other (please specify) - _____________________________________________
13. Within which price bracket are you likely to purchase a new mobile phone (in Rupees)?
o < 2,500
o 2,501 - 5,000
o 5001 - 10,000
o 10,001 - 20,000
o 20,001 - 30,000
o 30,001 - 50,000
o > 50,000

Competition Issues in India’s Mobile Handset Industry
14. How important are the following factors when considering purchase of a mobile phone? (Please rate
on a scale of 1 - 5 where 1 is the lowest priority and 5 is the highest priority)
o Price
o Brand
o Operating System
o Service centre accessibility
o Technology support (3G/4G support)
o Other (please specify) _________________
15. Please rate the features of a mobile phone based on how important they are to you. (Please rate each
feature on a scale of 1-5 where, 1 is the least important and 5 is the most important)
o Battery life
o Screen size
o RAM and Processing speed
o Storage memory
o Camera resolution
o Vernacular support
o Operating system
o Audio quality
o Display resolution
o Other (please specify) _________________
16. Between two phones, other features remaining the same, if the quality of one preferred feature
(camera, battery etc.) is improved in a phone, would you be willing to pay more for that phone?
o Yes
o No
17. If yes, how much extra would you be willing to pay?
o < 10%
o Between 10% and 20%
o Between 20% and 50%
o > 50%
18. What do you mostly do with your old phones?
o Trade for a new phone
o Sell in the second hand market for phones
o Give away to family/charity
o Leave unused
o Recycle
o Other (please specify) ___________________
19. Would you buy a mobile phone from the second hand market?
o Yes
o No
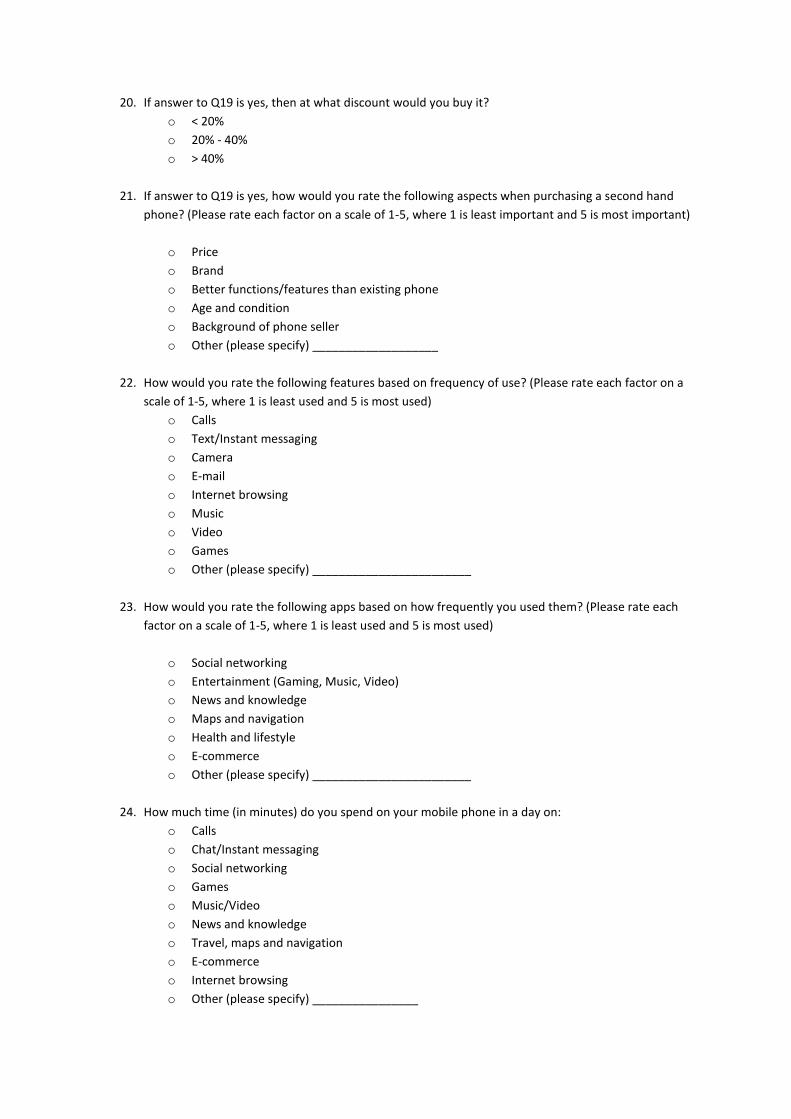
20. If answer to Q19 is yes, then at what discount would you buy it?
o < 20%
o 20% - 40%
o > 40%
21. If answer to Q19 is yes, how would you rate the following aspects when purchasing a second hand
phone? (Please rate each factor on a scale of 1-5, where 1 is least important and 5 is most important)
o Price
o Brand
o Better functions/features than existing phone
o Age and condition
o Background of phone seller
o Other (please specify) ___________________
22. How would you rate the following features based on frequency of use? (Please rate each factor on a
scale of 1-5, where 1 is least used and 5 is most used)
o Calls
o Text/Instant messaging
o Camera
o E-mail
o Internet browsing
o Music
o Video
o Games
o Other (please specify) ________________________
23. How would you rate the following apps based on how frequently you used them? (Please rate each
factor on a scale of 1-5, where 1 is least used and 5 is most used)
o Social networking
o Entertainment (Gaming, Music, Video)
o News and knowledge
o Maps and navigation
o Health and lifestyle
o E-commerce
o Other (please specify) ________________________
24. How much time (in minutes) do you spend on your mobile phone in a day on:
o Calls
o Chat/Instant messaging
o Social networking
o Games
o Music/Video
o News and knowledge
o Travel, maps and navigation
o E-commerce
o Internet browsing
o Other (please specify) ________________

Competition Issues in India’s Mobile Handset Industry
25. If you were to change your phone, would you be willing to change from the existing phone (model
and brand) to another one (new brand or a completely different model within the same brand)
o Yes
o No
26. If answer to Q25 is no, is it mostly because you are:
o Familiar with the functionality of the current phone
o Other brands do not offer a similar phone in this price range
o Locked in with the existing devices and/or operating system
o Other (please specify) _______________________
27. If answer to Q25 is yes, it is mostly because:
o Other brands have better options in the same price range
o Looking for new experience and features in a device
o High cost of repair/service (or poor service experience)
o Other (please specify) _______________________

Appendix 8
Table A8.1: Monthly Income Distributed by Educational Qualification
Educational Qualification
Monthly Income
< 30,000 30,000 -<
50,000
50,000 -<
1,00,000
1,00,000 -<
3,00,000 > 3,00,000
No
income
No
response
Mphil/PhD 2 1 3 1 0 1 0
Post Graduation 33 38 18 9 8 14 23
Graduation 71 25 21 10 4 32 92
Sr. Secondary (upto class 12) 8 3 3 0 1 58 34
Secondary (upto class 10) 8 4 1 1 1 4 12
Upper Primary (upto class 8) 0 0 0 0 0 0 0
Primary (upto class 5) 0 0 0 0 1 0 2
Table A8.2: Monthly Income Distributed by Occupation
Occupation
Monthly Income
< 30,000 30,000 -<
50,000
50,000 -<
1,00,000
1,00,000 -<
3,00,000 > 3,00,000
No
income
No
response
Employed with
Private Sector 60 27 14 10 7 3 8
Employed with
Public Sector 11 5 5 0 0 0 0
Employed with a
Not-for-Profit 3 19 6 2 0 1 0
Business 25 15 11 6 5 4 5
Independent
Professional
(Lawyer/Doctor) 6 1 3 2 0 14 0
Student 7 2 1 0 0 70 94
Table A8.3: Monthly Income wise Number of Smartphone and Feature phone owners
Monthly Income Smartphone Featurephone Other No response
< 30,000 117 5 0 0
30,000 -< 50,000 71 0 0 0
50,000 -< 1,00,000 44 2 0 0
1,00,000 -< 3,00,000 20 1 0 0
> 3,00,000 13 1 0 0
No income 105 1 Does not have a phone 1
Blank Response 158 4 Other 0

Competition Issues in India’s Mobile Handset Industry
Table A8.4: Vendor-group wise Users and User Preferences
Vendor
Group
Number of
Users
Percentage
share
Smart
phones
Feature
phones Average Price
Most important factor while
buying a mobile phone
Most important
features
Acer 2 0.37% 2 0 10000 Operating system
Battery life, RAM and
processing speed,
storage memory,
camera resolution,
vernacular support,
display resolution
Apple 56 10.29% 56 0 44981.11 Brand Battery life
ASUS 8 1.47% 8 0 9000 Brand and Technology support
(3G/4G support)
Battery life, RAM and
processing speed,
storage memory
Celkon 2 0.37% 2 0 5000
Brand, operating system and
technology support (3G/4G
support)
Battery life, screen size,
vernacular support,
audio quality
Coolpad 3 0.55% 3 0 7000 Price
Battery life, RAM and
processing speed,
storage memory,
camera resolution,
vernacular support,
operating system,
audio quality, display
resolution
Gionee 1 0.18% 1 0 10000 Price and operating system
Storage memory,
operating system,
audio quality, display
resolution
Google 5 0.92% 5 0 43400 Technology support (3G/4G
support) Battery life
HTC 10 1.84% 9 1 20666.67 Brand and Technology support
(3G/4G support) Creen size
Huawei 3 0.55% 2 1 10000 Price, brand, operating system
and service centre accessibility
Screen size and
vernacular support
InFocus 3 0.55% 3 0 8000
Price, brand, service centre
accessibility, technology support
(3G/4G support)
Battery life, RAM and
processing speed,
storage memory
InnJoo 1 0.18% 1 0 5000
Price, brand, operating system,
service centre accessibility,
technology support (3G/4G
support)
Battery life, screen size,
RAM and processing
speed, storage
memory, camera
resolution, vernacular
support, operating
system, audio quality,
display resolution
Intex 2 0.37% 1 1 6250 Technology support (3G/4G
support)
Battery life, RAM and
processing speed,
storage memory,
vernacular support,
operating system,
display resolution
Karbonn 2 0.37% 1 1 6500
Price, brand, operating system,
technology support (3G/4G
support)
Battery life, RAM and
processing speed,
storage memory,
camera resolution,
vernacular support,
display resolution
Lava 1 0.18% 1 0 7500 Price and service centre
accessibility
Battery life, audio
quality and display
resolution
LeEco 2 0.37% 1 1 Unreported Technology support (3G/4G
support) Screen size
Lenovo 36 6.62% 33 3 10727.12 Technology support (3G/4G
support)
RAM and processing
speed
LG 7 1.29% 7 0 15750 Technology support (3G/4G
support) Camera resolution
Lyf 4 0.74% 4 0 6875 Brand Battery life
Micromax 21 3.86% 20 1 9328.5 Technology support (3G/4G Storage memory

Vendor
Group
Number of
Users
Percentage
share
Smart
phones
Feature
phones Average Price
Most important factor while
buying a mobile phone
Most important
features
support)
Microsoft 1 0.18% 1 0 16000
Operating system, service centre
accessibility, technology support
(3G/4G support)
Battery life, RAM and
processing speed,
operating system,
audio quality
Motorola 74 13.60% 74 0 12804.05 Technology support (3G/4G
support) Battery life
Nokia 5 0.92% 4 1 9550 Service centre accessibility
RAM and processing
speed, storage
memory, camera
resolution, vernacular
support, operating
system, audio quality
OnePlus 20 3.68% 20 0 22692.15 Technology support (3G/4G
support)
Storage memory and
display resolution
OPPO 33 6.07% 32 1 14539.16 Brand
Battery life, RAM and
processing speed,
storage memory
Panasonic 3 0.55% 3 0 9500
Operating system and
technology support (3G/4G
support)
Battery life, camera
resolution, vernacular
support, operating
system, display
resolution
Samsung 109 20.04% 106 3 17094.49 Technology support (3G/4G
support)
Battery life and storage
memory
Sony 7 1.29% 7 0 21500 Operating system Battery life
Videocon 1 0.18% 0 1 Unreported
Brand, service centre
accessibility and technology
support (3G/4G support)
Screen size, storage
memory, vernacular
support, audio quality
Vivo 24 4.41% 24 0 14127.22 Service centre accessibility Camera resolution
Xiaomi 53 9.74% 53 0 11725.97 Technology support (3G/4G
support)
RAM and processing
speed
Others 1 0.18% 1 0 Unreported
Price, brand, service centre
accessibility, technology support
(3G/4G support)
Battery life, screen size,
RAM and processing
speed, storage
memory, camera
resolution, vernacular
support, display
resolution
No response 44
8.09% 42
Unrepo
rted 11428.57
Technology support (3G/4G
support)
Storage memory and
vernacular support
Source: All tables in Appendix 8 are based on data from the consumer survey

