working paper an ounce of prevention or a pound of cure
TRANSCRIPT

Electronic copy available at: http://ssrn.com/abstract=1374631
WORKING PAPER
An Ounce of Prevention or a Pound of Cure?
Short- and Long-Run Effects of Pharmaceutical Patents
on U.S. Health Care Expenditures
By
Hilary S. Johnson and Daniel K.N. Johnson
Colorado College Working Paper 2009-01
April, 2009
Department of Economics and Business
Colorado College
Colorado Springs, Colorado 80903-3298
www.coloradocollege.edu/dept/EC

Electronic copy available at: http://ssrn.com/abstract=1374631
1
An Ounce of Prevention or a Pound of Cure? Short- and Long-Run Effects of
Pharmaceutical Patents on U.S. Health Care Expenditures
Abstract
This study examines the relationship between pharmaceutical R&D and health
care expenditures, distinguishing between the short- and long-run impacts. To measure
these relationships quantitatively, we focus on patents as a key factor driving the costs of
pharmaceuticals, and develop a structured vector autoregressive (SVAR) model to
measure the social rate of return to pharmaceutical research as protected by patents. We
conclude with unambiguous results that pharmaceutical patents are not correlated with
higher short-run prices in any measure of medical costs. They are associated with higher
long-run prices in pharmaceuticals themselves, but with lower long-run prices in the
aggregate medical sector which includes pharmaceuticals as a component part. Further,
the TRIPS Agreement and Hatch-Waxman Act to enable generic competition have both
been demonstrably effective at lowering prices across the spectrum of medical sector
prices. We conclude that pharmaceutical patents may be economically medicinal
themselves, acting as the ‘ounce of prevention’ that saves a ‘pound of cure’, the cure
which would come in the form of even higher costs elsewhere in the medical sector.
1. Introduction
Since 1992 the pharmaceutical industry has witnessed radical changes in its
economic climate, as a direct result of major increases in U.S. health care expenditures.
In 2007, the United States spent more per capita on health care than any other nation in
the world (Commonwealth Fund, 2008). Total national health expenditures rose 6.9%
that year alone, twice the rate of inflation, to average $7,600 per person (National

2
Coalition on Health Care, 2008). Rising expenditures have clearly put a huge drain on
the public budget while creating opportunity for the pharmaceutical industry:
pharmaceutical sales in the U.S. are projected to reach half a trillion dollars by 2012
(Kaiser Family Foundation, 2003). In fact, prescription drugs are projected to be the
fastest-growing health sector through 2013 (Heffler et al., 2004).
Behind much of these expenditures is research. In 2007 the industry spent $58.8
billion on research and development (R&D), adding to the array of more than 2,700
medicines in development for nearly 4,600 different indications (PhRMA, 2008). For
example, new oncology drugs are finally fulfilling the promise of improved outcomes for
millions of patients. The market for cancer-related pharmaceutical products has doubled
in the last five years, and there are now more cancer treatments in late-stage development
than in any other therapeutic area (IMS Health, 2008).
Potentially, pharmaceutical research could have a positive or a negative effect on
health care spending. Like any investment expenditure, research costs are undoubtedly
passed along to consumers, but better treatment protocols could lower health care costs in
the long-run. So it seems wise to ask the question of how long the payback period is on
pharmaceutical research/investment. What is the social rate of return? Does the U.S.
health care system distort incentives to research away from lowering health costs and
toward other objectives instead?
The relationship between pharmaceutical R&D and health care expenditures has
obviously been investigated before. This study aims to draw attention to an important yet
hidden aspect of that interaction. As we will point out, the effects of pharmaceutical
innovation on health care spending vary dramatically from the short- to long-run. To
3
measure these relationships quantitatively, we will focus on the impact of patents as a key
factor driving the costs of pharmaceuticals, as they confer exclusive rights to production
and therefore enable short-term monopoly pricing. In order to compare these short-run
and long-run impacts, we develop a structured vector autoregressive (SVAR) model to
measure the social rate of return to pharmaceutical research as protected by patents.
We conclude with unambiguous results that pharmaceutical patents are not
correlated with higher short-run prices in any measure of medical costs. They are
associated with higher long-run prices in pharmaceuticals themselves, but with lower
long-run prices in the aggregate medical sector which includes pharmaceuticals as a
component part. Presumably, higher pharmaceutical costs are lowering hospitalization
costs more than proportionately. Further, the TRIPS Agreement and Hatch-Waxman Act
to enable generic competition have both been demonstrably effective at lowering prices
across the spectrum of medical sector prices. We conclude that pharmaceutical patents
may be economically medicinal themselves, acting as the ‘ounce of prevention’ that
saves a ‘pound of cure’, the cure which would come in the form of even higher costs
elsewhere in the medical sector.
The following section will review the literature on this topic, while Section 3 will
describe our dataset. Section 4’s presentation of the model foreshadows the results in
Section 5. The final section concludes with implications for policy-makers and future
academic study.
2. Literature
Health care spending is commonly believed to be influenced by three factors
primarily: rising prices, improving technology, and an aging population (CBO, 2008).

4
According to CBO analysis however, over the last fifty years the aging of the population
had a relatively small impact on overall health spending growth. A general consensus
among top analysts (Aaron, 1991; Newhouse, 1992; Schwartz and Mendelson, 1987; and
Cutler, 1995) suggests that a significant share of annual real health care cost growth can
be attributed to medical technology, predicated on an analysis of the “residual”: the
unexplained variance in cost growth. In essence, since an aging population, health
insurance, physician-induced demand, defensive medicine, administrative costs, and the
costs of caring for the terminally ill in the last year of life do not account for large
increases in spending growth, the cause must be the residual or the “march of science and
the increased capabilities of medicine.” (Rettig, 1994)
The march of science is fueled by incentives to innovate, often created through
the protection of intellectual property (IP), where IP is defined as an intangible asset such
as skill, knowledge or information. In the pharmaceutical industry, patent incentivize
firms by granting exclusive rights for twenty years to the holder of a novel, non-obvious,
useful invention. Exclusivity applies to production, use or sale (including imports),
effectively compensating the innovator for the risky investment in R&D with limited-
term monopoly profits via prices higher than perfect competition would engender. The
rationale is that it allows firms to collect profits sufficient to, a) cover high fixed costs of
development and FDA regulation, b) induce more R&D within the firm, c) account for
profits lost from new innovation being legally integrated into the public domain, and d)
compensate for the risks of research.
Monopolistic pricing necessarily leads to higher health expenditures, because the
demand for pharmaceutical products is clearly inelastic (Ringel et al., 2002). Since price

5
increases will categorically lead to higher spending in the health care industry, these two
terms will be used interchangeably within this study.
Expenditures on pharmaceuticals will therefore clearly depend on the duration of
market exclusivity afforded by IP law. For patents filed prior to June 8, 1995, the US
term for a patent was either 20 years from the earliest claimed filing date or 17 years
from the issue date, whichever is longer (WTO, 2008). Patents filed on a date later than
June 8th comply with the worldwide patent length standard of twenty years from the filing
date (a standard within the World Trade Organization, known as Trade Related Aspects
of Intellectual Property Rights, or TRIPS).
Extensions to patent duration are made in three special cases (Eisenberg, 2001).
In the cases of drugs to treat rare diseases and conditions affecting fewer than 200,000
patients, the Orphan Drug Act of 1983 grants up to seven extra years, and in the cases of
pediatric drugs, the Food and Drug Administration Modernization Act of 1997, grants up
to six extra months.
The most notable extensions are made under the Hatch-Waxman Act. Officially
entitled the Drug Price Competition and Patent Term Restoration Act of 1984, the Hatch-
Waxman Act increases the life span of a patent by up to five extra years to restore patent
life lost during the pre-market regulatory process. A second major provision of the law
facilitates the entry of generic competitors after patent expiration (Grabowski and
Vernon, 1986). Under the new Act, a generic drug company need only submit an
Abbreviated New Drug Application (ANDA), requiring a demonstration of
bioequivalence to the pioneer product. Grabowski and Vernon examine the net effect of
6
R&D incentives that simultaneously promote generic competition and extend patent life,
finding that the net effect is indeed positive for three cases.
Despite the assertion that technological change has accounted for the bulk of
health care cost increases, there is no doubt that such innovation has made invaluable
improvements to quality of life (Cutler and McClellan, 2001). Vast literature on this side
of the spectrum examines the benefits of patent-induced innovation in the long run. For
example, Manton and Gu (2001) find a seven year increase in life expectancy between
1950 and 1990.
Kim et al. (2001) conclude that one reason for U.S. health spending is quite
simply the public’s commitment to innovation and willingness to pay. Murphy and Topel
(2007) develop methods for valuing health improvements based on individuals’
willingness to pay. Their results indicate that past health improvements have been
enormously valuable, with gains in life expectancy over the twentieth century worth more
than $1.2 million per person, and rising longevity contributing about $3.2 trillion per year
to the national wealth between 1970 and 2000. Compared to the $60 billion spent per
year in applied health research, they suggest that progress is too slow and spending too
low.
Lichtenberg (2007) concludes similarly. His most conservative estimates indicate
that the use of post-1990 drugs in 2002 reduced the number of pre-retirement life years
lost by roughly one and a half million. Based on prescription drug expenditures and the
reduced costs of hospitals and nursing homes, he concludes that the net cost per life-year
saved before age 75 was a reasonable $15,974.

7
We propose to add to this literature’s discussion in the following way, adopting an
argument from Charles and Williams (1997). Suppose that tomorrow we reduced the
production of new innovation, leaving the current stock of ideas unchanged. We define
the social rate of return to pharmaceutical innovation as the gain in expenditures
associated with this change. We believe that an SVAR model will serve this new question
well, and we will outline our own application of this technique after presenting a
summary of our data.
3. Data
Our goal in this paper is to model the time path of prices, accounting for natural
short- and long-term relationships while identifying factors that may have caused one-
time changes in price level or inflation rates. We use monthly data for 381observation
periods from 1978 through 2007, all adjusted to a base period of 1982-84.
We choose to measure prices in three separate manners. First, Medical Care
Prices (mCPI) are measured by the consumer price index of medical care goods and
services, designed by the Bureau of Labor Statistics to reflect inflation at the retail level
based on a constant-quality market basket of medical goods and services (BLS, 2008).
The index includes four main divisions: medical care commodities, including prescription
drugs; medical care services, including physician and dental; hospital and related
services; and health insurance. Second, we consider hospital and related services (hCPI)
separately, to determine whether there is a trade-off between pharmaceutical and hospital
prices, since Lichtenberg (2007) and others show that trade-off clearly in expenditures.
Third, we consider prescription drugs explicitly (pCPI), to test whether IP affects
pharmaceuticals more clearly than other medical costs/prices. The pCPI and hCPI will

8
also be used as explanatory variables as well, since they are component parts of the
mCPI.
Innovation is measured by the number of issued patents. There is a long tradition
of using patents as imperfect indicators of innovation (e.g. Ahuja, 2000; Griliches, 1990;
Kamien and Schwartz, 1982) because they represent an externally validated measure of
technological novelty, and they confer property rights on the assignee so have economic
significance (Ahuja, 2000). While in some sectors, patents may be less used compared to
trade secrets, patents are widely and consistently used in chemicals relative to most other
economic sectors (Levin et al., 1987; Ahuja, 2000). We specifically consider the number
of patents issued monthly between 1978 and 2007 to U.S. patent classes 514 and 424,
both titled ‘Drugs, Bio-Affecting and Body Treating Compositions’. All data are drawn
from the U.S. Patent and Trademark Office.
In the short-run, we expect increases in innovation to increase prices on
prescription drugs, and by extension, prices on all medical goods. In the long-run we can
expect the opposite: reduced prices for prescription drugs and medical goods because of
the expiration of patents and increased competition with generic drugs, along with the
possibility of advances in medicine that replace less cost-effective drug treatments.
We expect a negative correlation between hCPI and patents in both the short- and
long-runs because prescription drugs may be substitute goods for hospital services.
The Food and Drug Administration (FDA) records generic drug approvals by
date, and we use counts of those by month as a control variable. For all price variables in
the short- and long-runs, we expect that more generic drugs will be associated with lower
prices.

9
We also include two policy variables in our analysis, to reflect the signing of the
TRIPS and Hatch-Waxman legislation respectively. Both are constructed as dummy
variables taking the value of unity for the period under which the policy is in force. For
all price indices, we expect TRIPS to have an inflationary effect in the short-run (due to
an effective three-year extension of monopoly rights) and a deflationary effect in the
long-run (due to an increase in the incentives to innovate for even more spectacular
increases to life expectancy or cost-effectiveness of treatment plans). We expect similar
impacts from Hatch-Waxman, as it was designed to increase R&D (higher costs to pass
through in the short-run) but increase generic competition and improve cost-efficiency
(lower costs in the long-run).
A summary table of the variables is presented in Table 1, along with the expected
signs of estimated coefficients. Notice that the range and variation for the three price
indices is fairly similar, with a little wider dispersion in the health cost index. The
number of patents varies quite widely from a low to 99 patents to a peak of 1532 in any
given period. Generics similarly range widely, from zero to 63 patents in a given period.
Recall that the TRIPS and Hatch-Waxman variables are dummies, so their presentation is
slightly different in the table below.
4. A Structured Vector Autoregressive Model
The VAR was initially formulated by Sims (1980) who suggested the need for an
econometric model to capture the evolution and interdependencies between multiple time
series. It was developed as a theory-free method to estimate economic relationships, as
an alternative to the identification restrictions in structural models. However, successive
generations of economists have imposed small structural constraints on VAR systems, for

10
TABLE 1: Summary of Variables
Variable Mean St. Dev. Max Min Expected Impact on costs in
Short-run Long-run
mCPI 200.85 90.89 357.66 58.90 + +
hCPI 244.37 138.13 515.68 51.80 + +
pCPI 216.21 99.93 374.39 58.90 + +
Patents (pats) 467.36 247.58 1532 99 +* -
Generics (gens) 15.04 12.04 63 0 - -
Mean Number of zeroes
Max Min
TRIPS 0.45 211 1 0 + -
Hatch-Waxman (HW) 0.81 73 1 0 + -
* expected sign is negative for hCPI but positive for mCPI and pCPI.
example to indicate known uni-directional causality. We use that established technique
here.
As dependent variables we are using medical care prices instead of costs, making
the assumption that there is a close linkage between the two. Specifically, we use the
Consumer Price Index (CPI), which only approximates what households spend out-of-
pocket on goods and services. We are considering out-of-pocket expenditures to be the
measure of interest, although policymakers may easily make the valid point that in fact
total expenditures are more important from a policy perspective.
Another critical assumption in many studies is the question of functional form,
and we are relying on the power of the ECM (VAR) process to inform the analysis from
the linearized first-order effects regardless of the underlying true functional form.
We propose the SVAR system below. Each section includes a long-run
equilibrium equation (1.1, 2.1, and 3.1) and a short-run dynamic (lagged) equation (1.2,
2.2, and 3.2).

11
(1.1) pCPIt = βp,1 + βp,2patst + βp,3TRIPSt + βp,4HWt + βp,5genst + βp,6timet + up,t
(1.2) ∆pCPIt = δp,1 + ∑=
n
s
sp
0
,2,δ ∆patst-s +∑=
n
s
sp
0
,3,δ ∆TRIPSt-s + ∑=
n
s
sp
0
,4,δ ∆HWt-s
+ ∑=
n
s
sp
0
,5,δ ∆genst-s + δp,6timet +∑=
n
s
sp
0
,7,δ ∆pCPIt-s + εp,t
(2.1) hCPIt = βh,1 + βh,2patst + βh,3TRIPSt + βh,4HWt + βh,5genst + βh,6timet
+ βh,7pCPIt + uh,t
(2.2) ∆hCPIt = δh,1 + ∑=
n
s
sh
0
,2,δ ∆patst-s +∑=
n
s
sh
0
,3,δ ∆TRIPSt-s + ∑=
n
s
sh
0
,4,δ ∆HWt-s
+ ∑=
n
s
sh
0
,5,δ ∆genst-s + δh,6timet +∑=
n
s
sh
0
,7,δ ∆pCPIt-s
+∑=
n
s
sh
0
,8,δ ∆hCPIt-s + εh,t
(3.1) mCPIt = βm,1 + βm,2patst + βm,3TRIPSt + βm,4HWt + βm,5genst + βm,6timet
+ βm,7pCPIt + βm,8hCPIt + um,t
(3.2) ∆mCPIt = δm,1 + ∑=
n
s
sm
0
,2,δ ∆patst-s +∑=
n
s
sm
0
,3,δ ∆TRIPSt-s + ∑=
n
s
sm
0
,4,δ ∆HWt-s
+ ∑=
n
s
sm
0
,5,δ ∆genst-s + δm,6timet +∑=
n
s
sm
0
,7,δ ∆pCPIt-s
+∑=
n
s
sm
0
,8,δ ∆hCPIt-s +∑=
n
s
sm
0
,9,δ ∆mCPIt-s + εm,t
Notice that we model long-run costs to depend only upon ‘smaller’ concepts of cost (i.e.
medical care prices depend on hospital and pharmaceutical prices, hospital prices depend
on pharmaceutical prices but not overall medical care prices, and pharmceutical prices do
not depend on either larger concept of price). In the short-run, we permit some impact of
lagged own-price values (e.g. past pharma prices may have an impact on today’s pharma
prices), but otherwise retain the same small-to-big accumulation structure of costs.

12
We include all exogenous variables in each equation, permitting patents, the
TRIPS Agreement, the Hatch-Waxman Act, the number of generic drugs and a time trend
to potentially impact each level of costs.
5. Estimation results
The appropriate lag length in each regression was determined via the Akaike
Information Criterion (AIC). Both pCPI and hCPI models settled on a 13 month lag,
with a slightly longer 16-month lag for the mCPI model. There are a number of surprises
in the results below, alongside some comforting regularities.
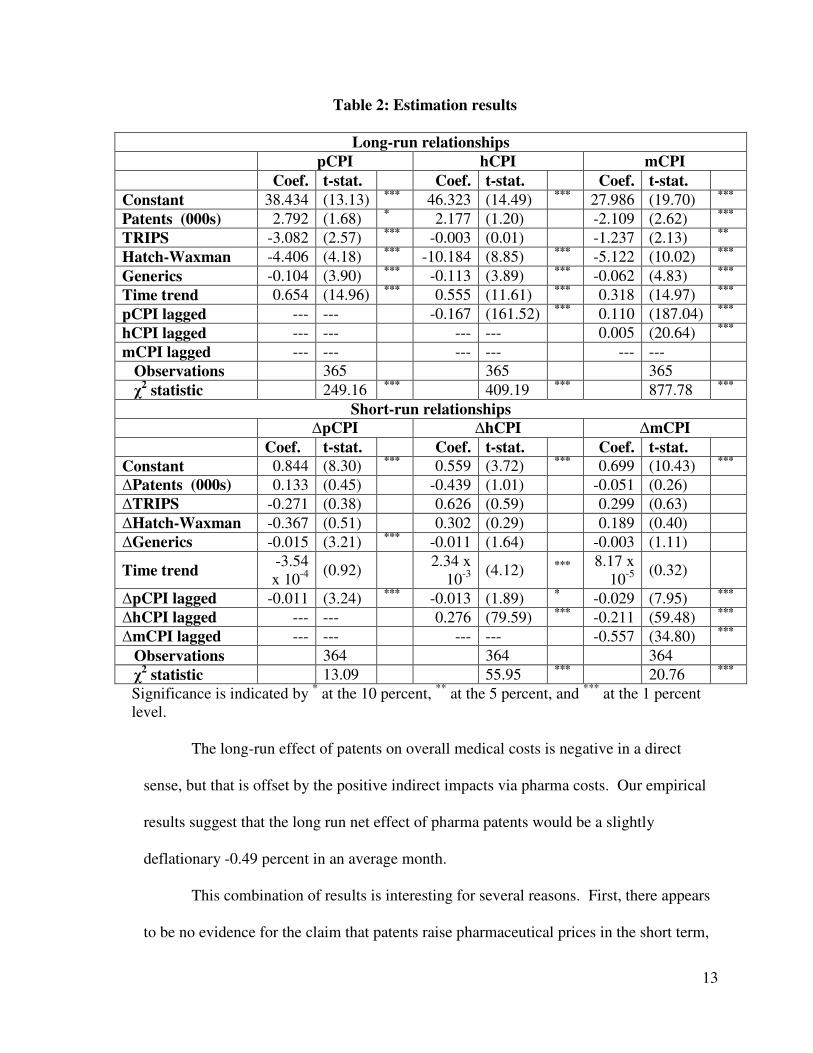
Of greatest interest for this paper is the role that patents play in health costs at
each level of aggregation. In the short run, there is no evidence that patents play any
statistically significant role in price changes at any level of aggregation. In the long run,
patents are (unsurprisingly) associated with higher prices for pharmaceuticals. The
results conclude that an additional thousand pharmaceutical patents would raise long-run
pharma prices by 2.79 points, or roughly 1.31 percent at the sample average. Considering
that a typical month sees 467 pharma patents granted, patents overall correspond to a 0.60
percent average effect on pharmaceutical prices.
There is an insignificant direct impact of patents on hospital costs, but the indirect
effect (via pharma prices in the VAR) is negative, restraining hospitalization costs as new
pharmaceutical products reduce the severity and duration of hospital stays. Combined, an
average monthly number of pharma patents would result in a net 0.41 percent increase in
hospital costs.
13
Table 2: Estimation results
Long-run relationships
pCPI hCPI mCPI
Coef. t-stat. Coef. t-stat. Coef. t-stat.
Constant 38.434 (13.13) *** 46.323 (14.49) *** 27.986 (19.70) ***
Patents (000s) 2.792 (1.68) * 2.177 (1.20) -2.109 (2.62) ***
TRIPS -3.082 (2.57) *** -0.003 (0.01) -1.237 (2.13) **
Hatch-Waxman -4.406 (4.18) *** -10.184 (8.85) *** -5.122 (10.02) ***
Generics -0.104 (3.90) *** -0.113 (3.89) *** -0.062 (4.83) ***
Time trend 0.654 (14.96) *** 0.555 (11.61) *** 0.318 (14.97) ***
pCPI lagged --- --- -0.167 (161.52) *** 0.110 (187.04) ***
hCPI lagged --- --- --- --- 0.005 (20.64) ***
mCPI lagged --- --- --- --- --- ---
Observations 365 365 365
χ2 statistic 249.16 *** 409.19 *** 877.78 ***
Short-run relationships
∆pCPI ∆hCPI ∆mCPI
Coef. t-stat. Coef. t-stat. Coef. t-stat.
Constant 0.844 (8.30) *** 0.559 (3.72) *** 0.699 (10.43) ***
∆Patents (000s) 0.133 (0.45) -0.439 (1.01) -0.051 (0.26)
∆TRIPS -0.271 (0.38) 0.626 (0.59) 0.299 (0.63)
∆Hatch-Waxman -0.367 (0.51) 0.302 (0.29) 0.189 (0.40)
∆Generics -0.015 (3.21) *** -0.011 (1.64) -0.003 (1.11)
Time trend -3.54 x 10⁻⁴
(0.92) 2.34 x 10⁻³
(4.12) *** 8.17 x 10⁻⁵
(0.32)
∆pCPI lagged -0.011 (3.24) *** -0.013 (1.89) * -0.029 (7.95) ***
∆hCPI lagged --- --- 0.276 (79.59) *** -0.211 (59.48) ***
∆mCPI lagged --- --- --- --- -0.557 (34.80) ***
Observations 364 364 364
χ2 statistic 13.09 55.95 *** 20.76 ***
Significance is indicated by * at the 10 percent, ** at the 5 percent, and *** at the 1 percent level.
The long-run effect of patents on overall medical costs is negative in a direct
sense, but that is offset by the positive indirect impacts via pharma costs. Our empirical
results suggest that the long run net effect of pharma patents would be a slightly
deflationary -0.49 percent in an average month.
This combination of results is interesting for several reasons. First, there appears
to be no evidence for the claim that patents raise pharmaceutical prices in the short term,

14
but there is strong support for the claim that they raise prices in the long run instead.
This pairing of results is consistent with competition between oligopolists, where short-
run competition leads to prices that do not cover the long-run costs of new product
development or advertising. However, those costs of market development and
advertising must be incorporated in the long-run, and in fact raise the cost curves for all
firms in the industry.
Second, pharmaceutical patents appear to be desirable for consumers in the long
run via overall health care costs, presumably because new products reduce the cost of
medical care in the aggregate. After all, presumably that is one of the primary reasons to
engage in pharmaceutical research (alongside increased quality of outcomes).
The TRIPS Agreement, Hatch-Waxman Act and the increase of generic varieties
have all lived up to their original intent, namely to reduce health costs at every level in
the long run. Presumably all three have done so by increasing competition among
providers of patentable pharmaceutical products. Notice, however, that none of the three
has any impact on any price levels in the short run, aside from the significant negative
effect of more generic competition on pharmaceutical prices in particular. Even this
effect is empirically very small, with an additional generic competitor lowering prices in
pharmaceuticals overall by a mere 0.015 price index points (and potentially a little more
via the indirect effect of pharma prices via the VAR).
To be concrete, our results suggest that the TRIPS Agreement is associated with a
three point lower cost index in pharmaceuticals. Hatch-Waxman has been much more
effective, associated with a 4.4 point decline in the pharma CPI and an additional 0.1
point decline for every generic that the Act enabled. The effects of Hatch-Waxman are

15
more than twice as potent in the hospitalization cost measure of prices, with a more than
10-point decline in costs. Overall medical sector costs naturally show a result between
these two, with TRIPS accounting for a 1.2 point decline in costs and Hatch-Waxman
accounting for a 5.1-point decline in costs (plus the marginal effect of each additional
generic).
Our results further suggest that at least some health-related costs are mean-
reverting or self-containing in nature. For example, increases in pharmaceutical prices
are associated with a subsequent decrease in hospitalization costs in the long-run, and are
associated with subsequent declines in all variations of health costs in the short-run.
While long-run overall medical costs rise with rises in the constituent parts, in the short
run overall medical costs reverse the direction of previous changes in pharmaceuticals,
hospital and even overall medical costs.
So why then are health costs rising? Our evidence suggests that there is a
powerful time trend underlying the rise, one that naturally has little impact on short-run
prices but has enormous and statistically significant impact on long-run costs.
Pharmaceuticals are seeing the largest period-to-period gain in prices based on trend
(0.65 CPI-points per month), followed by hospitalization costs (0.56 point per month).
By the time the trend hits overall health costs, the impact has been cut in half by the
combined impacts of patents and legislation like Hatch-Waxman, but that half is still
large enough to raise overall medical costs by 0.32 point per month due to direct trend
alone. That inertial effect amounts to 4.71 points per year of increase in overall medical
costs once the VAR effects of pharma prices and hospitalization prices are included. Any
policy to curb costs is fighting against that starting point.

16
6. Conclusion
The United States health care system is defined by high and rising expenditures,
uncontrolled costs, and system inefficiencies. Pharmaceutical patents have been blamed
in part as the culprit for this outcome, and this study has attempted to shed more light on
the ways in which prices (or costs) in the medical sector evolve over time.
We find very little evidence to suggest that patenting rates are in any way
correlated with prices. Instead, we find that most inflation is inertial. Pharmaceutical
patents are not at all correlated with short-run prices, and while they are associated with
higher long-run pharma costs they simultaneously are associated with lower long-run
medical costs overall. Policies aimed at encouraging competition, such as the TRIPS
Agreement and Hatch-Waxman Act with ensuing generic competitors, have effectively
counteracted any increases due to pharmaceutical patenting.
There is the strong possibility that our measure of patents is simply inadequate.
Perhaps the ‘value’ of a patent, rather than their frequency, is essential for a robust
analysis of this sort. An extension to this work will pursue that avenue of research,
targeting the ongoing debate in the innovation literature about how to measure ‘value’ or
impact without unintentionally biasing the result. Unfortunately, the available measures
of patent value are problematic at best, relying on surveys of experts, patent renewal
records, patent auction prices or academic citation records. Each carries a list of
inconvenient concerns.
As academics concerned about health care issues, and as policymakers designing
a revision to US health care policy in part to control costs, we offer these results.
Innovation has long been the engine of US economic growth, a fact as true in health care
17
as in any other sector. While innovation comes at an obvious cost, we have shown here
that patents given as incentives to innovators in pharmaceuticals are not the driving force
of recent medical inflation. Pharmaceutical research is the proverbial ‘ounce of
prevention’ which prevent the need for a ‘pound of cure’ in the form of even higher
hospitalization and overall medical sector costs.
We therefore encourage our community to think carefully about retaining the
financial incentives to innovate where they stimulate long-run benefits to our society in
terms of care or lower costs. Instead, let us target the inertial roots of medical inflation,
whose roots apparently do not reside with patented innovations.
Bibliography
Aaron, H.J., Serious and Unstable Condition: Financing America’s Health Care, Washington: The Brookings Institution, 1991
Ahuja, G., “Collaboration Networks, Structural Holes, and Innovation: A Longitudinal Study” Administrative Science Quarterly Vol.45 (2000): 433 Berndt, E.R., “The U.S. Pharmaceutical Industry: Why Major Growth in Times of
Cost Containment?” Health Affairs Vol. 20 (March/April 2001): 109 Bureau of Labor Statistics, available on http://www.bls.gov/cpi/cpifact4.htm; Internet;
accessed on April 19, 2008
Cogan, J., G. Hubbard, and D. Kessler, “Making Markets Work: Five Steps to a Better Health Care System” Health Affairs Vol. 24 (2005): 1447-58 Congressional Budget Office, “Technological Change and the Growth of Health Care
Spending,” available from www.cbo.gov (2008); Internet; accessed on April 19, 2008.
Cutler, D., “Cutting Costs and Improving Health: Making Reform Work” Health
Affairs (1995):161-172 Cutler, D. and M. McClellan, “Is Technological Change in Medicine Worth It?”
Health Affairs Vol.20 (2001): 11-29 Eisenberg, R., “The Shifting Functional Balance Between Patents and Drug

18
Regulation” Health Affairs Vol. 20 (2001): 119-135 Engle, R. and A. Patton, “Impacts of Trades in an Error-Correction Model of
Quote Prices,” UCSD Economics Working Paper, (December 2001) Engle, R. and C.W.J, Granger, “Co-Integration and Error Correction: Representation, Estimation, and Testing” Econometrica Vol. 55 (1987): 251-276 Food and Drug Administration, available on http://www.accessdata.fda.gov /scripts/cder/drugsatfda/index.cfm?fuseaction=Reports.ReportsMenu; Internet; accessed on April 19, 2008
Food and Drug Administration, “FDA Modernization Act of 1997,” (Jan 2006) available
on http://www.fda.gov/cder/fdama/default.htm; Internet; accessed on April 19, 2008
Grabowski, H. and J. Vernon, “Longer Patents for Lower Imitation Barriers: The 1984 Drug Act.” The American Economic Review, Papers and Proceedings of the
98th annual meeting of the American Economic Association, Vol. 76 (May 1986): 195-198
Griliches, Z., “Patent statistics as economic indicators: A Survey.” Journal of Economic
Literature Vol. 27 (1990):1661-1707 Hamilton, J., Time Series Analysis, New Jersey: Princeton University Press, 1994 Heffler, S., Keehan, C., and Zezza, T., “Trends: Health Spending Projections
Through 2013” Health Affairs (Spring 2004): w4-79-w4-93 IMS Health, “Orphan drugs: rarity no guarantee of access,” available on
http://www.imshealth.com/web/content0,3148,64576068_63872702_70261006_8 1912725,00.html; Internet; accessed on April 19, 2008
IMS Health, “Zero Sum,” Oncology Business Review (Nov 2007), available on
http://imshealth.com/vgn/images/portal/CIT_40000873/45/17/83046768OBR_11 07_ZSG.PDF; Internet; accessed on April 19, 2008 Jones, C. and J. Williams, “Measuring the Social Return to R&D,” (Feb 1997)
available on http://ssrn.com/abstract=2155; Internet; accessed on April 20, 2008
Kamien, M.I. and N.L. Schwartz, Market Structure and Innovation. New York: Cambridge University Press, 1982.
Kim, M., R. Blendon, and J. Benson, “How Interested are Americans In New Medical Technologies? A Multicultural Comparison” Health Affairs Vol. 20
(2001):194-201

19
Levin, R.C., A.K. Klevorick, R.R. Nelson, and S.G. Winter, “Appropriating the returns
from research and development.” Brookings Papers on Economic Activity, Vol. 3 (1987):783-820
Lichtenberg, F., “The Impact of New Drugs on US Longevity and Medical
Expenditure, 1990-2003: Evidence from Longitudinal, Disease-Level Data” American Economic Association Vol.97 :438-443
Lütkepohl, H., New Introduction to Multiple Time Series Analysis, Springer, 2005. Mankiw, N.G., Principles of Economics, 4th ed. Boston: The Thomson
Corporation, 2007 Manton, K.G., and X. Gu, “Changes in the Prevalence of Chronic Disability in the United
States Black and Nonblack Population above Age 65 from 1982 to 1999,” Proceedings of the National Academy of Sciences (May 2001): 6354-6359
Mehra, Y., “The Stability of the M2 Demand Function: Evidence from an Error-
Correction Model,” Journal of Money, Credit and Banking Vol. 25 (1993):455- 460
Molt, D. and R. Cline, “Exploring Generic Drug Use Behavior: The Role of
Prescribers and Pharmacists in the Opportunity for Generic Drug Use and Generic Substitution” Medical Care Vol. 40 (Aug 2002): pp:662-674
Mongan, J., “Health Care Costs 101: Cost Control is an Issue” NIHCM, (Feb. 2008). Murphy, K. and R. Topel, “Social Value and the Speed of Innovation” American
Economic Association Vol.97 (2007): 433-437 National Coalition on Health Care, ”Health Insurance Cost,” available on
http://www.nchc.org/facts /costs.html; Internet; accessed on April 19, 2008 Newhouse, J.P., “Medical Care Costs: How Much Welfare Loss?” Journal of Economic
Perspectives Vol. 6 (1992): 3-21 Omran, M., “Time Series Analysis of the Impact of Real Interest Rates on Stock
Market Activity and Liquidity in Egypt: Co-integration and Error Correction Approach,” International Journal of Business Vol. 8 (2003): 359-374
PhRMA, “R&D Spending by U.S. Biopharmaceutical Companies Reaches Record $58.8
Billion in 2007,” (March 2008 ), available on http://www.phrma.org/news_room/press_releases/us _biopharmaceutical
_companies_r%26d_spending_reaches_record_%2458.8_billion_in_2007/; Internet; accessed on April 19, 2008

20
Rettig, R., “Medical Innovation Duels Cost Containment,” Health Affairs Vol. 13 (1994): 7-27. Ringel, J., S. Hosek, B. Vollaard, and S. Mahnovski, “The Elasticity of
Demand for Health Care,” RAND Monograph Report (2002); available on http://rand.org/pubs/monograph_reports/MR1355/; Internet; accessed on April 19, 2008
Scherer, F.M. and D.Ross, Industrial Market Structure and Economic Performance.
Chicago: Rand McNally, 1990. Schwartz, W.B., “The Inevitable Failure of Current Cost-Containment Strategies: Why They Can Provide Only Temporary Relief,” Journal of the American Medical
Association 257 (1987): 220-224. Schwartz, W.B. and D.N. Mendelson, “Hospital Cost Containment in the 1980s: Hard Lessons Learned and Prospects for the 1990’s” The New England Journal of
Medicine 324 (1987): 1037-1042. Sims, C., “Macroeconomics and Reality” Econometrica Vol. 48 (1980): 1-48 Small, D. and R.D. Porter, “Understanding the Behavior of M2 and V2,” Federal
Reserve Bulletin (April 1989): 244-54 Stata Time Series Reference Manuel, College Station, TX: Stata Press, 2005 The Commonwealth Fund, “Health Policy Reform: Beyond the 2008 Elections,”
Supplement to the March/April 2008 Issue of the Columbia Journalism Review (2008)
The Kaiser Family Foundation, “Prescription Drug Trends,” (March 2003) and Health
Affairs, “Health Spending Projections for 2002-2012,” (February 2003) The Library of Congress, “A Bill to Amend the Patent Laws of the United States,” (Sept
1984), available on http://thomas.loc.gov/cgibin/bdquery/z?d09 8:SN01538:@@@D&summ2=m&|TOM:/bss/d098 query.html; Internet; accessed
on April 19, 2008 United States Patent and Trademark Office, available on www.uspto.gov; Internet; accessed on April 19, 2008 U.S. Department of Labor: Bureau of Labor Statistics, “CPI Factsheet,” available on
www.bls.gov/cpi/cpifact4/htm; Internet; accessed on April 20, 2008.
World Trade Organization, “TRIPS [trade-related aspects of intellectual property
21
rights],” available on http://www.wto.org/english/tratop_e/trips_e/trips_e.htm; Internet; accessed on April 19, 2008