wivenhoe alliance wivenhoe dam spillway … alliance wivenhoe dam spillway augmentation design...
TRANSCRIPT


Wivenhoe Alliance Wivenhoe Dam Spillway Augmentation Design Discharges and Downstream Impacts of the Wivenhoe Dam Upgrade
ItemID: 003684262 Page 2 of 93
WIV-RP-HD-004
TABLE OF CONTENTS
1. INTRODUCTION..................................................................................................................................... 9
2. PREVIOUS FLOOD STUDIES ............................................................................................................. 11
3. PROPOSED AUXILIARY SPILLWAYS ............................................................................................... 12
3.1 Design Outcomes 12
3.2 Proposed Auxiliary Spillway Configuration 12
3.3 Staged Construction 12
3.4 Fuse Plug Spillways 14 3.4.1 Concept of Controlled Fuse Plug Spillway ............................................................. 14
3.4.2 Fuse Plug Performance.......................................................................................... 15
3.4.3 Fuse Plug Reconstruction ...................................................................................... 16
4. GATE OPERATION PROCEDURES ................................................................................................... 17
4.1 Somerset Dam Gate Opening Procedures 17
4.2 Wivenhoe Dam Gate Opening Procedures 17
4.3 Gate Closure Procedures 18
4.4 Proposed Changes to the Flood Operating Procedures 18 4.4.1 Proposed Changes to the Emergency Gate Opening Procedures ........................ 20
4.5 Proposed Changes to the Flood Operating Procedures During Construction 21 4.5.1 Works within the Gated Spillway ............................................................................ 21
4.5.2 Works in the Auxiliary Spillway............................................................................... 22
5. WIVENHOE DAM DESIGN DISCHARGES.......................................................................................... 23
5.1 Method of Analysis 23
5.2 Spillway Discharges at Fuse Plug Initiation 23
5.3 Design Discharges 24
5.4 Dam Inflow and Outflow Comparison 26 5.4.1 48hour Storm Duration Flood Frequency Curve .................................................... 26
5.4.2 Inflow and outflow Comparison at Fuse Plug Initiation Levels............................... 27
6. PMF SENSITIVITY ANALYSIS ............................................................................................................ 28
6.1 Overview 28
6.2 Impact of Storm Duration 28
6.3 Impact of Temporal Patterns 29

Wivenhoe Alliance Wivenhoe Dam Spillway Augmentation Design Discharges and Downstream Impacts of the Wivenhoe Dam Upgrade
ItemID: 003684262 Page 3 of 93
WIV-RP-HD-004
6.4 Impact of Downstream Tributary Flows 30
6.5 Impact of Lateral Erosion Rates of the Fuse Plugs 31
6.6 Impact of Emergency Gate Opening Procedures 31
7. IMPACT OF FLOOD OPERATION CHANGES ................................................................................... 32
7.1 General 32
7.2 24 hour -1 in 10,000 AEP design Storm 32
7.3 24 hour Duration – PMP Design Storm 33
8. DOWNSTREAM IMPACT OF FUSE PLUG FLOWS ........................................................................... 35
8.1 General 35
8.2 Concurrent Downstream Flows 35
8.3 Fuse Plug 1 36 8.3.1 Impacts on Downstream Flows and Water Levels ................................................. 36
8.3.2 Impact at Savages Crossing and Moggill Gauge ................................................... 38
8.4 Fuse Plug 2 40 8.4.1 Impacts on Downstream Water Levels and Flood Extent ...................................... 40
8.4.2 Impact at Savages Crossing and Moggill Gauge ................................................... 42
8.5 Fuse Plug 3 43 8.5.1 Impacts on Downstream Water Levels and Flood Extent ...................................... 43
8.5.2 Impact at Savages Crossing and Moggill Gauge ................................................... 44
8.6 Fuse Plug 4 (Saddle Dam 2) 47 8.6.1 Impacts on Downstream Water Levels and Flood Extent ...................................... 47
8.6.2 Impact at Savages Crossing and Moggill Gauge ................................................... 49
8.7 Fuse Plug Breach Travel Times 51
9. SUMMARY AND CONCLUSIONS ....................................................................................................... 52
10. REFERENCES...................................................................................................................................... 54
APPENDIX A - Hydrological Model Development
1. INTRODUCTION................................................................................................................................... 57
2. METHOD OF ANALYSIS...................................................................................................................... 58
2.1 General 58
2.2 WT42D Rainfall-Runoff-Routing Model 58 2.2.1 Model Layout .......................................................................................................... 58
2.2.2 Model Calibration and Testing................................................................................ 60

Wivenhoe Alliance Wivenhoe Dam Spillway Augmentation Design Discharges and Downstream Impacts of the Wivenhoe Dam Upgrade
ItemID: 003684262 Page 4 of 93
WIV-RP-HD-004
2.3 The Wivops Dam Operation Model 60
2.4 FLRoute Dam Routing Model 61 2.4.1 Adopted Auxiliary Spillway Stage-Discharge Relationship .................................... 61
2.4.2 Adopted Fuse Plug Initiation Levels ....................................................................... 62
3. DESIGN FLOOD ESTIMATION............................................................................................................ 63
3.1 General 63
3.2 Design Rainfall Depths 63 3.2.1 Annual Exceedance Probability of the PMP........................................................... 63
3.3 Model Parameters 64
3.4 Adopted Rainfall Losses 64
3.5 Adopted Temporal Patterns 65
3.6 Concurrent Downstream Flows 66
3.7 Initial Storage Volume 66
3.8 Gate Operation Procedure Assumptions 67 3.8.1 The Existing Dam ................................................................................................... 67
3.8.2 Stage 1 and Stage 2 Dam Upgrade ....................................................................... 67
3.8.3 1 in 6,000 AEP Flood Stage-Discharge Curve Comparison .................................. 69
4. SUMMARY AND RECOMMENDATIONS ............................................................................................ 71
APPENDIX B - Hydraulic Model Development
1. INTRODUCTION................................................................................................................................... 73
2. HYDRAULIC MODEL DEVELOPMENT............................................................................................... 74
2.1 General 74
2.1 Available Topographic Data 74
2.2 Model Modifications 74 2.2.1 Structures ............................................................................................................... 75
3. MODEL CALIBRATION........................................................................................................................ 78
3.1 General 78
3.2 Adopted Roughness Coefficients 78
3.3 Calibration Results 79 3.3.1 Recorded 1974 Water Level Comparison .............................................................. 79
3.3.2 SKM Model Water Level Comparison .................................................................... 79
3.3.3 SKM Model Discharge Comparison ....................................................................... 79

Wivenhoe Alliance Wivenhoe Dam Spillway Augmentation Design Discharges and Downstream Impacts of the Wivenhoe Dam Upgrade
ItemID: 003684262 Page 5 of 93
WIV-RP-HD-004
4. DESIGN FLOOD LEVEL AND FLOOD FLOW ESTIMATION............................................................. 83
4.1 General 83
4.2 Boundary Conditions 83 4.2.1 Inflow Hydrographs................................................................................................. 83
4.2.2 Downstream Tailwater Boundary ........................................................................... 83
5. SUMMARY AND RECOMMENDATIONS ............................................................................................ 85
APPENDIX C - Adopted Spillway Rating Curve
1. INTRODUCTION................................................................................................................................... 87
2. SPILLWAY COEFFICIENT OF DISCHARGE...................................................................................... 88
2.1 Method Of Analysis 88 2.1.1 CFD Modelling........................................................................................................ 88
2.1.2 HEC-RAS ............................................................................................................... 88
2.1.3 USBR...................................................................................................................... 89
2.1.4 USACE ................................................................................................................... 89
2.2 Coefficient of Discharge 89
3. DISCHARGE ESTIMATE COMPARISON............................................................................................ 91
3.1 Adopted Spillway Rating 91
3.2 Sensitivity of Adopted Methodology to Discharge Estimates 92
4. SUMMARY............................................................................................................................................ 93
List of Figures
Figure 3.1 Wivenhoe Dam Auxiliary Spillway General Arrangement ........................... 13
Figure 3.2 Typical Fuse Plug Embankment Cross Section .......................................... 15
Figure 5.1 Inflow and Outflow Annual Series Flood Frequency Curves for the Existing, Stage 1 and Stage 2 Upgrades, Wivenhoe Dam. ............................................... 25
Figure 5.2 Flood Frequency Curves for Pre-Dams Flow, Wivenhoe Inflow (Including Somerset Outflow) and Wivenhoe Outflow (Post Upgrade), 48-hour duration event. .................................................................................................................. 26
Figure 7.1 Upper Brisbane River Rainfall hyetograph and Flow Hydrographs, 24 hour 1 in 10,000 AEP design flood................................................................................. 32
Figure 7.2 Upper Brisbane River Rainfall hyetograph and Flow Hydrographs, 24 hour PMP design flood................................................................................................ 33
Wivenhoe Alliance Wivenhoe Dam Spillway Augmentation Design Discharges and Downstream Impacts of the Wivenhoe Dam Upgrade
ItemID: 003684262 Page 6 of 93
WIV-RP-HD-004
Figure 8.1 Brisbane River Peak Water Level Difference, 1 in 6,000 AEP Wivenhoe Dam Flood With and Without Fuse Plug 1 Flows................................................ 36
Figure 8.2 Maximum Flood Initiation for 1 in 6,000 AEP Flood without Fuse Plug 1 Flows and the Additional Inundation following Fuse Plug 1 Flows, Wivenhoe Dam to Savages Crossing........................................................................................... 37
Figure 8.3 Water Level Hydrographs at Savages Crossing (Fernvale) With and Without Fuse Plug 1 flows, Wivenhoe Dam 1 in 6,000 AEP flood ...................... 39
Figure 8.4 Water Level Hydrographs at Moggill Gauge With and Without Fuse Plug 1 Flows, Wivenhoe Dam 1 in 6,000 AEP flood ...................................................... 39
Figure 8.5 Brisbane River Peak Water Level Difference, 1 in 11,500 AEP Wivenhoe Dam Flood With and Without Fuse Plug 1 Flows................................................ 40
Figure 8.6 Flood Initiation for 1 in 11,500 AEP Flood without Fuse Plug 1 Flows and the Additional Inundation following Fuse Plug 1 Flows, Wivenhoe Dam to Savages Crossing............................................................................................... 41
Figure 8.7 Water Level Hydrographs at Savages Crossing (Fernvale)With and Without Fuse Plug 2 Flows, Wivenhoe Dam 1 in 11,500 AEP flood ................... 42
Figure 8.8 Water Level Hydrographs at Moggill Gauge With and Without Fuse Plug 2 Flows, Wivenhoe Dam 1 in 11,500 AEP flood. ................................................... 43
Figure 8.9 Brisbane River Peak Water Level Difference, 1 in 22,500 AEP Wivenhoe Dam Flood With and Without Fuse Plug 1 Flows................................................ 44
Figure 8.10 Flood Initiation for 1 in 22,500 AEP Flood without Fuse Plug 1 Flows and the Additional Inundation following Fuse Plug 1 Flows, Wivenhoe Dam to Savages Crossing............................................................................................... 45
Figure 8.11 Water Level Hydrographs at Savages Crossing (Fernvale) With and Without Fuse Plug 3 Flows, Wivenhoe Dam 1 in 22,500 AEP flood ................... 46
Figure 8.12 Water Level Hydrographs at Moggill Gauge With and Without Fuse Plug 3 Flows, Wivenhoe Dam 1 in 22,500 AEP flood ................................................. 46
Figure 8.13 Brisbane River Peak Water Level Difference, 1 in 65,000 AEP Wivenhoe Dam Flood With and Without Fuse Plug 1 Flows................................................ 47
Figure 8.14 Flood Initiation for 1 in 65,000 AEP Flood without Fuse Plug 1 Flows and the Additional Inundation following Fuse Plug 1 Flows, Wivenhoe Dam to Savages Crossing............................................................................................... 48
Figure 8.15 Water Level Hydrographs at Savages Crossing (Fernvale) With and Without Fuse Plug 4 Flows, Wivenhoe Dam 1 in 65,000 AEP flood ................... 49
Figure 8.16 Water Level Hydrographs at Moggill Gauge With and Without Fuse Plug 4 Flows, Wivenhoe Dam 1 in 65,000 AEP flood ................................................. 50
APPENDIX A - Hydrological Model Development
Wivenhoe Alliance Wivenhoe Dam Spillway Augmentation Design Discharges and Downstream Impacts of the Wivenhoe Dam Upgrade
ItemID: 003684262 Page 7 of 93
WIV-RP-HD-004
Figure 2.1 Sub-catchment Boundaries, Brisbane River WT42D Model ...................... 59
Figure 2.2 Adopted Auxiliary Spillway Stage-Discharge Relationships, Wivenhoe Dam............................................................................................................................ 62
Figure 3.1 36-hour Duration Storm Cumulative Rainfall Temporal Patterns, Wivenhoe Dam .................................................................................................................... 65
Figure 3.2 Storage Volume Versus Percentage of Time Exceeded, Wivenhoe Dam (1900 to 1996)..................................................................................................... 66
Figure 3.3 Adopted Gated Spillway Rating Curves, Wivenhoe Dam....................... 68
Figure 3.4 1 in 6,000 AEP Adopted Gated Spillway Rating Curve and that Estimated Using WIVOPS, Wivenhoe Dam......................................................................... 69
APPENDIX B - Hydraulic Model Development
Figure 2.1 MIKE 11 Hydraulic Model Configuration, Brisbane River Catchment ...... 76
Figure 3.1 Comparison of Recorded and Predicted Maximum Flood Levels, 1974 Event (Moreton Bay to Sandy Creek) ................................................................. 80
Figure 3.2 Comparison of Recorded and Predicted Maximum Flood Levels, 1974 Event (Sandy Creek to Ipswich-Esk Shire Boundary)......................................... 81
Figure 3.3 Difference in Maximum Flood Levels predicted by the Current and SKM Modelling, 1974 Event ........................................................................................ 82
Figure 3.4 Difference in Maximum Flood Discharges predicted by the Current and SKM Modelling, 1974 Event................................................................................ 82
APPENDIX C - Adopted Spillway Rating Curve
Figure 2.1 Comparison of Cd values estimated using CFD modelling, HEC-RAS, USBR and USACE methodologies. .................................................................... 90
Figure 3.2 – Relative Percent Difference in Discharge Estimates for the Various Methods used Compared to the Adopted Discharges. ....................................... 92
List of Tables
Table 3.1 Fuse Plug Spillway Details, Wivenhoe Dam ................................................ 14
Table 4.1 Existing and Proposed Emergency Gate Opening Rating Curves, Wivenhoe Dam .................................................................................................................... 20
Table 4.2 Gated Spillway Area Works Restrictions, Wivenhoe Dam .......................... 22
Wivenhoe Alliance Wivenhoe Dam Spillway Augmentation Design Discharges and Downstream Impacts of the Wivenhoe Dam Upgrade
ItemID: 003684262 Page 8 of 93
WIV-RP-HD-004
Table 5.1 Peak Outflows and Maximum Lake Levels at Fuse Plug Initiation, Wivenhoe Dam .................................................................................................................... 23
Table 5.2 Design Inflows and Outflows for Existing, Stage 1 and Stage 2 Wivenhoe Upgrade .............................................................................................................. 24
Table 5.3 Comparison between Design Inflows of Various Storm Durations and Fuse Plug Initiation Level Outflows, Wivenhoe Dam ................................................... 27
Table 6.1 Design Discharges and Peak Lake Levels Using PMP Rainfalls of Various Durations, Wivenhoe Dam .................................................................................. 28
Table 6.2 36-Hour Storm Peak Inflows and Outflows and Maximum Lake Levels using Various Temporal Patterns and PMP Rainfalls, Wivenhoe Dam............... 29
Table 6.3 Sensitivity of PMF Outflows to Various Concurrent Downstream Flows, Wivenhoe Dam ................................................................................................... 30
Table 6.4 Sensitivity of PMF Lake Levels to Lateral Fuse Plug Erosion Rates, Wivenhoe Dam ................................................................................................... 31
Table 6.5 Sensitivity of Emergency Gate Opening Procedures to the PMF, Wivenhoe Dam .................................................................................................................... 31
Table 8.1 Concurrent Lower Brisbane River Flows Used to Determine the Difference in Downstream Water Levels .................................................................................. 36
Table 8.2 Brisbane River Flood Peak Travel Times From Commencement of the 36hour Duration Storm, Pre and Post Fuse Plug Flows ..................................... 51
APPENDIX A - Hydrological Model Development
Table 2.1 Fuse Plug Crest Levels and Adopted Fuse Plug Initiation Level, Wivenhoe Dam .................................................................................................................... 62
Table 3.1 Design Catchment Rainfall Depths and Aerial Reduction Factors for Various Storm Durations, Wivenhoe Dam Catchment ..................................................... 64
APPENDIX B - Hydraulic Model Development
Table 2.1 Brisbane River Bridges, MIKE 11 Model ................................................... 77
Table 4.1 WT42D Inflow Hydrograph locations, Brisbane and Ipswich Rivers MIKE 11 Model. ................................................................................................................. 84
APPENDIX C - Adopted Spillway Rating Curve
Table 2.1 Adopted Right Abutment Spillway Rating Curve ....................................... 91

Wivenhoe Alliance Wivenhoe Dam Spillway Augmentation Design Discharges and Downstream Impacts of the Wivenhoe Dam Upgrade
ItemID: 003684262 Page 9 of 93
Date Printed: 27/09/2005 3:25:00 PM Last Saved: 27/09/2005 3:24:00 PM
1 . INTRODUCTION
SEQWater is proposing to upgrade the flood discharge capacity of Wivenhoe Dam, located on the Brisbane River, to safely pass all floods up to the Probable Maximum Flood (PMF). To achieve PMF capacity, it is proposed to construct two auxiliary spillways consisting of a secondary, three bay fuse plug on the right abutment, and a tertiary, one bay fuse plug at Saddle Dam 2, some 2.8 km southeast of the existing spillway. Works will also be undertaken on the main embankment to raise the maximum lake level to 80 m AHD. In setting the maximum lake level, zero freeboard is proposed.
It is proposed to construct the necessary works in two stages. Stage 1 will involve the construction of the secondary spillway on the right abutment plus works to upgrade the main embankment. The tertiary spillway will be constructed in Stage 2 at a later date.
This report outlines the details of the proposed auxiliary spillways together with the changes to the gate operation procedures that are necessary as a result of the upgrade works. Results of hydrological and hydraulic modelling of the catchment to estimate design discharges at the dam and the impact of the proposed upgrade works on downstream flows and flood levels are also provided. This report updates a previous report on the proposed auxiliary spillways dated September 2004 using data collected during the construction of the right abutment spillway including the results of a computational fluid dynamics (CFD) analysis of the main spillway and right abutment spillway.
The report is structured as follows:
• Section 2 outlines the previous design flood studies undertaken of the dam;
• Section 3 outlines the proposed auxiliary spillway configuration and describes their behaviour;
• Section 4 describes the flood operating procedures currently used for Wivenhoe and Somerset Dams together with the changes proposed to the current procedures both during the Stage 1 construction phase and post construction;
• Section 5 outlines the design flood discharges at the dam;
• Section 6 presents a sensitivity of the Probable Maximum Flood outflow estimate for the dam to storm duration, temporal patterns, concurrent downstream flows, various fuse plug erosion rates and proposed changes to the emergency gate opening procedures.
• Section 7 outlines the impact of the proposed gate operation procedure changes.
• Section 8 outlines the downstream impacts of the proposed upgrade works.
• Section 9 presents the conclusions of the study;
• Section 10 is a list of references.
The report also includes three appendices.

Wivenhoe Alliance Wivenhoe Dam Spillway Augmentation Design Discharges and Downstream Impacts of the Wivenhoe Dam Upgrade
ItemID: 003684262 Page 10 of 93
Date Printed: 27/09/2005 3:25:00 PM Last Saved: 27/09/2005 3:24:00 PM
• Appendix A describes the hydrological models used to determine design flood discharges together with the hydrological model parameters used to estimate design flows;
• Appendix B describes the development and calibration of the hydraulic model used to determine the downstream impacts of the upgrade works.
• Appendix C describes the development of the right abutment spillway rating curve.

Wivenhoe Alliance Wivenhoe Dam Spillway Augmentation Design Discharges and Downstream Impacts of the Wivenhoe Dam Upgrade
ItemID: 003684262 Page 11 of 93
Date Printed: 27/09/2005 3:25:00 PM Last Saved: 27/09/2005 3:24:00 PM
2 . PREVIOUS FLOOD STUDIES
Wivenhoe Dam has a catchment area of about 7,048 km2. The current spillway capacity of Wivenhoe Dam is based on a PMF inflow of 15,090 m3/s made by the Queensland Water Resource Commission (WRC) in 1977 (Hausler and Porter, 1977). This estimate was based on a 48-hour duration probable maximum precipitation (PMP) estimate of 480 mm and synthetic unit graphs using the Clarke Johnson method.
WRC revised the design flood estimates in 1983 when the dam was in its final phase of construction. This revision was brought about because the Commonwealth Bureau of Meteorology (BOM) had revised their estimate of the PMP for the Wivenhoe catchment. In addition, better rainfall-runoff-routing techniques were available at that time to derive design flows. The revised PMF inflow estimated in 1983 was 48,000 m3/s, which is some 220% above the 1977 estimate. The increase was mainly attributed to the changes in the PMP, which increased to 1,000 mm for the 48-hour duration storm.
The Department of Natural Resources (DNR) (formally WRC) revised the design flows again as part of a comprehensive safety review of the dam undertaken between 1990 and 1994. Rainfall-runoff-routing models of the catchment were developed together with a dam flood routing model used to derive outflows from Somerset and Wivenhoe Dams taking into account the flood operating procedures used at that time. Somerset Dam, which has a catchment area of 1,331 km2 drains into Wivenhoe Dam.
As part of the review, the BOM was requested to update the PMP estimates for the catchment (BOM, 1991). The revised PMP estimates were used in the 1994 analysis to estimate PMF. DNR estimated the PMF inflow to be 39,880 m3/s, which is lower than the 1983 estimate but still substantially higher than the 1977 estimate. The lower PMF estimate were mainly attributed (again) to changes in the PMP, which was revised down to 870 mm for the 48-hour duration storm. The development and calibration of the rainfall runoff routing model was also much more comprehensive than previous studies. Flood operating procedures were also incorporated into the models to estimate design outflows. A detailed review of the previous studies is provided in Report No. 8a of the DNR flood study reports (1994).
The BOM recently updated the PMP estimates for the Wivenhoe catchment using the revised Generalised Tropical Storm Method (BOM, 2003). This report also provides the latest information on temporal patterns and spatial rainfall weightings to be used with the new PMP data. The 2003 PMP estimates are some 20% higher than PMP estimates used by DNR in the1994 study. As a result, the new PMF estimate for the catchment using this data is likely to be significantly higher than the 1994 estimate and much larger than the current spillway capacity of Wivenhoe Dam.
The DNR models (1994) have been used to estimate design flows for the current study.

Wivenhoe Alliance Wivenhoe Dam Spillway Augmentation Design Discharges and Downstream Impacts of the Wivenhoe Dam Upgrade
ItemID: 003684262 Page 12 of 93
Date Printed: 27/09/2005 3:25:00 PM Last Saved: 27/09/2005 3:24:00 PM
3 . PROPOSED AUXIL IARY SPILLWAYS
3.1 DESIGN OUTCOMES
The upgrade of Wivenhoe Dam has been driven by the need to reduce flood risk to the downstream community. To achieve this reduction, the following outcomes have been adopted for the design of the upgrade works:
• To allow Wivenhoe Dam to safely pass the latest estimate of the Probable Maximum Flood (PMF);
• To preserve the flood mitigation benefits of Wivenhoe and Somerset Dam for more frequent flood events;
• To ensure that outflows are less than inflows for all flood events;
• To limit the frequency of operation of the auxiliary spillway to reduce downstream damage; and
• To minimise the cost of the upgrade.
The proposed auxiliary spillways allow SEQWater to satisfy all of the above outcomes.
3.2 PROPOSED AUXILIARY SPILLWAY CONFIGURATION
The auxiliary spillway works for Wivenhoe Dam will consist of a three bay fuse plug spillway on the right abutment and a one bay fuse plug spillway at Saddle Dam two. The location and alignment of the two auxiliary spillways is shown in Figure 3.1. Works will also be undertaken on the main embankment to raise the maximum lake level to 80 m AHD. In setting the maximum lake level, zero freeboard is proposed. Details of the two auxiliary spillways are provided in Table 3.1.
3.3 STAGED CONSTRUCTION
It is proposed to undertake the works in two stages. The works proposed for the first stage consist of:
• The three right bank fuse plug spillways separated by concrete divider walls;
• The construction of a new highway bridge;
• A concrete cut off trench along the main dam wall to intersect with the existing clay core and strengthening of the existing crash barrier to raise the maximum lake level to 80 m AHD; and
• Post tensioning the main spillway monolith to resist overturning at the new maximum lake level.

Wiv
enho
e A
llian
ce
Wiv
enho
e D
am S
pillw
ay A
ugm
enta
tion
Des
ign
Dis
char
ges
and
Dow
nstre
am Im
pact
s of
the
Wiv
enho
e D
am U
pgra
de
Item
ID: 0
0368
4262
P
age
13 o
f 93
Dat
e P
rinte
d: 2
7/09
/200
5 3:
25:0
0 P
M
Last
Sav
ed: 2
7/09
/200
5 3:
24:0
0 P
M
Fi
gure
3.1
Wiv
enho
e D
am A
uxili
ary
Spill
way
Gen
eral
Arr
ange
men
t

Wivenhoe Alliance Wivenhoe Dam Spillway Augmentation Design Discharges and Downstream Impacts of the Wivenhoe Dam Upgrade
ItemID: 003684262 Page 14 of 93
Date Printed: 27/09/2005 3:25:00 PM Last Saved: 27/09/2005 3:24:00 PM
Table 3.1 Fuse Plug Spillway Details, Wivenhoe Dam
Auxiliary Spillway Location
Spillway Crest
Control Type
Spillway Crest Width
(m)
Spillway Crest Level
(m AHD)
Fuse Plug Pilot Channel Crest Level
(m AHD)
Right Bank
Fuse plug 1 Ogee 33 67 75.7
Fuse plug 2 Ogee 64.5 67 76.2
Fuse plug 3 Ogee 65.5 67 76.7
Saddle Dam 2
Fuse plug 4 Ogee 100 67 78.3
Stage 1 works increase the dam crest flood to an annual exceedance probability (AEP) of approximately 1 in 100,000. The current dam crest flood is 1 in 22,000 AEP. The stage 1 works commenced in early 2004 and are to be completed by the end of 2005.
Stage 2 works consist of the construction of a single bay fuse plug at saddle dam 2. It is proposed to undertake a review of the Stage 2 at the next comprehensive dam safety review due in 2017.
3.4 FUSE PLUG SPILLWAYS
3.4.1 Concept of Controlled Fuse Plug Spillway
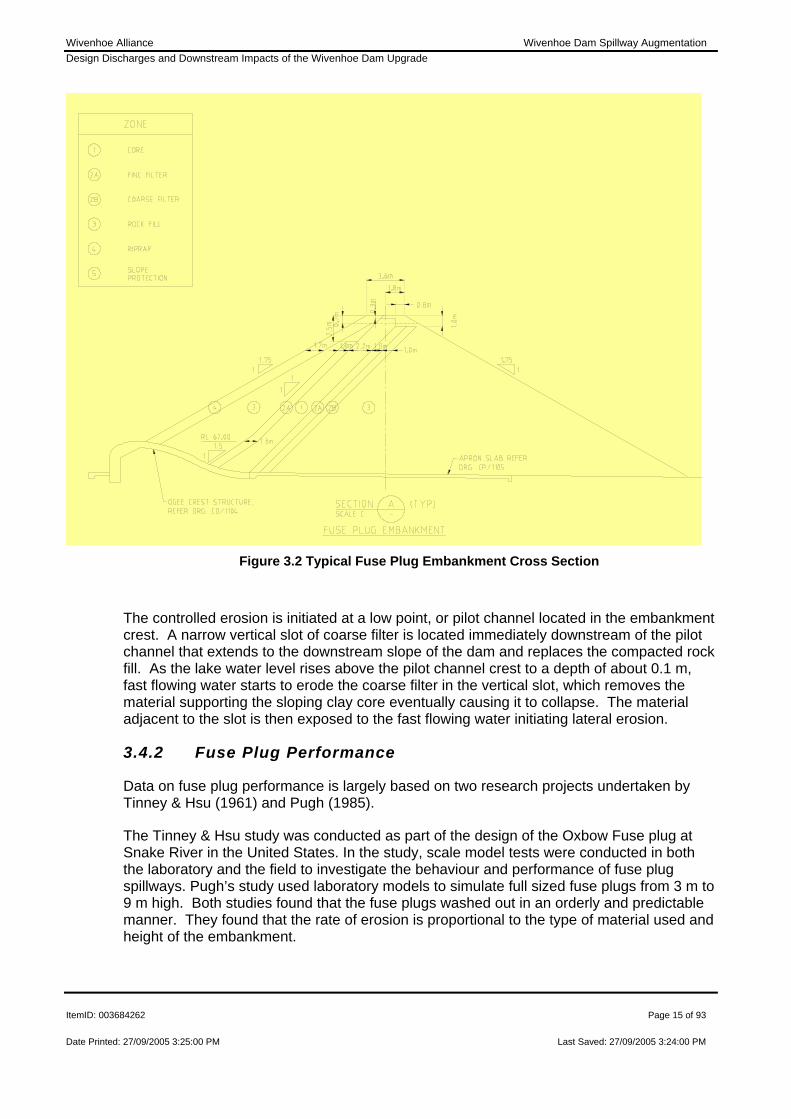
Figure 3.2 shows a cross section of a typical fuse plug embankment. It is effectively a zoned earth and rock fill embankment that is constructed on a non erosive sill or weir. The embankment is designed to erode in a controlled manner when the lake water level reaches a pre-determined level. Below this level, the embankment impounds water in the same manner as a typical zoned earth and rock fill embankment.
The upstream face of the embankment consists of a riprap layer to protect against wave action. Consecutive layers consist of coarse rock followed by a coarse filter and then the impermeable clay core that are laid on a similar slope to the riprap. Downstream of the sloping clay core are more layers of filters that lie on compacted rock fill, which extends to the downstream slope of the embankment.
Wivenhoe Alliance Wivenhoe Dam Spillway Augmentation Design Discharges and Downstream Impacts of the Wivenhoe Dam Upgrade
ItemID: 003684262 Page 15 of 93
Date Printed: 27/09/2005 3:25:00 PM Last Saved: 27/09/2005 3:24:00 PM
Figure 3.2 Typical Fuse Plug Embankment Cross Section
The controlled erosion is initiated at a low point, or pilot channel located in the embankment crest. A narrow vertical slot of coarse filter is located immediately downstream of the pilot channel that extends to the downstream slope of the dam and replaces the compacted rock fill. As the lake water level rises above the pilot channel crest to a depth of about 0.1 m, fast flowing water starts to erode the coarse filter in the vertical slot, which removes the material supporting the sloping clay core eventually causing it to collapse. The material adjacent to the slot is then exposed to the fast flowing water initiating lateral erosion.
3.4.2 Fuse Plug Performance
Data on fuse plug performance is largely based on two research projects undertaken by Tinney & Hsu (1961) and Pugh (1985).
The Tinney & Hsu study was conducted as part of the design of the Oxbow Fuse plug at Snake River in the United States. In the study, scale model tests were conducted in both the laboratory and the field to investigate the behaviour and performance of fuse plug spillways. Pugh’s study used laboratory models to simulate full sized fuse plugs from 3 m to 9 m high. Both studies found that the fuse plugs washed out in an orderly and predictable manner. They found that the rate of erosion is proportional to the type of material used and height of the embankment.

Wivenhoe Alliance Wivenhoe Dam Spillway Augmentation Design Discharges and Downstream Impacts of the Wivenhoe Dam Upgrade
ItemID: 003684262 Page 16 of 93
Date Printed: 27/09/2005 3:25:00 PM Last Saved: 27/09/2005 3:24:00 PM
The NSW Public Works and Services, now the NSW Department of Commerce, extrapolated the results of these studies to design the 15 m high fuse plug embankments at Warragamba Dam in Sydney (DPWS, 1998). The analysis undertaken for Warragamba Dam has been used to select the material and estimate the lateral erosion rates for the proposed fuse plugs at Wivenhoe Dam. Based on the fuse plug material selected for Wivenhoe, lateral erosion rates of 100 m per hour are expected. The sensitivity of fuse plug erosion rates to peak outflows are given in Section 6.5.
3.4.3 Fuse Plug Reconstruction
Fuse plug embankments can generally be reconstructed within three months of an initiation event provided designs are in place and sufficient material is available. For Wivenhoe Dam, designs to replace the structure are available. However, material will be acquired at the time of an initiation event. The initiation of the first fuse plug occurs at an annual exceedance probability of about of 1 in 6,000. It is not practical to stockpile material for such a rare event. To ensure sufficient material is available at the time of an initiation event, SEQWater will identify sources of replacement material, should it be needed, as part of the Dam Safety Inspections undertaken every 10 to 15 years.

Wivenhoe Alliance Wivenhoe Dam Spillway Augmentation Design Discharges and Downstream Impacts of the Wivenhoe Dam Upgrade
ItemID: 003684262 Page 17 of 93
Date Printed: 27/09/2005 3:25:00 PM Last Saved: 27/09/2005 3:24:00 PM
4 . GATE OPERATION PROCEDURES
The “Manual of Operational Procedures for Flood Mitigation for Wivenhoe and Somerset Dams” (SEQWater, 2002) outlines guidelines for the Senior Flood Operations Engineer to operate the gates of both Wivenhoe and Somerset Dams during a flood. These guidelines are designed to maximise the available flood storage capacity of both dams to minimise disruption and flood damage in the downstream areas. Overriding rules are in place to ensure the safety of the dam is maintained. The ultimate responsibility for managing the operation of the gates is given to the Senior Flood Operations Engineer.
4.1 SOMERSET DAM GATE OPENING PROCEDURES
The gate operating rules for Somerset Dam during flood events are summarised below:
• At the commencement of a flood, the radial gates are raised and the regulators and sluice gates are closed;
• The low level regulator valves and sluice gates are sequentially opened when the lake level in Wivenhoe Dam begins to fall or the level in Somerset exceeds 102.25 m AHD;
• The sequencing of opening the valves and sluice gates is undertaken to reduce the water level rate of rise to ensure the safety of the dam;
• If the flood event emanates from the Stanley River catchment without significant runoff in the Upper Brisbane River catchment, the operation of Somerset Dam will proceed on the basis that Wivenhoe Dam has already peaked.
4.2 WIVENHOE DAM GATE OPENING PROCEDURES
There are four distinct gate opening procedures for Wivenhoe Dam during flood events. These are summarised below:
Procedure 1
When the dam water level is between 67.25 m AHD and 68.5 m AHD, releases are made onto Lockyer Creek flows to minimise the submergence of downstream bridges between the dam and Mount Crosby Weir. There are five sequential sub-procedures, which are based both on dam water level and the waterway capacity of the various downstream bridges.
Procedure 2
When the dam water level is between 68.5 m AHD and 74 m AHD, releases are made onto Lockyer Creek flows ensuring the total flows do not exceed 3,500 m3/s at Lowood or exceed the peak flow from Lockyer Creek or the Bremer River. Care is taken not to prematurely submerge Fernvale Bridge and Mt Crosby Weir. The gates are also operated to ensure they are not overtopped.

Wivenhoe Alliance Wivenhoe Dam Spillway Augmentation Design Discharges and Downstream Impacts of the Wivenhoe Dam Upgrade
ItemID: 003684262 Page 18 of 93
Date Printed: 27/09/2005 3:25:00 PM Last Saved: 27/09/2005 3:24:00 PM
Procedure 3
When the dam water level is between 68.5 m AHD and 74 m AHD, releases are made onto Lockyer Creek flows ensuring that the total flows do not exceed 3,500 m3/s at Lowood and do not exceed 4,000 m3/s at Moggill. This value is the upper limit of non damaging flows for the urban reaches of the Brisbane River. Care is taken not to prematurely submerge Fernvale Bridge and Mt Crosby Weir. The gates are also operated to ensure they are not overtopped.
Procedure 4
When the dam water exceeds 74 m AHD, the gates are sequentially opened until the level in Wivenhoe Dam begins to fall. The gates are opened at a rate of 10 minutes per 500 mm increment unless the water level rise is expected to cause the gates to be overtopped. In this case, the gates can be raised at 5 minute increments.
4.3 GATE CLOSURE PROCEDURES
The gate closing procedures are designed to drain the dams within seven days after the flood has peaked to ensure sufficient storage capacity is available for any subsequent floods. However, if the combined flow from Lockyer Creek and the dam at Lowood is greater than 3,500 m3/s then flow at the dam is reduced to provide a combined flow of 3,500 m3/s.
4.4 PROPOSED CHANGES TO THE FLOOD OPERATING PROCEDURES
The Manual of Operational Procedures for Flood Mitigation for Wivenhoe and Somerset Dams will be updated to incorporate the operation of the auxiliary spillways. The general philosophy of the change is to maximise the capacity of the existing spillway to reduce the chance of the fuse plugs initiating whilst making the best use of the available flood storage to minimise downstream flooding. The reasons for minimising the chance that a fuse plug will operate are as follows:
• Fuse plug flows will erode the channel of Spring Creek immediately downstream of the spillway chute;
• Fuse plug flows will cause a rapid increase in downstream flood flows and flood levels;
• The initiation of a fuse plug limits the ability to mitigate consecutive floods because they take some months to re-construct; and
• Fuse plugs are expensive to rebuild.
A summary of the proposed changes to the gate opening procedures following the completion of the proposed upgrade works is outlined below:

Wivenhoe Alliance Wivenhoe Dam Spillway Augmentation Design Discharges and Downstream Impacts of the Wivenhoe Dam Upgrade
ItemID: 003684262 Page 19 of 93
Date Printed: 27/09/2005 3:25:00 PM Last Saved: 27/09/2005 3:24:00 PM
• Somerset Dam opening and closing procedures are to remain generally unchanged. If the safety of Somerset Dam is not compromised, Somerset gates and valves can be temporarily closed to prevent a fuse plug from initiating. With respect to the safety of Somerset, SMEC (2004) estimated that the dam has an increased risk of cracking at a level of 109.7 m AHD. Altering the Somerset gate operating procedures is considered safe below this level;
• Wivenhoe gate opening procedures 1, 2 and 3 will remain unchanged. This means that the proposed works will not affect outflows until the dam reaches a water level of 74 m AHD. It is noted that the 1999 flood, which had an AEP of about 1 in 100 at the dam reached a peak water level of 70.41 m AHD;
• Procedure 4 will be modified to incorporate the new fuse plug spillways. More specifically:
(a) If the flood level in Wivenhoe using a 500 mm in 10-minute gate opening procedure is predicted to peak below a level of 75.5 m AHD the gates are to be operated to maximise flood storage but to ensure the first fuse plug does not initiate. This sub-procedure effectively represents the existing gate operating procedures. (An allowance of 0.2 m below the initiation level of the first fuse plug has been given to account for errors in predicting flood levels and possible wave run up, which may cause premature initiation of the fuse plug).
(b) If the flood level in Wivenhoe using a 500 mm in 10-minute gate opening procedure is predicted to be above 75.5 m AHD, but is predicted to be below 75.5 m AHD using a 1 m in 10 minute gate opening procedure, the gates are to be raised at a rate to maximise flood storage capacity but to prevent the first fuse plug from initiating. (The Senior Flood Operations Engineer at Sunwater (Robert Ayre) and dam supervisor (Doug Grigg) advised during a meeting on the 27th November 2003 that changing the gate increment is the most practical method of increasing the rate of opening the gates.)
(c) If the flood level in Wivenhoe using a 1 m in 10-minute gate opening procedure is predicted to be above 75.5 m AHD, the gates are to be raised at a rate to ensure they are out of the water before the initiation of the first fuse plug. The gates are to be secured in a locked position before the dam water level reaches 75.7 m AHD.
• The concepts of the Wivenhoe gate closure rules will remain unchanged. However, releases from the main spillway may be reduced to recompense the releases from the auxiliary spillways to reduce the downstream flows below the non-damaging flows as quickly as possible, whilst still ensuring flood storage is available for consecutive floods within 7 days.
• If a consecutive flood occurs prior to the reconstruction of the fuse plug embankments, the gates are to be operated, to the extent possible, so that the same discharge restrictions apply as would have if the fuse plug embankment was in tact.
The impacts of these changes on downstream flows are discussed in the following sections.

Wivenhoe Alliance Wivenhoe Dam Spillway Augmentation Design Discharges and Downstream Impacts of the Wivenhoe Dam Upgrade
ItemID: 003684262 Page 20 of 93
Date Printed: 27/09/2005 3:25:00 PM Last Saved: 27/09/2005 3:24:00 PM
4.4.1 Proposed Changes to the Emergency Gate Opening Procedures
The emergency gate opening procedures are used by the dam supervisor during a flood when communications between the dam and the flood centre are not available. In this situation, the dam supervisor has no information on downstream or upstream flows or rainfall predictions to make informed decisions to mitigate downstream flooding. On these occasions, the dam supervisor uses emergency gate opening procedures that are based solely on the water level in the dam.
It is proposed to change the emergency gate opening procedures as a result of the increase in PMF and the proposed auxiliary spillways. The proposed changes are shown in Table 4.1.
Table 4.1 Existing and Proposed Emergency Gate Opening Rating Curves, Wivenhoe Dam
Dam Outflows (m3/s) Dam Water Level (m AHD)
Existing Proposed
67.0 0 0
67.5 50 50
68.0 155 155
68.5 260 260
69.0 470 470
69.5 640 640
70.0 875 875
70.5 1,115 1,115
71.0 1,365 1,365
71.5 1,560 1,560
72.0 1,820 1,820
72.5 2,250 2,250
73.0 2,960 2,960
73.5 3,850 3,850
74.0 4,750 5,500
74.5 6,030 7,110
75.0 7,830 8,720
75.5 9,150 10,330
76.0 10,790 10,790
76.5 11,440 11,440
77.0 12,070 12,070
79.0 13,600 13,600
79.7 13,500 13,500
80.0 13,440 13,440

Wivenhoe Alliance Wivenhoe Dam Spillway Augmentation Design Discharges and Downstream Impacts of the Wivenhoe Dam Upgrade
ItemID: 003684262 Page 21 of 93
Date Printed: 27/09/2005 3:25:00 PM Last Saved: 27/09/2005 3:24:00 PM
Table 4.1 shows that the changes to the emergency procedures are limited to lake levels between 73.5 m AHD and 76 m AHD. This range of lake levels is similar to the range of lake levels that are affected by the Procedure 4b gate operation procedure used when communications are available. These lake levels only occur during large to extreme floods. It is noted that for extreme floods, the emergency procedures may open the gates at a faster rate than recommended in Section 4.4.
4.5 PROPOSED CHANGES TO THE FLOOD OPERATING PROCEDURES DURING CONSTRUCTION
The Stage 1 construction phase is expected to last for up to two years. Some of the works will temporarily impact on the operation of the gates or temporarily lower the available flood storage during this period. The “Manual of Operational Procedures for Flood Mitigation for Wivenhoe and Somerset Dams” has been updated to assist the Senior Flood Operations Engineer to manage a flood during the construction period. The revised Manual outlines the responsibilities of the Alliance as well as the Senior Flood Operation Engineer to ensure floods are managed as effectively as possible.
The general philosophy of the manual revisions is to minimise the disruption to the dams flood mitigating capability during the construction program and to minimise the possibility of damaging the works. In particular, any works that lower the available flood storage or significantly impact on the operation of the gates will be programmed to be completed outside the wet season months of January, February and March. The gated spillway works program will be developed to ensure only one gate is inoperable at any one time.
A summary of the proposed changes to the gate opening procedures during the construction period is outlined below:
4.5.1 Works within the Gated Spillway
The following provisions will apply for works undertaken within the gated spillway:
• The opening of spillway gates to discharge floodwaters is at the sole discretion of the Senior Flood Operations Engineer;
• There is to be no obstruction of any spillway bay without the written approval of the Senior Flood Operations Engineer;
• All gates are to be capable of being operated at short notice during a flood if required. To ensure this capability is maintained, Table 4.2 specifies limitations that apply to the number of bays in which works may be occurring at any time. This table also nominates a target notice period to be provided by the Senior Flood Operations Engineer for the removal of construction material from the spillway bays prior to their use for releases. However the Senior Flood Operations Engineer is not constrained to provide this length of notice before operating any particular gate if its earlier operation is considered necessary.
• A maximum of one gate may be treated as inoperable and remain closed if a flood will severely damage works if it is opened, and the expected flood magnitude can be catered for with 4 gates. The other gates are to be operated in accordance with the existing flood operational procedures but to compensate for the loss of flow in

Wivenhoe Alliance Wivenhoe Dam Spillway Augmentation Design Discharges and Downstream Impacts of the Wivenhoe Dam Upgrade
ItemID: 003684262 Page 22 of 93
Date Printed: 27/09/2005 3:25:00 PM Last Saved: 27/09/2005 3:24:00 PM
the closed gate. As the flood rises to the top of the closed gate at an EL 73 m AHD, the gate is incrementally raised to prevent it from being overtopped. It is noted that a large flood is required for the lake level to reach EL 73 m AHD.
Table 4.2 Gated Spillway Area Works Restrictions, Wivenhoe Dam
Dam Level Season Maximum number of bays that may be
occupied at any time
Comments
Below EL 64.0 Winter (May to September)
3 12 hours notice to clear spillway
Below EL 64.0 Summer (October to April)
2 12 hours notice to clear spillway
Above EL 64.0 Winter (May to September)
2 12 hours notice to clear spillway
Above EL 64.0 Summer (October to April)
2 12 hours notice to clear spillway
Above EL 66.0 Flood Season (January to April)
1 Preferably not gate 1 or 5, 6 hours notice to clear spillway
The Corporation must prepare a Standing Operating Procedure for the conduct of works in the gated spillway whereby the above provisions are met such the capacity to achieve the dam’s operational objectives is maintained.
4.5.2 Works in the Auxiliary Spillway
The embankment forming the temporary road diversion that acts as a coffer dam is to be retained in place until the construction of the fuse plug has proceeded past EL 74, and then its removal is only to proceed once the written approval of a Senior Flood Operations Engineer has been obtained.

Wivenhoe Alliance Wivenhoe Dam Spillway Augmentation Design Discharges and Downstream Impacts of the Wivenhoe Dam Upgrade
ItemID: 003684262 Page 23 of 93
Date Printed: 27/09/2005 3:25:00 PM Last Saved: 27/09/2005 3:24:00 PM
5 . WIVENHOE DAM DESIGN DISCHARGES
5.1 METHOD OF ANALYSIS
Three numerical models were used to estimate design discharges at Wivenhoe Dam:
• The WT42D rainfall runoff routing model was used to estimate inflow hydrographs to Wivenhoe Dam and Somerset Dam and the downstream tributary flows from Lockyer Creek and the Bremer River;
• The WIVOPS model was used to derive an outflow hydrograph from Somerset Dam and derive outflows for Wivenhoe Dam for floods that do not initiate a fuse plug; and
• The FLRoute model was used to determine Wivenhoe Dam outflow hydrographs for events that do initiate a fuse plug.
Details of these three models together with adopted design parameters are provided in Appendix A.
5.2 SPILLWAY DISCHARGES AT FUSE PLUG INITIATION
Table 5.1 shows lake water levels and discharges from the various spillways when each fuse plug initiates. The approximate flood (inflow) AEP’s at which the fuse plugs initiate are also shown. It has been assumed that a depth averaged water level of 0.1m over the fuse plug pilot channel crest is required to initiate the fuse plug. Spillway chute losses of 0.03m and 0.08 m have been assumed for bay 2 and bay 3 on the right abutment respectively. These losses were determined from the 3D CFD modelling of the spillway undertaken by Worley (2004).
Table 5.1 Peak Outflows and Maximum Lake Levels at Fuse Plug Initiation, Wivenhoe Dam
Peak Outflow (m3/s) Fuse Plug No.
Initiated
Approx. Inflow AEP (1
in X Years) Gated Spillway
Total Right Abutment (RA)
Spillway
Saddle Dam 2 (SD2) Spillway
Lake Water Level at Fuse Plug Initiation
(m AHD)
1 6,000 10,600 1,650 0 75.80
2 11,500 11,200 5,400 0 76.33
3 22,500 11,900 9,900 0 76.88
4 (SD2) 65,000 13,100 12,200 7,550 78.40

Wivenhoe Alliance Wivenhoe Dam Spillway Augmentation Design Discharges and Downstream Impacts of the Wivenhoe Dam Upgrade
ItemID: 003684262 Page 24 of 93
Date Printed: 27/09/2005 3:25:00 PM Last Saved: 27/09/2005 3:24:00 PM
The following comments are made with respect to the above results:
• The first fuse plug initiates at an AEP of about 1 in 6,000. This is an exceptionally rare initiation level in comparison to auxiliary spillway retrofits of other large dams in Australia. For instance, the initiation of the first fuse plug at Warragamba Dam in Sydney is at an AEP of 1 in 750;
• The other fuse plugs initiate at AEP’s of approximately 1 in 11,000, 1 in 22,500 and 1 in 65,000 AEP respectively;
• The discharge through each fuse plug bay increases incrementally as the flood AEP reduces, as shown by the difference between right abutment discharges at each initiation point; and
• The first fuse plug breach increases downstream flows by about 1,650 m3/s within about 20 to 30 minutes. The second fuse plug breach increases flows by 3,600 m3/s within about 30 to 40 minutes and the third by 4,000 m3/s in about the same time. The final fuse plug at Saddle Dam 2 increases downstream flows by 7,400 m3/s in about an hour.
5.3 DESIGN DISCHARGES
Table 5.2 shows design inflows and outflows for the existing dam and the Stage 1 and Stage 2 dam upgrades, for design floods ranging from the 1 in 200 AEP to the PMF. Figure 5.1 shows the inflow and outflow annual series flood frequency curves over the range of floods analysed. Peak inflows represent the sum of inflows from the upper Brisbane River catchment and outflows from Somerset Dam. Table 5.2 Design Inflows and Outflows for Existing, Stage 1 and Stage 2 Wivenhoe Upgrade
Peak Outflow (m3/s) Event (1in X) Peak Inflow (m3/s)
Existing Stage 1 Stage 2
200 8,200 2,800 2,800 2,800
500 10,300 3,700 3,700 3,700
1,000 12,300 5,700 5,700 5,700
2,000 14,000 6,600 6,600 6,600
5,000 17,300 8,900 10,400 c 10,400 c
10,000 20,600 11,700 12,900 12,900
22,000 a 25,900 12,400 a 17,700 17,700
50,000 33,500 - b 24,100 24,100
100,000 42,600 - b 28,100 a 34,900
PMF 49,200 - b - b 37,400 a
a Dam Crest Flood b Overtops dam wall c Increases due to changes to Procedure 4.

Wivenhoe Alliance Wivenhoe Dam Spillway Augmentation Design Discharges and Downstream Impacts of the Wivenhoe Dam Upgrade
ItemID: 003684262 Page 25 of 93
Date Printed: 27/09/2005 3:25:00 PM Last Saved: 27/09/2005 3:24:00 PM
0
10,000
20,000
30,000
40,000
50,000
Annual Exceedance Probability ( 1 in X)
Dis
char
ge (m
3 /s)
Wivenhoe Inflow
Outflow (ExistingDam)Outflow (Stage 1)
Outflow (Stage 2)
100 1,000 10,000 100,000 1,000,000
Stage 1 DC
F
PMF
PMF
Fuseplug 1
Fuseplug 2
Fuseplug 3
Fuseplug 4
Com
mencem
ent of Procedure 4
Existing DC
F
Com
mencem
ent of Procedure 4(b)
Figure 5.1 Inflow and Outflow Annual Series Flood Frequency Curves for the Existing, Stage 1
and Stage 2 Upgrades, Wivenhoe Dam.
The following is of note with respect to the results in Table 5.2 and Figure 5.1:
• The 36-hour storm produces the highest inflow peak for all floods;
• The 48-hour storm produces the highest outflow peak for the 1 in 200, 1 in 500, 1 in 5,000 and 1 in 10,000 AEP events for the proposed dam upgrade and the 1 in 5,000 AEP event for the existing dam. The 72 hour event produces the highest outflow peak for the 1 in 1,000 and 1 in 2,000 AEP events for both the existing and proposed dam upgrades. The 36-hour storm produces the highest outflow peak for events more extreme than the 1 in 10,000 AEP event for both the existing and proposed dam upgrades;
• Both Wivenhoe and Somerset Dams have a significant impact on design flood outflow peaks. Somerset Dam alone reduces the PMF inflow peak to Wivenhoe Dam by over 6,000 m3/s. Combined Stage 1 and Stage 2 works reduce the PMF peak outflow by a further 11,800 m3/s;
• The existing dam is designed for a maximum flood level of 77 m AHD, which is the top of the existing clay core and filters. The dam has an increased risk of failure above this level. The flood AEP at this level is about 1 in 10,000;
• The proposed works do not change outflows for flood events up to the 1 in 2,000 AEP event. This is substantially higher than the 1974 flood, which had an AEP of about 1 in 100 at the dam;
• The increase in outflow for the 1 in 5,000 AEP event, prior to the fuse plug initiation, is due to the proposed changes to the gate operation procedure 4 to ensure the gates are out of the water before the first fuse plug initiates.
• The rapid increases in outflows in the annual series frequency curves represent the initiation of the fuse plugs;

Wivenhoe Alliance Wivenhoe Dam Spillway Augmentation Design Discharges and Downstream Impacts of the Wivenhoe Dam Upgrade
ItemID: 003684262 Page 26 of 93
Date Printed: 27/09/2005 3:25:00 PM Last Saved: 27/09/2005 3:24:00 PM
• The AEP of the existing dam crest flood is 1 in 22,000 at an elevation of 79m AHD;
• The AEP of the Stage 1 dam crest flood is about 1 in 100,000;
5.4 DAM INFLOW AND OUTFLOW COMPARISON A design objective of the proposed auxiliary spillway is to ensure outflows from the dam do not exceed inflows for any conceivable flood. To assess this objective, the models were run for all storm durations and all design AEP’s. The results of the analysis are given below.
5.4.1 48hour Storm Duration Flood Frequency Curve
Figure 5.2 shows flood frequency curves for the Wivenhoe Dam natural (pre Somerset) inflow and Wivenhoe Dam (post Somerset) inflow and Wivenhoe Dam (post upgrade) outflow for the 48 hour duration event. The 48 hour storm duration was selected for comparison between inflows and outflows because this duration produces the smallest difference between flood inflows and outflows.
0
10,000
20,000
30,000
40,000
50,000
Rainfall Annual Exceedance Probability ( 1 in X)
Dis
char
ge (m
3 /s)
Natural Inflow (without Wivenhoe andSomerset Dams)Wivenhoe Inflow (Post Somerset)
48 hour Outflow (Post Upgrade)
100 1,000 10,000 100,000 1,000,000
Outflows Exceeding Inflows
Figure 5.2 Flood Frequency Curves for Pre-Dams Flow, Wivenhoe Inflow (Including Somerset
Outflow) and Wivenhoe Outflow (Post Upgrade), 48-hour duration event.
The following is of note with respect to Figure 5.2:
• Somerset Dam alone significantly reduces design flood flows of this duration for all AEP’s (shown by the difference in flows between the solid and dashed lines in Figure 5.2);
• Wivenhoe Dam (post upgrade) has a further impact on design flows (shown by the difference in flows between the dashed line and the solid blue line in Figure 5.2);

Wivenhoe Alliance Wivenhoe Dam Spillway Augmentation Design Discharges and Downstream Impacts of the Wivenhoe Dam Upgrade
ItemID: 003684262 Page 27 of 93
Date Printed: 27/09/2005 3:25:00 PM Last Saved: 27/09/2005 3:24:00 PM
• For the floods that just initiate fuse plug 3 and fuse plug 4, the outflows marginally exceed the Wivenhoe Inflows but are substantially lower that the pre Somerset Dam design flows, thereby satisfying one of the design objectives.
5.4.2 Inflow and outflow Comparison at Fuse Plug Initiation Levels
Figure 5.2 shows that Wivenhoe Dam outflows are the closest to inflows for flood events that just initiate a fuse plug. For all other events, the outflows are lower than Wivenhoe inflows and much lower than natural (pre Somerset) flows. A comparison of Wivenhoe Dam (post upgrade) outflows and post Somerset Dam inflows for design storms that just cause the fuse plugs to initiate for the 24, 36, 48, 72, 96 and 120 hour duration storms is given in Table 5.3.
To explain this table further, a 24-hour design storm with an inflow peak of 20,600 m3/s just initiates the first fuse plug to breach and produces a total outflow discharge of 12,250 m3/s. A 36-hour storm with a peak of 18,500 m3/s initiates the same fuse plug with the same total outflow discharge of 12,250 m3/s. The outflows at the initiation events do not change provided that the gates are completely out of the water prior to initiation as per the proposed changes to the gate operating procedures.
Table 5.3 Comparison between Design Inflows of Various Storm Durations and Fuse Plug
Initiation Level Outflows, Wivenhoe Dam
Inflow Peak for each Duration (m3/s) Fuse Plug No.
24hr 36hr 48hr 72hr 96hr 120hr
Total Outflow at Initiation (m3/s)
1 20,600 18,500 14,000 15,800 14,700 16,100 12,250
2 25,600 22,050 17,300 18,700 17,400 19,300 16,600
3 29,900 26,300 21,600 22,600 22,400 23,700 21,800
4 39,950 36,350 31,700 32,600 32,300 34,050 32,800
The following is of note:
• At the initiation of fuse plugs 1, 2 and 3, the inflow peaks exceed the outflow peak for all design events considered except the 48 hour event for fuse plug 3. For this flood, the inflow is within 1% of the outflow; and
• At the initiation of Fuse Plug 4 at Saddle Dam 2, the outflow peaks exceed the Wivenhoe inflow peak for the 48-hour, 72-hour and 96-hour storms.
The results of Figure 5.2 and Table 5.3 suggest that the proposed auxiliary spillway for Stage 1 satisfactorily reduces or equals the inflow peak for almost any conceivable event. Note that these outflows are considerably lower than natural (pre Somerset) flows. For the proposed Stage 2 spillway at Saddle Dam 2, outflows exceed Wivenhoe inflows for design floods that just initiate the fuse plug for three durations considered. The outflows are still lower than natural inflows for these durations.

Wivenhoe Alliance Wivenhoe Dam Spillway Augmentation Design Discharges and Downstream Impacts of the Wivenhoe Dam Upgrade
ItemID: 003684262 Page 28 of 93
Date Printed: 27/09/2005 3:25:00 PM Last Saved: 27/09/2005 3:24:00 PM
6 . PMF SENSIT IV ITY ANALYSIS
6.1 OVERVIEW
The preliminary risk assessment study undertaken by SKM (2000) found that the incremental flood hazard category rating of Wivenhoe Dam is extreme under the current ANCOLD guidelines (ANCOLD, 2000). As a result, SKM recommended that the acceptable flood capacity of the dam be the Probable Maximum Flood (PMF).
Book VI, Estimation of Large and Extreme Floods of Australian Rainfall and Runoff (ARR) (IEAUST, 1999) defines PMF as the “limiting value of flood that could reasonably be expected to occur”. It states that the AEP neutral objective for selection of design inputs be explicitly rejected in favour of adopting conservatively high estimates to estimate the PMF. ARR also notes that design inputs must be selected within reason so not to superimpose risk of very low probabilities.
Presented below is an analysis of the impact of the various design inputs, namely storm duration, temporal patterns and concurrent downstream flow and fuse plug erosion rates on the PMF estimate for the upgraded dam (Stage 1 and Stage 2 works completed). The impact of changing the emergency procedures on the PMF estimate is also provided.
6.2 IMPACT OF STORM DURATION
Table 6.1 shows peak inflows and outflows as well as peak lake levels for the Stage 2 dam upgrade using the PMP rainfall depths and the associated average variability method (AVM) temporal patterns for various durations. The gated spillway rating curve (shown in Figure 3.3 Appendix A) that is most appropriate for the design event has been used in the analysis. The peak inflow includes inflows from the Upper Brisbane River as well as releases from Somerset Dam. Table 6.1 Design Discharges and Peak Lake Levels Using PMP Rainfalls of Various Durations,
Wivenhoe Dam
Storm Duration (hrs)
Peak Inflow (m3/s)
Peak Outflow (m3/s)
Peak Lake Level (m AHD)
24 48,400 35,700 79.20
36 49,200 37,600 79.93
48 39,700 35,500 79.12
72 37,400 34,000 78.66
96 38,100 34,600 78.83
120 39,900 34,500 78.80

Wivenhoe Alliance Wivenhoe Dam Spillway Augmentation Design Discharges and Downstream Impacts of the Wivenhoe Dam Upgrade
ItemID: 003684262 Page 29 of 93
Date Printed: 27/09/2005 3:25:00 PM Last Saved: 27/09/2005 3:24:00 PM
The 36-hour duration storm produces the highest peak inflow and outflow at the dam, and produces a maximum lake level of 79.93 m AHD. The 36-hour duration storm was adopted to estimate PMF. The longer duration storms have a much lower peak discharge than the 36-hour and the 24-hour storms and also mitigate the outflow peak to a lesser extent.
6.3 IMPACT OF TEMPORAL PATTERNS
Table 6.2 shows the 36-hour (critical) storm peak inflows (including Somerset Dam releases) and outflows from Wivenhoe Dam estimated using the AVM temporal pattern and the patterns used to derive the AVM pattern. The temporal pattern relates to the distribution of rainfalls throughout the storm. A description of the various temporal patterns is given in Appendix A. Any temporal patterns that have shorter duration PMP depths ‘nested’ within the design storm were not analysed, which left ten acceptable temporal patterns. The estimated maximum lake levels predicted for each temporal pattern are shown in Table 6.2.
Table 6.2 36-Hour Storm Peak Inflows and Outflows and Maximum Lake Levels using Various Temporal Patterns and PMP Rainfalls, Wivenhoe Dam.
Temporal Pattern Peak Discharge (m3/s)
Name Historical Storm Date
Inflow Outflow
Maximum Flood Level
(m AHD)
AVM 49,200 37,600 79.93
a2 3 Feb 1893 40,000 35,200 79.01
b 3 Apr 1898 51,900 38,400 80.23
d 21 Feb 1954 56,600 38,800 80.37
e 25 Feb 1955 41,800 34,300 78.76
l2 28 Jan 1974 41,400 35,600 79.17
m 13 Mar 1974 43,100 35,800 79.25
t 22 Jan 1982 38,600 35,000 78.95
u 14 Mar 1989 45,500 37,300 79.83
w 28 Feb 1995 43,700 36,000 79.32
The following is of note with respect to Table 6.2:
• The AVM temporal pattern produces higher inflow and outflow peaks than the majority of the other patterns. In fact, only two temporal patterns produce higher peaks than the AVM pattern. This indicates that the AVM pattern may not be AEP neutral for this catchment.

Wivenhoe Alliance Wivenhoe Dam Spillway Augmentation Design Discharges and Downstream Impacts of the Wivenhoe Dam Upgrade
ItemID: 003684262 Page 30 of 93
Date Printed: 27/09/2005 3:25:00 PM Last Saved: 27/09/2005 3:24:00 PM
• The mean peak inflow for all historical patterns is about 44,700 m3/s, which is some 4,500 m3/s (9%) lower than the estimated peak inflow when the AVM pattern is used. The median peak inflow of the historical patterns is 43,100 m3/s, which is 12% lower.
• The mean peak outflow for all historical patterns is about 36,300 m3/s, which is some 1,300 m3/s (4%) lower than the estimated peak outflow when the AVM pattern is used. The median peak outflow of the historical patterns is lower at 35,800 m3/s.
• The ‘d’ (21 Feb 1954) pattern produces the highest inflow and outflow peak.
Given that the AVM temporal pattern produces high inflow and outflow peaks in comparison to both the mean and median peak of the 10 acceptable patterns, the AVM pattern has been adopted to estimate PMF. The adoption of the ‘d’ or ‘b’ pattern would produce PMF estimates of very low probabilities, which would be unreasonable, given the definition in ARR (1999).
6.4 IMPACT OF DOWNSTREAM TRIBUTARY FLOWS
Downstream flows in Lockyer Creek and the Bremer River affect the gate opening procedures of Wivenhoe Dam and potentially affect design outflow peaks. The sensitivity of downstream tributary flows to the PMF estimate was made using the WT42D model, WIVOPS and FLRoute with three downstream tributary flows estimated using:
• The ARR recommended procedures to derive downstream flows using 0.6 times the Wivenhoe 36-hour PMP rainfall depth. This is approximately equivalent to a 1 in 20,000 AEP rainfall.
• 1 in 100 AEP Wivenhoe rainfalls to derive downstream catchment flows; and
• Wivenhoe PMP rainfalls to derive downstream catchment flows.
The results are presented in Table 6.3 below. Table 6.3 Sensitivity of PMF Outflows to Various Concurrent Downstream Flows,
Wivenhoe Dam
AEP of Concurrent Downstream Flow
Maximum Lake Level (m AHD)
Maximum Outflow (m3/s)
1 in 20,000 79.93 37,600
1 in 100 79.93 37,600
PMP 79.93 37,600
The results show that the PMF outflow and maximum lake levels are not affected by downstream tributary flows. It appears that the rules preventing the gates from being overtopped governs the gate opening procedures for the PMF, which is only related to inflows to the dam.

Wivenhoe Alliance Wivenhoe Dam Spillway Augmentation Design Discharges and Downstream Impacts of the Wivenhoe Dam Upgrade
ItemID: 003684262 Page 31 of 93
Date Printed: 27/09/2005 3:25:00 PM Last Saved: 27/09/2005 3:24:00 PM
6.5 IMPACT OF LATERAL EROSION RATES OF THE FUSE PLUGS
Table 6.4 shows the sensitivity of maximum PMF lake levels to lateral erosion rates of the fuse plugs varying from 50 m per hour to 200 m per hour. The adopted erosion rate is 100 m per hour, which is based on model study results (Tinney & Hsu, 1961 and Pugh, 1985). The results show that doubling or halving the expected lateral erosion rates does not significantly impact on the PMF lake levels. Table 6.4 Sensitivity of PMF Lake Levels to Lateral Fuse Plug Erosion Rates, Wivenhoe Dam
Lateral Erosion Rates (m/hour)
Maximum Lake Level (m AHD)
Maximum Outflow (m3/s)
100 79.93 37,600
50 79.99 37,700
200 79.89 37,500
6.6 IMPACT OF EMERGENCY GATE OPENING PROCEDURES
Table 6.5 shows a comparison of the PMF maximum lake levels and maximum outflows when using the proposed gate opening procedures as defined in Section 4 and when using the existing and proposed emergency gate opening procedures given in Table 4.1. The emergency procedures are used when communication between the dam supervisor and the flood centre is not available.
Table 6.5 Sensitivity of Emergency Gate Opening Procedures to the PMF, Wivenhoe Dam
Gate Opening Procedures Maximum Lake Level (m AHD)
Maximum Outflow (m3/s)
Proposed Gate Opening Procedures 79.93 37,600
Existing Emergency Procedures 80.03 37,800
Proposed Emergency Procedures 80.03 37,800
The table shows that the dam becomes overtopped by up to 0.03 m when using the existing and proposed emergency gate opening procedures. The emergency gate opening procedures need to be opened much more quickly to prevent overtopping during the PMF. Adjustment of the emergency procedures further to ensure that the dam is not overtopped during the PMF will prematurely inundate downstream areas during less severe floods. The adopted emergency procedures appear to provide a good balance between minimising downstream damage and protecting the integrity of the dam during the periods when the emergency procedures are used.

Wivenhoe Alliance Wivenhoe Dam Spillway Augmentation Design Discharges and Downstream Impacts of the Wivenhoe Dam Upgrade
ItemID: 003684262 Page 32 of 93
Date Printed: 27/09/2005 3:25:00 PM Last Saved: 27/09/2005 3:24:00 PM
7 . IMPACT OF FLOOD OPERATION CHANGES
7.1 GENERAL Section 5 suggests that the proposed changes to the flood operation procedures will not change flood discharges or downstream flooding from existing conditions for flood events up to about the 1 in 2,000 AEP event. For events more extreme than this, the senior flood operations engineer must open the gates earlier in the flood than what is currently required to ensure that the gates in the existing spillway are out of the water prior to the fuse plug initiating. This procedural change maximises the spillway capacity to reduce the likelihood of flows from the fuse plug spillways.
Outlined below is an analysis of 24 hour duration design storms to determine whether the proposed flood operation procedure changes are practical and that sufficient time and information is available for the senior flood operations engineer to prematurely raise the gates. The 24 hour duration storms are analysed because they peak earlier than any of the other design storms.
7.2 24 HOUR -1 IN 10,000 AEP DESIGN STORM Figure 7.1 shows the rainfall hyetograph and flow hydrographs at the various stream flow gauging stations in the Upper Brisbane River catchment for the 24 hour duration 1 in 10,000 AEP design storm.
1 2 3 4 5Days
0
4,000
8,000
12,000
16,000
20,000
Dis
char
ge (m
3/s
)
0
10
20
30
40
50
1 hour Rainfall (m
m)
RainfallLinvilleEmuCooyarGregorsSomerset InflowWivenhoe InflowOutflow
Figure 7.1 Upper Brisbane River Rainfall hyetograph and Flow Hydrographs, 24 hour 1 in
10,000 AEP design flood

Wivenhoe Alliance Wivenhoe Dam Spillway Augmentation Design Discharges and Downstream Impacts of the Wivenhoe Dam Upgrade
ItemID: 003684262 Page 33 of 93
Date Printed: 27/09/2005 3:25:00 PM Last Saved: 27/09/2005 3:24:00 PM
For this storm, the gate operation procedures recommend that the gates should remain closed for the first 24 hours to allow the Lockyer and Bremer River flood peaks to pass. After 24 hours, the water level in the dam is at 72.5 m AHD and rising at a rate of 0.4m per hour, the rainfall has stopped and all of the upstream gauging stations have peaked. This would give the Senior Flood Operations engineer sufficient information to commence raising the gates at the maximum rate of 1 m in 10 minutes to ensure the gates are out of the water prior to fuse plug initiating.
For this particular flood without the proposed changes to the gate operation procedure, the outflow peak from the gated spillway and the fuse plugs would be about 12,400 m3/s. The outflow peak with the proposed changes is 9,700 m3/s from the gated spillway only with no flow through the fuse plug spillway.
7.3 24 HOUR DURATION – PMP DESIGN STORM Figure 7.2 shows the rainfall hyetograph and flow hydrographs at the various stream flow gauging stations in the Upper Brisbane River catchment for the 24 hour duration PMP design storm.
0:00 12:00 0:00 12:00 0:00 12:00 0:00 12:00 0:00Date
0
10,000
20,000
30,000
40,000
50,000
Dis
char
ge (m
3/s
)
0
20
40
60
80
100
1 hour Rainfall (m
m)
RainfallLinvilleEmuCooyarGregorsSomerset InflowWivenhoe InflowOutflow
Figure 7.2 Upper Brisbane River Rainfall hyetograph and Flow Hydrographs, 24 hour PMP
design flood
For this storm, the Senior Flood Operations engineer must commence opening the gates about 8 to 10 hours into the storm to ensure the gates are out of the water before the fuse

Wivenhoe Alliance Wivenhoe Dam Spillway Augmentation Design Discharges and Downstream Impacts of the Wivenhoe Dam Upgrade
ItemID: 003684262 Page 34 of 93
Date Printed: 27/09/2005 3:25:00 PM Last Saved: 27/09/2005 3:24:00 PM
plugs initiate. At 8 hours into the storm the following information would be available to the Senior Flood Operations Engineer:
• The dam water level would be about 67.5m AHD, assuming it starts full at the commencement of the storm;
• About 215 mm of rain would have fallen throughout the catchment;
• Wivenhoe and Somerset water levels would have risen 0.1 m and 0.4m respectively over the past hour;
• The downstream bridges would be about to be submerged;
• Hydrologic modelling of the catchment, assuming no further rainfall, would indicate that the dam water level would peak at around 73.5m AHD;
At 10 hours into the storm, hydrologic modelling of the catchment, assuming no additional rainfall, would indicate that the fuse plugs will be overtopped even though the water level in the dam is only 68 to 68.5 m AHD.
At 12 hours, hydrologic modelling, assuming no additional rainfall, would indicate that the fuse plugs will be initiated within 10 hours even though the dam water level would be only about 69 m AHD at that time.
Sufficient information would be available for the Senior Flood Operations Engineer to commence opening the gates at about 8 hours and the rate of opening the gates would be maximised to 1 m per 10 minutes between 10 to 12 hours. For this scenario, the modelling predicts that the gates are completely out of the water just as the first fuse plug is being overtopped.
It is noted that the dam would not be overtopped during this event should the emergency spillway operating rules, given in Section 4.4.1, have been used (because it is not the critical duration storm).

Wivenhoe Alliance Wivenhoe Dam Spillway Augmentation Design Discharges and Downstream Impacts of the Wivenhoe Dam Upgrade
ItemID: 003684262 Page 35 of 93
Date Printed: 27/09/2005 3:25:00 PM Last Saved: 27/09/2005 3:24:00 PM
8 . DOWNSTREAM IMPACT OF FUSE PLUG FLOWS
8.1 GENERAL
The MIKE 11 model of the Brisbane River was used to assess the downstream impact of flows from the proposed Stage 1 Right Abutment and Stage 2 Saddle Dam 2 fuse plugs. Details of the MIKE 11 model are given in Appendix B. The model was used to:
• Determine the difference in water levels along the Brisbane River between events just prior to and just after a fuse plug flow occurs;
• Determine the depth of water at various locations when a fuse plug flow occurs;
• Determine the increase in flood extent as a result of the fuse plug flows;
• Estimate the rate of water level rise at various locations when a fuse plug flow occurs; and
• Estimate the travel time of the fuse plug flood wave.
The various dam discharge hydrographs (36 hour duration storm) for events just prior to and just after a fuse plug flow occurs were routed through the hydraulic model in conjunction with three concurrent downstream flood events to determine the likely range of downstream impacts.
8.2 CONCURRENT DOWNSTREAM FLOWS
Table 8.1 shows the annual exceedance probability (AEP) of the downstream catchment design flows used concurrently with the various design floods at Wivenhoe Dam. Three separate concurrent downstream floods were used to derive a representative range of impacts on downstream water levels.
• The typical estimate of concurrent downstream flow was determined using the approximate procedures recommended in Australian Rainfall and Runoff (ARR) (IEAUST, 1999). This assumes that design flows in the Wivenhoe Dam catchment occur concurrently with flows in the Lower Brisbane River catchment generated using 0.6 times the Wivenhoe Dam catchment design rainfall depth. This methodology is described further in Appendix A.
• The upper bound of the pre and post fuse plug flow water level difference was determined using Wivenhoe Dam design flows and nominal concurrent lower Brisbane River catchment flows with AEPs of 1 in 50 or 1 in 120; and
• The lower bound of the pre and post fuse break water level difference was determined using Wivenhoe Dam catchment design flows and concurrent lower Brisbane River catchment flows determined using Wivenhoe Dam catchment design rainfall depths of the same AEP. This is only a nominal AEP in the downstream catchment because lower Brisbane River catchment rainfall depths for events larger than a 1 in 2,000 AEP are not known.

Wivenhoe Alliance Wivenhoe Dam Spillway Augmentation Design Discharges and Downstream Impacts of the Wivenhoe Dam Upgrade
ItemID: 003684262 Page 36 of 93
Date Printed: 27/09/2005 3:25:00 PM Last Saved: 27/09/2005 3:24:00 PM
Table 8.1 Concurrent Lower Brisbane River Flows Used to Determine the Difference in Downstream Water Levels
Concurrent Lower Brisbane River Flow AEP (1 in X) AEP of Wivenhoe Dam Inflow
(1 in X) Typical Upper Bound Lower Bound
6,000 120 50 6,000
11,500 300 120 11,500
22,500 1,000 120 22,500
65,000 5,000 120 65,000
8.3 FUSE PLUG 1
8.3.1 Impacts on Downstream Flows and Water Levels
Figure 8.1 shows the difference in water levels between Moreton Bay and Wivenhoe Dam for a 1 in 6,000 AEP event at the dam with and without fuse plug 1 flows. The without fuse plug flowing case closely resembles the outflows under the existing operating rules without the auxiliary spillways. The solid line represents the peak water level difference using the typical downstream concurrent flow as recommended in ARR. The dashed lines represent the expected upper and lower bounds of the peak water level differences. The increased flood extent between Wivenhoe Dam and Savages Crossing as a result of the fuse plug flow is shown in Figure 8.2. The flood extent was determined using the typical downstream concurrent flow;
Figure 8.1 Brisbane River Peak Water Level Difference, 1 in 6,000 AEP Wivenhoe Dam Flood
With and Without Fuse Plug 1 Flows
0.0
0.2
0.4
0.6
0.8
1.0
1.2
0 20 40 60 80 100 120 140AMTD (km)
Wat
er L
evel
Diff
eren
ce (m
)
1 in 120 AEP Concurrent Downstream FlowExpected Upper and Lower Bounds of Water Level Differences
Will
iam
Jol
ly B
ridge
Indo
oroo
pilly
Brid
ges
Cen
tena
ry B
ridge
Bre
mer
Con
fluen
ce
Col
lege
s C
ross
ing
Mt C
rosb
y W
eir
Kho
lo B
ridge
Mor
eton
Bay
Lock
yer C
onflu
ence
Sav
ages
Cro
ssin
g
Mog
gill
Gau
ge

Wiv
enho
e A
llian
ce
W
iven
hoe
Dam
Spi
llway
Aug
men
tatio
n D
esig
n D
isch
arge
s an
d D
owns
tream
Impa
cts
of th
e W
iven
hoe
Dam
Upg
rade
Item
ID: 0
0368
4262
P
age
37 o
f 93
Dat
e P
rinte
d: 2
7/09
/200
5 3:
25:0
0 P
M
Last
Sav
ed: 2
7/09
/200
5 3:
24:0
0 P
M
Fi
gure
8.2
Max
imum
Flo
od In
itiat
ion
for 1
in 6
,000
AEP
Flo
od w
ithou
t Fus
e Pl
ug 1
Flo
ws
and
the
Add
ition
al In
unda
tion
follo
win
g Fu
se P
lug
1 Fl
ows,
Wiv
enho
e D
am to
Sav
ages
Cro
ssin
g

Wivenhoe Alliance Wivenhoe Dam Spillway Augmentation Design Discharges and Downstream Impacts of the Wivenhoe Dam Upgrade
ItemID: 003684262 Page 38 of 93
Date Printed: 27/09/2005 3:25:00 PM Last Saved: 27/09/2005 3:24:00 PM
The following is of note with respect to Figure 8.1 and Figure 8.2:
• The greatest impact occurs between Savages Crossing (GS143001) and Mt Crosby Weir (GS 143003) where water levels rise by around 0.7 m. Water levels increase by less than 0.4 m downstream of the Bremer River confluence.
• The difference in peak flow immediately downstream of Wivenhoe Dam prior to, and just after the initiation of fuse plug 1 is 1,700 m3/s. This difference in flow is attenuated to approximately 800 m3/s at Savages Crossing and 300 m3/s at Moggill Gauge.
• The 0.7 m flood level increase does not translate to a significant increase in flood extent upstream of Savages Crossing.
8.3.2 Impact at Savages Crossing and Moggill Gauge
Figure 8.3 and Figure 8.4 show the water level hydrographs at Savages Crossing and at Moggill Gauge respectively for the 1 in 6,000 AEP flood with and without fuse plug 1 flowing. Concurrent downstream flows as recommended in ARR have been adopted. The following is of note:
• The peak water levels increase by about 0.7 m at Savages Crossing and by about 0.3 m at Moggill Gauge with the fuse plug 1 flows;
• Water levels are higher during the recession of the flood when fuse plug 1 has been initiated. However, modifications to the main spillway gate closing procedures, mentioned in Section 4.4, are likely to reduce water levels as the flood recedes;
• The rate of water level rise caused by fuse plug 1 flows does not significantly change from the ‘no’ fuse plug flow rate of rise at both Savages Crossing and Moggill. The large floodplain storage available between the dam and Savages Crossing appears to mitigate the rapid increase in discharges resulting from the fuse plug flows;
• The depth of water in the Brisbane River at Savages Crossing is almost 30 m without fuse plug 1 flows. A 0.7 m increase at this location resulting from fuse plug 1 flows represents an increase in flood depth of approximately 2%;
• The depth of water above mean sea level at Moggill Gauge is over 14 m without fuse plug 1 flows. A 0.3 m increase at this location resulting from fuse plug 1 flows represents a 2% increase in flood depth; and
• The 1974 recorded peak water level is higher at Moggill than the 1 in 6000 AEP flood at Wivenhoe and the 1 in 120 AEP flood in the downstream catchments. The modelling shows that the Lockyer and Bremer flood peaks have already passed the Moggill gauge by the time the Wivenhoe flood peak arrives. For the 1974 flood, the dam was not there to “slow” the peak from the Upper Brisbane River. This provides clear evidence of the flood mitigating capability of Wivenhoe Dam.
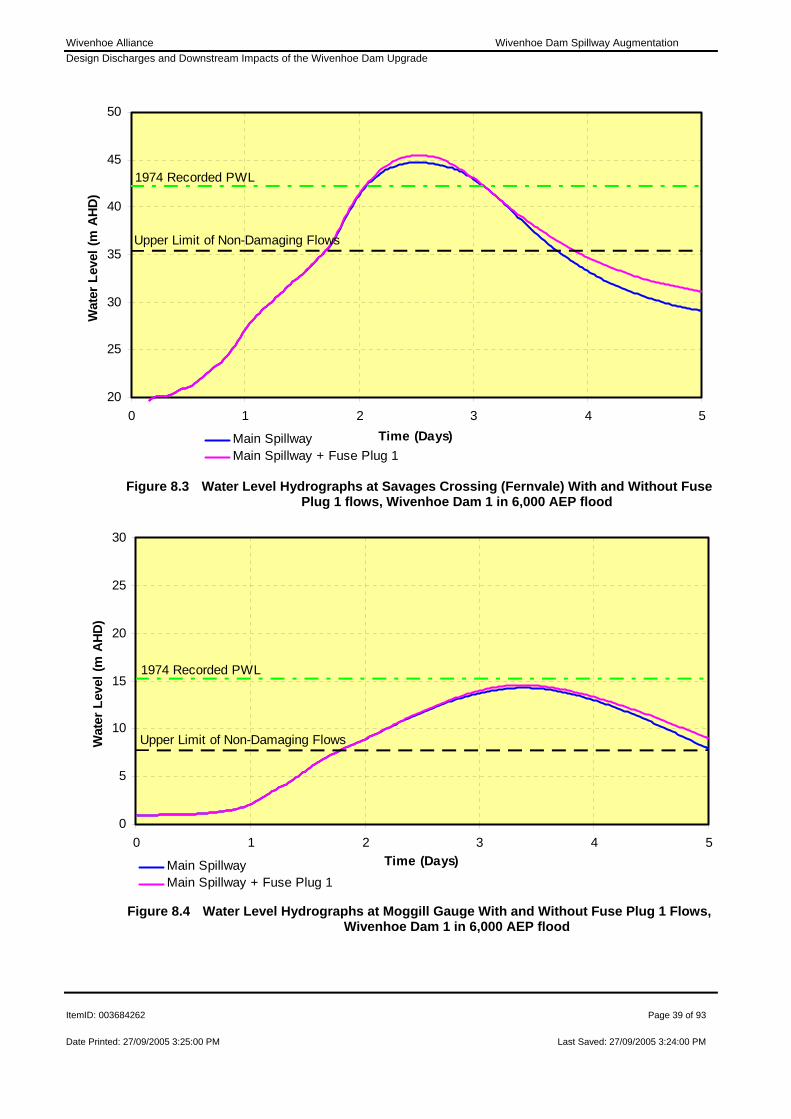
Wivenhoe Alliance Wivenhoe Dam Spillway Augmentation Design Discharges and Downstream Impacts of the Wivenhoe Dam Upgrade
ItemID: 003684262 Page 39 of 93
Date Printed: 27/09/2005 3:25:00 PM Last Saved: 27/09/2005 3:24:00 PM
Figure 8.3 Water Level Hydrographs at Savages Crossing (Fernvale) With and Without Fuse
Plug 1 flows, Wivenhoe Dam 1 in 6,000 AEP flood
Figure 8.4 Water Level Hydrographs at Moggill Gauge With and Without Fuse Plug 1 Flows,
Wivenhoe Dam 1 in 6,000 AEP flood
20
25
30
35
40
45
50
0 1 2 3 4 5Time (Days)
Wat
er L
evel
(m A
HD)
Main SpillwayMain Spillway + Fuse Plug 1
Upper Limit of Non-Damaging Flows
1974 Recorded PWL
0
5
10
15
20
25
30
0 1 2 3 4 5Time (Days)
Wat
er L
evel
(m A
HD)
Main SpillwayMain Spillway + Fuse Plug 1
Upper Limit of Non-Damaging Flows
1974 Recorded PWL

Wivenhoe Alliance Wivenhoe Dam Spillway Augmentation Design Discharges and Downstream Impacts of the Wivenhoe Dam Upgrade
ItemID: 003684262 Page 40 of 93
Date Printed: 27/09/2005 3:25:00 PM Last Saved: 27/09/2005 3:24:00 PM
8.4 FUSE PLUG 2
8.4.1 Impacts on Downstream Water Levels and Flood Extent
Figure 8.5 shows the difference in water levels between Moreton Bay and Wivenhoe Dam for the 1 in 11,500 AEP flood with and without fuse plug 2 flows. Flows are released from both the main spillway and fuse plug 1 for the ‘without’ case and from the main spillway and fuse plug 1 and 2 for the ‘with’ case. The solid line represents the water level difference using the typical downstream concurrent flow as recommended in ARR. The dashed lines represent the expected upper and lower bounds of the water level differences. The increased flood extent between Wivenhoe Dam and Savages Crossing is shown in Figure 8.6. The flood extent was determined using the typical downstream concurrent flow.
Figure 8.5 Brisbane River Peak Water Level Difference, 1 in 11,500 AEP Wivenhoe Dam
Flood With and Without Fuse Plug 1 Flows
The following is of note:
• The greatest impact occurs between Savages Crossing and Mt Crosby Weir where water levels rise by about 1.2 m. Water level increases are generally less than 0.6 m downstream of the Bremer River confluence. This increase translates to a minimal increase on flood extent upstream of Savages Crossing;
• The difference in peak flow immediately downstream of Wivenhoe Dam for the events with and without fuse plug 2 flows is 3,500 m3/s. This difference in flow attenuates to approximately 1,700 m3/s at of Savages Crossing and 700 m3/s at Moggill Gauge.
• About 5 hours separates the initiation of fuse plug 1 and fuse plug 2 for this event.
0.0
0.2
0.4
0.6
0.8
1.0
1.2
0 20 40 60 80 100 120 140AMTD (km)
Wat
er L
evel
Diff
eren
ce (m
)
1 in 300 AEP Concurrent Downstream FlowExpected Upper and Lower Bounds of Water Level Differences
Will
iam
Jol
ly B
ridge
Indo
oroo
pilly
Brid
ges
Cen
tena
ry B
ridge
Bre
mer
Con
fluen
ce
Col
lege
s C
ross
ing
Mt C
rosb
y W
eir
Kho
lo B
ridge
Mor
eton
Bay
Lock
yer C
onflu
ence
Sav
ages
Cro
ssin
g
Mog
gill
Gau
ge
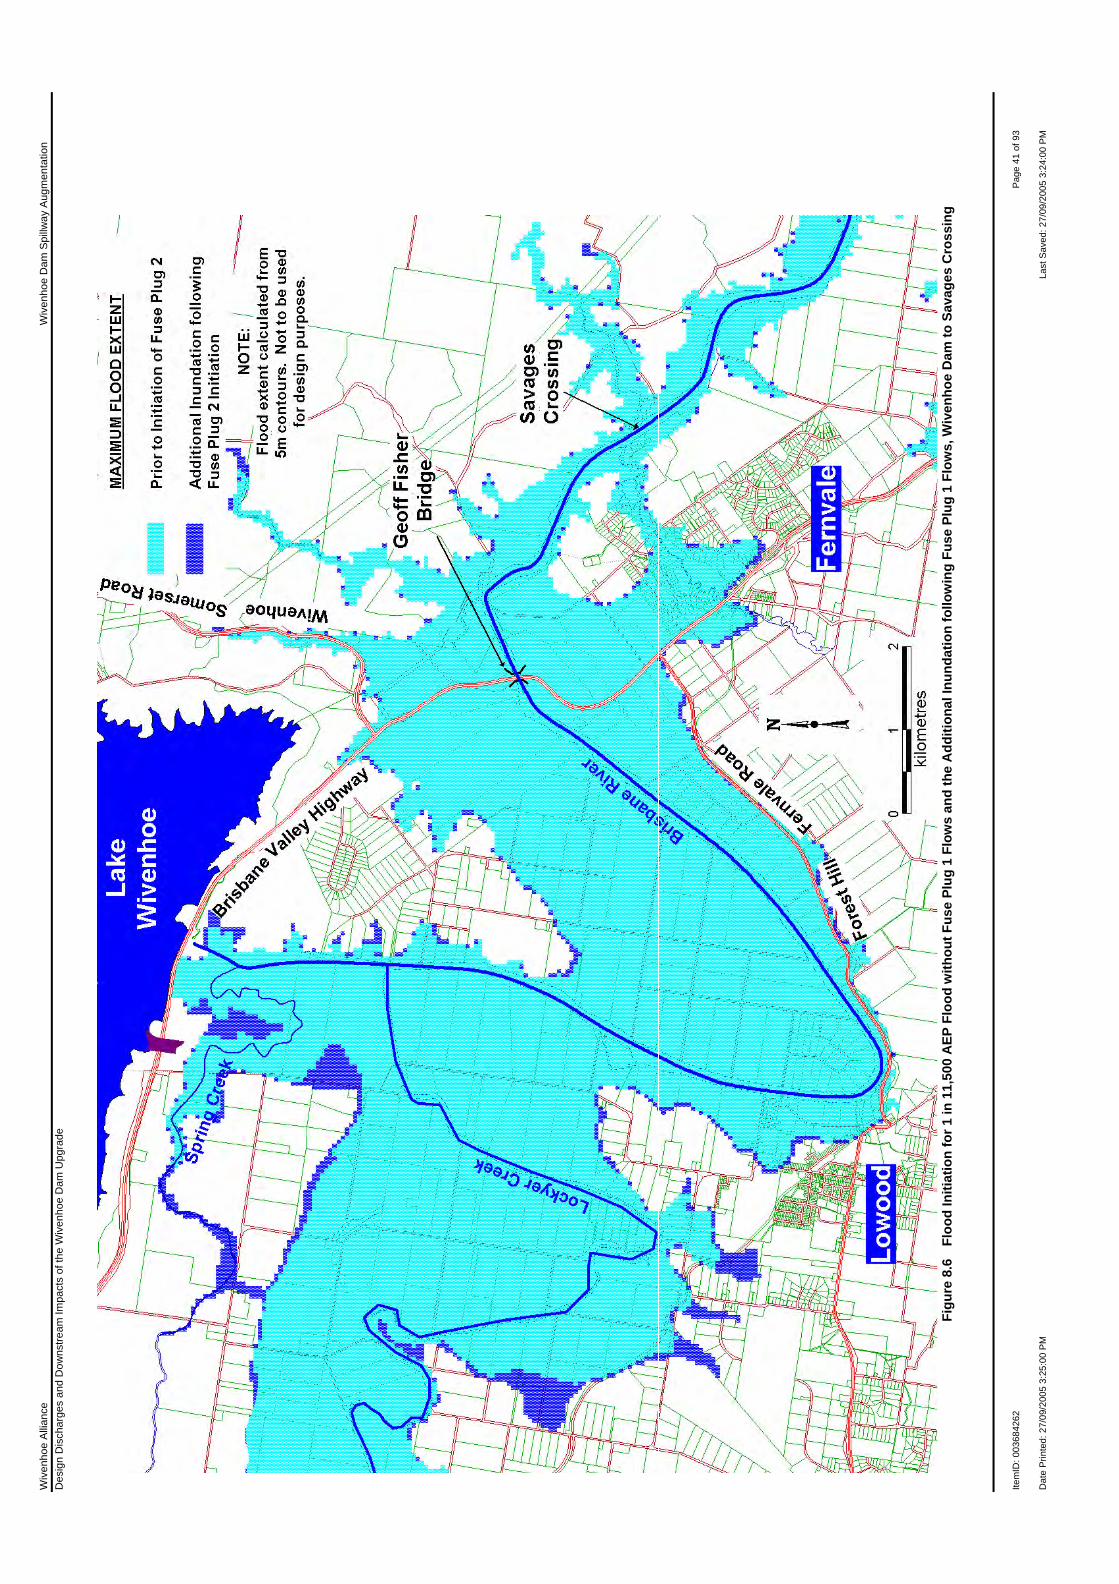
Wiv
enho
e A
llian
ce
Wiv
enho
e D
am S
pillw
ay A
ugm
enta
tion
Des
ign
Dis
char
ges
and
Dow
nstre
am Im
pact
s of
the
Wiv
enho
e D
am U
pgra
de
Item
ID: 0
0368
4262
P
age
41 o
f 93
Dat
e P
rinte
d: 2
7/09
/200
5 3:
25:0
0 P
M
Last
Sav
ed: 2
7/09
/200
5 3:
24:0
0 P
M
Fi
gure
8.6
Fl
ood
Initi
atio
n fo
r 1 in
11,
500
AEP
Flo
od w
ithou
t Fus
e Pl
ug 1
Flo
ws
and
the
Add
ition
al In
unda
tion
follo
win
g Fu
se P
lug
1 Fl
ows,
Wiv
enho
e D
am to
Sav
ages
Cro
ssin
g
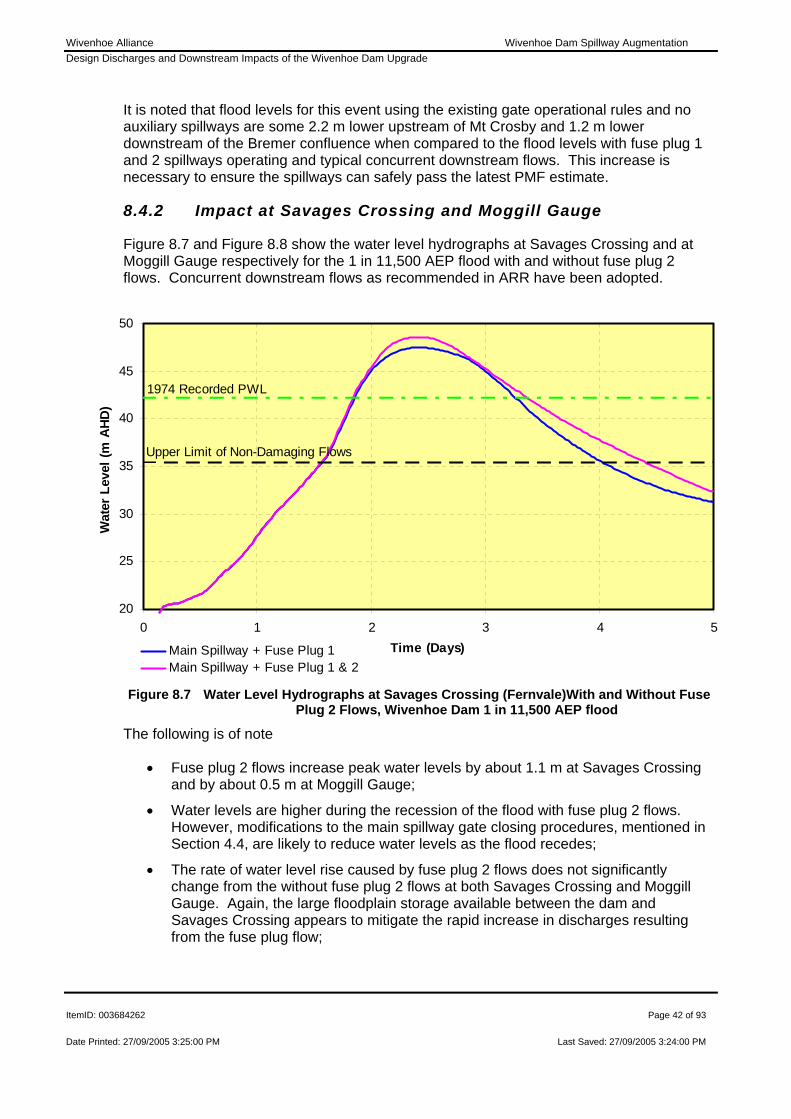
Wivenhoe Alliance Wivenhoe Dam Spillway Augmentation Design Discharges and Downstream Impacts of the Wivenhoe Dam Upgrade
ItemID: 003684262 Page 42 of 93
Date Printed: 27/09/2005 3:25:00 PM Last Saved: 27/09/2005 3:24:00 PM
It is noted that flood levels for this event using the existing gate operational rules and no auxiliary spillways are some 2.2 m lower upstream of Mt Crosby and 1.2 m lower downstream of the Bremer confluence when compared to the flood levels with fuse plug 1 and 2 spillways operating and typical concurrent downstream flows. This increase is necessary to ensure the spillways can safely pass the latest PMF estimate.
8.4.2 Impact at Savages Crossing and Moggill Gauge
Figure 8.7 and Figure 8.8 show the water level hydrographs at Savages Crossing and at Moggill Gauge respectively for the 1 in 11,500 AEP flood with and without fuse plug 2 flows. Concurrent downstream flows as recommended in ARR have been adopted.
•
•
Figure 8.7 Water Level Hydrographs at Savages Crossing (Fernvale)With and Without Fuse
Plug 2 Flows, Wivenhoe Dam 1 in 11,500 AEP flood
The following is of note
• Fuse plug 2 flows increase peak water levels by about 1.1 m at Savages Crossing and by about 0.5 m at Moggill Gauge;
• Water levels are higher during the recession of the flood with fuse plug 2 flows. However, modifications to the main spillway gate closing procedures, mentioned in Section 4.4, are likely to reduce water levels as the flood recedes;
• The rate of water level rise caused by fuse plug 2 flows does not significantly change from the without fuse plug 2 flows at both Savages Crossing and Moggill Gauge. Again, the large floodplain storage available between the dam and Savages Crossing appears to mitigate the rapid increase in discharges resulting from the fuse plug flow;
20
25
30
35
40
45
50
0 1 2 3 4 5Time (Days)
Wat
er L
evel
(m A
HD)
Main Spillway + Fuse Plug 1Main Spillway + Fuse Plug 1 & 2
Upper Limit of Non-Damaging Flows
1974 Recorded PWL
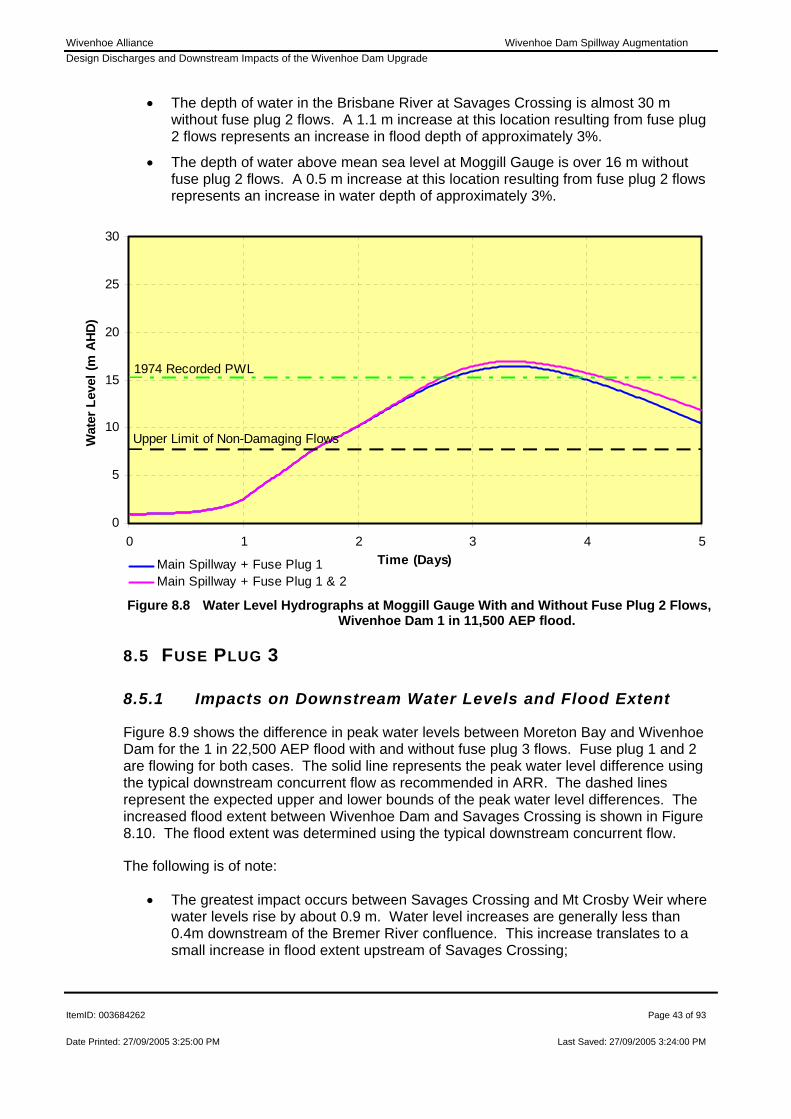
Wivenhoe Alliance Wivenhoe Dam Spillway Augmentation Design Discharges and Downstream Impacts of the Wivenhoe Dam Upgrade
ItemID: 003684262 Page 43 of 93
Date Printed: 27/09/2005 3:25:00 PM Last Saved: 27/09/2005 3:24:00 PM
• The depth of water in the Brisbane River at Savages Crossing is almost 30 m without fuse plug 2 flows. A 1.1 m increase at this location resulting from fuse plug 2 flows represents an increase in flood depth of approximately 3%.
• The depth of water above mean sea level at Moggill Gauge is over 16 m without fuse plug 2 flows. A 0.5 m increase at this location resulting from fuse plug 2 flows represents an increase in water depth of approximately 3%.
Figure 8.8 Water Level Hydrographs at Moggill Gauge With and Without Fuse Plug 2 Flows,
Wivenhoe Dam 1 in 11,500 AEP flood.
8.5 FUSE PLUG 3
8.5.1 Impacts on Downstream Water Levels and Flood Extent
Figure 8.9 shows the difference in peak water levels between Moreton Bay and Wivenhoe Dam for the 1 in 22,500 AEP flood with and without fuse plug 3 flows. Fuse plug 1 and 2 are flowing for both cases. The solid line represents the peak water level difference using the typical downstream concurrent flow as recommended in ARR. The dashed lines represent the expected upper and lower bounds of the peak water level differences. The increased flood extent between Wivenhoe Dam and Savages Crossing is shown in Figure 8.10. The flood extent was determined using the typical downstream concurrent flow.
The following is of note:
• The greatest impact occurs between Savages Crossing and Mt Crosby Weir where water levels rise by about 0.9 m. Water level increases are generally less than 0.4m downstream of the Bremer River confluence. This increase translates to a small increase in flood extent upstream of Savages Crossing;
0
5
10
15
20
25
30
0 1 2 3 4 5Time (Days)
Wat
er L
evel
(m A
HD)
Main Spillway + Fuse Plug 1Main Spillway + Fuse Plug 1 & 2
Upper Limit of Non-Damaging Flows
1974 Recorded PWL

Wivenhoe Alliance Wivenhoe Dam Spillway Augmentation Design Discharges and Downstream Impacts of the Wivenhoe Dam Upgrade
ItemID: 003684262 Page 44 of 93
Date Printed: 27/09/2005 3:25:00 PM Last Saved: 27/09/2005 3:24:00 PM
• The difference in peak flow immediately downstream of Wivenhoe Dam for events with and without fuse plug 3 flows is 3,800 m3/s. This difference in peak flow attenuates to approximately 1,800 m3/s at Savages Crossing and 600 m3/s at Moggill Gauge; and
• About 2 hours separates the initiation of fuse plugs 1 and 2 for this event. About 5 hours separates the initiation of fuse plugs 2 and 3.
It is noted that the existing dam without the auxiliary spillway would be overtopped for this event.
Figure 8.9 Brisbane River Peak Water Level Difference, 1 in 22,500 AEP Wivenhoe Dam
Flood With and Without Fuse Plug 1 Flows
8.5.2 Impact at Savages Crossing and Moggill Gauge
Figure 8.11 and Figure 8.12 show the water level hydrographs at Savages Crossing and at Moggill Gauge respectively for the 1 in 22,500 AEP flood with and without fuse plug 3 flows. Concurrent downstream flows as recommended in ARR have been adopted.
The following is of note:
• Fuse plug 3 flows increase peak water levels by about 0.9 m at Savages Crossing and by about 0.4 m at Moggill Gauge;
• Water levels are higher during the recession of the flood when fuse plug 3 flows occur. However, modifications to the main spillway gate closing procedures, mentioned in Section 4.4, are likely to reduce water levels as the flood recedes;
0.0
0.2
0.4
0.6
0.8
1.0
1.2
0 20 40 60 80 100 120 140AMTD (km)
Wat
er L
evel
Diff
eren
ce (m
)
1 in 1,000 AEP Concurrent Downstream FlowExpected Upper and Lower Bounds of Water Level Differences
Will
iam
Jol
ly B
ridge
Indo
oroo
pilly
Brid
ges
Cen
tena
ry B
ridge
Bre
mer
Con
fluen
ce
Col
lege
s C
ross
ing
Mt C
rosb
y W
eir
Kho
lo B
ridge
Mor
eton
Bay
Lock
yer C
onflu
ence
Sav
ages
Cro
ssin
gMog
gill
Gau
ge

Wiv
enho
e A
llian
ce
Wiv
enho
e D
am S
pillw
ay A
ugm
enta
tion
Des
ign
Dis
char
ges
and
Dow
nstre
am Im
pact
s of
the
Wiv
enho
e D
am U
pgra
de
Item
ID: 0
0368
4262
P
age
45 o
f 93
Dat
e P
rinte
d: 2
7/09
/200
5 3:
25:0
0 P
M
Last
Sav
ed: 2
7/09
/200
5 3:
24:0
0 P
M
Fi
gure
8.1
0 F
lood
Initi
atio
n fo
r 1 in
22,
500
AEP
Flo
od w
ithou
t Fus
e Pl
ug 1
Flo
ws
and
the
Add
ition
al In
unda
tion
follo
win
g Fu
se P
lug
1 Fl
ows,
Wiv
enho
e D
am to
Sav
ages
Cro
ssin
g

Wivenhoe Alliance Wivenhoe Dam Spillway Augmentation Design Discharges and Downstream Impacts of the Wivenhoe Dam Upgrade
ItemID: 003684262 Page 46 of 93
Date Printed: 27/09/2005 3:25:00 PM Last Saved: 27/09/2005 3:24:00 PM
•
Figure 8.11 Water Level Hydrographs at Savages Crossing (Fernvale) With and Without Fuse
Plug 3 Flows, Wivenhoe Dam 1 in 22,500 AEP flood
Figure 8.12 Water Level Hydrographs at Moggill Gauge With and Without Fuse Plug 3 Flows,
Wivenhoe Dam 1 in 22,500 AEP flood
30
35
40
45
50
55
60
0 1 2 3 4 5Time (Days)
Wat
er L
evel
(m A
HD)
Main Spillway + Fuse Plug 1 & 2Main Spillway + Fuse Plug 1, 2 & 3
Upper Limit of Non-Damaging Flows
1974 Recorded PWL
0
5
10
15
20
25
30
0 1 2 3 4 5Time (Days)
Wat
er L
evel
(m A
HD
)
Main Spillway + Fuse Plug 1 & 2Main Spillway + Fuse Plug 1, 2 & 3
Upper Limit of Non-Damaging Flows
1974 Recorded PWL

Wivenhoe Alliance Wivenhoe Dam Spillway Augmentation Design Discharges and Downstream Impacts of the Wivenhoe Dam Upgrade
ItemID: 003684262 Page 47 of 93
Date Printed: 27/09/2005 3:25:00 PM Last Saved: 27/09/2005 3:24:00 PM
• The rate of water level rise caused by fuse plug 3 flows does not significantly change from the without fuse plug 3 flow case at both Savages Crossing and at Moggill Gauge. Again, the large floodplain storage available between the dam and Savages Crossing appears to mitigate the rapid increase in discharges resulting from the fuse break;
• The depth of water in the Brisbane River at Savages Crossing is almost 30 m without the fuse plug 3 flows. A 0.9 m increase at this location resulting from the fuse plug 3 flows represents a 3% increase in flood depth; and
• The depth of water above mean sea level at Moggill Gauge is over 16 m without the fuse plug 3 flows. A 0.4 m increase at this location resulting from the fuse plug 3 flow represents an increase in water depth of less than 3%.
8.6 FUSE PLUG 4 (SADDLE DAM 2)
8.6.1 Impacts on Downstream Water Levels and Flood Extent
Figure 8.13 shows the difference in water levels between Moreton Bay and Wivenhoe Dam for the 1 in 65,000 AEP flood at the dam with and without fuse plug 4 flows. All of the right abutment fuse plugs are flowing for both cases. The solid line represents the water level difference using the typical downstream concurrent flow as recommended in ARR. The dashed lines represent the expected upper and lower bounds of the peak water level differences. . The increased flood extent between Wivenhoe Dam and Savages Crossing is shown in Figure 8.14. The flood extent was determined using the typical downstream concurrent flow.
Figure 8.13 Brisbane River Peak Water Level Difference, 1 in 65,000 AEP Wivenhoe Dam
Flood With and Without Fuse Plug 1 Flows
0.0
0.2
0.4
0.6
0.8
1.0
1.2
1.4
1.6
0 20 40 60 80 100 120 140AMTD (km)
Wat
er L
evel
Diff
eren
ce (m
)
1 in 5,000 AEP Concurrent Downstream FlowExpected Upper and Lower Bounds of Water Level Differences
Will
iam
Jol
ly B
ridge
Indo
oroo
pilly
Brid
ges
Cen
tena
ry B
ridge
Bre
mer
Con
fluen
ce
Col
lege
s C
ross
ing
Mt C
rosb
y W
eir
Kho
lo B
ridge
Mor
eton
Bay
Lock
yer C
onflu
ence
Sav
ages
Cro
ssin
g
Mog
gill
Gau
ge

Wiv
enho
e A
llian
ce
Wiv
enho
e D
am S
pillw
ay A
ugm
enta
tion
Des
ign
Dis
char
ges
and
Dow
nstre
am Im
pact
s of
the
Wiv
enho
e D
am U
pgra
de
Item
ID: 0
0368
4262
P
age
48 o
f 93
Dat
e P
rinte
d: 2
7/09
/200
5 3:
25:0
0 P
M
Last
Sav
ed: 2
7/09
/200
5 3:
24:0
0 P
M
Fi
gure
8.1
4 Fl
ood
Initi
atio
n fo
r 1 in
65,
000
AEP
Flo
od w
ithou
t Fus
e Pl
ug 1
Flo
ws
and
the
Add
ition
al In
unda
tion
follo
win
g Fu
se P
lug
1 Fl
ows,
Wiv
enho
e D
am to
Sav
ages
Cro
ssin
g
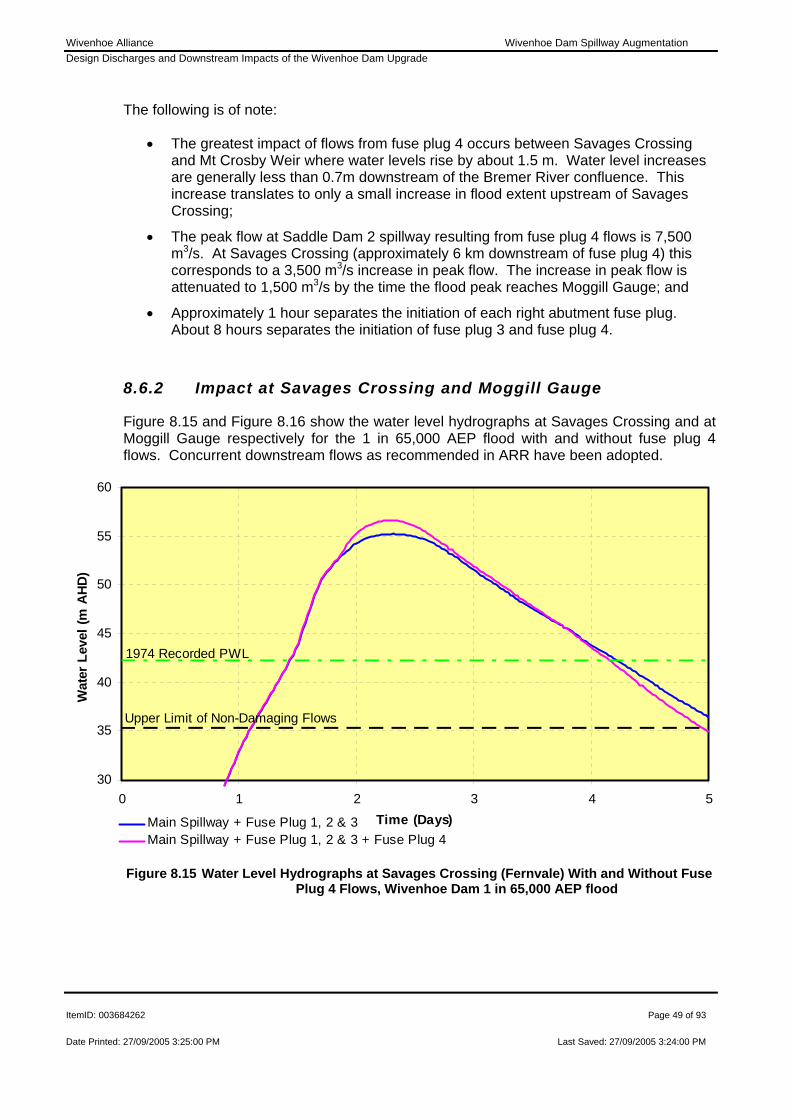
Wivenhoe Alliance Wivenhoe Dam Spillway Augmentation Design Discharges and Downstream Impacts of the Wivenhoe Dam Upgrade
ItemID: 003684262 Page 49 of 93
Date Printed: 27/09/2005 3:25:00 PM Last Saved: 27/09/2005 3:24:00 PM
The following is of note:
• The greatest impact of flows from fuse plug 4 occurs between Savages Crossing and Mt Crosby Weir where water levels rise by about 1.5 m. Water level increases are generally less than 0.7m downstream of the Bremer River confluence. This increase translates to only a small increase in flood extent upstream of Savages Crossing;
• The peak flow at Saddle Dam 2 spillway resulting from fuse plug 4 flows is 7,500 m3/s. At Savages Crossing (approximately 6 km downstream of fuse plug 4) this corresponds to a 3,500 m3/s increase in peak flow. The increase in peak flow is attenuated to 1,500 m3/s by the time the flood peak reaches Moggill Gauge; and
• Approximately 1 hour separates the initiation of each right abutment fuse plug. About 8 hours separates the initiation of fuse plug 3 and fuse plug 4.
8.6.2 Impact at Savages Crossing and Moggill Gauge
Figure 8.15 and Figure 8.16 show the water level hydrographs at Savages Crossing and at Moggill Gauge respectively for the 1 in 65,000 AEP flood with and without fuse plug 4 flows. Concurrent downstream flows as recommended in ARR have been adopted.
Figure 8.15 Water Level Hydrographs at Savages Crossing (Fernvale) With and Without Fuse
Plug 4 Flows, Wivenhoe Dam 1 in 65,000 AEP flood
30
35
40
45
50
55
60
0 1 2 3 4 5Time (Days)
Wat
er L
evel
(m A
HD
)
Main Spillway + Fuse Plug 1, 2 & 3Main Spillway + Fuse Plug 1, 2 & 3 + Fuse Plug 4
Upper Limit of Non-Damaging Flows
1974 Recorded PWL

Wivenhoe Alliance Wivenhoe Dam Spillway Augmentation Design Discharges and Downstream Impacts of the Wivenhoe Dam Upgrade
ItemID: 003684262 Page 50 of 93
Date Printed: 27/09/2005 3:25:00 PM Last Saved: 27/09/2005 3:24:00 PM
Figure 8.16 Water Level Hydrographs at Moggill Gauge With and Without Fuse Plug 4 Flows,
Wivenhoe Dam 1 in 65,000 AEP flood
The following is of note:
• Fuse plug 4 flows increase peak water levels by about 1.5 m at Savages Crossing and by about 0.6 m at Moggill Gauge;
• Water levels are higher during the recession of the flood when flows occur from fuse plug 4. However, modifications to the main spillway gate closing procedures, mentioned in Section 4.4, are likely to reduce water levels as the flood recedes;
• The rate of water level rise caused by fuse plug 4 flows does not significantly change from the without fuse plug 4 flow case at both Savages Crossing and at Moggill Gauge. Again, the large floodplain storage available between the dam and Savages Crossing appears to mitigate the rapid increase in discharges resulting from the fuse break;
• The depth of water in the Brisbane River at Savages Crossing is almost 35 m prior to fuse plug 4 flowing. A 1.5 m increase at this location resulting from fuse plug 4 flows represents a 4% increase in flood depth; and
• The depth of water above mean sea level at Moggill Gauge is over 22 m without fuse plug 4 flows. A 0.6 m increase at this location resulting from fuse plug 4 flows represents an increase in water depth of less than 3%.
0
5
10
15
20
25
30
0 1 2 3 4 5Time (Days)
Wat
er L
evel
(m A
HD
)
Main Spillway + Fuse Plug 1, 2 & 3Main Spillway + Fuse Plug 1, 2 & 3 + Fuse Plug 4
Upper Limit of Non-Damaging Flows
1974 Recorded PWL

Wivenhoe Alliance Wivenhoe Dam Spillway Augmentation Design Discharges and Downstream Impacts of the Wivenhoe Dam Upgrade
ItemID: 003684262 Page 51 of 93
Date Printed: 27/09/2005 3:25:00 PM Last Saved: 27/09/2005 3:24:00 PM
8.7 FUSE PLUG BREACH TRAVEL TIMES
Table 8.2 shows the travel time of the flood peak from the commencement of the 36 hour storm event to various locations along the Brisbane River for flood events immediately prior to and just after fuse plug flows occur. The following is of note:
• The flood peak travel times from Wivenhoe Dam to Savages Crossing (Fernvale) vary from about 7 hours prior to the initiation of fuse plug 1 to 1.5 hours following the initiation of fuse plug 4;
• The flood peak travel times from Wivenhoe Dam to Moggill Gauge vary from 23.5 hours prior to the initiation of fuse plug 1 to 15.5 hours following the initiation of fuse plug 4; and
• The fuse plug flows do not significantly alter the flood peak travel times, only the volume of flow.
• Table 8.2 Brisbane River Flood Peak Travel Times From Commencement of the 36hour
Duration Storm, Pre and Post Fuse Plug Flows
Location Fuse Plug 1 Fuse Plug 2 Fuse Plug 3 Fuse Plug 4 (Saddle Dam 2)
Before After Before After Before After Before After
Wivenhoe Dam 53.0 53.0 54.0 51.5 53.5 52.5 53.5 53.5
Savages Crossing (Fernvale)
60.0 60.5 58.0 57.5 56.5 55.5 55.5 55.0
Mt Crosby Weir 70.5 69.5 68.5 67.0 65.5 64.0 61.5 61.0
Moggill Gauge 76.5 76.0 75.5 75.0 73.0 72.5 70.0 69.0
Port Office Gauge 88.0 88.0 88.0 87.5 86.5 87.0 84.0 82.5

Wivenhoe Alliance Wivenhoe Dam Spillway Augmentation Design Discharges and Downstream Impacts of the Wivenhoe Dam Upgrade
ItemID: 003684262 Page 52 of 93
Date Printed: 27/09/2005 3:25:00 PM Last Saved: 27/09/2005 3:24:00 PM
9 . SUMMARY AND CONCLUSIONS
SEQWater is proposing to upgrade the flood discharge capacity of Wivenhoe Dam to safely pass all floods up to the Probable Maximum Flood (PMF). To achieve PMF capacity, it is proposed to construct two auxiliary spillways consisting of a secondary, three bay fuse plug on the right abutment, and a tertiary, one bay fuse plug at Saddle Dam 2, some 2.8 km southeast of the existing spillway. Works will also be undertaken on the main embankment to raise the maximum lake level to 80 m AHD. In setting the maximum lake level, zero freeboard is proposed. The works will be undertaken in two stages with the right abutment spillway and the works on the main embankment and gates undertaken during stage 1. The remainder of works will be undertaken in Stage 2 at a time yet to be nominated.
It is necessary to alter the Wivenhoe and Somerset Dams Gate Operating procedures to include the proposed auxiliary spillways. The proposed changes to the procedures are summarised below.
• Somerset Dam opening and closing procedures are to remain generally unchanged. Opportunity exists to hold back releases from Somerset if it will prevent a fuse plug from initiating;
• Wivenhoe Dam gate opening procedures 1, 2 and 3 will remain unchanged;
• Procedure 4 is to be modified to ensure the gates are fully out of the water prior to the initiation of the first fuse plug, whilst maximising the available flood storage. This will be undertaken by the introduction of three sub procedures. The latter sub procedures allow for an increase in the maximum gate opening increment from 0.5 m per 10 minute interval to 1 m per 10 minute interval;
• The concepts of the Wivenhoe Dam gate closure rules will remain unchanged. However, releases from the main spillway may be reduced to recompense additional releases from the auxiliary spillways; and
• The emergency gate opening procedures, used when there are no communications between the dam and the flood centre, will be modified to ensure the gates are out of the water prior to the initiation of the first fuse plug for most flood events.
The key conclusions of the study are summarised below:
• The PMF inflow to the dam (including Somerset outflows) is estimated at 49,200 m3/s, which corresponds to a critical storm duration of 36-hours. The PMF outflow is estimated at 37,600 m3/s;
• The PMF inflow and outflow is sensitive to temporal patterns. The adopted pattern produces an inflow peak that is higher than the mean and median produced using the historical patterns. PMF outflow is not very sensitive to downstream flows or the lateral erosion rates of the fuse plugs;
• The AEP of the existing dam crest flood is around 1 in 22,000. However, the dam has an increased risk of failure for floods in excess of 1 in 10,000 AEP events as the lake level exceeds the top of the clay core;
• The dam crest flood will increase to 1 in 100,000 AEP for Stage 1 and PMF for Stage 2;
Wivenhoe Alliance Wivenhoe Dam Spillway Augmentation Design Discharges and Downstream Impacts of the Wivenhoe Dam Upgrade
ItemID: 003684262 Page 53 of 93
Date Printed: 27/09/2005 3:25:00 PM Last Saved: 27/09/2005 3:24:00 PM
• The fuse plugs initiate at AEP’s of approximately 1 in 6,000, 1 in 11,500, 1 in 22,500 and 1 in 65,000 AEP flow events. The capacity of each fuse plug increases as the AEP of the flood reduces.
• The proposed upgrade works do not change outflows for flood events up to the 1 in 2,000 AEP event. This is substantially higher than the 1974 flood, which had an AEP of about 1 in 100 at the dam;
• The proposed upgrade works will result in minor increases in dam outflows for flood events between the 1 in 2,000 AEP event to the 1 in 5,000 AEP event. This is due to the changes proposed to procedure 4 of the gate operational rules to ensure the gates are out of the water before the first fuse plug initiates.
• The outflows from the dam are less than or equal to Wivenhoe inflows for all design flows investigated up to the initiation of the tertiary spillway at Saddle Dam 2. Outflows from the dam once the Saddle Dam 2 auxiliary spillway initiates are mostly below Wivenhoe inflows and are always less than pre Somerset Dam or natural (pre Somerset and Wivenhoe Dam) flows.
• Flows from the fuse plugs on the right abutment spillway increase peak water levels by 0.7 m to 1.1 m at Savages Crossing, and by 0.3 m to 0.5 m at Moggill Gauge. Flows from fuse plug 4 (Saddle Dam 2 spillway) increases peak water levels by almost 1.5 m at Savages Crossing and by 0.6m at Moggill Gauge. This increase translates to only a small increase in flood extent upstream of Savages Crossing;
• The rate of water level rise downstream of Savages Crossing is not significantly affected by the fuse plug flows. It appears that the rapid increase in flows from all fuse plug flows is mitigated by the large floodplain storage upstream of Savages Crossing.
• The flood peak travel times from Wivenhoe Dam to Savages Crossing (Fernvale) vary from 7 hours prior to the initiation of fuse plug 1 to 1.5 hours following the initiation of fuse plug 4;
• The flood peak travel times from Wivenhoe Dam to Moggill Gauge vary from 23.5 hours prior to the initiation of fuse plug 1 to 15.5 hours following the initiation of fuse plug 4; and
• The fuse plug flows do not significantly alter the flood peak travel times;

Wivenhoe Alliance Wivenhoe Dam Spillway Augmentation Design Discharges and Downstream Impacts of the Wivenhoe Dam Upgrade
ItemID: 003684262 Page 54 of 93
Date Printed: 27/09/2005 3:25:00 PM Last Saved: 27/09/2005 3:24:00 PM
1 0 . REFERENCES
ANCOLD (2000) Guidelines on Selection of Acceptable flood capacity for dams, Australian national Committee on Large Dams. March 2000
BOM (1991) Probable Maximum Precipitation Studies for the Brisbane River Catchment, and sub-catchments of the Brisbane River System, Queensland regional Office, 1991
BOM (2003) Generalised Probable Maximum Precipitation Estimates for the Wivenhoe Dam Catchment. Report prepared for SEQWater by the Hydrometeorological Advisory Service of the Commonwealth Bureau of Meteorology (HAS report No. GTSMR/03R) 2003.
Bradley (1978) Hydraulics of Bridge Waterways, Hydraulic Design Series No. 1, Federal Highway Administration US Department of Transportation Second Edition revised March 1978 Washington DC
CHOW (1959) Open Channel Hydraulics, McGraw Hill, New York Ven T Chow Ph.D 1959
DNR (1994) Brisbane River Flood Study suite of reports. Reports prepared by the Department of Natural Resources (1994).
DNR (1997) Brisbane River System Hydrological Simulation Modelling to Below Mt Crosby Weir. Department of Natural Resources, Resource Science Centre, Water Assessment and Planning, Surface Water Assessment John Ruffini, Maria Greer, Craig Johansen and Nerida Bartlett August 1997
DPWS (1998) Warragamba Dam Auxiliary Spillway – Concept Design Report NSW Department of Public Works and Services, Dams and Civil Section, Report No. DC98058
IEAUST (1999) Australian Rainfall and Runoff. A Guide to Flood Estimation. Institution of Engineers Australia (1999)
HAUSLER AND PORTER (1977) report on the Hydrology of Wivenhoe Dam, Water Resources Commission, QDPI Hydrology Report 143005.PR Brisbane
SKM (2000) Preliminary Risk Assessment Wivenhoe, Somerset and North Pine Dams. Final Report. Report prepared for SEQWater by SKM. (March, 2000)
SKM (2000a) Ipswich Rivers Flood Studies, Report prepared for Ipswich Rivers Improvement Trust by SKM (2000)
SEQWater (2002) Manual of Operational Procedures for Flood Mitigation for Wivenhoe and Somerset Dams” SEQWater, 2002
USACE (1990) Hydraulic Design of Spillways EM-1110-2-1603 Department of the Army, Washington DC 1990

Wivenhoe Alliance Wivenhoe Dam Spillway Augmentation Design Discharges and Downstream Impacts of the Wivenhoe Dam Upgrade
ItemID: 003684262 Page 55 of 93
Date Printed: 27/09/2005 3:25:00 PM Last Saved: 27/09/2005 3:24:00 PM
USBR (1987) Design of Small Dams United States Department of Interior, Bureau of Reclamation Third Edition 1987
WORLEY (2003) Wivenhoe Dam Spillway CFD Study, Draft Report prepared by Worley Pty Ltd for the Wivenhoe Alliance, November 2003.
WORLEY (2004) Wivenhoe Dam Right Abutment Spillway CFD Study, Final Report. Prepared by Worley Pty Ltd for the Wivenhoe Alliance. 19 October 2004.
WRC (1979) Wivenhoe Dam Spillway Hydraulic Model Studies. Prepared by M.Wilke at the Queensland Water Resources Commission Hydraulics Laboratory November 1979

Wivenhoe Alliance Wivenhoe Dam Spillway Augmentation Design Discharges and Downstream Impacts of the Wivenhoe Dam Upgrade
ItemID: 003684262 Page 56 of 93
Date Printed: 27/09/2005 3:25:00 PM Last Saved: 27/09/2005 3:24:00 PM
Appendix A
Hydrological Model Development
Wivenhoe Alliance Wivenhoe Dam Spillway Augmentation Design Discharges and Downstream Impacts of the Wivenhoe Dam Upgrade
ItemID: 003684262 Page 57 of 93
Date Printed: 27/09/2005 3:25:00 PM Last Saved: 27/09/2005 3:24:00 PM
1 . INTRODUCTION
This appendix presents the methodology, models and model parameters used to derive design flood estimates at Wivenhoe Dam for flood events up to the PMF.

Wivenhoe Alliance Wivenhoe Dam Spillway Augmentation Design Discharges and Downstream Impacts of the Wivenhoe Dam Upgrade
ItemID: 003684262 Page 58 of 93
Date Printed: 27/09/2005 3:25:00 PM Last Saved: 27/09/2005 3:24:00 PM
2 . METHOD OF ANALYSIS
2.1 GENERAL
Three numerical models were used to estimate design discharges:
• The WT42D rainfall runoff routing model was used to estimate inflow hydrographs to Wivenhoe Dam and Somerset Dam and the downstream tributary flows in the Brisbane River from Lockyer Creek and the Bremer River;
• The WIVOPS model was used to derive outflow hydrographs from Somerset Dam and derive outflows from Wivenhoe Dam for flood events that do not initiate a fuse plug;
• The FLRoute model was used to determine Wivenhoe Dam outflows for events that initiate a fuse plug.
Brief descriptions of these models and their use in this study are given below.
2.2 WT42D RAINFALL-RUNOFF-ROUTING MODEL
The Queensland Department of Natural Resources (DNR) developed the WT42D rainfall runoff routing model in 1994 as part of an overall safety review of SEQWater’s dams. Details of this safety review are presented in a series of reports entitled Brisbane and Pine River Flood Study (DNR, 1994). The WT42D model was initially developed as a ‘design’ model to derive design discharges including the probable maximum flood (PMF) and the dam crest flood (DCF) at the various dams. It was then modified to enable it to be used as a ‘real time’ flood-forecasting model. Details of this model are given in DNR (1994).
2.2.1 Model Layout
Figure 2.1 shows the Brisbane River catchment delineated into the various WT42D model sub-catchments. DNR separated the WT42D model into five distinct areas representing the Stanley River to Somerset Dam, the Upper Brisbane River to Wivenhoe Dam, Lockyer Creek to Savages Crossing (GS 143001), the Bremer River to David Trumpy Bridge and the Lower Brisbane River. These areas are delineated further into twenty-two separate WT42D sub-models as follows;
• One representing the Stanley River catchment;
• Six representing the Upper Brisbane River catchment;
• Four representing Lockyer Creek,
• Five representing the Bremer River; and
• Six representing the Lower Brisbane River.

Wivenhoe Alliance Wivenhoe Dam Spillway Augmentation Design Discharges and Downstream Impacts of the Wivenhoe Dam Upgrade
ItemID: 003684262 Page 59 of 93
Date Printed: 27/09/2005 3:25:00 PM Last Saved: 27/09/2005 3:24:00 PM
Figure 2.1 Sub-catchment Boundaries, Brisbane River WT42D Model

Wivenhoe Alliance Wivenhoe Dam Spillway Augmentation Design Discharges and Downstream Impacts of the Wivenhoe Dam Upgrade
ItemID: 003684262 Page 60 of 93
Date Printed: 27/09/2005 3:25:00 PM Last Saved: 27/09/2005 3:24:00 PM
The sub-models for each area are linked together and run through a batch file to determine discharge hydrographs for each area. This composite model derives inflow hydrographs to Wivenhoe and Somerset Dams and hydrographs for the various downstream catchment areas.
2.2.2 Model Calibration and Testing
DNR calibrated the model to some 10 historical flood events recorded at the various rainfall and stream flow gauges throughout the catchment. When determining the model routing parameters, DNR adopted a “m” value of 0.8 and determined a weighted average of “k” derived from the calibration events. The weighting was in proportion to the peak discharge of each calibration event. The model parameters are therefore biased towards flood events of relatively large magnitude (DNR, 1994). Sunwater, in conjunction with the Queensland Department of Natural Resources and Mines (NR&M) (formerly DNR), now use the model as a flood-forecasting model for SEQWater. The model has now been successfully tested during several recent flood events including a large flood that occurred in 1999.
DNR’s model calibration has not been independently verified for this study. However, the WT42D model design flows were compared against design flows estimated by the BOM’s URBS model of the Brisbane River. The BOM’s model uses the same catchment sub-division as the WT42D model but has been independently calibrated by BOM.
The inflow peaks to Wivenhoe and Somerset Dams compare reasonably well between the two models. However, the predicted Lockyer Creek and Bremer River flood peaks compare poorly. The reasons for the discrepancy between the two models for the lower tributaries have not been investigated because this study is generally only interested in the inflows to Wivenhoe Dam. The model calibration was considered to be satisfactory for the purposes of this study. The adopted k values for each sub-catchment are provided in DNR (1994).
2.3 THE WIVOPS DAM OPERATION MODEL
The WIVOPS model was developed by DNR to simulate the gate operation rules of Wivenhoe and Somerset Dams presented in Section 3 of the main report. The model inputs the Upper Brisbane and Stanley River hydrographs together with the Lockyer and Bremer outflow hydrographs derived using the WT42D model to determine the releases from both Somerset and Wivenhoe Dams.
The proposed auxiliary spillways have been incorporated into the WIVOPs program but the proposed changes to the gate opening procedures have not been incorporated. As such, WIVOPS is only used to determine;
• The outflows from Somerset Dam for all design events; and
• The outflows from Wivenhoe Dam for events that reach a maximum lake level below 75.5 m AHD, the trigger level for Procedure 4(b) gate operating procedure (see Section 4.4 of the main report). That is, all events up to and including the 1 in 2,000 AEP flood event.

Wivenhoe Alliance Wivenhoe Dam Spillway Augmentation Design Discharges and Downstream Impacts of the Wivenhoe Dam Upgrade
ItemID: 003684262 Page 61 of 93
Date Printed: 27/09/2005 3:25:00 PM Last Saved: 27/09/2005 3:24:00 PM
2.4 FLROUTE DAM ROUTING MODEL
The FLRoute dam routing program was used to derive the outflows from Wivenhoe Dam for events greater than the 1 in 2,000 AEP event where Procedure 4B gate operating rule is necessary. FLRoute was developed by the NSW Department of Commerce as a generic dam flood routing model specifically developed to design auxiliary spillways. Several spillway configurations can be investigated including:
• Uncontrolled spillways defined by the weir formula;
• Embankment type fuse plug spillways incorporating the weir formula and a longitudinal erosion rate or failure time;
• Spillways defined by a rating table;
• "Hydroplus" type fuse gate spillways;
• Embankment type fuse plug spillways with coefficient of discharge (Cd) values for both the crest and the sill; and
• A combination of the above spillway types.
In this study, rating tables were used to define the stage-discharge relationship of the existing spillway. Separate rating tables were developed for each design event to approximate the gate operating procedures for that event. The rating tables are described further in Section 3.8.2. An embankment type fuse plug spillway with a coefficient of discharge (Cd) values for both the crest and the sill was used for the proposed auxiliary spillways. Details of the stage-discharge relationship used for the auxiliary spillway are given below.
2.4.1 Adopted Auxiliary Spillway Stage-Discharge Relationship
Figure 2.2 shows the adopted auxiliary spillway stage-discharge relationships used in FLRoute to estimate design flows. These curves were derived using a Cd of 1.98 for the fuse plug sill, which was derived from published data (USBR, 1987) and physical model studies of a similar sized ogee crest at Glenlyon and Toonumbar Dams. A Cd of 1.7 was used for water overtopping the fuse plug crest. It was assumed that the fuse plugs erode at a rate of 100 m per hour. Details of the adopted fuse plug behaviour are described in Section 3.4 of the main section of the report.
The curves in Figure 2.2 approximate the stage-discharge relationship of the four fuse plugs by using a fixed Cd. A more accurate stage discharge relationship, where the Cd varies with head, is presented in Appendix C. The curves in Appendix C were developed using theoretical data and the results of a 3 dimensional computational fluid dynamics (CFD) model of the spillway chute (Worley, 2004). The adopted curve, shown in Figure 2.2, is considered acceptable for the estimation of design flows as it adequately approximates the true curve. However, it is recommended that the more accurate stage discharge curve in Appendix C be used for flood forecasting.

Wivenhoe Alliance Wivenhoe Dam Spillway Augmentation Design Discharges and Downstream Impacts of the Wivenhoe Dam Upgrade
ItemID: 003684262 Page 62 of 93
Date Printed: 27/09/2005 3:25:00 PM Last Saved: 27/09/2005 3:24:00 PM
67
69
71
73
75
77
79
81
0 5,000 10,000 15,000 20,000 25,000
Discharge (m3/s)
Stag
e (m
AH
D)
4 bays 3 Bays 2 bays 1 bay
Figure 2.2 Adopted Auxiliary Spillway Stage-Discharge Relationships, Wivenhoe Dam
2.4.2 Adopted Fuse Plug Initiation Levels
Table 2.1 shows the fuse plug pilot channel crest levels and the adopted fuse plug initiation levels used in the analysis. It has been assumed that a depth averaged water level of 0.1m over the pilot channel crest is required to initiate a fuse plug. Spillway chute losses of 0.03m and 0.08 m have been assumed for bay 2 and bay 3 on the right abutment respectively. These losses were determined from the 3D CFD modelling of the spillway undertaken by Worley (2004).
Table 2.1 Fuse Plug Crest Levels and Adopted Fuse Plug Initiation Level, Wivenhoe Dam
Fuse Plug Pilot Channel Crest Level (m AHD)
Adopted Fuse Plug Initiation level (m AHD)
Bay 1 (Right Abutment) 75.70 75.80
Bay 2 (Right Abutment) 76.20 76.33
Bay 3 (Right Abutment) 76.70 76.88
Saddle Dam 2 78.30 78.30

Wivenhoe Alliance Wivenhoe Dam Spillway Augmentation Design Discharges and Downstream Impacts of the Wivenhoe Dam Upgrade
ItemID: 003684262 Page 63 of 93
Date Printed: 27/09/2005 3:25:00 PM Last Saved: 27/09/2005 3:24:00 PM
3 . DESIGN FLOOD ESTIMATION
3.1 GENERAL
Design flood estimates for Wivenhoe Dam were made for a range of events from the 1 in 200 AEP event to the Probable Maximum Flood (PMF). This covers the range of floods affected by the proposed auxiliary spillway works.
Note that this report focuses only on design flows at Wivenhoe Dam. These flows do not directly correspond to downstream design flows through Brisbane or Ipswich, which include flows from the Bremer River and Lockyer Creek. Additional hydrological analyses are required to determine Brisbane River design flows downstream of Wivenhoe Dam, which is outside the scope of this investigation.
3.2 DESIGN RAINFALL DEPTHS
Table 3.1 shows the design rainfall depths and aerial reduction factors for storms of various durations in the Wivenhoe Dam catchment. The BOM (2003) provided PMP rainfall depths. NR&M provided aerial reduction factors and rainfall depths for the more frequent events up to an Annual Exceedance Probability (AEP) of 1 in 2,000. Rainfall depths up to an AEP of 1 in 2,000 were derived using the CRC Forge Method. Intermediate rainfall depths were derived using the interpolation procedure recommended in ARR (1999). Note that the rainfall depths in Table 3.1 are catchment rainfall depths and not point rainfall depths, as aerial reduction factors have already been applied.
3.2.1 Annual Exceedance Probability of the PMP
For the purpose of this investigation, the PMP is assigned a notional AEP of 1 in 143,000, as recommended in Australian Rainfall and Runoff (IEAUST, 1999). It is noted that “there is considerable uncertainty surrounding these (AEP) recommendations as they are for events beyond the realm of experience and are based on methods whose conceptual foundations are unclear” (IEAUST, 1999). The uncertainty is reflected in the two orders of magnitude given to confidence limits of the recommended AEP. This assumption is significant to this study as it impacts on the AEP of the existing and proposed Stage 1 dam crest flood (DCF), which impacts on the determination of tolerable risk and any consequence assessment. It is understood that research is currently being undertaken to better define the AEP of the PMP. Given the potential impact of this assumption, it is recommended that any future research be considered before additional risk assessments are undertaken for the dam.

Wivenhoe Alliance Wivenhoe Dam Spillway Augmentation Design Discharges and Downstream Impacts of the Wivenhoe Dam Upgrade
ItemID: 003684262 Page 64 of 93
Date Printed: 27/09/2005 3:25:00 PM Last Saved: 27/09/2005 3:24:00 PM
Table 3.1 Design Catchment Rainfall Depths and Aerial Reduction Factors for Various Storm Durations, Wivenhoe Dam Catchment
AEP (1 in X) Design Rainfall Depths (mm) and Aerial Reduction Factors for Various Storm Durations (hours)
Duration (Hours) 24 36 48 72 96 120
PMPa (143,000) 800 940 1,060 1,280 1,460 1,530
100,000 712 847 962 1,160 1,315 1,380
50,000 578 703 806 969 1,087 1,144
Exist. DCFb (22,000) 466 576 666 799 887 936
10,000 391 488 567 677 747 788
5,000 343 430 500 595 653 690
2,000 301 375 434 514 562 594
1,000 276 342 394 464 507 535
500 252 310 356 417 455 481
200 221 270 309 359 392 415
ARFc 0.791 0.827 0.853 0.881 0.898 0.909
a Probable Maximum Precipitation b Dam Crest Flood c Aerial Reduction Factor
3.3 MODEL PARAMETERS
The following model parameters were used to calculate the design flows:
• “k” and ‘m’ values determined from the model calibration (DNR, 1994) were used;
• Design rainfalls provided in Table 3.1 are spatially weighted in accordance with the recommendations in BOM (2003) for the sub-catchments upstream of the dam. The spatial weights were provided by NR&M. Rainfall on catchments downstream of the dam is not spatially weighted.
3.4 ADOPTED RAINFALL LOSSES
NR&M recommended the adoption of an initial loss of 0 mm and a continuing loss of 2.5 mm/hr to estimate the PMF at the dam. This recommendation was based on the model calibration study undertaken by DNR (1994), which found initial losses varied from 0 to 65 mm but were generally closer to zero for the larger events with some pre-burst rainfall. Continuing losses varied between 0.1 to 11 mm/hr but were generally around 2.5 mm/hr. Stanley River catchment continuing losses were generally between 0.1 and 0.3 mm/hr. The largest calibration event used in the 1994 study was the 1974 event.
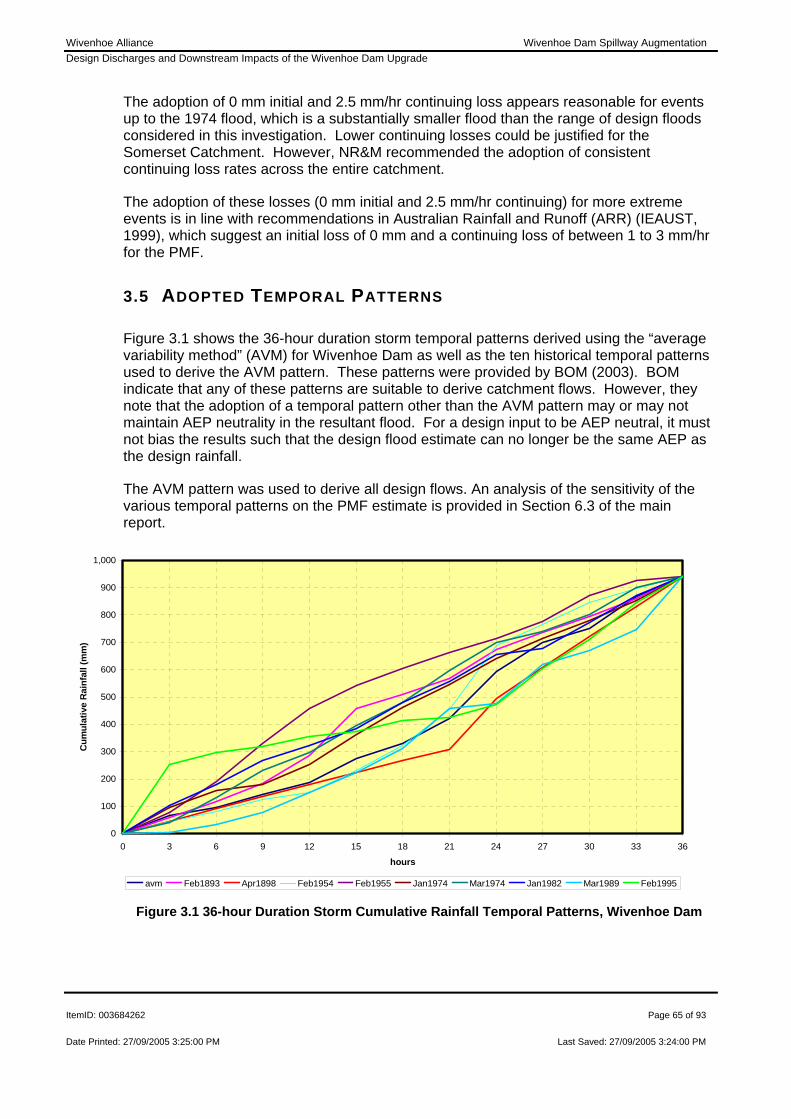
Wivenhoe Alliance Wivenhoe Dam Spillway Augmentation Design Discharges and Downstream Impacts of the Wivenhoe Dam Upgrade
ItemID: 003684262 Page 65 of 93
Date Printed: 27/09/2005 3:25:00 PM Last Saved: 27/09/2005 3:24:00 PM
The adoption of 0 mm initial and 2.5 mm/hr continuing loss appears reasonable for events up to the 1974 flood, which is a substantially smaller flood than the range of design floods considered in this investigation. Lower continuing losses could be justified for the Somerset Catchment. However, NR&M recommended the adoption of consistent continuing loss rates across the entire catchment.
The adoption of these losses (0 mm initial and 2.5 mm/hr continuing) for more extreme events is in line with recommendations in Australian Rainfall and Runoff (ARR) (IEAUST, 1999), which suggest an initial loss of 0 mm and a continuing loss of between 1 to 3 mm/hr for the PMF.
3.5 ADOPTED TEMPORAL PATTERNS
Figure 3.1 shows the 36-hour duration storm temporal patterns derived using the “average variability method” (AVM) for Wivenhoe Dam as well as the ten historical temporal patterns used to derive the AVM pattern. These patterns were provided by BOM (2003). BOM indicate that any of these patterns are suitable to derive catchment flows. However, they note that the adoption of a temporal pattern other than the AVM pattern may or may not maintain AEP neutrality in the resultant flood. For a design input to be AEP neutral, it must not bias the results such that the design flood estimate can no longer be the same AEP as the design rainfall.
The AVM pattern was used to derive all design flows. An analysis of the sensitivity of the various temporal patterns on the PMF estimate is provided in Section 6.3 of the main report.
0
100
200
300
400
500
600
700
800
900
1,000
0 3 6 9 12 15 18 21 24 27 30 33 36
hours
Cum
ulat
ive
Rai
nfal
l (m
m)
avm Feb1893 Apr1898 Feb1954 Feb1955 Jan1974 Mar1974 Jan1982 Mar1989 Feb1995 Figure 3.1 36-hour Duration Storm Cumulative Rainfall Temporal Patterns, Wivenhoe Dam
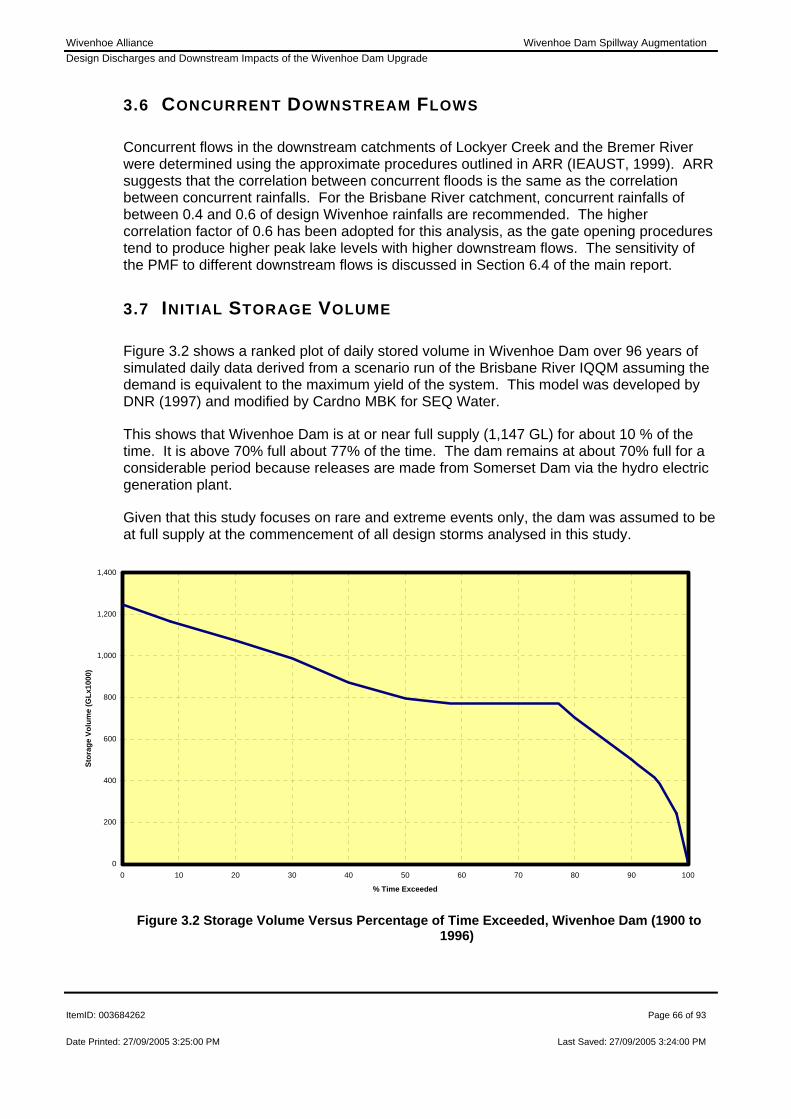
Wivenhoe Alliance Wivenhoe Dam Spillway Augmentation Design Discharges and Downstream Impacts of the Wivenhoe Dam Upgrade
ItemID: 003684262 Page 66 of 93
Date Printed: 27/09/2005 3:25:00 PM Last Saved: 27/09/2005 3:24:00 PM
3.6 CONCURRENT DOWNSTREAM FLOWS
Concurrent flows in the downstream catchments of Lockyer Creek and the Bremer River were determined using the approximate procedures outlined in ARR (IEAUST, 1999). ARR suggests that the correlation between concurrent floods is the same as the correlation between concurrent rainfalls. For the Brisbane River catchment, concurrent rainfalls of between 0.4 and 0.6 of design Wivenhoe rainfalls are recommended. The higher correlation factor of 0.6 has been adopted for this analysis, as the gate opening procedures tend to produce higher peak lake levels with higher downstream flows. The sensitivity of the PMF to different downstream flows is discussed in Section 6.4 of the main report.
3.7 INITIAL STORAGE VOLUME
Figure 3.2 shows a ranked plot of daily stored volume in Wivenhoe Dam over 96 years of simulated daily data derived from a scenario run of the Brisbane River IQQM assuming the demand is equivalent to the maximum yield of the system. This model was developed by DNR (1997) and modified by Cardno MBK for SEQ Water.
This shows that Wivenhoe Dam is at or near full supply (1,147 GL) for about 10 % of the time. It is above 70% full about 77% of the time. The dam remains at about 70% full for a considerable period because releases are made from Somerset Dam via the hydro electric generation plant.
Given that this study focuses on rare and extreme events only, the dam was assumed to be at full supply at the commencement of all design storms analysed in this study.
0
200
400
600
800
1,000
1,200
1,400
0 10 20 30 40 50 60 70 80 90 100
% Time Exceeded
Stor
age
Volu
me
(GLx
1000
)
Figure 3.2 Storage Volume Versus Percentage of Time Exceeded, Wivenhoe Dam (1900 to
1996)

Wivenhoe Alliance Wivenhoe Dam Spillway Augmentation Design Discharges and Downstream Impacts of the Wivenhoe Dam Upgrade
ItemID: 003684262 Page 67 of 93
Date Printed: 27/09/2005 3:25:00 PM Last Saved: 27/09/2005 3:24:00 PM
3.8 GATE OPERATION PROCEDURE ASSUMPTIONS
3.8.1 The Existing Dam
The WIVOPS model was used to estimate outflows from the existing dam (without the proposed auxiliary spillway):
• For events up to and including the 1 in 5,000 AEP flood, the time between gate openings was assumed to be ten minutes per 500 mm gate opening increment, as defined for Procedure 4 of the Flood Operations Manual;
• For larger events, the time between gate openings was assumed to be six minutes per 500 mm opening to ensure the gates are not overtopped. Six minutes was selected to reflect that the gates will be opened at 10 minutes per increment and some will be at 5 minutes during the event.
It is noted that the outflows are very sensitive to the adopted gate opening increment. The adoption of a different gate opening increment will change the design flows and the estimate of the dam crest flood flow. The gate opening increments adopted above are assumed to provide the best estimate of how the dam would be operated during the various design floods for the existing dam.
3.8.2 Stage 1 and Stage 2 Dam Upgrade
Events up to and including the 1 in 2,000 AEP Flood.
The WIVOPS program was used to estimate Wivenhoe inflows and outflows using a 500 mm per 10 minutes gate opening increment. This includes all events that do not initiate a fuse plug or are not affected by the changes to the Procedure 4 gate opening procedures.
Events between the 1 in 2,000 AEP flood and the 1 in 5,000 AEP flood
The WIVOPS program was used to estimate Wivenhoe inflows and outflows using a 1m per 10 minutes gate opening increment. This includes events that would cause the fuse plugs to initiate using a 500 mm per 10 minute gate opening increment but would not cause the fuse plugs to initiate using a 1m per 10 minute gate opening increment.
Events Greater than the 1 in 5,000 AEP Flood
For events that initiate a fuse plug using the WIVOPS program, a combination of the WIVOPS program and the FLRoute program were used. The WIVOPS program was used to estimate Somerset Dam outflows, which is combined with Upper Brisbane River flows to derive Wivenhoe Dam inflows. The FLRoute model was then used to estimate Wivenhoe outflows.
Figure 3.3 shows the adopted stage-discharge curves used in FLRoute for the gated spillway for events that initiate a fuse plug. The lake levels corresponding to the various gate operating procedure trigger levels are also shown. These curves approximate the proposed Procedure 4 gate opening procedures. In developing these curves, the following was assumed:
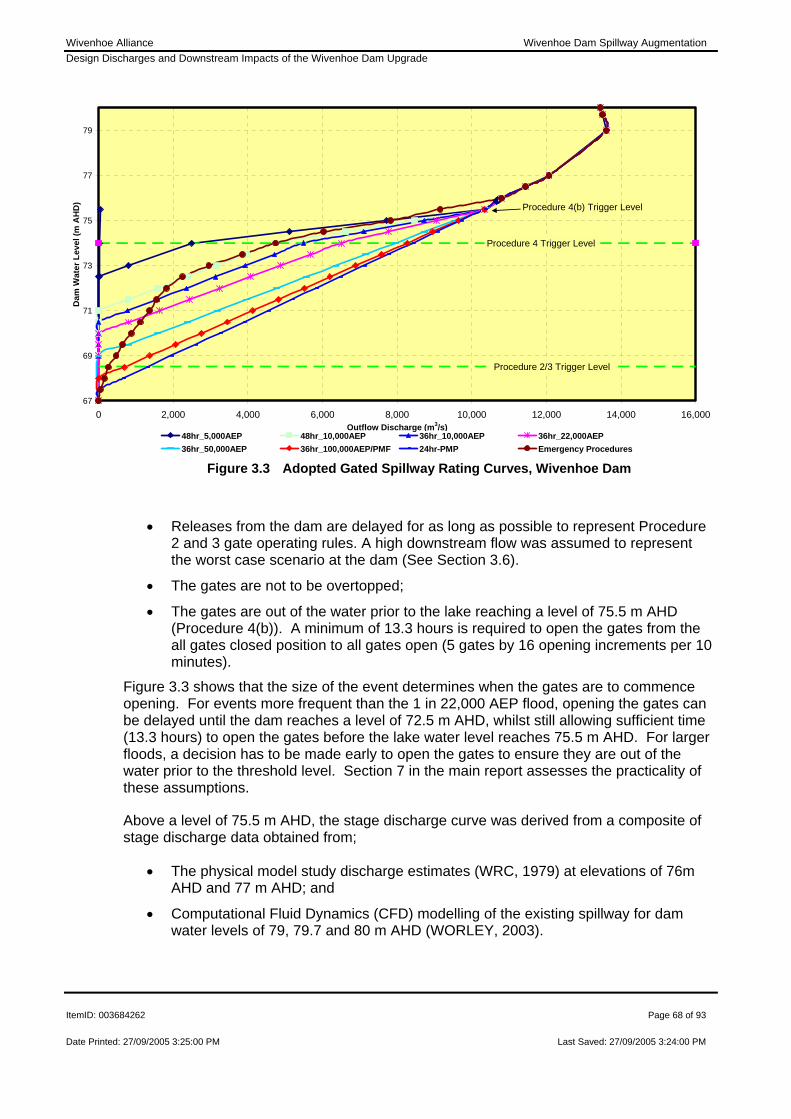
Wivenhoe Alliance Wivenhoe Dam Spillway Augmentation Design Discharges and Downstream Impacts of the Wivenhoe Dam Upgrade
ItemID: 003684262 Page 68 of 93
Date Printed: 27/09/2005 3:25:00 PM Last Saved: 27/09/2005 3:24:00 PM
67
69
71
73
75
77
79
0 2,000 4,000 6,000 8,000 10,000 12,000 14,000 16,000Outflow Discharge (m3/s)
Dam
Wat
er L
evel
(m A
HD
)
48hr_5,000AEP 48hr_10,000AEP 36hr_10,000AEP 36hr_22,000AEP36hr_50,000AEP 36hr_100,000AEP/PMF 24hr-PMP Emergency Procedures
Procedure 4(b) Trigger Level
Procedure 4 Trigger Level
Procedure 2/3 Trigger Level
Figure 3.3 Adopted Gated Spillway Rating Curves, Wivenhoe Dam
• Releases from the dam are delayed for as long as possible to represent Procedure 2 and 3 gate operating rules. A high downstream flow was assumed to represent the worst case scenario at the dam (See Section 3.6).
• The gates are not to be overtopped;
• The gates are out of the water prior to the lake reaching a level of 75.5 m AHD (Procedure 4(b)). A minimum of 13.3 hours is required to open the gates from the all gates closed position to all gates open (5 gates by 16 opening increments per 10 minutes).
Figure 3.3 shows that the size of the event determines when the gates are to commence opening. For events more frequent than the 1 in 22,000 AEP flood, opening the gates can be delayed until the dam reaches a level of 72.5 m AHD, whilst still allowing sufficient time (13.3 hours) to open the gates before the lake water level reaches 75.5 m AHD. For larger floods, a decision has to be made early to open the gates to ensure they are out of the water prior to the threshold level. Section 7 in the main report assesses the practicality of these assumptions.
Above a level of 75.5 m AHD, the stage discharge curve was derived from a composite of stage discharge data obtained from;
• The physical model study discharge estimates (WRC, 1979) at elevations of 76m AHD and 77 m AHD; and
• Computational Fluid Dynamics (CFD) modelling of the existing spillway for dam water levels of 79, 79.7 and 80 m AHD (WORLEY, 2003).

Wivenhoe Alliance Wivenhoe Dam Spillway Augmentation Design Discharges and Downstream Impacts of the Wivenhoe Dam Upgrade
ItemID: 003684262 Page 69 of 93
Date Printed: 27/09/2005 3:25:00 PM Last Saved: 27/09/2005 3:24:00 PM
Note that the outflow discharge of the gated spillway decreases as the lake level exceeds 79 m AHD. CFD modelling of the gated spillway shows that orifice flow occurs as the existing gates and the service bridge impinge on the flows.
3.8.3 1 in 6,000 AEP Flood Stage-Discharge Curve Comparison
Figure 3.4 shows a comparison of the 1 in 6,000 AEP design flood stage-discharge curve estimated using the WIVOPS program and the approximated curve adopted in FLRoute. The WIVOPS curve was developed from the rising limb of the outflow hydrograph and the corresponding lake levels. This flood was adopted because it is the first design flood that initiates a fuse plug. The following is of note with respect to Figure 3.4.
67
68
69
70
71
72
73
74
75
76
77
0 2,000 4,000 6,000 8,000 10,000 12,000Outflow Discharge (cumecs)
Dam
Wat
er L
evel
(m A
HD
)
48hr_5,000AEP (WIVOPS) 48hr_5,000 (FLRoute) Figure 3.4 1 in 6,000 AEP Adopted Gated Spillway Rating Curve and that Estimated Using
WIVOPS, Wivenhoe Dam
• The WIVOPS program estimates that the gates are to be opened early in the flood and then closed as the downstream flows increase. This has been ignored when developing the adopted curve;
• The dam water level at which the gates commence opening (again) is the same for both curves. The gates are opened at this time to ensure the gates are not overtopped;
• WIVOPS predicts that the 1 in 6,000 AEP design flood peaks at 75.80 m AHD with a combined peak outflow from both spillways of 13,000 m3/s. WIVOPS predicts that the gates are fully raised just as the fuse plugs initiate. The proposed changes to Procedure 4 opens the gates at a faster rate earlier in the flood to ensure the gates are opened before 75.5 m AHD. Under this scenario, the flood peaks at a level of 75.55 m AHD with a peak outflow of 10,400 m3/s using the above rating curve.

Wivenhoe Alliance Wivenhoe Dam Spillway Augmentation Design Discharges and Downstream Impacts of the Wivenhoe Dam Upgrade
ItemID: 003684262 Page 70 of 93
Date Printed: 27/09/2005 3:25:00 PM Last Saved: 27/09/2005 3:24:00 PM
• An analysis of the 1 in 6,000 AEP flood indicates that there is sufficient time to open the gates using the adopted curve.
It is proposed to update the WIVOPS model to include proposed Procedure 4 changes. In the interim, the approximate stage-discharge relationships shown above provide a good representation of the design outflows for the extreme floods investigated in this study. Note that none of the gate closure rules during a flood are included in the modelling undertaken to date, and hence the shape of the recession curve of the outflow flood hydrographs will not be accurately predicted.

Wivenhoe Alliance Wivenhoe Dam Spillway Augmentation Design Discharges and Downstream Impacts of the Wivenhoe Dam Upgrade
ItemID: 003684262 Page 71 of 93
Date Printed: 27/09/2005 3:25:00 PM Last Saved: 27/09/2005 3:24:00 PM
4 . SUMMARY AND RECOMMENDATIONS
Design flood estimates were made using a rainfall – runoff - routing model (WT42D) of the Brisbane River catchment developed and calibrated by the then Department of Natural Resources (DNR, 1994), now the Department of Natural Resources and Mines (NR&M), together with two dam flood routing models; one developed by DNR and another by the NSW Department of Commerce (Commerce). The latest design rainfall estimates using the Generalised Tropical Storm Method Revised (GTSM-R) (BOM, 2003) and CRC Forge Method were used in the analysis. The following is of note:
• A series of rating curves are used to represent the proposed changes to the gate operating rules. These rules are yet to be coded into WIVOPS to accurately estimate design flows and the recession curve of floods. The assumed rules are expected to be representative of actual conditions;
• The stage-discharge relationship of the auxiliary spillway was developed using an adopted Cd value of the crest. The stage-discharge relationship has been refined using a 3 dimensional CFD model of the spillway chute. The refined rating curve should be incorporated into the WIVOPS program when it is updated;
• It is understood that research is currently being undertaken to better define the AEP of the PMP. Given the potential impact of this assumption, it is recommended that any future research be considered before additional risk assessments are undertaken for the dam.

Wivenhoe Alliance Wivenhoe Dam Spillway Augmentation Design Discharges and Downstream Impacts of the Wivenhoe Dam Upgrade
ItemID: 003684262 Page 72 of 93
Date Printed: 27/09/2005 3:25:00 PM Last Saved: 27/09/2005 3:24:00 PM
Appendix B
Hydraulic Model Development
Wivenhoe Alliance Wivenhoe Dam Spillway Augmentation Design Discharges and Downstream Impacts of the Wivenhoe Dam Upgrade
ItemID: 003684262 Page 73 of 93
Date Printed: 27/09/2005 3:25:00 PM Last Saved: 27/09/2005 3:24:00 PM
1 . INTRODUCTION
This appendix outlines the development of the hydraulic model used to derive design flood discharges and flood levels downstream of Wivenhoe Dam for a range of flood events up to the PMF.

Wivenhoe Alliance Wivenhoe Dam Spillway Augmentation Design Discharges and Downstream Impacts of the Wivenhoe Dam Upgrade
ItemID: 003684262 Page 74 of 93
Date Printed: 27/09/2005 3:25:00 PM Last Saved: 27/09/2005 3:24:00 PM
2 . HYDRAULIC MODEL DEVELOPMENT
2.1 GENERAL
Ipswich Rivers Improvement Trust made available the MIKE Hydraulic 11 model of the Brisbane and Ipswich Rivers, developed by SKM. The model was based on the Brisbane River MIKE 11 model, also developed by SKM, for Brisbane City Council. The model was developed as part of a comprehensive flood study of the Brisbane and Ipswich Rivers to derive design flood discharges and flood levels for a range of flood events from the 1 in 2 AEP event up to the PMF. Details of the model development and calibration are found in the Ipswich Rivers Flood Study Report (SKM, 2000a).
The SKM model was updated and recalibrated for this study. Substantial modifications to the above MIKE 11 model were necessary to use it for this study because:
• The model cross-sections did not extend much higher than the 1974 flood level, which is substantially lower than the PMF level investigated in this study;
• The model was developed using the 1999 version of MIKE 11. The 2003 version of MIKE 11, used in this study, would not reproduce results from the 1999 version;
• The model did not extend upstream of the Ipswich and Esk council boundary.
A brief description of the modifications undertaken is given in Section 2.2. The calibration results are given in Section 3.
2.1 AVAILABLE TOPOGRAPHIC DATA
The following digital topographic data was available for the study:
• Cross sections from the SKM MIKE 11 model;
• 1 m digital contours of Brisbane City Council area;
• 0.5 m digital contours of Ipswich City Council area;
• 5 m digital contours of Esk Shire Council area; and
• Cross sections surveyed for DNR for the 1994 study. These cross sections were used to develop a Rubicon model of the Brisbane River.
The digital topographic data was combined to form a single digital elevation model (DEM) of the catchment from the dam to Moreton Bay. This DEM was used to update the MIKE 11 model and derive flood extent maps.
2.2 MODEL MODIFICATIONS
The following modifications were made to the SKM MIKE 11 model for this study:

Wivenhoe Alliance Wivenhoe Dam Spillway Augmentation Design Discharges and Downstream Impacts of the Wivenhoe Dam Upgrade
ItemID: 003684262 Page 75 of 93
Date Printed: 27/09/2005 3:25:00 PM Last Saved: 27/09/2005 3:24:00 PM
• Brisbane River cross sections in the SKM MIKE 11 model were extended to encompass the extent of GTSMR PMF flooding using the available digital contour data;
• Thirty eight additional branches were used to represent the overland flow paths that occur at high flows;
• The model was extended from the Ipswich and Esk Shire boundary to Wivenhoe Dam and up to Lyons Bridge on Lockyer Creek using cross sections from the NR&M Rubicon hydraulic model. Cross section distances on Lockyer Creek are based on floodplain distances rather than main channel distances as this provides the best representation of floodplain conveyance and storage for large flood events. The representation of smaller flows will be less accurate;
• Additional floodplain storage on the Bremer River and its tributaries, not represented by the existing cross sections was modelled using stage-surface area curves at Bremer River cross sections 1,000,700 (upper reach), 1,025,300 (middle reach) and 1,025,300 (lower reach);
• The stage – storage relationship (attached to Oxley Creek cross section 599400) representing floodplain storage within Oxley Creek was extended up to the new PMF level; and
• A number of bridge structures were modified to remove model instabilities as described below.
The model configuration showing the additional branches is shown in Figure 2.1.
2.2.1 Structures
A total of 72 culverts and 64 weirs are included in the MIKE 11 model to represent the road and rail bridges that cross the Brisbane River and its tributaries. Details of these and other structures are provided in the Ipswich Rivers Flood Study Report (SKM, 2000a). A list of bridges of importance to this study along the Brisbane River is given in Table 2.1.
All but the Fernvale Bridge was included in the SKM MIKE 11 model. The Department of Main Roads provided “as constructed” drawings of the Fernvale Bridge for the study. Some modifications to the existing structures were necessary because the SKM model contained steep inverse bed slopes at a number of the bridge structures, which caused the model to become unstable. Modifying the downstream cross sections and correcting the bed slope of the structure were necessary to remove the instabilities.
Discussions with DHI, the developers of MIKE 11, indicated that the algorithms used to estimate afflux at bridges have been changed between the 1999 and 2003 versions of MIKE 11. Therefore the 1999 and 2003 versions are expected to produce different affluxes using the same parameters.

Wiv
enho
e A
llian
ce
Wiv
enho
e D
am S
pillw
ay A
ugm
enta
tion
IPA
A s
tage
D
esig
n D
isch
arge
s an
d D
owns
tream
Impa
cts
of th
e W
iven
hoe
Dam
Upg
rade
Ite
mID
: 003
6842
62
Pag
e 76
of 9
3
Dat
e P
rinte
d: 2
7/09
/200
5 3:
25:0
0 P
M
Last
Sav
ed: 2
7/09
/200
5 3:
24:0
0 P
M
LEG
END
Inflo
w L
ocat
ion
Dow
nstre
am B
ound
ary
Mod
elle
d R
each
Mod
elle
d Li
nk B
ranc
h
Figu
re 2
.1
MIK
E 11
Hyd
raul
ic M
odel
Con
figur
atio
n, B
risba
ne R
iver
Cat
chm
ent

Wivenhoe Alliance Wivenhoe Dam Spillway Augmentation IPAA stage Design Discharges and Downstream Impacts of the Wivenhoe Dam Upgrade
ItemID: 003684262 Page 77 of 93
Date Printed: 27/09/2005 3:25:00 PM Last Saved: 27/09/2005 3:24:00 PM
Table 2.1 Brisbane River Bridges, MIKE 11 Model
Structure Brisbane River Chainage (km)
Gateway Bridge (not modelled) -
Story Bridge 21.7
Captain Cook Bridge 24.0
Victoria Bridge 25.3
William Jolly Bridge 26.0
Merivale Street Bridge 26.3
Indooroopilly Bridges (Indooroopilly Rail Bridge and Walter Taylor Bridge)
41.6
Centenary Bridge 50.0
Colleges Crossing Bridge 86.2
Mt Crosby Weir 90.5
Kholo Bridge 99.1
Fernvale Bridge 134.5

Wivenhoe Alliance Wivenhoe Dam Spillway Augmentation IPAA stage Design Discharges and Downstream Impacts of the Wivenhoe Dam Upgrade
ItemID: 003684262 Page 78 of 93
Date Printed: 27/09/2005 3:25:00 PM Last Saved: 27/09/2005 3:24:00 PM
3 . MODEL CALIBRATION
3.1 GENERAL
A check of the original MIKE 11 model calibration was undertaken to ensure that the modifications made did not affect the calibration results. The 1974 historical flood was used for this purpose because the 1974 flood calibration parameters were adopted by SKM in their study to estimate design flows. The model results were compared against:
• Recorded water level data of the 1974 flood provided by the Ipswich Rivers Improvement Trust; and
• 1974 water levels and flows predicted using the SKM model.
Recorded water level data for the 1974 flood was only available downstream of the Ipswich-Esk shire boundary. As such, model calibration was only undertaken in this area. The model is un-calibrated above this location.
To be consistent with the SKM study, the inflow hydrographs developed for their study were used for model calibration. These inflow hydrographs were developed using an XP-RAFTS model of the catchment.
3.2 ADOPTED ROUGHNESS COEFFICIENTS
Manning’s ‘n’ values used in the SKM model varied from 0.03 to 0.13 for the Brisbane River main channel, and from 0.04 to 0.22 on the floodplain. The adopted Manning’s ‘n’ values account for channel roughness and bend losses (which are not explicitly modelled in MIKE 11).
Re-calibration of the model was achieved by increasing Brisbane River channel and floodplain Manning’s ‘n’ values by 5% downstream of the Bremer River confluence. The Manning’s ‘n’ values at cross section BNE 976020 (upstream of Kholo Bridge) were also modified to match the roughness values of the upstream cross sections. This was necessary to replicate SKM model results in this vicinity.
It is noted that SKM adopted overbank Manning’s roughness values that are extraordinarily high (up to 0.22). The adopted values are likely to be adequate for events up to the 1974 flood as buildings will slow overbank velocities. As the flood level rises, overbank velocities are likely to increase and Manning’s ‘n’ values will correspondingly decrease. The calibrated values have been adopted for this study in the absence of better data. However, flood levels much higher than the 1974 flood are likely to be over-predicted.

Wivenhoe Alliance Wivenhoe Dam Spillway Augmentation IPAA stage Design Discharges and Downstream Impacts of the Wivenhoe Dam Upgrade
ItemID: 003684262 Page 79 of 93
Date Printed: 27/09/2005 3:25:00 PM Last Saved: 27/09/2005 3:24:00 PM
3.3 CALIBRATION RESULTS
3.3.1 Recorded 1974 Water Level Comparison
Figure 3.1 and Figure 3.2 show a comparison of recorded and predicted maximum water levels along Brisbane River for the 1974 event. There is generally good agreement between predicted and recorded data with predicted data generally within +/- 0.2 m of recorded values. The predicted afflux at the bridges generally compare well with recorded data.
3.3.2 SKM Model Water Level Comparison
Figure 3.3 shows the difference between Brisbane River maximum water levels predicted in this study and by SKM for the 1974 event. Predicted level differences are generally within +/- 0.2 m. The discrepancy in predicted levels between Indooroopilly and Centenary Bridges is a result of differences in estimated afflux at these structures. The predicted affluxes at Indooroopilly bridge and Centenary bridge are under and over predicted respectively, relative to the SKM model results. This is probably due to the different algorithms used to estimate afflux between the 1999 and 2003 versions of the model. Overall, both models provide an acceptable calibration in this area.
Discrepancies in predicted levels upstream of the Bremer River confluence appear to be related to local variations in Manning’s roughness values. While smaller differences could be achieved by modifying local roughness values, this is unlikely to improve the estimation of maximum water levels for design events.
3.3.3 SKM Model Discharge Comparison
Figure 3.4 shows the difference in maximum flows predicted in this study and by SKM for the 1974 event. Predicted maximum flows in the Brisbane River upstream of the Bremer confluence are very similar. Downstream of the Bremer confluence, predicted maximum flows are generally 200 to 300 m3/s lower than those predicted using the SKM model for the 1974 event. This represents a difference of less than 4 % of the peak flow.

Wiv
enho
e A
llian
ce
Wiv
enho
e D
am S
pillw
ay A
ugm
enta
tion
D
esig
n D
isch
arge
s an
d D
owns
tream
Impa
cts
of th
e W
iven
hoe
Dam
Upg
rade
Ite
mID
: 003
6842
62
Pag
e 80
of 9
3
Dat
e P
rinte
d: 2
7/09
/200
5 3:
25:0
0 P
M
Last
Sav
ed: 2
7/09
/200
5 3:
24:0
0 P
M
Fi
gure
3.1
C
ompa
rison
of R
ecor
ded
and
Pred
icte
d M
axim
um F
lood
Lev
els,
197
4 Ev
ent (
Mor
eton
Bay
to S
andy
Cre
ek)
02468
10
12
14
16
18
20
22
05
10
15
20
25
30
35
40
45
50
55
60
Bri
sb
an
e R
ive
r C
ha
ina
ge
(k
m)
Maximum Water Level (m AHD)P
red
icte
d M
axi
mu
m W
ate
r L
eve
lP
red
icte
d M
axi
mu
m W
ate
r L
eve
l (S
KM
)R
eco
rde
d D
ata
- L
eft
Ba
nk
Re
cord
ed
Da
ta -
Rig
ht
Ba
nk
William Jolly Bridge
Indooroopilly Bridges
Centenary Bridge
Moreton Bay

Wiv
enho
e A
llian
ce
Wiv
enho
e D
am S
pillw
ay A
ugm
enta
tion
D
esig
n D
isch
arge
s an
d D
owns
tream
Impa
cts
of th
e W
iven
hoe
Dam
Upg
rade
Ite
mID
: 003
6842
62
Pag
e 81
of 9
3
Dat
e P
rinte
d: 2
7/09
/200
5 3:
25:0
0 P
M
Last
Sav
ed: 2
7/09
/200
5 3:
24:0
0 P
M
Fi
gure
3.2
C
ompa
rison
of R
ecor
ded
and
Pred
icte
d M
axim
um F
lood
Lev
els,
197
4 Ev
ent (
Sand
y C
reek
to Ip
swic
h-Es
k Sh
ire B
ound
ary)
16
18
20
22
24
26
28
30
32
34
36
38
60
65
70
75
80
85
90
95
10
01
05
11
01
15
12
0
Bri
sb
an
e R
iver
Ch
ain
ag
e (k
m)
Maximum Water Level (m AHD)
Pre
dic
ted
Ma
xim
um
Wa
ter
Le
vel
Pre
dic
ted
Ma
xim
um
Wa
ter
Le
vel (
SK
M)
Re
cord
ed
Da
ta -
Le
ft B
an
kR
eco
rde
d D
ata
- R
igh
t B
an
k
Bremer Confluence
Colleges Crossing
Mt Crosby Weir
Kholo Bridge

Wivenhoe Alliance Wivenhoe Dam Spillway Augmentation Design Discharges and Downstream Impacts of the Wivenhoe Dam Upgrade
ItemID: 003684262 Page 82 of 93
Date Printed: 27/09/2005 3:25:00 PM Last Saved: 27/09/2005 3:24:00 PM
Figure 3.3 Difference in Maximum Flood Levels predicted by the Current and SKM
Modelling, 1974 Event
Figure 3.4 Difference in Maximum Flood Discharges predicted by the Current and SKM
Modelling, 1974 Event
-1
-0.8
-0.6
-0.4
-0.2
0
0.2
0.4
0.6
0.8
1
0 10 20 30 40 50 60 70 80 90 100 110
Brisbane River Chainage (km)
Max
imum
Wat
er L
evel
Diff
eren
ce (m
)
Cen
tena
ry B
ridge
Indo
oroo
pilly
Brid
ges
Willi
am J
olly
Brid
ge
Mt C
rosb
y W
eir
Col
lege
s C
ross
ing
Brem
mer
Con
fluen
ce
Khol
o Br
idge
-400
-300
-200
-100
0
100
200
300
400
0 10 20 30 40 50 60 70 80 90 100 110
Brisbane River Chainage (km)
Max
imum
Flo
w D
iffer
ence
(m3 /s
)
Cen
tena
ry B
ridge
Indo
oroo
pilly
Brid
ges
Will
iam
Jol
ly B
ridge
Mt C
rosb
y W
eir
Col
lege
s C
ross
ing
Bre
mm
er C
onflu
ence
Kho
lo B
ridge

Wivenhoe Alliance Wivenhoe Dam Spillway Augmentation Design Discharges and Downstream Impacts of the Wivenhoe Dam Upgrade
ItemID: 003684262 Page 83 of 93
Date Printed: 27/09/2005 3:25:00 PM Last Saved: 27/09/2005 3:24:00 PM
4 . DESIGN FLOOD LEVEL AND FLOOD FLOW ESTIMATION
4.1 GENERAL
Design flood levels and flood flows along the Lower Brisbane River downstream of Wivenhoe Dam were determined using:
• The recalibrated MIKE 11 model network and cross section files;
• WT42D rainfall runoff routing model inflows at the Mike 11 model boundaries;
• Downstream water levels in Moreton Bay equivalent to the mean high water spring tide, and
• A range of concurrent downstream tributary inflows.
Descriptions of the various boundary conditions and downstream flows are described below.
4.2 BOUNDARY CONDITIONS
4.2.1 Inflow Hydrographs
Figure 2.1 shows the locations of the inflow hydrographs used to derive design flows along the Brisbane River. Descriptions of the inflow locations are given in Table 4.1. Inflow hydrographs were derived using the WT42D rainfall-runoff-routing model described in Appendix A.
The WT42D model is similar to the RAFTS-XP model used in model calibration but it has not been delineated into as many inflow locations. Minor differences in design flood levels are expected as a result of using the different models. Given that this study is interested in extreme floods where no calibration data exists, the different results produced between the two models is considered to be acceptable.
4.2.2 Downstream Tailwater Boundary
The mean high water spring tide level of 0.92 m AHD at the Western Inner Bar was used as the downstream boundary for all design runs. Brisbane City Council provided this value to SKM for use in their study of the Brisbane River.
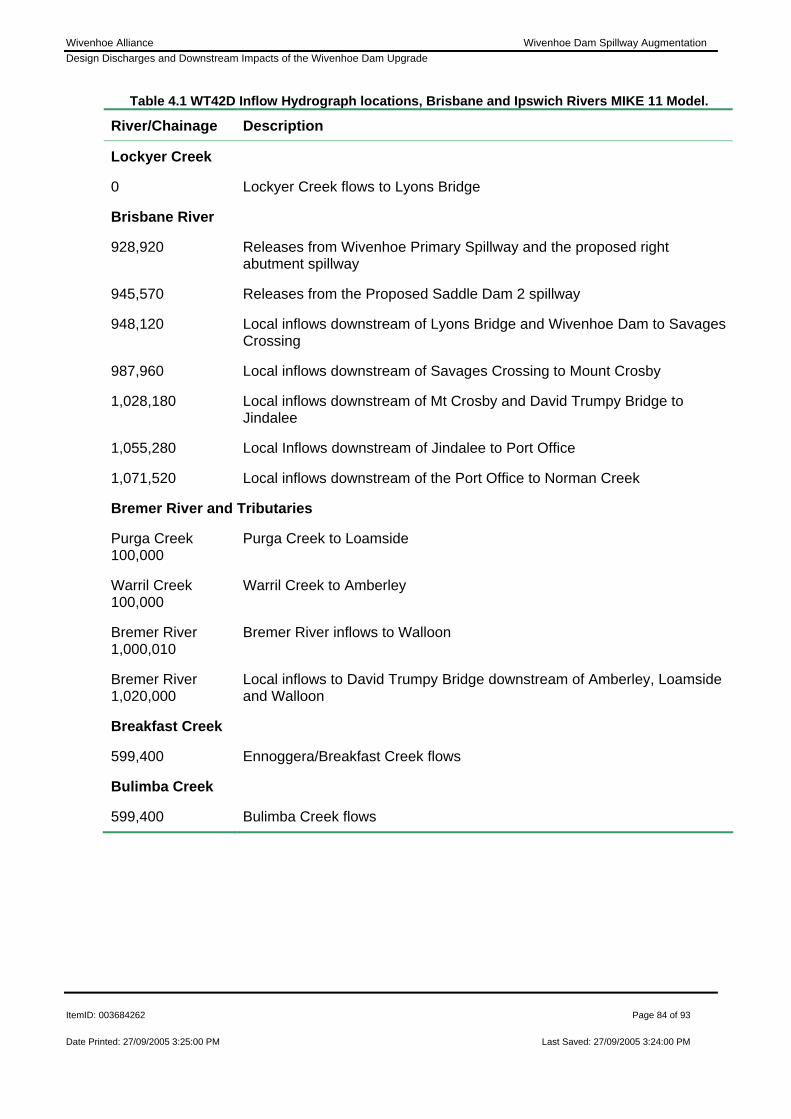
Wivenhoe Alliance Wivenhoe Dam Spillway Augmentation Design Discharges and Downstream Impacts of the Wivenhoe Dam Upgrade
ItemID: 003684262 Page 84 of 93
Date Printed: 27/09/2005 3:25:00 PM Last Saved: 27/09/2005 3:24:00 PM
Table 4.1 WT42D Inflow Hydrograph locations, Brisbane and Ipswich Rivers MIKE 11 Model.
River/Chainage Description
Lockyer Creek
0 Lockyer Creek flows to Lyons Bridge
Brisbane River
928,920 Releases from Wivenhoe Primary Spillway and the proposed right abutment spillway
945,570 Releases from the Proposed Saddle Dam 2 spillway
948,120 Local inflows downstream of Lyons Bridge and Wivenhoe Dam to Savages Crossing
987,960 Local inflows downstream of Savages Crossing to Mount Crosby
1,028,180 Local inflows downstream of Mt Crosby and David Trumpy Bridge to Jindalee
1,055,280 Local Inflows downstream of Jindalee to Port Office
1,071,520 Local inflows downstream of the Port Office to Norman Creek
Bremer River and Tributaries
Purga Creek 100,000
Purga Creek to Loamside
Warril Creek 100,000
Warril Creek to Amberley
Bremer River 1,000,010
Bremer River inflows to Walloon
Bremer River 1,020,000
Local inflows to David Trumpy Bridge downstream of Amberley, Loamside and Walloon
Breakfast Creek
599,400 Ennoggera/Breakfast Creek flows
Bulimba Creek
599,400 Bulimba Creek flows

Wivenhoe Alliance Wivenhoe Dam Spillway Augmentation Design Discharges and Downstream Impacts of the Wivenhoe Dam Upgrade
ItemID: 003684262 Page 85 of 93
Date Printed: 27/09/2005 3:25:00 PM Last Saved: 27/09/2005 3:24:00 PM
5 . SUMMARY AND RECOMMENDATIONS
The Brisbane River MIKE 11 hydraulic model (SKM, 2000a) was obtained to assess the downstream hydraulic impacts of the proposed augmentation of Wivenhoe Dam spillway. The model was modified and extended for use in this study.
The updated model was re-calibrated to recorded 1974 flood level data within Brisbane and Ipswich City Council river reaches using the available hydrological data from the SKM Study. Hydrological data for the 1974 event upstream of the Ipswich City Council boundary was not available for this study, and therefore calibration of the model for the Esk Shire Council river reach has not been undertaken. Re-calibration to the smaller historical events has also not been undertaken.
Although, it is acknowledged that no calibration of the model has been undertaken for the Esk Shire Council river reach, the updated and extended model is considered suitable for use in this study to assess the relative impacts of the proposed spillway augmentation works. It is recommended that the calibration of the model be re-visited should hydrologic and hydraulic data upstream of Ipswich City Council become available.

Wivenhoe Alliance Wivenhoe Dam Spillway Augmentation Design Discharges and Downstream Impacts of the Wivenhoe Dam Upgrade
ItemID: 003684262 Page 86 of 93
Date Printed: 27/09/2005 3:25:00 PM Last Saved: 27/09/2005 3:24:00 PM
Appendix C
Auxiliary Spillway Stage-Discharge
Rating Curve

Wivenhoe Alliance Wivenhoe Dam Spillway Augmentation Design Discharges and Downstream Impacts of the Wivenhoe Dam Upgrade
ItemID: 003684262 Page 87 of 93
Date Printed: 27/09/2005 3:25:00 PM Last Saved: 27/09/2005 3:24:00 PM
1 . INTRODUCTION
This appendix presents the stage discharge relationship, or the rating curve, for the proposed right abutment spillway on Wivenhoe Dam. The spillway consists of three unequal sized bays each containing a fuse plug embankment. When each fuse plug embankment becomes overtopped and erodes away, an ogee crest spillway at an elevation of 67 m AHD will control the discharges over the spillway. Outlined below are the methodology used and the results of the investigation to determine the rating curve of the ogee crest after the fuse plugs have eroded away.
Note that the rating curve presented in this appendix has not been used to estimate the design flows outlined in this report. The design flows in the report are based on a preliminary stage discharge relationship and a simplification of the flood operation rules. It is recommended that the new rating curve be used for future design flow estimates and for future flood emergency management for Wivenhoe Dam.

Wivenhoe Alliance Wivenhoe Dam Spillway Augmentation Design Discharges and Downstream Impacts of the Wivenhoe Dam Upgrade
ItemID: 003684262 Page 88 of 93
Date Printed: 27/09/2005 3:25:00 PM Last Saved: 27/09/2005 3:24:00 PM
2 . SPILLWAY COEFFICIENT OF DISCHARGE
2.1 METHOD OF ANALYSIS
The right abutment spillway rating curve has been determined using the weir equation shown below:
Q = CLHe1.5
Where:
Q = Discharge (m3/s) C = Coefficient of Discharge (Cd) L = Effective Length of the Spillway (m); and H = Total energy head on the crest (including the approach channel velocity head) (m).
The Cd was determined for the various operating heads using a number of methods, as follows:
• Computational Fluid Dynamics (CFD) modelling of the spillway (Worley, 2004).
• One Dimensional HEC-RAS hydraulic modelling of the spillway,
• US Bureau of Reclamation (USBR, 1987) published data.
• US Army Corp of Engineers (USACE) published data (Chow, 1959);
A description of the various methods used to estimate the Cd is given below.
2.1.1 CFD Modelling
Worley (2004) developed a computational fluid dynamics model of the spillway chute using the FLOW-3D model. The model incorporates the upstream and downstream training walls and embankments, the spillway chute, the road bridge piers, ogee crest spillway, divider walls and the three fuse plug embankments. The model was run for a range of storage levels and for scenarios with one, two and three fuse plugs operating to obtain a time averaged flow. The flow was then used to back calculate a Cd at the weir, using the weir equation, making adjustments for estimated chute losses and divider wall losses. Further details of the CFD modelling are provided in Worley (2004).
2.1.2 HEC-RAS
A HEC-RAS hydraulic model (USACE, 2005) was developed for the spillway chute. The model incorporates cross sections extending some 250 m upstream of the spillway and some 400 m downstream. The bridge piers were ignored. With respect to the spillway, the model uses the nomograph developed by USBR (1987) to estimate the Cd at water levels other than design head. It then uses the method determined by Bradley (1978) to estimate the variation in Cd with downstream submergence. The model does not incorporate variations in Cd with the downstream apron location.

Wivenhoe Alliance Wivenhoe Dam Spillway Augmentation Design Discharges and Downstream Impacts of the Wivenhoe Dam Upgrade
ItemID: 003684262 Page 89 of 93
Date Printed: 27/09/2005 3:25:00 PM Last Saved: 27/09/2005 3:24:00 PM
2.1.3 USBR
USBR (1987) provides a series of nomographs, based on physical model studies, to derive the relationship between flow and Cd varying with approach channel height, design head, upstream face slope, downstream submergence and the location of the downstream apron.
2.1.4 USACE
The USACE (1990) also developed a series of nomographs to derive spillway flows. They are slightly different to the USBR nomographs but they also use approach channel height, design head, upstream face slope, downstream submergence and the location of the downstream apron to determine the spillway flows. The USACE nomographs revised by Chow (1959) were used for this study.
2.2 COEFFICIENT OF DISCHARGE
Figure 2.1 shows the Coefficients of Discharge (Cd) estimated using each of the above methodologies and compares them against the adopted Cd. These Cd’s are for the weir only and do not incorporate the losses in the upstream spillway chute.
The following comments are of note:
• The adopted Cd’s are based on the USBR and the USACE methodologies with Cd’s varying between 1.66 and 1.98.
• At high heads, the adopted Cd’s are generally consistent with the Cd’s estimated using the CFD model.
• At lower heads, the CFD model produces higher Cd’s than the other methods. The reason for this is unknown. The published data suggests that the weir will behave more like a broad crested weir (Cd = 1.7) at low flows because of the positive crest pressures. Given that the CFD model was only run for two events below a water level of 75 m AHD, the adopted low flow Cd was based on the published data more consistent with the USBR and USACE methodologies.
• The HEC-RAS and USBR Cd’s are identical until the water level reaches about 72 m AHD as they both use the same nomograph. USBR suggests that the location of the downstream apron begins to impact on the Cd above this level, which is not modelled in HEC-RAS. The difference between the two curves represents the impact of the downstream apron location on Cd.

Wivenhoe Alliance Wivenhoe Dam Spillway Augmentation Design Discharges and Downstream Impacts of the Wivenhoe Dam Upgrade
ItemID: 003684262 Page 90 of 93
Date Printed: 27/09/2005 3:25:00 PM Last Saved: 27/09/2005 3:24:00 PM
1.0
1.2
1.4
1.6
1.8
2.0
2.2
67 69 71 73 75 77 79
Dam Water Level (m AHD)
Coe
ffic
ient
of D
isch
arge
CFD Hec Ras USBR USACE Adopted
Figure 2.1 Comparison of Cd values estimated using CFD modelling, HEC-RAS, USBR and USACE methodologies.

Wivenhoe Alliance Wivenhoe Dam Spillway Augmentation Design Discharges and Downstream Impacts of the Wivenhoe Dam Upgrade
ItemID: 003684262 Page 91 of 93
Date Printed: 27/09/2005 3:25:00 PM Last Saved: 27/09/2005 3:24:00 PM
3 . D ISCHARGE ESTIMATE COMPARISON
3.1 ADOPTED SPILLWAY RATING
Table 3.1 shows the adopted discharge rating curve for the right abutment spillway. Fuse Plug 1 is the centre bay (33m wide). Fuse Plug 2 is the eastern bay (64.5 m wide) and Fuse Plug 3 is the western bay (65.5 m wide). The maximum spillway capacity is estimated at 14,820 m3/s. The rating curve was determined using the weir equation using:
• The adopted Cd from the previous section;
• An adjusted spillway length to account for the losses associated with the divider walls; and
• An adjusted total energy head to account for upstream chute losses.
Table 3.1 Adopted Right Abutment Spillway Rating Curve
Spillway Discharge (m3/s) Dam Water Level (m
AHD) Fuse Plug 1 Fuse Plug 2 Fuse Plug 3 Combined
67 0 0 0 0
68 60 110 110 280
69 160 320 320 800
70 310 610 620 1,540
71 500 970 980 2,450
72 710 1,380 1,400 3,490
73 940 1,830 1,860 4,630
74 1,200 2,330 2,360 5,890
75 1,470 2,850 2,900 7,220
76 1,750 3,410 3,460 8,620
77 2,060 3,990 4,050 10,100
78 2,370 4,600 4,680 11,650
79 2,690 5,230 5,310 13,230
80 3,020 5,850 5,950 14,820
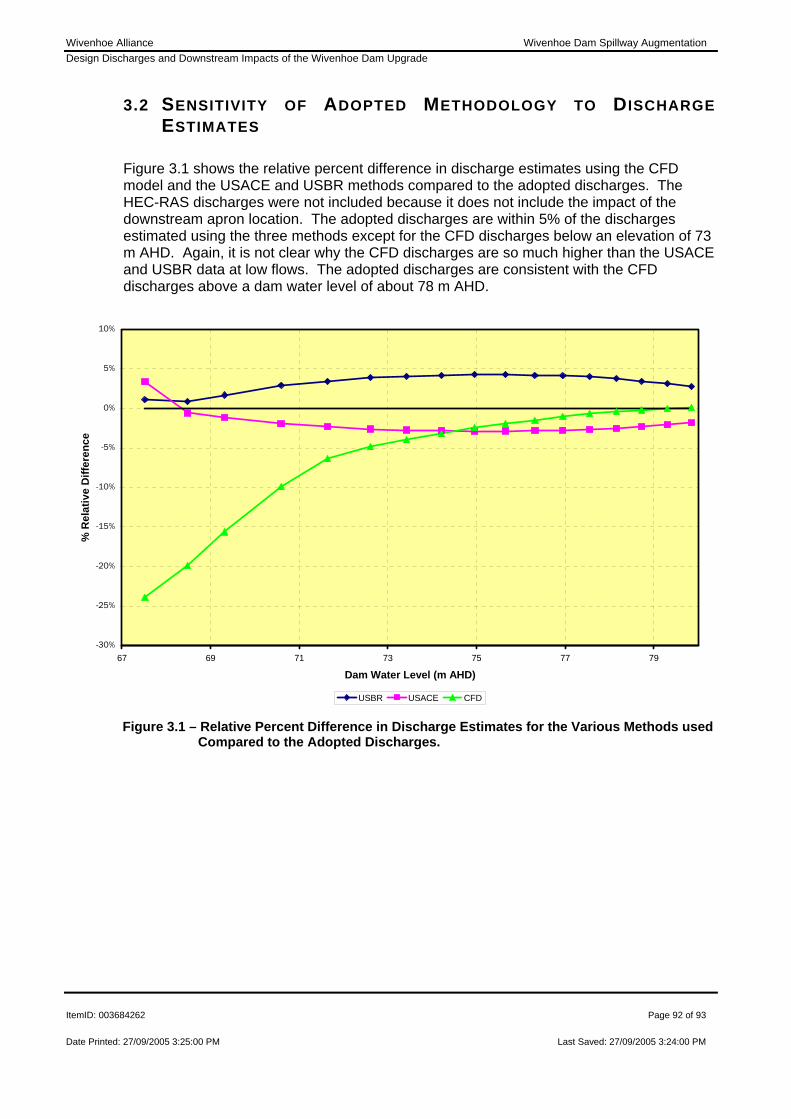
Wivenhoe Alliance Wivenhoe Dam Spillway Augmentation Design Discharges and Downstream Impacts of the Wivenhoe Dam Upgrade
ItemID: 003684262 Page 92 of 93
Date Printed: 27/09/2005 3:25:00 PM Last Saved: 27/09/2005 3:24:00 PM
3.2 SENSITIVITY OF ADOPTED METHODOLOGY TO DISCHARGE ESTIMATES
Figure 3.1 shows the relative percent difference in discharge estimates using the CFD model and the USACE and USBR methods compared to the adopted discharges. The HEC-RAS discharges were not included because it does not include the impact of the downstream apron location. The adopted discharges are within 5% of the discharges estimated using the three methods except for the CFD discharges below an elevation of 73 m AHD. Again, it is not clear why the CFD discharges are so much higher than the USACE and USBR data at low flows. The adopted discharges are consistent with the CFD discharges above a dam water level of about 78 m AHD.
-30%
-25%
-20%
-15%
-10%
-5%
0%
5%
10%
67 69 71 73 75 77 79
Dam Water Level (m AHD)
% R
elat
ive
Diff
eren
ce
USBR USACE CFD
Figure 3.1 – Relative Percent Difference in Discharge Estimates for the Various Methods used Compared to the Adopted Discharges.

Wivenhoe Alliance Wivenhoe Dam Spillway Augmentation Design Discharges and Downstream Impacts of the Wivenhoe Dam Upgrade
ItemID: 003684262 Page 93 of 93
Date Printed: 27/09/2005 3:25:00 PM Last Saved: 27/09/2005 3:24:00 PM
4 . SUMMARY
A stage discharge rating curve has been developed for the right abutment spillway of Wivenhoe Dam. The curve was based on computational fluid dynamics modelling of the spillway (Worley, 2004) and published data USACE (1990) and USBR (1987). A HEC –RAS one dimensional hydraulic model of the spillway was also developed.
• The adopted rating curve has Cd’s varying between 1.66 at low flows and 1.97 at high flows.
• The spillway has a capacity of about 14,820 m3/s at a dam water level of 80 m AHD.
• The CFD model produced Cd’s at low flows that are moderately higher than the published data. The reason for the inconsistency is not clear. The Cds consistent with the published data were adopted for the low flows.