naches/cowiche diversion dam spillway modification project ... · pdf filer-93-6...
TRANSCRIPT

R-93-6
NACHES/COWICHE DIVERSION DAM SPILLWAY MODIFICATION
PROJECT-FISH BARRIER STUDY
SUMMARY OF INVESTIGATIONS
April 1993
U.S. DEPARTMENT OF THE INTERIOR Bureau of Reclamation
Denver Office Research and Laboratory Services Division
Hydraulics Branch

7-2090 (4-81) Bureau of Reclamation
1. REPORT NO.
R-93-6 4. TITLE AND SUBTITLE
TECHNICAL REPORT STANDARD TITLE PAGE ~'i¢,?::~~,~.~i'::/?,':?~i'-'- .... ~ , - . . . .
NACHES/COWICHE DIVERSION DAM SPILLWAY MODIFICATION PROJECT - FISH BARRIER STUDY SUMMARY OF INVESTIGATIONS
7. AUTHOR(S)
Roxanne George and Manuel (Manolo) Menendez Prieto
3. RECIPIENT'S CATALOG NO.
5. REPORT DATE
April 1993 6. PERFORMING ORGANIZATION CODE
D-3751
S. PERFORMING ORGANIZATION REPORT NO.
]],-93-6
9. PERFORMING ORGANIZATION NAME AND ADDRESS
Bureau of Reclamation Denver Office Denver CO 80225
12. SPONSORING AGENCY NAME AND ADDRESS
Same
10. WORK UNIT NO.
11. CONTRACT OR GRANT NO.
13. TYPE OF REPORT AND PERIOD COVERED
DIBR
14. SPONSORING AGENCY CODE
15. SUPPLEMENTARY NOTES
Microfiche and hard copy available at the Denver Office, Denver, Colorado. Ed: TH
16. ABSTRACT
A physical model having a scale of 2.5:1, Denver Office Hydraulic Laboratory, Bureau of Reclamation, was used to analyze the use of rubber dams and pneumatic crest gates as possible methods for preventing fish passage over the spillway at Naches/Cowiche Diversion Dam, Washington. Velocity and depth of flow data were collected and analyzed for several placements and orientations of both types of designs for a range of discharges and tailwater elevations. These data were then compared to available biological data for the fish species present at the site to determine the effectiveness of these types of designs as fish barriers. Analyses found that the Naches/Cowiche site does not allow development of sufficient head to achieve velocities in excess of the maximum fish darting velocities for steelhead; therefore, a 100-percent effective barrier cannot be ensured. Fish barrier efficiency cannot be closely estimated based on the laboratory model tests. However, the best overshot gate option for increasing barrier effectiveness is clearly the addition of a properly located crest gate. This conclusion was based on an evaluation of the combined effects of increased velocity and resulting work required to swim upstream, reduced flow depths, and abrupt changes in flow direction.
17. KEY WORDS AND DOCUMENT ANALYSIS a. DESCRIPTORS- hydraulic engineering/hydraulic laboratories/hydraulic models/concrete structures/diversion dams/fish barriers/stilling basins/
b. IDENTIFIERS- Naches/Cowiche] National Marine Fisheries Service/Washington Department of Fisheries/Bridgestone/CEDEX/ c. COSATI Field~Group 13B COWRR: 1302 18. DISTRIBUTION STATEMENT
SRIM: 19. SECURITY CLASS 21. NO. OF PAGES
crH,s ~Po~ 21 UNCLASSIFIED
20. SECURITY CLASS 22. PRICE (THIS PAGE') ~J~;~M,Fst~t~o
R-93-6
NACHES/COWICHE DIVERSION DAM SPILLWAY MODIFICATION PROJECT- FISH BARRIER STUDY
SUMMARY OF INVESTIGATIONS
by
Roxanne George Manuel Menendez Prieto
Hydraulics Branch Research and Laboratory Services Division
Denver Office Denver, Colorado
April 1993
UNITED STATES DEPARTMENT OF THE INTERIOR -k BUREAU OF RECLAMATION
ACKNOWLEDGMENTS
The studies were conducted under the direct supervision of Brent Mefford, Head, Hydraulic Structures Section, with general supervision and review from Philip Burgi, Chief, Hydraulics Branch. The following people greatly aided in the completion of this study: Steve Rainey, National Marine Fisheries Service; Ken Bates, Washington Department of Fisheries; Dennis Hudson and Gary Steinbach, Reclamation, Boise Regional Office; and Perry Johnson and Tracy Vermeyen, Reclamation, Hydraulics.. Special recognition is given to Manuel (Manolo) Menendez Prieto, a visiting hydraulic engineer from CEDEX (The Center for Studies and Experimentation of Public Works), Madrid, Spain, for his work and contributions.
Mission: As the Nation's principal conservation agency, the Department of the Interior has responsibility for most of our nationally owned public lands and natural and cultural resources. This includes fostering wise use of our land and water resources, protecting our fish and wildlife, preserving the environmental and cultural values of our national parks and historical places, and providing for the enjoyment of life through outdoor recreation. The Department assesses our energy and mineral resources and works to assure that their development is in the best interests of all our people. The Department also promotes the goals of the Take Pride in America campaign by encouraging stewardship and citizen responsibility for the public lands and promoting citizen participation in their care. The Department also has a major responsibility for American Indian reservation communities and for people who live in Island Territories under U.S. AdministratiorL
DISCLAIMER
Special t hanks a re given to Bridgestone, Inc., for the i r in format ion per ta in ing to rubbe r dams , a n d to 0 b e r m e y e r Hydro Accessories, Inc., for in format ion on pneumat i c cres t gates. However, Reclamat ion is not responsible for the validity of the da ta provided. The informat ion c o n t a i n e d in this r epor t r ega rd ing commerc ia l p roduc ts or f i rms may n o t be used for adver t i s ing or ~ promot ional purposes and is not to be cons t rued as an e n d o r s e m e n t of any product or f i rm by the Bureau of Reclamation.
ii

CONTENTS
In t roduc t ion ............................................
Conclus ions ............................................
B a c k g r o u n d in fo rma t ion ...................................... F i sh b a r r i e r cr i te r ia . . . . . . . . . . . . . . . . . . . . . . . . . . . . . . . . . . . . . . R u b b e r d a m s tudies ...................................... P n e u m a t i c c res t ga te s tudies .................................
Model t e s t s ............................................. As-bui l t s t ruc tu re t e s t r e su l t s ................................. R u b b e r d a m t e s t s ........................................ R u b b e r d a m tes t r e su l t s ................................... . P n e u m a t i c c res t ga te model t e s t s . . . . . . . . . . . . . . . . . . . . . . . . . . . . . . . P n e u m a t i c c res t ga te t e s t r e su l t s . . . . . . . . . . . . . . . . . . . . . . . . . . . . . . .
Discuss ion ............................................. B a r r i e r ef fec t iveness of flow dep th ............................... B a r r i e r ef fec t iveness of velocity and ene rgy r e q u i r e m e n t s . . . . . . . . . . . . . . . . . . B a r r i e r e f fec t iveness of the flow over the ga tes . . . . . . . . . . . . . . . . . . . . . . . .
Table
TABLES
1 Discha rges and cor respond ing t a i l w a t e r e leva t ions for Naches /Cowiche d ivers ion d a m .....................................
2 M e a s u r e d flow velocit ies and dep th s wi th in the f i r s t 4 i~ (horizontal) downs t r ean i f rom the c r e s t P C ...................................
3 F low velocit ies and dep t h s b e t w e e n 6 and 12 f t (horizontal) d o w n s t r e a m f rom the c res t PC .......................................
4 Hydrau l i c d a t a wi th the cres t ga te located 1.25 f t u p s t r e a m f rom the cres t PC and a t a 60 ° angle ...................................
5 H y d r a u l i c d a t a wi th the cres t ga te located 1.25 i~ u p s t r e a m f rom the cres t PC and lowered to a 45 ° angle . . . . . . . . . . . . . . . . . . . . . . . . . . . . . .
6 Hydrau l i c d a t a wi th the c res t ga te located 1.25 f t u p s t r e a m f rom the cres t PC and lowered to a 15 ° angle . . . . . . . . . . . . . . . . . . . . . . . . . . . . . .
Figure FIGURES
1 Locat ion m a p - Naches /Cowiche Cana l . . . . . . . . . . . . . . . . . . . . . . . . . 2 Views of sect ional model ................................. 3 E leva t ion v iew of sect ion t h r o u g h cen te r of Naches /Cowiche divers ion d a m . . . . . 4 W a t e r sur face profi les for as -bui l t condit ions . . . . . . . . . . . . . . . . . . . . . . 5 E leva t ion view of water- f i l led r u b b e r d a m m o u n t e d on the sp i l lway cres t . . . . . . 6 W a t e r sur face profi les for r u b b e r d a m . . . . . . . . . . . . . . . . . . . . . . . . . . 7 E leva t ion v iew of c res t ga te t e s t locat ions . . . . . . . . . . . . . . . . . . . . . . . . 8 W a t e r surface profi les for cres t ga te a t 60 °, located 1.25 i~ u p s t r e a m f rom PC . . . . 9 W a t e r surface profi les for c res t ga te a t 45 °, located 1.25 t~ u p s t r e a m f rom PC . . . .
10 W a t e r sur face profi les for c res t ga te a t 15 °, located 1.25 t~ u p s t r e a m f rom PC . . . . 11 A compar i son of the addi t iona l work ~equired for f ish to negot ia te the f ish
b a r r i e r ga te s t r u c t u r e s a t 2,000-i~°/s d i scharge . . . . . . . . . . . . . . . . . . . 12 A compar i son of the addi t iona l work ~equired for f ish to negot ia te the f ish
b a r r i e r ga te s t r u c t u r e s a t 3,000-i~°/s d ischarge . . . . . . . . . . . . . . . . . . . 13 A compar i son of the addi t iona l work ~equired for f i sh to nego t ia te the f ish
b a r r i e r ga te s t r u c t u r e s a t 4 ,500- i~/s d ischarge . . . . . . . . . . . . . . . . . . .
Page 1
1 1 4 5
5 7
10 11 11 13
17 17 18 20
3
8
9
15
16
17
2 6 7
10 12 12 13 14 14 14
19
19
20
° ° °

INTRODUCTION
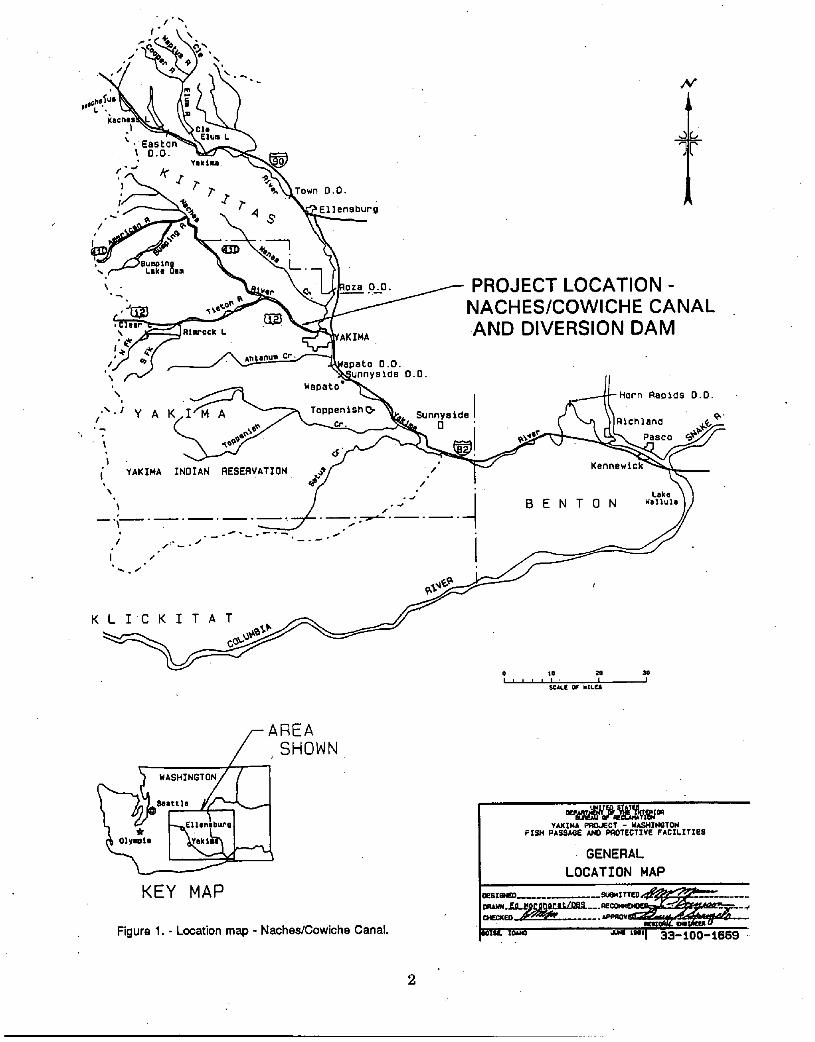
The PN (Pacific Northwest) Region requested the Denver Office Hydraulics Branch to conduct a study for spillway modification to the Naches/Cowiche diversion dam, located near Yakima, Washington (fig. 1). The purpose of the spillway modification is to prevent anadromous fish from bypassing an existing fish ladder and catchment facility. Currently, migrating fish are able to pass up and over the ogee crest spillway.
The two options for fish barriers studied, using a sectional model of the dam, were a water-filled rubber dam and a pneumatic crest gate, each attached to the top of the existing spillway crest.
CONCLUSIONS
• The Naches/Cowiche site does not allow the development of sufficient head to achieve velocities in excess of the maximum fish darting velocities for steelhead; therefore, a 100-percent effective barrier cannot be ensured.
• Fish barrier efficiency cannot be closely estimated based on the laboratory model tests. However, the best overshot gate option for increasing barrier effectiveness is clearly the addition of a properly located crest gate. This conclusion was based on an evaluation of the combined affects of increased velocity and the resulting work required to swim upstream, reduced flow depths, and abrupt changes in flow direction.
BACKGROUND INFORMATION 6
Naches/Cowiche diversion dam is located on the Naches River, about 2 mi west of Yakima, Washington. The diversion dam is a concrete ogee spillway structure, about 212.5 it wide by 15 It high, consisting of a 5-R-long crest, a 21-ft-long ogee spillway, and a 21-ft-long apron.
Radio tagging of spring chinook salmon and steelhead trout at the site confirmed the need to create a stronger barrier to adult fish passage. The project requires a more positive fish barrier during key periods of the year while retaining the ability to pass flood flows under conditions similar to the existing conditions. An evaluation of the operations and fish barrier needs indicated that an overshot-type structure that could be raised and lowered would best meet the requirements.
Fish Barrier Criteria
Two basic designs for fish barrier dams have been developed:
• One design is based on creating a barrier by maintaining, at all streamflows, a drop of sufficient height to prevent fish migration upstream. To be effective for salmon and trout species, this type of barrier requires at least 10 it of free overfaU. This design was not feasible for Naches/Cowiche diversion dam.
1
#
J
C,, t
/
D.D. Y l k t m a
x'~,,_ Z T " 4 3
Town O.O.
~ E l l e n s b u r ' g . "
N
',, r . J - - -C;~;"~. %
~ Ri~OCk L
,
• , . , _ ~
' " - J Y A K I~M~A
l
I \
YAKIMA INDIAN RESERVATION
~ K I M A
O.D. . ~
Papato O.O. L~unnyside O.O.
ToppenishQ,,
o.#
/
' . _ , " . - - - ~ o . . . I / P _ . J
I' .,' ,~, ° ,,s
s u n n y s i d e J n ,
/
P R O J E C T L O C A T I O N - N A C H E S / C O W l C H E C A N A L • A N D D I V E R S I O N D A M
• Horn Rapids O.O.
Rtch land ~ '
,'~ Pasco G ~
BENTON Lske
Wallula
KL I C K I T A T
0 |0 20 I I I I I I ' I I
¢~P~E OF WXLfJI
I| WASHINGTON/
h '; L.,.°.°,,,
KEY MAP
.•AREA SHOWN.
Figure 1. - Loca t ion m a p - N a c h e s / C o w i c h e Canal .
YAKZMA PROJECT - WASHINGTON F ISH PASSABE ~ PROTECTIVE F A C I L I T I E S
GENERAL
L O C A T I O N MAP
.u , . xo,.o " ~ '" ' I 3 3 - I 0 0 - i 6 6 9 "
9.
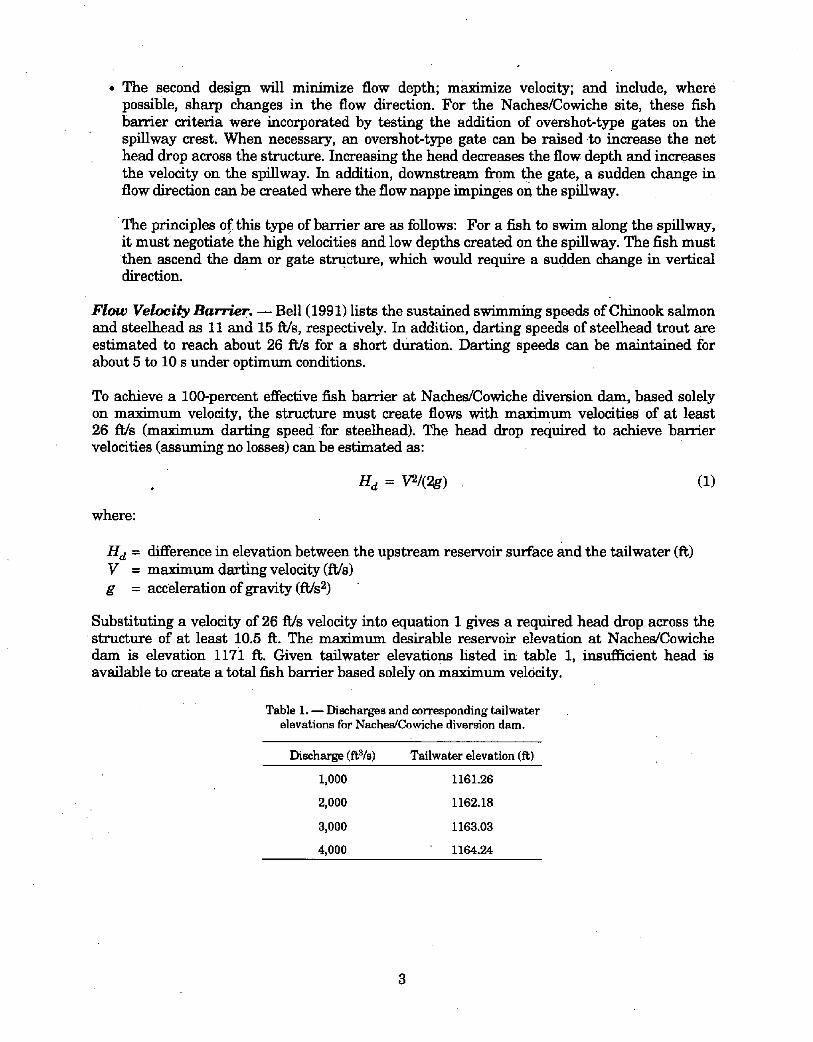
The second design will minimize flow depth; maximize velocity; and include, where possible, sharp changes in the flow direction. For the Naches/Cowiche site, these fish barrier criteria were incorporated by testing the addition of overshot-type gates on the spillway crest. When necessary, an overshot-type gate can be raised to increase the net head drop across the structure. Increasing the head decreases the flow depth and increases the velocity on the spillway. In addition, downstream from the gate, a sudden change in flow direction can be created where the flow nappe impinges on the spillway.
The principles ofthis type of barrier are as follows: For a fish to swim along the spillway, it must negotiate the high velocities and low depths created on the spillway. The fish must • then ascend the dam or gate structure, which would require a sudden change in vertical direction.
F l o w V e l o c i t y B a r r i e r . m Bell (1991) fists the sustained swimming speeds of Chinook salmon and steelhead as 11 and 15 R/s, respectively. In addition, darting speeds of steelhead trout are estimated to reach about 26 ft/s for a short duration. Darting speeds can be maintained for about 5 to 10 s under optimum conditions.
To achieve a 100-percent effective fish barrier at Naches/Cowiche diversion dam, based solely on maximum velocity, the structure must create flows with maximum velocities of at least 26 f~ls (maximum darting speed for steelhead). The head drop required to achieve barrier velocities (assuming no losses) can be estimated as:
H d = V2/(2g) (1)
where:
H d = difference in elevation between the upstream reservoir surface ~md the tailwater (ft) V = maximum darting velocity (ft/s) g = acceleration of gravity (R/s 2)
Substituting a velocity of 26 R/s velocity into equation 1 gives a required head drop across the structure of at least 10.5 ft. The maximum desirable reservoir elevation at Naches/Cowiche dam is elevation 117i ft. Given tailwater elevations listed in table 1, ins~t~cient head is available to create a total fish barrier based solely on maximum velocity.
Table I. -- Discharges and corresponding tailwater elevations for Naches/Cowiche diversion dam.
Discharge (f~S/s) Tailwater elevation (ft)
1,000 1161.26
2,000 1162.18
3,000 1163.03
4,000 1164.24
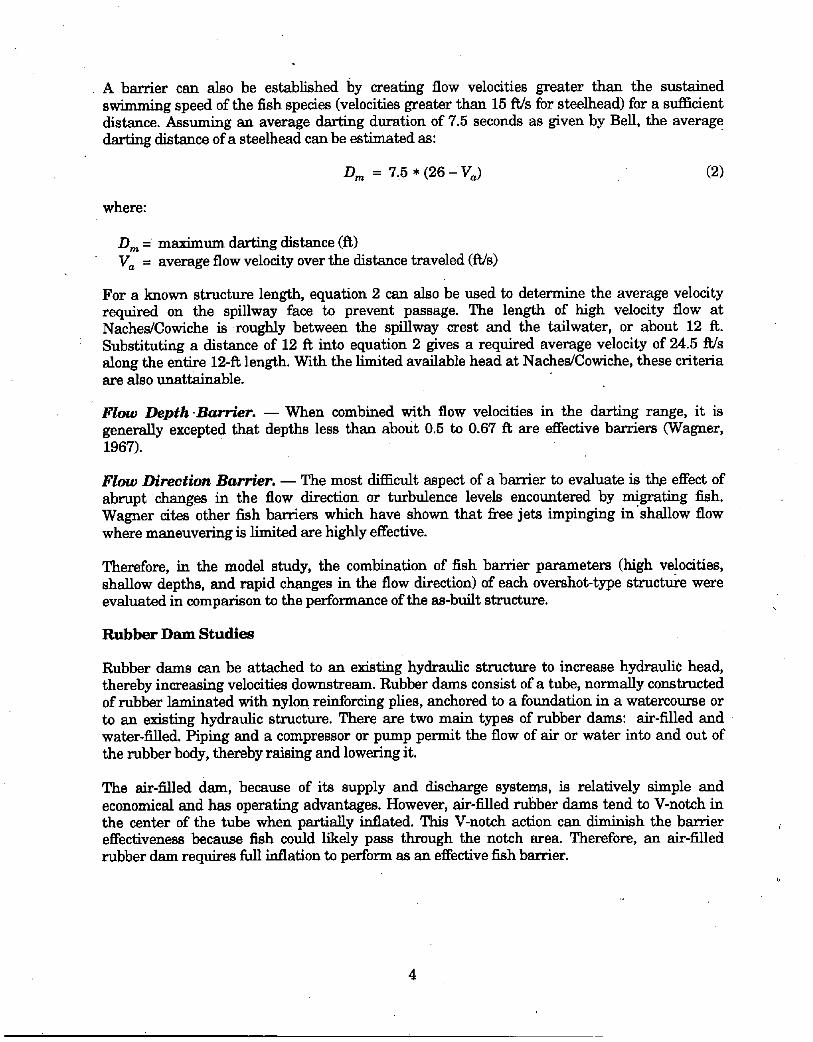
A barr ier can also be established by creating flow velocities greater than the sustained swimming speed of the fish species (velocities greater than 15 R/s for steelhead) for a sufficient distance. Assuming an average darting duration of 7.5 seconds as given by Bell, the average darting distance ofa steelhead can be estimated as:
Dm = 7 . 5 . ( 2 6 - V a) (2)
where:
D m = maximum darting distance (i~) V a = average flow velocity over the distance traveled (R/s)
For a known structure length, equation 2 can also be used to determine the average velocity required on the spillway face to prevent passage. The length of high velocity flow at Naches/Cowiche is roughly between the spillway crest and the tailwater, or about 12 i~. Substituting a distance of 12 ft into equation 2 gives a required average velocity of 24.5 fds along the entire 12-ft length. With the limited available head at Naches/Cowiche, these criteria are also unattainable.
F l o w D e p t h B a r r i e r . - - When combined with flow velocities in the darting range, it is generally excepted that depths less than about 0.5 to 0.67 i~ are effective barriers (Wagner, 1967).
F l o w D i r e c t i o n B a r r i e r . - - The most difficult aspect of a barrier to evaluate is the effect of abrupt changes in the flow direction or turbulence levels encountered by mi.grating fish. Wagner cites other fish barriers which have shown that free jets impinging in shallow flow where maneuvering is limited are highly effective.
Therefore, in the model study, the combination of fish barrier parameters (high velocities, shallow depths, and rapid changes in the flow direction) of each overshot-type structure were evaluated in comparison to the performance of the as-built structure.
Rubber D a m Studies
Rubber dams can be attached to an existing hydraulic structure to increase hydraulic head, thereby increasing velocities downstream. Rubber dams consist of a tube, normally constructed of rubber laminated with nylon reinforcing plies, anchored to a foundation in a watercourse or to an existing hydraulic structure. There are two main types of rubber dams: air-filled and water-filled. Piping and a compressor or pump permit the flow of air or water into and out of the rubber body, thereby raising and lowering it.
The air-filled dam, because of its supply and discharge systems, is relatively simple and economical and has operating advantages. However, air-filled rubber dams tend to V-notch in the center of the tube when partially inflated. This V-notch action can diminish the barrier effectiveness because fish could likely pass through the notch area. Therefore, an air-filled rubber dam requires full inflation to perform as an effective fish barrier.
4

Manufacturers claim water-filled rubber dams are less subject to V-notching than the air-filled, although no manufactures were able to provide test data on V-notching of water-filled dams. The placement of water-filled dams is restricted, because they must be mounted on a horizontal surface large enough to support the deflated size of the dam. A horizontal surface is necessary to ensure the dam deflates completely.
Pneumatic Crest Gate Studies
The second type of overshot gate tested was a pneumatic activated crest gate. The crest gate system consists of a row of steel panels hinged and anchored to the spillway along the gate's upstream edge. The steel panels are raised by an inflatable air bladder located downstream from the gate hinge point. The gates can be operated between 0 ° and about 60 ° referenced to the plane of the hinge point. Thus, the upstream pool elevation is controlled by the angle at which the steel panels are inclined in the direction of flow.
Some of the advantages of pneumatic crest gates as given by the manufacturers are:
(1) They provide accurate automatic pool elevation control even under power failure conditions;
(2) Unlike steel crest gates, pneumatic crest gate panels are supported for their entire width by an inflatable bladder, resulting in simple foundation requirements and a cost-effective and efficient structure;
(3) The thin profile of the gate efficiently passes flood flows, ice, and debris;
(4) Unlike rubber dams, the steel panels overhang the rubber bladder in all positions, thereby protecting the bladder from floating logs, debris, ice, etc.; and
(5) The gates have low maintenance and installation costs.
MODEL TESTS
A 4-ft-wide by 8-R-high by 90-It-long glass-walled laboratory flume was used for the study. The flume was modified to a 2-It width for the Naches/Cowiche model. A 2.5:1 FroUde scale sectional model including the dam crest, ogee spillway, and stilling basin were constructed in the flume (fig. 2). The model scale was chosen based on modeling a maximum prototype unit discharge of 23.9 It3/s/It.
Dimensions of the spillway and stilling basin were taken from drawings provided by the PN Region. Tests were conducted at discharges and tailwater conditions as given in table 1. The maximum permissible upstream pool elevation was given as 1171 It.
Depth measurements along the spillway were taken at stations every 0.8 R in the model (2.0 It prototype), beginning at the crest PC (point of crest curvature). These points are referred to in the data as X - 0 It, X = 2.0 It, etc. Six points along the spillway were evaluated. Where possible, depths were measured vertically and then converted to normal depths perpendicular
5
t
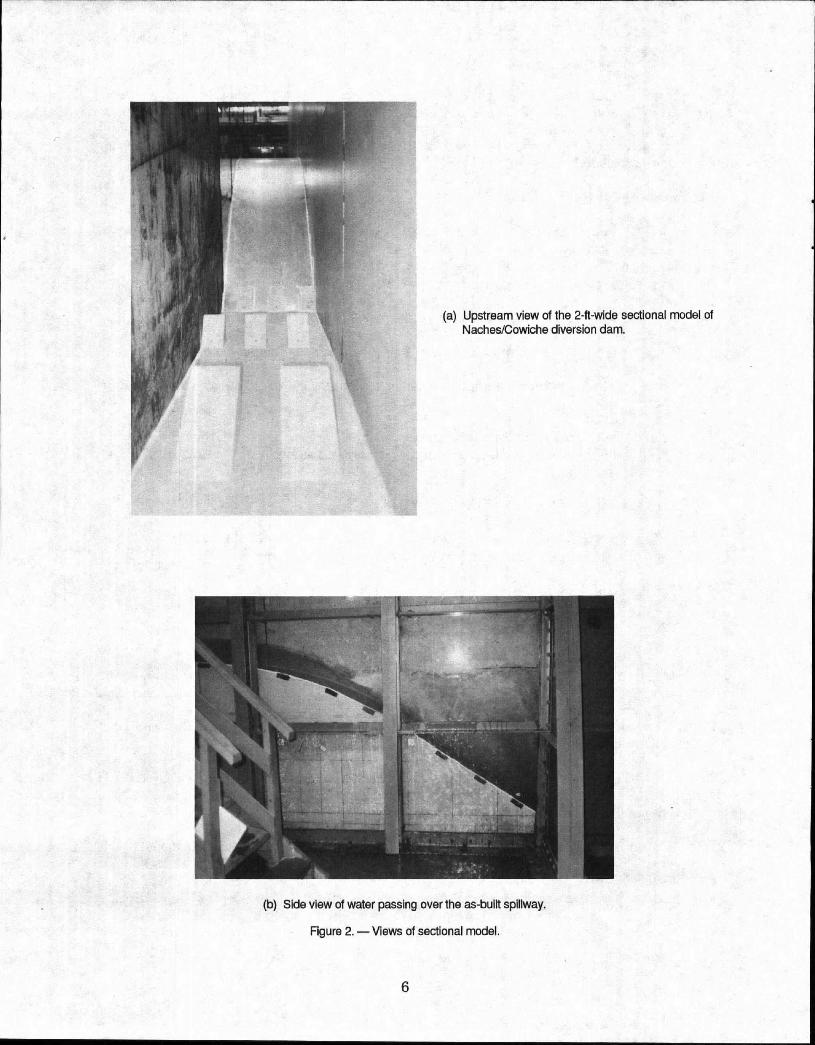
(a) Upstream view of the 2-f~-wide sectional model of Naches/Cowiche diversion dam.
(b) Side view of water passing over the as-built spillway.
Figure 2. - - Views of sectional model.

to the spillway surface. Table 2 Summarizes these values for several tests performed. The flow downstream from the ogee crest was typically fast-shallow-aerated flow in the model. In many instances, the combination of small depths, large velocities, and air entrainment prevented measuring the depth or velocity. Therefore, depth and velocity estimates were calculated using the upstream total head measured in the model for locations downstream from X = 6 i~. Table 3 summarizes these calculated values. Velocities were calculated from total head assuming no losses. Depths were then calculated based on flow continuity: This procedure results in maximum possible velocities and minimum possible depths at each station. For the •flow conditions witnessed in the model, this procedure of calculating spillway chute flow data should closely model prototype conditions.
Discharge coefficients for all structures were calculated using the general equation for a sharp-crested weir under free flow conditions:
C - Q (3) L • H 1.6
where:
C = coefficient of discharge Q = discharge (i~3/s) L = length (i~) H = total head above weir (i~)
As-built Structure Test Results
Initially, flow depths and average velocities over the as-built structure (fig. 3) were measured for flows up to 4,500 f~S/s. These data were used as a basis for evaluating flow changes achieved by installing each fish barrier option.
1170
~'--~1165
"~1160
1155
1150
26.0' ~* .
10 20 30 40 50
Distance (ft)
1170
1165
1160
1155
1150
Figure 3. - - Elevation view of section through center of Naches/Cowiche diversion dam.
I
7

Table 2. - - Measu red flow velocities and depths within t he first 4 ft (horizontal) downst ream from the crest PC.
Discharge (ft3/s)
Struc ture type
r L o c a t i o n d o w n s ~ e a m f f o m o g e e c r e s t
X = 0 R X = 2 R X = 4 ~
Vm Depth Vm Depth Vm Depth
Reservoir elevat ion
fit)
00
2,000
3,000
4,500
As-bui l t 11.2 0.94
Rubber dam 9.1 1.16
Cres t gate, Pp = 4.17 ft No da ta
Cres t gate, Pp = 1.67 ft No da ta
Cres t gate, Pp = 1.25 ft 6.8 1.61
As-bui l t 12.1 1.31
Rubber dam 10.7 1.48
Cres t gate, Pp = 4.17 ft 5.9 2.71
Cres t gate, Pp = 1.67 ft No da ta
Cres t gate, Pp = 19.5 ft 7.62 2.10
As-bui l t 13.6 1.75
Rubber dam 10.6 2.25
Cres t gate, Pp = 4.17 i~ 5.9 4.06
Cres t gate, Pp = 1.67 ft No da ta
Cres t gate, Pp = 1.25 ft 8.8 2.70
11.6 0.91 13.3 0.79
14.1 0.75 17.4 0.61
No da ta No da ta
No da ta No da t a
No da ta 18.7 0.57
13.0 1"22 14.8 1.07
15.7 1.01 19.1 0.83
14.1 1.13 19.5 0.82
No da ta No da t a
No da ta 19.8 0.80
14.8 1.61 15.7 1.52
16.0 1.49 18.7 1.28
11.0 2.17 18.9 1.26
No da ta No data
No data 20.9 1.14
1167.00
1170.32
1170.00
1167.85
1170.37
'11709.0
1170.65~
1170.65
1168.92
1171.20
1171.05
1171.47
1171.45
1 pp = crest gate pivot point.
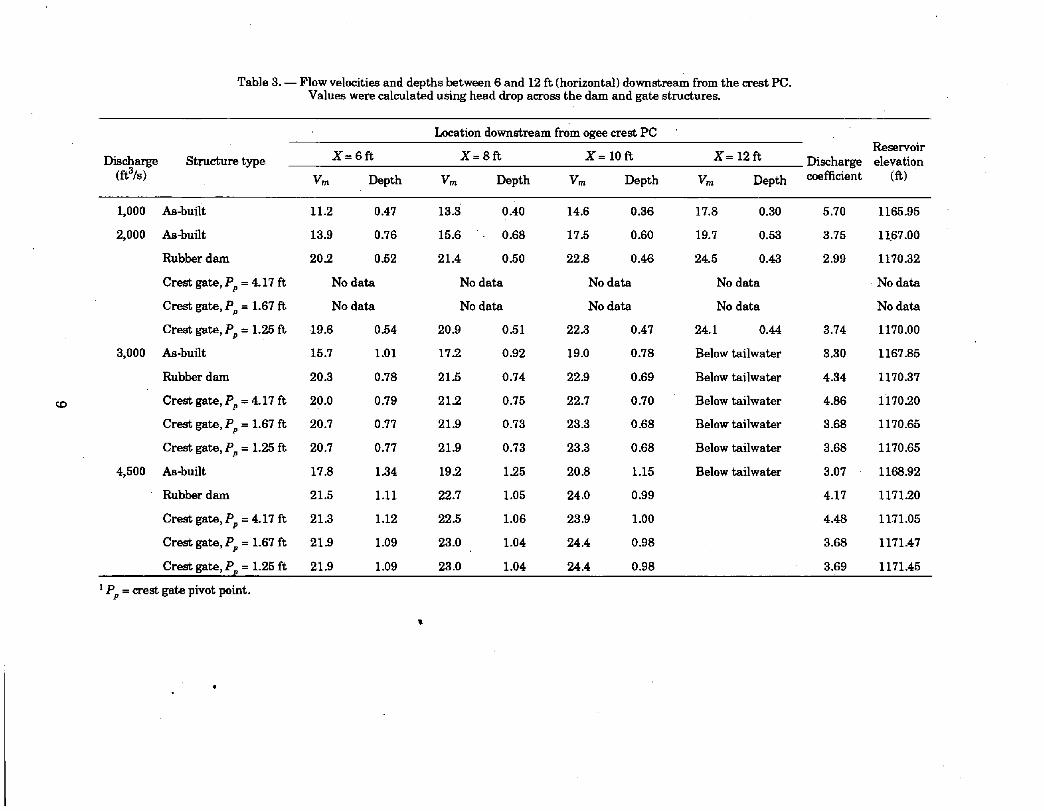
Table 3. - - Flow velocities and depths between 6 and 12 ft (horizontal) downstream from the crest PC. Values were calculated using head drop across the dam and gate structure~
Discharge Structure type (ft3/s)
Ixx~tion downstream from ogee crest PC
X = 6 ~ X = 8 ~ X = 1 0 ~ X = 1 2 R
Vm Depth Vm Depth Vm Depth Vm Depth
Discharge coefficient
Reservoir elevation
(~)
1,000 As-built 11.2 0.47
2,000 As-built 13.9 0.76
Rubber dam 20.2 0.52
Crest gate, Pp = 4.17 ft No data
Crest gate, Pp = 1.67 ft No data
Crest gate, Pp = 1.25 ft 19.6 0.54
3,000 As-built 15.7 1.01
Rubber dam 20.3 0.78
Crest gate, Pp = 4.17 ft 20.0 0.79
Crest gate, Pp = 1.67 ft 20.7 0.77
Crest gate, Pp = 1.25 ft 20.7 0.77
4,500 As-built 17.8 1.34
Rubber dam 21.5 1.11
Crest gate, Pp = 4.17 ft 21.3 1.12
Crest gate, Pp = 1.67 ft 21.9 1.09
Crest gate, Pp = 1.25 ft 21.9 1.09
13.3 0.40 14.6 0.36 17.8 0.30
15.6 0.68 17.5 0.60 19.7 0.53
21.4 0.50 22.8 0.46 24.5 0.43
No data No data No data
No data No data No data
20.9 0.51 22.3 0.47 24.1 0.44
17.2 0.92 19.0 0.78 Below tailwater
21.5 0.74 22.9 0.69 Below tailwater
21"2 0.75 22.7 0.70 Below tailwater
21.9 0.73 23.3 0.68 Below tailwater
21.9 0.73 23.3 0.68 Below tailwater
19.2 1.25 20.8 1.15 Below tailwater
22.7 1.05 24.0 0.99
22.5 1.06 23.9 1.00
23.0 1.04 24.4 0.98
23.0 1.04 24.4 0.98
5.70
3.75
2.99
3.74
3.30
4.34
4.86
3.68
3.68
3.07
4.17
4.48
3.68
3.69
1165.95
1167.00
1170.32
No data
No data
1170.00
1167.85
1170.37
1i70.20
1170.65
1170.65
1168.92
1171.20
1171.05
1171.47
1171.45
1 pp = crest gate pivot point.

The following stmunarizes data for the as-built structure, The complete data are given in tables 2 and 3. Water surface profiles are plotted on figure 4.
Discharge at 1,000 flSls. - - The maximum velocity a t ta ined was about 18 flJs nea r the ta i lwater contact. Depths less than 0.5 it were a t ta ined near X = 6 it and beyond. The upst ream pool elevation was 1166.0 it.
Discharge at 2,000 flSls. - - The maximum velocity a t ta ined was about 20 fl/s near the ta i lwater contact. A depth of 0.5 it was a t ta ined at the tailwater, contact. The ups t ream pool elevation was 1167.0 it. The discharge coefficient was 3.8.
Discharge at 3,000 flS/s. - - The maximum velocity at ta ined was about 19.0 flJs near the ta i lwater contact. Depths less than 0.5 it were not attained. The min imum depth a t ta ined was 0.8 it a t X = 10 it. The ups t ream pool elevation was i167.8 it. The discharge coefficient was 3.3.
Discharge at 4,500 ftSls. - - The maximum velocity a t ta ined was about 21 flJs near the ta i lwater contact. Depths less than 0.5 it were not attained. The min imum depth a t ta ined was 1.1 it at the ta t lwater contact. The upst ream pool elevation was 1168.9 it. The discharge coefficient was 3.1.
1175 - 1175
.o
:>
1 1 7 0
1165
1 1 6 0
1155
1150
Q=4500 fts/s
i . 0 = 3 0 0 0 f t 3 / s
Q = 2 0 0 0 ft3/s
0 5- 10 15 20 i . . . .
25 3O
Distance (ft) Note: Zero = P C . "
1170
1165
1160
1155
1150
v
o ¢1
Figure 4. -- Water surface profiles for as-built conditions.
R u b b e r D a m Tes t s
The test section geometry and discharge characteristics of the water-filled rubber dam were based on information provided by Bridgestone Engineered Products Company. The rubber dam section was constructed of plywood ribs and a sheet metal skin. The implications of modeling a water-filled dam with a rigid model were discussed with the Bridgestone engineers. I t was concluded tha t a water-filled rubber dam is essentially incompressible, and therefore, a rigid model would be satisfactory. A 2-in-diameter model air vent was placed on the side wall jus t downstream from and below the nappe breaker to provide aeration to the lower flow nappe. The rubber dam was no t tested for partially inflated conditions, because no information could be obtained on the rubber dam shape.
10
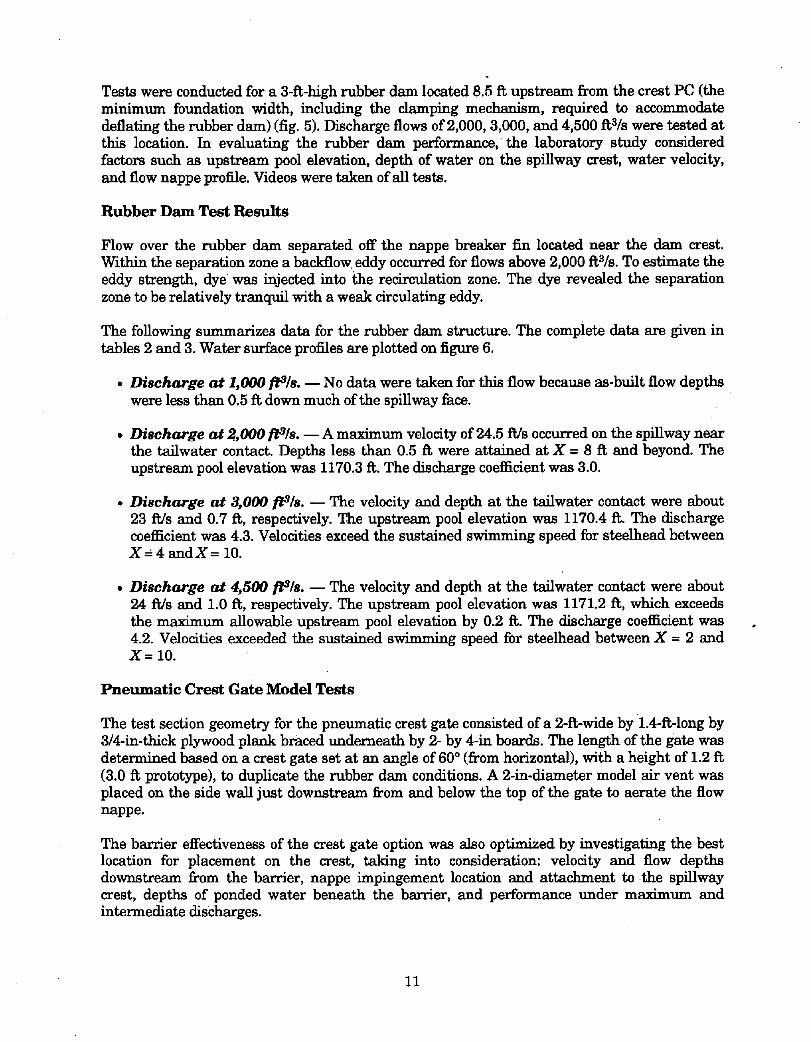
Tests were conducted for a 3-It-high rubber dam located 8.5 It upstream from the crest PC (the minimum foundation width, including the damping mechanism, required to accommodate deflating the rubber dam) (fig. 5). Discharge flows of 2,000, 3,000, and 4,500 It3/s were tested at this location. In evaluating the rubber dam performance, the laboratory study considered factors such as upstream pool elevation, depth of water on the spillway crest, water velocity, and flow nappe profile. Videos were taken of all tests.
R u b b e r D a m Test R e s u l t s
Flow over the rubber dam separated off the nappe breaker fin located near the dam crest. Within the separation zone a backflow eddy occurred for flows above 2,000 ItS/s. To estimate the eddy strength, dye was injected into h~e recirculation zone. The dye revealed the separation zone to be relatively tranquil with a weak circulating eddy.
The following summarizes data for the rubber dam structure. The complete data are given in tables 2 and 3. Water surface profiles are plotted on figure 6.
• D i s c h a r g e a t 1 ,000 ftS/s. - - No data were taken for this flow because as-built flow depths were less than 0.5 It down much of the spillway face.
D i s c h a r g e a t 2 , 000 ftS/s, m A maximum velocity Of 24.5 It/s occurred on the spillway near the tailwater contact. Depths less than 0.5 It were attained at X = 8 It and beyond: The upstream pool elevation was 1170.3 It. The discharge coefficient was 3.0.
D i s c h a r g e a t 3 ,000 ftS/s, m The velocity and depth at the tailwater contact were about 23 fl/s and 0.7 It, respectively. The upstream pool elevation was 1170.4 It. The discharge coefficient was 4.3. Velocities exceed the sustained swimming speed for stee]head between X = 4 a n d X = 10.
D i s c h a r g e a t 4 ,500 flS/s, m The velocity and depth at the tailwater contact were about 24 flYs and 1.0 It, respectively. The upstream pool elevation was 1171.2 It, which exceeds the maximum allowable upstream pool elevation by 0.2 It. The discharge coefficient was 4.2. Velocities exceeded the sustained swimming speed for steel_head between X = 2 and X = 10.
P n e u m a t i c Crest Gate M o d e l Tes t s
The test section geometry for the pneumatic crest gate consisted of a 2-it-wide by i.4-it-long by 3/4-in-thick plywood plank braced underneath by 2- by 4-in boards. The length of the gate was determined based on a crest gate set at an angle of 60 ° (from horizontal), with a height of 1.2 It (3.0 It prototype), to duplicate the rubber dam conditions. A 2-in-diameter model air vent was placed on the side wall just downstream from and below the top of the gate to aerate the flow nappe.
The barrier effectiveness of the crest gate option was also optimized by investigating the best location for placement on the crest, taking into consideration: velocity and flow depths downstream from the barrier, nappe impingement location and attachment to the spillway crest, depths of ponded water beneath the barrier, and performance under maximum and intermediate discharges.
11

1170
2 1165
~ 1160
1155
1150
0 10 20 30 ~ 50
1170
1165
1160
1155
1150
Rgure 5. - - Elevation view of water-filled rubber dam mounted on the spillway crest.
v
.o
1175 1
1170
1165'
1160
1155
1150 -5
W , o:4soo o=3ooo ,t:/s Q=2000 ~ - / s
0 5 10 15 20
Distance ( f t )
1175
1170
1165
1160 ~
1155
, . . . . 115o 25 30
N o t e : Z e r o - P C .
Rgure 6. - -Water surface profiles for rubber darn.
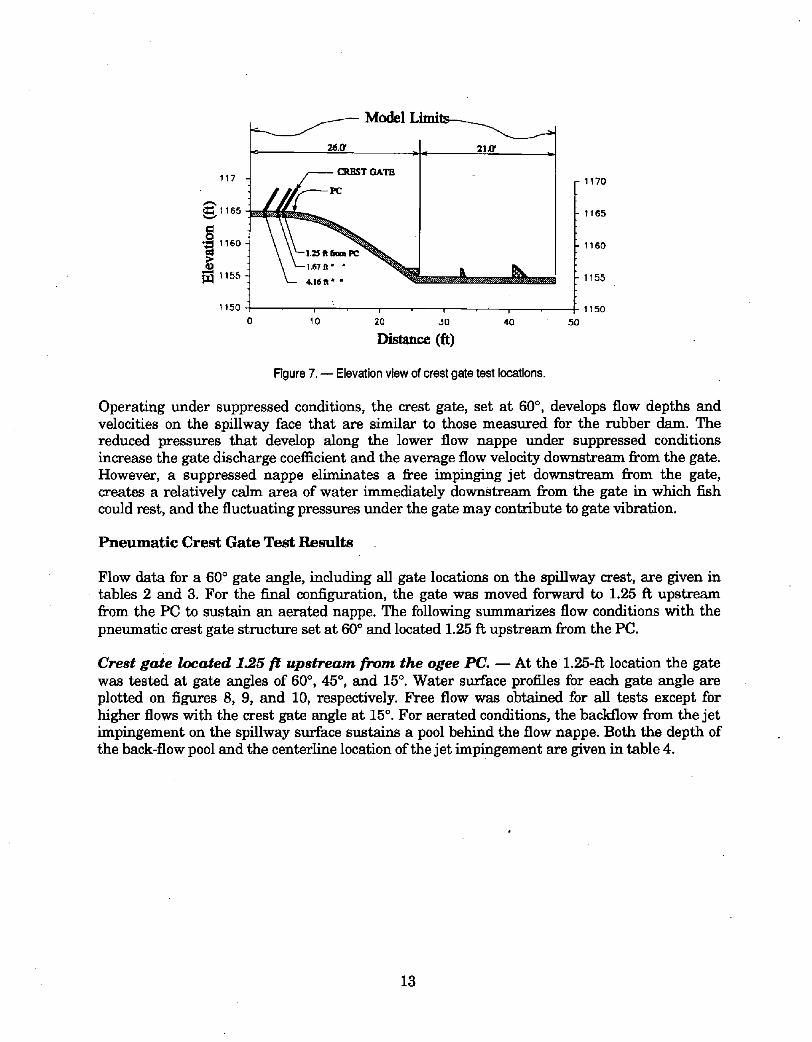
Initially, the crest gate was set at a 60 ° angle and tested at three different pivot point positions on the spillway crest--4.17, 1.67, and 1.25 It upstream from the crest PC (fig. 7). At the 4.17-it location the nappe was suppressed for all fl0w conditions tested. To obtain an aerated condition in the separation zone, the gate was moved downstream until the flow passing over the gate impinged downstream from the crest PC. By impinging the flow on the downward sloping surface of the spillway face, the strength of the backflow component was reduced. Mounting the gate 1.67 It upstream from the crest PC created an aerated condition for flows up to about 3,000-itS/s. To maintain an aerated nappe at 4,500-itS/s required the gate be moved to 1.25 i t upstream from the crest PC. Although aerated, the impinging jet forces a backflow pool between the gate and the jet impingement point. Small depths of pooling were felt to be desirable should fish reach the gate and attempt to jump the structure. Obviously, large pool depths behind the gate are not desirable if they provide a resting zone for fish and adequate room for the fish to negotiate jumping over the crest gate.
12
117
~,1165
*~1160
~1155
1150
Model Limi 2 ~ . ~ ~
CRK~T OATB
0 10 20 r
30 40
(ft)
1170
1165
1160
1155
1150 50
Rgure 7. - - Elevation view of crest gate test locations.
Operating under suppressed conditions, the crest gate, set at 60 °, develops flow depths and velocities on the spillway face that are similar to those measured for the rubber dam. The reduced pressures that develop along the lower flow nappe under suppressed conditions increase the gate discharge coefficient and the average flow velocity downstream from the gate. However, a suppressed nappe eliminates a free impinging jet downstream from the gate, creates a relatively calm area of water immediately downstream from the gate in which fish could rest, and the fluctuating pressures under the gate may contribute to gate vibration.
P n e u m a t i c Crest Gate Test R e s u l t s
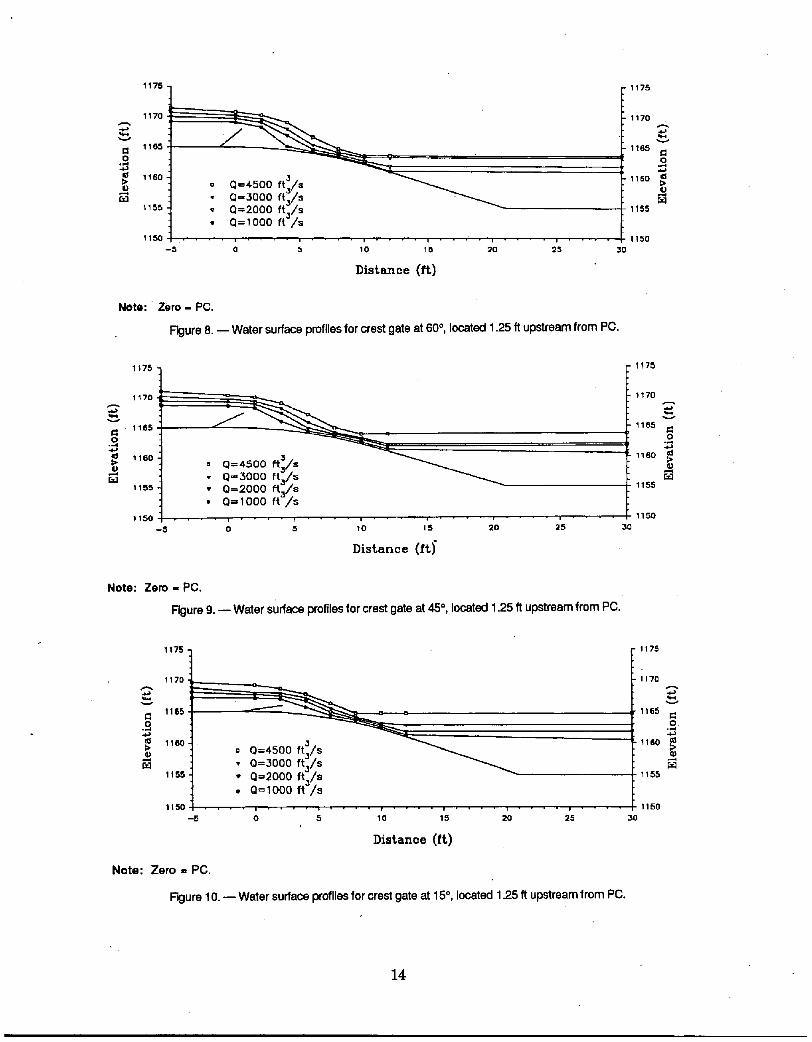
Flow data for a 60 ° gate angle, including all gate locations on the spillway crest, are given in tables 2 and 3. For the final configuration, the gate was moved forward to 1.25 i~ upstream from the PC to sustain an aerated nappe. The following summarizes flow conditions with the pneumatic crest gate structure set at 60 ° and located 1.25 i~ upstream from the PC.
Crest g a t e loca ted 1.25 f i u p s t r e a m f r o m the ogee PC. ~ At the 1.25-ft location the gate was tested at gate angles of 60 ° , 45 ° , and 15% Water surface profiles for each gate angle are plotted on figures 8, 9, and 10, respectively. Free flow was obtained for all tests except for higher flows with the crest gate angle at 15 °. For aerated conditions, the backflow from the jet impingement on the spillway surface sustains a pool behind the flow nappe. Both the depth of the back-flow pool and the centerline location of the jet impingement are given in table 4.
13
1 1 7 5
1 1 7 0
~ 1160
1 1 5 5
1 1 5 0
= Q=4500 ft3/s • Q=3000 ft3/s • Q=2000 ft:/s • Q= 1000 f t ' / s
." " • • i . . . . i . . . . i . . . . i • - , - i
- 5 0 5 1 0 1 5 2 0
D i s t a n c e ( f t )
i . . . .
2 5
Note: Z e r o - PC.
Figure 6. - - Water surface profiles for crest gate at 60 °, located 1.25 ft upstream from PC.
1 1 7 5
1 1 7 0
. 1 1 6 5
~ 1 1 6 0
1155
- Q=4500 f t : / s • Q=3000 ft / s • Q=2000 f t : / s • Q= IO00 f t - / s
1 1 5 0 | . . . . , . . . . ~ . . . . , . . . . , - - , . . . . ,
-5 o 5 ,o 15 20 =s
Distance (ft)
1 1 7 5
1 1 7 0
! 1 6 5
o
1 1 5 0
1 1 5 5
1 1 5 0
3 0
3 0
1 1 7 5
1 1 7 0
1 1 6 5
0
1 1 6 0
1155
1 1 5 0
Note: Zero - PC.
Figure g. - - Water surface profiles for crest gate at 45 °, located 1.25 ft upstream from PC.
1 1 7 5
1 1 7 0 ,
1 1 6 5
1 1 8 0 >
r .~ 1 t 5 5
1 1 5 0 . . . . ,
• Q=2000 ft~/s ~" • Q=IO00 ft'~/s
. . . . ~ . . . . ! . . . . w . . . . i . . . . ! . . . .
0 5 1 0 1 5 2 0 2 5
Distance (ft)
Note: Zero = PC.
Figure 10. - - Water surface profiles for crest gate at 15 °, located 1.25 ft upstream from PC.
1175
1 1 7 0
1165
1160
1 1 5 5
1 1 5 0
3 0
1 4

Table 4. - - Hydraulic data with the crest gate located 1.25 t~ upstream from the crest PC and at a 60°angle. The 60 ° angle corresponds to a vertical gate height of 3.00 i~.
Summary of results
Discharge (f0/s) 1,000 2,000 3,000 4,500
Reservoir elevation (i~) 1169.20 1 1 6 9 . 9 8 1170.65 1171.45
Pool depth behind gate (ft) 0.95 1.25 1.40 1.48
Nappe impingement point (fi) 3.90 4.95 5.60 5.95 (horizontal from crest PC)
Total head on gate (ft) +---H t 15.08 15.65 16.52 17.32
Discharge head (i~) ~--H c 1.20 1.98 2.65 3.45
Discharge coefficient (---C 4.03 3.82 3.68 3.73
D e p t h a n d v e l o c i t y data along spillway
Discharge 1,000 2,000 3,000 4,500
- - Depth Velocity Depth Velocity Depth Velocity Depth Velocity PC dist (ft) (ft/s) (f0 . (ft/s) (l~) (fl/s) (ft) (fl/s)
~7= 0.0 ft
~7= 2.0 t~
X:= 4.0 i~
~= 6.0 ft
~(= 8.0 ft
= 10.0 i~
= 12.0 i~
4.06 1.30
3.36 1.58
0.56 9.48
0,20 26.93
0.19 27.95
0:18 29.19
TW I NA 2
4.69 2~26
4.10 2.59
2.34 4.54
0.59 17.90
0.48 22.32
0.45 23.32 TW 1 NA 2
5.18 3.07
4.63 3.43
3.34 4.76
1.31 12.16
0.83 19.13
TW 1 NA ~
TW I NA 2
5.77 4.14
5.31 4.50
4.35 5.49
2.53 9.43
1.38 17.31
1.20 19.95
TW 1 NA ~
1 = tailwater. 2 = not applicable.
C r e s t G a t e a t 60 °. - -
. D i s c h a r g e a t 2 , 0 0 0 ftS/s. B A m a x i m u m velocity of 24.1 fl/s occurred on the spi l lway n e a r the t a i lwa te r contact. Depths less t h a n 0.5 It were a t t a i n e d a t X = 8 i t and beyond. The u p s t r e a m pool elevat ion was 1170.0 ft. The discharge coefficient was 3.8.
° D i s c h a r g e a t 3 ,000 ftS/s. - - T h e velocity a n d dep th a t the t a i lwa te r contact were about 23.3 fl/s a n d 0.7 It, respectively. The u p s t r e a m pool elevat ion was 1170.6 ft. The d i scharge coefficient was 3.7. Velocities exceeded the sus t a ined sw imming speed for s tee lhead b e t w e e n X = 6 a n d X = 10.
• D i s c h a r g e a t 4 ,500 fiSls. - - T h e velocity a n d dep th a t the t a i lwa te r contact were about 24.4 ft/s a n d 1.0 It, respectively. The u p s t r e a m pool elevat ion was 1171.45 It, which exceeds the m a x i m u m pool elevation by 0.45 It. The discharge coefficient was 3.7. Velocities exceeded the sus t a ined sw imming speed for s tee lhead be tween X = 6 a n d X = 10.
Addi t ional tes ts of the crest ga te were m a d e wi th the gate angle set a t 45 ° a n d 15 ° above horizontal . These tes ts were conducted to eva lua te flow character is t ics over the s t ruc tu re a t par t ia l openings. The hydrau l ic d a t a from these par t ia l gate opening tes ts are given in tables 5 a n d 6.
15

The gate must be lowered to an angle of about 45 ° (height of 2.45 It) to pass 4,500 It3/s at the maximum reservoir elevation, 1171.0 It. At this gate position, the velocity and depth at the tailwater contact were about 22.4 R/s and 0.94 It, respectively. The discharge coefficient was 3.5.
Table 5. -- Hydraulic data with the crest gate located 1.25 It upstream from the crest PC and lowered to a 45 ° angle. The 45 ° angle corresponds to a vertical gate height of 2.45 ft.
S u m m a r y of r esu l t s
Discharge (itS/s) 1,000 2,000 3,000 4,500
Reservoir elevation (it) 1168.75 1169.50 1170.20 1171.02
Pool depth behind gate (ft) 0.78 1.05 1.20 1.30
Nappe impingement point (it) 4.18 5.18 5.90 6.42 (horizontal from crest PC)
Total head on gate (it) ( - -H t 14.62 15.38 16.08 16.90
Discharge head (it) ~ - H c 1.30 2.05 2.75 3.58
Discharge coefficient ¢--C 3.57 3.61 3.48 3.53
Depth and velocity d a t a a long spi l lway
Discharge 1,000 2,000 3,000 4,500
- - Depth Velocity Depth Velocity Depth Velocity Depth Velocity PC dist (it) (R/s) (It) (R/s) (it) (R/s) (it) (R/s)
X f 0 . 0 i t
~=2 .0 i t
X = 4 . 0 i t
~ = 6 . 0 i t
~ = 8 . 0 i t
~ = 1 0 . 0 i t
X=12 .0 i t
3.63 L 4 6
3.32 1.60
1.35 3.93
0.29 18.32
0.32 16.45
0.23 23.30
0.23 23.49
4.25 2.50
3.97 2.68
2.72 3.90
0.79 13.36
0.53 19.84
0.63 16.96
0.67 15.82
4.71 3.38
4.43 3.59
3.49 4.56
1.67 9.50
0.80 20.01
0.83 19.14
TW I NA 2
5.36 4.46
5.06 4.72
4.33 5.52
2.94 8.12
1.52 15.71
TW 1 NA 2
TW I NA 2
1 = tailwater. -~ = not applicable.
4 -
16

Table 6. -- Hydraul ic da ta with the crest gate located 1.25 It ups t ream from the crest PC and lowered to a 15 ° angle. The 15 ° angle corresponds to a vertical ga te height of 0.92 It.
S u m m a r ~ o f r e s u l t s
Discharge (itS/s) 1,000 2,000 3,000 4,500
Reservoir elevation (it) 1167.27 1168.10 1168.75 1169.65
Pool depth behind gate (it) 0.52 Ful l Full Full
Nappe impingement point (it) 4.48 None None None (horizontal from crest PC)
Total head on gate (it) ~--H t 13.15 13.98 14.62 15.52
Discharge head (it) ~--H c 1.35 2.18 2.83 3.73
Discharge coefficient ~ - C 3.38 3.30 i 3.35 3.32
Depth and v e l o c i t y d a t a a l o n g s p i l l w a y
Discharge 1,000 2,000 3,000 4,500
- - Depth Velocity Depth Velocity Depth Velocity Depth Velocity PC dist (it) (R/s) (it) (R/s) (it) (R/s) (it) (R/s)
~ = 0 .0 i t
~ = 2.0 It
~ = 4.0 t t
~ = 6 .0 i t
~(= 8.0 It
= 10.0 It
k '= 12.0 It
2.14 2.48
2.08 2.54
1.05 5.03
0.39 13.71
0.35 14.96
0.24 22.44
0.24 21.67
2.68 3.96
2.55 4.17
2.02 5.26
0.84 12.64
0.58 18.14
0:51 20.73
TW 1 NA 2
3.01 5.28
3.02 5.26
2.53 6.29
1.37 11.59
0.85 18.67
0.77 20.67
TW 1 NA 2
4.14 5.77
3.68 6.49
3.07 7.77
2.12 11.24
1.36 17.59
TW 1 NA 2
TW 1 NA 2
1 = tai lwater . 2 = not applicable.
DISCUSSION
• The Naches/Cowiche site does not allow the development of sufficient head to achieve velocities i n excess of the maximum fish darting velocities for steelhead; therefore, a 100-percent effective barrier cannot be ensured.
• Fish barrier efficiency cannot be closely estimated based on the laboratory model tests. However, the best overshot gate option for increasing barrier effectiveness is clearly the addition of a properly located crest gate. This conclusion was based on an evaluation of the combined effects of increased velocity and the resulting work required to swim upstream, reduced flow depths, and abrupt changes in flow direction~ A discussion of each of these effects follows.
Barrier Effectiveness of Flow Depth
The flow depth on the as-built spillway exceeds the 0.5-R maximum desired depth criterion at about 2,000 itS/s. The addition of a 3-ft-high overshot gate structure extends the discharge range for which depth is less than the 0.5-R criterion, but only by a few hundred ftS/s. Therefore, the decreased spillway depths achieved by adding a 3-ft-high overshot gate provide only marginal improvement to the fish barrier effectiveness.
17
Barrier Effectiveness of Velocity and Energy Requirements
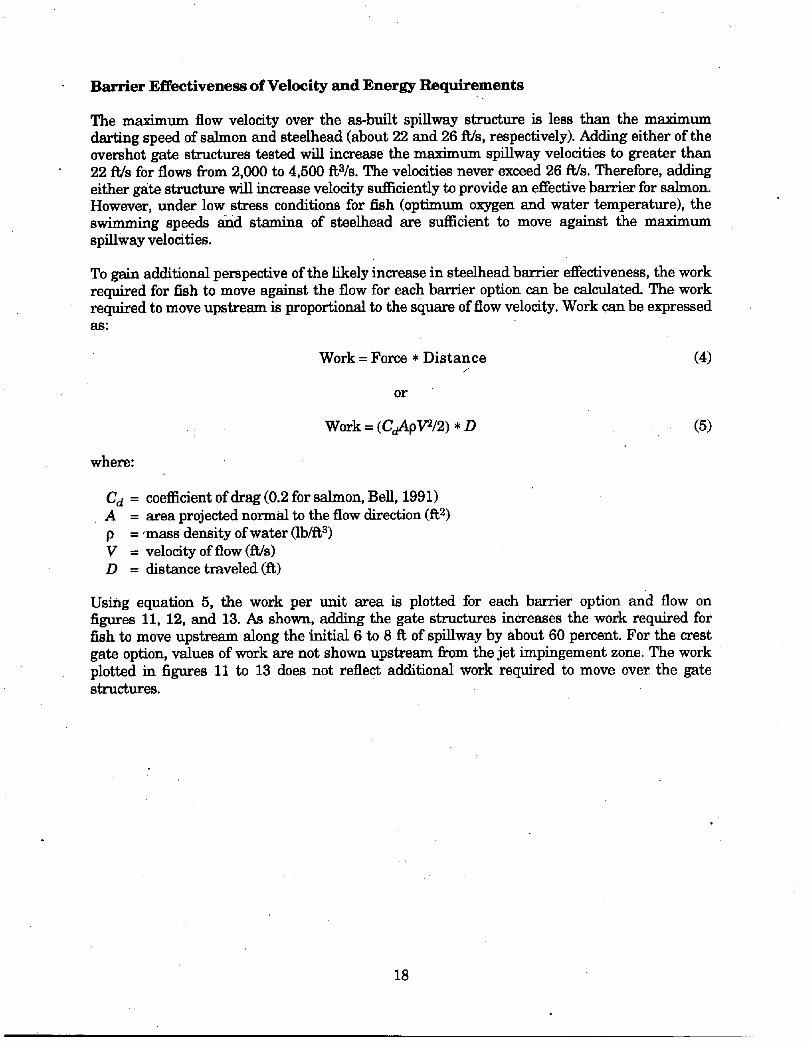
The maximum flow velocity over the as-built spillway structure is less than the maximum darting speed of salmon and steelhead (about 22 and 26 ft/s, respectively). Adding either of the overshot gate structures tested will increase the maximum spillway velocities to greater than 22 f~/s for flows from 2,000 to 4,500 ftS/s. The velocities never exceed 26 flJs. Therefore, adding either gate structure will increase velocity sufficiently to provide an effective barrier for salmon. However, under low stress conditions for fish (optimum oxygen and water temperature), the swimming speeds and stamina of steelhead are sufficient to move against the maximum spillway velocities.
To gain additional perspective of the likely increase in steelhead barrier effectiveness, the work required for fish to move against the flow for each barrier option can be calculated. The work required to move upstream is proportional to the square of flow velocity. Work can be expressed a s :
Work = Force * Distance (4) f
o r
Work = (C~ApV2/2) * D (5)
where:
C d = coefficient of drag (0.2 for salmon, Bell, 1991) A -- area projected normal to the flow direction (f~2) p = ~mass density of water (lb/f~ 3) V = velocity of flow (f~/s) D = distance traveled (ft)
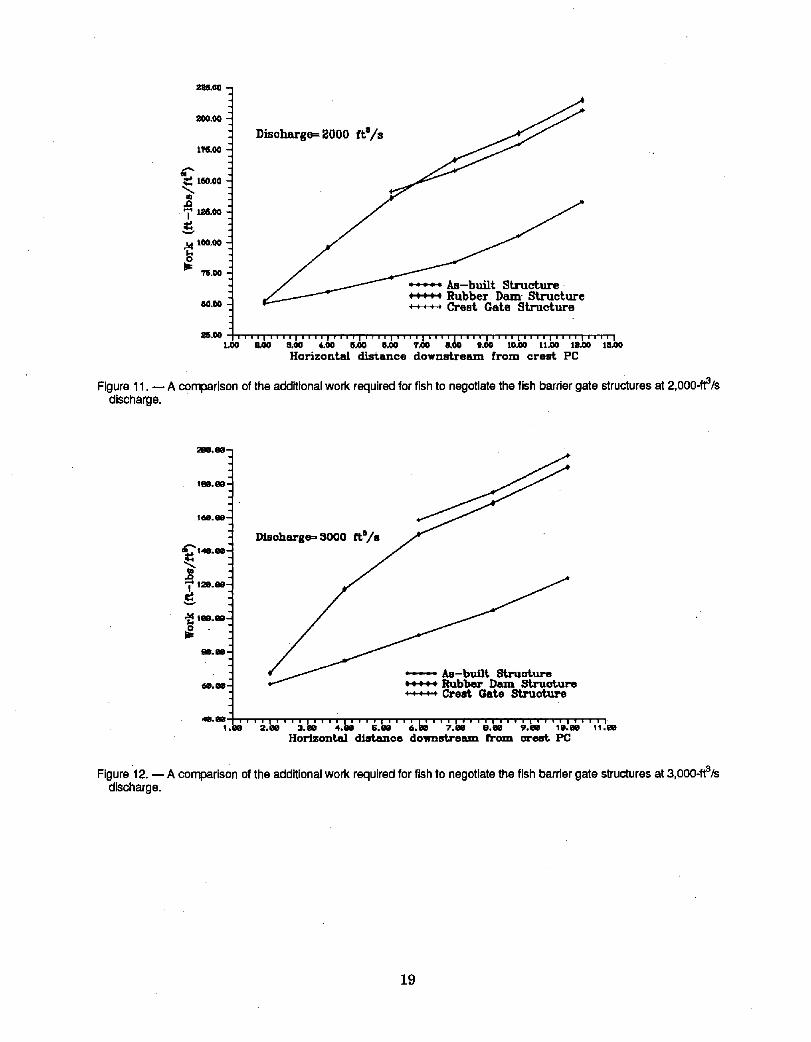
Using equation 5, the work per unit area is plotted for each barrier option and flow on figures 11, 12, and 13. As shown, adding the gate structures increases the work required for fish to move upstream along the initial 6 to 8 f~ of spillway by about 60 percent. For the crest gate option, values of work are not shown upstream from the jet impingement zone. The work plotted in figures 11 to 13 does not reflect additional work required to move over the gate structures.
• r
18
~ . 0 0
200.00
Disc 11'6.00
~'~ 160.00 I
£
I~ ~ . ~
Rubber Dam- S t r u c t u r e eo.oo ~ Crest Gate Structure
s.oo ~oo ~o o.oo ,~ ' i ~ = ' " ~ J o " ' l ; l ~ " ' " ' t ; , ~ ' Horizonta l d i s t ance d o w n s t r e a m f r o m c r e s t PC
Figure 11. - - A comparison of the additional work required for fish to negotiate the fish barrier gate structures at 2,000-f~/s discharge.
188.eo
1(le. eB 1
I 1 ~ . ~
~ ! ~ . ~ , -
I
~,~, ~ Rubber Dam S t r u c t u r e Crest Gate ~;ructm-e
410. mm
Horlsont, aI dJatanoe do~'nst.t-emm from m'est PC
Figure 12. - - A comparison of the additional work required for fish to negotiate the fish barrier gate structures at 3,000-~/s discharge.
19

m O O
m ~ 0
17L00
U
50,00
*~*~* A s - b u i l t S t r u c t u r e R u b b e r Dam S t r u c t u r e C r e s t Ga te S t r u o t u r e
"L&'"L~"L~"L~o'"L~"$~"4M"I~"~M'"'Io= . . . . . . . ~ ',k~ H o _ , 4 z o n t a l d i s t a n ~ d o w n s t r e a m ~ o m c r e ~ PC
Figure 13. - - A comparison of the additional work required for fish to negotiate the fish barrier gate structures at 4,500-ft3/s discharge.
Barr ier E f f e c t i v e n e s s o f the F l o w Over t h e G a t e s
Visual observations of the flow field in the separation zone downstream from the rubber gate (or crest gate when suppressed) indicated the zone is relatively tranquil. The separation zone could likely be used as a re'sting area for fish that have moved up the spillway. Providing a resting area about half way up the structure will greatly increase the likelihood that fish can negotiate the structure.
The resting zone was eliminated for the crest gate option by moving the gate downstream closer to the spillway ogee section. With the gate pivot point located 1.25 it upstream from the PC, the jet freely aerated at the gate brink. Although not tested because of uncertainties about creating an overhang between the lowered gate and the crest, the gate could be moved farther forward to reduce the pool depths behind the gate. The option of mounting the gate as close as 1 it to the upstream edge of the ogee crest should be discussed with gate manufacturers. The same strategy for creating an aerated nappe is not possible for the water-filled rubber dam because of drainage requirements previously discussed.
Creating a free impinging jet on the downward sloping portion of the spillway face provides several characteristics that increase fish barrier effectiveness. Fish encounter the free impinging jet while amid a darting spurt. Flow conditions and direction vary rapidly at the jet impingement point. Fish must reorient to the new flow direction and conditions in a relatively
• shallow, swiftly flowing, highly turbulent zone.
20
REFERENCES
Bell, M. C., F/sheries Handbook of Engineering Requirements and Biological Criteria, U.S. Army Corps of Engineersl North Pacific Division, 1991.
Wagner, C. H., Technical Memorandum on Fish Barrier Dams, Fish Facilities Section, Columbia Fisheries Program Office, Bureau of Commercial Fisheries, Portland, Oregon, 1967.
21

Mission
The mission of the Bureau of Reclamation is to manage, develop, and protect water and related resources in an environmental ly and economically sound manner in the interest of the American public.
A free pamphlet is available from the Bureau entitled "Publications for Sale." It describes some of the technical publications currently available, their cost, and how to order them. The pamphlet can be obtained upon request from the Bureau of Reclamation, Attn D-7923A, PO Box 25007, Denver Federal Center, Denver CO 80225-0007.
_ x l
TPB4
RESEARCH & LABORATORY CHIEF SERVICES_DIV~I-SION CODE~
J