winners don t punish - harvard university
TRANSCRIPT
Winners Don't Punish
CitationDreber, Anna, David G. Rand, Drew Fudenberg, and Martin A. Nowak. Winners don't punish. Nature 452: 335-348.
Published Versionhttp://www.economics.harvard.edu/faculty/fudenberg/files/winners don't punish.pdf;http://dx.doi.org/10.1038/nature06723
Permanent linkhttp://nrs.harvard.edu/urn-3:HUL.InstRepos:2252594
Terms of UseThis article was downloaded from Harvard University’s DASH repository, and is made available under the terms and conditions applicable to Open Access Policy Articles, as set forth at http://nrs.harvard.edu/urn-3:HUL.InstRepos:dash.current.terms-of-use#OAP
Share Your StoryThe Harvard community has made this article openly available.Please share how this access benefits you. Submit a story .
Accessibility
Winners don’t punish
Anna Dreber1,2*, David G. Rand1,3*, Drew Fudenberg4 & Martin A. Nowak1,5,6†
1Program for Evolutionary Dynamics, 3Department of Systems Biology, 4Department of Economics, 5Department of Mathematics, 6Department of Organismic and Evolutionary
Biology, Harvard University, Cambridge, Massachusetts 02138, USA. 2Stockholm School of Economics, Department of Economics, Stockholm, Sweden.
*These authors contributed equally to this work, †Corresponding author
A key aspect of human behavior is cooperation1-7. We tend to help others even if costs are involved. We are more likely to help when the costs are small and the benefits for the other person significant. Cooperation leads to a tension between what is best for the individual and what is best for the group. A group does better if everyone cooperates, but each individual is tempted to defect. Recently, there has been much interest to explore the effect of costly punishment on human cooperation8-23. Costly punishment means paying a cost for another individual to incur a cost. It has been suggested that costly punishment promotes cooperation even in non-repeated games and without any possibility of reputation effects10. But most of our interactions are repeated and reputation is always at stake. Thus, if costly punishment plays an important role in promoting cooperation, it must do so in a repeated setting. We have performed experiments where in each round of a repeated game people choose between cooperation, defection and costly punishment. In control experiments, people can only cooperate or defect. We find that the option of costly punishment increases the amount of cooperation, but not the average payoff of the group. Furthermore, there is a strong negative correlation between total payoff and use of costly punishment. Those people who gain the highest total payoff tend not to use costly punishment: winners don’t punish. This suggests that costly punishment behavior is maladaptive in cooperation games and might have evolved for other reasons. The essence of cooperation is described by the Prisoner’s Dilemma. Two players have a choice between cooperation, C, and defection, D. If both players cooperate they get more than if both defect, but defecting against a cooperator leads to the highest payoff, while cooperating with a defector leads to the lowest payoff. One way to construct a Prisoner’s Dilemma is by assuming that cooperation implies paying a cost for the other person to receive a benefit, while defection implies taking something away from the other person (Fig 1). Without any mechanism for the evolution of cooperation, natural selection favors defection. But a number of such mechanisms have been proposed, including direct and indirect reciprocity 7. Direct reciprocity means there are repeated encounters between the same two individuals, and my behavior depends on what you have done to me 1-6. Indirect reciprocity means there are repeated encounters within a group; my behavior also depends on what you have done to others. Costly (or altruistic) punishment, P, means that one person pays a cost for another person to incur a cost. People are willing to use costly punishment against others who have
- 1 -
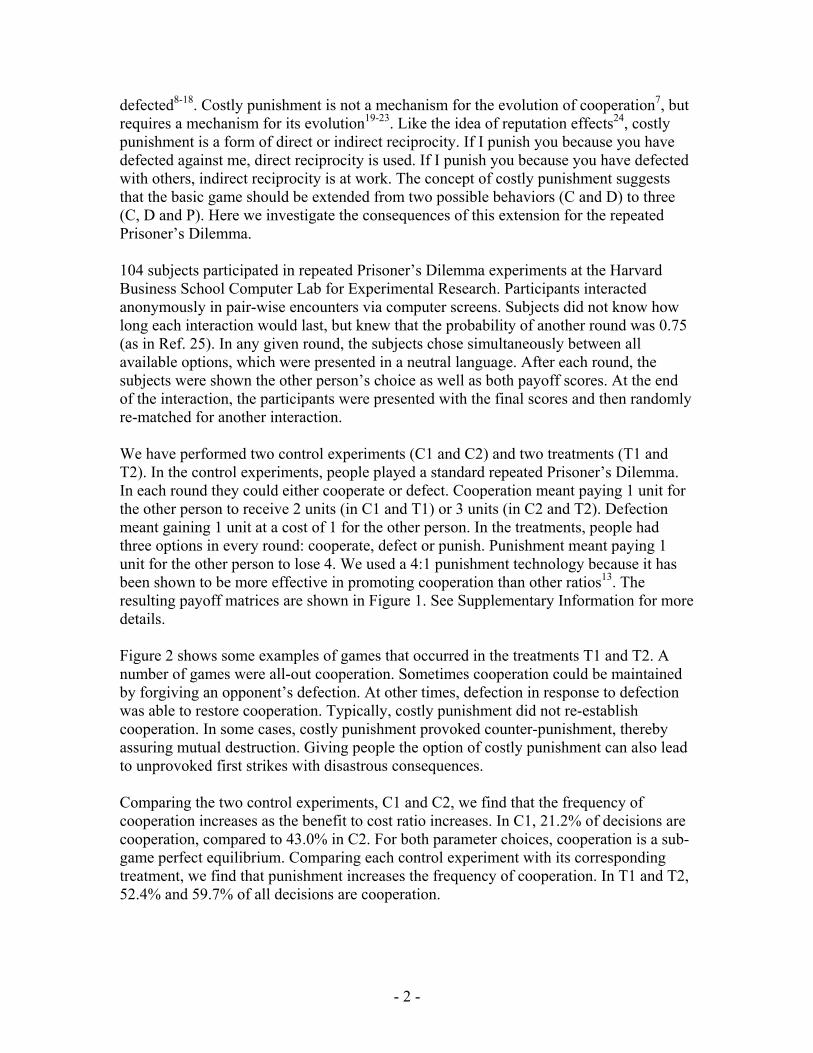
defected8-18. Costly punishment is not a mechanism for the evolution of cooperation7, but requires a mechanism for its evolution19-23. Like the idea of reputation effects24, costly punishment is a form of direct or indirect reciprocity. If I punish you because you have defected against me, direct reciprocity is used. If I punish you because you have defected with others, indirect reciprocity is at work. The concept of costly punishment suggests that the basic game should be extended from two possible behaviors (C and D) to three (C, D and P). Here we investigate the consequences of this extension for the repeated Prisoner’s Dilemma. 104 subjects participated in repeated Prisoner’s Dilemma experiments at the Harvard Business School Computer Lab for Experimental Research. Participants interacted anonymously in pair-wise encounters via computer screens. Subjects did not know how long each interaction would last, but knew that the probability of another round was 0.75
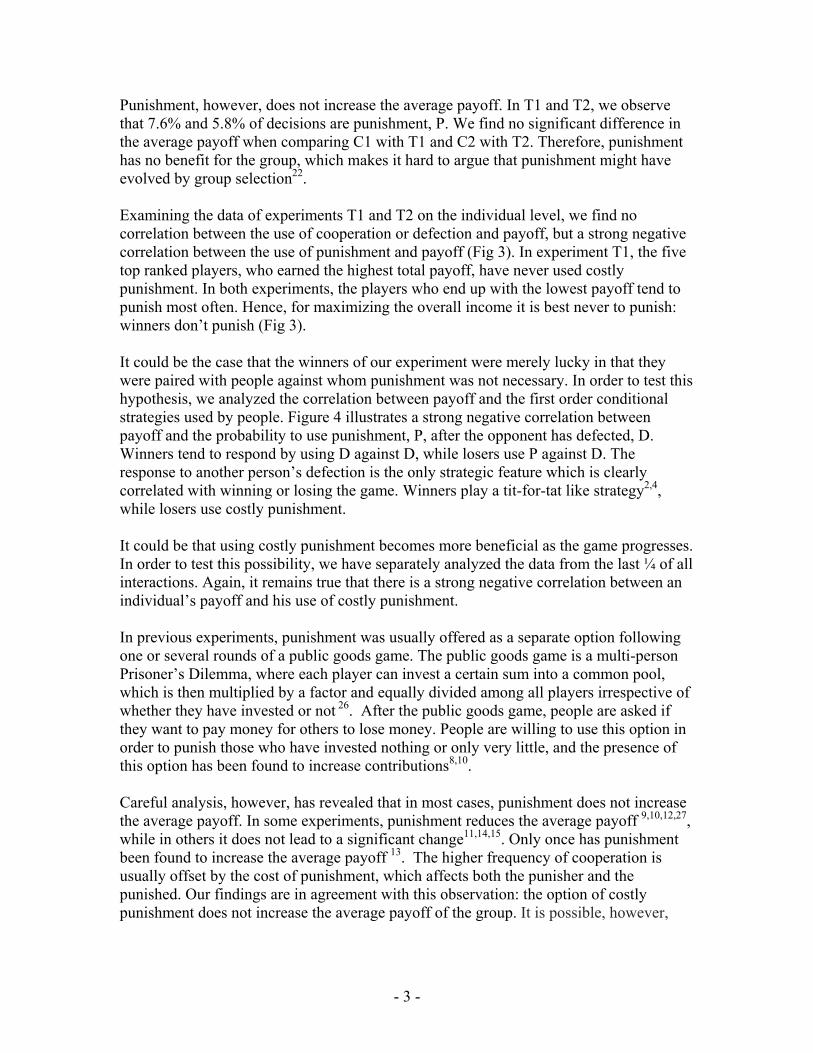
(as in Ref. 25). In any given round, the subjects chose simultaneously between all available options, which were presented in a neutral language. After each round, the subjects were shown the other person’s choice as well as both payoff scores. At the end of the interaction, the participants were presented with the final scores and then randomly re-matched for another interaction. We have performed two control experiments (C1 and C2) and two treatments (T1 and T2). In the control experiments, people played a standard repeated Prisoner’s Dilemma. In each round they could either cooperate or defect. Cooperation meant paying 1 unit for the other person to receive 2 units (in C1 and T1) or 3 units (in C2 and T2). Defection meant gaining 1 unit at a cost of 1 for the other person. In the treatments, people had three options in every round: cooperate, defect or punish. Punishment meant paying 1 unit for the other person to lose 4. We used a 4:1 punishment technology because it has been shown to be more effective in promoting cooperation than other ratios13. The resulting payoff matrices are shown in Figure 1. See Supplementary Information for more details. Figure 2 shows some examples of games that occurred in the treatments T1 and T2. A number of games were all-out cooperation. Sometimes cooperation could be maintained by forgiving an opponent’s defection. At other times, defection in response to defection was able to restore cooperation. Typically, costly punishment did not re-establish cooperation. In some cases, costly punishment provoked counter-punishment, thereby assuring mutual destruction. Giving people the option of costly punishment can also lead to unprovoked first strikes with disastrous consequences. Comparing the two control experiments, C1 and C2, we find that the frequency of cooperation increases as the benefit to cost ratio increases. In C1, 21.2% of decisions are cooperation, compared to 43.0% in C2. For both parameter choices, cooperation is a sub-game perfect equilibrium. Comparing each control experiment with its corresponding treatment, we find that punishment increases the frequency of cooperation. In T1 and T2, 52.4% and 59.7% of all decisions are cooperation.
- 2 -
Punishment, however, does not increase the average payoff. In T1 and T2, we observe that 7.6% and 5.8% of decisions are punishment, P. We find no significant difference in the average payoff when comparing C1 with T1 and C2 with T2. Therefore, punishment has no benefit for the group, which makes it hard to argue that punishment might have evolved by group selection22. Examining the data of experiments T1 and T2 on the individual level, we find no correlation between the use of cooperation or defection and payoff, but a strong negative correlation between the use of punishment and payoff (Fig 3). In experiment T1, the five top ranked players, who earned the highest total payoff, have never used costly punishment. In both experiments, the players who end up with the lowest payoff tend to punish most often. Hence, for maximizing the overall income it is best never to punish: winners don’t punish (Fig 3). It could be the case that the winners of our experiment were merely lucky in that they were paired with people against whom punishment was not necessary. In order to test this hypothesis, we analyzed the correlation between payoff and the first order conditional strategies used by people. Figure 4 illustrates a strong negative correlation between payoff and the probability to use punishment, P, after the opponent has defected, D. Winners tend to respond by using D against D, while losers use P against D. The response to another person’s defection is the only strategic feature which is clearly correlated with winning or losing the game. Winners play a tit-for-tat like strategy2,4, while losers use costly punishment. It could be that using costly punishment becomes more beneficial as the game progresses. In order to test this possibility, we have separately analyzed the data from the last ¼ of all interactions. Again, it remains true that there is a strong negative correlation between an individual’s payoff and his use of costly punishment. In previous experiments, punishment was usually offered as a separate option following one or several rounds of a public goods game. The public goods game is a multi-person Prisoner’s Dilemma, where each player can invest a certain sum into a common pool, which is then multiplied by a factor and equally divided among all players irrespective of whether they have invested or not 26. After the public goods game, people are asked if they want to pay money for others to lose money. People are willing to use this option in order to punish those who have invested nothing or only very little, and the presence of this option has been found to increase contributions8,10. Careful analysis, however, has revealed that in most cases, punishment does not increase the average payoff. In some experiments, punishment reduces the average payoff 9,10,12,27, while in others it does not lead to a significant change11,14,15. Only once has punishment been found to increase the average payoff 13. The higher frequency of cooperation is usually offset by the cost of punishment, which affects both the punisher and the punished. Our findings are in agreement with this observation: the option of costly punishment does not increase the average payoff of the group. It is possible, however,
- 3 -
that in longer experiments and for particular parameter values punishment might increase the average payoff. It is sometimes argued that costly punishment is a mechanism for stabilizing cooperation in anonymous, one-shot games. But whether or not this is the case seems to be of little importance, because most of our interactions occur in a context where repetition is possible and reputation matters. For millions of years of human evolution, our ancestors have lived in relatively small groups where people knew each other. Interactions in such groups are certainly repeated and open ended. Thus, our strategic instincts have been evolving in situations where it is likely that others either directly observe my actions or eventually find out about them. Also in modern life, most of our interactions occur with people whom we meet frequently. Typically, we can never rule out ‘subsequent rounds’. Therefore, if costly punishment is important for the evolution of human cooperation, then it must play a beneficial role in the setting of repeated games. Our findings do not support this claim. We also believe that our current design has some additional advantages over previous ones. In our setting, costly punishment is always one of three options. Hence, there is an opportunity cost for using punishment, because the subject forfeits the opportunity to cooperate or to defect. Our design also minimizes the experimenter and participant demand effects28, because there are always several options 27. In many previous experiments retaliation for punishment is not possible 9-16,27, but it is a natural feature of our setting. In summary, our data show that costly punishment strongly disfavors the individual who uses it and hence it is opposed by individual selection in cooperation games where direct reciprocity is possible. We conclude that costly punishment might have evolved for reasons other than promoting cooperation, such as coercing individuals into submission and establishing dominance hierarchies20,29. Punishment might enable a group to exert control over individual behavior. A stronger individual could use punishment to dominate weaker ones. People engage in conflicts and know that conflicts can carry costs. Costly punishment serves to escalate conflicts, not to moderate them. Costly punishment might force people to submit, but not to cooperate. It could be that costly punishment is beneficial in these other games, but the use of costly punishment in games of cooperation appears to be maladaptive. We have shown that in the framework of direct reciprocity, winners do not use costly punishment, while losers punish and perish. Methods summary A total of 104 subjects (45 women, 59 men, mean age 22.2) from Boston area colleges and universities participated voluntarily in a modified repeated Prisoner’s Dilemma game at the Harvard Business School Computer Lab for Experimental Research (CLER). The lab consists of 36 computers which are visually partitioned. The participants interacted anonymously via the software z-Tree30. The subjects were from a number of different schools and a wide range of fields of study, such that it was unlikely for any subject to know more than one other person in the room. No significant difference in cooperation
- 4 -
use, punishment use or payoff was found between males and females, or between economics majors and non-economic majors (Mann-Whitney test: p > 0.05 for all sessions). Subjects were not allowed to participate in more than one session of the experiment. A total of 4 sessions were conducted in April and May 2007, with an average of 26 participants playing an average of 24 interactions, for an average of 79 total rounds per subject. At the start of each new interaction, subjects were unaware of the previous decisions of the other player. After each round, the subjects were shown the other person's choice as well as both payoff scores. At the end of the interaction, the participants were presented with the final scores and then randomly re-matched for another interaction. In each session, the subjects were paid a $15 show up fee. Each subject’s final score summed over all interactions was multiplied by $0.10 to determine additional earned income. To allow for negative incomes while maintaining the $15 show up fee, $5 was added to each subject’s earned income at the end of the session. Subjects were informed of this extra $5 at the beginning of the session. The average payment per subject was $26 and the average session length was 1.25 hours. 1. Trivers, R. The evolution of reciprocal altruism. Q. Rev. Biol. 46, 35-57 (1971). 2. Axelrod, R. & Hamilton, W. D. The evolution of cooperation. Science 211, 1390-1396 (1981). 3. Fudenberg, D. and Maskin, E. Evolution and cooperation in noisy repeated games. Am. Econ. Rev. 80, 274-279 (1990). 4. Nowak, M.A. & Sigmund, K. Tit for tat in heterogeneous populations. Nature 355, 250-253 (1992). 5. Binmore, K. & Samuelson, L. Evolutionary stability in repeated games played by finite automata. J. of Econ. Theory 57, 278-305 (1992). 6. Colman, A. M. Game Theory and its Applications in the Social and Biological Sciences (Routledge, New York, 1995). 7. Nowak, M.A. Five rules for the evolution of cooperation. Science 314, 1560-1563 (2006). 8. Yamagishi, T. The provision of a sanctioning system as a public good. J. Pers. Soc. Psychol. 51, 110-116 (1986). 9. Ostrom E., Walker, J. & Gardner, R. Covenants with and without a sword: self-governance is possible. Am. Pol. Sci. Rev. 86, 404-417 (1992). 10. Fehr, E. & Gächter, S. Altruistic punishment in humans. Nature 415, 137-140 (2002).
- 5 -
11. Botelho, A., Harrison, G.W., Pinto, L.M.C. & Rutström, E.E. Social norms and social choice. University of Central Florida Economics Working Paper No. 05-23 (2005). 12. Egas, M. & Riedl, A. The economics of altruistic punishment and the demise of cooperation. IZA Discussion Papers No. 1646 (2005). 13. Nikiforakis, N. & Normann, H.T. A comparative statics analysis of punishment in public-good experiments. Royal Holloway University of London Discussion Paper in Economics No. 05/07 (2005). 14. Page, T., Putterman, L. & Unel, B. Voluntary association in public goods experiments: reciprocity, mimicry and efficiency. Econ. J. 115, 1032-1053 (2005). 15. Bochet, O., Page, T. & Putterman, L. Communication and punishment in voluntary contribution experiments. J. Econ. Behav. Org. 60, 11-26 (2006). 16. Gürerk, Ö., Irlenbusch, B. & Rockenbach, B. The competitive advantage of sanctioning institutions. Science 312, 108-111 (2006). 17. Rockenbach, B. & Milinski, M. The efficient interaction of indirect reciprocity and costly punishment. Nature 444, 718-723 (2006). 18. Denant-Boemont, L., Masclet D. & Noussair, C. N. Punishment, counterpunishment and sanction enforcement in a social dilemma experiment. Econ. Theory 33, 145-167 (2007). 19. Boyd, R. & Richerson, P.J. Punishment allows the evolution of cooperation (or anything else) in sizable groups. Ethology and Sociobiology 13, 171−195 (1992). 20. Clutton-Brock, T.H. & Parker, G.A. Punishment in animal societies. Nature 373, 209-216 (1995). 21. Sigmund K., Hauert, C. & Nowak, M.A. Reward and punishment. Proc. Natl. Acad. Sci. USA 98, 10757-10762 (2001). 22. Boyd, R., Gintis, H., Bowles, S. & Richerson, P.J. The evolution of altruistic punishment. Proc. Natl. Acad. Sci. USA 100, 3531-3535 (2003). 23. Fowler, J.H. Altruistic punishment and the origin of cooperation. Proc. Natl. Acad. Sci. USA 102, 7047-7049 (2005). 24. Fudenberg, D. in Advances in Economic Theory: Sixth World Congress (ed Laffont, J.J). 89-131 (Cambridge University Press, Cambridge, 1993).
- 6 -
25. Dal Bó, P. Cooperation under the shadow of the future: experimental evidence from infinitely repeated games. Am. Econ. Rev. 95, 1591-1604 (2005).
26. Hardin, G. The Tragedy of the Commons. Science 162, 1243-1248 (1968).
27. Sefton, M., Shupp, R. & Walker, J.M. The Effect of Rewards and Sanctions in Provision of Public Goods. Indiana University Bloomington Economics CAEPR Working Paper No. 2006-005 (2006).
28. Carpenter, J., Liati, A. & Vickery, B. They come to play: supply effects in an economic experiment. Middlebury College Economics Discussion Paper No. 06-02 (2006). 29. Samuelson, L. Economic theory and experimental economics. J. of Econ. Lit. 43, 65-107 (2005). 30. Fischbacher, U. z-Tree: Zurich Toolbox for Ready-made Economic Experiments. Experimental Economics 10, 171-178 (2007). Acknowledgements Support from the John Templeton Foundation, the NSF-NIH joint program in mathematical biology (NIH grant 1R01GM078986), the Jan Wallander Foundation (A.D) and NSF grant SES 0646816 (DF) is gratefully acknowledged. The Program for Evolutionary Dynamics is sponsored by J. Epstein.
- 7 -
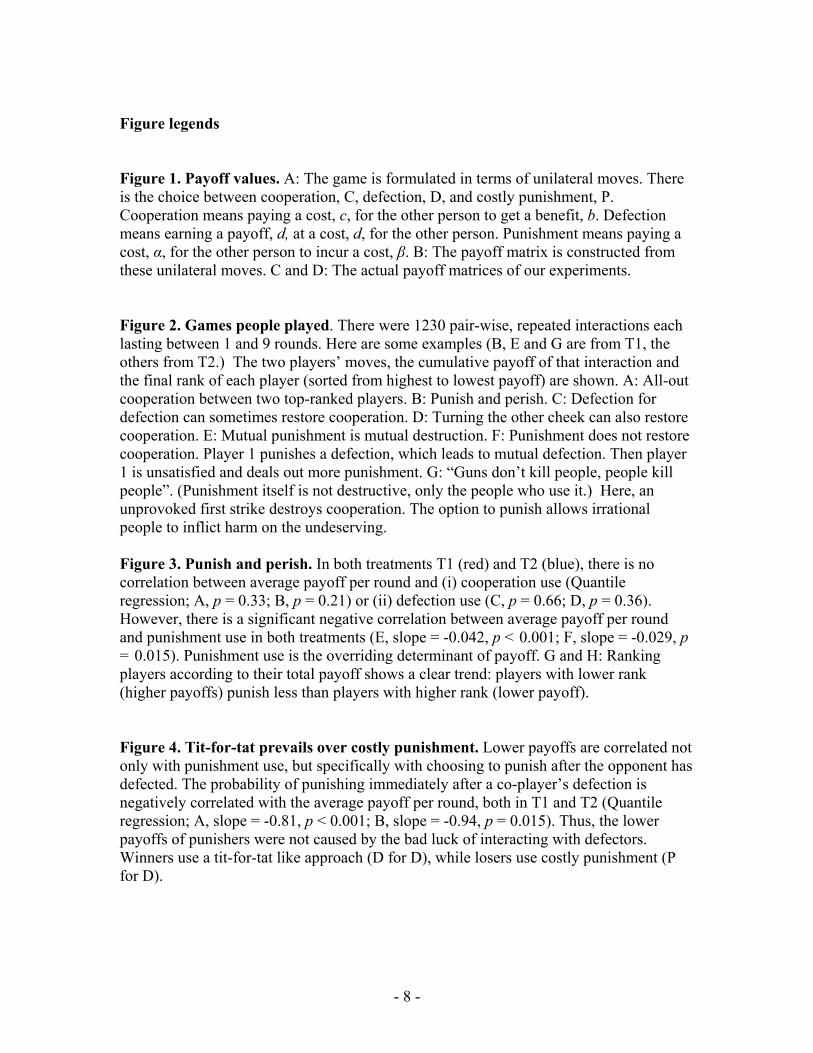
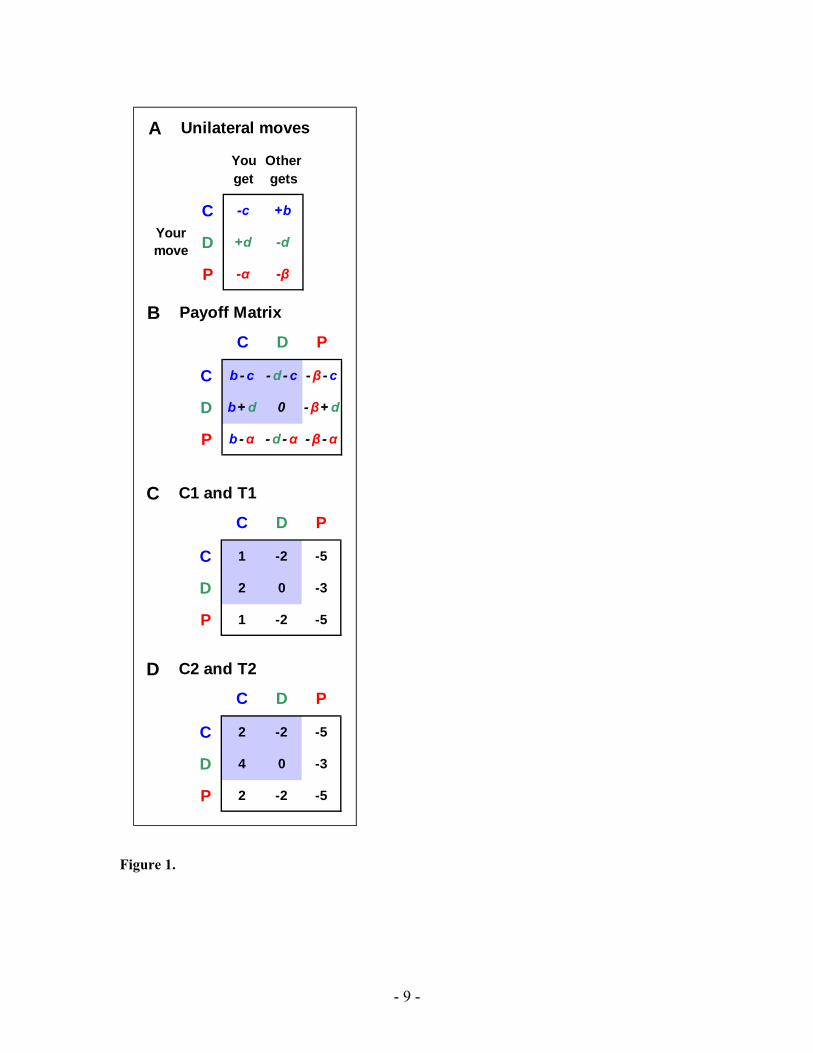
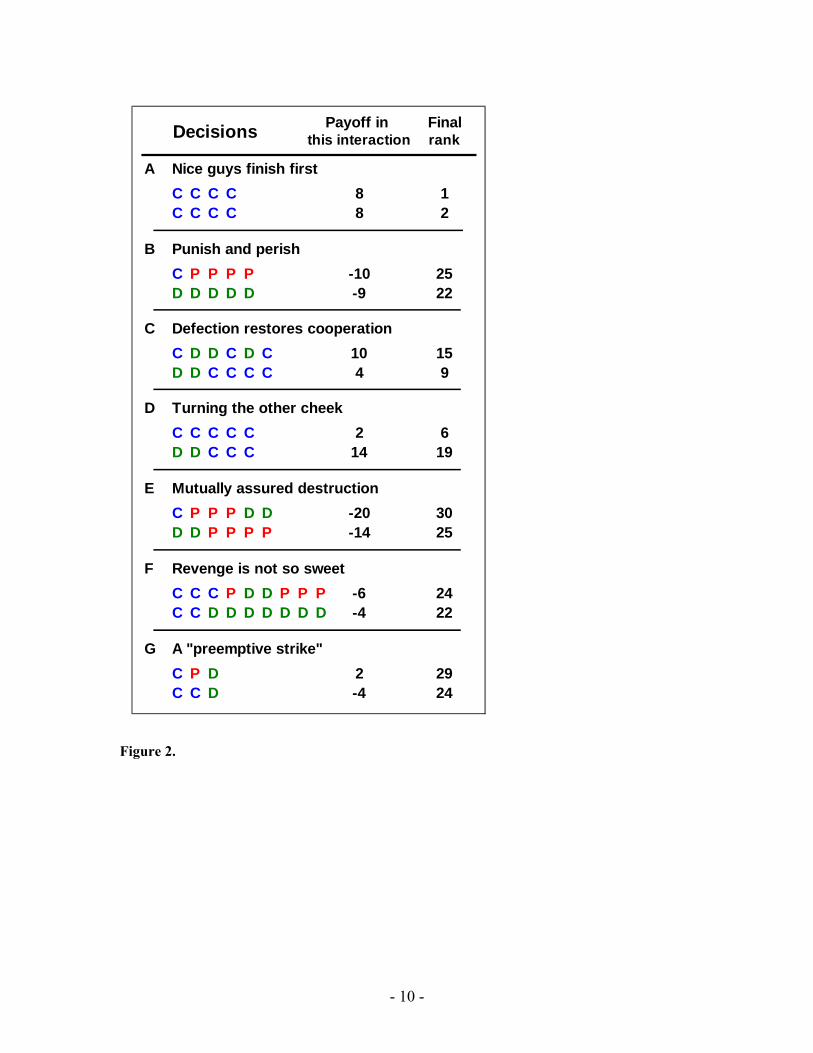
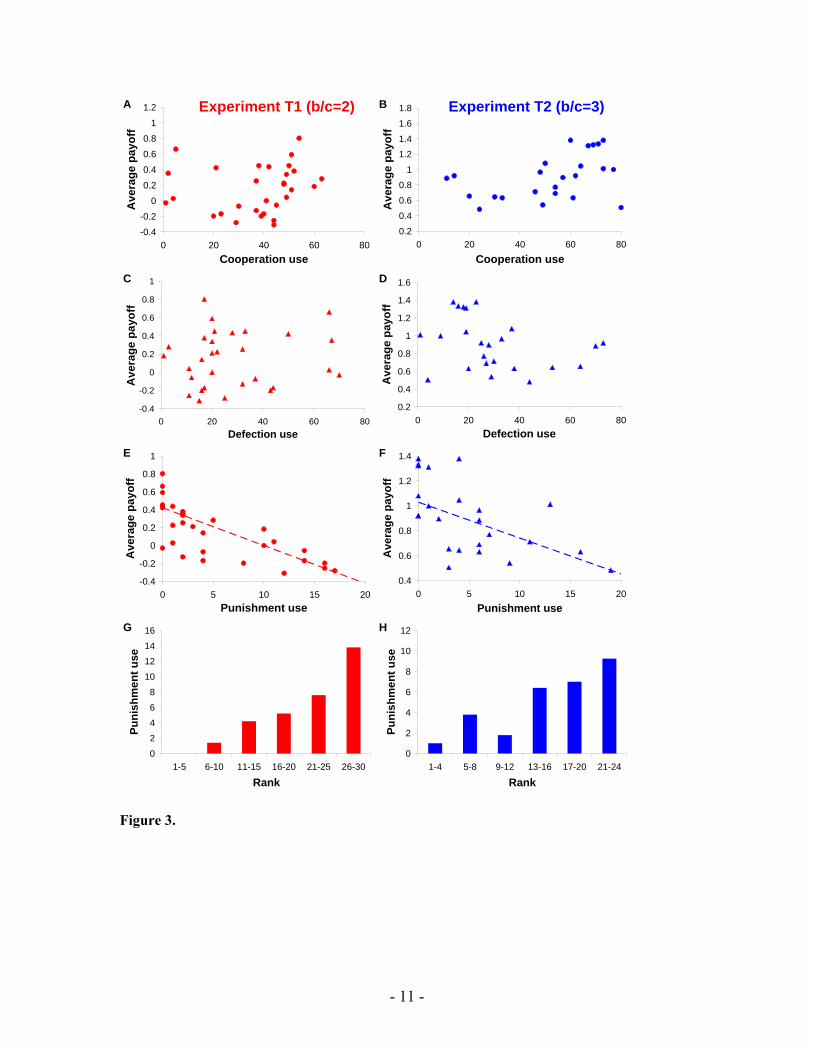
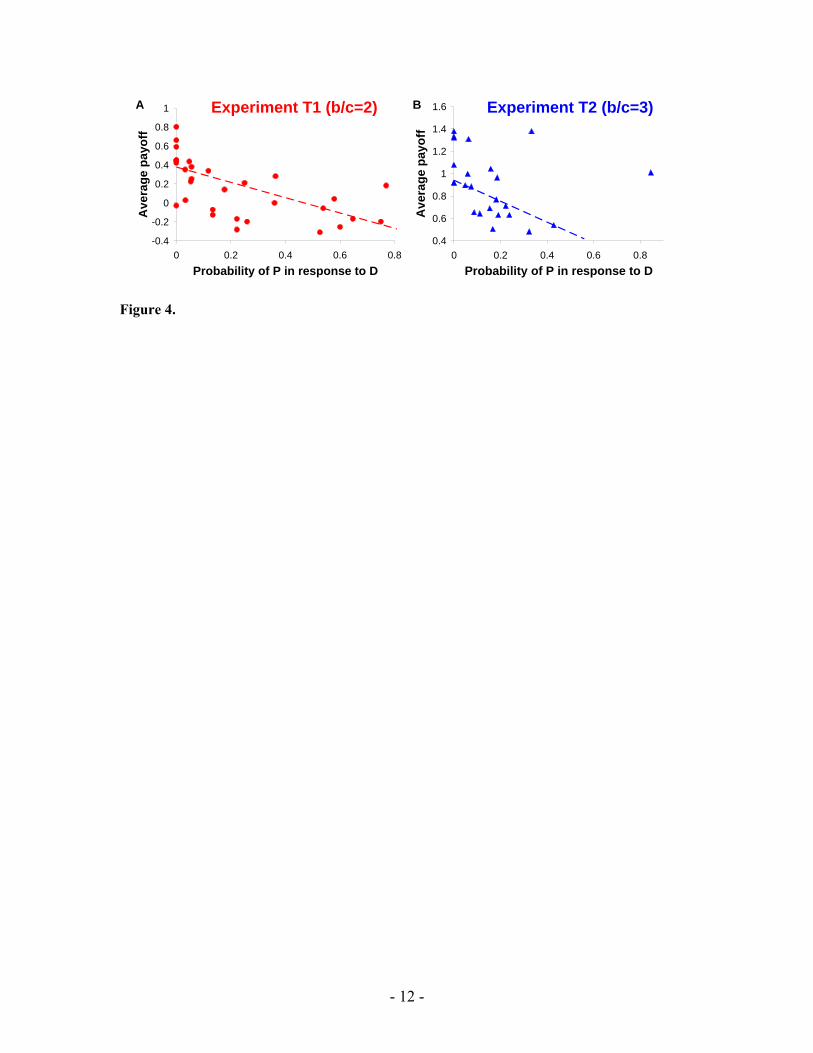
Figure legends Figure 1. Payoff values. A: The game is formulated in terms of unilateral moves. There is the choice between cooperation, C, defection, D, and costly punishment, P. Cooperation means paying a cost, c, for the other person to get a benefit, b. Defection means earning a payoff, d, at a cost, d, for the other person. Punishment means paying a cost, α, for the other person to incur a cost, β. B: The payoff matrix is constructed from these unilateral moves. C and D: The actual payoff matrices of our experiments. Figure 2. Games people played. There were 1230 pair-wise, repeated interactions each lasting between 1 and 9 rounds. Here are some examples (B, E and G are from T1, the others from T2.) The two players’ moves, the cumulative payoff of that interaction and the final rank of each player (sorted from highest to lowest payoff) are shown. A: All-out cooperation between two top-ranked players. B: Punish and perish. C: Defection for defection can sometimes restore cooperation. D: Turning the other cheek can also restore cooperation. E: Mutual punishment is mutual destruction. F: Punishment does not restore cooperation. Player 1 punishes a defection, which leads to mutual defection. Then player 1 is unsatisfied and deals out more punishment. G: “Guns don’t kill people, people kill people”. (Punishment itself is not destructive, only the people who use it.) Here, an unprovoked first strike destroys cooperation. The option to punish allows irrational people to inflict harm on the undeserving. Figure 3. Punish and perish. In both treatments T1 (red) and T2 (blue), there is no correlation between average payoff per round and (i) cooperation use (Quantile regression; A, p = 0.33; B, p = 0.21) or (ii) defection use (C, p = 0.66; D, p = 0.36). However, there is a significant negative correlation between average payoff per round and punishment use in both treatments (E, slope = -0.042, p < 0.001; F, slope = -0.029, p = 0.015). Punishment use is the overriding determinant of payoff. G and H: Ranking players according to their total payoff shows a clear trend: players with lower rank (higher payoffs) punish less than players with higher rank (lower payoff). Figure 4. Tit-for-tat prevails over costly punishment. Lower payoffs are correlated not only with punishment use, but specifically with choosing to punish after the opponent has defected. The probability of punishing immediately after a co-player’s defection is negatively correlated with the average payoff per round, both in T1 and T2 (Quantile regression; A, slope = -0.81, p < 0.001; B, slope = -0.94, p = 0.015). Thus, the lower payoffs of punishers were not caused by the bad luck of interacting with defectors. Winners use a tit-for-tat like approach (D for D), while losers use costly punishment (P for D).
- 8 -
D C2 and T2
C D
A Unilateral moves
You Otherget gets
C -c +b
D +d -dYour move
P -α -β
P
P
C 2 -2 -5
D 4 0 -3
2 -2 -5
C C1 and T1
C D
C 1 -2 -5
D 2 0 -3
1 -2 -5
P
P
B Payoff Matrix
C D
C b- c - d - c - c
D b+d 0 - +d
b - - d - - -
P
β -
β
P α α β α
Figure 1.
- 9 -
Payoff in Finalthis interaction rank
A Nice guys finish firstC C C C 8 1C C C C 8 2
B Punish and perish C -10 25D D D D D -9 22
C Defection restores cooperationC D D C D C 10 15D D C C C C 4 9
D Turning the other cheekC C C C C 2 6D D C C C 14 19
E Mutually assured destructionC D D -20 30D D -14 25
F Revenge is not so sweetC C C D D -6 24C C D D D D D D D -4 22
G A "preemptive strike"C D 2 29C C D -4 24
Decisions
P P P P
P P PP P P P
P P P P
P
Figure 2.
- 10 -
-0.4
-0.2
0
0.2
0.4
0.6
0.8
1
1.2
0 20 40 60 80Cooperation use
Ave
rage
pay
off
A Experiment T1 (b/c=2)
0.2
0.4
0.6
0.8
1
1.21.4
1.6
1.8
0 20 40 60 8
Cooperation use
Ave
rage
pay
off
B Experiment T2 (b/c=3)
0
-0.4
-0.2
0
0.2
0.4
0.6
0.8
1
0 20 40 60 80Defection use
Ave
rage
pay
off
C
0.2
0.4
0.6
0.8
1
1.2
1.4
1.6
0 20 40 60 8Defection use
Ave
rage
pay
off
D
0
-0.4
-0.2
0
0.2
0.4
0.6
0.8
1
0 5 10 15 20Punishment use
Ave
rage
pay
off
E
0.4
0.6
0.8
1
1.2
1.4
0 5 10 15 20Punishment use
Ave
rage
pay
off
F
0
24
6
8
10
1214
16
1-5 6-10 11-15 16-20 21-25 26-30
Rank
Puni
shm
ent u
se
G
0
2
4
6
8
10
12
1-4 5-8 9-12 13-16 17-20 21-24
Rank
Puni
shm
ent u
se
H
Figure 3.
- 11 -
-0.4
-0.2
0
0.2
0.4
0.6
0.8
1
0 0.2 0.4 0.6 0.8Probability of P in response to D
Ave
rage
pay
off
A Experiment T1 (b/c=2)
0.4
0.6
0.8
1
1.2
1.4
1.6
0 0.2 0.4 0.6 0.8Probability of P in response to D
Ave
rage
pay
off
B Experiment T2 (b/c=3)
Figure 4.
- 12 -
Winners don’t punish
Supplementary Information
Anna Dreber1,2*, David G. Rand1,3*, Drew Fudenberg4 & Martin A. Nowak1,5,6†
1Program for Evolutionary Dynamics, 3Department of Systems Biology, 4Department of Economics, 5Department of Mathematics, 6Department of Organismic and Evolutionary
Biology, Harvard University, Cambridge, Massachusetts 02138, USA. 2Stockholm School of Economics, Department of Economics, Stockholm, Sweden.
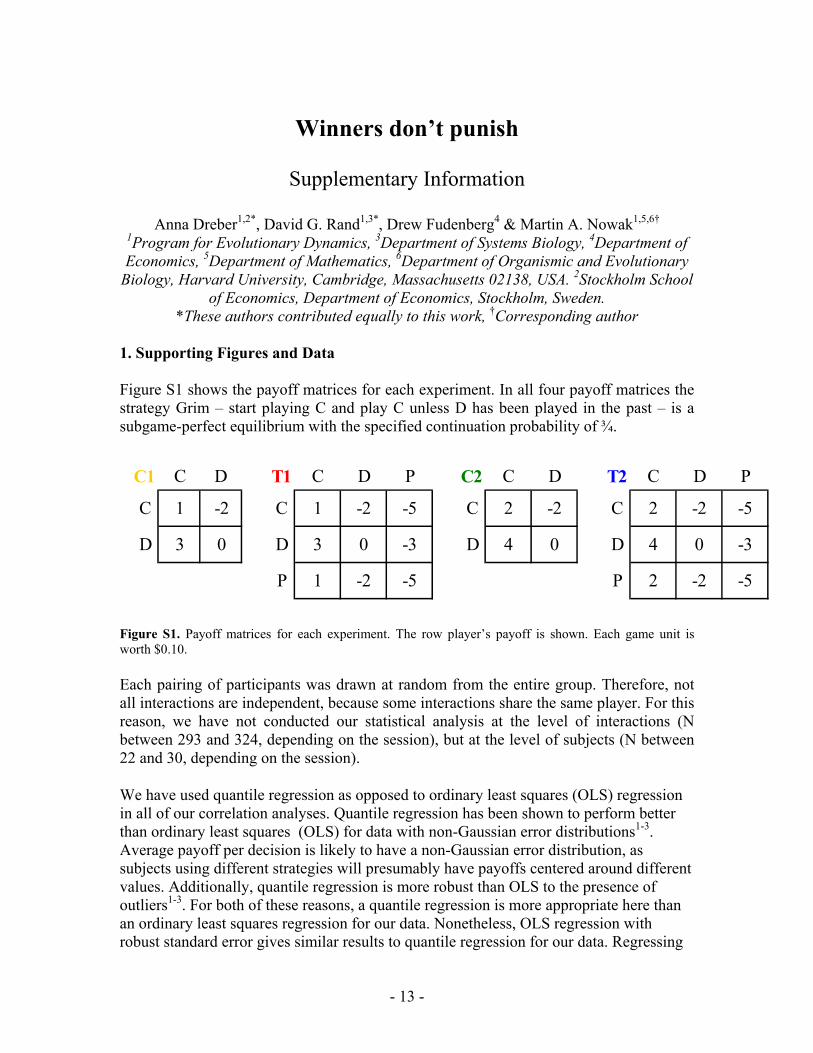
*These authors contributed equally to this work, †Corresponding author 1. Supporting Figures and Data Figure S1 shows the payoff matrices for each experiment. In all four payoff matrices the strategy Grim – start playing C and play C unless D has been played in the past – is a subgame-perfect equilibrium with the specified continuation probability of ¾.
C1 C D C D P C2 C D T2 C D P
C 1 -2 C 1 -2 -5 C 2 -2 C 2 -2 -5
D 3 0 D 3 0 -3 D 4 0 D 4 0 -3
P 1 -2 -5 P 2 -2 -5
T1
Figure S1. Payoff matrices for each experiment. The row player’s payoff is shown. Each game unit is worth $0.10. Each pairing of participants was drawn at random from the entire group. Therefore, not all interactions are independent, because some interactions share the same player. For this reason, we have not conducted our statistical analysis at the level of interactions (N between 293 and 324, depending on the session), but at the level of subjects (N between 22 and 30, depending on the session).
We have used quantile regression as opposed to ordinary least squares (OLS) regression in all of our correlation analyses. Quantile regression has been shown to perform better than ordinary least squares (OLS) for data with non-Gaussian error distributions1-3. Average payoff per decision is likely to have a non-Gaussian error distribution, as subjects using different strategies will presumably have payoffs centered around different values. Additionally, quantile regression is more robust than OLS to the presence of outliers1-3. For both of these reasons, a quantile regression is more appropriate here than an ordinary least squares regression for our data. Nonetheless, OLS regression with robust standard error gives similar results to quantile regression for our data. Regressing
- 13 -
average payoff per decision against punishment use is significant, and gives a similar slope to quantile regression (T1: slope coefficient = -0.038, p<0.001; T2: slope coefficient = -0.031, p<0.001). Regressing average payoff per decision against probability to punish in response to defection is significant in T1 (slope coefficient = -.730, p<0.001), and significant in T2 (slope coefficient = -1.211, p=0.04) with the exclusion of one outlier, who has a probability to punish in response to defection more than 3 standard deviations greater than the mean. Quantile regression is less sensitive to outliers than OLS, and so does not necessitate the exclusion of any data.
Our random partner-matching method does not prevent cyclic interactions, such as A playing with B, then B playing with C, and then A playing with C. To assess whether these cycles affect our conclusion, we have examined the effect of ignoring such interactions. Excluding all interactions between A and C such that A played with B, then B played with C, and then A played with C (~55% of decisions in C1 and T1, and ~66% of interactions in C2 and T2), we still find a significant negative correlation between punishment use and average payoff per round (Quantile regression; T1 slope = -0.068, t = -2.95, p = 0.006; T2, slope = -0.086, t = -2.26, p = 0.034). As described in the main text, the option for costly punishment significantly increases the average cooperation frequency (Fisher’s Exact Test, two-tailed; C1 vs T1: p < 0.001; C2 vs T2: p < 0.001), as shown in Fig. S2A. But the average payoff per round is not significantly different between each control and its corresponding treatment (Mann-Whitney test; C1 vs T1: z = 1.043, p = 0.30; C2 vs T2: z = −0.231, p = 0.82), as shown in Fig. S2B. Therefore, punishment does not provide any advantage for the group. Additionally, the variance in payoffs is larger with punishment than without (C1, std = 14.4; T1, std = 21.5; C2, std = 20.8; T2, std =25.0).
- 14 -
0
0.1
0.2
0.3
0.4
0.5
0.6
0.7
C1 T1 C2 T2
Coo
pera
tion
freq
uenc
y
A
0
0.5
1
1.5
2
C1 T1 C2 T2
Ave
rage
pay
off
B
ALLC payoff
ALLC payoff
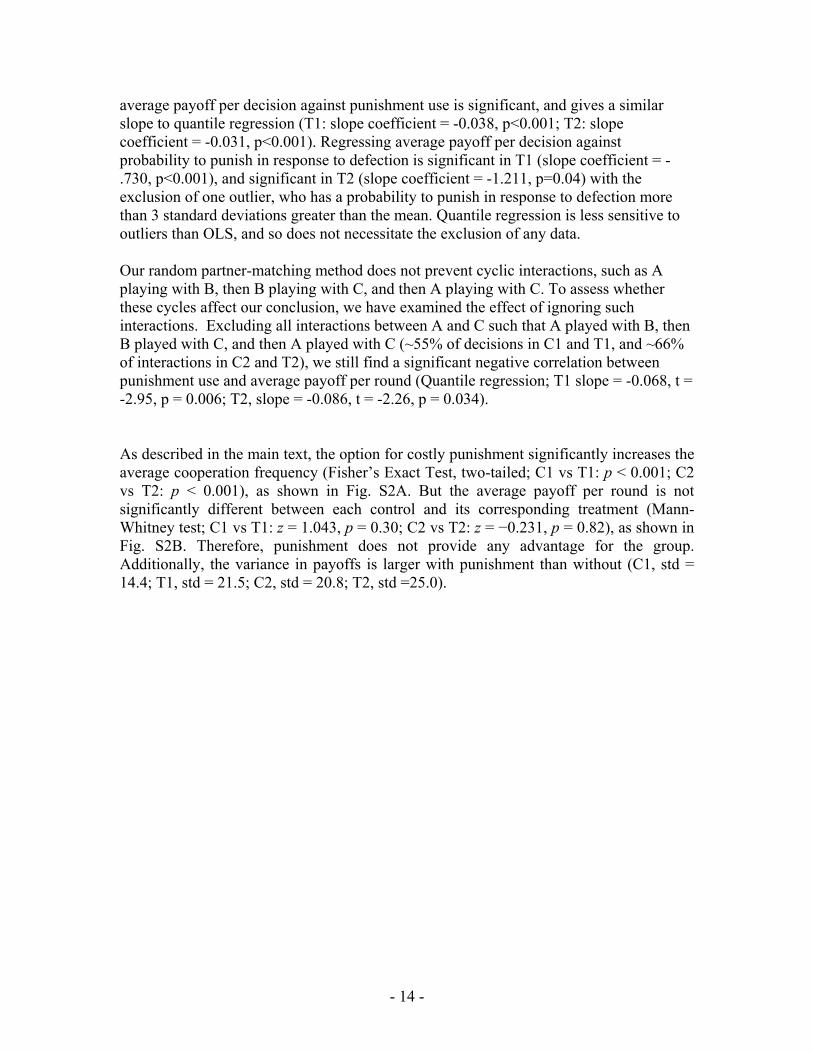
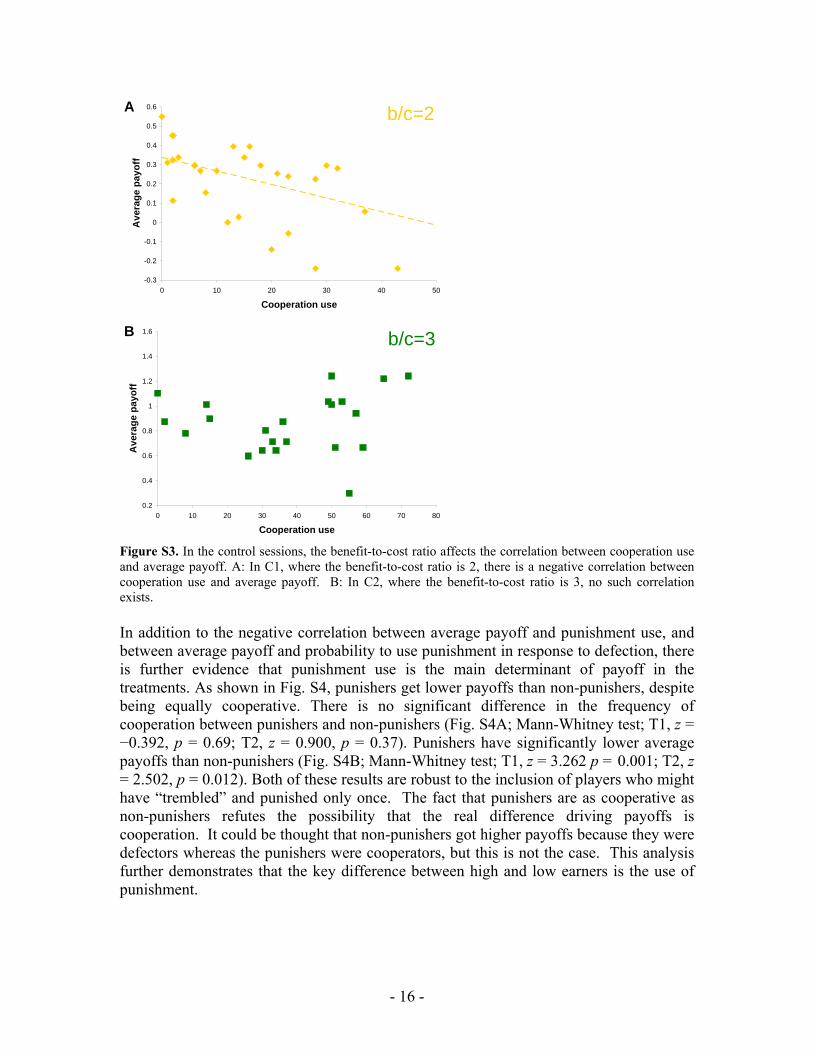
Figure S2. Cooperation frequency (A) and average payoff per round (B) in each session. Error bars represent standard error of the mean. There is significantly more cooperation in each treatment than in the corresponding control, but no significant difference in the average payoff. All control and treatment payoffs are significantly lower than the optimally cooperative payoff for ALLC play. In our control experiment C1 (with a b/c ratio of 2), unprovoked defection increases over the course of the session (Quantile regression, unprovoked defections occurrence against interaction number; slope = 0.5, t = 5.06, p < 0.001). This means people ‘learn’ to defect. In the control experiment C2 (with a b/c ratio of 3), unprovoked defection decreases over the course of the session (Slope = -0.1875, t = -2.65, p = 0.014); hence, people ‘learn’ to cooperate. Interestingly, in both treatments, T1 and T2, there is no significant change of unprovoked defection over the course of the session (T1: t = 0, p = 1.00; T2: t = -1.12, p = 0.27). Hence, the threat of punishment seems to reduce unprovoked defection over time when comparing C1 with T1, but not when comparing C2 with T2. In the control treatments, the correlation between average payoff and cooperation use varies between sessions, as can be seen in Fig. S3. In C1, where the benefit-to-cost ratio is 2, a significant negative correlation exists between average payoff and cooperation use (Fig. S3A; Quantile regression; t = −2.61, p = 0.015, slope = −0.50). In C2, where the benefit-to-cost ratio is 3, no such correlation exists (Fig. S3B; Quantile regression; t = 0.77, p = 0.452).
- 15 -
-0.3
-0.2
-0.1
0
0.1
0.2
0.3
0.4
0.5
0.6
0 10 20 30 40
Cooperation use
Ave
rage
pay
off
A b/c=2
50
0.2
0.4
0.6
0.8
1
1.2
1.4
1.6
0 10 20 30 40 50 60 70 8
Cooperation use
Ave
rage
pay
off
B b/c=3
0
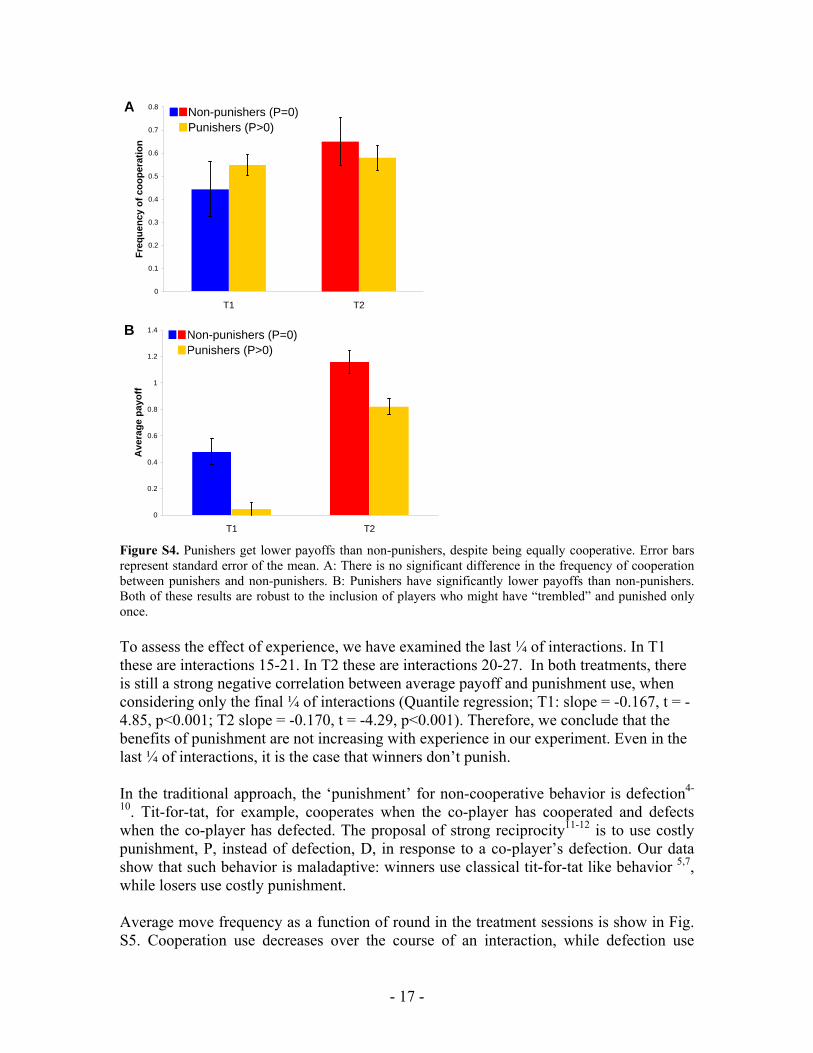
Figure S3. In the control sessions, the benefit-to-cost ratio affects the correlation between cooperation use and average payoff. A: In C1, where the benefit-to-cost ratio is 2, there is a negative correlation between cooperation use and average payoff. B: In C2, where the benefit-to-cost ratio is 3, no such correlation exists. In addition to the negative correlation between average payoff and punishment use, and between average payoff and probability to use punishment in response to defection, there is further evidence that punishment use is the main determinant of payoff in the treatments. As shown in Fig. S4, punishers get lower payoffs than non-punishers, despite being equally cooperative. There is no significant difference in the frequency of cooperation between punishers and non-punishers (Fig. S4A; Mann-Whitney test; T1, z = −0.392, p = 0.69; T2, z = 0.900, p = 0.37). Punishers have significantly lower average payoffs than non-punishers (Fig. S4B; Mann-Whitney test; T1, z = 3.262 p = 0.001; T2, z = 2.502, p = 0.012). Both of these results are robust to the inclusion of players who might have “trembled” and punished only once. The fact that punishers are as cooperative as non-punishers refutes the possibility that the real difference driving payoffs is cooperation. It could be thought that non-punishers got higher payoffs because they were defectors whereas the punishers were cooperators, but this is not the case. This analysis further demonstrates that the key difference between high and low earners is the use of punishment.
- 16 -
0
0.1
0.2
0.3
0.4
0.5
0.6
0.7
0.8
T1 T2
Freq
uenc
y of
coo
pera
tion
Non-punishers (P=0)Punishers (P>0)
A
0
0.2
0.4
0.6
0.8
1
1.2
1.4
T1 T2
Ave
rage
pay
off
Non-punishers (P=0)Punishers (P>0)
B
Figure S4. Punishers get lower payoffs than non-punishers, despite being equally cooperative. Error bars represent standard error of the mean. A: There is no significant difference in the frequency of cooperation between punishers and non-punishers. B: Punishers have significantly lower payoffs than non-punishers. Both of these results are robust to the inclusion of players who might have “trembled” and punished only once. To assess the effect of experience, we have examined the last ¼ of interactions. In T1 these are interactions 15-21. In T2 these are interactions 20-27. In both treatments, there is still a strong negative correlation between average payoff and punishment use, when considering only the final ¼ of interactions (Quantile regression; T1: slope = -0.167, t = -4.85, p<0.001; T2 slope = -0.170, t = -4.29, p<0.001). Therefore, we conclude that the benefits of punishment are not increasing with experience in our experiment. Even in the last ¼ of interactions, it is the case that winners don’t punish. In the traditional approach, the ‘punishment’ for non-cooperative behavior is defection4-
10. Tit-for-tat, for example, cooperates when the co-player has cooperated and defects when the co-player has defected. The proposal of strong reciprocity11-12 is to use costly punishment, P, instead of defection, D, in response to a co-player’s defection. Our data show that such behavior is maladaptive: winners use classical tit-for-tat like behavior 5,7, while losers use costly punishment. Average move frequency as a function of round in the treatment sessions is show in Fig. S5. Cooperation use decreases over the course of an interaction, while defection use
- 17 -
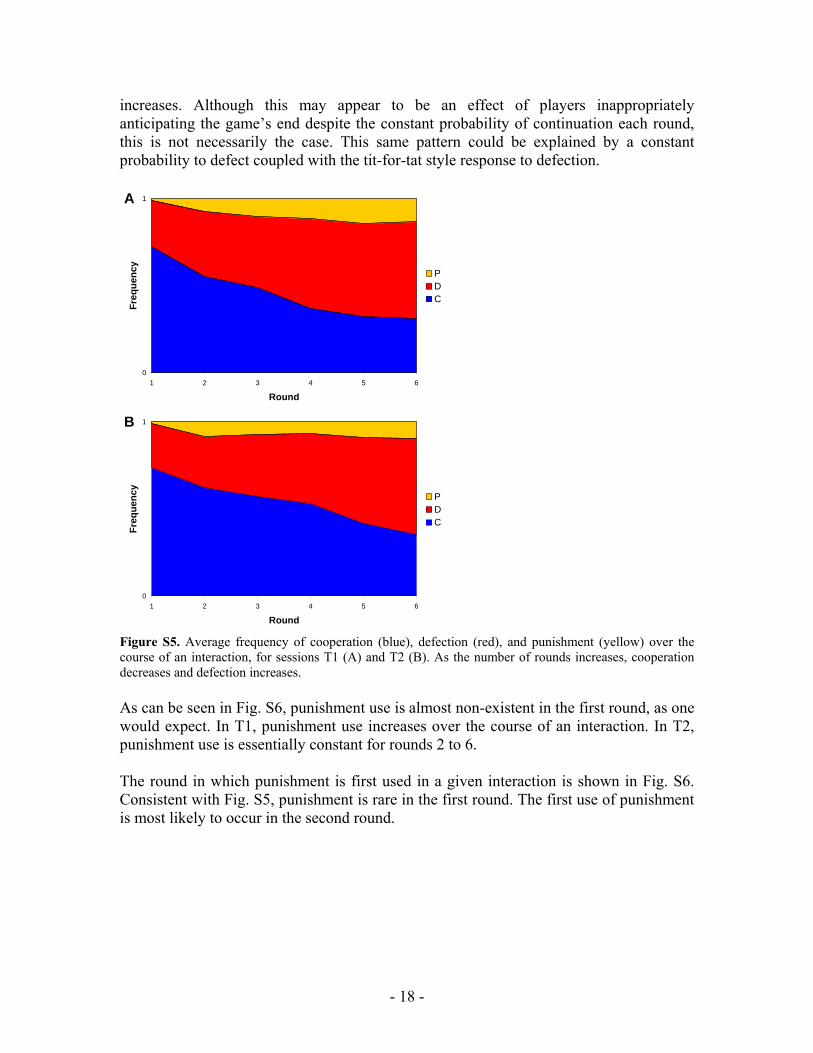
increases. Although this may appear to be an effect of players inappropriately anticipating the game’s end despite the constant probability of continuation each round, this is not necessarily the case. This same pattern could be explained by a constant probability to defect coupled with the tit-for-tat style response to defection.
0
1
1 2 3 4 5 6
Round
Freq
uenc
y
PDC
A
0
1
1 2 3 4 5 6
Round
Freq
uenc
y
PDC
B
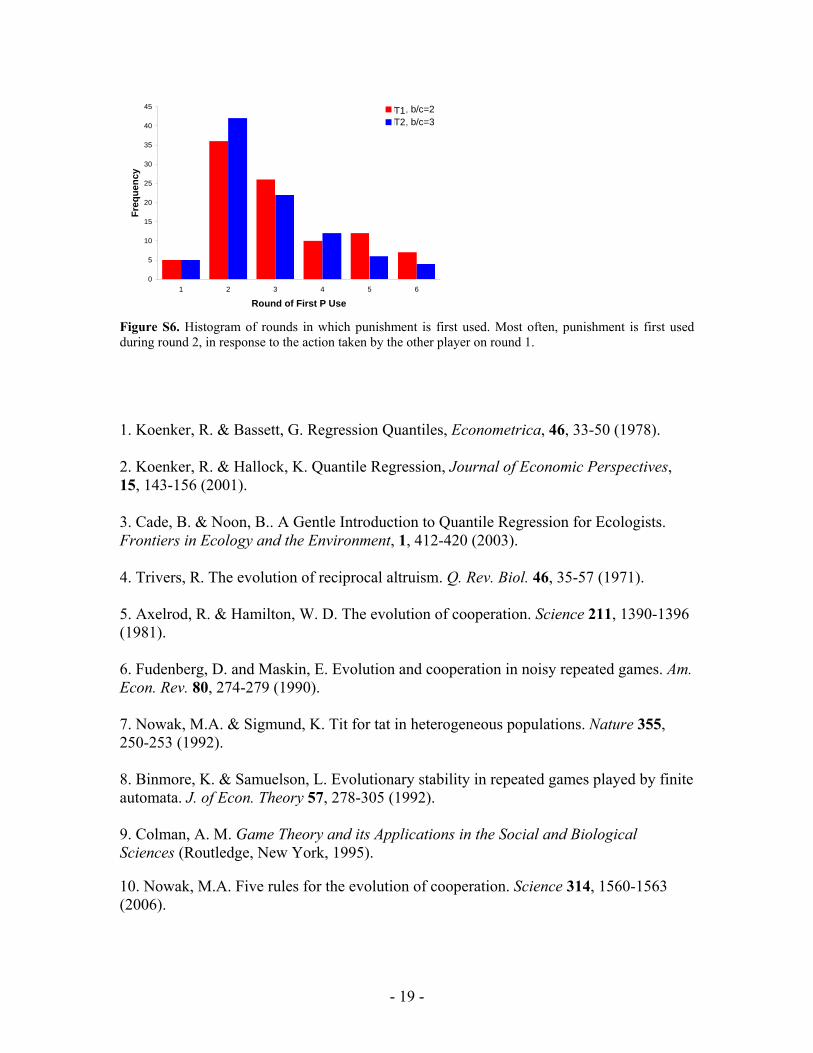
Figure S5. Average frequency of cooperation (blue), defection (red), and punishment (yellow) over the course of an interaction, for sessions T1 (A) and T2 (B). As the number of rounds increases, cooperation decreases and defection increases. As can be seen in Fig. S6, punishment use is almost non-existent in the first round, as one would expect. In T1, punishment use increases over the course of an interaction. In T2, punishment use is essentially constant for rounds 2 to 6. The round in which punishment is first used in a given interaction is shown in Fig. S6. Consistent with Fig. S5, punishment is rare in the first round. The first use of punishment is most likely to occur in the second round.
- 18 -
0
5
10
15
20
25
30
35
40
45
1 2 3 4 5 6
Round of First P Use
Freq
uenc
y
B1, b/c=2B2, b/c=3T1T2
Figure S6. Histogram of rounds in which punishment is first used. Most often, punishment is first used during round 2, in response to the action taken by the other player on round 1.
1. Koenker, R. & Bassett, G. Regression Quantiles, Econometrica, 46, 33-50 (1978).
2. Koenker, R. & Hallock, K. Quantile Regression, Journal of Economic Perspectives, 15, 143-156 (2001).
3. Cade, B. & Noon, B.. A Gentle Introduction to Quantile Regression for Ecologists. Frontiers in Ecology and the Environment, 1, 412-420 (2003).
4. Trivers, R. The evolution of reciprocal altruism. Q. Rev. Biol. 46, 35-57 (1971). 5. Axelrod, R. & Hamilton, W. D. The evolution of cooperation. Science 211, 1390-1396 (1981). 6. Fudenberg, D. and Maskin, E. Evolution and cooperation in noisy repeated games. Am. Econ. Rev. 80, 274-279 (1990). 7. Nowak, M.A. & Sigmund, K. Tit for tat in heterogeneous populations. Nature 355, 250-253 (1992). 8. Binmore, K. & Samuelson, L. Evolutionary stability in repeated games played by finite automata. J. of Econ. Theory 57, 278-305 (1992). 9. Colman, A. M. Game Theory and its Applications in the Social and Biological Sciences (Routledge, New York, 1995). 10. Nowak, M.A. Five rules for the evolution of cooperation. Science 314, 1560-1563 (2006).
- 19 -
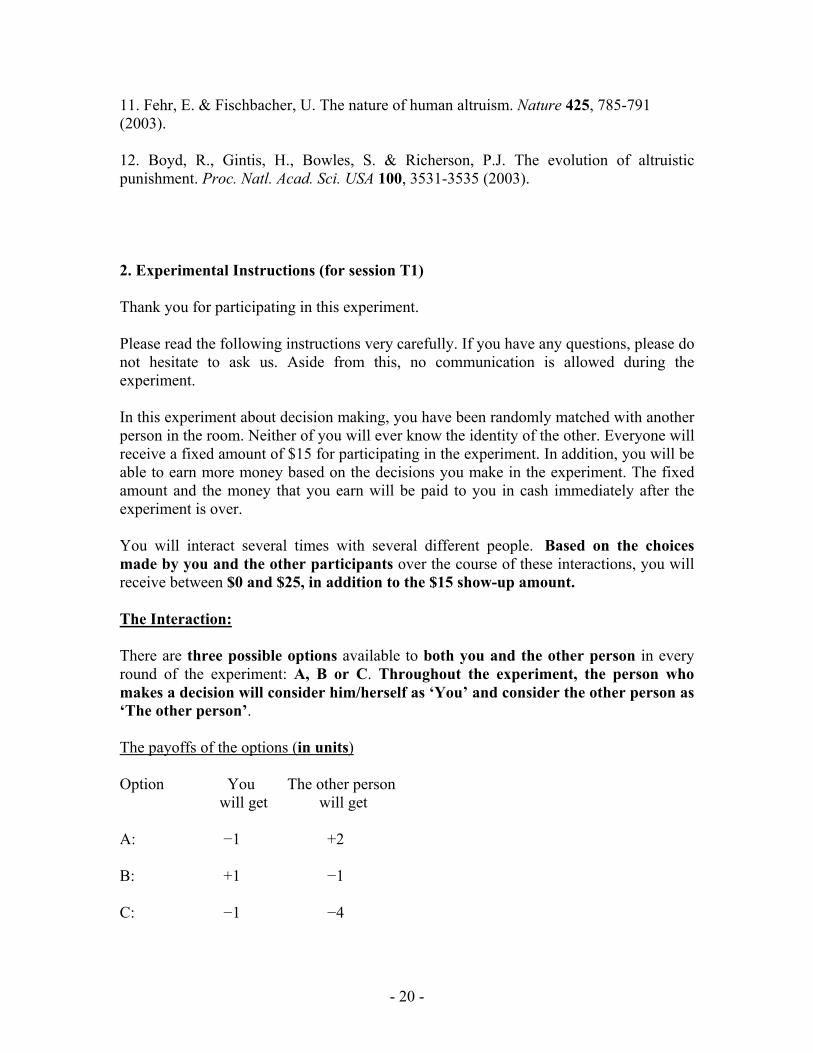
11. Fehr, E. & Fischbacher, U. The nature of human altruism. Nature 425, 785-791 (2003). 12. Boyd, R., Gintis, H., Bowles, S. & Richerson, P.J. The evolution of altruistic punishment. Proc. Natl. Acad. Sci. USA 100, 3531-3535 (2003). 2. Experimental Instructions (for session T1) Thank you for participating in this experiment. Please read the following instructions very carefully. If you have any questions, please do not hesitate to ask us. Aside from this, no communication is allowed during the experiment. In this experiment about decision making, you have been randomly matched with another person in the room. Neither of you will ever know the identity of the other. Everyone will receive a fixed amount of $15 for participating in the experiment. In addition, you will be able to earn more money based on the decisions you make in the experiment. The fixed amount and the money that you earn will be paid to you in cash immediately after the experiment is over. You will interact several times with several different people. Based on the choices made by you and the other participants over the course of these interactions, you will receive between $0 and $25, in addition to the $15 show-up amount. The Interaction: There are three possible options available to both you and the other person in every round of the experiment: A, B or C. Throughout the experiment, the person who makes a decision will consider him/herself as ‘You’ and consider the other person as ‘The other person’. The payoffs of the options (in units) Option You The other person
will get will get A: −1 +2 B: +1 −1 C: −1 −4
- 20 -

1 unit = $0.10 If you choose A then you will get −1 units, whereas the other person will get +2 units. If you choose B then you will get +1 units, whereas the other person will get −1 units. If you choose C then you will get −1 unit, whereas the other person will get −4 units.
- 21 -
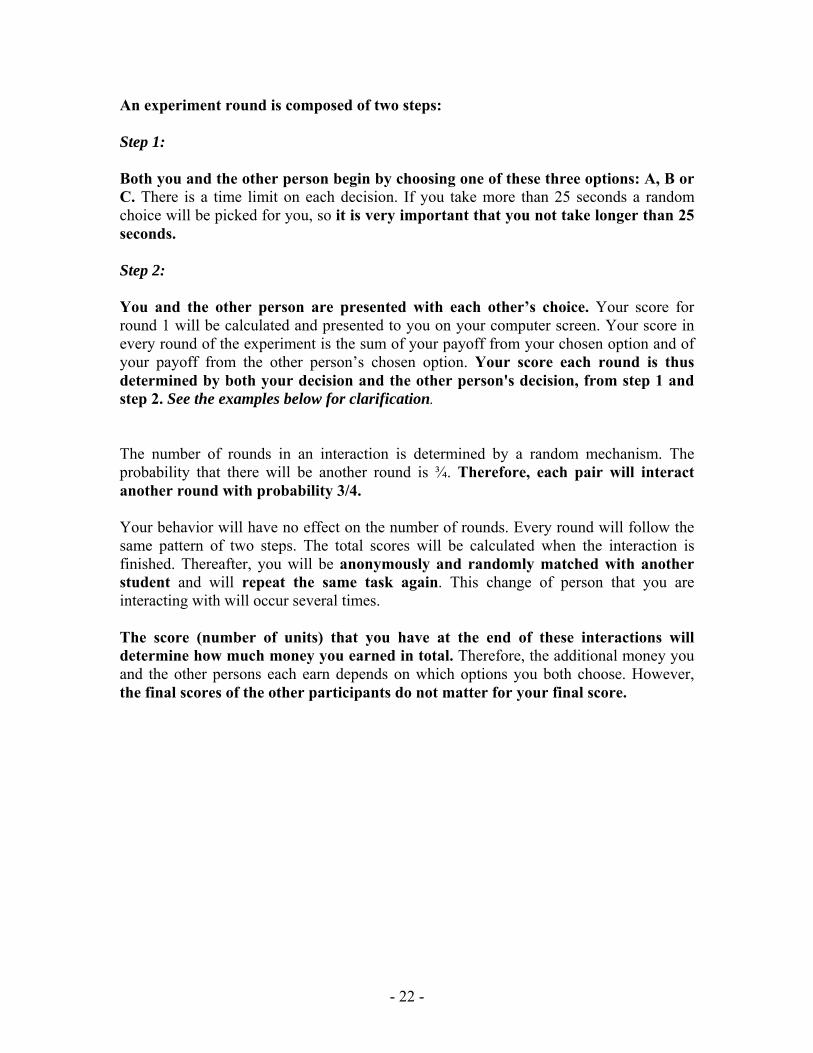
An experiment round is composed of two steps: Step 1: Both you and the other person begin by choosing one of these three options: A, B or C. There is a time limit on each decision. If you take more than 25 seconds a random choice will be picked for you, so it is very important that you not take longer than 25 seconds. Step 2: You and the other person are presented with each other’s choice. Your score for round 1 will be calculated and presented to you on your computer screen. Your score in every round of the experiment is the sum of your payoff from your chosen option and of your payoff from the other person’s chosen option. Your score each round is thus determined by both your decision and the other person's decision, from step 1 and step 2. See the examples below for clarification. The number of rounds in an interaction is determined by a random mechanism. The probability that there will be another round is ¾. Therefore, each pair will interact another round with probability 3/4. Your behavior will have no effect on the number of rounds. Every round will follow the same pattern of two steps. The total scores will be calculated when the interaction is finished. Thereafter, you will be anonymously and randomly matched with another student and will repeat the same task again. This change of person that you are interacting with will occur several times. The score (number of units) that you have at the end of these interactions will determine how much money you earned in total. Therefore, the additional money you and the other persons each earn depends on which options you both choose. However, the final scores of the other participants do not matter for your final score.
- 22 -
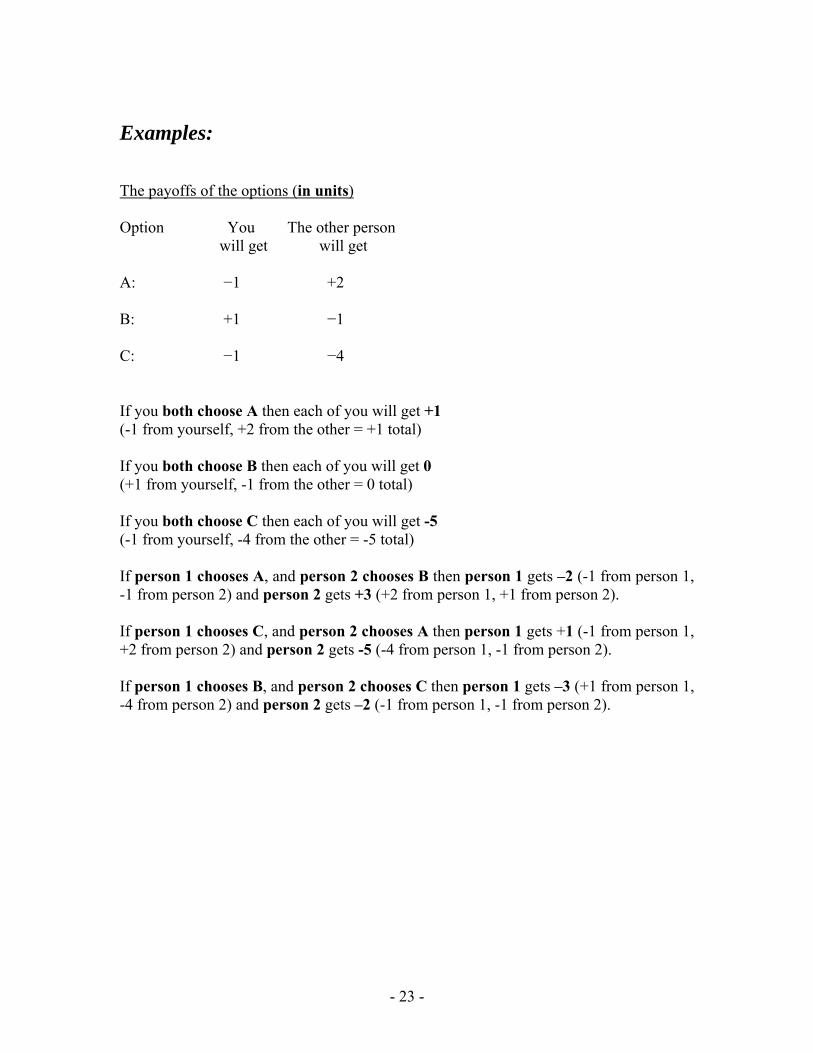
Examples: The payoffs of the options (in units) Option You The other person
will get will get A: −1 +2 B: +1 −1 C: −1 −4 If you both choose A then each of you will get +1 (-1 from yourself, +2 from the other = +1 total) If you both choose B then each of you will get 0 (+1 from yourself, -1 from the other = 0 total) If you both choose C then each of you will get -5 (-1 from yourself, -4 from the other = -5 total) If person 1 chooses A, and person 2 chooses B then person 1 gets –2 (-1 from person 1, -1 from person 2) and person 2 gets +3 (+2 from person 1, +1 from person 2). If person 1 chooses C, and person 2 chooses A then person 1 gets +1 (-1 from person 1, +2 from person 2) and person 2 gets -5 (-4 from person 1, -1 from person 2). If person 1 chooses B, and person 2 chooses C then person 1 gets –3 (+1 from person 1, -4 from person 2) and person 2 gets –2 (-1 from person 1, -1 from person 2).
- 23 -

- 24 -
Earning additional money: In addition to the $15 show-up fee, you will begin the experiment with an additional $5. This is the base line, which corresponds to 0 game units. Based on your decisions in this experiment, units will be added or subtracted from this initial amount. At the end of all the interactions, your total monetary payoff will be computed to determine the amount of money earned. If you have a total score of 0 after completing all the interactions, you will have earned the additional $5 in the experiment. If you have a total score above 0, the exchange rate will be 1 unit = $0.10. The maximum amount that you can earn will be $25, however, and this is rather unlikely to happen. If you have a total score of less than 0, the exchange rate will be 1 unit = $0.10, such that negative units will be withdrawn from the initial $5. However, you cannot lose more than the initial $5, so you will always walk away here with at least the $15 show-up fee.
1 unit = $0.10