will we be better off? - cmtalliance.org we be better off cmta...will we be better off? ... and...
TRANSCRIPT

Will We Be Better Off? Assessing the benefits of the BaltimoreLink plan
Central Maryland Transportation Alliance
The Central Maryland Transportation Alliance (Transportation Alliance) represents a diverse coalition of corporate and civic leaders uniting business, philanthropic and institutional sectors around a common agenda: improving and expanding transportation options for the citizens and businesses of Central Maryland. The Transportation Alliance is an initiative of the Baltimore Community Foundation. The Transportation Alliance hired Transportation for America to perform an accessibility analysis comparing existing Maryland Transit Administration (MTA) service in the Baltimore region with the service proposed under the second revision of the BaltimoreLink plan, released in July 2016.
Transportation for America (T4A) is an alliance of elected, business and civic leaders from communities across the country, united to ensure that states and the federal government step up to invest in smart, homegrown, locally-driven transportation solutions — because these are the investments that hold the key to our future economic prosperity. Transportation for America is a program of Smart Growth America. Acknowledgements This report was made possible by support from the Clayton Baker Trust, James L Shea, and the funders of the Central Maryland Transportation Alliance. We would like to thank partners at the Maryland Transit Administration, the Baltimore Metropolitan Council, the Baltimore City Department of Planning, Baltimore City Public Schools and Hack Baltimore for sharing data and insights. All errors and omissions are the authors'.
Contents
• Executive Summary 1 • Background 4 • Methodology 6 • Access to Jobs 10
o Access to All Jobs 10 o Access to High Opportunity Jobs 14 o Access to All Jobs for Low Composite
Opportunity Neighborhoods 18 o Access to High Opportunity Jobs for Low
Composite Opportunity Neighborhoods 23 o Access to Maryland Employment Centers 28
• Access to Essential Services 31 o Access to Schools 31 o Access to Food Sources for Individuals in
Food Deserts 35 • Recommendations 39 • Appendix A - Access to Jobs for Low Composite
Opportunity Neighborhoods 43 • Appendix B - Access to High Opportunity Jobs for
Low Composite Opportunity Neighborhoods 51 • Appendix C - Description of Citilabs’ Sugar
Access Analysis Tool 59
On October 22, 2015 the Maryland Transit Administration (MTA) released a new plan for transit service in the Baltimore region. “For the first time ever in history,” Governor Larry Hogan declared, “the people of Baltimore and the surrounding jurisdictions will be able to travel conveniently, efficiently, and affordably from where they live to where they work.” The plan, BaltimoreLink, was announced as a “transformative new vision for the future of transit in Baltimore City.” As longtime advocates for an overhaul of MTA’s outdated bus network, the Central Maryland Transportation Alliance urged stakeholders to seize the opportunity to bring about needed improvements and challenged the MTA to deliver them in measurable ways. Unfortunately, our independent analysis of BaltimoreLink shows that it doesn’t deliver the promised improvements. For example, the plan was said to be focused on “improved connections to regional employers and job centers.” However, this study finds that many key job centers, such as Woodlawn, Columbia, and Linthicum (BWI Business District) are worse off under BaltimoreLink. Promotional materials claimed that 745,000 jobs would be accessible from the new BaltimoreLink System, 131,000 more jobs would be accessible with high-frequency transit, and 76,000 new jobs would be accessible with new commuter connections. But these headline numbers do not tell the full story. While the MTA’s analysis looked at all jobs, this study looks at the types of jobs being accessed and whether they are in fast-growth industries that pay family-supporting wages. The analysis also examines how accessible these high growth jobs are for families living in poverty, with low educational attainment rates, and other economic-opportunity barriers. The study also examines how accessible schools, healthy food sources, and key job centers are on weekdays and weekends, comparing the current service to the proposed service under BaltimoreLink. Similar to the MTA’s own finding, this analysis finds that at the regional level access to all jobs and high opportunity jobs on a weekday, both for the entire population and those living in low opportunity neighborhoods, will not significantly increase under BaltimoreLink. Any marginal weekday gains are outweighed by losses in access to jobs on a weekend day for the average resident of the region. The loss of weekend service is critical because many high opportunity jobs are in industries that operate many shifts a day, seven days a week. Additionally, this study finds negligible improvements in access to Baltimore City Schools and access to healthy food options.
EXECUTIVE SUMMARY
1
Taken together, this study finds that BaltimoreLink represents a missed opportunity to address regional goals to connect households to jobs, schools, and essential services through transit.
• Weekend Service — Due to the loss in weekend jobs access we recommend that MTA thoroughly analyze the proposed changes to the weekend BaltimoreLink plan, present its findings, and provide a minimum amount of time for the public to review and comment. This analysis should target low- and middle-wage jobs that are more likely to employ residents relying on transit to access jobs on the weekend.
• Employment Centers — We recommend that MTA analyze and improve
the BaltimoreLink plan and the strategic investment it represents as a means to improve transit access to the state’s employment centers. The plan does not appear to make noticeable improvements to access for these essential economic centers. This strategy aligns with the Maryland Department of Transportation’s own long-term strategic plan that recommends providing efficient, frequent transit access between transit hubs and Maryland Economic Centers.
• Schools — Baltimore City families rely on the MTA to transport their
children to public middle schools and high schools. The BaltimoreLink plan does not appreciably increase the number of schools children can access by transit within 45 minutes or less. We recommend that MTA analyze school access in a more meaningful manner than the number of schools that will be near a bus route with 15-minute headways, such as measuring the number of schools accessible for all children and those in low composite opportunity neighborhoods.
• Healthy Foods — Baltimore City has recognized the critical need to
improve healthy food access for residents, 25 percent of whom live in areas identified as food deserts. The BaltimoreLink plan only marginally improves access to healthy food sources for those living in food deserts. Provided that food access disproportionately impacts children and African Americans, efforts should be made to better coordinate with the Baltimore City Department of Planning and Department of Health and the Baltimore Development Corporation to help overcome longstanding disinvestment in these neighborhoods to ensure connections to food options can be made through rapid transit.
• Baltimore City-MTA Coordination — Much of BaltimoreLink’s success in
terms of speed and reliability hinges on coordination of road space and traffic signals between MTA and the City of Baltimore’s Department of Transportation. Without dedicated bus lanes and traffic signal prioritization the potential benefits of this project may not be realized. It is inaccurate to anticipate reliable, rapid transit going through downtown without dedicated
2
right-of-way. A major portion of the cancelled Baltimore Red Line project’s budget was dedicated to an east-west downtown tunnel in order to mitigate downtown vehicle congestion. A memorandum of understanding or other agreement document should be signed by both parties before the planning process is complete to capture the benefits and hold both parties accountable for prioritizing transit over privately driven, single-occupancy vehicles, particularly in the downtown core.
Public oversight of MTA is needed The MTA’s Bus Network Improvement Project and the BaltimoreLink plan both lacked clear, accountable direction for how to assess the expected outcomes from the transportation investment. We strongly recommend that an MTA oversight board be established to improve accountability and transparency, which will give the public greater access to and understanding of important decisions impacting community development and the use of taxpayer dollars in MTA’s service area. More funding is needed to achieve the desired outcomes The $135 million plan is spread over six years with $70 million going toward operating expenses and $65 million toward capital expenses. Seventy million dollars over six years amounts to a 1.5 percent increase in the MTA’s annual operating budget. The BaltimoreLink plan’s funding appears inadequate to achieve improved access to jobs, schools and healthy food sources and according to the MTA’s analysis will not improve the region’s average travel time for transit trips. Creating the transformative changes needed likely cannot be achieved on a shoestring budget. Conclusion Overall, there is great variability in the outcomes from BaltimoreLink. Some people and neighborhoods may see better access and transit service while others will not. There will be winners and losers under BaltimoreLink and the MTA should not claim or imply that there are across-the-board benefits. Partly, this is because there were no clear measurable goals and outcomes identified at the outset. But this is also because the total amount of service being provided does not change all that much. The transit pie is not growing, it is just being re-sliced. The plan falls well short of what was promised in October 2015.
3

The Maryland Transit Administration (MTA), a state-led agency, runs the Baltimore, Maryland, region’s transit system. The MTA primarily serves the Baltimore metropolitan region that includes Anne Arundel County, Baltimore City, Baltimore County, Howard County, and other local jurisdictions. Transit service is provided via several modes: metro-subway, central light-rail, commuter-heavy rail (MARC), and local bus. The MTA is one of the busiest (highest ridership) transit systems in the country. Seventy-two percent of all MTA trips are served by bus,1 yet the MTA bus network is outdated, unreliable, inefficient, and poorly utilizes existing resources. The MTA’s bus network is primarily derived from decades-old original streetcar networks making these bus routes out-of-date and not reflective of current land uses, population, job centers, and commuting habits. As a result, a typical resident of the region can reach only 11 percent of all jobs via transit in under one hour. Forty two percent of all reports logged by MTA riders using the Rate Your Ride service are for transit vehicles that were late or skipped a stop.2 Baltimore leaders and MTA officials have known for years that a major overhaul is needed to reinvent and to better provide transit service for the region’s residents and businesses, especially for the bus network. In October 2015, Governor Hogan and the MTA released the BaltimoreLink plan, with the stated goals of improving access to jobs and increasing speed, efficiency, and reliability. The Governor announced $135 million for BaltimoreLink to be spent over six years with $70 million going towards operating expenses and $65 million towards capital expenses. The operating expenses will primarily go to new personnel expenses with the creation of 130 new positions, enhanced service on the quick bus 40, and commuter bus service. The capital improvements aim to improve the bus system primarily by adding transfer facilities, installing transit signal priority technology, and planning dedicated bus lanes, in addition to improvements including new vehicles, signage, and maps. It should be noted BaltimoreLink has received no new funds from the Maryland Transportation Trust Fund; the $135 million comes from funds repurposed from a Maryland Ports Administration project, from cost-savings on a metro subway project, and from federal transportation funding. The BaltimoreLink plan includes an overhaul of the MTA’s bus routes, which is largely based on analysis done for the 2014 Bus Network Improvement Project (BNIP) bus realignment and consolidation program initiated under the administration of Gov. Martin O’Malley, but never completed. BNIP was an 18-
1 http://www.apta.com/resources/statistics/Documents/Ridership/2016-q1-ridership-APTA.PDF 2 http://www.cmtalliance.org/reportcard/
BACKGROUND
4
month outreach, planning, and analysis project to update the outdated Baltimore bus system. The BaltimoreLink plan will realign the MTA bus network with three major service changes:
1. CityLink - 12 new high-frequency, color-coded, branded, 24-hour local service buses that will connect with existing MTA service including metro rail, light rail, and MARC;
2. LocalLink - Redesign of existing bus routes to provide better connections to neighborhoods and community services; and
3. Express BusLink - Regional express service between suburban job centers.
BaltimoreLink will also coincide with the delivery of the $27.3 million North Avenue redesign that in 2016 received a $10 million federal TIGER grant award. The North Avenue project will leverage the BaltimoreLink plan’s investments by improving bus shelters, pedestrian crosswalks, sidewalks, transit signal prioritization, dedicated bus-only lanes, and metro station improvements in one of the City’s most highly-used corridors. The BaltimoreLink plan is not without controversy. Following the Governor’s cancellation of the federally-funded Baltimore Red Line light rail project in June 2015, many Baltimore leaders viewed the BaltimoreLink plan as an insufficient solution to address the severe east-west public transportation deficiencies in the city. Additionally, many question the BaltimoreLink plan’s ability to catalyze economic development benefits with the same returns that the Baltimore Red Line was anticipated to provide. Lastly BaltimoreLink relies on Baltimore City Department of Transportation dedicating roadway space to bus-only lanes that would negatively impact downtown traffic and congestion. Avoiding congestion was a major reason the Baltimore Red Line would have tunneled under downtown. In July 2016 MTA released BaltimoreLink Draft #2 that incorporated comments from the public outreach process conducted from October 2015 through January 2016. According to MTA, the BaltimoreLink Draft #2 proposal will increase access to jobs and other essential services for the region, while maintaining the status quo for average travel times for transit riders. The comment period for Draft #2 will end in early fall 2016 with a full launch of BaltimoreLink anticipated in Summer 2017.
5

The project team utilized Sugar Access, an ArcGIS-based accessibility measurement tool developed by Citilabs, to perform the analysis described in this report. Sugar Access analyzes the accessibility of origins in a community, such as residential neighborhoods, to everyday destinations such as jobs and schools. The tool can perform these calculations for driving, public transit, walking, or bicycling, based on the existing transportation network or proposed changes. Sugar Access offers several types of calculations, each providing a different measurement of accessibility. Each calculation generates GIS data layers and maps (see appendix C for more details). The project team obtained General Transit Feed Specification (GTFS) data files from MTA for the MTA public transit network for both existing service and the planned service under the BaltimoreLink plan’s version 2.0 published in July 2016. The MTA core service area covered by the files includes Baltimore City and parts of Baltimore County, Anne Arundel County, and Howard County. The project team also held phone calls with MTA and its BaltimoreLink project consultants to better understand the data and base assumptions used by MTA. MTA asked the project team to recognize that the GTFS data files for existing service, and the published schedules on which they were based, do not accurately represent actual service times on the ground as some trips are delayed, eliminated entirely when a driver or bus is unavailable, or there are unforeseen traffic or construction conditions. To compensate, the baseline model uses adjusted run times based on deviation from the schedule observed by MTA in the fall of 2015, taking into account both time of day (morning, afternoon, or evening) and day of the week (weekday or weekend). To model future service this analysis used GTFS data provided by MTA and assumed 100% on-time performance. The project team incorporated several GIS data layers for use with this analysis:
• Baltimore Opportunity Collaborative’s Composite Opportunity Index: The Index is a regional measure considering indicators in six categories, including access to employment, transportation and education. These categories are designed to rate the level of opportunity available to residents of each Census Tract.
• High Opportunity Jobs per square mile by neighborhood: This layer, provided by the Baltimore Metropolitan Council, reflects the quantity of jobs in each neighborhood in the six industries identified as high opportunity by the Opportunity Collaborative. These high opportunity industries generally offer well-paying jobs for mid- and low-skilled workers and opportunities to advance positions through on-the-job training.
METHODOLOGY
6

• Public schools in the study area: The project team received a GIS layer with all Baltimore City Public Schools identified. The team created a new GIS layer containing only the middle schools (grades 6-8) and high schools (9-12) within each jurisdiction. The team also included elementary schools in the new layer if they also served students in grade 6 or higher. As only Baltimore City public schools uses MTA to bus their students this was the only jurisdiction analyzed.
• Food deserts: This layer identifies areas of Baltimore City with great distances to a supermarket, low median household incomes, and low vehicle availability.
• Healthy Food Sources: This layer includes grocery stores and other retail locations that have been assigned a healthy food availability index (HFAI) score based on the availability of healthy foods for purchase.
• Maryland’s Employment Centers: This GIS layer, provided by the National Center for Smart Growth (NCSG), indicates the location of the 23 employment centers in the State of Maryland that are major drivers of the Maryland economy. The project team identified the 10 employment centers that are within the MTA core service area.
Study Area The project team performed analysis using Sugar Access on a study area including all of Baltimore City, and portions of Baltimore County, Anne Arundel and Howard Counties where MTA local bus, commuter bus, light rail, and/or Metro subway operate. This analysis was completed at the Census block level (as opposed to geographically larger Census designations such as block groups or tracts) in order to obtain the most precise results. Sugar Access Analysis The T4A team performed the following analysis in Sugar Access:
• Destination summations calculating both existing MTA transit service and future BaltimoreLink service:
o All jobs counted in the 2014 Longitudinal Employer Household Dynamics (LEHD) data from the US Census Bureau, including federal workers and self-employed
o High opportunity jobs, as described above o Maryland Employment Centers o Schools (both Middle Schools and High Schools)
For each of the above, Sugar Access calculated the number of jobs or other destinations accessible from each Census block in the study area within 45 minutes of travel time. The T4A team chose this threshold because it reflects the
7
travel time used in the Transportation Alliance’s 2015 Transportation Report Card.3 As this report card notes: “The Baltimore Neighborhood Indicators Alliance has found a strong correlation between neighborhoods where the highest percentage of workers commute at least 45 minutes and neighborhoods showing signs of distress including the highest levels of unemployment and poverty and the lowest life expectancies.” Further, using a threshold of 45 minutes approximates MTA’s own estimates of average transit travel time of 52 minutes on both the existing MTA service as well as on BaltimoreLink service. Travel Time analysis was calculated for Maryland Employment Centers, Schools, and Grocery Stores including Baltimore City as a whole as well as the identified food deserts as described above. The project team performed all analysis except for grocery store access using an AM peak travel period defined as 6am to 9am on weekdays. For weekends, the project team used Sunday mornings 7am to 10am. For grocery store access, the project team used a PM peak travel period of 3pm to 6pm on weekdays and 4pm to 7pm on Sundays for the weekend analysis. The later peak periods on weekends account for the later start time for these jobs, particularly on Sundays. The project team modeled grocery store trips as PM trips because they are more representative of times that people generally purchase groceries. The project team calculated the population-weighted average across all Census blocks within defined geographic boundaries (e.g. county, city, neighborhood, etc.) for each of the destination summation analyses completed. The analysis compared current MTA service in the Baltimore area to the BaltimoreLink plan. The difference represents the change in jobs and schools accessible for the average person within the geographically defined boundary. The project team also calculated the number of residents able to access destinations by transit within a set travel time for different destinations (e.g. 45 minutes for jobs and schools). This calculation was executed for Maryland Employment Centers, schools and grocery stores. Individual Census blocks were used as reference points for Employment Centers. The project team selected reference Census blocks that have access to transit and are near a high number of jobs for each of the Employment Centers. School addresses were used as reference points. The project team assumed most residents frequent their nearest grocery store or healthy food source, with the addresses for these destinations acting as the reference point for this calculation. The difference represents the change in the number of residents who can access the various destinations within a set time period.
3 http://www.cmtalliance.org/reportcard/
8
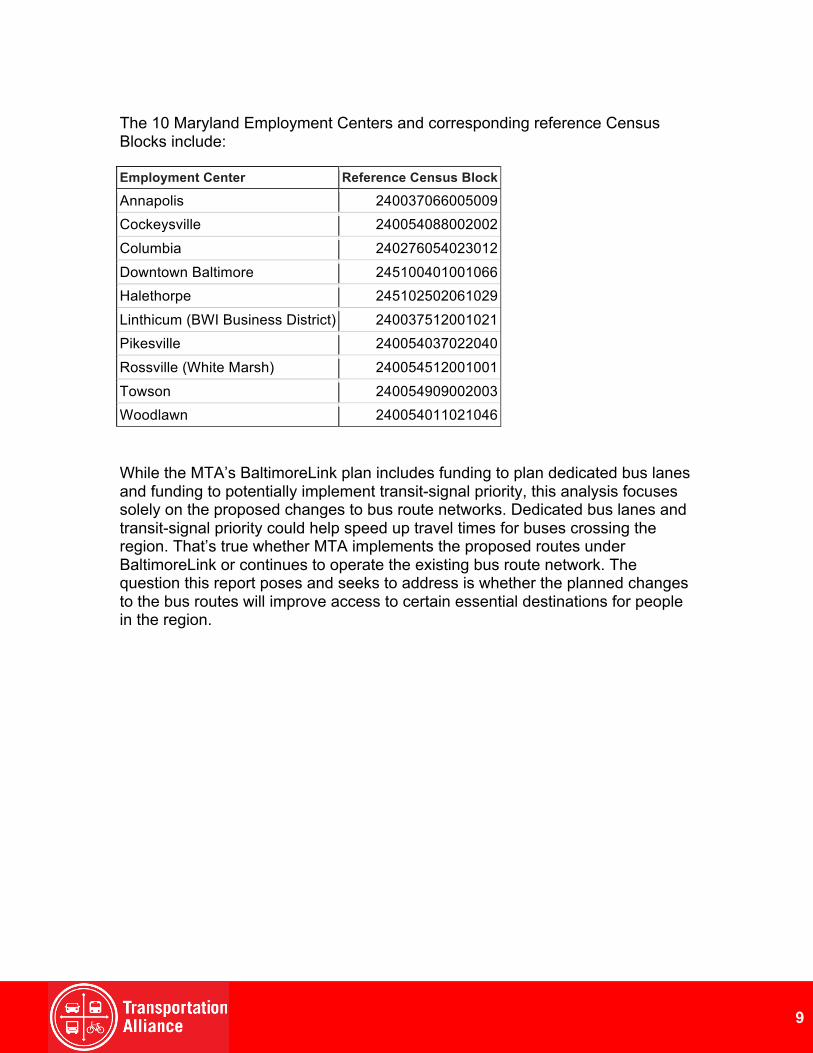
The 10 Maryland Employment Centers and corresponding reference Census Blocks include: Employment Center Reference Census Block
Annapolis 240037066005009
Cockeysville 240054088002002
Columbia 240276054023012
Downtown Baltimore 245100401001066
Halethorpe 245102502061029
Linthicum (BWI Business District) 240037512001021
Pikesville 240054037022040
Rossville (White Marsh) 240054512001001
Towson 240054909002003
Woodlawn 240054011021046 While the MTA’s BaltimoreLink plan includes funding to plan dedicated bus lanes and funding to potentially implement transit-signal priority, this analysis focuses solely on the proposed changes to bus route networks. Dedicated bus lanes and transit-signal priority could help speed up travel times for buses crossing the region. That’s true whether MTA implements the proposed routes under BaltimoreLink or continues to operate the existing bus route network. The question this report poses and seeks to address is whether the planned changes to the bus routes will improve access to certain essential destinations for people in the region.
9

According to MTA, the proposed BaltimoreLink plan would increase the number of jobs accessible by transit across the Baltimore service area by 20 percent for trips less than 30 minutes, 12 percent for trips less than 45 minutes and 8 percent for trips less than 60 minutes. Like the MTA, the project team analyzed the impact that the BaltimoreLink plan will have on people’s access to all jobs in MTA’s Baltimore service area. Not all jobs are created equal and not all neighborhoods have the same access to opportunity, however. Therefore, the project team expanded its jobs accessibility analysis to include the following assessments:
• Change in jobs accessible within 45 minutes by transit for the average resident on a weekday and weekend day in the MTA Baltimore service area;
• Change in high opportunity jobs accessible within 45 minutes by transit for the average resident on a weekday and weekend day in the MTA Baltimore service area;
• Change in jobs accessible within 45 minutes by transit for the average resident in a low composite opportunity neighborhood on a weekday and weekend day in the MTA Baltimore service area;
• Change in high opportunity jobs accessible within 45 minutes by transit for the average resident in a low composite opportunity neighborhood on a weekday and weekend day in the MTA Baltimore service area; and,
• Change in number of residents that can access certain Maryland Employment Centers within 45 minutes by transit on a weekday and weekend day.
ACCESS TO ALL JOBS When compared with existing MTA service, the BaltimoreLink plan provides a marginal increase in access to jobs by transit during the weekday when compared to current service, while decreasing access to jobs on the weekend. The average resident in MTA’s Baltimore service area would be able to access 500 more jobs by transit within 45 minutes during the week, but would lose access to nearly 5,800 jobs on weekends. The impacts vary by county. The average Anne Arundel County and Baltimore City residents would experience increased access to jobs during the week, while the average Howard and Baltimore County residents lose access to jobs during the week. During the weekend, the average residents in Baltimore City and Baltimore County would lose access to jobs under the BaltimoreLink plan. The maps below show the difference in accessibility to all jobs between existing service and the BaltimoreLink plan.
ACCESS TO JOBS
10
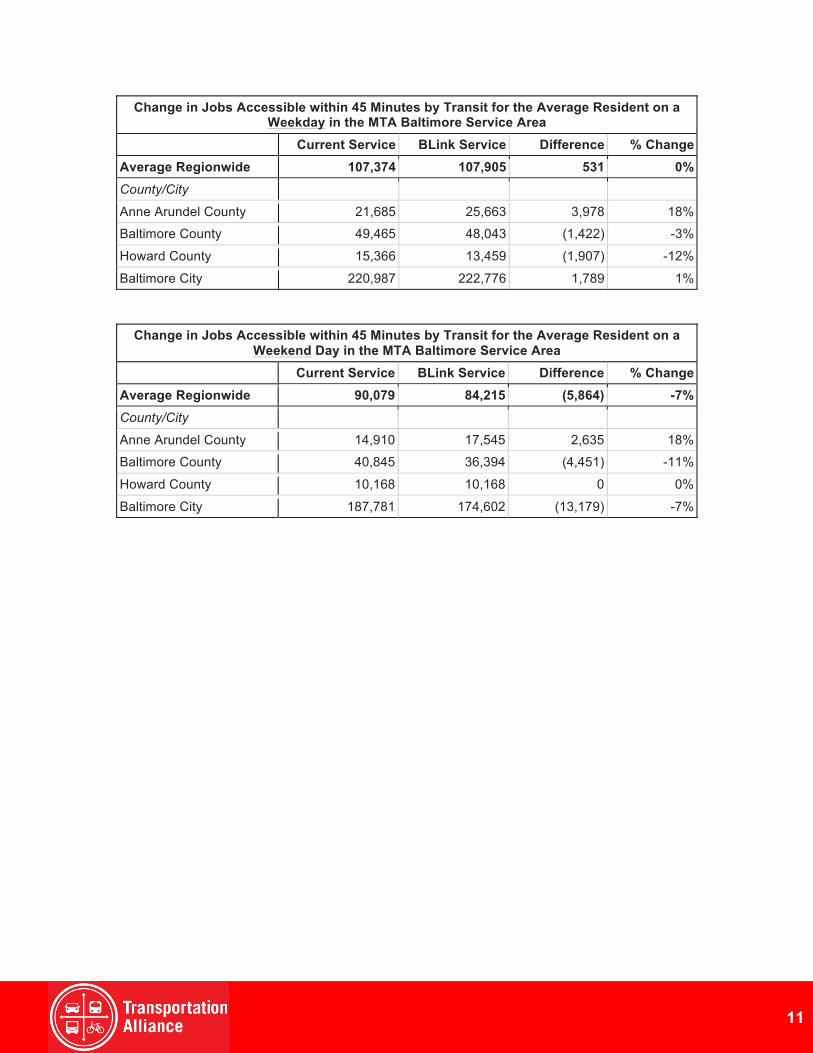
Change in Jobs Accessible within 45 Minutes by Transit for the Average Resident on a Weekday in the MTA Baltimore Service Area
Current Service BLink Service Difference % Change
Average Regionwide 107,374 107,905 531 0%
County/City
Anne Arundel County 21,685 25,663 3,978 18% Baltimore County 49,465 48,043 (1,422) -3%
Howard County 15,366 13,459 (1,907) -12%
Baltimore City 220,987 222,776 1,789 1%
Change in Jobs Accessible within 45 Minutes by Transit for the Average Resident on a Weekend Day in the MTA Baltimore Service Area
Current Service BLink Service Difference % Change
Average Regionwide 90,079 84,215 (5,864) -7%
County/City
Anne Arundel County 14,910 17,545 2,635 18% Baltimore County 40,845 36,394 (4,451) -11%
Howard County 10,168 10,168 0 0%
Baltimore City 187,781 174,602 (13,179) -7%
11

12

14 13
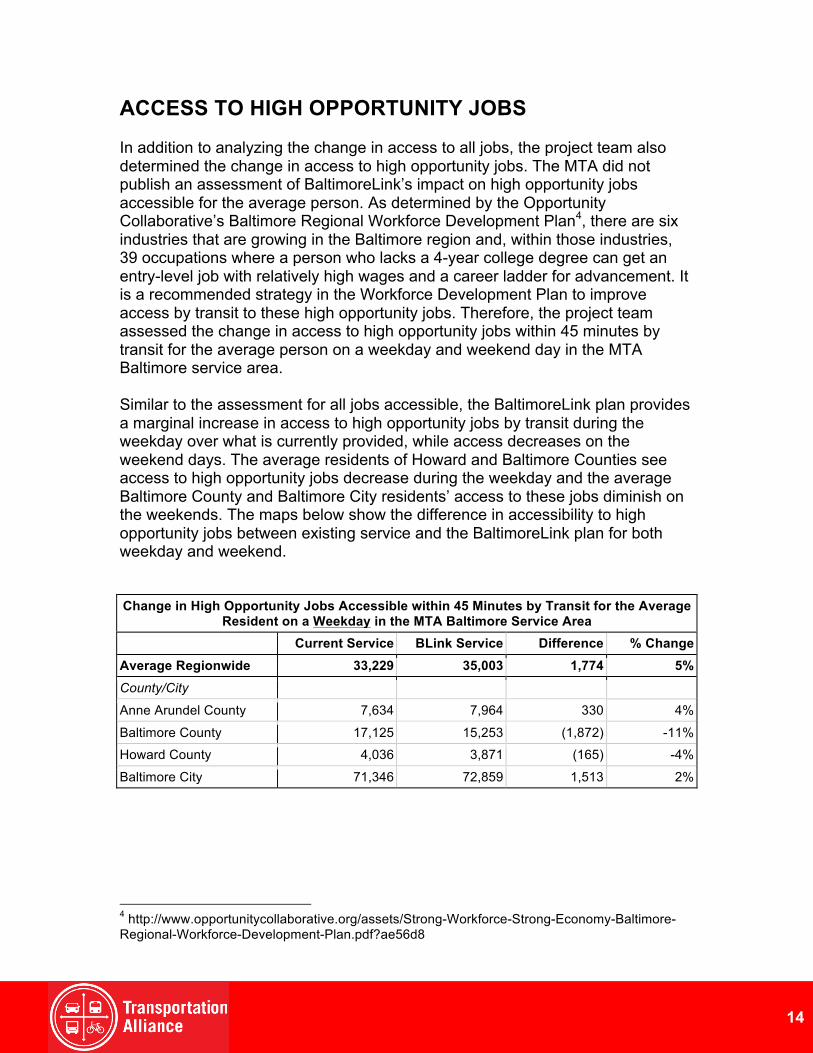
ACCESS TO HIGH OPPORTUNITY JOBS In addition to analyzing the change in access to all jobs, the project team also determined the change in access to high opportunity jobs. The MTA did not publish an assessment of BaltimoreLink’s impact on high opportunity jobs accessible for the average person. As determined by the Opportunity Collaborative’s Baltimore Regional Workforce Development Plan4, there are six industries that are growing in the Baltimore region and, within those industries, 39 occupations where a person who lacks a 4-year college degree can get an entry-level job with relatively high wages and a career ladder for advancement. It is a recommended strategy in the Workforce Development Plan to improve access by transit to these high opportunity jobs. Therefore, the project team assessed the change in access to high opportunity jobs within 45 minutes by transit for the average person on a weekday and weekend day in the MTA Baltimore service area. Similar to the assessment for all jobs accessible, the BaltimoreLink plan provides a marginal increase in access to high opportunity jobs by transit during the weekday over what is currently provided, while access decreases on the weekend days. The average residents of Howard and Baltimore Counties see access to high opportunity jobs decrease during the weekday and the average Baltimore County and Baltimore City residents’ access to these jobs diminish on the weekends. The maps below show the difference in accessibility to high opportunity jobs between existing service and the BaltimoreLink plan for both weekday and weekend. Change in High Opportunity Jobs Accessible within 45 Minutes by Transit for the Average
Resident on a Weekday in the MTA Baltimore Service Area
Current Service BLink Service Difference % Change
Average Regionwide 33,229 35,003 1,774 5%
County/City
Anne Arundel County 7,634 7,964 330 4%
Baltimore County 17,125 15,253 (1,872) -11% Howard County 4,036 3,871 (165) -4%
Baltimore City 71,346 72,859 1,513 2%
4 http://www.opportunitycollaborative.org/assets/Strong-Workforce-Strong-Economy-Baltimore-Regional-Workforce-Development-Plan.pdf?ae56d8
14

Change in High Opportunity Jobs Accessible within 45 Minutes by Transit for the Average
Resident on a Weekend Day in the MTA Baltimore Service Area
Current Service BLink Service Difference % Change
Average Regionwide 29,588 26,981 (2,607) -9%
County/City
Anne Arundel County 5,347 5,676 329 6% Baltimore County 14,127 12,074 (2,053) -15%
Howard County 2,839 2,839 0 0%
Baltimore City 60,712 55,983 (4,729) -8%
15

16

17
ACCESS TO ALL JOBS FOR LOW COMPOSITE OPPORTUNITY NEIGHBORHOODS
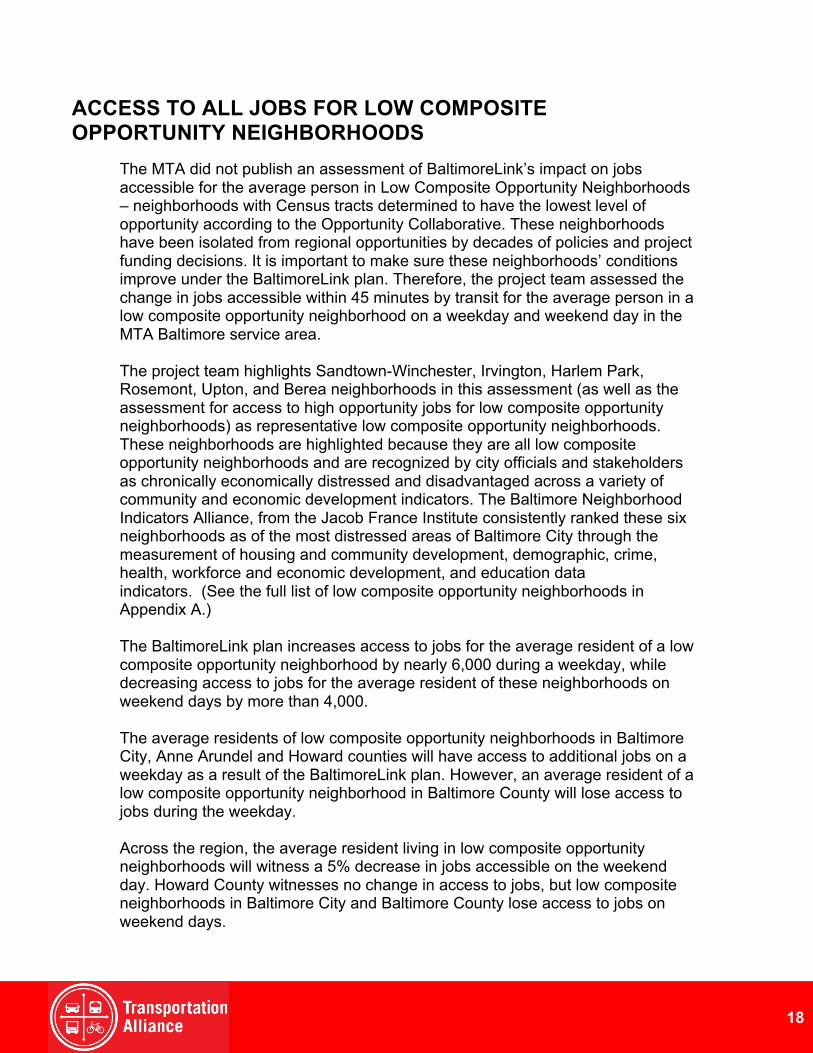
The MTA did not publish an assessment of BaltimoreLink’s impact on jobs accessible for the average person in Low Composite Opportunity Neighborhoods – neighborhoods with Census tracts determined to have the lowest level of opportunity according to the Opportunity Collaborative. These neighborhoods have been isolated from regional opportunities by decades of policies and project funding decisions. It is important to make sure these neighborhoods’ conditions improve under the BaltimoreLink plan. Therefore, the project team assessed the change in jobs accessible within 45 minutes by transit for the average person in a low composite opportunity neighborhood on a weekday and weekend day in the MTA Baltimore service area. The project team highlights Sandtown-Winchester, Irvington, Harlem Park, Rosemont, Upton, and Berea neighborhoods in this assessment (as well as the assessment for access to high opportunity jobs for low composite opportunity neighborhoods) as representative low composite opportunity neighborhoods. These neighborhoods are highlighted because they are all low composite opportunity neighborhoods and are recognized by city officials and stakeholders as chronically economically distressed and disadvantaged across a variety of community and economic development indicators. The Baltimore Neighborhood Indicators Alliance, from the Jacob France Institute consistently ranked these six neighborhoods as of the most distressed areas of Baltimore City through the measurement of housing and community development, demographic, crime, health, workforce and economic development, and education data indicators. (See the full list of low composite opportunity neighborhoods in Appendix A.) The BaltimoreLink plan increases access to jobs for the average resident of a low composite opportunity neighborhood by nearly 6,000 during a weekday, while decreasing access to jobs for the average resident of these neighborhoods on weekend days by more than 4,000. The average residents of low composite opportunity neighborhoods in Baltimore City, Anne Arundel and Howard counties will have access to additional jobs on a weekday as a result of the BaltimoreLink plan. However, an average resident of a low composite opportunity neighborhood in Baltimore County will lose access to jobs during the weekday. Across the region, the average resident living in low composite opportunity neighborhoods will witness a 5% decrease in jobs accessible on the weekend day. Howard County witnesses no change in access to jobs, but low composite neighborhoods in Baltimore City and Baltimore County lose access to jobs on weekend days.
18

In each of the six low composite opportunity neighborhoods highlighted by this study, residents currently have access to more jobs than is the average across the region on both weekdays and weekend days. This remains unchanged under the BaltimoreLink plan. Five of the six neighborhoods gain access to jobs during the weekday, with Sandtown-Winchester losing access to 15,000 jobs on average. On the weekend, three of the six neighborhoods lose access to jobs on average. Irvington expects to see a 50% increase access to jobs on average. Change in Jobs Accessible within 45 Minutes by Transit for the Average Resident in a Low
Composite Opportunity Neighborhood on a Weekday in the MTA Baltimore Service Area
Current Service
BLink Service Difference % Change
Average All Low Opportunity Neighborhoods Regionwide 112,930 118,708 5,778 5%
County/City
Anne Arundel County 16,295 20,570 4,275 26%
Baltimore County 50,078 45,906 (4,172) -8%
Howard County 19,978 22,836 2,858 14% Baltimore City 220,034 236,728 16,694 8%
Profiled Low Opportunity Index Neighborhoods
Sandtown-Winchester 292,856 277,656 (15,201) -5%
Irvington 214,428 220,906 6,478 3% Harlem Park 255,978 270,364 14,385 6%
Rosemont 232,841 247,846 15,005 6%
Upton 289,256 306,306 17,050 6%
Berea 241,580 259,893 18,313 8%
19
Change in Jobs Accessible within 45 Minutes by Transit for the Average Resident in a Low
Composite Opportunity Neighborhood on a Weekend Day in the MTA Baltimore Service Area
Current Service
BLink Service Difference % Change
Average All Low Opportunity Neighborhoods Regionwide 94,675 90,413 (4,262) -5%
County/City
Anne Arundel County 11,854 16,045 4,191 35%
Baltimore County 42,797 33,011 (9,786) -23%
Howard County 16,854 16,854 0 0%
Baltimore City 184,339 182,161 (2,178) -1%
Profiled Low Opportunity Index Neighborhoods
Rosemont 183,162 144,301 (38,861) -21%
Harlem Park 242,401 225,633 (16,769) -7%
Sandtown-Winchester 259,130 251,029 (8,101) -3%
Upton 257,776 258,352 576 0% Berea 223,145 226,235 3,090 1%
Irvington 138,560 207,370 68,810 50%
20

21

22
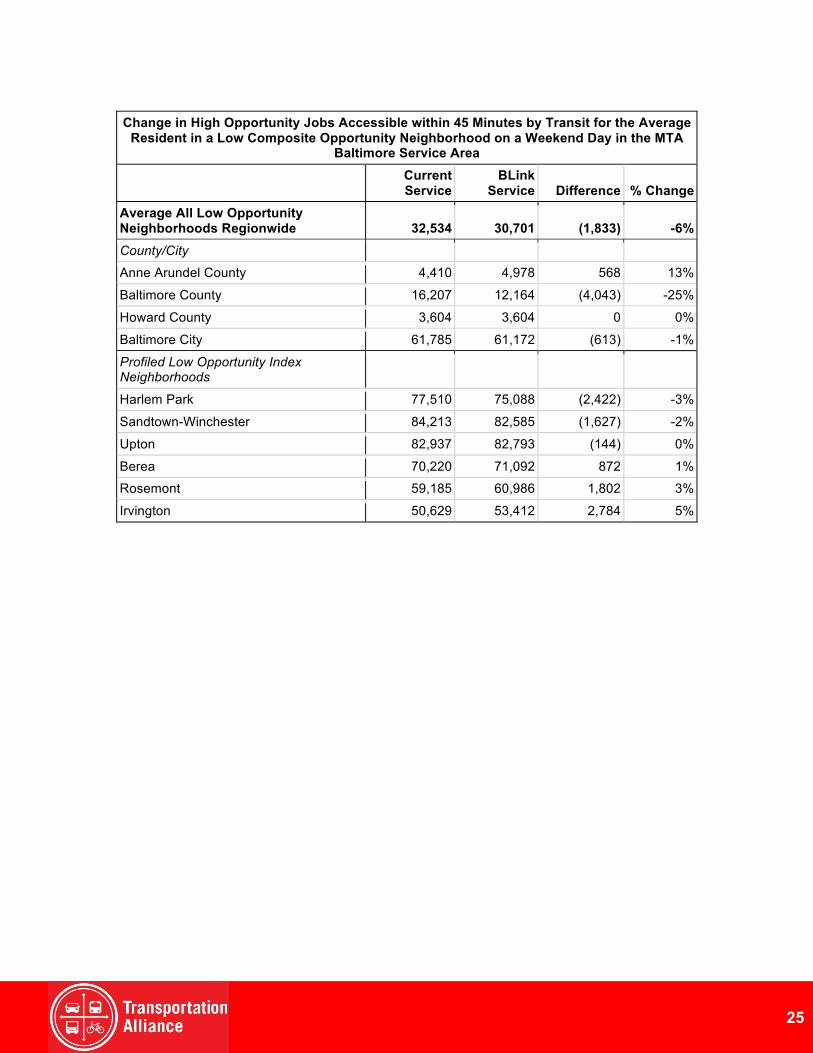
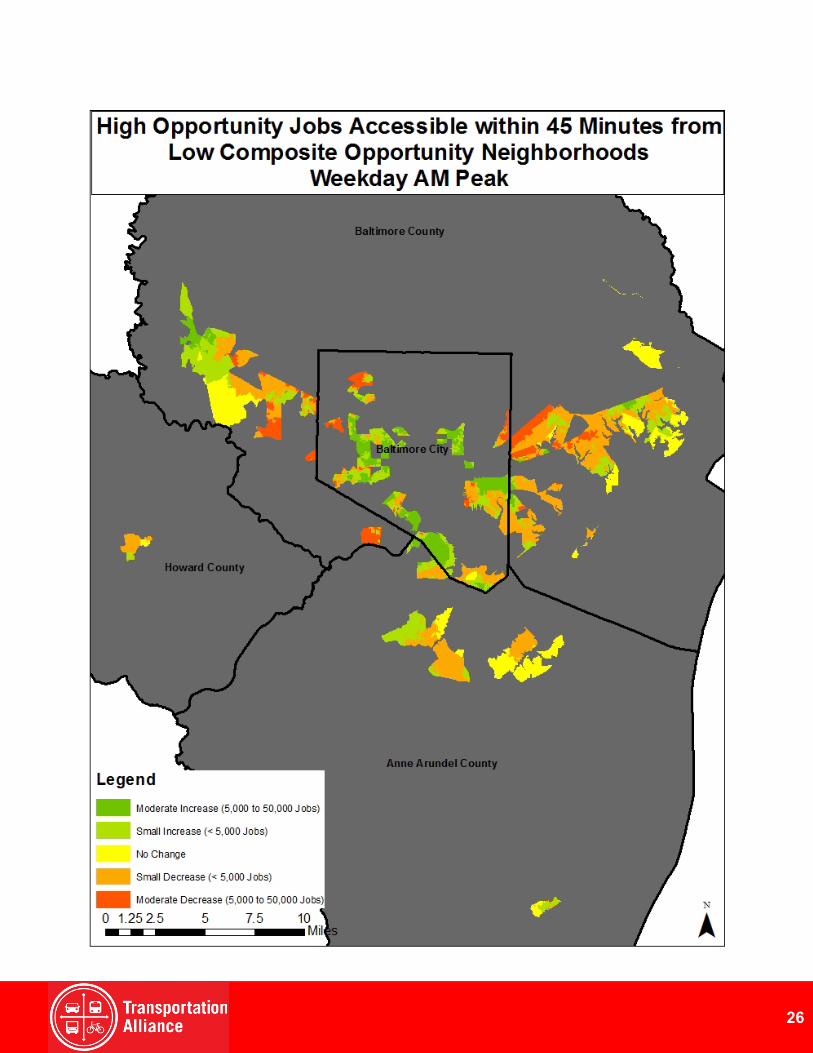
ACCESS TO HIGH OPPORTUNITY JOBS FOR LOW COMPOSITE OPPORTUNITY NEIGHBORHOODS Access to high opportunity jobs as defined by the Opportunity Collaborative is particularly important for low-skilled and mid-skilled workers. The project team wanted to examine what impact the BaltimoreLink plan will have on access to high opportunity jobs from neighborhoods identified as having relatively less access to opportunity. The MTA did not publish an assessment of BaltimoreLink’s impact on high opportunity jobs accessible for the average person in Low Composite Opportunity Neighborhoods. The project team assessed the change in high opportunity jobs accessible within 45 minutes by transit for the average person in a low composite opportunity neighborhood on a weekday and weekend day in the MTA Baltimore service area. The trend witnessed for jobs accessible for low composite opportunity neighborhoods is consistent for high opportunity jobs. The average resident living in a low composite opportunity neighborhood will gain access to 1,200 high opportunity jobs on a weekday, but lose access to 1,800 high opportunity jobs on a weekend day. Baltimore and Howard counties both lose access to high opportunity jobs on a weekday, but Baltimore County’s decrease is larger with a loss of more than 2,000 high opportunity jobs on average. Baltimore City residents living in low opportunity neighborhoods will gain access to 5,000 high opportunity jobs on a weekday, on average. Howard County residents living in low composite opportunity neighborhoods will witness no change in access to high opportunity jobs on a weekend day, while the average resident living in Baltimore City’s and Baltimore County’s low composite opportunity neighborhoods lose access to jobs. Baltimore City will lose access to 600 high opportunity jobs and Baltimore County residents will lose access to 4,000 high opportunity jobs on the weekend days, on average. All six of the low composite opportunity neighborhoods that the project team highlights gain access to high opportunity jobs on weekdays under the BaltimoreLink plan. The largest increase is seen in Harlem Park where the average resident will gain access to nearly 13,000 additional high opportunity jobs on a weekday. Similar to all jobs, three of the six neighborhoods lose access to jobs on the weekend day, on average.
23

Change in High Opportunity Jobs Accessible within 45 Minutes by Transit for the Average
Resident in a Low Composite Opportunity Neighborhood on a Weekday in the MTA Baltimore Service Area
Current Service
BLink Service Difference % Change
Average All Low Opportunity Neighborhoods Regionwide 38,630 39,872 1,242 3%
County/City
Anne Arundel County 5,845 6,361 516 9%
Baltimore County 18,598 16,420 (2,178) -12%
Howard County 4,315 4,243 (72) -2%
Baltimore City 73,780 78,874 5,094 7%
Low Opportunity Index Neighborhood
Irvington 74,928 75,825 897 1%
Sandtown-Winchester 97,634 103,155 5,521 6%
Upton 94,780 101,111 6,331 7%
Berea 76,242 84,471 8,229 11%
Rosemont 74,671 82,951 8,280 11% Harlem Park 83,024 95,857 12,833 15%
24
Change in High Opportunity Jobs Accessible within 45 Minutes by Transit for the Average
Resident in a Low Composite Opportunity Neighborhood on a Weekend Day in the MTA Baltimore Service Area
Current Service
BLink Service Difference % Change
Average All Low Opportunity Neighborhoods Regionwide 32,534 30,701 (1,833) -6%
County/City
Anne Arundel County 4,410 4,978 568 13%
Baltimore County 16,207 12,164 (4,043) -25%
Howard County 3,604 3,604 0 0%
Baltimore City 61,785 61,172 (613) -1%
Profiled Low Opportunity Index Neighborhoods
Harlem Park 77,510 75,088 (2,422) -3%
Sandtown-Winchester 84,213 82,585 (1,627) -2%
Upton 82,937 82,793 (144) 0%
Berea 70,220 71,092 872 1% Rosemont 59,185 60,986 1,802 3%
Irvington 50,629 53,412 2,784 5%
25
26

27
ACCESS TO MARYLAND EMPLOYMENT CENTERS The project team’s analysis considered whether the BaltimoreLink plan utilizes an important strategy for improving access to jobs and growing the state’s economy: designing public transportation to better connect where people live with Maryland’s 23 designated employment centers. The University of Maryland’s National Center for Smart Growth defines employment centers as dense clusters of jobs in the state where there are a minimum of 10,000 jobs and a density threshold of nine jobs per acre. The 23 employment centers that meet that definition represent one percent of Maryland’s land area but “42.3 percent of all jobs, 20.8 percent of all auto trips, and 39.4 percent of all transit trips in the state. . . They also represent important growth engines, capturing 21 percent of new start-ups and nearly one-third of new jobs in 2008 and 2009.”5 The 2035 Maryland Transportation Plan (MTP) describes the “Critical Transportation Challenges” that the state’s transportation policies and projects must address. Under the challenge “Building Foundations for Economic Prosperity,” the plan describes the 23 employment centers and says that connecting population and dense clusters of jobs via public transportation is required to relieve pressure on the highway system and ensure economic prosperity.6 During the public engagement for the MTP members of the public voted for the most important strategy under each of the plan’s six goals. The top-rated strategy under the Quality of Service goal is “Invest in enhanced public transit services to facilitate access in and around population and employment centers.” The top-rated strategy under the Economic Prosperity goal is “Invest in improving transit access to major employment and commercial centers.” The project team strongly feels that by redrawing the network of bus routes, the BaltimoreLink plan is an opportunity to improve access to the employment centers in the Baltimore region. Providing efficient, frequent bus service between transit hubs and employment centers such as Towson or Woodlawn would reduce travel times between a large population and a dense cluster of jobs. Our assessment included the following 10 employment centers within the study area:
5 http://smartgrowth.umd.edu/assets/documents/seed/seed_d1.pdf 6 http://www.mdot.maryland.gov/Office_of_Planning_and_Capital_Programming/CTP/ CTP_14_19/1_Final_CTP_Documents/2035_MTP.pdf
28

Employment Centers Included in the Study Area
Annapolis
Cockeysville
Columbia
Downtown Baltimore
Halethorpe
Linthicum Heights (BWI Business District)
Pikesville - Owings Mills
Rossville (White Marsh)
Towson
Woodlawn
The project team gathered travel times from every Census block in the study area to determine how many residents could access each specific Employment Center within 45 minutes. This analysis does not take into account non-MTA circulators and shuttles that are options in some MECs. Half of the Employment Centers studied will see a decrease in the number of residents that can access jobs located at the center on a weekday, and six will see decreases on the weekend. Twenty-eight thousand more residents will be able to access Halethorpe Employment Center within 45 minutes on the weekday as a result of the BaltimoreLink plan, but both Downtown Baltimore and Woodlawn employment centers will lose access to 40,000 residents of the region. Sixty-thousand residents will no longer be able to access the Woodlawn Employment Center within 45 minutes on the weekend, which represents 50% of those currently able to access this center on the weekend. No change is seen at Annapolis and Columbia employment centers on the weekend, while Pikesville and Rossville (White Marsh) both see increases of access to 2,000 residents. These results show that the MTA missed an opportunity to implement a strategy recommended in the state's transportation plan.
29
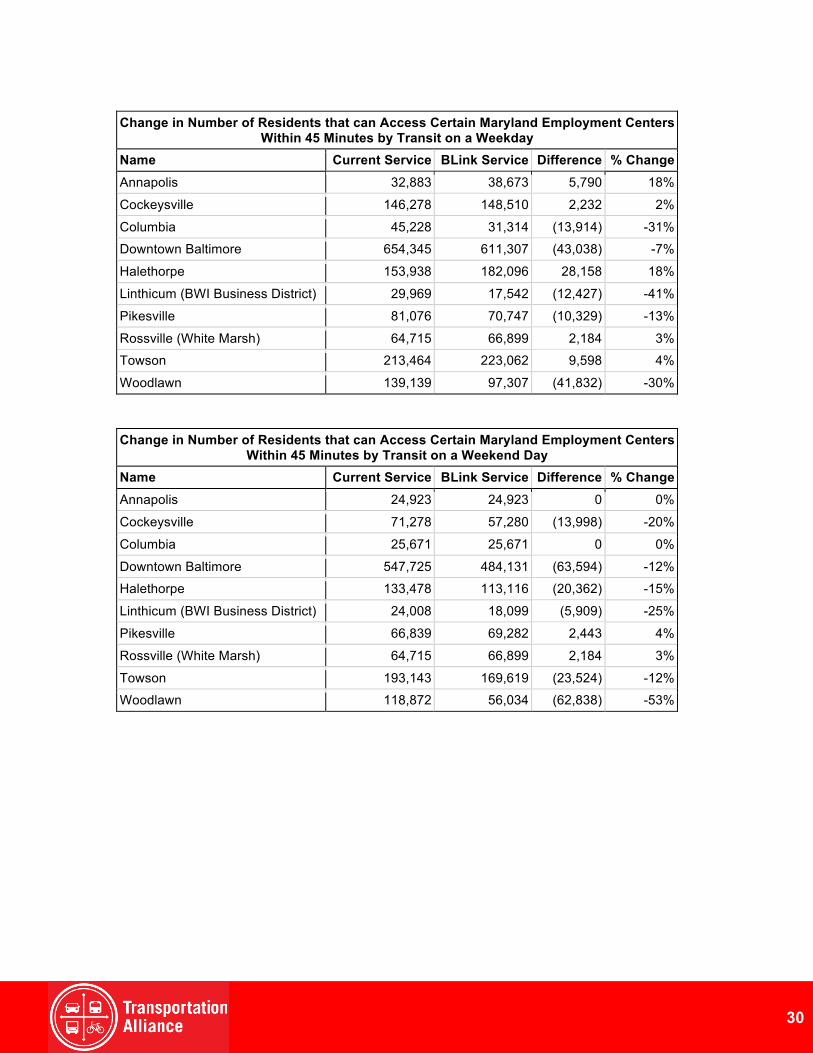
Change in Number of Residents that can Access Certain Maryland Employment Centers
Within 45 Minutes by Transit on a Weekday Name Current Service BLink Service Difference % Change
Annapolis 32,883 38,673 5,790 18%
Cockeysville 146,278 148,510 2,232 2%
Columbia 45,228 31,314 (13,914) -31% Downtown Baltimore 654,345 611,307 (43,038) -7%
Halethorpe 153,938 182,096 28,158 18%
Linthicum (BWI Business District) 29,969 17,542 (12,427) -41%
Pikesville 81,076 70,747 (10,329) -13%
Rossville (White Marsh) 64,715 66,899 2,184 3% Towson 213,464 223,062 9,598 4%
Woodlawn 139,139 97,307 (41,832) -30% Change in Number of Residents that can Access Certain Maryland Employment Centers
Within 45 Minutes by Transit on a Weekend Day Name Current Service BLink Service Difference % Change
Annapolis 24,923 24,923 0 0%
Cockeysville 71,278 57,280 (13,998) -20%
Columbia 25,671 25,671 0 0%
Downtown Baltimore 547,725 484,131 (63,594) -12% Halethorpe 133,478 113,116 (20,362) -15%
Linthicum (BWI Business District) 24,008 18,099 (5,909) -25%
Pikesville 66,839 69,282 2,443 4%
Rossville (White Marsh) 64,715 66,899 2,184 3%
Towson 193,143 169,619 (23,524) -12% Woodlawn 118,872 56,034 (62,838) -53%
30

ACCESS TO SCHOOLS
For Baltimore City, where families rely on the MTA to transport their children to middle school and high school, and where the Choice Schools model is predicated on students going to the secondary school anywhere in the system which best suits their needs and interests, the impact that the BaltimoreLink plan will have on a child’s ability to get to schools has implications for attendance, grades and graduation rates. In its presentations during summer 2016 the MTA has said that under the proposed BaltimoreLink plan an additional 15 public schools will have access to high-frequency transit, up 13% from current service. However, the presentations do not indicate where these schools are located, if they are middle schools or high schools, or if there are any schools that suffer from diminished transit access as a result of the plan. Our finding was that BaltimoreLink does not appreciably increase the number of schools children can get to within 45 minutes. Our analysis measured access to middle schools and high schools from each Census block group in the city. The surrounding counties were not examined because they do not use MTA for school busing. For the analysis the project team did not include trippers. Trippers are bus runs that deviate from the standard route at certain specified times of day to drop off or pick up children close to a school. The MTA currently operates trippers each weekday during the school year. The agency indicates it will run a similar number of trippers after the BaltimoreLink plan goes into effect, but has yet to announce the routes or schedules they will follow. Because students and school employees often need to travel to and from a school outside the limited times that trippers run, it should be a goal of BaltimoreLink to improve access to schools via the base bus routes before relying on trippers to address gaps in service. The analysis showed marginal or no improvements from existing MTA service for a resident’s ability to access middle and high schools within 45 minutes. Results vary by neighborhoods, but averaged across the city two additional middle schools, and zero additional high schools are made accessible within 45 minutes due to new service in the BaltimoreLink plan when compared to existing service. As a second way of understanding what happens to access to schools, the project team selected five high schools, Digital Harbor High School, Frederick Douglas High School, Mergenthaler Vocational-Technical School, Patterson High School and Baltimore Polytechnic Institute, to determine what happens to the number of people who can access each school within 45 minutes when the MTA replaces existing service with BaltimoreLink. To do this the project team analyzed
ACCESS TO ESSENTIAL SERVICES
31
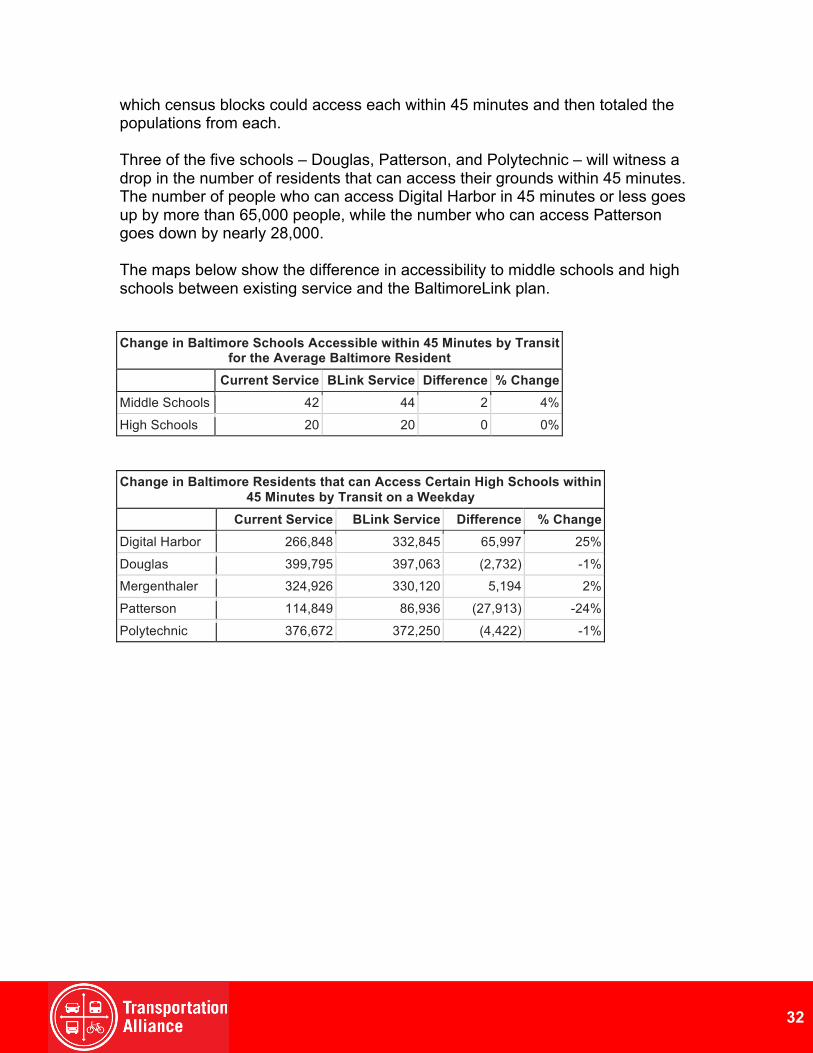
which census blocks could access each within 45 minutes and then totaled the populations from each. Three of the five schools – Douglas, Patterson, and Polytechnic – will witness a drop in the number of residents that can access their grounds within 45 minutes. The number of people who can access Digital Harbor in 45 minutes or less goes up by more than 65,000 people, while the number who can access Patterson goes down by nearly 28,000. The maps below show the difference in accessibility to middle schools and high schools between existing service and the BaltimoreLink plan. Change in Baltimore Schools Accessible within 45 Minutes by Transit
for the Average Baltimore Resident
Current Service BLink Service Difference % Change
Middle Schools 42 44 2 4%
High Schools 20 20 0 0% Change in Baltimore Residents that can Access Certain High Schools within
45 Minutes by Transit on a Weekday
Current Service BLink Service Difference % Change
Digital Harbor 266,848 332,845 65,997 25%
Douglas 399,795 397,063 (2,732) -1% Mergenthaler 324,926 330,120 5,194 2%
Patterson 114,849 86,936 (27,913) -24%
Polytechnic 376,672 372,250 (4,422) -1%
32

33

34
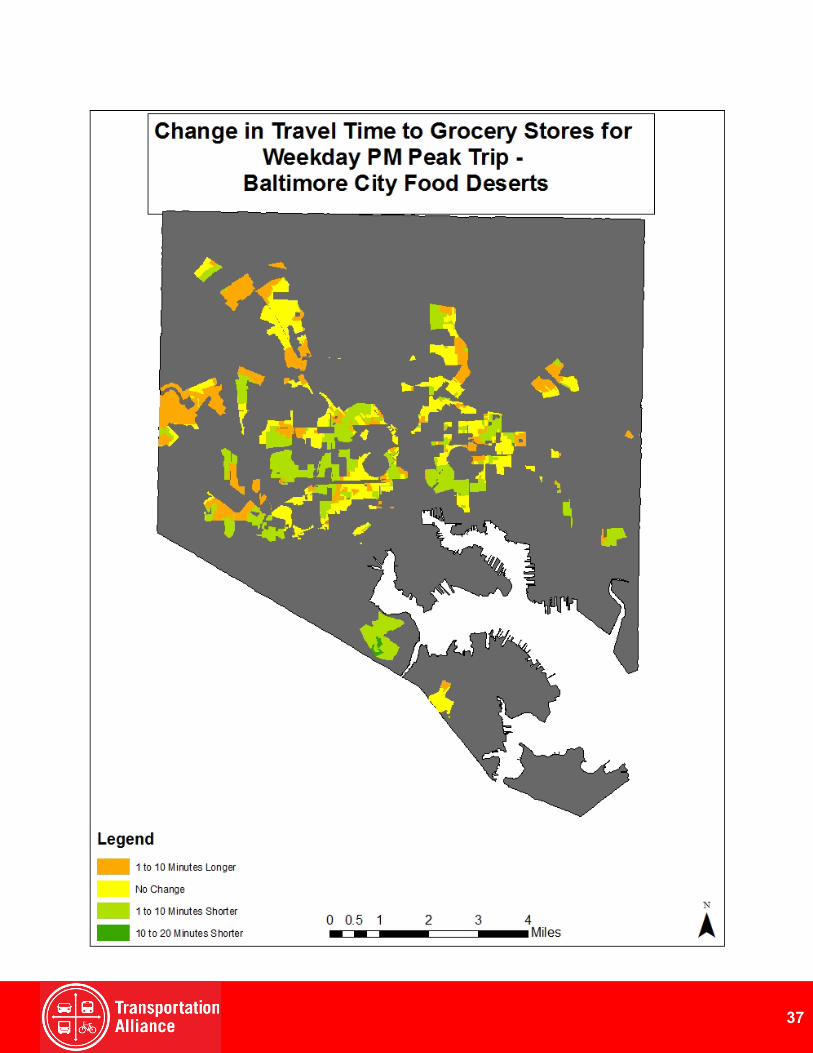
ACCESS TO FOOD SOURCES FOR INDIVIDUALS IN FOOD DESERTS The Baltimore Food Policy Initiative (BFPI) and the Johns Hopkins Center for a Livable Future (CLF) have defined a food desert to be an area where the distance to a supermarket or supermarket alternative is more than 1/4 mile, the median household income is at or below 185 percent of the Federal Poverty Level, over 30 percent of households have no vehicle available, and the average Healthy Food Availability Index (HFAI) score for all food stores is low. According to the 2015 Food Environment Map and Report:
• Twenty-five percent of Baltimore City residents live in areas identified as food deserts;
• Children are affected disproportionately, with 30 percent living in food deserts; and,
• African Americans are the most likely of any racial or ethnic group to live in a food desert (34 percent of the African American population compared to 8 percent of Baltimore’s white population).7
BaltimoreLink is an opportunity to improve access to healthy foods for Baltimore residents, particularly those living in a food desert. In its presentations during summer 2016 the MTA has said that under the BaltimoreLink plan twelve grocery stores would have improved access to high-frequency transit. However, the plan does not indicate where the grocery stores are located or whether areas identified as food deserts would have improved transit access to healthy food sources. For this analysis the project team analyzed travel to the nearest healthy food source for the average Baltimore City resident and those living in identified food deserts. The analysis identified healthy food sources as all grocery stores plus those stores or markets with a Healthy Food Availability Index (HFAI) score greater than 25, according to the Baltimore Food Policy Initiative (BFPI) and the Johns Hopkins Center for a Livable Future (CLF). A total of 206 stores and markets met the criteria within the entire study area including 49 in Baltimore City. The project team chose to use 15 minutes by transit as a proxy for the 1/4 mile criterion used in the definition of food deserts. Similar assessments of healthy food sources and food deserts have not been completed for jurisdictions other than Baltimore City and therefore were not available for this analysis.
7 http://mdfoodsystemmap.org/wp-content/uploads/2015/06/Baltimore-Food-Environment-Report-2015-11.pdf
35
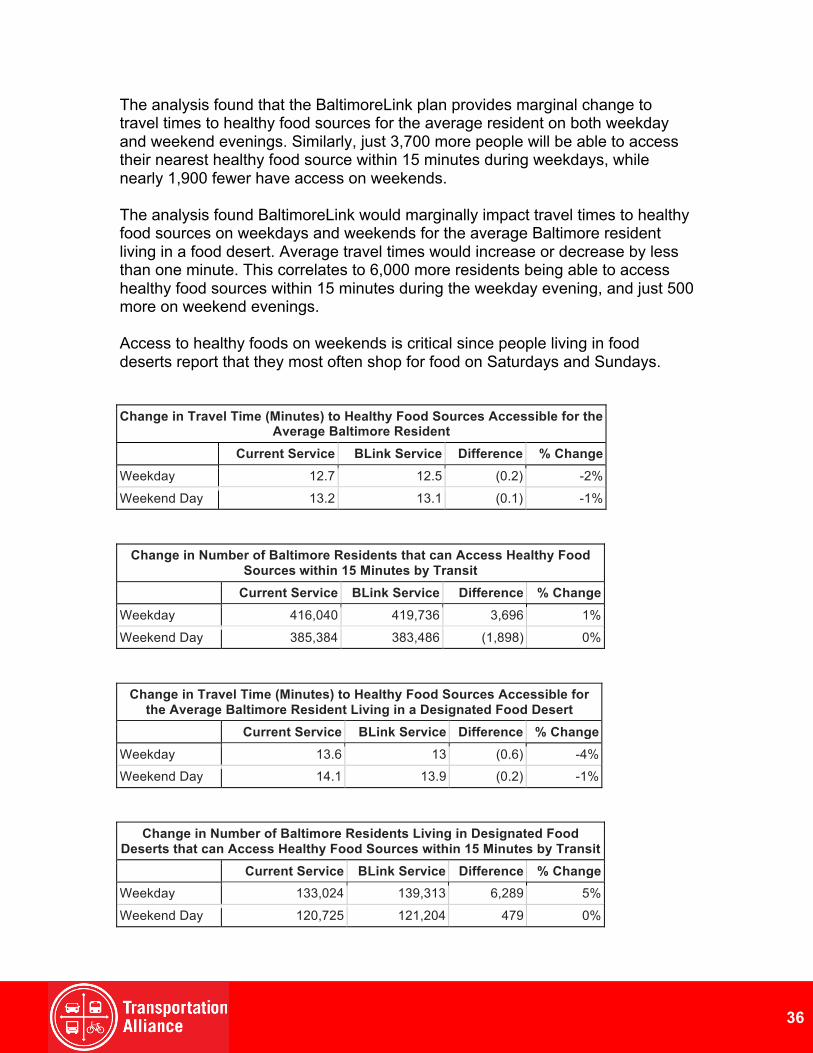
The analysis found that the BaltimoreLink plan provides marginal change to travel times to healthy food sources for the average resident on both weekday and weekend evenings. Similarly, just 3,700 more people will be able to access their nearest healthy food source within 15 minutes during weekdays, while nearly 1,900 fewer have access on weekends. The analysis found BaltimoreLink would marginally impact travel times to healthy food sources on weekdays and weekends for the average Baltimore resident living in a food desert. Average travel times would increase or decrease by less than one minute. This correlates to 6,000 more residents being able to access healthy food sources within 15 minutes during the weekday evening, and just 500 more on weekend evenings. Access to healthy foods on weekends is critical since people living in food deserts report that they most often shop for food on Saturdays and Sundays. Change in Travel Time (Minutes) to Healthy Food Sources Accessible for the
Average Baltimore Resident
Current Service BLink Service Difference % Change
Weekday 12.7 12.5 (0.2) -2%
Weekend Day 13.2 13.1 (0.1) -1%
Change in Number of Baltimore Residents that can Access Healthy Food Sources within 15 Minutes by Transit
Current Service BLink Service Difference % Change
Weekday 416,040 419,736 3,696 1%
Weekend Day 385,384 383,486 (1,898) 0%
Change in Travel Time (Minutes) to Healthy Food Sources Accessible for the Average Baltimore Resident Living in a Designated Food Desert
Current Service BLink Service Difference % Change
Weekday 13.6 13 (0.6) -4% Weekend Day 14.1 13.9 (0.2) -1%
Change in Number of Baltimore Residents Living in Designated Food Deserts that can Access Healthy Food Sources within 15 Minutes by Transit
Current Service BLink Service Difference % Change Weekday 133,024 139,313 6,289 5%
Weekend Day 120,725 121,204 479 0%
36
37

38

MTA’s Baltimore region bus system warrants improvements such as those highlighted in BaltimoreLink’s plan, including dedicated bus lanes, transit signal prioritization, and an update to the route network. The inadequacy of the current bus system creates transportation-related barriers for thousands of residents by preventing access to jobs and essential daily services. The objective of this study was to enhance MTA’s BaltimoreLink plan, and at a minimum, ensure the proposed bus realignment expands opportunity for the MTA Baltimore region, especially for those neighborhoods with decades of neglect and disinvestment. Similar to the MTA’s own finding, at the regional level the project team finds that access to all jobs and high opportunity jobs on a weekday, both for the entire population and those living in low opportunity neighborhoods, will not significantly increase under BaltimoreLink. Any marginal weekday gains are outweighed by losses in access to jobs on a weekend day for the average resident of the region. The loss of weekend service is critical because many low-skill and mid-skill jobs require weekend work and, for many, access by transit is the only available option. A stated aim of the BaltimoreLink plan is to better connect buses with fixed rail. The plan announced in October 2015 included expanding light rail service on Sundays, but according to the project team’s analysis this improvement appears to have been left out of the July 2016 version of the plan, especially for the morning hours on Sunday from 7 AM to 10 AM. Without expanded hours for light rail on Sundays, the benefit of rerouting buses to better connect is lost for people commuting to work on Sunday mornings. The Transportation Alliance feels strongly that the investments made by the BaltimoreLink plan cannot be narrowly focused and every expenditure should accomplish multiple outcomes. These additional benefits – supporting local economic development or providing access to opportunity and jobs – are not “amenities,” but rather essential benefits expected by the Baltimore region and its residents. The BaltimoreLink plan does not demonstrably improve access to jobs, schools, or healthy food sources. The MTA has reported that the plan also will not decrease transit travel times for the average resident. We are left hoping the MTA’s reliability will far exceed what is currently offered. In many instances, any investment is a positive. However, in this case the project team identifies a missed opportunity to leverage the more than $100 million investment to achieve multiple strategic outcomes for the region, including improved transit access to Maryland Economic Centers, schools, and healthy food sources.
RECOMMENDATIONS
39

The Transportation Alliance recommends the following: MTA should address the following issues before progressing BaltimoreLink to its next stage
• Weekend Service — Due to the loss in weekend jobs access we recommend that MTA thoroughly analyze the proposed changes to the weekend BaltimoreLink plan, present its findings, and provide a minimum amount of time for the public to review and comment. This should target low- and middle-wage jobs that are more likely to employ residents relying on transit to access jobs on the weekend.
• Employment Centers — Providing efficient, frequent transit access between transit hubs and Maryland Employment Centers is an identified strategy in Maryland Department of Transportation’s own long-term strategic plan to help build the foundations for economic prosperity. The state’s BaltimoreLink plan does not appear to make noticeable improvements to accessibility of these essential economic centers by transit, however. Therefore, we recommend that MTA analyze the BaltimoreLink plan and how it can best use this strategic investment as a means to improve access to the state’s economic centers.
• Schools — Baltimore City families rely on the MTA to transport their children to public middle schools and high schools, and the Choice Schools model is predicated on a child going to whichever secondary school in the system best suits his or her needs and interests. The BaltimoreLink plan does not appreciably increase the number of schools children can access by transit within 45 minutes or less. We recommend that MTA analyze school access in a more meaningful manner than the number of schools that will be near a bus route with 15-minute headways, such as the number of schools accessible for all children and those in low composite opportunity neighborhoods.
• Healthy Foods — Baltimore City has recognized the critical need to improve healthy food access for residents, 25% of whom live in areas identified as food deserts. The BaltimoreLink plan only marginally improves outcomes. Provided that lack of food access disproportionately affects children and African Americans, efforts should be made to better coordinate with the Baltimore City Department of Planning and Department of Health and the Baltimore Development Corporation to help overcome longstanding disinvestment in these neighborhoods to ensure connections to food options can be made through rapid transit.
• Baltimore City-MTA Coordination — Much of BaltimoreLink’s success in terms of travel time and reliability hinges on coordination of road space and traffic signals between MTA and the City of Baltimore’s Department of Transportation. Without dedicated bus lanes and traffic signal prioritization the potential benefits of this project may not be
40
realized. It is inaccurate to anticipate reliable, rapid transit going through downtown without dedicated right-of-way. A major portion of the cancelled Baltimore Red Line project’s budget was dedicated to an east-west tunnel in order to mitigate downtown vehicle congestion. A memorandum of understanding or other agreement document should be signed by both parties before the planning process is complete to capture the benefits and hold both parties accountable for prioritizing the movement of people in transit vehicles over privately driven, single-occupancy vehicles, particularly in the downtown core.
Public oversight of MTA is needed The MTA’s Bus Network Improvement Project and the subsequent BaltimoreLink plan have lacked clear, accountable direction for how to assess the expected outcomes from the transportation investment. Further, there was little public input or awareness that the BaltimoreLink plan was occurring until its release in fall 2015. Making matters more challenging, MTA has used shifting language and statistics to describe the plan’s projected measures and outcomes. We recommend that an MTA oversight board be established to improve accountability and transparency, which will give the public greater access to and understanding of important decisions impacting community development and the use of taxpayer dollars in MTA’s service area. Decisions made by bureaucrats – and even legislators – at the state level can be difficult for the public to understand. Many find the current performance measurement and reporting from MTA inadequate or subject to change with limited to no public awareness. Citizen oversight and locally-driven decisions will help to build public trust in MTA’s planning decisions and ultimately grow public support for vital transit service. A recent action taken by MTA only further focuses the need for an oversight board for the agency and places into question the permanency of any of the proposed BaltimoreLink changes. In August, with just ten days warning and inaccurate and incomplete public notice, the MTA cut service on 21 of its 51 local bus routes, which amounted an average reduction in service of 11 percent, as measured in total bus runs during a week. The reduction in bus runs means the routes remain the same, but fewer buses are scheduled to travel the routes per day. Many riders are now facing severely longer waits before the next bus arrives. The lack of transparency by MTA makes many stakeholders question the direction MTA is heading. An oversight board would provide an opportunity to notify the public earlier and to air the rationale behind the service cuts. Many other metropolitan transit agencies – including those that benefit from the support of state funding – have state or local boards empowered to guide major planning and investment decisions.
41
More funding needed to achieve the desired outcomes from the BaltimoreLink plan Baltimore region residents are hopeful that BaltimoreLink creates “a customer focused transit system for Baltimore that is safer, cleaner, and which better meets the needs of Baltimore City residents.” However, failure to improve the outcomes important to the region’s residents cannot be an option. The $135 million plan, while appreciated, is spread over six years with $70 million going towards operating expenses and $65 million towards capital expenses. The BaltimoreLink plan’s funding appears inadequate to noticeably improve access to jobs, schools, and healthy food sources and does not improve the region’s average transit travel time. The sources of the $135 million are funds reallocated from a project where the MTA was able to conduct maintenance on the Metro subway under budget, funds reallocated from a Port of Baltimore project that was deferred, and federal funds. BaltimoreLink has received no new funds from the Maryland Transportation Fund that weren’t already programmed for transportation projects in the Baltimore region. There is great variability in the outcomes from BaltimoreLink. Some people and neighborhoods may see better access and transit service while others will not. There will be winners and losers under BaltimoreLink and the MTA should not claim or imply that there are across the board benefits. Partly, this is because there were no clear measurable goals and outcomes identified at the outset. But this is also because the total amount of service being provided does not change all that much. The transit pie is not growing; it is just being re-sliced. This plan falls well short of what was promised in October 2015. Baltimore’s economy and quality of life depend on an efficient and effective transit system. Creating the transformative changes needed likely cannot be achieved on a shoestring budget. If the BaltimoreLink plan is a priority for the Hogan Administration and MTA, the Administration should provide the resources needed to support the Baltimore region’s continued prosperity. Specifically, in order to see more substantial improvement in access to jobs, schools, and healthy foods there must be additional funding for capital improvements that enable buses to move more rapidly through traffic and intersections. Dedicated bus lanes and traffic signal prioritization can reduce travel times and make them more reliable, two priorities for people who use transit or consider using it. There must also be additional funding for operations to avoid the steep drop off in access when buses run infrequently.
42
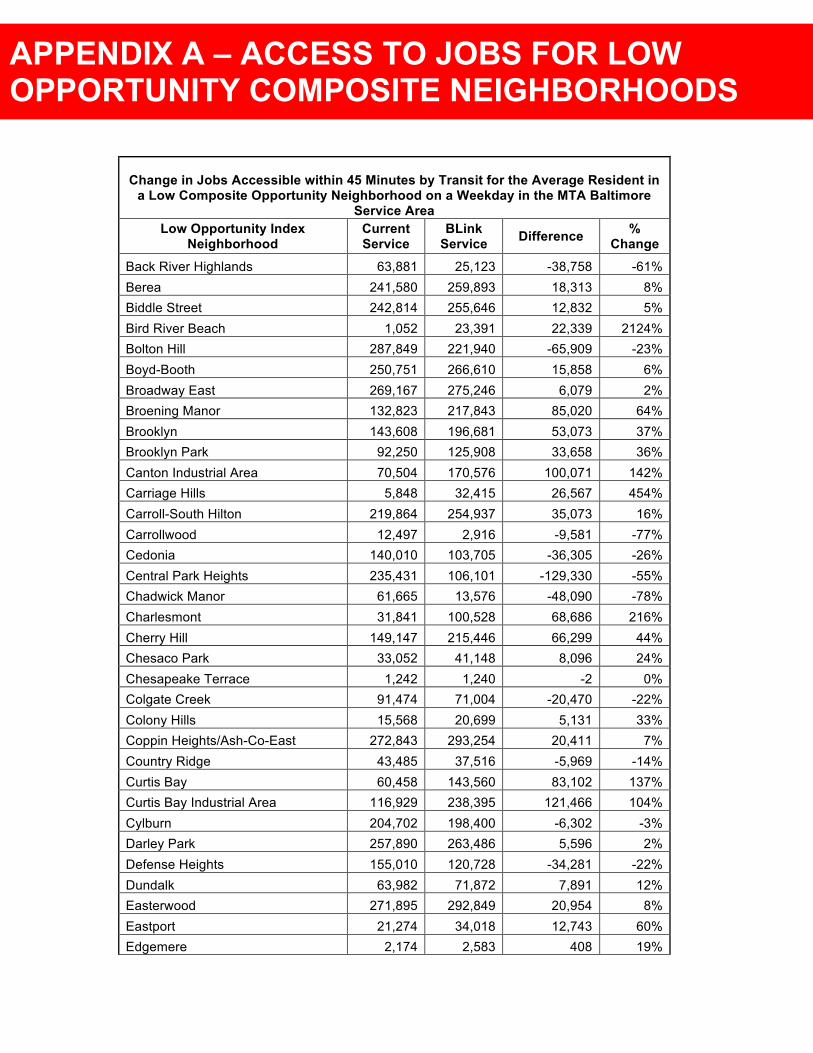
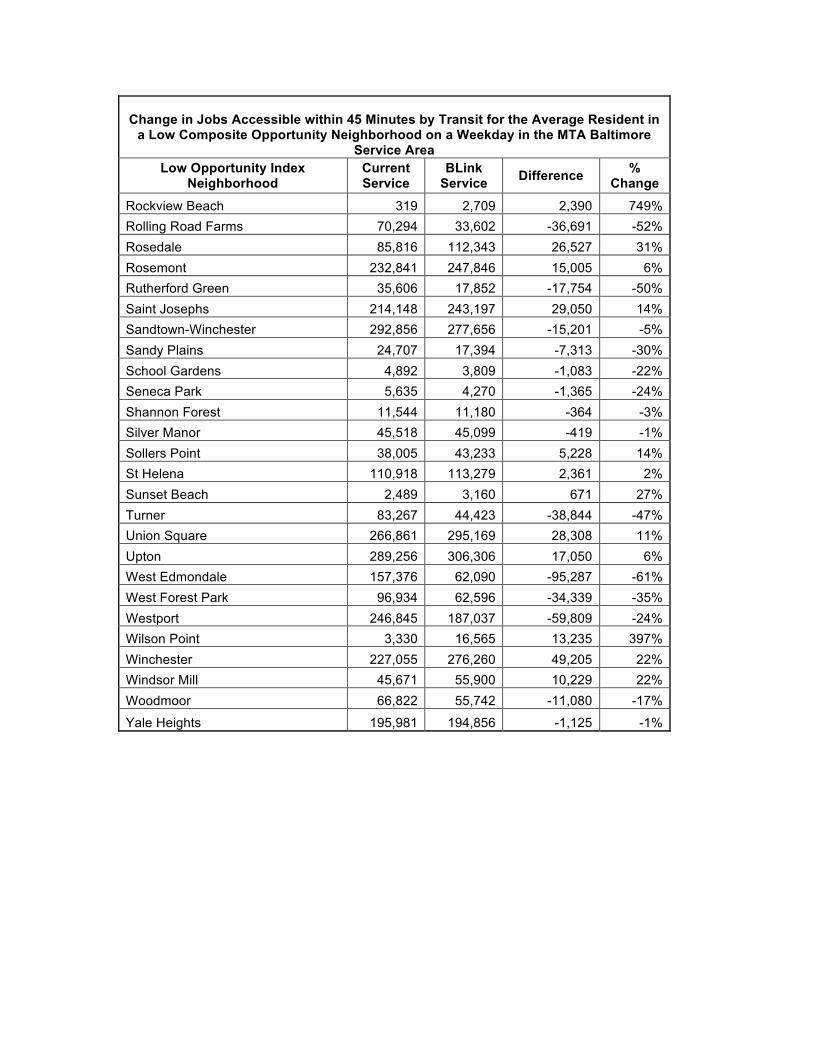
Change in Jobs Accessible within 45 Minutes by Transit for the Average Resident in a Low Composite Opportunity Neighborhood on a Weekday in the MTA Baltimore
Service Area Low Opportunity Index
Neighborhood Current Service
BLink Service Difference %
Change Back River Highlands 63,881 25,123 -38,758 -61% Berea 241,580 259,893 18,313 8% Biddle Street 242,814 255,646 12,832 5% Bird River Beach 1,052 23,391 22,339 2124% Bolton Hill 287,849 221,940 -65,909 -23% Boyd-Booth 250,751 266,610 15,858 6% Broadway East 269,167 275,246 6,079 2% Broening Manor 132,823 217,843 85,020 64% Brooklyn 143,608 196,681 53,073 37% Brooklyn Park 92,250 125,908 33,658 36% Canton Industrial Area 70,504 170,576 100,071 142% Carriage Hills 5,848 32,415 26,567 454% Carroll-South Hilton 219,864 254,937 35,073 16% Carrollwood 12,497 2,916 -9,581 -77% Cedonia 140,010 103,705 -36,305 -26% Central Park Heights 235,431 106,101 -129,330 -55% Chadwick Manor 61,665 13,576 -48,090 -78% Charlesmont 31,841 100,528 68,686 216% Cherry Hill 149,147 215,446 66,299 44% Chesaco Park 33,052 41,148 8,096 24% Chesapeake Terrace 1,242 1,240 -2 0% Colgate Creek 91,474 71,004 -20,470 -22% Colony Hills 15,568 20,699 5,131 33% Coppin Heights/Ash-Co-East 272,843 293,254 20,411 7% Country Ridge 43,485 37,516 -5,969 -14% Curtis Bay 60,458 143,560 83,102 137% Curtis Bay Industrial Area 116,929 238,395 121,466 104% Cylburn 204,702 198,400 -6,302 -3% Darley Park 257,890 263,486 5,596 2% Defense Heights 155,010 120,728 -34,281 -22% Dundalk 63,982 71,872 7,891 12% Easterwood 271,895 292,849 20,954 8% Eastport 21,274 34,018 12,743 60% Edgemere 2,174 2,583 408 19%
APPENDIX A – ACCESS TO JOBS FOR LOW OPPORTUNITY COMPOSITE NEIGHBORHOODS

Change in Jobs Accessible within 45 Minutes by Transit for the Average Resident in a Low Composite Opportunity Neighborhood on a Weekday in the MTA Baltimore
Service Area Low Opportunity Index
Neighborhood Current Service
BLink Service Difference %
Change Edrich 1,166 8,864 7,698 660% Eliots Oak 16,264 20,359 4,095 25% Essex 71,351 61,837 -9,514 -13% Essexshire Gate 27,656 27,903 247 1% Evergreen Park 341 30,556 30,215 8863% Fairmont 262,106 283,822 21,716 8% Forest Park 249,460 218,394 -31,067 -12% Four By Four 249,311 256,442 7,132 3% Fox Ridge Manor 34,880 32,016 -2,864 -8% Franklintown Road 247,079 249,898 2,819 1% Furnace Branch 29,199 31,179 1,979 7% Garwyn Oaks 212,267 225,858 13,591 6% Glen Burnie 38,619 36,018 -2,601 -7% Glen Gardens 27,795 25,595 -2,200 -8% Glenwood 15,316 18,924 3,609 24% Golden Ring 137,706 123,903 -13,804 -10% Graceland 92,373 96,834 4,461 5% Graceland Park 163,137 188,365 25,228 15% Granite 2,017 29,043 27,026 1340% Greenspring 264,774 260,511 -4,263 -2% Guilford Manor 34,028 92,209 58,181 171% Harborview 45,472 74,715 29,243 64% Harlem Park 255,978 270,364 14,385 6% Harpers Choice 21,627 20,469 -1,157 -5% Hartland Run 39,064 41,485 2,421 6% Hawthorne 22,075 23,481 1,406 6% Hebbville 5,076 42,789 37,713 743% High Point 1,162 2,423 1,261 108% Highlandtown 252,354 247,149 -5,205 -2% Holbrook 978 69,539 68,561 7010% Hollofield 721 48,463 47,742 6626% Hyde Park 19,302 23,415 4,113 21% Irvington 214,428 220,906 6,478 3% Josenhans 37,205 69,905 32,700 88% Kelso 50,444 75,333 24,889 49% Kings Park 3,901 21,504 17,604 451% Langston Hughes 242,630 248,110 5,480 2%

Change in Jobs Accessible within 45 Minutes by Transit for the Average Resident in a Low Composite Opportunity Neighborhood on a Weekday in the MTA Baltimore
Service Area Low Opportunity Index
Neighborhood Current Service
BLink Service Difference %
Change Lochearn 91,815 63,655 -28,160 -31% Longfellow 19,878 24,972 5,094 26% Lucille Park 280,310 279,440 -871 0% Lynne Acres 52,378 34,168 -18,210 -35% Madison-Eastend 260,798 287,820 27,022 10% Margate 6,518 19,630 13,111 201% Marley 14,672 3,752 -10,920 -74% Martindale 22,545 7,298 -15,247 -68% McDonogh Manor 5,371 11,538 6,167 115% McDonogh Park 21,585 19,880 -1,705 -8% McElderry Park 265,331 271,570 6,239 2% Meadow Brook 31,402 26,558 -4,844 -15% Medford 177,930 174,170 -3,760 -2% Miami Beach 4,310 9,942 5,632 131% Middle Branch/Reedbird Parks 154,175 194,800 40,625 26% Middle River 12,484 11,643 -842 -7% Middleborough 46,094 54,622 8,528 19% Middlesex 45,330 84,041 38,710 85% Midtown-Edmondson 250,079 273,583 23,504 9% Millhill 232,887 252,117 19,229 8% Mondawmin 279,577 285,783 6,205 2% Monumental 103,720 55,913 -47,807 -46% Mount Winans 178,205 220,343 42,138 24% Oakdale 13,051 22,610 9,559 73% O’Donnell Heights 171,560 203,329 31,769 19% Patapsco 25,592 15,439 -10,153 -40% Penrose 252,141 250,285 -1,856 -1% Pimlico Good Neighbors 233,163 215,307 -17,856 -8% Point Pleasant 4,063 10,126 6,062 149% Powhatan Beach 5,486 14,651 9,165 167% Pulaski Industrial Area 157,704 84,011 -73,693 -47% Randall Ridge 14,471 9,866 -4,605 -32% Randallstown 46,365 38,613 -7,752 -17% Reservoir Hill 260,822 271,082 10,259 4% Riviera Beach 2,703 2,889 186 7% Rock Hill Beach 2,793 3,354 561 20% Rockdale 83,546 38,028 -45,518 -54%
Change in Jobs Accessible within 45 Minutes by Transit for the Average Resident in a Low Composite Opportunity Neighborhood on a Weekday in the MTA Baltimore
Service Area Low Opportunity Index
Neighborhood Current Service
BLink Service Difference %
Change Rockview Beach 319 2,709 2,390 749% Rolling Road Farms 70,294 33,602 -36,691 -52% Rosedale 85,816 112,343 26,527 31% Rosemont 232,841 247,846 15,005 6% Rutherford Green 35,606 17,852 -17,754 -50% Saint Josephs 214,148 243,197 29,050 14% Sandtown-Winchester 292,856 277,656 -15,201 -5% Sandy Plains 24,707 17,394 -7,313 -30% School Gardens 4,892 3,809 -1,083 -22% Seneca Park 5,635 4,270 -1,365 -24% Shannon Forest 11,544 11,180 -364 -3% Silver Manor 45,518 45,099 -419 -1% Sollers Point 38,005 43,233 5,228 14% St Helena 110,918 113,279 2,361 2% Sunset Beach 2,489 3,160 671 27% Turner 83,267 44,423 -38,844 -47% Union Square 266,861 295,169 28,308 11% Upton 289,256 306,306 17,050 6% West Edmondale 157,376 62,090 -95,287 -61% West Forest Park 96,934 62,596 -34,339 -35% Westport 246,845 187,037 -59,809 -24% Wilson Point 3,330 16,565 13,235 397% Winchester 227,055 276,260 49,205 22% Windsor Mill 45,671 55,900 10,229 22% Woodmoor 66,822 55,742 -11,080 -17%
Yale Heights 195,981 194,856 -1,125 -1%
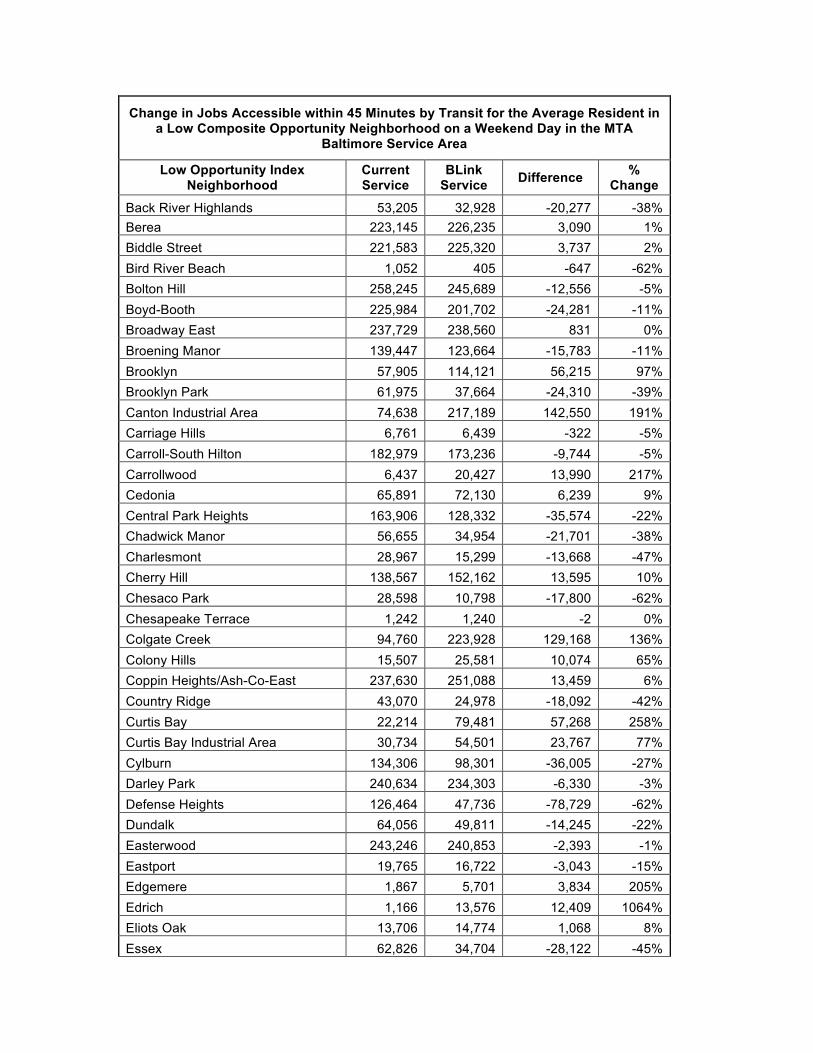
Change in Jobs Accessible within 45 Minutes by Transit for the Average Resident in a Low Composite Opportunity Neighborhood on a Weekend Day in the MTA
Baltimore Service Area
Low Opportunity Index Neighborhood
Current Service
BLink Service Difference %
Change Back River Highlands 53,205 32,928 -20,277 -38% Berea 223,145 226,235 3,090 1% Biddle Street 221,583 225,320 3,737 2% Bird River Beach 1,052 405 -647 -62% Bolton Hill 258,245 245,689 -12,556 -5% Boyd-Booth 225,984 201,702 -24,281 -11% Broadway East 237,729 238,560 831 0% Broening Manor 139,447 123,664 -15,783 -11% Brooklyn 57,905 114,121 56,215 97% Brooklyn Park 61,975 37,664 -24,310 -39% Canton Industrial Area 74,638 217,189 142,550 191% Carriage Hills 6,761 6,439 -322 -5% Carroll-South Hilton 182,979 173,236 -9,744 -5% Carrollwood 6,437 20,427 13,990 217% Cedonia 65,891 72,130 6,239 9% Central Park Heights 163,906 128,332 -35,574 -22% Chadwick Manor 56,655 34,954 -21,701 -38% Charlesmont 28,967 15,299 -13,668 -47% Cherry Hill 138,567 152,162 13,595 10% Chesaco Park 28,598 10,798 -17,800 -62% Chesapeake Terrace 1,242 1,240 -2 0% Colgate Creek 94,760 223,928 129,168 136% Colony Hills 15,507 25,581 10,074 65% Coppin Heights/Ash-Co-East 237,630 251,088 13,459 6% Country Ridge 43,070 24,978 -18,092 -42% Curtis Bay 22,214 79,481 57,268 258% Curtis Bay Industrial Area 30,734 54,501 23,767 77% Cylburn 134,306 98,301 -36,005 -27% Darley Park 240,634 234,303 -6,330 -3% Defense Heights 126,464 47,736 -78,729 -62% Dundalk 64,056 49,811 -14,245 -22% Easterwood 243,246 240,853 -2,393 -1% Eastport 19,765 16,722 -3,043 -15% Edgemere 1,867 5,701 3,834 205% Edrich 1,166 13,576 12,409 1064% Eliots Oak 13,706 14,774 1,068 8% Essex 62,826 34,704 -28,122 -45%

Change in Jobs Accessible within 45 Minutes by Transit for the Average Resident in a Low Composite Opportunity Neighborhood on a Weekend Day in the MTA
Baltimore Service Area
Low Opportunity Index Neighborhood
Current Service
BLink Service Difference %
Change Essexshire Gate 26,983 35,325 8,342 31% Evergreen Park 341 32,007 31,666 9289% Fairmont 220,990 194,242 -26,747 -12% Forest Park 196,316 123,416 -72,900 -37% Four By Four 225,187 225,401 214 0% Fox Ridge Manor 34,454 26,716 -7,739 -22% Franklintown Road 223,217 176,273 -46,944 -21% Furnace Branch 23,403 28,352 4,949 21% Garwyn Oaks 146,703 134,654 -12,050 -8% Glen Burnie 32,899 43,313 10,414 32% Glen Gardens 24,267 29,748 5,480 23% Glenwood 14,129 17,631 3,502 25% Golden Ring 117,949 79,120 -38,830 -33% Graceland 93,118 63,155 -29,963 -32% Graceland Park 155,089 116,644 -38,445 -25% Granite 2,017 29,614 27,597 1368% Greenspring 215,738 195,876 -19,862 -9% Guilford Manor 26,486 31,716 5,230 20% Harborview 42,384 40,072 -2,312 -5% Harlem Park 242,401 225,633 -16,769 -7% Harpers Choice 18,633 17,037 -1,597 -9% Hartland Run 38,007 24,874 -13,133 -35% Hawthorne 21,354 17,389 -3,965 -19% Hebbville 4,768 6,288 1,520 32% High Point 1,162 1,510 348 30% Highlandtown 243,654 216,814 -26,841 -11% Holbrook 978 18,618 17,640 1804% Hollofield 712 28,856 28,144 3953% Hyde Park 18,368 23,550 5,182 28% Irvington 138,560 207,370 68,810 50% Josenhans 35,959 3,650 -32,309 -90% Kelso 44,955 9,618 -35,337 -79% Kings Park 4,522 10,123 5,601 124% Langston Hughes 189,112 143,292 -45,820 -24% Lochearn 56,867 46,570 -10,297 -18% Longfellow 16,525 17,931 1,405 9% Lucille Park 249,671 242,299 -7,373 -3%
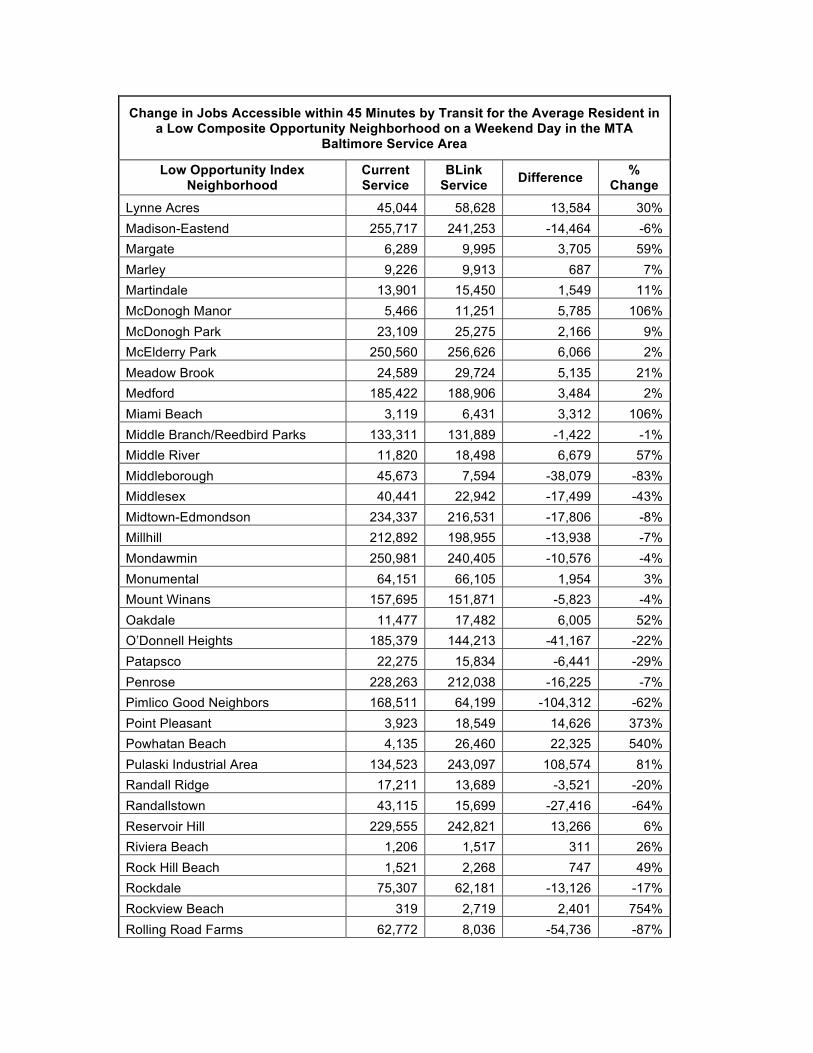
Change in Jobs Accessible within 45 Minutes by Transit for the Average Resident in a Low Composite Opportunity Neighborhood on a Weekend Day in the MTA
Baltimore Service Area
Low Opportunity Index Neighborhood
Current Service
BLink Service Difference %
Change Lynne Acres 45,044 58,628 13,584 30% Madison-Eastend 255,717 241,253 -14,464 -6% Margate 6,289 9,995 3,705 59% Marley 9,226 9,913 687 7% Martindale 13,901 15,450 1,549 11% McDonogh Manor 5,466 11,251 5,785 106% McDonogh Park 23,109 25,275 2,166 9% McElderry Park 250,560 256,626 6,066 2% Meadow Brook 24,589 29,724 5,135 21% Medford 185,422 188,906 3,484 2% Miami Beach 3,119 6,431 3,312 106% Middle Branch/Reedbird Parks 133,311 131,889 -1,422 -1% Middle River 11,820 18,498 6,679 57% Middleborough 45,673 7,594 -38,079 -83% Middlesex 40,441 22,942 -17,499 -43% Midtown-Edmondson 234,337 216,531 -17,806 -8% Millhill 212,892 198,955 -13,938 -7% Mondawmin 250,981 240,405 -10,576 -4% Monumental 64,151 66,105 1,954 3% Mount Winans 157,695 151,871 -5,823 -4% Oakdale 11,477 17,482 6,005 52% O’Donnell Heights 185,379 144,213 -41,167 -22% Patapsco 22,275 15,834 -6,441 -29% Penrose 228,263 212,038 -16,225 -7% Pimlico Good Neighbors 168,511 64,199 -104,312 -62% Point Pleasant 3,923 18,549 14,626 373% Powhatan Beach 4,135 26,460 22,325 540% Pulaski Industrial Area 134,523 243,097 108,574 81% Randall Ridge 17,211 13,689 -3,521 -20% Randallstown 43,115 15,699 -27,416 -64% Reservoir Hill 229,555 242,821 13,266 6% Riviera Beach 1,206 1,517 311 26% Rock Hill Beach 1,521 2,268 747 49% Rockdale 75,307 62,181 -13,126 -17% Rockview Beach 319 2,719 2,401 754% Rolling Road Farms 62,772 8,036 -54,736 -87%

Change in Jobs Accessible within 45 Minutes by Transit for the Average Resident in a Low Composite Opportunity Neighborhood on a Weekend Day in the MTA
Baltimore Service Area
Low Opportunity Index Neighborhood
Current Service
BLink Service Difference %
Change Rosedale 72,587 48,859 -23,728 -33% Rosemont 183,162 144,301 -38,861 -21% Rutherford Green 34,761 47,758 12,997 37% Saint Josephs 172,233 170,010 -2,223 -1% Sandtown-Winchester 259,130 251,029 -8,101 -3% Sandy Plains 21,308 73,244 51,936 244% School Gardens 1,537 1,705 167 11% Seneca Park 4,452 20,770 16,318 366% Shannon Forest 4,439 25,477 21,038 474% Silver Manor 36,622 23,034 -13,589 -37% Sollers Point 33,854 62,459 28,605 84% St Helena 108,026 38,590 -69,436 -64% Sunset Beach 1,799 1,588 -211 -12% Turner 80,712 30,615 -50,097 -62% Union Square 226,603 223,875 -2,727 -1% Upton 257,776 258,352 576 0% West Edmondale 114,965 12,517 -102,448 -89% West Forest Park 79,895 33,715 -46,179 -58% Westport 227,356 171,295 -56,062 -25% Wilson Point 3,114 16,991 13,877 446% Winchester 192,311 178,984 -13,327 -7% Windsor Mill 40,111 11,217 -28,894 -72% Woodmoor 47,501 65,064 17,563 37%
Yale Heights 114,433 121,583 7,150 6%
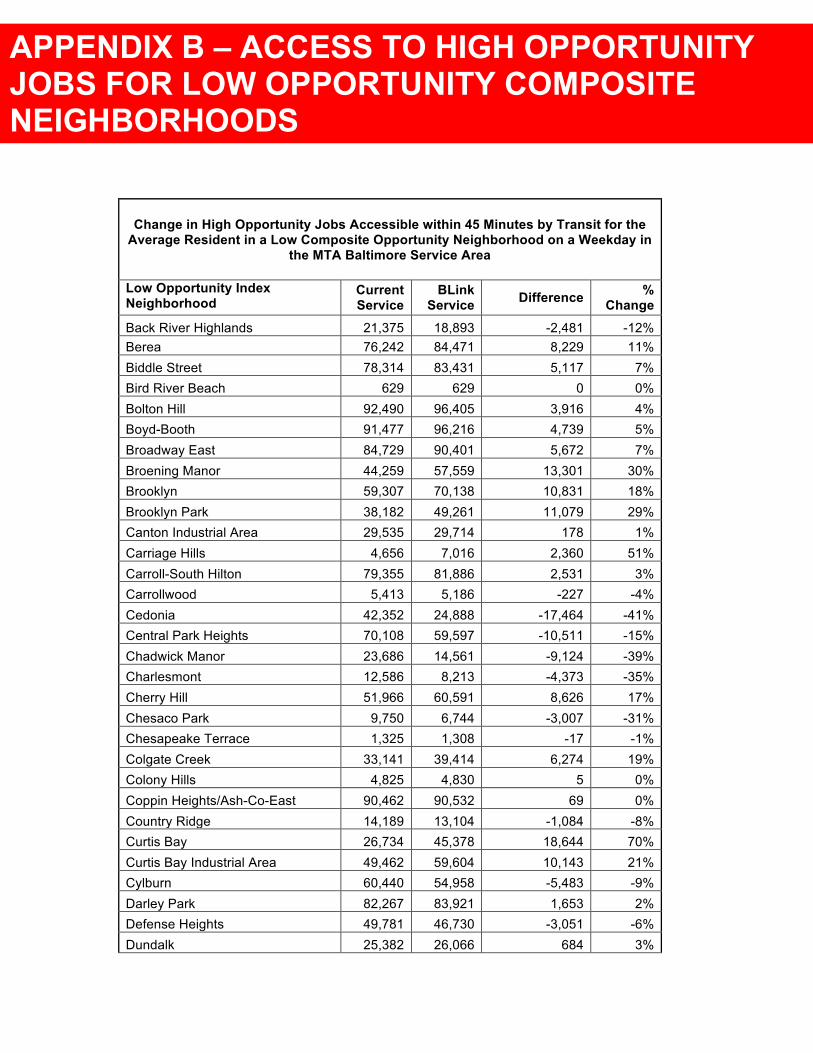
Change in High Opportunity Jobs Accessible within 45 Minutes by Transit for the Average Resident in a Low Composite Opportunity Neighborhood on a Weekday in
the MTA Baltimore Service Area
Low Opportunity Index Neighborhood
Current Service
BLink Service Difference %
Change Back River Highlands 21,375 18,893 -2,481 -12% Berea 76,242 84,471 8,229 11% Biddle Street 78,314 83,431 5,117 7% Bird River Beach 629 629 0 0% Bolton Hill 92,490 96,405 3,916 4% Boyd-Booth 91,477 96,216 4,739 5% Broadway East 84,729 90,401 5,672 7% Broening Manor 44,259 57,559 13,301 30% Brooklyn 59,307 70,138 10,831 18% Brooklyn Park 38,182 49,261 11,079 29% Canton Industrial Area 29,535 29,714 178 1% Carriage Hills 4,656 7,016 2,360 51% Carroll-South Hilton 79,355 81,886 2,531 3% Carrollwood 5,413 5,186 -227 -4% Cedonia 42,352 24,888 -17,464 -41% Central Park Heights 70,108 59,597 -10,511 -15% Chadwick Manor 23,686 14,561 -9,124 -39% Charlesmont 12,586 8,213 -4,373 -35% Cherry Hill 51,966 60,591 8,626 17% Chesaco Park 9,750 6,744 -3,007 -31% Chesapeake Terrace 1,325 1,308 -17 -1% Colgate Creek 33,141 39,414 6,274 19% Colony Hills 4,825 4,830 5 0% Coppin Heights/Ash-Co-East 90,462 90,532 69 0% Country Ridge 14,189 13,104 -1,084 -8% Curtis Bay 26,734 45,378 18,644 70% Curtis Bay Industrial Area 49,462 59,604 10,143 21% Cylburn 60,440 54,958 -5,483 -9% Darley Park 82,267 83,921 1,653 2% Defense Heights 49,781 46,730 -3,051 -6% Dundalk 25,382 26,066 684 3%
APPENDIX B – ACCESS TO HIGH OPPORTUNITY JOBS FOR LOW OPPORTUNITY COMPOSITE NEIGHBORHOODS

Change in High Opportunity Jobs Accessible within 45 Minutes by Transit for the Average Resident in a Low Composite Opportunity Neighborhood on a Weekday in
the MTA Baltimore Service Area
Low Opportunity Index Neighborhood
Current Service
BLink Service Difference %
Change Easterwood 88,435 93,956 5,522 6% Eastport 5,361 5,377 17 0% Edgemere 3,003 2,883 -120 -4% Edrich 726 2,067 1,341 185% Eliots Oak 3,741 3,726 -15 0% Essex 25,249 20,068 -5,180 -21% Essexshire Gate 9,102 8,786 -316 -3% Evergreen Park 245 245 0 0% Fairmont 85,852 88,155 2,303 3% Forest Park 78,716 82,463 3,747 5% Four By Four 78,681 83,187 4,506 6% Fox Ridge Manor 11,367 10,877 -491 -4% Franklintown Road 86,501 93,362 6,861 8% Furnace Branch 10,425 11,196 771 7% Garwyn Oaks 63,073 68,380 5,307 8% Glen Burnie 13,570 13,749 179 1% Glen Gardens 9,149 9,320 171 2% Glenwood 5,594 5,521 -73 -1% Golden Ring 39,971 23,815 -16,156 -40% Graceland 33,001 37,886 4,884 15% Graceland Park 51,982 58,612 6,630 13% Granite 950 7,003 6,053 637% Greenspring 81,149 78,719 -2,430 -3% Guilford Manor 14,854 18,686 3,832 26% Harborview 17,387 16,573 -814 -5% Harlem Park 83,024 95,857 12,833 15% Harpers Choice 4,767 4,758 -9 0% Hartland Run 12,770 12,237 -532 -4% Hawthorne 7,982 7,411 -571 -7% Hebbville 3,025 2,882 -143 -5% High Point 310 310 0 0% Highlandtown 85,600 93,599 7,999 9% Holbrook 612 1,511 899 147% Hollofield 613 623 11 2% Hyde Park 6,138 6,098 -40 -1% Irvington 74,928 75,825 896 1%
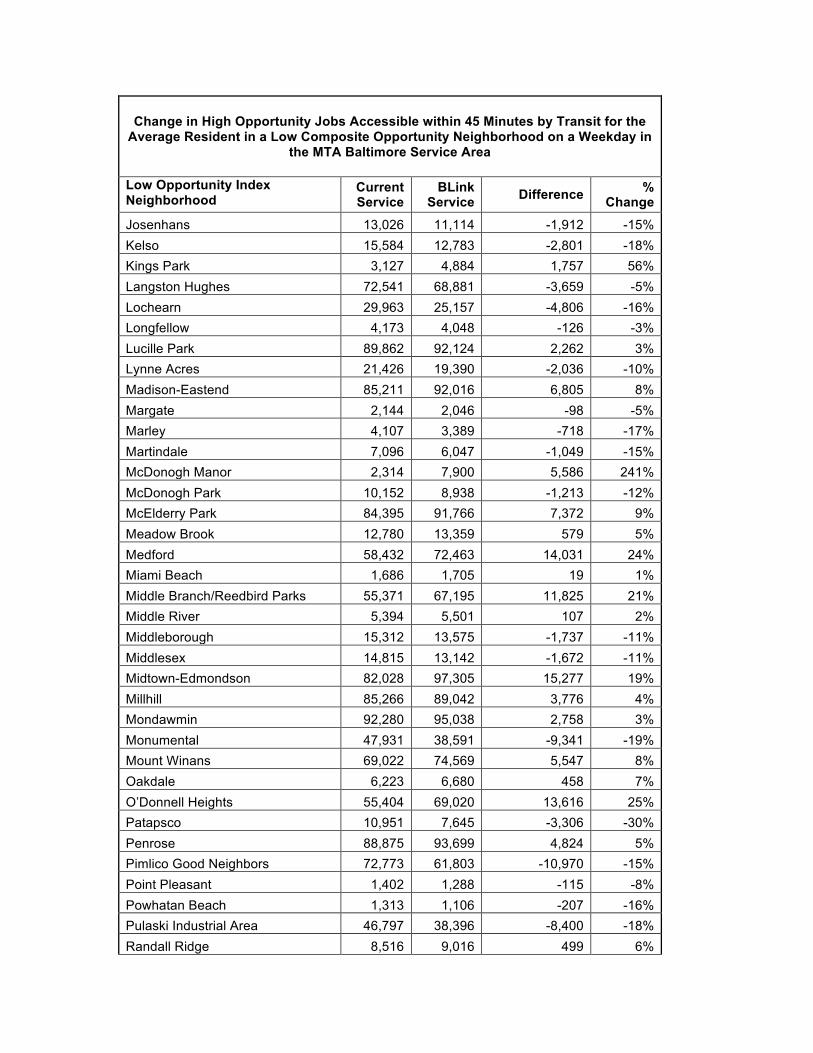
Change in High Opportunity Jobs Accessible within 45 Minutes by Transit for the Average Resident in a Low Composite Opportunity Neighborhood on a Weekday in
the MTA Baltimore Service Area
Low Opportunity Index Neighborhood
Current Service
BLink Service Difference %
Change Josenhans 13,026 11,114 -1,912 -15% Kelso 15,584 12,783 -2,801 -18% Kings Park 3,127 4,884 1,757 56% Langston Hughes 72,541 68,881 -3,659 -5% Lochearn 29,963 25,157 -4,806 -16% Longfellow 4,173 4,048 -126 -3% Lucille Park 89,862 92,124 2,262 3% Lynne Acres 21,426 19,390 -2,036 -10% Madison-Eastend 85,211 92,016 6,805 8% Margate 2,144 2,046 -98 -5% Marley 4,107 3,389 -718 -17% Martindale 7,096 6,047 -1,049 -15% McDonogh Manor 2,314 7,900 5,586 241% McDonogh Park 10,152 8,938 -1,213 -12% McElderry Park 84,395 91,766 7,372 9% Meadow Brook 12,780 13,359 579 5% Medford 58,432 72,463 14,031 24% Miami Beach 1,686 1,705 19 1% Middle Branch/Reedbird Parks 55,371 67,195 11,825 21% Middle River 5,394 5,501 107 2% Middleborough 15,312 13,575 -1,737 -11% Middlesex 14,815 13,142 -1,672 -11% Midtown-Edmondson 82,028 97,305 15,277 19% Millhill 85,266 89,042 3,776 4% Mondawmin 92,280 95,038 2,758 3% Monumental 47,931 38,591 -9,341 -19% Mount Winans 69,022 74,569 5,547 8% Oakdale 6,223 6,680 458 7% O’Donnell Heights 55,404 69,020 13,616 25% Patapsco 10,951 7,645 -3,306 -30% Penrose 88,875 93,699 4,824 5% Pimlico Good Neighbors 72,773 61,803 -10,970 -15% Point Pleasant 1,402 1,288 -115 -8% Powhatan Beach 1,313 1,106 -207 -16% Pulaski Industrial Area 46,797 38,396 -8,400 -18% Randall Ridge 8,516 9,016 499 6%
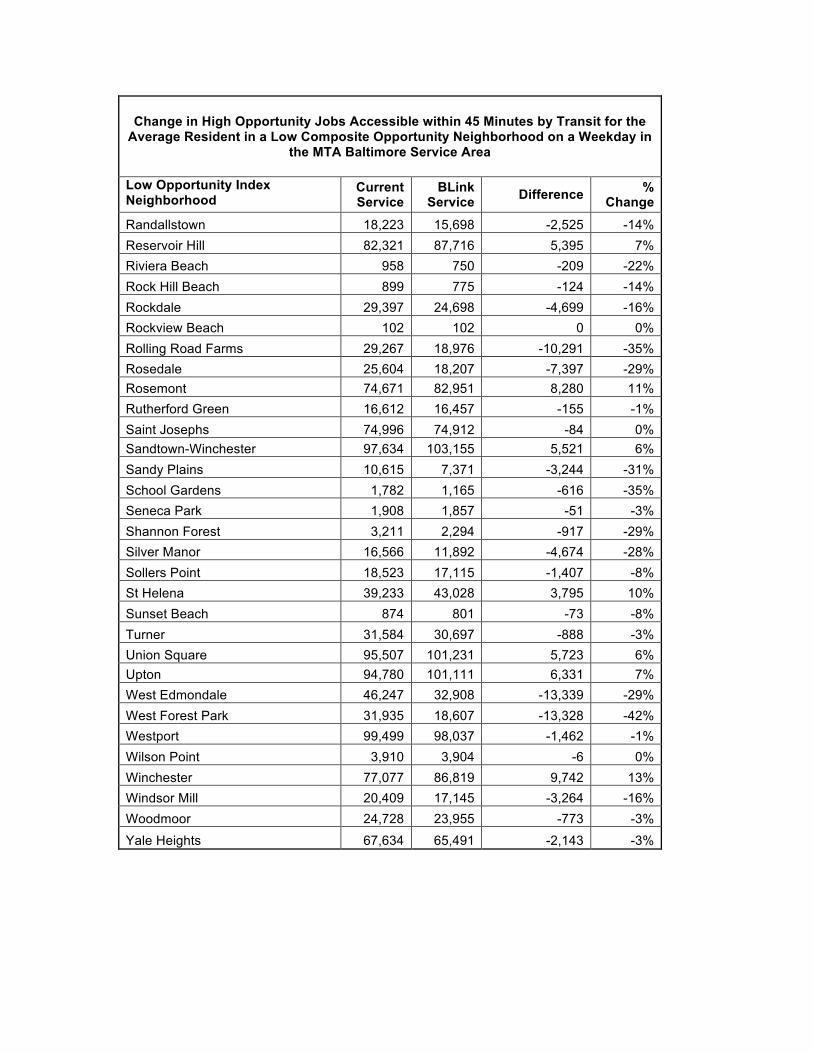
Change in High Opportunity Jobs Accessible within 45 Minutes by Transit for the Average Resident in a Low Composite Opportunity Neighborhood on a Weekday in
the MTA Baltimore Service Area
Low Opportunity Index Neighborhood
Current Service
BLink Service Difference %
Change Randallstown 18,223 15,698 -2,525 -14% Reservoir Hill 82,321 87,716 5,395 7% Riviera Beach 958 750 -209 -22% Rock Hill Beach 899 775 -124 -14% Rockdale 29,397 24,698 -4,699 -16% Rockview Beach 102 102 0 0% Rolling Road Farms 29,267 18,976 -10,291 -35% Rosedale 25,604 18,207 -7,397 -29% Rosemont 74,671 82,951 8,280 11% Rutherford Green 16,612 16,457 -155 -1% Saint Josephs 74,996 74,912 -84 0% Sandtown-Winchester 97,634 103,155 5,521 6% Sandy Plains 10,615 7,371 -3,244 -31% School Gardens 1,782 1,165 -616 -35% Seneca Park 1,908 1,857 -51 -3% Shannon Forest 3,211 2,294 -917 -29% Silver Manor 16,566 11,892 -4,674 -28% Sollers Point 18,523 17,115 -1,407 -8% St Helena 39,233 43,028 3,795 10% Sunset Beach 874 801 -73 -8% Turner 31,584 30,697 -888 -3% Union Square 95,507 101,231 5,723 6% Upton 94,780 101,111 6,331 7% West Edmondale 46,247 32,908 -13,339 -29% West Forest Park 31,935 18,607 -13,328 -42% Westport 99,499 98,037 -1,462 -1% Wilson Point 3,910 3,904 -6 0% Winchester 77,077 86,819 9,742 13% Windsor Mill 20,409 17,145 -3,264 -16% Woodmoor 24,728 23,955 -773 -3% Yale Heights 67,634 65,491 -2,143 -3%
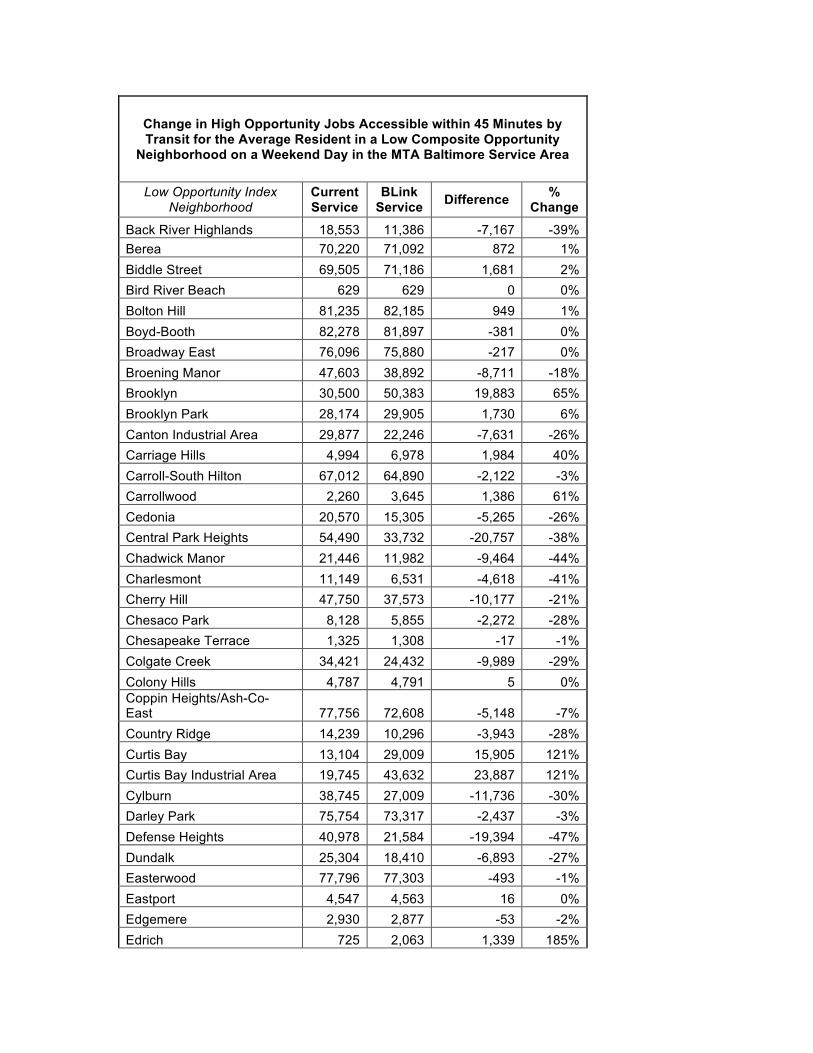
Change in High Opportunity Jobs Accessible within 45 Minutes by Transit for the Average Resident in a Low Composite Opportunity
Neighborhood on a Weekend Day in the MTA Baltimore Service Area
Low Opportunity Index Neighborhood
Current Service
BLink Service Difference %
Change Back River Highlands 18,553 11,386 -7,167 -39% Berea 70,220 71,092 872 1% Biddle Street 69,505 71,186 1,681 2% Bird River Beach 629 629 0 0% Bolton Hill 81,235 82,185 949 1% Boyd-Booth 82,278 81,897 -381 0% Broadway East 76,096 75,880 -217 0% Broening Manor 47,603 38,892 -8,711 -18% Brooklyn 30,500 50,383 19,883 65% Brooklyn Park 28,174 29,905 1,730 6% Canton Industrial Area 29,877 22,246 -7,631 -26% Carriage Hills 4,994 6,978 1,984 40% Carroll-South Hilton 67,012 64,890 -2,122 -3% Carrollwood 2,260 3,645 1,386 61% Cedonia 20,570 15,305 -5,265 -26% Central Park Heights 54,490 33,732 -20,757 -38% Chadwick Manor 21,446 11,982 -9,464 -44% Charlesmont 11,149 6,531 -4,618 -41% Cherry Hill 47,750 37,573 -10,177 -21% Chesaco Park 8,128 5,855 -2,272 -28% Chesapeake Terrace 1,325 1,308 -17 -1% Colgate Creek 34,421 24,432 -9,989 -29% Colony Hills 4,787 4,791 5 0% Coppin Heights/Ash-Co-East 77,756 72,608 -5,148 -7% Country Ridge 14,239 10,296 -3,943 -28% Curtis Bay 13,104 29,009 15,905 121% Curtis Bay Industrial Area 19,745 43,632 23,887 121% Cylburn 38,745 27,009 -11,736 -30% Darley Park 75,754 73,317 -2,437 -3% Defense Heights 40,978 21,584 -19,394 -47% Dundalk 25,304 18,410 -6,893 -27% Easterwood 77,796 77,303 -493 -1% Eastport 4,547 4,563 16 0% Edgemere 2,930 2,877 -53 -2% Edrich 725 2,063 1,339 185%
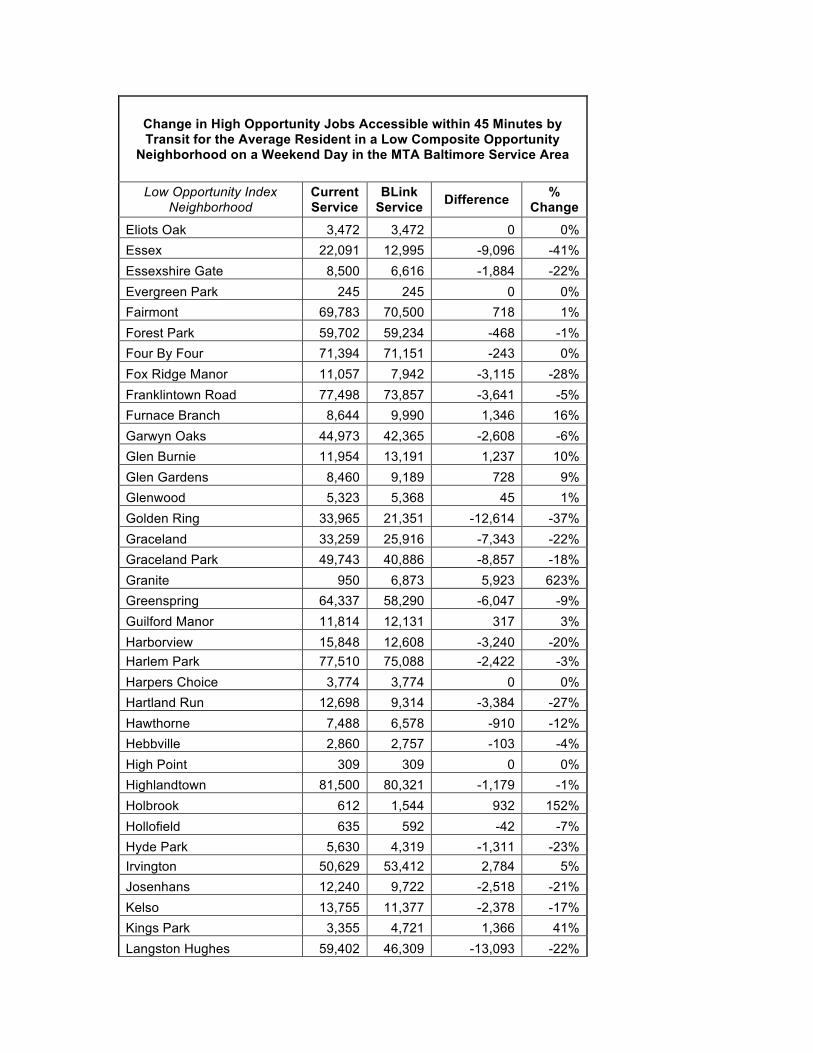
Change in High Opportunity Jobs Accessible within 45 Minutes by Transit for the Average Resident in a Low Composite Opportunity
Neighborhood on a Weekend Day in the MTA Baltimore Service Area
Low Opportunity Index Neighborhood
Current Service
BLink Service Difference %
Change Eliots Oak 3,472 3,472 0 0% Essex 22,091 12,995 -9,096 -41% Essexshire Gate 8,500 6,616 -1,884 -22% Evergreen Park 245 245 0 0% Fairmont 69,783 70,500 718 1% Forest Park 59,702 59,234 -468 -1% Four By Four 71,394 71,151 -243 0% Fox Ridge Manor 11,057 7,942 -3,115 -28% Franklintown Road 77,498 73,857 -3,641 -5% Furnace Branch 8,644 9,990 1,346 16% Garwyn Oaks 44,973 42,365 -2,608 -6% Glen Burnie 11,954 13,191 1,237 10% Glen Gardens 8,460 9,189 728 9% Glenwood 5,323 5,368 45 1% Golden Ring 33,965 21,351 -12,614 -37% Graceland 33,259 25,916 -7,343 -22% Graceland Park 49,743 40,886 -8,857 -18% Granite 950 6,873 5,923 623% Greenspring 64,337 58,290 -6,047 -9% Guilford Manor 11,814 12,131 317 3% Harborview 15,848 12,608 -3,240 -20% Harlem Park 77,510 75,088 -2,422 -3% Harpers Choice 3,774 3,774 0 0% Hartland Run 12,698 9,314 -3,384 -27% Hawthorne 7,488 6,578 -910 -12% Hebbville 2,860 2,757 -103 -4% High Point 309 309 0 0% Highlandtown 81,500 80,321 -1,179 -1% Holbrook 612 1,544 932 152% Hollofield 635 592 -42 -7% Hyde Park 5,630 4,319 -1,311 -23% Irvington 50,629 53,412 2,784 5% Josenhans 12,240 9,722 -2,518 -21% Kelso 13,755 11,377 -2,378 -17% Kings Park 3,355 4,721 1,366 41% Langston Hughes 59,402 46,309 -13,093 -22%

Change in High Opportunity Jobs Accessible within 45 Minutes by Transit for the Average Resident in a Low Composite Opportunity
Neighborhood on a Weekend Day in the MTA Baltimore Service Area
Low Opportunity Index Neighborhood
Current Service
BLink Service Difference %
Change Lochearn 18,002 18,143 141 1% Longfellow 3,530 3,530 0 0% Lucille Park 78,561 75,210 -3,352 -4% Lynne Acres 19,235 16,758 -2,477 -13% Madison-Eastend 82,088 77,903 -4,186 -5% Margate 2,022 2,035 13 1% Marley 2,319 3,634 1,315 57% Martindale 4,429 6,494 2,066 47% McDonogh Manor 2,378 7,643 5,265 221% McDonogh Park 10,782 8,485 -2,298 -21% McElderry Park 80,367 77,828 -2,540 -3% Meadow Brook 10,139 11,608 1,469 14% Medford 60,718 58,229 -2,488 -4% Miami Beach 1,194 1,314 120 10% Middle Branch/Reedbird Parks 47,526 45,613 -1,913 -4% Middle River 4,927 3,783 -1,144 -23% Middleborough 15,282 10,973 -4,309 -28% Middlesex 13,705 11,817 -1,889 -14% Midtown-Edmondson 77,370 75,608 -1,762 -2% Millhill 76,609 75,719 -890 -1% Mondawmin 82,713 79,391 -3,322 -4% Monumental 33,830 27,204 -6,625 -20% Mount Winans 61,864 61,731 -133 0% Oakdale 5,516 4,656 -860 -16% O’Donnell Heights 60,161 53,537 -6,624 -11% Patapsco 9,585 7,290 -2,295 -24% Penrose 79,675 75,272 -4,403 -6% Pimlico Good Neighbors 56,173 40,636 -15,537 -28% Point Pleasant 1,259 1,259 0 0% Powhatan Beach 1,074 1,138 64 6% Pulaski Industrial Area 38,697 30,530 -8,167 -21% Randall Ridge 9,224 8,606 -618 -7% Randallstown 17,740 13,849 -3,891 -22% Reservoir Hill 70,618 74,424 3,806 5% Riviera Beach 374 374 0 0%
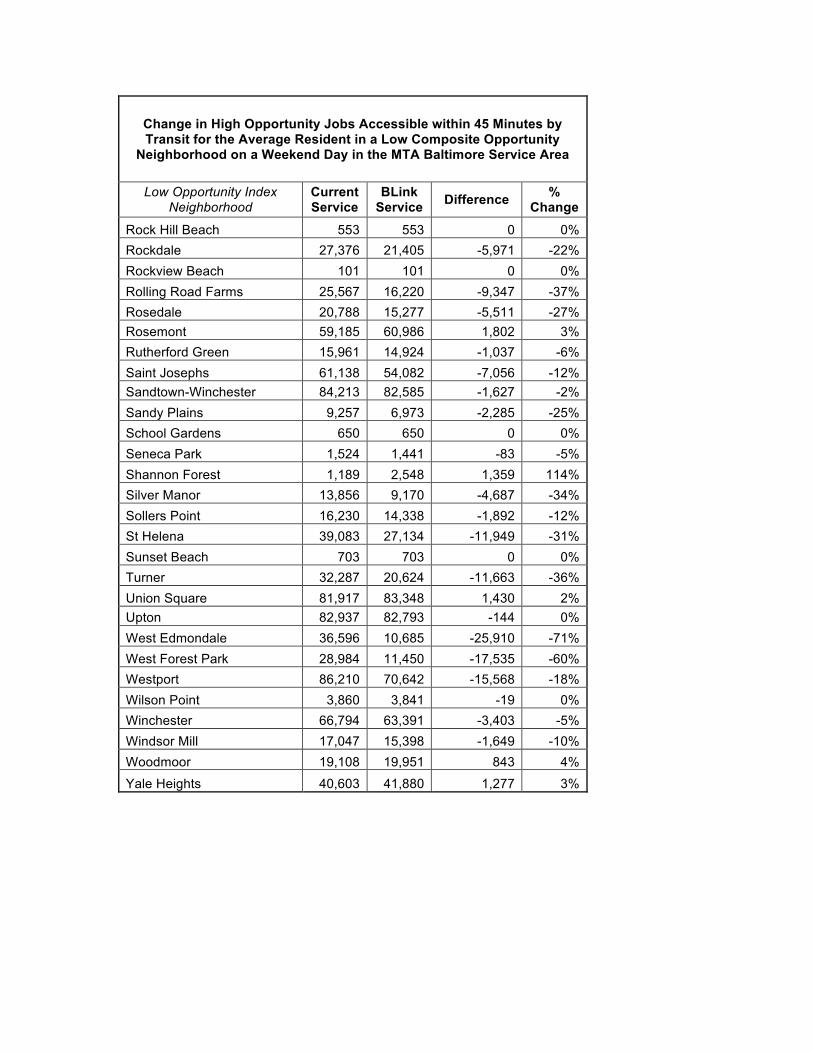
Change in High Opportunity Jobs Accessible within 45 Minutes by Transit for the Average Resident in a Low Composite Opportunity
Neighborhood on a Weekend Day in the MTA Baltimore Service Area
Low Opportunity Index Neighborhood
Current Service
BLink Service Difference %
Change Rock Hill Beach 553 553 0 0% Rockdale 27,376 21,405 -5,971 -22% Rockview Beach 101 101 0 0% Rolling Road Farms 25,567 16,220 -9,347 -37% Rosedale 20,788 15,277 -5,511 -27% Rosemont 59,185 60,986 1,802 3% Rutherford Green 15,961 14,924 -1,037 -6% Saint Josephs 61,138 54,082 -7,056 -12% Sandtown-Winchester 84,213 82,585 -1,627 -2% Sandy Plains 9,257 6,973 -2,285 -25% School Gardens 650 650 0 0% Seneca Park 1,524 1,441 -83 -5% Shannon Forest 1,189 2,548 1,359 114% Silver Manor 13,856 9,170 -4,687 -34% Sollers Point 16,230 14,338 -1,892 -12% St Helena 39,083 27,134 -11,949 -31% Sunset Beach 703 703 0 0% Turner 32,287 20,624 -11,663 -36% Union Square 81,917 83,348 1,430 2% Upton 82,937 82,793 -144 0% West Edmondale 36,596 10,685 -25,910 -71% West Forest Park 28,984 11,450 -17,535 -60% Westport 86,210 70,642 -15,568 -18% Wilson Point 3,860 3,841 -19 0% Winchester 66,794 63,391 -3,403 -5% Windsor Mill 17,047 15,398 -1,649 -10% Woodmoor 19,108 19,951 843 4% Yale Heights 40,603 41,880 1,277 3%
Sugar Access contains several analysis tools for measuring accessibility in different ways. The Accessibility Calculator function provides two possible types of output. Within this function, a Destination Summation calculates the number of destinations accessible from every other location in the study area within a chosen travel time cutoff, such as 45 minutes. A Travel Time analysis calculates the minimum travel time to a destination, such as a school or grocery store, from any other location. The Access Score function is analogous to commercial walkability score calculators that are familiar to many. The tool sets a target number of “points of interest” (POI) for each location to deem that location accessible. Each potential destination is scored based on its proximity to the origin. The software assumes that those points located closer to the origin are more valuable to the individual traveling than those further away. Thus, those destinations where the target number of POI are all within 5 minutes of travel time receive a full score. Conversely, if all destinations require more than an hour of travel time, the origin will receive a score of 0 for that category. Finally, the Map Mixer function allows comparisons between the existing transportation network and proposed changes. Citilabs, the creator of Sugar Access, created transit models for both the existing (baseline) transit service as well as for the BaltimoreLink plan. As described below, they utilize General Transit Feed Specification (GTFS) data files describing the transit system to create these models. The T4A team worked with MTA and its consultants to obtain the BaltimoreLink 2.0 GTFS data files released in July 2016. T4A and Citilabs held a conference call with MTA’s consultant responsible for creating the BaltimoreLink GTFS data, Foursquare Integrated Transportation Planning, to understand how this model incorporated MTA’s observed on-time performance. Because Foursquare incorporated observed performance on a segment-by-segment basis based on the existing MTA service, using actual data collected in the field in fall 2015, all parties agreed that no further modification of the BaltimoreLink 2.0 GTFS data files was warranted. For the existing (baseline) MTA service, the project team obtained the actual performance data from fall 2015 described above that MTA’s consultant utilized to create the BaltimoreLink GTFS files. Citilabs altered the run time of the baseline routes based on the observed deviation from the schedule taking into account both time of day (morning, afternoon, or evening) and day of the week (weekday or weekend).
APPENDIX C – DESCRIPTION OF CITILABS’ SUGAR ACCESS ANALYSIS TOOL
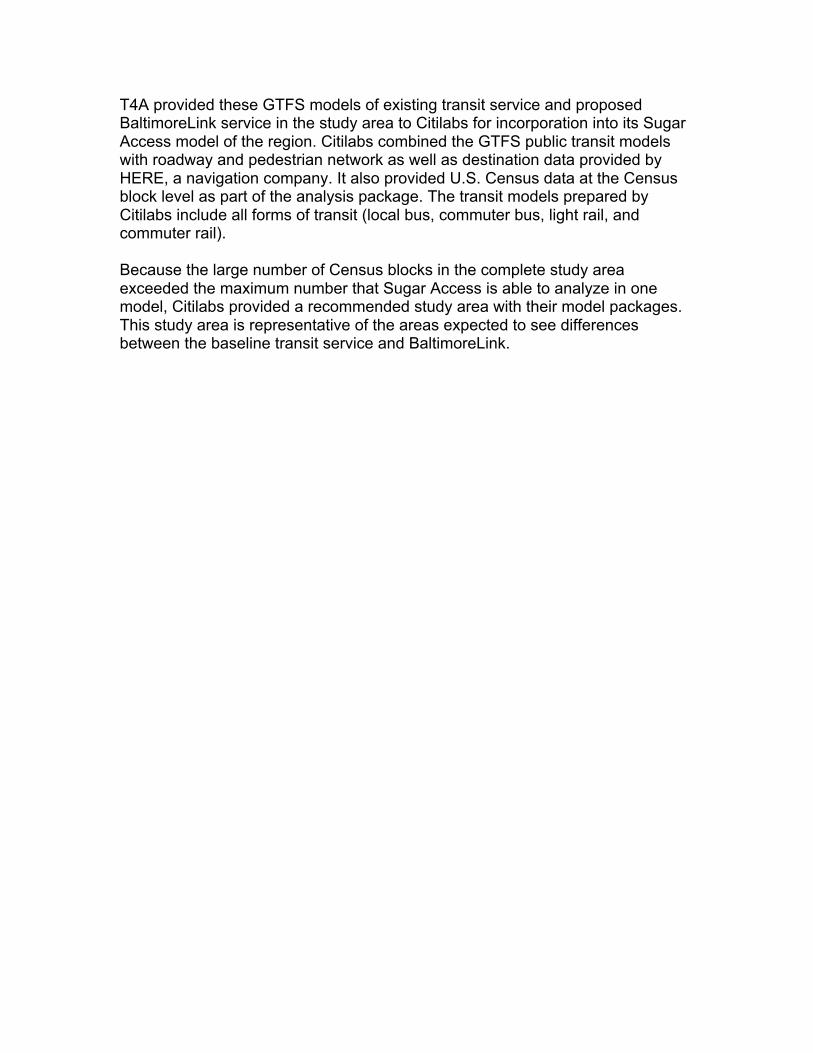
T4A provided these GTFS models of existing transit service and proposed BaltimoreLink service in the study area to Citilabs for incorporation into its Sugar Access model of the region. Citilabs combined the GTFS public transit models with roadway and pedestrian network as well as destination data provided by HERE, a navigation company. It also provided U.S. Census data at the Census block level as part of the analysis package. The transit models prepared by Citilabs include all forms of transit (local bus, commuter bus, light rail, and commuter rail). Because the large number of Census blocks in the complete study area exceeded the maximum number that Sugar Access is able to analyze in one model, Citilabs provided a recommended study area with their model packages. This study area is representative of the areas expected to see differences between the baseline transit service and BaltimoreLink.