fiscal policy changes in namibia: are namibians better off
TRANSCRIPT

69PB Strategic Review for Southern Africa, Vol 42, No 1. May/June 2020
ISSN 1013-1108
Fiscal Policy Changes in Namibia: Are Namibians Better Off After Independence?
Christopher P.P. ShafudaUniversity of Namibia, NamibiaDepartment of Economics, North-Eastern Hill University, India
Utpal Kumar DeDepartment of Economics, North-Eastern Hill University, India
Abstract
An attempt is made in this article to examine the effect of new policy instruments implemented by the self-governing Namibia on the aspects of human development. We analysed whether the changes in fiscal policy adopted in post-independence era have improved the quality of life of Namibians as compared to pre-independence era. Time series data on government expenditures as well as health and education related indicators for the period 1980 to 2015 has been used for the purpose of analysis. Impacts of per capita government expenditure on healthcare and education on reduction in mortality, increase in life expectancy at birth, rising literacy and growth of people acquiring higher education/technical education have been examined. During 1980 to 1990, Namibia was under South African control, a colonial era, and, therefore, in the 1991 to 2015 period Namibia was independent. The study reveals that Namibians are better off in the post-independence as compared to the colonial era on major parameters. However, changes in policy have not been successful in transforming the lives of Namibians to the levels expected. There is still ample scope for improvement in the fiscal management of the country.
Keywords: Policy Instruments; Healthcare; Education; Human Development; Namibia; South Africa

7170 Strategic Review for Southern Africa, Vol 42, No 1. May/June 2020
ISSN 1013-1108
Introduction
The history of Namibia passed through several distinct stages, from tribal demarcations to the creation of political borders that was marked by colonialism in the late nineteenth century to independence on 21 March 1990. Since 1884 till First World War, Namibia was a German colony, which was then referred to as German South West Africa. After the First World War, South Africa, being a member of the British Commonwealth and a former British colony, was mandated to administer this territory by the League of Nations. As a result, in 1915 South Africa occupied Namibia and made it the fifth province, namely South-West Africa province. Namibia therefore, exchanged one colonial experience for another.
Following World War II, the League of Nations was dissolved in April 1946 and its successor, the United Nations, instituted a Trusteeship system to bring all the former German colonies in Africa under UN control. However, South Africa did not agree with this arrangement in case of this fifth province (presently Namibia) on the argument that majority of its population were comfortable with South African rule. In 1948, the Afrikaner led National Party gained power in South Africa and the then system of segregation that was prevalent in colonial Africa was intensified through its apartheid policy. One example of the way in which divisions between communities were created was the increasingly harsh application of the “Immorality Act”, which termed it “immoral” and illegal for a white person to have a sexual relationship or any sexual contact with a person of different skin colour. Nevertheless, after a number of UN resolutions (Resolution 2145 (XXI) of 27 October 1966, resolutions 385 (1976), 431 (1978), Security Council Resolution 435 of 29th September, 1978) and the prolonged guerrilla war, Namibia earned independence in 1990 (after 75 years under the South African regime). The Namibians got absolute power to make decisions and allocate resources with progressive fiscal measures for the welfare of its own people.
Given the aforesaid background, efforts are made in this paper to examine the effect of the policy instruments, which have been implemented by the government of independent Namibia, on various aspects of human development. It is analysed whether the policy changes adopted after independence to improve the education and primary healthcare systems has really made the life of the

7170 Strategic Review for Southern Africa, Vol 42, No 1. May/June 2020
ISSN 1013-1108
Namibians better as compared to pre-independence era.
Status of Education and Healthcare after Independence
The independent government inherited an economy of highly skewed income distribution with resourceful minority white settlers, and majority of the country’s indigenous people was in absolute poverty (Namibia Statistics Agency 2010). Income inequality in Namibia was extreme, as was inequity in access to healthcare services and education. In order to attain faster economic growth and redress inequality, the government of independent Namibia needed to follow some prudent macroeconomic policies (Sherbourne 2016). Hence, the new government gave more emphasis to education, primary healthcare and other social protection measures. Before independence, the healthcare system in Namibia was highly fragmented and biased towards curative care, which was inefficient and inadequate, and thus the previously-disadvantaged were at the bitter end of the stick. At the time of independence in 1990, the healthcare delivery system reflected a traditional medical model, focused mainly on hospital-based and curative services and the health outcomes were generally poor.
Soon after independence, a switch in policy with emphasis on primary healthcare was adopted. In order to provide effective and equitable primary healthcare services, the healthcare reform included the decentralisation of responsibilities and local communities were involved in the decision-making processes (Low, Ithindi and Low 2003). In 1994, thirteen regional health management teams were set up to plan and manage all local primary healthcare services and facilities equitably. These teams were responsible for managing district health management teams as they sought to operationalise a primary care approach.
Since independence, access to healthcare facilities has improved. The area of coverage within 10 km of healthcare facility has more than tripled. Number of such facilities increased from 98 in 1981 to 317 in 2000 and further to 448 by 2010. As a result, 80 per cent of the population lived within 10 km of a clinic or a hospital in 2000 (Obeid, et al. 2001), which further increased to 85 per cent in 2010 (MHSS 2010). Access to doctors has also improved to about 7500 people per public service doctor and 250 people per hospital bed in 2010. According to World Health Organisation (2010) Namibia has 343 public hospitals and

7372 Strategic Review for Southern Africa, Vol 42, No 1. May/June 2020
ISSN 1013-1108
clinics, as well as 1150 smaller service points. There are four tiers in the public healthcare system: 1150 outreach points, 309 health centres, 34 district hospitals, and 4 intermediate and referral hospitals. In addition to that there are a number of private healthcare facilities in the country.
Like healthcare, the education system was also designed in line with apartheid mode in the pre-independence period, instead of providing the necessary human resource base to promote equitable social and economic development across all races and ethnic groups. Education system was fragmented along racial and ethnic lines, with vast disparities in both the allocation of resources and offering quality education (Zaaruka, Biwa & Kalenga 2001). The new government then pledged to address the education issue, and therefore created a uniform structure for education administration for all groups. Accordingly, educational reforms were adopted and basic education became one of the Namibia’s top priorities. In 1990, Namibia’s Education Ministry set five goals: (1) to achieve improved and equitable access to education, (2) to improve the quality of education, (3) to enhance democratic participation in the education system, (4) to improve efficiency in the education system and (5) to promote life-long learning (Zaaruka, Biwa & Kalenga 2001).
A uniform and learner-centred curriculum for grades one through twelve was finalised in 1998 (replacing the old standard one to ten curriculum) and significant progress has been made in the use of English (replacing Afrikaans as the nation’s official language) as a medium of instruction. By 2010, about 95 percent of school aged children attended school and the number of teachers has increased by almost 30 percent over 1990 statistics. More than 3000 new classrooms have been built since 1990. As a result, repetition rates in all grades have been reduced and dropout rates have also dropped significantly. In 1991, half the learners in grade 1 were repeating the grade; but in 2003, over 84 percent of learners were earning their promotions on time (Fischer 2012).
According to Ministry of Education, Government of Namibia (2015) there were approximately 1600 schools in Namibia, of which over 100 were privately owned in 2013. By the end of 2009, net primary enrolment (grade 1-7) rate had reached 98 percent from 89 percent in 1992. The Ministry of Education reports that in 2007 total number of teachers was 20333, of which 894 was without teachers’ training. As per qualification, 15568 teachers had more than two years of tertiary-level education, 3285 had grade 12 or 1-2 years of tertiary education,

7372 Strategic Review for Southern Africa, Vol 42, No 1. May/June 2020
ISSN 1013-1108
and 1,480 had less than grade 12. About 71 percent of primary school teachers and 90.3 percent of secondary school teachers were qualified. Overall student-teacher ratio was 28:1 (MOE 2008).
Despite the policy changes on education and healthcare and the adoption of expansionary fiscal policy over the past two and half decades, the economy has still been facing serious challenges of high unemployment and income inequality. According to the Namibia Labour Survey report (2016), unemployment in the country stands at 28 per cent of the country’s total labour force in 2015. Furthermore, a high per capita GDP (as high as US$ 6800 in 2015) as compared to other African countries, hides one of the world’s most unequal distribution of income, as reflected by Namibia’s Gini coefficient of 57.6. Although, Namibia’s Gini coefficient has improved gradually over the years (from 70 in 1993 to 63 in 2004, and further to 59.7 in 2010) the country ranked as the most unequal country in the world, competing only with South Africa (Namibia Statistics Agency, Govt. of Namibia 2010). Theoretical Framework and Empirical Review
As per theory, fiscal policy plays a key role in promoting and maintaining macroeconomic stability, which in turn is a prerequisite for high and sustainable economic growth. This is supported by the standard effective demand theory of Keynesian macroeconomic framework, which is based on the proposition that an increase in government intervention through expansionary fiscal policy bring about an increase in aggregate demand, which inspires economic growth (Keynes 1936). This theory suggests that a proactive public policy intervention is a crucial instrument in the hands of governments to stimulate economic activity and growth. However, the Keynesian theory is in direct opposition to an earlier theory by Wagner (1890), the ‘law of the expanding state role’, which suggests that government expenditure is an endogenous factor or an outcome, not a cause of economic growth. The classical school of thought however suggest that government should limit its participation on economic activities (Skousen 2009). Classical theories assumed that if the economy is left to itself, it will function better. Therefore, the government intervention will cause disturbances in the economy.
Empirically, Solow’s (1957) neo-classical model provides the necessary
7574 Strategic Review for Southern Africa, Vol 42, No 1. May/June 2020
ISSN 1013-1108
foundations for growth estimation; which has however ignored the role of human capital in the determination of economic growth. The model assumes that countries use their resources efficiently and therefore there are diminishing returns to capital and labour. In the 1960s, pivotal works of Schultz (1961), Denison (1962), Becker, (1962 & 1964) highlighted the role of education in human capital accumulation for economic growth. In these models, human capital contributed to the enhanced productivity of the labour force, and subsequent growth in national income.
However, Blaug (1970) and Sheehan (1971) opined that investment in education is just merely consumption since the investment in acquiring knowledge or skills is for the individual interests only and does not contribute to economic growth. To support this argument, Devarajan et al. (1996: 325) using data on 43 developing countries showed that excessive government expenditure in education is negatively correlated with the countries’ economic growth. They suggested that “expenditures which are normally considered productive could become unproductive if there is an excessive amount of them”, and capital spending in developing countries may have squeezed current spending at the margin. Also, corruption in the economy could have made expenditure on items like education unproductive.
The groundwork on importance of human capital in economic growth was highlighted in much of the new growth theories, which came to prominence in the late 1980s and the early 1990s. Lucas (1988: 22) developed an endogenous growth model, where he specified education as the critical force that generated technical progress in an economy. Lucas’ model showed that education and the creation of human capital could be responsible for both the differences in productivity and the overall technological progress in an economy. Lucas designed what he called the ‘mechanics’ suitable for studying economic development, a system of equations, where the solutions imitated the features of economic behaviour observed in the real world.
Existing literature accepts education as one of the primary components of human capital since education, other than improving productivity of labour, has certain spill-over benefits. In addition to benefiting the individuals who receive it, in modern economies, investment in human capital is a key determinant of economic growth. Hence, government expenditure helps economic growth if human capital investment is formed in the process of infrastructure development

7574 Strategic Review for Southern Africa, Vol 42, No 1. May/June 2020
ISSN 1013-1108
necessary for schooling and skill formation (Ismail 1996; Agenor 2008; and Mekdad, Dahmani and Louaj 2014). On this basis, education is considered a long term investment that leads to higher production in a country in the future and promotes growth. Afzal et al. (2010) showed that education has positive long-run and short-run effect on economic growth in Pakistan. This is in line with findings from Lin (2003) on Taiwan, and Tamang (2011) on India respectively. In addition, Baldacci et al. (2004)’s study of 120 developing countries for the period 1975-2000 found positive relationships in the long-run between educational expenditure and economic growth.
Like education, the idea of health as a form of human capital emerged in 1960s (see Schultz 1961; Mushkin 1962). Grossman (1972) developed a model that show how illness prevents work so that the cost of ill health is lost labour time, and therefore low productivity that have a negative impact on economic growth and development. Consequently, health has been recognised as another fundamental element of human capital (Bloom et al. 2001; and Barro 2013). Preston (1975) demonstrated a positive correlation between national income levels and life expectancy. While Strauss and Thomas (1998) stated that health and income mutually affect each other. Thus, problems affecting health cause negative shocks in growth.
Bloom and Canning (2000) suggest that healthy communities or populations tend to have enhanced physical abilities and mental clarity, which in turn increases productivity. Health can also affect growth indirectly when health status affects educational performance. Good health can be associated with increased levels of schooling and high educational performance. Barro (1996) found that there is an incentive to invest in education given an increase in health indicators. Literature has shown that government spending on education and health has a positive impact on social indicators (Gupta et al. 2002; Commader et al. 1997). However, there exists diminishing returns in the production of education and health services in regions with relatively high per capita income and a limited private sector in the provision of education and health services (Gupta et al. 2002). Gray, Lane and Varoudakis (2007) argued that proportion of educated population is clearly associated with faster economic growth, although more public spending on education and healthcare is not always associated with better educational and health outcomes, while there is a positive correlation between per capita incomes and learning outcomes. Some countries, such as Korea, Poland, and Romania,

7776 Strategic Review for Southern Africa, Vol 42, No 1. May/June 2020
ISSN 1013-1108
appear to have better educational outcomes than would be expected for their levels of per capita income.
Fiscal policy instruments influences economic growth through its impact on the technical know-how, progress in technical production and accumulation of productive resources such as human capital. The amount of resources allocated to the education sector generally reflects investment in development of skills and training, which determines human capital. The quality of healthcare also influences the productivity of workforce and thus public spending on healthcare enhances human capital. Other than education and health, public spending devoted to the infrastructure sector enhances the productive potential of the economy to ensure high and sustainable economic growth (Rademacher 2011; Gray, Lane & Varoudakis 2007).
Both theoretical and empirical literature revealed that government interventions through expansionary fiscal policy may have both positive and negative outcome in an economy. It is thus pertinent to analyse whether the independent government’s expansionary expenditure policies to enhance education and healthcare expenditure in Namibia has really created a significant positive impact on aggregate economic activity (GDP). A comparative analysis with the growth and development of those human resource indicators can also throw some light on the implications of independent policy decisions undertaken in independent Namibia.
For the purpose of analysis, secondary data on variables of interest were collected from the World Bank, Ministry of Finance and Education, Ministry of Health and Social Services, Government of Namibia database and Department of Health, Government of South Africa. The study is conducted for the period of 1980 to 2015, which is constrained by the availability of data, with 1980 to 1990 as the period before independence and 1991 to 2015 as the post-independence period of Namibia.
First of all, growth of expenditure on variables like education and primary healthcare expenditure, capital formation and final government consumption expenditure from 1980 to 2015 has been estimated by simple regression:
LnY = α + β.t_(k_1 ) + U… … … … (1)
Where Y represents either per capita GDP, expenditure etc, t is the time in

7776 Strategic Review for Southern Africa, Vol 42, No 1. May/June 2020
ISSN 1013-1108
years, K1 is the period from 1980 to 2015 and α, β are the two parameters. Here β represents the annual exponential rate of growth. U is random disturbance term with usual classical regression properties. Also, growth has been estimated by similar technique for the sub-period 1991 to 2015 to understand the comparative growth picture of pre and post-independence period.
LnY = α + β. t_(k_2 ) + U… … … … (2)
Where, K2 is the period between 1991 and 2015. Further, associations of healthcare and education expenditure with various variables like per capita GDP, life expectancy, mortality rate, fertility rate, literacy rate and enrolment rate have been estimated with a double log Hierarchical Linear Regression equation like
LnY = α + β1 lnX1 + (β2 lnX2) + U … … … … (3)
Where, Y represents development outcome e.g., life expectancy, mortality, enrolment rate etc, X1 and X2 represent government expenditures on health and education respectively.
Using the results of regression 1 and 2, we examine if there is a significant variation in the growth of fiscal policy instruments. This analysis can be done either by using (i) t test, assuming the homogeneity of variances or (ii) Z test if we cannot assume homogeneity of the error variances between groups and the sample sizes are large; each sample n > 25 (Kleinbaum & Kupper 1978). Since here n >25, we tested the hypothesis of equality of coefficients of t (for equations 1 and 2) by using Z test. According to Moreno et al. (2005) testing for equality of β in both equations is of practical interest and theoretically challenging. There is no unique formula for this (Zellner 1962; Theil 1971, p. 131; Williford et al. 1986; Smith 1975, 1980; Smith and Cook 1980). However, the most used formula for the difference between two regression coefficients (b1 and b2) is:
Where, V1 and V2 are the degrees of freedom and SEb12 and SEb22; are the standard errors associated with first and second groups respectively. However, Paternoster et al. (1998) suggested that by using this formula, there is a high

7978 Strategic Review for Southern Africa, Vol 42, No 1. May/June 2020
ISSN 1013-1108
probability of rejecting the null hypothesis of equality of coefficients is greater than one’s reported alpha level. One would, therefore, mistakenly conclude that there are group differences in the estimated structural coefficient, when in fact there is no difference. Moreover, it is found that this bias is likely to be more pronounced when the two groups have very unequal sample sizes. Thus, following Clogg et al. (1995) we adopted the following formula for significantly different sample sizes:
In the same way, growths of such variables of fiscal policy instruments in Namibia and South Africa have been compared along with their impacts on mortality rates, life expectancy, literacy/enrolment rates etc.
4. Fiscal Outlook from 1980 to 2015
Government participation in the economic activities through provision of public good (education and healthcare) in Namibia has been growing for the past two and half decades. As a result, per capita government spending has tremendously grown in the study period, especially after 1990. Consequently, per capita GDP also grew significantly. Tables 1 and 2 shows quinquennial average per capita government spending on education and primary healthcare as well as per capita gross capital formation, government final consumption expenditure and GDP. In Namibia per capita government expenditure on primary healthcare grew from 78.92 Namibian Dollar (hereafter N$) on average between 1981 and 1985 to N$ 584.30 between 1996 and 2000, and further to N$ 2896.76 between 2010 and 2015. Parallel to that, government expenditure on education also grew from N$ 159.20 during 1981-85 to N$ 1009.32 during 1996-2000 and further to N$ 5524.59 during 2011-15 periods. Per capita GDP, however, decreased from N$ 30017.49 during 1981-85 to N$ 26911.06 during 1996-2000, but it increased to N$ 41244.88 during the last sub-period.
In case of South Africa, per capita government expenditure on primary healthcare grew from 847.50 South African Rand (hereafter ZAR) on an average during 1981-1985 to ZAR 1335.31 during 1996-2000 and further to ZAR 3602.13 during 2010-2015. Per capita government expenditure on education also recorded

7978 Strategic Review for Southern Africa, Vol 42, No 1. May/June 2020
ISSN 1013-1108
significant growth from ZAR 1793.70 during 1981-85 to ZAR 1977.24 during 1996-2000 and further jumped to ZAR 4866.01 during 2011-15. Per capita GDP however declined from ZAR 47522.14 during 1981-85 to ZAR 42516.75 during 1996-2000 but thereafter increased to ZAR 55412.16 during 2011-15.
Table 1: Comparative Picture of Quinquennial Average Per Capita Government Expenditures on Primary Healthcare, Education and Total Government Expenditure in Namibia and South Africa (1980 to 2015) (at Constant Local Currency Unit)
PC_Govt_Health_Exp. PC_Govt_Edu_Exp. PC_Total_Govt_Exp
Year Namibia
(N$)
South Afri-
ca (ZAR)
Namibia
(N$)
South
Africa
(ZAR)
Namibia
(N$)
South Africa
(ZAR)
1981-1985 78.92 847.50 159.2 1 793.70 5 561.69 9 487.90
1986-1990 153.33 688.69 308.03 1 501.59 2 053.82 7 133.73
1991-1995 279.34 833.78 616.33 1 769.28 3 847.42 7 669.02
1996-2000 584.34 1 335.31 1 009.32 1 977.24 7 472.98 9 820.98
2001-2005 764.97 1 766.74 1 374.56 2 646.21 9 084.32 13 244.36
2006-2010 1 437.89 2 639.02 2 593.74 3 618.68 15
748.62
19 645.96
2011-2015 2 896.76 3 602.13 5 524.59 4 866.01 26
945.92
25 100.89
Source: Computed by authors.

8180 Strategic Review for Southern Africa, Vol 42, No 1. May/June 2020
ISSN 1013-1108
Table 2: Comparative Picture of Quinquennial Average of PC GDP, Capital Formation and Government Final Consumption Expenditures of Namibia and South Africa (1980 to 2015) (at Constant Local Currency Unit)
PC_GDP PC_Gross_Cap_Formtn
PC_Govt Final_Consump_Exp
Year Namibia (N$)
South Africa (ZAR)
Namibia (N$)
South Africa (ZAR)
Namibia (N$)
South Africa (ZAR)
1981-1985 30 017.49 47 522.14 5 075.44 9 001.69 486.25 486.21
1986-1990 26 903.19 44 902.66 2 294.33 5 973.62 1 002.15 1 160.12
1991-1995 26 805.63 41 219.72 3 511.27 5 518.99 1 795.05 2 150.03
1996-2000 26 960.58 42 516.75 4 017.43 6 481.18 2 910.33 3 339.80
2001-2005 29 911.06 46 629.49 5 001.44 7 762.29 4 082.88 5 482.07
2006-2010 36 284.71 53 394.61 8 276.36 10 776.73 7 472.26 8 869.23
2011-2015 41 244.88 55 412.16 13 772.35 11 597.28 13 173.57 13 503.61
Source: Computed by authors.
To find the annual exponential growth of various government expenditures and GDP we used ordinary least square (OLS) regression. The results reveal that during 1980 to 2015, per capita GDP grew exponentially at 1.1 and 0.6 per cent per annum in Namibia and South Africa respectively. Per capita gross capital formation grew at 4.4 and 1.4 per cent annual exponential rates in Namibia and South Africa. Annual exponential growth of per capita final consumption were 10.5 and 10.8 respectively in Namibia and South Africa, while that of per capita expenditure on primary healthcare and education were 11.5 and 11.1 in Namibia but 5.3 and 3.5 in South Africa (Table 3). Hence all the variables except per capita final consumption expenditure grew in Namibia at significantly faster rate than in South Africa.

8180 Strategic Review for Southern Africa, Vol 42, No 1. May/June 2020
ISSN 1013-1108
Table 3: Results of Regression of Log of Per Capita GDP and Government Expenditures on Time in Namibia and South Africa (1980 to 2015)
Indicator Name Country Time (year) Const. Adj. R2
LnPC_GDP Namibia 0.011*** (5.88) 10.13 (258.66) 0.49
South Africa 0.006*** (4.41) 10.65 (369.59) 0.34
LnPC_Gross_Cap_Formtn
Namibia 0.044*** (3.42) 7.62 (28.00) 0.23
South Africa 0.014*** (3.59) 8.70 (102.32) 0.25
LnPC_Govtfinal_Con-sm_Exp.
Namibia 0.105*** (54.82) 5.89 (144.37) 0.99
South Africa 0.108*** (46.41) 5.97 (121.03) 0.98
LnPC_Govt_Health_Exp.
Namibia 0.115*** (59.04) 3.99 (96.68) 0.99
South Africa 0.053*** (14.54) 6.24 (80.28) 0.86
LnPC_Govt_Edu_Exp. Namibia 0.111*** (47.08) 4.73 (94.70) 0.98
South Africa 0.035*** (11.65) 7.12 (111.52) 0.79
Note: Figures in the parentheses represent t value. Note: ***, ** and * represent that the coefficient is significant at 1, 5 and 10 per cent level of significance.
Source: Computed by authors.
5. Expenditure on Health and Education and Social Development Indicators in Namibia and South Africa
To analyse the influence of per capita government expenditure on primary healthcare and education on per capita GDP, and development indicators related to health (fertility and mortality rate, life expectancy) and education (literacy, enrolment rate), analysis is made by OLS hierarchical regressions. Education is expected to enhance the earning capability through rising employability and working efficiency and also indirectly health parameters as education can make people aware to take necessary preventive or curative measures. Healthcare expenditure is also expected to increase earning capability and education expenditure to improve achievement in enrolment, literacy etc.
Though influence of per capita healthcare expenditure on per capita GDP is found to be positive but insignificant in Namibia, it is significantly negative in case of South Africa during 1980 to 2015. The ineffectiveness may be due to the war disturbance and internal conflict in South Africa. On the contrary, per capita

8382 Strategic Review for Southern Africa, Vol 42, No 1. May/June 2020
ISSN 1013-1108
education expenditure is found to have positive and significant impact on GDP per capita in both countries. The result shows that one percent increase in per capita government expenditure on education leads to a rise of per capita GDP by 0.085 percent in Namibia and 0.474 in South Africa during the period under study.
In terms of development indicators related to health, per capita expenditure on primary healthcare has significantly negative influence on total fertility rate in both Namibia and South Africa and the impact is more than double in case of South Africa (-0.66) than that in Namibia (-0.30). Though education expenditure is insignificant for total fertility in Namibia, its impact shows significantly positive impact in South Africa. Despite the expected indirect effect of education on birth control, for the dismal healthcare situation in the country and apartheid ruling, it was not yielding expected result. Furthermore, primary healthcare expenditure has significantly negative influence on life expectancy in both countries, but it has significantly positive effect on both infant and adult mortality rate in both Namibia and South Africa. Not only that, the effect is more pronounced in Namibia than in South Africa. Nevertheless, per capita government expenditure on education has significant positive impact on life expectancy in Namibia but insignificant in South Africa and it has negative impact on both infant and adult mortality rate in both Namibia and South Africa (Table 4).

8382 Strategic Review for Southern Africa, Vol 42, No 1. May/June 2020
ISSN 1013-1108
Table 4: Slope Coeff. of Regressions of Log of PC-GDP and Health Indicators on Healthcare and Education Expenditure by Govt., in Namibia and South Africa during 1980 to 2015
Namibia South Africa
Indicator Name
Coef LnPC_Gov_Health_exp.
LnPC_Gov_Edu_Exp.
Adj. R2
LnPC_Gov_Health_Exp.
LnPC_Gov_Edu_Exp.
Adj. R2
LnPC_GDP β 0.010 0.085*** 0.454 -0.081*** 0.474*** 0.745
p 1.052 2.415 -2.520 4.497
LnTot_Fert_Rate
β -0.303*** 0.140 0.943 -0.656*** 0.490*** 0.782
ᵼ -3.647 1.632 -4.518 2.303
LnLif_ Expectency
β -0.232*** 0.250*** 0.252 -0.165*** 0.135 0.515
ᵼ -3.269 3.405 -2.762 1.552
LnInfant_Mortality_ Rate,
β 0.233*** -0.384*** 0.930 0.204 -0.585*** 0.488
ᵼ 3.039 -4.825 1.216 -2.383
LnAdult_Mortality_ Rate
β 0.906*** -0.872*** 0.286 0.794*** -0.719*** 0.749
ᵼ 3.123 -2.901 5.102 -3.154
Note: ***, ** and * represent that the coefficient is significant at 1, 5 and 10 per cent level of significance.
Source: Computed by authors.
With regard to education related development indicators also, expenditure on both education and primary healthcare confirms mixed results. The analysis revealed that adult literacy rate has insignificant response to per capita government expenditure on education and on primary healthcare in both countries. Youth literacy responded positively to healthcare expenditure but negatively to education expenditure. Elderly literacy responded significantly and positively to health expenditure but inversely to education expenditure in South Africa but not significantly responsive to both the variables in Namibia (Table 4).
Likewise, the analysis reveals mixed results for school enrolment rate like

8584 Strategic Review for Southern Africa, Vol 42, No 1. May/June 2020
ISSN 1013-1108
literacy rate. Gross pre-primary and net secondary school enrolment reacted positively to government healthcare expenditure, but negatively to expenditure on education in Namibia. Per capita government expenditure on primary healthcare has significant negative influence on gross school enrolment rate while per capita government expenditure on education has significant positive impact. Expenditure on both education and primary healthcare has no impact on net primary school and gross secondary school enrolment rate. Expenditure on education however has a positive influence on tertiary school enrolment rate while healthcare expenditure is found to be insignificant.
During the same period in South Africa, both net and gross primary and secondary school enrolment rate reacted positively to per capita government expenditure on education but negatively to healthcare expenditure. Gross pre-primary school enrolment rate has reacted positively to government expenditure on primary healthcare. Just as for gross pre-primary school enrolment rate, healthcare expenditure has positive influence on tertiary education school enrolment rate while education expenditure remained insignificant.

8584 Strategic Review for Southern Africa, Vol 42, No 1. May/June 2020
ISSN 1013-1108
Table 5: Effect of Govt. Expenditure on Healthcare and Education on Educational Achievement Indicators in Namibia and South Africa (1980 to 2015)
Namibia South Africa
Indicator Name Coef LnPC_Gov_Health_ exp.
LnPC_Gov_Edu_Exp
Adj. R2
LnPC_Gov_Health_exp.
LnPC_Gov_Edu_Exp.
Adj. R2
LnLR _Adult (15+)
β -0.026 0.091 0.829 0.057 0.060 0.817
ᵼ -0.472 1.569 1.505 1.085
LnLR_Youth (15 - 24)
β 0.118*** -0.068* 0.902 0.156*** -0.123*** 0.826
ᵼ 3.388 -1.888 5.452 -2.929
LnLR_Elderly (65 +)
β 0.049 0.150 0.948 0.659*** -0.583*** 0.828
ᵼ 0.538 1.585 6.256 -3.774
LnSE_Preprima-ry (gross)
β 1.900*** -1.686*** 0.574 0.955*** 0.049 0.911
ᵼ 3.620 -3.103 3.765 0.132
LnSE_Primary (gross)
β -0.169*** 0.145*** 0.496 0.454*** -0.601*** 0.164
ᵼ -2.666 2.203 2.795 -2.527
LnSE_Primary (net)
β 0.027 0.064 0.692 0.213*** -0.234*** 0.773
ᵼ 0.231 0.522 7.337 -5.499
LnSE_Secondary (gross)
β 0.187 0.031 0.872 0.895*** -0.899*** 0.690
ᵼ 1.119 0.181 5.111 -3.501
LnSE_Secondary (net)
β 0.596*** -0.253 0.939 0.609*** -0.536*** 0.718
ᵼ 3.298 -1.354 4.557 -2.739
LnSE_Tertiary (gross)
β 0.023 0.735*** 0.966 1.240*** -0.721 0.786
ᵼ 0.082 2.572 3.801 -1.509
Note: ***, ** and * represent that the coefficient is significant at 1, 5 and 10 per cent level of significance.
Source: Computed by authors.
The above results reveal contradicting outcome during 1980 to 2015 possibly because, during 1980 to 1990 both countries were at war. The South African Border War, also known as the Namibian War of Independence, where Namibians were fighting for independence from South African Government that lasted from 26 August 1966 to 21 March 1990 (Clayton 1999; Stapleton 2013), and

8786 Strategic Review for Southern Africa, Vol 42, No 1. May/June 2020
ISSN 1013-1108
political violence in South Africa like Rhodesian Bush War (1965–1979) and the Natal civil war of 1987–1994, Black South Africans fight for freedom from the apartheid Government (Taylor 2002). Thus, the apartheid government’s effort to nurture the education system and primary healthcare show no impressive results because many parents in Namibia were scared of sending their children to school especially to pre-primary school as it was not safe due to political violence in the countries. Thus, many children started primary school at later ages while a number of them completely missed out of school. Congruently, due to war casualty, government expenditure on healthcare was not really effective to improve the health-related issues in the country. As a result during 1980 to 1990 life expectancy was dropping, while mortality rate was going up in both the countries. It is however noticed that the desirable impacts of health and education expenditures were more significant in Namibia than in South Africa.
6. Fiscal Policy Impact in the Post-Independence Namibia and South Africa
In March 1990, Namibia had a transition from South African white minority apartheid government to a democratic self-rule. However, the South African themselves had to wait for another five years for their economy to transform from white minority apartheid rule to a fully democratic society in 1994. After gaining independence and freedom from white minority apartheid rule, both countries declared war against racism and built a national reconciliation program aiming to unite the inhabitants of the two nations. Furthermore, both governments promised to address inequality among the races and bridge the gap between rich white minorities and poor black majorities. As a result, several black empowerment programmes were introduced. Among others, access to education and primary healthcare for all citizens became a priority in both Namibia and South Africa. This section is devoted to analyse the changes in primary healthcare and education spending as well as their impacts on those aspects of development in those two countries during 1991 to 2015.
To analyse the changes in the fiscal policy in post-independence Namibian era, we used ordinary least square regression model (OLS) on log variables just like the previous section. Variables like per capita gross capital formation, final government consumption expenditure, government expenditure on primary

8786 Strategic Review for Southern Africa, Vol 42, No 1. May/June 2020
ISSN 1013-1108
healthcare and education are used here as fiscal policy variables. However, in this study a deep focus is given to per capita primary healthcare and education spending by government. Log of per capita GDP is used as one of the development variables in addition to education and health outcome related variables. In Tables 6, 7 and 8 we discussed the change in fiscal policy variables during 1991 to 2016, impacts of per capita primary healthcare and education expenditure by the government on development parameters in Namibia and South Africa respectively.
The results reveal that during the democratic era, changes in fiscal policy variables have been faster than those of the colonial period. Similarly, per capita GDP grew faster as compared to the colonial period since the coefficient of time was much lower when the series 1980 to 2015 was included in the study. Per capita GDP grew by annual exponential rates of 2.2 and 1.5 per cent in Namibia and South Africa respectively during 1991-2015 as compared to 1.1 and 0.6 per cent during 1980-2015. Per capita gross capital formation grew by 10.1 per cent annually during the post-independence period as compared to 4.4 per cent during the whole period in Namibia. It was 3.8 per cent during 1991-2015 in South Africa as compared to 1.4 per cent during 1980-2015. However, during the independence era, growth of per capita final consumption expenditure declined marginally to 9.9 and 9.3 per cent annual exponential rates as compared to 10.5 and 10.8 per cent during the whole period in Namibia and South Africa respectively. Annual exponential growth rate of per capita government expenditure on primary healthcare also reduced marginally to 11.2 per cent during 1991-2015 from 11.5 per cent during 1980-2015 for Namibia. In South Africa, its growth rate increased from 5.3 per cent annually during 1980-2015 to 7.3 per cent per annum during 1991-2015. Though total expenditure in Namibia expanded at faster rate, the rising expenditure on healthcare is arrested by faster population growth in the later period.
Likewise, per capita government expenditure on education growth was a bit slow for Namibia during the post-independence era (10.5 per cent annually) as compared to the whole period (11.0 per cent per annum) though in South Africa it grew at faster rate (5.2 per cent per annum) than the whole period (3.5 per cent per annum) (Table 6 and Table 3).

8988 Strategic Review for Southern Africa, Vol 42, No 1. May/June 2020
ISSN 1013-1108
Table 6: PC GDP and Government Expenditure Growth in Namibia and South Africa from 1991 to 2015
Indicator Name Country Time (year) C Adj. R2
LnPC_GDP Namibia 0.022 *** (14.16) 10.06 (414.14) 0.89
South Africa 0.015*** (12.95) 10.57 (597.23) 0.87
LnPC_Gross_Capital _For-mation
Namibia 0.101*** (5.41) 7.14 (24.84) 0.53
South Africa 0.038*** (15.89) 8.46 (226.86) 0.91
LnPC_Govtfinal_ Con-sumptn_Exp.
Namibia 0.099*** (191.57) 7.04 (41.37) 0.99
South Africa 0.093*** (93.99) 7.28 (475.38) 0.997
LnPC_Govt_Health_ Exp. Namibia 0.112*** (32.62) 5.20 (98.35) 0.98
South Africa 0.073*** (31.97) 6.47 (183.88) 0.98
LnPC_Govt_Edu_ Exp. Namibia 0.105*** (25.82) 5.93 (94.50) 0.96
South Africa 0.052*** (23.88) 7.20 (215.10) 0.96
Note: Figures in the parentheses represent t value. Note: ***, ** and * represent that the coefficient is significant at 1, 5 and 10 per cent level of significance.
Source: Computed by authors.
To examine whether the changes in fiscal policy expenses adopted after 1990 was statistically significant, Z test is applied and equality of coefficients of time is tested (Tables 3 and 6). A difference in coefficients of time during the overall period and second sub-period was found to be statistically significant in both countries except for per capita government expenditure on education and on primary healthcare in Namibia (Table 7). It thus reveals that there is no significant change in government expenditure on education and primary healthcare in Namibia. This is because the allocations to education and healthcare were already high during the previous (colonial) Government, though it was not reflected in the education and health output for partiality in utilisation between blacks and whites (Clayton 1999; Obeid et al. 2001).

8988 Strategic Review for Southern Africa, Vol 42, No 1. May/June 2020
ISSN 1013-1108
Table 7: Test for Difference between Coefficients of Time in the Overall and Post-Independence Period
Namibia South Africa
Indicators Beta Coeff. Std. Error
Z Veta Coeff. Std. Error
Z
LnPC_GDP b1 0.011 SEb1 0.002 -4.702 b2 0.015 SEb2 0.001 -4.982
b2 0.022 SEb2 0.002 b1 0.006 SEb1 0.001
LnPC_Gross_Cap_Formtn
b1 0.044 SEb1 0.013 -2.519 b2 0.038 SEb2 0.002 -5.127
b2 0.101 SEb2 0.019 b1 0.014 SEb1 0.004
LnPC_Gov-tfinal_Con-sn_Exp.
b1 0.105 SEb1 0.002 2.228 b2 0.093 SEb2 0.001 5.799
b2 0.099 SEb2 0.002 b1 0.108 SEb1 0.002
LnPC_Govt_Health_Exp.
b1 0.115 SEb1 0.002 0.836 b2 0.073 SEb2 0.002 -4.524
b2 0.112 SEb2 0.003 b1 0.053 SEb1 0.004
LnPC_Govt_Edu_Exp.
b1 0.111 SEb1 0.002 1.235 b2 0.052 SEb2 0.002 -4.511
b2 0.105 SEb2 0.004 b1 0.035 SEb1 0.003
Note: Subscripts 1 & 2 Represent Overall and Second Sub-period
Source: Computed by authors.
To examine the impact of per capita government expenditure on primary healthcare and education on various development indicators during the independence era we used same hierarchical regression technique for the period 1991-2015. During this period, per capita government healthcare expenditure was found to have insignificant influence on per capita GDP in both Namibia and South Africa. However, government expenditure on education per capita had significant positive influence on GDP per capita in both countries. The elasticity was found to be 0.368 for Namibia, while it was 0.176 in case of South Africa.
Government expenditure on education per capita and fertility rate in Namibia are found to move in the same direction, while that is inverse with healthcare expenditure, meaning healthcare expenditure has got direct bearing on total fertility rate, though learning effect on birth control is found to missing. In case of South Africa, both the expenditures had virtually no impact on total fertility rate. Further, both per capita government expenditure on education and primary healthcare has significant positive influence on life expectancy in both countries and the effects were much higher in Namibia than in South Africa

9190 Strategic Review for Southern Africa, Vol 42, No 1. May/June 2020
ISSN 1013-1108
during the independence period. Also per capita government expenditure on primary healthcare reduced both infant and adult mortality rate while per capita government expenditure on education has positive impact on mortality in both countries (Table 8). Though healthcare expenditure resulted in reduction of mortality in the desired direction, the education expenditure is found to be ineffective so far. The adjusted R2 was found to be higher in case of Namibia as compared to South Africa in all the regressions, implying that per capita government expenditure on primary healthcare and education can explain the per capita GDP, mortality rate, enrolment rate and other development indicators better in Namibia.
Table 8: Impact of Government Expenditure on Healthcare and Education on Health Development Indicators in Namibia and South Africa during 1991 to 2015
Namibia South Africa
Indicator Name
LnPC_Govt_ Health_exp
LnPC_Govt_Edu_Exp.
Adj. R2 LnPC_Gov-Health_exp.
LnPC_Gov_Edu_Exp.
Adj. R2
LnPC_GDP
β 0.151 0.368*** 0.899 0.076 0.176** 0.841
ᵼ 1.428 3.283 1.006 1.932
LnTotal_Fert_Rate
β -0.402*** 0.280*** 0.889 -0.108 0.199 0.743
ᵼ -5.027 3.319 -0.859 1.177
LnLif_ Exptncy
β 0.326*** 0.373*** 0.531 0.216*** 0.198** 0.425
ᵼ 4.484 2.848 2.830 1.922
LnInf_ Mortality_ Rate
β -0.339*** 0.514*** 0.912 -0.506*** 0.989*** 0.694
ᵼ -4.417 3.334 -3.372 2.894
LnAdult_ Mortality_ Rate
β -0.899*** -0.403*** 0.464 -0.805*** 0.722*** 0.609
ᵼ -4.733 -4.837 -3.891 2.591
Note: ***, ** and * represent that the coefficient is significant at 1, 5 and 10 per cent level of significance.
Source: Computed by authors.
The analysis reveals mixed results for literacy and enrolment rate for both Namibia and South Africa. The result shows that per capita government

9190 Strategic Review for Southern Africa, Vol 42, No 1. May/June 2020
ISSN 1013-1108
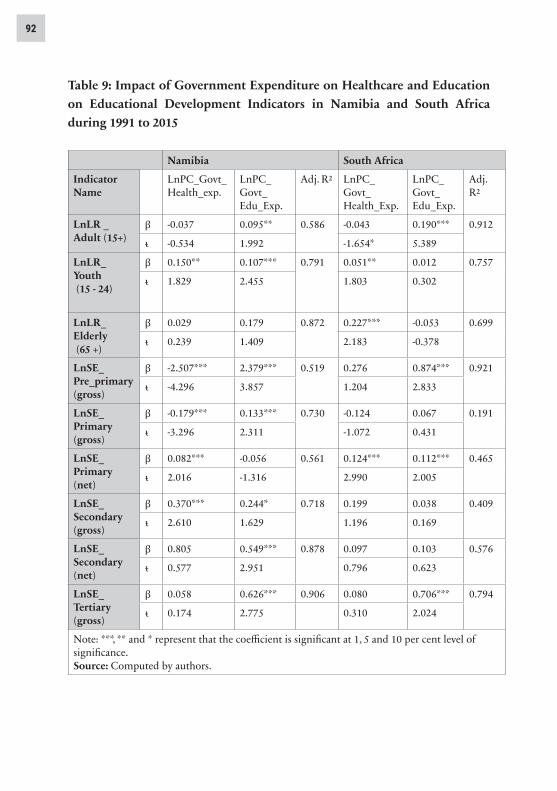
expenditure on primary healthcare has virtually no influence on adult literacy, elderly literacy rate, net secondary school enrolment rate and tertiary school enrolment in Namibia. Similarly, per capita government expenditure on education has no significant impact on elderly literacy rate and net primary school enrolment rate. Furthermore, per capita government expenditure on primary healthcare is negatively related to gross pre-primary and gross primary school enrolment rate in Namibia. This implies that more the government spends on primary healthcare, the healthier the children are. This will enable them to start school at the actual school starting age instead of later. Per capita government expenditure on primary healthcare is positively correlated to youth literacy rate and gross secondary school enrolment rate. While per capita government expenditure on education is positively correlated to adult literacy rate, youth literacy rate, pre-primary and primary school enrolment rate as well as secondary and tertiary school enrolment rate in Namibia (Table 9).
In case of South Africa, per capita government expenditure on primary healthcare has no impact on all gross pre-primary and primary, secondary and tertiary school enrolment rates. Likewise, impact of per capita government expenditure on education on youth literacy, elderly literacy rate, gross primary and secondary school enrolment rates are insignificant. This could be because the country’s literacy rate was already high and further increase was difficult. Expenditure on education however has positive impact on adult literacy rate, pre-primary and net primary school enrolment as well as tertiary school enrolment rates. While youth literacy rate, elderly literacy rate and net primary school enrolment rate were positively influenced by Per capita government expenditure on primary healthcare (Table 8).
9392 Strategic Review for Southern Africa, Vol 42, No 1. May/June 2020
ISSN 1013-1108
Table 9: Impact of Government Expenditure on Healthcare and Education on Educational Development Indicators in Namibia and South Africa during 1991 to 2015
Namibia South Africa
Indicator Name
LnPC_Govt_Health_exp.
LnPC_Govt_Edu_Exp.
Adj. R2 LnPC_Govt_ Health_Exp.
LnPC_Govt_Edu_Exp.
Adj. R2
LnLR _ Adult (15+)
β -0.037 0.095** 0.586 -0.043 0.190*** 0.912
ᵼ -0.534 1.992 -1.654* 5.389
LnLR_ Youth (15 - 24)
β 0.150** 0.107*** 0.791 0.051** 0.012 0.757
ᵼ 1.829 2.455 1.803 0.302
LnLR_ Elderly (65 +)
β 0.029 0.179 0.872 0.227*** -0.053 0.699
ᵼ 0.239 1.409 2.183 -0.378
LnSE_ Pre_primary (gross)
β -2.507*** 2.379*** 0.519 0.276 0.874*** 0.921
ᵼ -4.296 3.857 1.204 2.833
LnSE_ Primary (gross)
β -0.179*** 0.133*** 0.730 -0.124 0.067 0.191
ᵼ -3.296 2.311 -1.072 0.431
LnSE_ Primary (net)
β 0.082*** -0.056 0.561 0.124*** 0.112*** 0.465
ᵼ 2.016 -1.316 2.990 2.005
LnSE_ Secondary(gross)
β 0.370*** 0.244* 0.718 0.199 0.038 0.409
ᵼ 2.610 1.629 1.196 0.169
LnSE_ Secondary (net)
β 0.805 0.549*** 0.878 0.097 0.103 0.576
ᵼ 0.577 2.951 0.796 0.623
LnSE_ Tertiary (gross)
β 0.058 0.626*** 0.906 0.080 0.706*** 0.794
ᵼ 0.174 2.775 0.310 2.024
Note: ***, ** and * represent that the coefficient is significant at 1, 5 and 10 per cent level of significance.Source: Computed by authors.

9392 Strategic Review for Southern Africa, Vol 42, No 1. May/June 2020
ISSN 1013-1108
The results presented in Tables 6, 7 and 8, clearly reveal a mixed outcome. Though independent Namibia was able to enhance the performance on several fronts, there are still more scopes to improve. The development indicators reaction to fiscal policy changes takes long time due to required build up time for the human resource development. It started yielding results only recently in the previous decade. Further, the controversy in the outcomes may be caused by the inconstancy of data in both countries. It was also confirmed by Devarajan et al. (1996) and Gray et al. (2007) that the government spending in developing countries does not always deliver the desired output due to the fact that there is a lack of control and accountability in developing countries. In case of Namibia, it would be more relevant for the initial ignorant and inefficient manpower inherited for the long deprivation of native people that had been lacking guidance of educated elite. Despite that, as noted, the development indicators multipliers are high in Namibia as compared to South Africa in several indicators. Thus, we can conclude that Namibians has been successful in enhancing several welfare indicators after self-rule though it could not achieve much in some other respects.
7. Conclusion and Recommendation
In this study, attempt was made to analyse whether the decision-making process of self-governing Namibia made Namibians better off than during the rule by South African apartheid government. The results revealed that Namibians are somehow better off under the self-government, while it also revealed that there is no significant change in government expenditure on education and primary healthcare in comparison to pre-independence Namibia as expected. This could be attributed to the fact that during 1980-1989 the separation war intensified, South Africa wanted to be seen as promoting the material and moral well-being and the social progress of the inhabitants of the territory by contributing to a larger volume of integrated social welfare including the provision of healthcare and education (Gottschalk 1988, 577: Nord 2014, 423). Thus, the deprivation in allocation of resources and access for healthcare and education has been relaxed for the white (colonial) government loyalist of all sections of population making them more privileged as compared to the resistant groups.
The outcomes of the analysis also show mixed results on the effect of government intervention on human developmental outputs. Per capita

9594 Strategic Review for Southern Africa, Vol 42, No 1. May/June 2020
ISSN 1013-1108
government expenditure on primary healthcare was found to have a positive correlation to youth literacy rate and gross secondary school enrolment rate. While per capita government expenditure on education is positively correlated to adult and youth literacy rate, and to school enrolment rate at all levels in Namibia. Infant mortality rate and fertility rate have been reduced significantly with rising education expenditure. Also, expenditure of healthcare has inverse impact on fertility and adult mortality rates in both countries. Per capita government expenditure on education and primary healthcare was found to have insignificant effect on total fertility rate in South Africa. Similarly, per capita government expenditure on education has no impact on elderly literacy rate and net primary school enrolment rate in Namibia. Further, per capita government expenditure on education is found to be moving in the same direction as infant mortality rate in both the countries. The controversy in the results would also be attributed to inconstancy of data in both countries and inefficient management and lack of accountability in the initial years.
Other issues that might have caused the inconstancy in the data in Namibia and South Africa were that in most cases when fund was transferred from the government bank account, it was recorded as expenditure even when there was no exchange of goods or services. Nevertheless, there appeared to be a lack of political will to address this issue as political leaders were not bothered to enforce accountability on their subordinates. The reason behind that could be due to their (political leaders) ignorance on the public financial system or because they were also involved in the underground corruption cases and if they impose accountability it would have exposed them. This cycle could have led to inefficiency in the public sector. In addition to that the two countries have neither a strong data recording systems and no independent data collection centres.
Even if Namibia seems to be leading in terms of converting the government expenditures into development output more in some respects as compared to South Africa; a lot need to be done to address the inconsistency in the data in both countries. Both Namibia and South Africa need to endorse accountability in their public sector. Public officials responsible for government spending must be answerable to all the funds leaving the government bank account. Expenditures should be recorded as expenditure when an actual exchange of goods and services occur, but not when the money is released from the government account. Political leaders should be willing to participate in this

9594 Strategic Review for Southern Africa, Vol 42, No 1. May/June 2020
ISSN 1013-1108
process without any hesitation. Cases of corruption should be tackled seriously without any mercy or favouritism to certain politically connected elites. Thus, it calls for further analysis of the policy effectiveness and efficiency of the public sector service delivery.
References
Afzal, M, MS Farook, HK Ahmed, I Begum and MA Quddus (2010), “Relationship between School Education and Economic Growth in Pakistan: ARDL Bounds Testing Approach to Cointegration”, Pakistan Economic and Social Review, Vol 48, No 1, pp 39-60.
Agenor, PR (2008), “Fiscal Policy and Endogenous Growth with Public Infrastructure”, Oxford Economic Papers, Vol 60, pp 57-87.
Baldacci, E, Baldacci, E, B Clements, S Gupta and Q Cui (2005), “Social Spending, Human Capital, and Growth in Developing Countries,” World Development, Vol 36, No 8, pp 1317- 1341.
Barro, R (2013), “Health and Economic Growth,” Annals of Economics and Finance, Vol 14, No 2, pp 329-366.
Barro, RJ (1996), “Determinants of Economic Growth: A Cross-Country Empirical Study,” NBER Working Paper, No. 5698.
Becker, G (1964), Human Capital. New York: Columbia University Press.Becker, G (1962), “Investment in Human Capital: A Theoretical Analysis”, Journal
of Political Economy, Vol 70 (Supplement), pp 9-49.Blaug, M (1970), An Introduction to the Economics of Education. London: Allen
Lane the Penguin Books.Bloom, DE and D Canning (2000), “The Health and Wealth of Nations,” Science,
Vol 287, pp 1207-1209.Bloom, DE, D Canning and J Sevilla (2001), “The Effect of Health on Economic
Growth: Theory and Evidence”, NBER Working Paper No. 8587.Clayton, A (1999), Frontiersmen: Warfare in Africa since 1950. Philadelphia: UCL
Press Limited. Clogg, CC, E Petkova, and A Haritoum (1995), “Statistical Methods for Comparing
Regression Coefficients between Models”, American Journal of Sociology, Vol 100, pp 1261-1293.
Commander, MJ, Sashidharan, SP, Odell, SM and PG Surtees (1997), “Access to

9796 Strategic Review for Southern Africa, Vol 42, No 1. May/June 2020
ISSN 1013-1108
Mental Health Care in an Inner-City Health District. I: Pathways into and Within Specialist Psychiatric Services”, British Journal of Psychiatry, Vol 170, pp 312–316.
Denison, E (1962), “Education, Economic Growth, and Gaps in Information”, The Journal of Political Economy, Vol 70, No 5, part 2, pp 124-128.
Devaragan, S, Swaroop V and H Zou (1996),” The Composition of Public Expenditure and Economic Growth”, Journal of Monetary Economics, Vol 37, pp 313-344
Fischer G (2012), “The Namibian Educational System,” Friedrich Ebert Stiftung, Windhoek. Available at http://fesnam.org (accessed 4 December 2016).
Gottschalk, K (1988), “The Political Economy of Health Care: Colonial Namibia 1915–1961”, Social Science and Medicine, Vol 26, No 6, pp 577-82
Government of Namibia, Ministry of Education (2008), “The Development of Education: National Report of Namibia”, Document presented at the 48th session of the International Conference on Education, Geneva, 2008.
Government of Namibia, Ministry of Education (2015), Achieving Education for All Goals. Windhoek: Government Gazette.
Government of Namibia, Ministry of Health and Social Services and ICF Macro (2010), “Namibia Health Facility Census 2009”, Windhoek, Namibia.
Gray, C, T Lane and A Varoudakis (2007), Fiscal Policy and Economic Growth, Lessons for Eastern Europe and Central Asia. Washington, DC: The International Bank for Reconstruction and Development.
Grossman, M (1972), “On the Concept of Health Capital and the Demand for Health”, Journal of Political Economy, Vol 80, pp 223–55.
Gupta S, M Verhoeven and E Tiongson (2002), “The Effectiveness of Government Spending on Education and Health Care in Developing and Transition Economies”, European Journal of Political Economy, Vol 18, No 4, pp 717-737.
Ismail, R (1996), Modal Manusiadan Perolehan Buruh. Kuala Lumpur: Dewan Bahasa dan Pustaka.
Keynes, JM (1936), The General Theory of Employment, Interest and Money. New York: Cambridge University Press.
Kleinbaum, DG and L.L Kupper (1978), Applied Regression Analysis and Other Multivariable Methods. Boston: Duxbury.
Lin, TC (2003), “Education, Technical Progress, and Economic Growth: The Case of Taiwan”, Economic of Education Review, Vol 22, pp 213-220.

9796 Strategic Review for Southern Africa, Vol 42, No 1. May/June 2020
ISSN 1013-1108
Lindeke, W (1995), “Democratization in Namibia: Soft State, Hard Choice”, Studies in Comparative International Development, Vol 30, No 1, pp 3-29.
Low, A, T Ithindi and A Low (2003), “A Step too Far? Making Health Equity Interventions in Namibia more Sufficient”, International Journal for Equity in Health, Vol 2, No 1, pp 5-16.
Lucas, RE (1988), “On the Mechanics of Economic Development”, Journal of Monetary Economics, Vol 22, No 1, pp 3-42.
Mekdad, Y, A Dahmani, and M Louaj (2014), “Public Spending on Education and Economic Growth in Algeria: Causality Test”, International Journal of Business and Management, Vol 2, No 3, pp 55-70.
Melber, H (2014), Understanding Namibia: The Trials of Independence. Windhoek: Hurst and CO Publishers.
Moreno, E, F Torres and G Casella (2005), “Testing Equality of Regression Coefficients in Heteroscedastic Normal Regression Models”, Journal of Statistical Planning & Inference, Vol 131, No 1, pp 117-134.
Mushkin, SJ (1962), “Health as an Investment”, Journal of Political Economy, Vol 70, No 5, pp 129-57.
Nord, C (2014), “Healthcare and Warfare. Medical Space, Mission and Apartheid in Twentieth Century Northern Namibia”, Medical History, Vol 58, No 3, 422-446.
Obeid, SE, et al. (2001), Health in Namibia: Progress and Challenges. Windhoek: Research and Information Services of Namibia. Available at http://www.raison.com.na/0_front_pages.pdf (Accessed 03 March 2018).
Paternoster, R, et al. (1998), “Using the Correct Statistical Test for the Equality of Regression Coefficients”, Criminology, Vol 36, No 4, pp 859-866.
Preston, S (1975), “The Changing Relation between Mortality and Level of Economic Development”, Population Studies, Vol 29, pp 231-248.
Rademacher, I (2011), “Fiscal Policy and Growth - Boosting Employment and Competitiveness in Namibia”, Frierich Ebert Stiftung, Windhoek, Namibia.
Schultz, TW (1961), “Investment in Human Capital”, American Economic Review, Vol 51, pp 1-17.
Sherbourne, R (2016), Guide to the Namibian Economy. 16th ed. Windhoek: IPPR Publication.
Skousen, M. (2009), The Making of Modern Economics: The Lives and Ideas of the Great Thinkers. 2nd ed. New York: Routledge

PB98 Strategic Review for Southern Africa, Vol 42, No 1. May/June 2020
ISSN 1013-1108
Smith, AFM (1975), “A Bayesian Approach to Inference about a Change-Point in a Sequence of Random Variables”, Biometrika, Vol 62, pp 407-416.
Smith, AFM (1980), “Change-Point Problems: Approaches and Applications”, in Bernardo, JM, DeGroot, MH, Lindley, DV and AFM Smith (eds), Bayesian Statistics, pp 83-98.
Smith, AFM and DG Cook (1980), “Straight Lines with a Change-Point: A Bayesian Analysis of Some Renal Transplant Data”, Applied Statistics, Vol 29, pp 180-189.
Solow, R (1957), “A Contribution to the Theory of Economic Growth”, Quarterly Journal of Economics, Vol 70, PP 65-94.
Stapleton, T (2013), “A Military History of Africa”, Santa Barbara: ABC-CLIO, pp 251-257.
Strauss, J and D Thomas (1998), “Health, Nutrition, and Economic Development”, Journal of Economic Literature, Vol 36, No 2, pp 766-817.
Tamang, P (2011), “The Impact of Education Expenditure on India’s Economic Growth”, Journal of International Academic Research, Vol 11, No 3, pp 14-20.
Theil, H (1971), Principles of Econometrics. New York: Wiley PublicationsTaylor, R (2002), “Justice Denied: Political Violence in KwaZulu-Natal after 1994”,
African Affairs, 101, Vol 405, pp 473-508.Wagner, A (1890), Finanzwissenchaft. Leipzig: Winter, C.F., Germany.Williford, HN, Smith, JF Mansfield, ER Conerly, MD and PA Bishop (1986),
“Validation of Body Composition Models for High School Wrestlers”, Medicine & Science in Sports & Exercise, Vol 18, pp 216-224.
World Health Organization (2010), “Namibia Country Cooperation Strategy 2010-2015”. Available at https://afro.who.int/sites/default/files/2017-06/Namibia-who-ccs-2010-2015-abridged-version.pdf (Accessed 3 March 2018).
Zaaruka, B, Biwa, B and P Kalenga (2001), “Public Expenditure Management in Namibia Health and Education Sectors - Preliminary Analysis”, BON Working Paper, No.1/02.
Zellner, A (1962), “An Efficient Method of Estimating Seemingly Unrelated Regression and Tests for Aggregation Bias”, Journal of American Statistical Association, Vol 57, pp 348-368.