why the twin cities? - saint paul, minnesota€¦ · · 2015-11-13why the twin cities? 3...
TRANSCRIPT

Why the Twin Cities?
M i n n e a p o l i s - s t . p a u l

Why the Twin Cities? 3
Workforce 4
Education 9
Logistics 12
Transportation 15
Business Costs 16
Utilities 20
Quality of Life 22
State and Local Assistance 24
table of contents
St.PaulMinneapolis
Minneapolis–St. Paul–Bloomington,MN-WI MSA
M I N N E S O T A

3The Twin Cities offers a strong workforce, state and local support, and great communities that will help your firm achieve its goals for extraordinary growth and profitability.
Minneapolis-St. Paul ranks among the top four “best U.s. cities for business” for 2009, according to MarketWatch.
Minnesota is listed among the top states for business 2009, ranking sixth, according to a CNBC report that assessed cost of doing business, workforce, transportation, business friendliness, economy and cost of living.
FierceBiotech ranked Minnesota among the top five regions targeting biotech in the nation, with an established reputation for developing bioscience incubators and funding R&D facilities.
Minnesota’s business taxes rank among the 16 lowest in the nation, according to a report by Ernst & Young and the Council on State Taxation, 2009.
Minnesota is among the top five states nationwide in the 2010 camelot Index, according to State Policy Reports, based on our economy, health, education, crime, society and government.
supportive state and local partners will assist your company in securing the financial and workforce development resources for the project to be a success.
Minneapolis-St. Paul is one of the most logistics friendly areas nationwide, according to Expansion Management, receiving five stars and ranking high in crucial indicators such as road conditions, trucking and warehousing.
Minnesota’s favorable income apportionment factors and the absence of a throwback provision reduce effective tax liabilities, benefiting companies with significant sales outside the state. This makes the corporate income tax system in the state very competitive with others across the country.
Minnesota exempts personal property like inventory and machinery from the property tax, resulting in a lower effective tax rate for businesses. As a result, businesses whose equipment and inventory values are high relative to the real estate value pay a lower effective tax than in states that impose such taxes.
Minnesota’s electric and natural gas services are dependable and moderately priced, providing a competitive edge to businesses.
The Twin Cities’ quality of life is enviable, as evidenced by a wide range of impartial rankings such as CQ Press’ ranking of Minnesota among the top four most “livable states,“ for more than a decade.
Why the twin cities?

Head blurb. 4
20080.1 – 7.7 Jobs/Sq. Mi.
7.8 – 19.3 Jobs/Sq. Mi.
19.4 – 42.4 Jobs/Sq. Mi.
42.5 – 73.3 Jobs/Sq. Mi.
73.4 – 117.7 Jobs/Sq. Mi.
115.8 – 231.5 Jobs/Sq. Mi.
Workforce
4Your firm can tap into the Twin Cities’ large pool of skilled workers and be assured of a growing supply of potential hires.
The Minneapolis-st. Paul area was third in this year’s ranking of america’s best cities for Young Professionals, published by Forbes magazine, just behind Houston and Washington, D.C. Rounding out the list were New York, Boston, Dallas, Seattle, Denver, Atlanta and Austin.
Minnesota attracts people from across the country at a higher rate than Illinois, California and New York. In 2008, the U.S. Census Bureau found that 1.9 percent of Minnesotans had come to the state within the last year.
Workers stay in Minnesota. less than 1 percent of Minnesotans left the state between 2007 and 2008, a smaller portion than those who left states such as New York, Massachusetts, Georgia and North Carolina.
Minneapolis is among the top 10 boom towns with resilient economies, growing industries and lots of job potential, according to CBS News’ Business Network.
Minneapolis-St. Paul workers have one of the nation’s fastest commutes, outperforming other big markets. The Twin Cities is the only top 20 metro on the list with a population of more than 3 million.
Where Workers are Concentrated in the Minneapolis-St. Paul Metro Area
No Data or Suppressed
0 – 775
776 – 2,550
2,551 – 5,700
5,701 – 9,675
9,676 – 17,050
17,051 – 31,900
31,901 – 48,875
48,876 – 153,546
The Twin Cities outstanding commute time means workers come from across the entire metro. As an example, workers who commute to the Brooklyn Park area of the metro are shown on the map at left, and span the entire region.
Where Workers Live Who Are Employed in the Brooklyn Park Area of the Twin Cities

5Minnesota boasts one of the best-educated workforces in the country.
Workforce The Minneapolis-St. Paul metro offers a labor pool of
over 1.7 million workers.
Labor Force for Selected MetrosLocation Employment
New York-Northern New Jersey-Long Island, NY-NJ-PA 8,277,610.00
Chicago-Naperville-Joliet, IL-IN-WI 4,332,198.00
Dallas-Fort Worth-Arlington, TX 2,927,566.00
Boston-Cambridge-Quincy, MA-NH 2,399,034.00
Atlanta-Sandy Springs-Marietta, GA 2,299,202.00
San Francisco-Oakland-Fremont, CA 2,047,357.00
Minneapolis-St. Paul-Bloomington, MN-WI 1,734,555.00
Austin-Round Rock, TX 768,189.00
Raleigh-Cary, NC 507,154.00
Cleveland, OH 37,816.00
Minnesota’s hard-working ethic is reflected in the fifth-highest labor force participation rate in the nation.
Labor Force Participation Rates, 2009
StateLabor Force
Participation RateRank
Minnesota 71.9% 5
Illinois 66.8% 22
Massachusetts 66.5% 23
Ohio 66.0% 25
Texas 65.8% 26
Georgia 65.7% 27
California 65.1% 31
North Carolina 64.2% 35
New York 63.2% 40
United States 65.4% ----
In 2009, about 96 percent of Minnesota employers were quite satisfied with the Minnesota graduates they had hired, rating them as very good or good.
Employment Preparation of Minnesota Graduates2008-2009 Survey Responses
Note: The “very poor” rating had a zero percent response.Source: Minnesota Office of Higher Education.
Good
Very good
Very poor
Poor
19%
77%
4%
0%
Prior Work Experience Field-Specifi c Education
Not at all important 1% 1%
Not very important 10% 4%
Somewhat important 63% 38%
Very important 26% 57%
Source: Minnesota Offi ce of Higher Education
Factors in Hiring for Positions Requiring Postsecondary Education
The Twin Cities area is located in a state ranked as having the second most competitive workforce in the nation, according to the Beacon Hill Institute, 2008.
According to Travel + Leisure’s 2009 America’s Favorite Cities Survey, Minneapolis-st. Paul has the most intelligent citizens.

Head blurb. 6
Workforce
6
Minneapolis-St. Paul is the third-best U.s. major market for young professionals, according to Forbes magazine.
Minnesota is among the top 10 most productive states per capita. Minnesota workers add more value to the products they produce than most other states.
19 percent more than Ohio
18 percent more than Georgia
14 percent more than North Carolina
8 percent more than Texas
4 percent more than Illinois.
Minneapolis-St. Paul has a supply of selected scientific researchers comparable to Chicago and exceeding Dallas, Atlanta, Austin, Raleigh and Cleveland.
Employment and Median Wages for Selected Biological and Chemical Science Occupations by Location
LocationMicrobiologists Biological Scientists
Biochemists and Biophysicists
Biomedical Engineers
Employment Wage Employment Wage Employment Wage Employment Wage
San Francisco-San Mateo-Redwood City, CA 360 $87,020 450 $77,660 890 $90,570 510 $101,260
Atlanta-Sandy Springs-Marietta, GA 460 $84,470 510 $70,390 ** ** 160 $66,060
Chicago-Naperville-Joliet, IL 310 $64,180 340 $69,880 ** $71,660 ** $58,830
Boston-Cambridge-Quincy, MA 1,000 $65,110 920 $44,100 1,970 $93,640 960 $89,500
Minneapolis-St. Paul-Bloomington, MN-WI 240 $59,450 520 $55,590 290 $55,360 720 $94,010
Raleigh-Cary, NC ** $41,870 170 $60,110 ** ** ** **
New York-White Plains-Wayne, NY-NJ 470 $78,590 360 $76,770 800 $87,880 350 $76,100
Cleveland-Elyria-Mentor, OH 40 $47,650 ** $47,780 330 $56,390 190 $72,510
Austin-Round Rock, TX 150 $42,540 ** ** ** $65,680 130 $59,790
Dallas-Plano-Irving, TX 50 $43,570 170 $66,560 30 ** 80 $65,960
** not available. Source: U.S. Bureau of Labor Statistics, Occupational and Employment Statistics, May 2009.
Employment and Median Wages for Selected Biological and Chemical Science Occupations by Location
LocationChemists Chemical Engineers Chemical Technicians
Employment Wage Employment Wage Employment Wage
San Francisco-San Mateo-Redwood City, CA 1,100 $87,270 70 $86,140 650 $55,270
Atlanta-Sandy Springs-Marietta, GA 870 $72,170 120 $65,370 560 $33,850
Chicago-Naperville-Joliet, IL 1,450 $64,430 710 $80,640 1,210 $40,780
Boston-Cambridge-Quincy, MA 2,090 $85,430 560 $87,540 930 $51,190
Minneapolis-St. Paul-Bloomington, MN-WI 1,250 $68,420 270 $74,130 520 $42,270
Raleigh-Cary, NC 840 $56,430 120 $81,810 200 $37,930
New York-White Plains-Wayne, NY-NJ 2,310 $75,740 290 $92,400 1,340 $43,600
Cleveland-Elyria-Mentor, OH 1,090 $61,000 420 $81,710 990 $41,200
Austin-Round Rock, TX 480 $45,820 ** $74,760 370 $44,260
Dallas-Plano-Irving, TX 730 $70,010 360 $76,860 970 $42,460
** not available. Source: U.S. Bureau of Labor Statistics, Occupational and Employment Statistics, May 2009.
Minnesota employers overwhelmingly praise the quality of the state’s workforce.

Minnesota’s labor force is a competitive strength, skilled yet affordable. 7
Workforce Minneapolis–St. Paul ranks first in the nation and third in the world for human capital economic
activity, according to the World Knowledge Competitiveness Index 2008.
Minneapolis–St. Paul is among america’s top three best cheap cities for 2009, according to Forbes, and has one of the highest rankings for cultural activities.
Salaries go far in the Twin Cities, and the great work-life balance here creates productive workers. Single-family housing costs in the Twin Cities for the fourth quarter of 2009, according to the National Association of Realtors, are about a third less than some comparable metro areas.
Minneapolis-St. Paul has a supply of selected computer-related professionals that exceeds San Francisco, Austin, Raleigh and Cleveland.
Employment and Median Wages for Selected Computer Occupations by Location
Location
Computer Programmers
Computer Software Engineers,
Applications
Computer Software Engineers, Systems
Software
Computer Systems Analyst
Employment Wage Employment Wage Employment Wage Employment Wage
San Francisco- San Mateo-Redwood City, CA
3,580 $95,520 10,820 $105,560 7,280 $111,450 7,250 $92,880
Atlanta-Sandy Springs-Marietta, GA 5,510 $75,080 9,760 $88,940 7,370 $85,910 20,160 $81,070
Chicago-Naperville-Joliet, IL 15,620 $71,710 12,280 $89,760 13,970 $93,270 14,000 $74,720
Boston-Cambridge-Quincy, MA 7,220 $89,070 14,430 $100,140 18,920 $98,820 13,490 $86,820
Minneapolis-St. Paul-Bloomington, MN-WI 4,600 $66,690 13,580 $88,600 5,740 $93,670 10,600 $74,640
Raleigh-Cary, NC 2,930 $76,130 4,230 $85,150 2,490 $87,770 3,680 $73,770
New York-White Plains-Wayne, NY-NJ 24,950 $74,790 21,730 $97,020 11,170 $99,560 25,090 $86,050
Cleveland-Elyria-Mentor, OH 2,940 $60,810 3,570 $80,780 1,250 $74,950 3,380 $69,960
Austin-Round Rock, TX 5,110 $72,500 6,730 $89,750 5,660 $96,620 8,640 $72,580
Dallas-Plano-Irving, TX 10,100 $80,150 13,210 $95,420 12,750 $95,010 15,230 $82,390
Source: U.S. Bureau of Labor Statistics, Occupational and Employment Statistics, May 2009.
Employment and Median Wages for Selected Mangerial Occupations by Location
LocationGeneral and Operations
ManagersHuman Resources
ManagersComputer and Information
Systems ManagersSales
Managers
Employment Wage Employment Wage Employment Wage Employment Wage
San Francisco-San Mateo-Redwood City, CA
19,270 $125,290 1,060 $128,530 5,440 $140,740 4,790 $130,760
Atlanta-Sandy Springs-Marietta, GA
51,080 $88,170 1,580 $96,820 8,150 $110,280 10,890 $98,680
Chicago-Naperville-Joliet, IL 40,940 $108,360 2,670 $98,350 11,040 $111,380 13,410 $96,240
Boston-Cambridge-Quincy, MA 23,920 $107,760 870 $114,160 8,840 $125,580 5,290 $136,280
Minneapolis-St. Paul-Bloomington, MN-WI
20,930 $100,360 2,000 $104,870 8,090 $113,260 7,120 $103,780
Raleigh-Cary, NC 7,650 $104,160 150 $99,460 2,380 $108,580 1,450 $93,540
New York-White Plains-Wayne, NY-NJ
60,190 $142,510 4,990 $104,180 19,190 $139,790 13,450 $152,900
Cleveland-Elyria-Mentor, OH 6,180 $102,090 530 $103,010 1,650 $107,080 2,250 $104,970
Austin-Round Rock, TX 11,340 $98,190 300 $105,990 2,250 $117,850 1,850 $117,710
Dallas-Plano-Irving, TX 35,050 $103,010 860 $111,990 6,740 $120,290 6,460 $109,360
Source: U.S. Bureau of Labor Statistics, Occupational and Employment Statistics, May 2009.

8The Twin Cities is attractive to job seekers because of its diversity of industries.
Workforce
Employment and Median Wages for Selected Production Occupations by Location
Location
First Line Supervisors of Production and Operating
Workers
Computer-controlled Machine Tool Operators
Structural Metal FabricatorsProduction Workers,
All Other
Employment Wage Employment Wage Employment Wage Employment Wage
San Francisco-San Mateo-Redwood City, CA
1,790 $63,570 210 $50,040 50 $43,100 610 $29,640
Atlanta-Sandy Springs-Marietta, GA
9,610 $50,370 690 $34,790 1,750 $32,590 4,560 $20,210
Chicago-Naperville-Joliet, IL
18,610 $55,920 4,670 $35,880 1,320 $39,120 18,370 $28,260
Boston-Cambridge-Quincy, MA
4,650 $60,550 830 $40,240 400 $38,670 640 $20,920
Minneapolis-St. Paul-Bloomington, MN-WI
8,410 $56,170 3,030 $40,500 670 $40,840 5,730 $27,320
Raleigh-Cary, NC 1,690 $51,380 190 $30,090 ** $32,980 230 $45,980
New York-White Plains-Wayne, NY-NJ
10,940 $58,170 730 $36,080 970 $37,490 2,980 $28,770
Cleveland-Elyria-Mentor, OH 6,400 $53,690 2,750 $36,910 650 $34,760 1,750 $36,120
Austin-Round Rock, TX 2,550 $53,080 640 $24,500 270 $30,930 450 $23,030
Dallas-Plano-Irving, TX 8,700 $52,840 970 $32,770 2,650 $28,230 1,780 $20,010
** not available. Source: U.S. Bureau of Labor Statistics, Occupational and Employment Statistics, May 2009.
the twin cities has a strong, vibrant economy. The state weathered the recent recession avoiding the extremes of the housing boom and bust.
Minneapolis had the smallest rise in unemployment among the nation’s largest metro areas, according to the U.S Bureau of Labor Statistics.
The Twin Cities has an incredible manufacturing sector that encompasses 197,000 workers, with an additional 138,000 elsewhere in the state. In addition, the state has over 71,000 workers in management of companies.
Employment and Median Wages for Selected Business Operations Occupations by Location
Location
Compensation, Benefits, and Job Analysis
Specialists
Human Resources, Training, and Labor
Relations Specialists
Network and Computer Systems Administrators
Office and Administrative Support Occupations
Employment Wage Employment Wage Employment Wage Employment Wage
San Francisco-San Mateo-Redwood City, CA 1,420 $67,550 2,220 $83,340 4,600 $92,000 163,960 $40,580
Atlanta-Sandy Springs-Marietta, GA 2,400 $54,910 2,880 $61,900 7,340 $71,830 438,280 $31,610
Chicago-Naperville-Joliet, IL 3,630 $58,080 5,530 $53,080 12,370 $75,060 612,900 $32,780
Boston-Cambridge-Quincy, MA 2,650 $64,960 2,610 $67,580 6,750 $78,590 287,050 $38,240
Minneapolis-St. Paul-Bloomington, MN-WI 1,880 $58,610 4,960 $61,320 8,250 $71,690 280,260 $34,420
Raleigh-Cary, NC 860 $53,170 430 $60,990 1,630 $65,300 82,110 $31,380
New York-White Plains-Wayne, NY-NJ 10,040 $65,210 9,580 $61,580 13,740 $82,900 957,990 $36,100
Cleveland-Elyria-Mentor, OH 890 $54,690 3,260 $42,380 3,050 $59,730 175,620 $30,630
Austin-Round Rock, TX 1,130 $48,650 860 $56,420 3,070 $61,760 137,260 $31,270
Dallas-Plano-Irving, TX 2,510 $54,440 2,740 $61,170 9,180 $70,570 385,530 $31,920
Source: U.S. Bureau of Labor Statistics, Occupational and Employment Statistics, May 2009.

9The Twin Cities is a magnet for people from throughout the country, drawing talented graduates and skilled, educated workers.
education
Minneapolis-St. Paul ranked among the top nine U.s. best college cities, according to the College Destinations Index 2009-2010 from the American Institute for Economic Research.
Minneapolis-St. Paul is within a two-hour drive to 15 of “america’s best colleges,” according to Forbes.
Of the over 272,000 high school students in Minnesota in 2009-10, nearly 149,000 (or 55 percent) were located in the twin cities. Over 25,000 more students are located in the ring of counties surrounding the Twin Cities, 9 percent of the state total.
Minnesota ranks second among states in the percentage of the population aged 25 years or older that has a high school diploma.
Minnesota’s population is one of the most educated in the nation.
Percentage of Population with Bachelor’s Degrees and High School Diplomas, 2008
Metropolitan Area Bachelor’s Degrees High School Diplomas
San Francisco-Oakland-Fremont, CA 43.4 86.9
Raleigh-Cary, NC 41.5 89.9
New York-Northern New Jersey-Long Island, NY-NJ-PA 35.2 83.8
Minneapolis-St. Paul-Bloomington, MN-WI 37.6 92.7
Dallas-Fort Worth-Arlington, TX 29.6 81.2
Cleveland, OH 27.0 88.0
Chicago-Naperville-Joliet, IL-IN-WI 33.0 85.5
Boston-Cambridge-Quincy, MA-NH 41.9 89.9
Austin-Round Rock, TX 38.2 86.5
Atlanta-Sandy Springs-Marietta, GA 34.6 87.3
Source: Ranking Tables, 2008 American Community Survey 1-Year Estimates, U.S. Census Bureau.
Enrollment in Twin Cities Metro Area Colleges and Universities, 2008PRIvATE PuBLIC
College Enrollment College Enrollment
Augsburg College 4,019 University of Minnesota - Twin Cities 51,659
Carleton College 2,011 Metropolitan State University 7,361
St. Catherine University 5,277 Anoka Technical College 2,260
Hamline University 5,166 Anoka Ramsey Community College 9,210
McCalester College 1,996 Century College 10,489
St. Olaf College 3,099 Dakota County Technical College 2,978
University of St. Thomas 10,852 Hennepin Technical College 6,236
Bethel University 4,370 Inver Hills Community College 6,188
Concordia University 2,816 Minneapolis Community and Technical College 10,591
St. Marys University 5,498 Normandale Community College 10,092
North Hennepin Community College 7,421
St. Paul College 5,929
Source: Preliminary Minnesota Postsecondary Enrollment Census for Fall 2009, Minnesota Office of Higher Education, Nov. 2009.
10The state’s higher education sector is a critical driver in building and maintaining a competitive workforce.
education
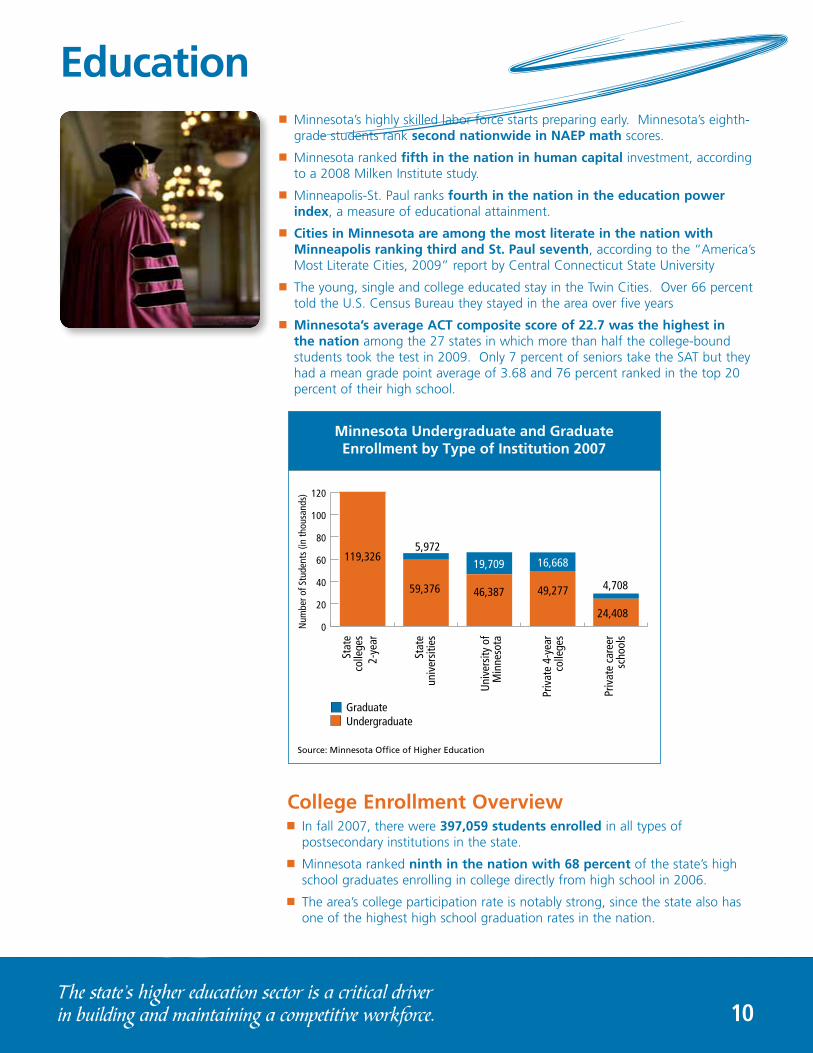
college enrollment overview In fall 2007, there were 397,059 students enrolled in all types of
postsecondary institutions in the state.
Minnesota ranked ninth in the nation with 68 percent of the state’s high school graduates enrolling in college directly from high school in 2006.
The area’s college participation rate is notably strong, since the state also has one of the highest high school graduation rates in the nation.
GraduateUndergraduate
Source: Minnesota Office of Higher Education
Minnesota Undergraduate and GraduateEnrollment by Type of Institution 2007
Num
bero
fStu
dent
s(in
thou
sand
s)
0
20
40
60
80
100
120
Stat
eco
llege
s2-
year
Stat
eun
iver
sitie
s
Univ
ersit
yof
Min
neso
ta
Priv
ate
4-ye
arco
llege
s
Priv
ate
care
ersc
hool
s
119,3265,972
59,376
19,709
46,387
16,668
49,277 4,708
24,408
Minnesota’s highly skilled labor force starts preparing early. Minnesota’s eighth-grade students rank second nationwide in naeP math scores.
Minnesota ranked fifth in the nation in human capital investment, according to a 2008 Milken Institute study.
Minneapolis-St. Paul ranks fourth in the nation in the education power index, a measure of educational attainment.
cities in Minnesota are among the most literate in the nation with Minneapolis ranking third and st. Paul seventh, according to the “America’s Most Literate Cities, 2009” report by Central Connecticut State University
The young, single and college educated stay in the Twin Cities. Over 66 percent told the U.S. Census Bureau they stayed in the area over five years
Minnesota’s average act composite score of 22.7 was the highest in the nation among the 27 states in which more than half the college-bound students took the test in 2009. Only 7 percent of seniors take the SAT but they had a mean grade point average of 3.68 and 76 percent ranked in the top 20 percent of their high school.

11Minnesota can attract and retain the best talent.
education
All OtherBusiness ManagementConstruction Manufacturing & TransportationHuman Services (Cosmetology)Health Science
Source: U.S. Department of Education, IPEDS Completion Survey
Certificates and Diplomas
Minnesota Peer States Nation 0%
20%
40%
60%
80%
100%
14%
10%
11%
11%
12%
42%
12%6%5%
14%
12%
51%
16%
8%6%
14%
13%
43%
All OtherArts & CommunicationsLaw & Corrections Business ManagementLiberal ArtsHealth Science
Source: U.S. Department of Education, IPEDS Completion Survey
Associate Degrees
Minnesota Peer States Nation 0%
20%
40%
60%
80%
100%
19%
5%7%
12%
29%
29%
27%
4%7%
17%
23%
22%
23%
4%5%
13%
35%
20%
All OtherArts & CommunicationsHealth Science Liberal Arts, Languages, HistorySTEMBusiness Managemant
Source: U.S. Department of Education, IPEDS Completion Survey
Bachelor’s Degrees
Minnesota Peer States Nation 0%
20%
40%
60%
80%
100%
31%
10%
11%
13%
15%
20%
30%
11%
12%
11%
14%
21%
29%
11%
12%
13%
14%
21%
All OtherSTEMHuman Services Health ScienceBusiness ManagementEducation & Training
Source: U.S. Department of Education, IPEDS Completion Survey
Master’s Degrees
Minnesota Peer States Nation 0%
20%
40%
60%
80%
100%
16%
5%
11%
17%
25%
26%
16%
9%
7%
11%
27%
30%
18%
9%7%
11%
25%
30%
All OtherEducation & TrainingHuman Services STEMLawHealth Science
Source: U.S. Department of Education, IPEDS Completion Survey
Doctoral Degrees
Minnesota Peer States Nation 0%
20%
40%
60%
80%
100%9%4%10%
12%
30%
36%
8%5%7%
15%
25%
40%
8%5%7%
15%
29%
35%
college Graduates In 2006-2007, over 78,000 college degrees were
awarded in Minnesota, about 95 percent of those within a couple hours of the Twin Cities.
14,700 certificates and diplomas less than two years in length
16,100 associate degrees
32,700 bachelor’s degrees
11,300 master’s degrees
3,300 doctoral degrees in both research and professional fields (such as law, medicine, theology)
If Minnesota were a nation, it would be ranked fifth (behind Canada, Russia, Japan and North Korea) in the percent of population age 25 to 34 with an associate degree or higher.
Over 1,000 engineering degrees were awarded by the University of Minnesota-Twin Cities alone, for a total of over 2,300 across the state.
Associate Degree: 718
Bachelor’s Degree: 1,132 (685 at U of MN Twin Cities)
Master’s Degree: 340 (230 at U of MN Twin Cities)
Doctoral Degree: 125 (all at U of MN Twin Cities)
awards conferred by Minnesota Institutions compared to Peer states and the nation by level of award 2006-2007

12As the headquarters to many prominent companies, Minnesota has tremendous transportation networks.
logisticsCommuting Times
Metropolitan AreaPopulation
(2008)
Average commuting time
to work (minutes)
Rank
Cleveland-Elyria-Mentor, OH 2,094,051 23.82 13
Minneapolis-St. Paul-Bloomington, MN-WI
3,237,612 24.13 16
Raleigh-Cary, NC 1,090,408 25.18 27
Austin-Round Rock, TX 1,654,100 25.41 29
Dallas-Fort Worth-Arlington, TX 6,301,085 26.77 38
Boston-Cambridge-Quincy, MA-NH 4,544,705 28.50 45
San Francisco-Oakland-Fremont, CA 4,260,236 28.66 46
Atlanta-Sandy Springs-Marietta, GA 5,385,586 30.80 49
Chicago-Naperville-Joliet, IL-IN-WI 9,515,636 31.08 50
New York-Northern New Jersey-Long Island, NY-NJ-PA
18,968,501 34.55 52
Source: Business First ranking of 52 major markets.
Miss
issip
pi R
iver
Interstate Highway System
Over 1,000MW
100-1,000MW
1-100MW
American Wind Energy Association (AWEA)
Ontario
Interstate Highway system
Metro
American Wind Energy Association (AWEA)
the twin cities are centrally located in north america, making it easy to
ship across the continent.
An efficient and ever-growing freight system is essential for Minnesota businesses. the state is home to 21 fortune 500 companies, including 20 in the metro, and 32 fortune 1,000 companies, 12 of which are in the metro.
Prominent companies such as supervalu, cHs, General Mills, land o’lakes, Hormel foods, Polaris Industries, target, nash finch, best buy, cargill, c.H. Robinson and toro are headquartered in the state.
Minnesota is a global competitor that exports to nearly 200 countries, ranking ninth for outbound interstate shipments. Two-thirds of all freight tonnage moving in Minnesota crosses the state’s borders.
Minnesota was ranked among the top 12 states for transportation infrastructure by CNBC for 2009.
Highways and trucking The Minneapolis-St. Paul metro is considered one of the
largest trucking centers in the United states and is a hub for more than 150 motor freight companies that provide overnight and four- to five-day delivery throughout the country.
Businesses in Minneapolis-St. Paul have quick, efficient access to workers with some of the quickest commute times in the nation — and the fastest commute time for a metro of over 3 million.

13Your firm would be connected to U.S. and global locations through top-notch infrastructure and logistical advantages.
logistics
Major Railroads
American Wind Energy Association (AWEA)
Rail Six rail lines in the state are integrated with both the
U.S. and Canadian railway systems, offering competitive rates to companies that use rail service.
Rail accounts for about 33 percent of freight tonnage in Minnesota. twenty-three railroad companies and three private industries haul rail freight in the state.
River shipping Minneapolis-St. Paul is served by two waterway systems
— the Mississippi River and the Great lakes/st. lawrence seaway. These bodies of water provide a low-cost and effective means of transporting goods.
The Mississippi River system connects Minnesota with 17 states and the international port of New Orleans. Barge tows and diesel towboats haul a wide range of commodities.
The Port of Duluth, an international seaport, is located two hours north of the Twin Cities. It is the western terminus of the Great Lakes/St. Lawrence Seaway and connects the region to the East Coast and world markets beyond.
Metro

14Minneapolis-St. Paul International Airport offers safe, efficient and reliable access to customers and suppliers.
logistics
selected non-stop Destinations from MsP airport
airports Minneapolis-St. Paul International Airport (MSP) was
recognized as the best airport in north america among airports serving between 25 million and 40 million passengers a year in 2009, and ranks as the third best airport in the World in that size category, according to Airports Council International.
There are 14 airports in Minnesota that support scheduled air cargo operations. An additional 18 airports provide on-demand charter operations for air cargo.
Minneapolis-St. Paul International is among the top cargo operations airports in the country, ranking 23rd with 1.2 billion pounds of landed cargo.
MSP airport serves 148 nonstop markets, including 122 domestic and 26 international markets, ranking second for non-stop markets per capita in the nation.
MSP ranked 12th in the country and 15th in north america in passenger traffic, serving 32 million people, according to Airports Council International.
Ranking of Major Airport On-Time Arrival Performance Year-to-Date Through April 2010
Rank January 1 - April 30, 2010 %
10 Minneapolis/St. Paul, MN (MSP) 81.86
12 Chicago, IL (MDW) 81.23
13 Dallas/Ft.Worth, TX (DFW) 80.70
16 Atlanta, GA (ATL) 78.58
18 Chicago, IL (ORD) 77.74
24 Boston, MA (BOS) 74.21
26 New York, NY (JFK) 73.87
27 New York, NY (LGA) 73.53
28 San Francisco, CA (SFO) 71.04
Source: U.S. Bureau of Transportation Statistics.
ReykjavikAmsterdamLondonParis
Miami
SanFrancisco
Houston
Los Angeles
San Diego
Vancouver
Tokyo
Mexico City
Seattle
Boston
Montreal
Winnipeg
Minneapolis-St. Paul Toronto
Philadelphia
Atlanta
New York
Washington, DC
Chicago
Dallas
Detroit

15The 11-mile Central Corridor light rail line between St. Paul and Minneapolis will open for passenger service in 2014.
transportationnorthstar commuter Rail line Northstar, Minnesota’s first commuter rail line, provides fast, convenient,
hassle-free service in one of the region’s fastest growing and most congested corridors. The 40-mile line operates between Big Lake and downtown Minneapolis, with stops in Elk River, Anoka, Coon Rapids and Fridley.
light Rail The 12-mile Hiawatha line, linking downtown Minneapolis, the
Minneapolis-st. Paul International airport and the Mall of america, provided 10 million rides in 2008, an average of 30,500 per weekday.
The Twin Cities long-range transportation plan calls for developing additional bus and rail “transitways” in six corridors by 2020. The plan includes construction of the region’s second light rail transit line in the Central Corridor between downtown st. Paul and downtown Minneapolis, connecting there with the Hiawatha light rail line and the Northstar commuter rail line.
35W
94
35E
280
55
MIS
SISSIPPI RIVER
DowntownMinneapolis
DowntownSt. Paul
State CapitolMISSISSIPPI RIVER
MINNEAPOLIS
ST PAUL
945TH ST
UNIVERSITY AVE
WASHINGTON AVE
CEDAR ST
394
Hiawatha LRT
Northstar
Commuter Rail
4th & Cedar Station
Westgate Station
West BankStation
Union Depot
Station
Raymond Ave Station
Capitol East Station
Fairview Ave Station
Minneapolis
MultiM
odal Stat
ion
10th St Station
Rice St Station
Dale St Station
29th Ave Station
East B
ank S
tation
Snelling Ave Station
Nicolle
t Mall
Station
Lexington Pkwy Station
Stadium Villa
ge
Station
Govern
ment C
enter
Station
Downtown East /
Metrodome S
tation
Warehouse
Dist
rict S
tation
0 0.5 1 1.5 2
Miles
Central Corridor Station
Rail Line
Existing Hiawatha Station
Series: 01_overview_color2
Hiawatha line light Rail
central corridor light Rail
northstar commuter Rail line

16Because of Minnesota’s favorable tax provisions, bottom-line tax liability is very competitive.
business costs
Corporate Income Tax
State Corporate Income Tax RateApportionment Formula (sales/property/payroll)
Throwback Rule CarryforwardR&D
Credit
Minnesota 9.80% 87/6.5/6.5* No Yes (0 back, 15 forward) Yes
Ohio
40% of the greater of (1) 5.1% on 1st $50,000 of net income and 8.5% on net income in
excess of $50,000; (2) 4 mills times net worth up to $150,000 max; or (3) fixed dollar mini-
mum tax of $50/$1,000.
Triple weighted sales No Yes (0 back, 20 forward) Yes
California 8.84%Three factor, double-weighted sales; May elect single-sales
factor beginning in 2011.
Yes. For combined reporting groups is avoided if any
group member has nexus with destination state.
Yes: 2010=0 back, 20 forward; 2011=2 back (50% NOL deduc-tion limit), 20 forward; 2012=2
back (75% NOL deduction limit), 20 forward; After 2012=2 back,
20 forward
Yes
TexasMargin tax of 1% or .5% on lesser of 70% of total revenues or 100% of gross receipts after
deductions; subject to other discounts.One-factor gross receipts No
No (0 back, 5 forward for reports due prior to 2008)
Yes
Illinois4.8% (plus 2.5% personal property
replacement tax)One-factor sales Yes Yes (0 back, 12 forward) Yes
Massachusetts
Pay an excise tax equal to the greater of the foloowing: (a) $2.60 per $1,000 of value on
tangible property not taxedlocally or net worth, plus 9.5% on net income attributable to state
sources; or (b) minumum tax of $456.
Three factor, double-weighted sales
Yes Yes (0 back, 5 forward) Yes
Georgia 6.00% One-factor sales No Yes(2 back, 20 forward) Yes
New York
Tax on greatest of 7.1% of entrie net income with adjustments (6.5% for qualified in-state
mfgers); 1.5% alternative min tax base; 0.15% per dollar of allocated capital (up to $350,000
for qualified in-state mfgers or $10 mill for others); or a fixed min tax between $25 and
$5,000.
Three factor, double-weighted sales
NoYes (2 back (1st $10,000 of loss),
20 forward)No**
North Carolina 6.9% plus a 3% surchargeThree factor, double-weighted
salesNo Yes (0 back, 15 forward) Yes
*Minnesota is phasing in a single sales apportionment by 2014. **There is an R&D credit for property and other related incentives. Source: 2010 State Tax Handbook, CCH Inc. A Practical Guide to Research and Development Tax Incentives, Second Edition, CCH Inc. State websites.
Minnesota business taxes are Very competitive Minnesota’s business taxes rank among the 16 lowest in the nation,
according to a report by Ernst & Young and the Council on State Taxation, which assessed business taxes as a share of private sector gross state product for fiscal year 2009. Minnesota’s tax ranking was better than that for California, Texas, New York, Ohio and Illinois.
Minnesota is among the top states for business 2009, ranking sixth overall, according to a CNBC report. That report found that Minnesota’s economic competitiveness was better than such states as California, Pennsylvania, New Jersey, New York, Ohio, Georgia, North Carolina, Massachusetts and Illinois.
corporate Income tax Minnesota’s lack of a throwback rule (sales to states without income taxes
“thrown back” to the taxing state for apportionment purposes) reduces net income, and a generous carryforward period helps reduce tax liabilities.

17Minnesota offers service value with reasonable business costs.
business costs
sales and Use tax
StateState Sales
and use Tax RateMaximum
Local Sales Tax RateTotal State and
Local Sales Tax RateTax on Manufacturing
Machinery
Illinois 6.250% 3.5% (Chicago) 9.750% No
California 7.250% 2.25% (San Francisco) 9.500% Yes
New York 4.000% 4.875% (New York) 8.875% No
Texas 6.250% 2.0% (Dallas) 8.250% No
Georgia 4.000% 4.0% (Atlanta) 8.000% No**
Minnesota 6.875% 0.9% (Minneapolis), 0.75% (St. Paul) 7.775% No*
Ohio 5.500% 2.25% (Cleveland) 7.750% No
North Carolina 5.750% 2.0% (Raleigh-Durham) 7.750% No
Massachusetts 6.250% 0% (Boston) 6.250% No
*Refunded. **Only “new and expanded industry” is exempt.Source: 2010 State Tax Handbook, CCH Incorporated.
Minnesota has one of the lowest tax burdens, according to the 2009 Forbes report “America’s Most Beastly Tax Burdens,” ranking 11th lowest in the nation.
sales and Use tax Minnesota exempts capital equipment used in the manufacturing
process from the sales tax, and there are several other major exemptions for businesses, including fees for equipment installation and repair, and most services. Also exempted are utilities, chemicals and gases used in industrial production. In Minnesota, only certain services are taxable.

18Minnesota has competitive advantages that make it a leading state for doing business.
business costscommercial and Industrial Property tax Minnesota exempts personal property like machinery and inventory
from the property tax, resulting in a lower effective tax rate for real and personal property. As a result, businesses whose equipment and inventory values are high, relative to their real estate value, pay a lower effective tax rate than in states that impose such taxes.
the effective tax rate for industrial businesses in Minneapolis (1.294 percent) is lower than those of other cities in the Midwest such as Detroit (2.723 percent); Kansas City (2.158 percent); and Des Moines (1.740 percent).
Property Tax Base
StateTax on Personal
PropertyTax on Intangible
PropertyTax on
Inventories
Minnesota No No No
Ohio Yes No No
California Yes No No
Texas Yes* No** Yes
Illinois No No No
Massachusetts Yes No Yes***
Georgia Yes No Yes
New York No No No
North Carolina Yes No No
*Only income-producing personal property is taxable. **Certain intangibles of insurance companies and savings and loans are taxable. ***Unincorpoated businesses only.Source: 2010 State Tax Handbook, CCH Incorporated.
Property Tax on a $2.5 Million-Valued Urban Industrial Property, Payable Year 2009
State City Net Tax Effective Tax Rate Rank
Texas Houston $63,093 2.52% 3
Georgia Atlanta $39,689 1.59% 13
New York New York City $38,837 1.55% 16
Minnesota Minneapolis $32,342 1.29% 24
Illinois Chicago $28,331 1.13% 32
Massachusetts Boston $27,110 1.08% 33
California Los Angeles $23,188 0.93% 38
North Carolina Charlotte $22,430 0.90% 39
Ohio Columbus $22,226 0.89% 40
United States $33,276 1.33% ----

19Minnesota offers competitive insurance-related costs.
Unemployment Insurance tax Minnesota companies with the most favorable employment histories received
an unemployment insurance base tax rate of 0.5 percent in 2010.
business costs
2008 Unemployment Insurance TaxState Tax Rate as Percent of Total Wages Average State Tax Per Worker at Tax Base
Minnesota 0.73% $393
Ohio 0.63% $230
California 0.69% $284
Texas 0.27% $107
Illinois 0.77% $354
Massachusetts 0.97% $472
Georgia 0.35% $127
New York 0.53% $292
North Carolina 0.79% $335
Source: ETA 205 Unemployment Insurance Service, Employment and Training Administration, U.S. Department of Labor.
Workers’ Compensation InsuranceState Overall Cost per $100 (rank) Office Worker Cost per $100 (rank) Mfg Assembly Cost per $100 (rank)
Minnesota $2.33 (24) $0.26 (41) $6.71 (11)
Ohio $3.32 (3) $0.40 (20) $9.19 (3)
California $2.72 (13) $0.64 (5) $3.51 (41)
Texas $2.61 (17) $0.39 (21) $8.77 (4)
Illinois $2.79 (10) $0.34 (27) $5.91 (13)
Massachusetts $1.39 (49) $0.13 (51) $2.87 (47)
Georgia $2.29 (25) $0.32 (34) $5.68 (16)
New York $2.55 (19) $0.33 (30) $7.66 (5)
North Carolina $2.43 (22) $0.46 (17) $3.72 (33)
Source: Oregon Workers’ Compensation Premium Rate Ranking 2008, March 2009, Oregon Dept of Consumer and Business Services.
Workers’ compensation Insurance Minnesota’s workers’ compensation costs are 30 percent below the median
total cost per claim among a 15-state sample, according to a 2010 report by the non-profit Workers Compensation Research Institute (WCRI).
Employers generally arrange workers’ compensation coverage with private insurers at a market rate. Minnesota’s insurance industry is very competitive, allowing for substantially reduced market-rate premiums.

20Minnesota’s energy services are extremely reliable and cost less than the national average.
Utilities
electricity cost Minnesota’s low electricity costs give you a competitive advantage.
Minnesota’s low rate is comparable to areas with a far smaller supply of skilled workers.
The average electricity price for industrial consumers in Minnesota is 8 percent lower than the national average, and 23 percent lower for commercial consumers.
Electricity Average Retail Price for Industrial Customers, 2009
StateCents per Kilowatthr
Rank
North Carolina 5.93 20
Georgia 6.13 22
Minnesota 6.28 24
Ohio 6.69 28
Texas 6.99 32
Illinois 7.53 35
New York 9.71 40
California 10.46 44
Massachusetts 11.61 46
U.S. Average 6.84
Source: U.S. Department of Energy, Energy Information Administration.
Electricity Average Retail Price for Commercial Customers, 2009
StateCents per Kilowatthr
Rank
Minnesota 7.87 16
North Carolina 7.92 17
Illinois 8.31 23
Georgia 8.89 26
Ohio 9.59 32
Texas 9.84 34
California 13.73 43
New York 15.4 48
Massachusetts 17.8 50
U.S. Average 10.21
Source: U.S. Department of Energy, Energy Information Administration.
Utilities are exempted from sales tax in Minnesota, a great savings for those companies with heavy utility costs.
Utility providers in the Twin Cities include Xcel Energy, CenterPoint Energy, Dakota Electric, Great River Energy and local municipalities.

21From electricity to telecommunications, Minnesota utilities are abundant, reliable and affordable.
Utilities
Utility assistance from Metcouncil environmental services (Mces) — There are many ways MCES could help companies evaluate their wastewater discharge and improve overall processes including:
Providing historical information including discharge volumes, strength charge amounts (which are based on chemical oxygen demand and suspended solids concentrations), and oils/grease concentrations.
Evaluating wastewater generating activities for potential reductions in volume and constituents.
Reviewing viable wastewater pretreatment options such as dissolved air floatation (solids and O/G reductions) and wastewater cooling/phase separation (O/G reduction).
Helping to establish a relationship with the Minnesota Technical Assistance Program (MNTAP), a free resource funded by the state through the Minnesota Pollution Control Agency. General Mills had previously received assistance from MNTAP for its facility.
Helping to establish a relationship with the Retired Engineers Technical Assistance Program (RETAP), a free resource.
natural Gas cost The natural gas price for industrial consumers in Minnesota was among the
10 lowest in the nation for 2009.
Natural gas is mostly supplied by pipelines entering the state from Canada and North and South Dakota. The state ships over four-fifths of the natural gas it receives to Iowa and Wisconsin, on the way to other markets in the Midwest.
Natural Gas Average Retail Price for Industrial Customers, Annual 2009
StatePrice (Dollars per
Thousand Cubic Feet)Rank*
Texas 4.08 2
Minnesota 5.71 10
California 6.54 20
Georgia 7.27 21
Illinois 7.29 22
North Carolina 8.3 26
Ohio 9.88 34
New York 10.82 36
Massachusetts 16.15 41
U.S. Average 5.27
*Among those states with available data. Source: U.S. Department of Energy, Energy Information Administration.
Natural Gas Average Retail Price for Commercial Customers, Annual 2009
StatePrice (Dollars per
Thousand Cubic Feet)Rank*
California 7.67 7
Minnesota 7.93 9
Texas 8.15 10
Illinois 8.71 11
Ohio 10.63 24
New York 10.9 26
North Carolina 11.5 31
Georgia 11.61 32
Massachusetts na na
U.S. Average 9.75
*Among those states with available data. Source: U.S. Department of Energy, Energy Information Administration.

22International and U.S. magazines are saying what Minnesotans already know: The state is one of the best places to work and live.
Quality of lifeQuality of life Minneapolis is one of the world’s top 25 most livable cities, according
to a 2008 report by the British Journal, Monacle. Minneapolis is among top cosmopolitan cities such as Paris, Barcelona and Amsterdam.
In 2008, a travel & leisure/cnn poll found that Minneapolis-st. Paul was among the top three cities in the nation for cleanliness, most intelligent people, safety, friendly people and affordability. Travel & Leisure also named Minneapolis one of the top biking cities in the world, one of only three in the U.S. that made the list.
Minneapolis is one of america’s best long-term real estates bets, ranking fourth nationwide, according to forbes. The magazine evaluated the 40 largest metropolitan areas, using 25 years of data from the National Association of Home Builders.
Minneapolis was called the “Design city” by newsweek due to stunning buildings such as the Guthrie Theater, the Minneapolis Central Library, the Walker Arts Center and the Minneapolis Institute of Arts.
Minneapolis is the safest city In america according to Forbes magazine.
Minneapolis was rated among the top 10 fun cities by Portfolio.com.
The Twin Cities is among the top eight cities for live music/concerts and bands, according to Travel & Leisure magazine.
Quality of life Indicators no other state in the nation has five cities among the top 20 in Money
Magazine’s annual list of america’s top 100 best Places to live. All five are located in the Twin Cities. Eden Prairie is ranked first in the nation, Plymouth 11th , Woodbury 13th , Eagan 15th, and Apple Valley at 20th.
Minnesota is the healthiest state in the country, according to 2008 annual rankings by CQ Press. The state has been among the top five states since 1996 and among the top three since 2006.
Minneapolis and st. Paul rank first and second, respectively, in land dedicated to parks. According to Trust for Public Land, 16.6 percent of Minneapolis is parks while the percentage for St. Paul is 14.7 percent.
According to the 2009 Forbes’ Most Wired Cities report, Minneapolis ranks seventh among the 30 most wired cities in the country. Across Minnesota, more than 76 percent of individuals use the Internet, ranking fourth in the nation.
Minneapolis ranked as the third Most fit city in america by the American College of Sports Medicine Fitness Index.
Minneapolis-St. Paul is among the top three best cities for Working Mothers, according to Forbes, ranking far above such cities as San Francisco (15th), Raleigh (18th), Chicago (23rd), Boston (24th), Dallas (29th), Atlanta (31st) and Cleveland (34th).

23Cultural attractions, outdoor recreation, affordable housing, safe streets and an educated labor force make the state one of the most livable places in the country.
attractions Minneapolis-St. Paul ranks among the top seven cities nationwide
for recreational opportunities, according to Places Rated Almanac. The Twin Cities have more than 150 golf courses, about 63,130 acres of recreation areas, 192,000 acres of lakes and rivers, nearly 150 professional sporting events annually, more than 530 movie theater screens, two zoos and three amusement parks.
the Mall of america features over 400 stores and more than 2.5 million square feet of shopping. It draws more visitors than any other tourist attraction in the country.
The Twin Cities area offers a wide variety of family entertainment, including the Minnesota Zoological Gardens, Como Zoo and Conservatory, the Children’s Museum, and the Science Museum of Minnesota.
More than 8 million people visit Minnesota’s state parks annually. Minnesota’s state park system includes 72 state parks and recreation areas, eight waysides, one state trail and 54 state forest campgrounds and day-use areas totaling 267,000 acres.
Hospitals by the numbers The twin cities metro has 29 hospitals. There are a total of 151
hospitals across in the state with over 16,000 licensed beds.
Major healthcare systems in the Twin Cities include:
Allina Hospitals & Clinics
Children’s Hospitals and Clinics of Minnesota
Fairview Health Services
HealthEast Care System
North Memorial
Park Nicollet
The system with the greatest number of hospitals is allina Hospitals and clinics with 11 hospitals and 2,645 licensed beds.
The hospital with the largest number of staffed beds in the state is Mayo clinic, Rochester with 2,175 licensed beds.
climate by the numbers There are an average of 196 sunny or partly sunny days per year in the
Twin Cities.
The Twin Cities averages 32 inches of rain and 52 inches of snowfall each year.
Quality of life
twin cities average Monthly temperatureJan. Feb. Mar. Apr. May June July Aug. Sep. Oct. Nov. Dec.
Avg. High 22˚ 28˚ 39˚ 56˚ 69˚ 79˚ 83˚ 81˚ 71˚ 59˚ 41˚ 27˚
Avg. Low 4˚ 10˚ 22˚ 36˚ 48˚ 58˚ 63˚ 61˚ 51˚ 40˚ 25˚ 12˚
Source: Minnesota Climatology Working Group.

Head blurb. 24Minnesota has financial tools to help your business reach its goals.
Minnesota’s office of business Development has a program with financing of up to $1 million. Depending on the number of jobs added to Minnesota within two years of the plant’s opening, the Minnesota Investment Fund could provide for fixed assets such as machinery and equipment. Availability of this program depends on the funding the department has at any given time in its fiscal year.
The Minnesota Agricultural and Economic Development Board may make direct loans for land, building expansion or acquisition of equipment on a statewide basis to support business expansions. Typical terms of the loan are a maximum of $500,000, up to 10-year amortization at an interest rate of 3 percent, and jobs created must pay at least $11.66 per hour. The program provides up to a maximum of $5 million in fixed asset financing to a business and generally requires that 20 percent of project costs be privately financed.
Larger loans are financed through the issuance of industrial development bonds. Interest rates are the market rate for similar securities at the time bonds are sold. Rates are fixed for the term of the loan. Real estate loans are for a maximum of 20 years. Equipment loans are for a maximum of 10 years.
Minnesota Job skills Partnership — Minnesota companies have extensively used the Job Skills Partnership Program through educational partners in Minnesota to create and implement training programs. DEED will eagerly pursue any options that call for customized training.
The maximum grant is $400,000, which is awarded to the educational institution to help underwrite the cost of developing curriculum and delivering it. Training can be done on your premises. Access to the full available grant depends upon formulation of the training package that would use the full amount and be matched by your company with a cash or in-kind contribution.
local energy Improvements financing Program (leIf) — local communities can provide low-interest loans that enable property owners to retrofit their buildings with cost-effective energy improvements. The loan cannot exceed 10 percent of the assessed value of the property and owners will pay back the loan through a special tax assessment not to exceed 20 years.
Job opportunity building Zone (JobZ) benefits — Several Minneapolis-St. Paul area communities can offer substantial tax savings through Minnesota’s JOBZ program. Eligible companies can qualify for the following tax exemptions by expanding or locating within one of the JOBZ areas:
Corporate franchise tax Income tax for operators or investors, including capital gains tax Sales tax on goods and services used in the zone if the goods and services were purchased during the company’s period of eligibility
Property tax on commercial and industrial improvements but not on land Wind energy production tax Employment tax credit for high-paying jobs
Actual benefits are determined by the exact nature of your business expansion, as well as its effective date. JOBZ benefits accrue from the date that your business qualifies and continue until Dec. 31, 2015.
financial assistance
state and local assistance
24

25The Twin Cities can provide tax incentives to help finance projects
tax Increment financing — In Minnesota, cities and development authorities may use tax increment financing to help finance costs of real estate development. TIF uses the increased property taxes that a new real estate development generates to finance up-front costs of the development. In Minnesota, TIF is used as an incentive to:
Encourage developers to construct buildings or other private improvements.
Pay for public improvements, such as streets, sidewalks, sewer and water, and similar public infrastructure improvements that are related to the development.
The city, county or development authority uses TIF to pay qualifying costs — land acquisition, site preparation and public infrastructure, for instance — incurred for the project. There are three basic financing techniques used to finance up-front costs:
Bonds. The authority or municipality (city or county) may issue its bonds to pay these up-front costs and use increments to pay the bonds back. Often, extra bonds are issued to pay interest on the bonds (“capitalizing” interest) until increments begin to be received.
Interfund loans. In some cases, the authority may advance money from its own funds (e.g., a development fund or sewer and water fund) and use the increments to reimburse the fund.
Pay-as-you-go financing. The developer may pay the costs with its own funds. The increments, then, are used to reimburse the developer for these costs. This type of developer financing is often called “pay-as-you-go” or “pay-go” financing.
Minnesota authorizes development authorities to use TIF. These authorities are primarily housing and redevelopment authorities, economic development authorities, port authorities and cities.
tax abatement — Cities, counties and school districts may use tax abatement to help finance certain economically beneficial projects. Property taxes are forgiven for a period of time to allow the project to cash flow. Or the taxes are captured for a period of time and an up-front payment is made by the political subdivision to help the project cover start-up costs.
City councils, county commissions and school boards may grant a current or prospective abatement of the taxes imposed by the political subdivision on a parcel of property, which may include personal property and machinery, or defer payment of taxes and abate the interest and penalty that otherwise would apply, if:
It expects the benefits of the proposed abatement to at least equal the costs to the political subdivision, and it finds that doing so will advance the public good in several ways, including increasing or preserving tax base, providing employment, redeveloping blighted areas or constructing new public facilities.
At least 50 percent of the payroll of the operations of the business that qualify for abatement must be for employees engaged in one of the following lines of business or any combination of them: manufacturing, agricultural processing, mining, research and development, warehousing or qualified high technology.
state and local assistancefinancial assistance

26Production or assembly operations within a Foreign Trade Zone can result in significant savings for a business.
foreign trade Zones — Currently there are eight General Purpose Zone sites in Minnesota including six in the Minneapolis/St. Paul area (FTZ#119) one site in Duluth (FTZ#51) and one site in International Falls (FTZ#259).
The locations for the sites are as follows:
Minneapolis Convention Center
St. Paul
Eagan Industrial Park
The Greater Airport Bloomington Site
Mid-City Industrial Park
Seaway Port Authority of Duluth
International Falls
Bloomington Central Industrial Area
Subzones
While it is easier and less expensive for a company to realize benefits by utilizing the General Purpose Zones in the Twin Cities area, any company in Minnesota can apply to make its existing facility a Subzone of FTZ #119.
FTZs can help business by minimizing duty payments.
the Innovative business Development Public Infrastructure Program provides grants to local governmental units on a competitive basis statewide for up to 50 percent of the capital cost of the public infrastructure necessary to expand or retain jobs.
The projects must be publicly owned infrastructure related to new development, including projects that target manufacturing, technology, warehousing and distribution, research and development, innovative business incubator, agricultural processing; or industrial, office, or research park development that would be used by an innovative business.
Funds from this program can also be used for land acquisition and preparation, telecommunications, bridges, parking ramps, demolition, hazard remediation, pre-design, construction, equipment and furnishings.
the Minnesota office of business Development partners with Metcouncil environmental services to work with companies to lower their overall sewer access charges (SAC) through SAC transfers from communities or by lowering the up-front cost by amortizing the expense over a 10-year period at 2 to 4 percent interest.
state and local assistancefinancial assistance
Head blurb. 27State and local organizations offer a variety of specialized services.
Positively Minnesota Minnesota’s office of business Development coordinates metro area
projects in concert with the many local community and economic development partners in the area. Go to www.MNPRO.com for helpful site selection information.
Industry specialists — Provide information to businesses in targeted industries on financial programs, supply sources, business planning assistance, trade opportunities, strategic partners and venture partners. In addition to technical assistance with proposed projects, specialists actively market Minnesota and provide information on markets, technologies, buildings and sites, transportation and other Minnesota advantages in response to your inquiries and at industry gatherings (www.PositivelyMinnesota.com/bizdev/industryspecialists.htm).
MetroMsP — MetroMSP.org is a powerful economic development and site selection tool covering the 11-county Minneapolis/St. Paul region. It has two sides that are seamlessly linked so users can go back and forth with ease.
The static, narrative side makes a business case for locating or expanding in the MSP region (MetroMSP.org).
The interactive, data side makes it easy for users to identify the ideal site on which to locate or expand a business in the 11-county region (MSPProspector.com).
DeeD business service specialists support — These specialists are your personal connection to a comprehensive statewide network of information and resources, including:
Recruitment — Provide help with posting vacancies online via MinnesotaWorks.net, sourcing applicants, interviewing and other services.
Connect you with WorkForce Center staff that can advise on job fair participation — booth logistics for easy resume collection, networking and conducting all-important first interviews.
Training — Identify state and local resources for basic and customized training.
Planning and Consulting — Offer information about state financing options, employment law, income tax credits, hiring incentives and business workshops.
Minnesota trade office — The Minnesota Trade Office (MTO) promotes and assists in the expansion of exports that contribute to the growth of the Minnesota economy. The MTO’s services are tailored for new exporters as well as experienced international companies, and include education and training, information and marketing, and counseling.
The MTO also sponsors and coordinates trade missions to targeted countries, including missions led by the governor. Participating companies find these events an excellent way to establish trade contacts and gain firsthand knowledge of new markets.
state and local assistance
27

July 2010
Kevin McKinnonDirector
Office of Business DevelopmentMinnesota Department of employment and economic Development
332 Minnesota Street, Suite E200St. Paul, MN 55101
651-259-7445 [email protected]
Gene GoddardSr. Business Development Specialist
Office of Business DevelopmentMinnesota Department of employment and economic Development
332 Minnesota Street, Suite E200St. Paul, MN 55101
www.PositivelyMinnesota.com/business