why next generation networks? market drivers and ... · market trends: new providers’ revenue...
TRANSCRIPT

1
Why Next Generation Networks? Market Drivers and Quantitative Models for Convergence
Mark Bass
Director, Bell Labs Business Modeling
Lucent Technologies – Proprietary - Use pursuant to company instruction

2
New Types of Users - Why are they important?
They are the children of the baby boomer generation of the 1950s and 1960sThey have grown up with the internetThey like instant responseThey love brands like Apple, Virgin, Nike...They create their own web sites and make CDs and DVDsThey like to personalise and customise the way they interact

3
What do they like to do?Activities revolve around computers, games console, TV, Mobile Phone, Music player.Learning - forget text books and libraries. Want to know something?Just ‘Google’ it…Don’t completely understand the technology – but they know how to use it effectivelyTo define their own
experiences, when they are reachable, and by whom

4
Market Trends:New Providers’ Revenue Model – Other People’s Money
Service Providers
AttractingEyeballsModel
TelecomModel
“87% from Ads 13% from Premium Service”
“0% from Ads 95% from Tranx, 5% VoIP”
-Limited From Ads, (Directory Services ?)-Nearly 100% from Telephony”
“98% from Ads, 2% from Software*”Google
Yahoo!
AOL
MSN
Skype/eBay
“58% From Ads, 42% from Internet Access”
“19% From Ads, 81% from Internet Access”
Riding On-Line Advertising Growth, & to a Lesser Extent Premium Services**
*Google Software: Enterprise Search Appliance, Google Earth, etc; **Yahoo Preimum Services: Music, Game, Telco, SMB

5
Future Competitive LandscapeThree Main Business Models for Providers
Sessions, Content, Advertising
Emerging Service Providers (Google, etc)
Expand on Core Competency: eg content, Capture New Subscribers
Rapid Service Delivery: First to Market
Further Segment User Preferences: Increase Advertising Revenue
Parasite on Networks: Low costs
Build Strength in Mobility: Increase Knowledge of User Preferences
Traditional Providers
Content & Advertising: Increase Revenue
Personalization: IncreaseKnowledge of User Preferences
Enterprise Strength: Limited Competition
Speed to Deploy: First to Market

6
Key Questions From Service ProvidersHow do I characterize my customers?
What services will they buy and how much will they pay for them?
Does the business case prove in
Does a Platform approach (IMS) give me an advantage against Point Solution competitors ?
If so, when should I move to IMS?
1. The answers depend on the Network Operator’s specific situation.2. Modeling is essential to facilitate Decision-making & help Manage
Risk- Multiple Parameters- Rapid Iteration- Business Quantification

7
Service Bundling vs. Service BlendingService bundling offers unified ordering and billing for otherwise separate services.Service Blending enables different services to control one another, providing a unified service experience.
Service Blending (with Unified Control via IMS)
Voice Subscriber
ControlVoice
Data
Video
Voice Network Control
Video Subscriber
Control
Video Network Control
Data Subscriber
Control
Data Network Control
For Voice Connections
For MobileVoice Connections
Third party
Wireline
Wireless
For Data Connections
For VideoVoice Connections
Voice
Data
Video
Unified Control
Wireline
Wireless
Mobile TV
Alerts
Gaming on Demand
Caller ID on TV
Family Finder
Web on TV
Service Bundling

8
Consumer Findings
Willingness to Switch for Blended Services
2006 Lucent Technologies –Western Europe Blended Services Primary Market Research
5% 3% 4%7%
22%
16%19%
14%
3%
8%
0%
5%
10%
15%
20%
25%
30%
35%
40%
1 Definitelywould not
2 3 4 5 6 7 8 9 10Definitely
Would
59%41%
Consumers are generally willing to switch service providers to gain access to blended lifestyle services.

9
Willingness to Pay for Blended Services
Consumer Findings2006 Lucent Technologies –Western Europe Blended Services Primary Market Research
0%
5%
10%
15%
20%
25%
30%
Single Providerw/o Blending
Single Providerw/Blending
While lower price expectations prevail when moving to a single provider, blended services increase the number of potential customers who expect to pay more.
% o
f aud
ienc
e w
ho
expe
ct to
pay
mor
e

10
Consumer Segment Demographics
Consumer Findings2006 Lucent Technologies –Western Europe Blended Services Primary Market Research
HHI $50,000+
HHI under $50,000
Children in household
Male
Married
45-65
25-44
Age 18-24
Female
Median current monthly spending
6.05.78.08.17.3Mean interest in blended services
22%24%21%18%15%Segment size (% of population)
SkepticsOlder Low Income
HHs
Premium Adopters
Fun Techies
Secure & Connected
HHI $50,000+
HHI under $50,000
Children in household
Male
Married
45-65
25-44
Age 18-24
Female
€129Median current monthly spending
6.05.78.08.17.3Mean interest in blended services
22%24%21%18%15%
SkepticsOlder Low Income
HHs
Premium Adopters
Fun Techies
Secure & Connected
Low Average HighLow Average High
€131 €156 €108 €146

11
Revenue Forecast Methodology
RelativeBundle
Adoption
Bundle AdoptionConstraints in year T
AddressableMarket
CurrentSubscriber
Base
ExpectedGrowth/
De-growth
ExpectedBundle
Adoption in year T
Number ofSubscribers per
Year
Expected Demand & Revenue in
year T
BundleSelection
ApplicationCoverage
HighPreference
MaximumService
Adoption
Coeff. OfInnovation
Coeff. OfImitation
Individual service adoption
in year T
Price Constrained Preference
Preference for
Bundle
OptimalPrice
PurchaseLikelihood
A forecast model to estimate the subscriber and revenue potential of Blended Services solutions Based on primary research results, conjoint pricing model, and Bass Diffusion model

12
Estimation of Service Diffusion Coefficients for Next Generation Services
Maximum adoption rates (m) can be derived from primary research data
All consumer features of consumer blended package are categorized into 3 groups to use the the p and q values of the 3 representative services
Example: Bass Diffusion Coefficients p and q

13
Market Simulation of Custom Service Bundles
Communications Portal offers the blended features to compete with 8 other existing blended packages in the market

14
Simulation Results by Segment – Optimal Market Pricing
To maximize the total market revenue potential, the market simulation results indicate that the optimal price for Comm. Portal would be US$30 (~ €23.6) along with other existing blended service offers
Market divided into 2 segments – current operator subscribers have higher preference and purchase likelihood than other subscribersThe optimal price is inclusive of the usage charge per feature in addition to the platform/enabler charge

15
Blended Lifestyle ServicesPlatform (IMS) vs. Point Solution
ENDPOINTS
SESSION
APPLICATION
IM VoIP
… …
Video Conf.
IMS• Common Session control • Privacy and personalization• Single sign-on • Sharing of common data
across applications
IMS• Common Session control • Privacy and personalization• Single sign-on • Sharing of common data
across applications
Master Brand• Single Subscriber Identity• Seamless• Common user experience
Master Brand• Single Subscriber Identity• Seamless• Common user experience
Common Resources• Sharing of common data• Single user profile• Single Sign on• Integrated Web portal experience
Common ResourcesCommon Resources• Sharing of common data• Single user profile• Single Sign on• Integrated Web portal experience
Simplified Converged Apps• Common apps across Networks• Independent applications• Integrated voice/data services
Simplified Converged Apps• Common apps across Networks• Independent applications• Integrated voice/data services
IMS enables service providers to build and launchservices faster, efficiently adapting to market changes
16
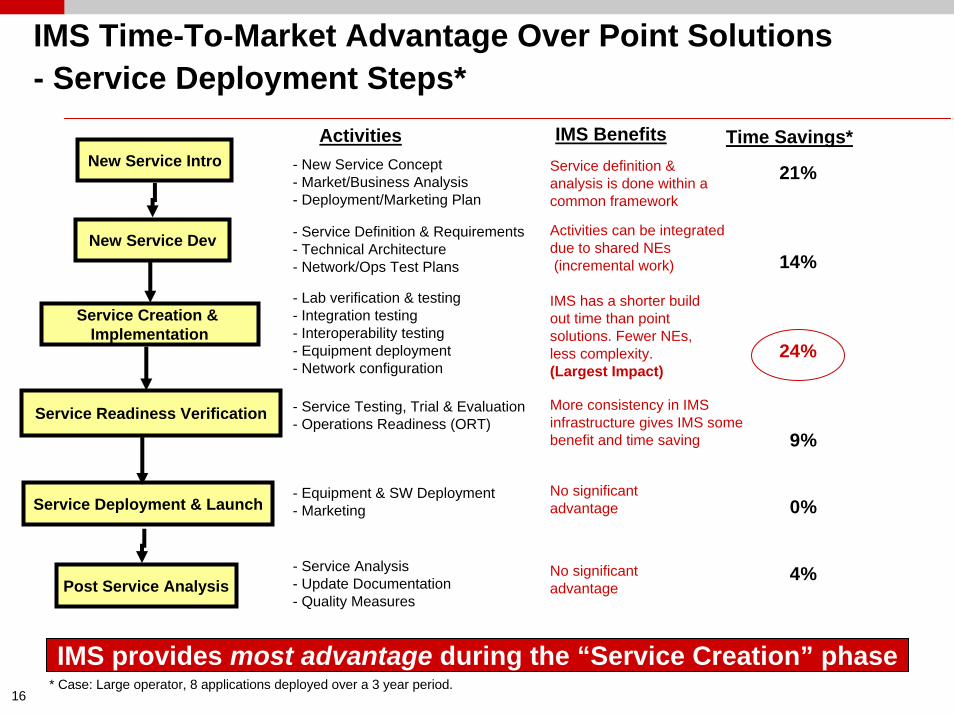
IMS Time-To-Market Advantage Over Point Solutions - Service Deployment Steps*
IMS Benefits Time Savings*- New Service Concept- Market/Business Analysis- Deployment/Marketing Plan
Activities
- Service Definition & Requirements- Technical Architecture- Network/Ops Test Plans
- Lab verification & testing- Integration testing- Interoperability testing- Equipment deployment- Network configuration
- Service Analysis- Update Documentation- Quality Measures
New Service Intro
Service Readiness Verification
Service Creation & Implementation
New Service Dev
Service Deployment & Launch
Post Service Analysis
Activities can be integrated due to shared NEs(incremental work)
Service definition & analysis is done within a common framework
IMS has a shorter build out time than point solutions. Fewer NEs, less complexity.(Largest Impact)
More consistency in IMS infrastructure gives IMS some benefit and time saving
No significant advantage
No significantadvantage
21%
14%
24%
9%
0%
4%
- Equipment & SW Deployment- Marketing
- Service Testing, Trial & Evaluation- Operations Readiness (ORT)
IMS provides most advantage during the “Service Creation” phase* Case: Large operator, 8 applications deployed over a 3 year period.

17
Optimal Deployment Strategy
Transition Cost
IMS time-to-market advantage results in
• significant incremental revenue, with
• slight increase in investment and expense
Early transition to IMS will • reduce transition cost, and• improve profitability by as
much as 24%
Optimal Strategy

18
IMS Reduces Risks of Introducing New Services
• IMS reduces risk and provides a platform for “experimentation”• Opportunity to level the playing field with Internet companies
IMS services are financially viable at lower adoption levels than point solutions
Opportunity to profitably provide services to niche markets
Service adoptionService adoption
100%
80%
60%
40%
20%
0Mobile voice
SMS Service A
Service B
Service C
Service D
Service E
Unattractive services to a non IMS operator
ILLUSTRATIVE
100%
80%
60%
40%
20%
0Mobile voice
SMS Service A
Service B
Service C
Service D
Service E
Unattractive services to a non IMS operator
ILLUSTRATIVE
Both IMS and point solutions viable
Only IMS solutions viable
No solutions viable
***Based on Lucent research and are not indicative or representative of actual results or experience. Actual results could differ significantly from what is shown.

19
Simulation of Market DynamicsSimulation Model – “Optimal Control” formulation of market dynamics
where operator and consumer rational behaviour is explicitly modelledService providers compete for customer shares trying to optimize NPV of their cash
flows, e.g., revenue, operational cost of adding new customers, investment in additional infrastructure
Customers optimize their “value” by selecting freely between offers and their combinations.
Operators adjust offer plans for next
period
Financial resultsand customer
shares analysed by operators
Customer Segments
select from service offers
New transition probabilities
based on plans and utilities
)( 12 bb UUgker −=
Given choice of bundles customer switches to another bundle at the rate ofCurrent
Mkt StateStrategicAction A Strategic
Action BStrategicAction C
Mkt StateII
StrategicAction A Strategic
Action BStrategicAction C
Mkt StateIII
StrategicAction A Strategic
Action BStrategicAction C
Mkt StateIV

20
Overall Projected Share for Voice, Convergence and Data Offers
DMS offer is the only service with steady growthCable-data offer remains flat mainly due to being included in more bundles, including the converged offers
The two converged offers that include data, wireline, and wireless voice are the front-runnersPlain WiFi roaming offers (BYOBB), only gain moderate market sharesDMS has an advantage over the closest rival mainly due to sticky, value-added services
Share Dynamics by Offer
02468
101214161820
1 2 3 4 5 6 7 8 9 10 11 12 13 14 15 16 17 18 19 20quarters
Nor
mal
ized
Mkt
Sha
re, M
P OT S D ata - D SL D ata - C B L Wireless D M S
Market Share Dynamics - Converged Voice
0123456789
10
1 2 3 4 5 6 7 8 9 10 11 12 13 14 15 16 17 18 19 20Quarters
Nor
mal
ized
Mkt
. Sha
re, M
SP1/SP2 SP3 SP5/CBL SP4 SP6
Anywhere blended minutes,B’band, &VAS
Bundled minutes&B’band
BYOBB

21
Simulation Results for Dual-Mode ServiceMarket Share Simulation Scope:
– Specific Region: 7 operators, 7 offer types, 40 service bundles, 6 market segmentsImpact of Dual- Mode Service on DSL Churn
1.50%
1.90%
2.30%
2.70%
3.10%
3.50%
2007 2008 2009 2010 2011
Mon
thly
Chu
rn in
DSL
More than 30% drop in 5 years
No Dual-Mode
With Dual-Mode
Market Share Dynamics - Converged Voice
25%
35%
45%
55%
65%
75%
85%
2007 2008 2009 2010 2011
Mkt
. Sha
re, %
More than 3 to 1 advantage in 5 years
Converged Operator
Mobile Operator
Converged operators increase market share:
− Converged platforms enable coordination of Family Number, Personal Number, etc
− Integration of Mobile and Wireline voice features with data services
Introduction of Dual-Mode Service can reduce churn on DSL
− Service integration increases Dual-Mode offer stickiness
− Dual-Mode Service includes DSL service, and as Dual-Mode Service adoption increases, overall DSL churn reduces
Operators Offering Converged Voice and Data Services Can - Build Significant Market Share Advantage, and - Reduce Churn on Their Existing Voice and Data Services

22
Summary: Why Next Generation Networks? Market Drivers and Quantitative Models for Convergence
Operators need to seek new revenue generating services and deploy them efficiently as a way to counter voice erosion and threats from non-traditional players.
– There is pent-up demand for new applications and blended services
IMS provides an efficient deployment platform for launching next generation services
– As the number of services increase, the added efficiency builds up quickly– Services are deployed faster, translating into higher revenue potential– In a competitive environment, the impact on profitability will be significant– Positive cross-elastic impact on existing broadband services– Platform efficiencies also translate into operational savings
As competition increases, growing commitment to Converged Services is a key strategy
– Converged, blended services will be key to customer acquisition and retention
Operators need to explore new business models to exploit the convergence of all media